Embed Size (px)
Citation preview
7/27/2019 07_AC15
http://slidepdf.com/reader/full/07ac15 1/19
ACTA CHROMATOGRAPHICA, NO. 15, 2005
APPLICATION OF THIN-LAYER
CHROMATOGRAPHY (TLC) TO INVESTIGATING
OSCILLATORY INSTABILITY
OF THE SELECTED PROFEN ENANTIOMERS
M. Sajewicz, R. Piętka, A. Pieniak , and T. Kowalska*
Institute of Chemistry, Silesian University, 9 Szkolna Street, 40-006 Katowice, Poland
SUMMARY
In our earlier studies we intended to evaluate the performance of
thin-layer chromatography (TLC) as an analytical tool applied to separation
of the selected profen (i.e. 2-arylpropionic acid) enantiomers and we se-
lected ibuprofen as a model analyte for this purpose. Surprisingly enough,
TLC is relatively seldom used for separation of enantiomers, even though
– despite the low number of theoretical plates ( N ) in this particular techni-
que in comparison with fully automated column chromatographic techni-
ques (basically GC and HPLC) – it seems very well suited for completeseparation of two analytes only (i.e. a pair of enantiomers).
Separation of profens can be regarded as a particularly urgent ana-
lytical task, because they are among the most widely prescribed synthetic
non-steroidal anti-inflammatory drugs and in medicinal chemistry we must
be vigilantly aware of possible unpredictable consequences of dispensing
medicines as racemic mixtures.
In earlier and in more recent studies we have provided enough evi-
dence not only to prove that the analytical performance of TLC is suffi-
cient for separation of the enantiomers of ibuprofen, but also – even more
important – to demonstrate the usefulness of this simple yet very efficient
separation technique in physicochemical studies of the oscillatory instabilityof profens when stored for long periods of time in aqueous media. By use
of TLC it was possible to show the oscillatory transenantiomerization of
the profens from the S to the R form, and vice versa, during storage. The
correctness of our TLC assessment with regard to structural oscillation of
enantiomeric profens was later successfully confirmed by means of pola-
riemetry.
- 131 -
7/27/2019 07_AC15
http://slidepdf.com/reader/full/07ac15 2/19
INTRODUCTION
In their pioneering paper on the thin-layer chromatographic sepa-
ration of ibuprofen enantiomers, Bhushan and Parshad [1] suggested silica
with addition of L-arginine as stationary phase and ACN–MeOH–H2O, 5:1:1
(v/v), plus several drops of acetic acid to maintain the pH < 4.8, as mobile
phase. Their experimental procedure included in-house coating of glass
plates with silica–gypsum slurry containing an accurately known amount
of L-arginine as chiral selector. This direct approach (i.e. using a chiral
stationary phase) to separation of the enantiomers of ibuprofen we later extended [2] to thin-layer chromatographic systems with commercially
available silica-coated glass plates, again impregnated with L-arginine.
Because mobile-phase pH must be maintained below the isoelectric point
(p I ) of L-arginine (pH 4.8), the most probable mechanism of separation of
the two ibuprofen enantiomers can be given by the equations:
L-arginine+ + S -(+)-ibuprofen− ↔ L-arginine+ – S -(+)-ibuprofen
−; ( K 1)
L-arginine+ + R-(−)-ibuprofen− ↔ L-arginine+ – R-(−)-ibuprofen−; ( K 2)
Successful separations of ibuprofen enantiomers were shown as
chromatographic bands visualized by use of iodine vapour [1] and densi-
tometrically [2]. This separation success was, however, rather limited, be-cause storage for several hours or days of ibuprofen dissolved in EtOH–
H2O, 7:3 (v/v) resulted in the surprise disappearance of the two well sepa-
rated chromatographic bands and, instead, the steadily changing position
of a single and skewed ibuprofen band. On successive chromatograms this
t 3 t 4
F (1)
F (2)
F (1)
F (2)
t 1 t 2
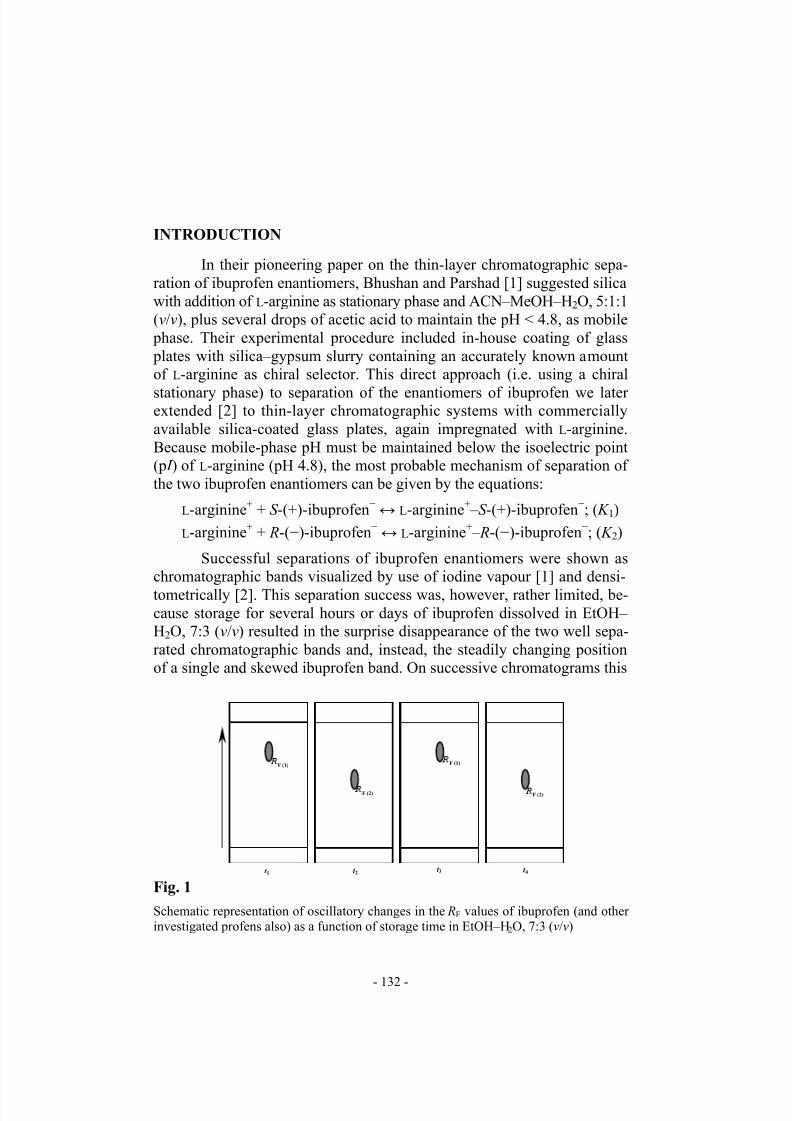
Fig. 1
Schematic representation of oscillatory changes in the RF values of ibuprofen (and other investigated profens also) as a function of storage time in EtOH–H2O, 7:3 (v/v)
- 132 -
7/27/2019 07_AC15
http://slidepdf.com/reader/full/07ac15 3/19
single and skewed ibuprofen band appeared in quite different positions
which clearly depended on the storage time yet which remained within
rigid boundaries, i.e. the uppermost and the lowermost RF values, thus gi-
ving the impression of ‘oscillation’. This phenomenon is shown schemati-
cally in Fig. 1.
Because of our curiosity about the reason for this behaviour, a mo-
re systematic study of the oscillating transenantiomerization of S -(+)-ibu-
profen became the target of research described in this paper. In addition to
S -(+)-ibuprofen, the behaviour of two other 2-arylpropionic acids, S -(+)-
naproxen and S , R-(±)-2-phenylpropionic acid, was also investigated. Theoutcome for the three profens is presented in this paper.
EXPERIMENTAL
Profen Samples and Standards
S -(+)-ibuprofen and S -(+)-naproxen were obtained from Sigma–Al-
drich (St Louis, MO, USA; #I-106 and 28,478-5, respectively) and S , R-(±)-
2-phenylpropionic acid from Merck (Darmstadt, Germany; #8.20651.0010).
For TLC analysis, solutions of S -(+)-ibuprofen, S-(+)-naproxen, and S , R-(±)-
2-phenylpropionic acid (1 µg µL−1, equivalent to ca. 5.8 × 10⁻³, 4.3 × 10⁻³,and 6.5 × 10⁻³ mol L−1, respectively) were prepared in 70% ethanol and
10-µL volumes were applied to the plates. For polarimetry, solutions of S -
(+)-ibuprofen, S-(+)-naproxen, and S , R-(±)-2-phenylpropionic acid (50,
12.5, and 500 µg µL−1, respectively, equivalent to ca. 0.25, 5.4 × 10
−2 , and
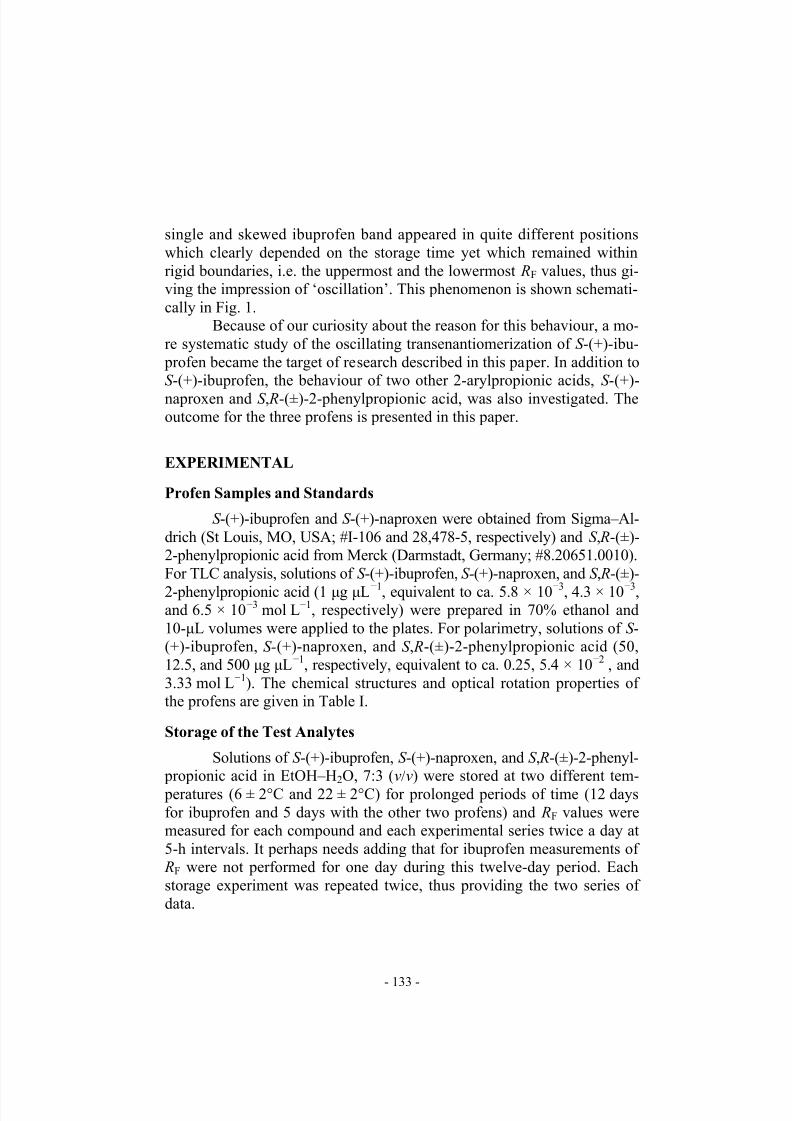
3.33 mol L−1). The chemical structures and optical rotation properties of
the profens are given in Table I.
Storage of the Test Analytes
Solutions of S -(+)-ibuprofen, S -(+)-naproxen, and S , R-(±)-2-phenyl-
propionic acid in EtOH–H2O, 7:3 (v/v) were stored at two different tem-
peratures (6 ± 2°C and 22 ± 2°C) for prolonged periods of time (12 days
for ibuprofen and 5 days with the other two profens) and RF values were
measured for each compound and each experimental series twice a day at
5-h intervals. It perhaps needs adding that for ibuprofen measurements of
RF were not performed for one day during this twelve-day period. Each
storage experiment was repeated twice, thus providing the two series of
data.
- 133 -
7/27/2019 07_AC15
http://slidepdf.com/reader/full/07ac15 4/19
Table I
Schematic representation of the chemical structures of the three profens discussed in this
study and the specific rotation, [α]D, of their S and R enantiomers at 25°C, as taken from
literature
Specific rotation, [α]D
(°)Profen Chemical structure
S R
IbuprofenC
COOH
CH3
H
CH3
H
H3C
H
H
C C
+53.2 [3] −57.5 [4]
NaproxenC H
COOH
CH3
H3C O
+64.9 [5]
+66.3 [6]
−67.2 [6]
2-Phenylpro-
pionic acid C
COOH
CH3
H
69.2 [7]
79.2 [4]
−80.0 [4]
Commercial TLC Silica Gel Layers and Their Pretreatment
TLC was performed on commercial glass plates precoated with
0.25 mm layers of silica gel 60 F254 (Merck, #1.05715). Before use, the
plates were carefully washed by predevelopment with methanol–water,
9:1 (v/v), then dried at ambient temperature for 3 h. Washing of the plates before more ‘sensitive’ separations is often recommended by the manu-
facturer.
The washed and dried plates were then impregnated with a 3 × 10⁻²
mol L−1 solution of L-arginine in methanol by conventional dipping for
2 s. The concentration of the impregnating solution was calculated as that
depositing 0.5 g L-arginine per 50 g of the dry silica gel adsorbent layer.
Finally, the washed, impregnated adsorbent layers were ready for chroma-
tography.
- 134 -
7/27/2019 07_AC15
http://slidepdf.com/reader/full/07ac15 5/19
Development of the Chromatograms
S-(+)-Ibuprofen
Development of the ibuprofen samples was performed at two dif-
ferent temperatures, 6 ± 2 and 22 ± 2°C. Plates with three adjacent spots
from the 5-µL volumes of S -(+)-ibuprofen solution were developed to a
distance of 15 cm using the ternary mobile phase ACN–MeOH–H2O, 5:1:1
(v/v) containing several drops of acetic acid to fix the pH < 4.8. After de-
velopment of the chromatograms, the plates were dried at ambient tem-
perature for 3 h and the three lanes were scanned densitometrically. The
experiment was repeated twice for each measurement temperature.
S-(+)-Naproxen
Development of the naproxen samples was performed as described
for ibuprofen except that the mobile phase was ACN–MeOH–H2O, 5:1:1.5
(v/v), again containing several drops of acetic acid to fix the pH < 4.8.
S , R-(±)-2-Phenylpropionic acid
Development of the 2-phenylpropionic acid samples was performed
as described for ibuprofen and naproxen except that the mobile phase wasACN–MeOH–H2O, 5:1:0.75 (v/v), containing several drops of acetic acid
to fix the pH < 4.8.
Densitometric Assessment of the Chromatograms
Densitograms were acquired with a Desaga (Heidelberg, Germany)
model CD 60 densitometer equipped with Windows-compatible ProQuant
software. Concentration profiles of the development lanes for the three pro-
fens were recorded in UV light from the deuterium lamp (in reflectance
mode) at 210 nm. (This is the approximate wavelength of the stronger of
the UV absorption maxima for ibuprofen; the stronger maxima for napro-
xen and 2-phenylpropionic acid are close to this position). The dimensionsof the rectangular light beam were 0.02 mm × 0.4 mm. The maxima of the
concentration profiles were used for calculation of RF values.
Polarimetric Measurements of Specific Rotation [α]D of the Profens
Measurements of the specific rotation [α]D of solutions of S-(+)-
ibuprofen, S-(+)-naproxen, and S , R-(±)-2-phenylpropionic acid in 70% etha-
nol were performed at 6 ± 2°C and 22 ± 2°C, during storage of the solu-
tions, by means of a Polamat A polarimeter (Carl Zeiss, Jena, Germany). The
- 135 -
7/27/2019 07_AC15
http://slidepdf.com/reader/full/07ac15 6/19
7/27/2019 07_AC15
http://slidepdf.com/reader/full/07ac15 7/19
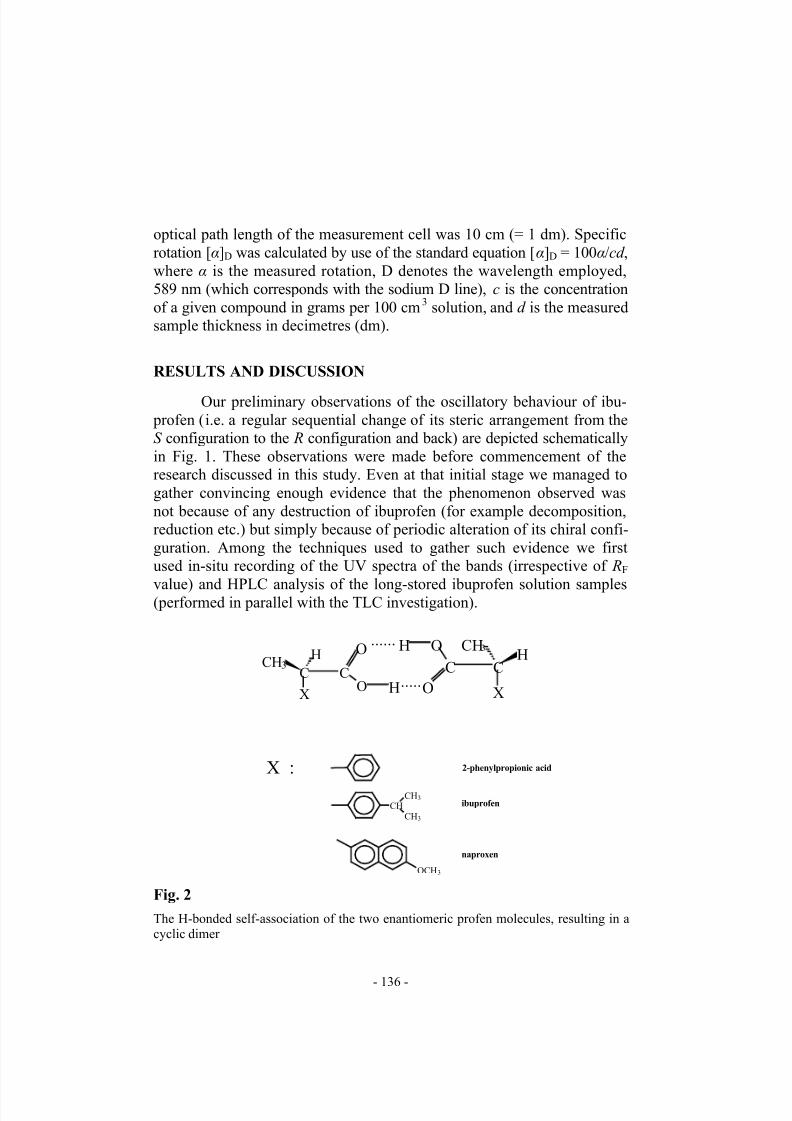
Another important preliminary observation made before this study
was that after storage of a solution of S , R-(±)-ibuprofen in 70% ethanol
for several hours the initial separation of the two antipodes disappeared
and instead a relatively broad and skewed band appeared. This could, of
course, be because of the beginnings of a change in the chiral characte-
ristics of the two enantiomers in the racemic mixture, but it is equally pro-
bable it happened because of the formation of cyclic dimers between the S
and the R antipodes. As reported elsewhere [8], mixed hydrogen bonding
interactions can sometimes prevent chromatographic separation of two com-
pletely different compounds; this is even more likely for two antipodes of a racemic mixture. Cyclic hydrogen-bonded dimeric structures quite typical
of monocarboxylic acids and, therefore, also typical of ibuprofen, naproxen,
and 2-phenylpropionic acid are shown in Fig. 2.
Now let us report the experimental results gathered in this study.
As already mentioned, we started by scrutiny of the numerical values of
the retardation factors ( RF) for S-(+)-ibuprofen, S-(+)-naproxen, and S , R-
(±)-2-phenylpropionic acid (each analyte dissolved in 70% ethanol and
stored for a long time at either 6 ± 2°C or at 22 ± 2°C); the results are
shown in Figs 3–5.
As mentioned in the experimental section, each experiment wasrepeated three times in each series and two such series were run for each
profen and for each working temperature. The results originating from the
same storage series were averaged; data originating from two different sto-
rage series were qualitatively almost identical. Thus for reasons of economy
in this paper we present results from a single experimental series only.
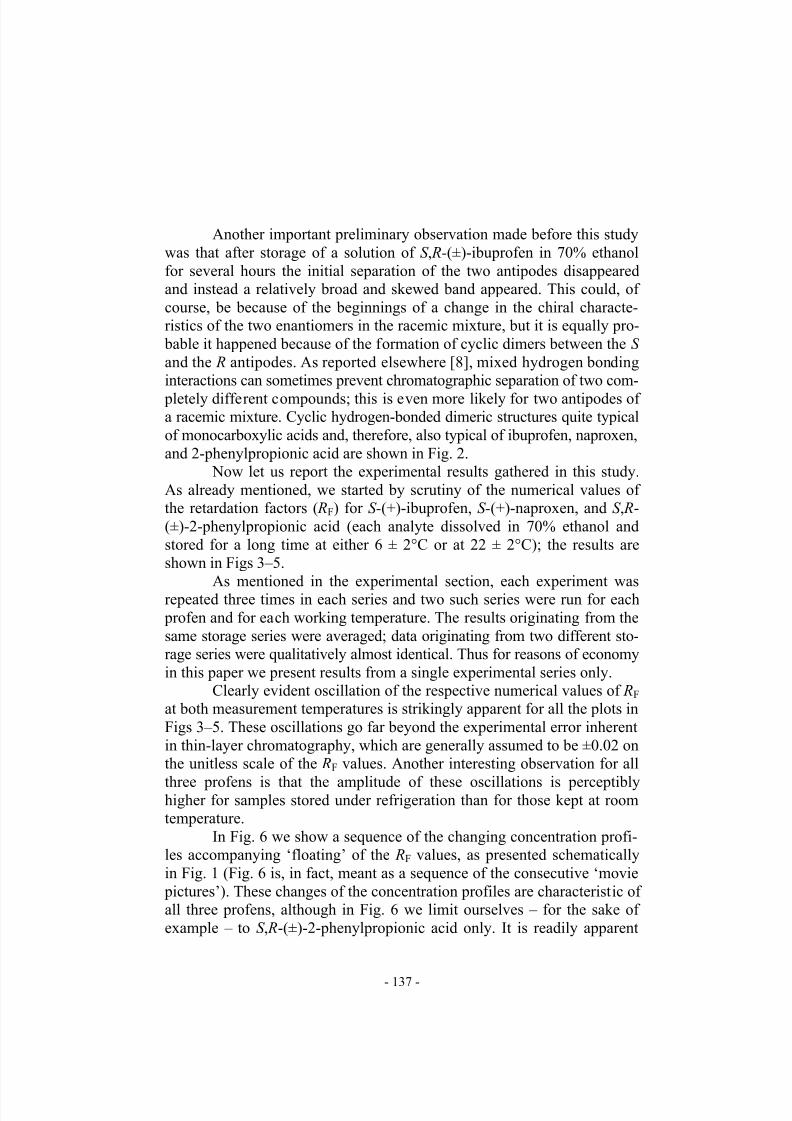
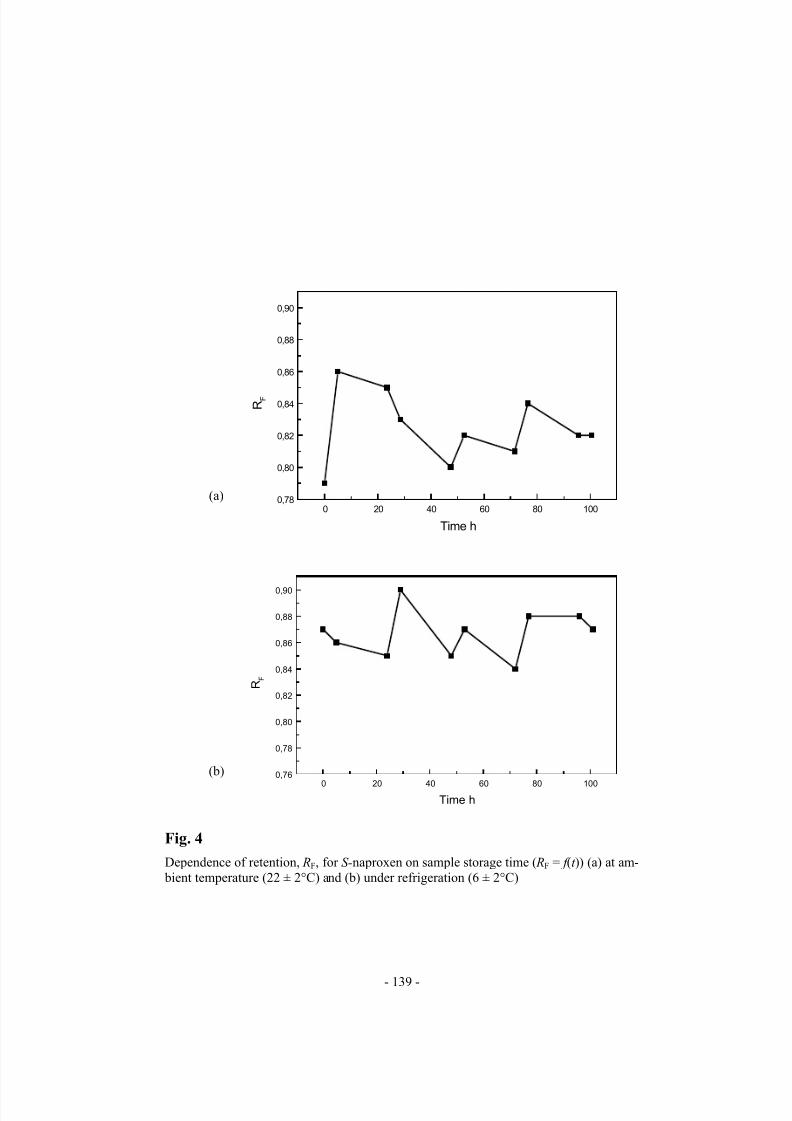
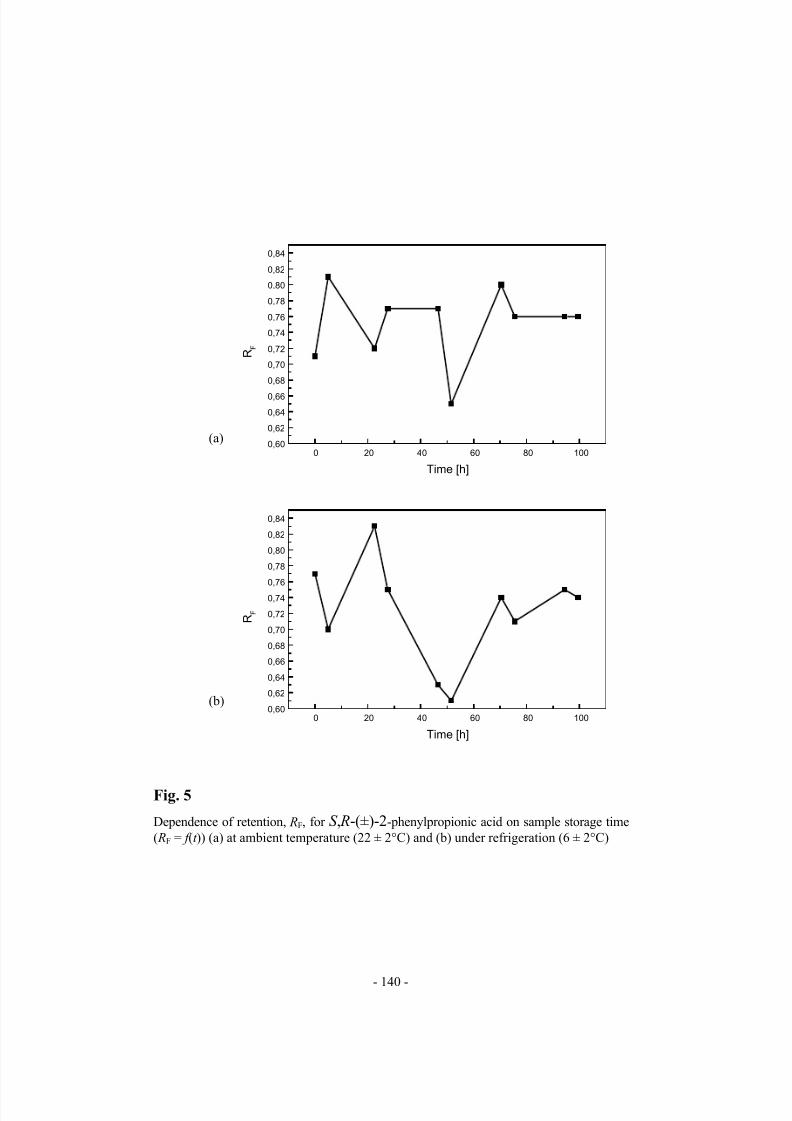
Clearly evident oscillation of the respective numerical values of RF
at both measurement temperatures is strikingly apparent for all the plots in
Figs 3–5. These oscillations go far beyond the experimental error inherent
in thin-layer chromatography, which are generally assumed to be ±0.02 on
the unitless scale of the RF values. Another interesting observation for all
three profens is that the amplitude of these oscillations is perceptiblyhigher for samples stored under refrigeration than for those kept at room
temperature.
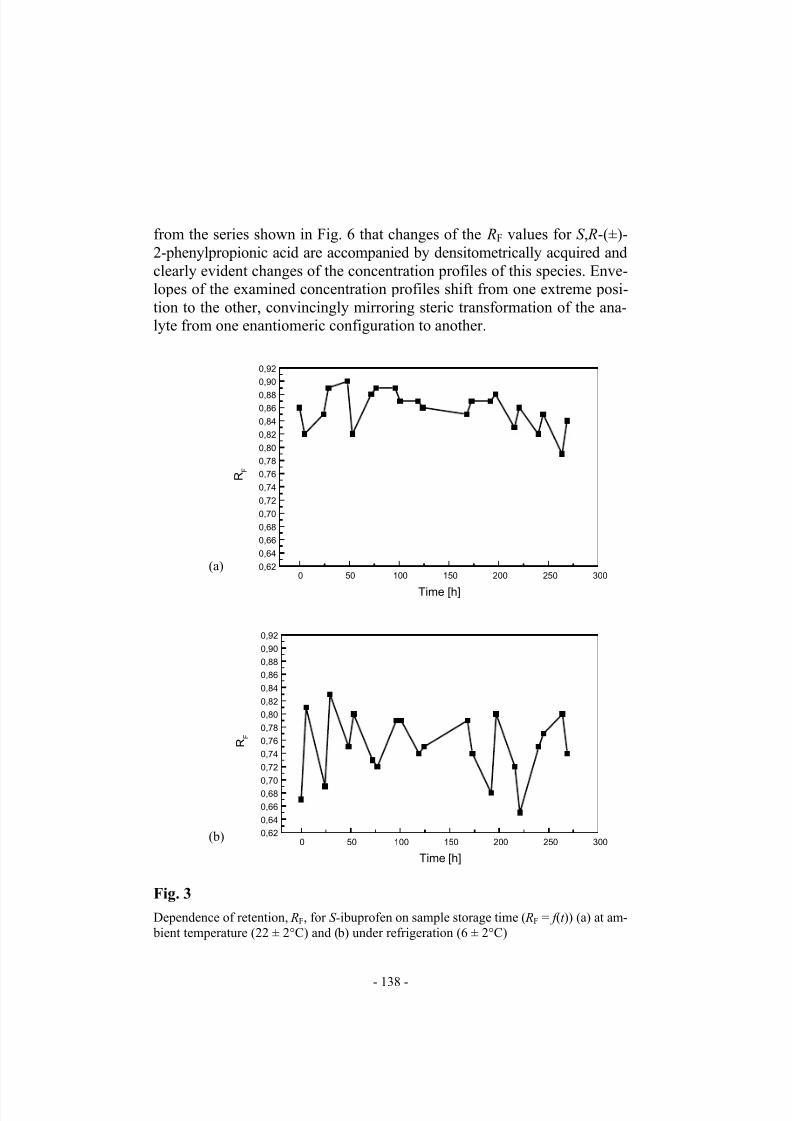
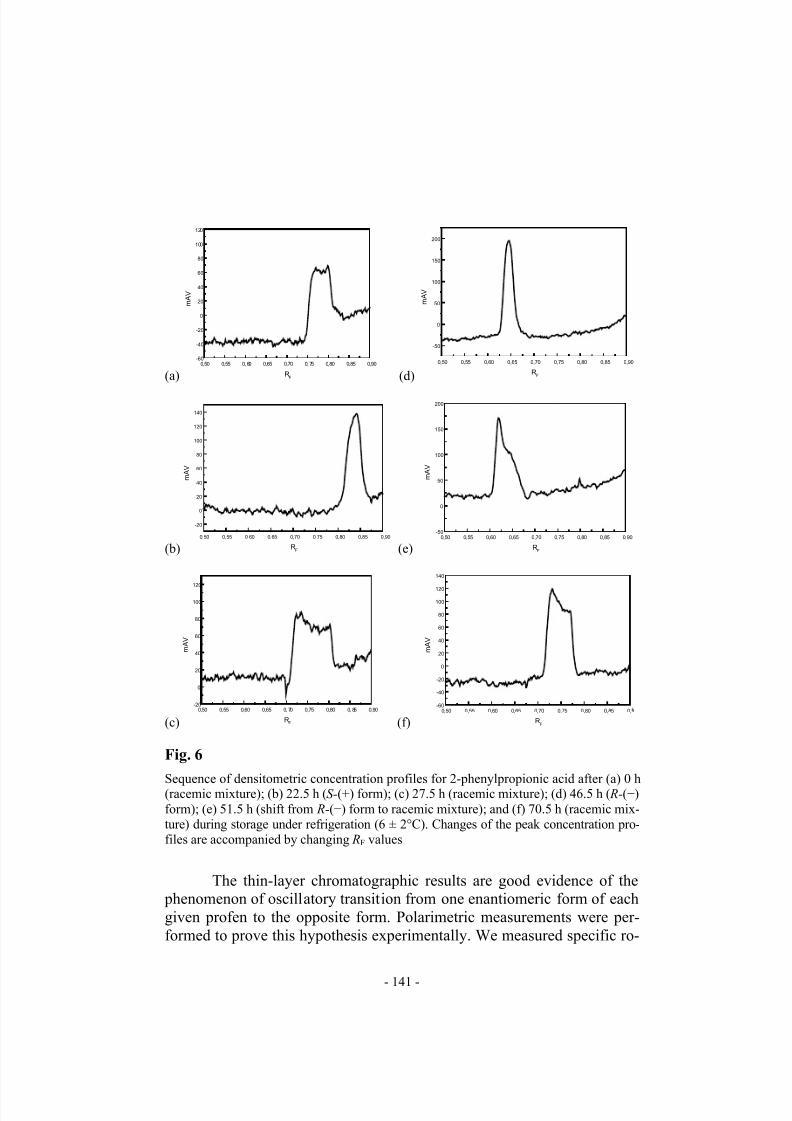
In Fig. 6 we show a sequence of the changing concentration profi-
les accompanying ‘floating’ of the RF values, as presented schematically
in Fig. 1 (Fig. 6 is, in fact, meant as a sequence of the consecutive ‘movie
pictures’). These changes of the concentration profiles are characteristic of
all three profens, although in Fig. 6 we limit ourselves – for the sake of
example – to S , R-(±)-2-phenylpropionic acid only. It is readily apparent
- 137 -
7/27/2019 07_AC15
http://slidepdf.com/reader/full/07ac15 8/19
from the series shown in Fig. 6 that changes of the RF values for S , R-(±)-
2-phenylpropionic acid are accompanied by densitometrically acquired and
clearly evident changes of the concentration profiles of this species. Enve-
lopes of the examined concentration profiles shift from one extreme posi-
tion to the other, convincingly mirroring steric transformation of the ana-
lyte from one enantiomeric configuration to another.
0 50 100 150 200 250 3000,62
0,64
0,66
0,68
0,70
0,72
0,74
0,76
0,78
0,80
0,82
0,84
0,86
0,88
0,90
0,92
R F
Time [h]
(a)
0 50 100 150 200 250 3000,62
0,64
0,66
0,68
0,70
0,72
0,74
0,76
0,78
0,80
0,82
0,84
0,86
0,88
0,90
0,92
R F
Time [h]
(b)
Fig. 3
Dependence of retention, RF, for S-ibuprofen on sample storage time ( RF = f (t )) (a) at am-
bient temperature (22 ± 2°C) and (b) under refrigeration (6 ± 2°C)
- 138 -
7/27/2019 07_AC15
http://slidepdf.com/reader/full/07ac15 9/19
0 20 40 60 80 1000,78
0,80
0,82
0,84
0,86
0,88
0,90
R F
Time h
(a)
0 20 40 60 80 100
0,76
0,78
0,80
0,82
0,84
0,86
0,88
0,90
R F
Time h
(b)
Fig. 4
Dependence of retention, RF, for S-naproxen on sample storage time ( RF = f (t )) (a) at am-
bient temperature (22 ± 2°C) and (b) under refrigeration (6 ± 2°C)
- 139 -
7/27/2019 07_AC15
http://slidepdf.com/reader/full/07ac15 10/19
0 20 40 60 80 1000,60
0,62
0,64
0,66
0,68
0,70
0,72
0,74
0,76
0,78
0,80
0,82
0,84
R F
Time [h]
(a)
0 20 40 60 80 1000,60
0,62
0,64
0,66
0,68
0,70
0,72
0,74
0,76
0,78
0,80
0,82
0,84
R F
Time [h]
(b)
Fig. 5
Dependence of retention, RF, for S , R-(±)-2-phenylpropionic acid on sample storage time
( RF = f (t )) (a) at ambient temperature (22 ± 2°C) and (b) under refrigeration (6 ± 2°C)
- 140 -
7/27/2019 07_AC15
http://slidepdf.com/reader/full/07ac15 11/19
(a)0,50 0,55 0, 60 0,65 0,70 0, 75 0,80 0,85 0,90
-60
-40
-20
0
20
40
60
80
100
120
m A V
RF (d)
0,50 0,55 0,60 0,65 0,70 0,75 0,80 0,85 0,90
-50
0
50
100
150
200
m A V
RF
(b)0,50 0,55 0,60 0,65 0,70 0,75 0,80 0,85 0,90
-20
0
20
40
60
80
100
120
140
m A V
RF (e)
0,50 0,55 0,60 0,65 0,70 0,75 0,80 0,85 0,90-50
0
50
100
150
200
m A V
RF
(c)0,50 0,55 0,60 0,65 0, 70 0,75 0,80 0, 85 0,90
-20
0
20
40
60
80
100
120
m A V
RF (f)
0,50 0,55 0,60 0,65 0,70 0,75 0,80 0,85 0,9-60
-40
-20
0
20
40
60
80
100
120
140
m A V
RF
Fig. 6
Sequence of densitometric concentration profiles for 2-phenylpropionic acid after (a) 0 h(racemic mixture); (b) 22.5 h (S-(+) form); (c) 27.5 h (racemic mixture); (d) 46.5 h ( R-(−)
form); (e) 51.5 h (shift from R-(−) form to racemic mixture); and (f) 70.5 h (racemic mix-ture) during storage under refrigeration (6 ± 2°C). Changes of the peak concentration pro-files are accompanied by changing RF values
The thin-layer chromatographic results are good evidence of the
phenomenon of oscillatory transition from one enantiomeric form of each
given profen to the opposite form. Polarimetric measurements were per-
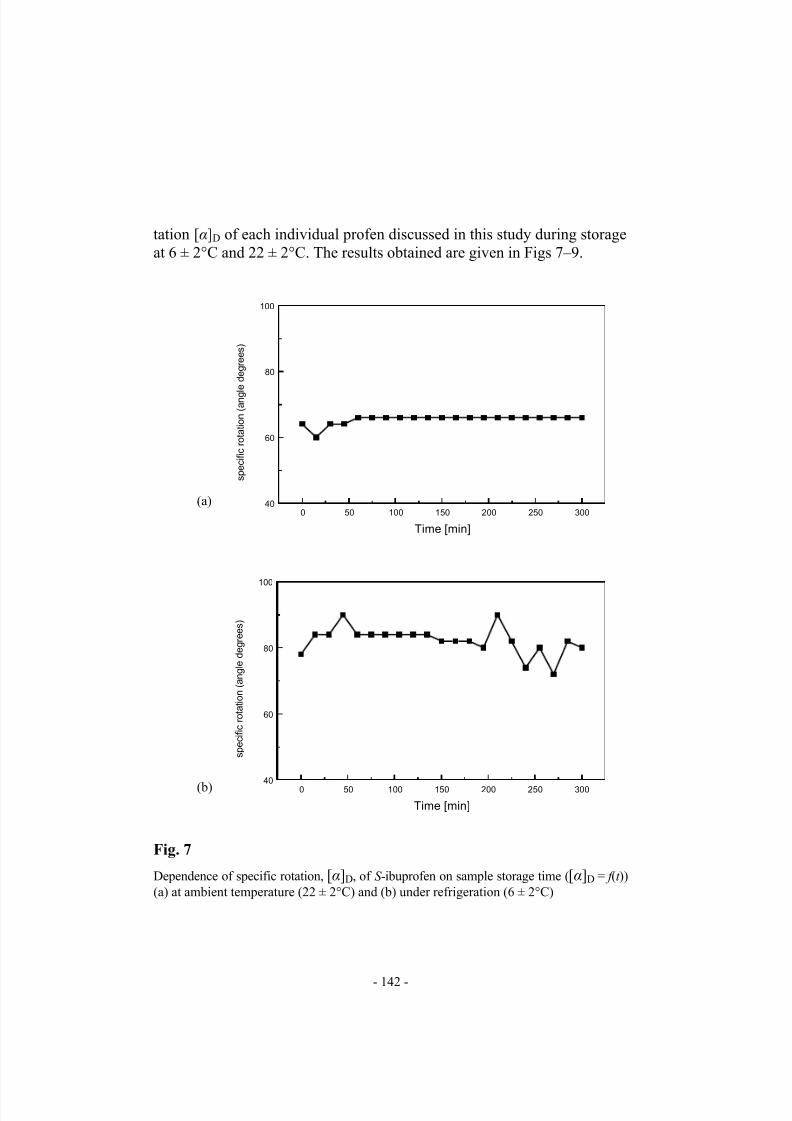
formed to prove this hypothesis experimentally. We measured specific ro-
- 141 -
7/27/2019 07_AC15
http://slidepdf.com/reader/full/07ac15 12/19
tation [α]D of each individual profen discussed in this study during storage
at 6 ± 2°C and 22 ± 2°C. The results obtained are given in Figs 7–9.
0 50 100 150 200 250 30040
60
80
100
s p e c i f i c r o t a t i o n ( a n g l e d e g r e e s )
Time [min]
(a)
0 50 100 150 200 250 30040
60
80
100
s p e c i f i c r o t a t i o n ( a n g l e d e g r e e s )
Time [min]
(b)
Fig. 7
Dependence of specific rotation, [α]D, of S-ibuprofen on sample storage time ([α]D = f (t ))
(a) at ambient temperature (22 ± 2°C) and (b) under refrigeration (6 ± 2°C)
- 142 -
7/27/2019 07_AC15
http://slidepdf.com/reader/full/07ac15 13/19
0 50 100 150 200 250 300
-100
0
100
200
300
400
s p e c i f i c r o t a t i o
n ( a n g l e d e g r e e s )
Time [min]
(a)
0 50 100 150 200 250 300
-100
0
100
200
300
400
s p e c i f i c r o t a t i o n ( a n g l e d e g r e e s )
Time [min]
(b)
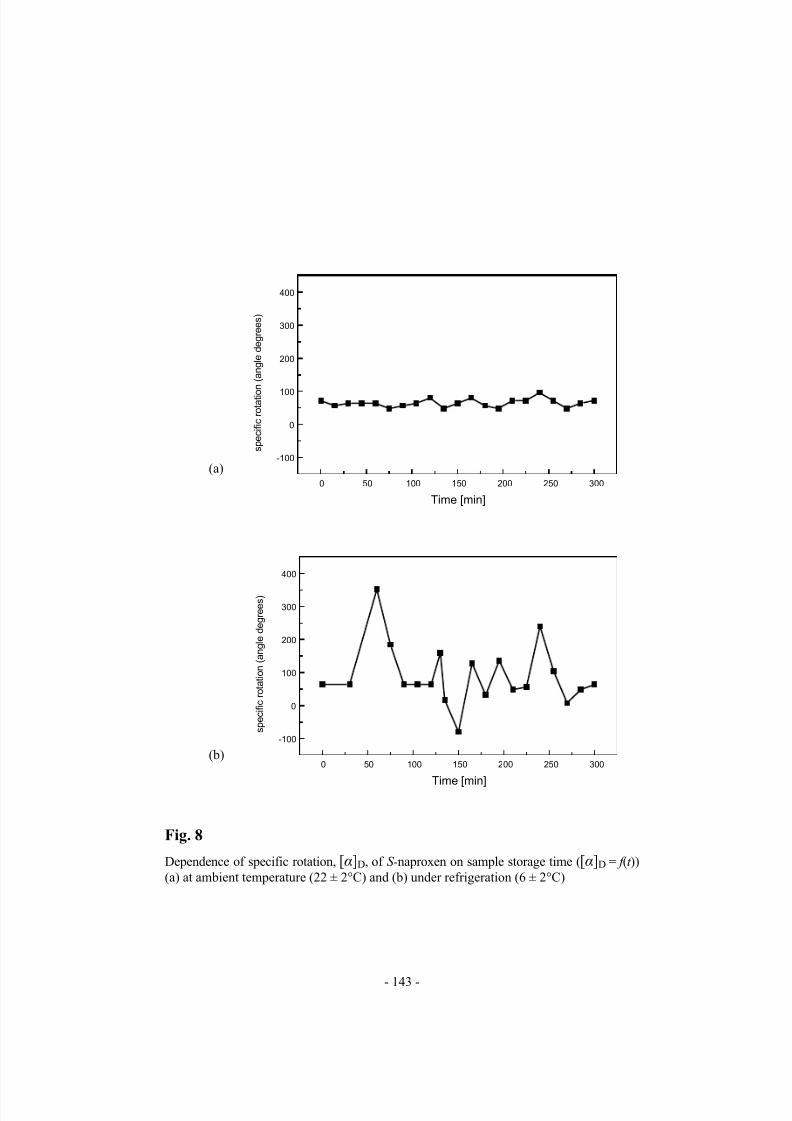
Fig. 8
Dependence of specific rotation, [α]D, of S-naproxen on sample storage time ([α]D = f (t ))
(a) at ambient temperature (22 ± 2°C) and (b) under refrigeration (6 ± 2°C)
- 143 -
7/27/2019 07_AC15
http://slidepdf.com/reader/full/07ac15 14/19
2880 2910 2940 2970 3000 3030 3060 3090 3120 3150 3180-2
-1
0
1
2
3
s p e c i f i c
r o t a t i o n ( a n g l e d e g r e e s )
Time [min]
(a)
0 50 100 150 200 250 300 350-2
-1
0
1
2
3
s p e c i f i c r o t a t i o n ( a n g l e d e
g r e e s )
Time [min]
(b)
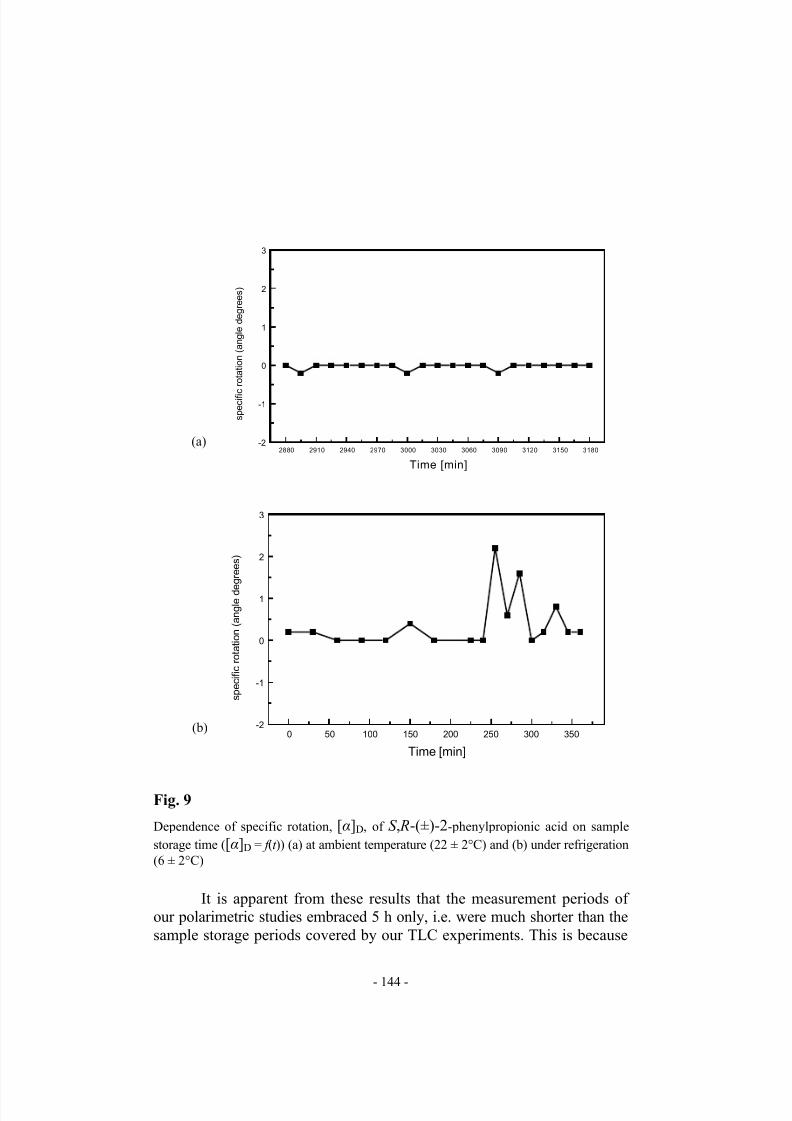
Fig. 9
Dependence of specific rotation, [α]D, of S , R-(±)-2-phenylpropionic acid on sample
storage time ([α]D = f (t )) (a) at ambient temperature (22 ± 2°C) and (b) under refrigeration
(6 ± 2°C)
It is apparent from these results that the measurement periods of
our polarimetric studies embraced 5 h only, i.e. were much shorter than the
sample storage periods covered by our TLC experiments. This is because
- 144 -
7/27/2019 07_AC15
http://slidepdf.com/reader/full/07ac15 15/19
polarimetric measurements are incomparably faster than the thin-layer chro-
matographic measurements and, moreover, can be performed almost con-
tinuously (or with very short time intervals) whereas collecting a single RF
takes approximately 1 h. Nevertheless, from the plots presented in Figs 7–
9 it is clearly apparent that:
i. the specific rotation of the three investigated profens changes in an
oscillatory manner in the course of time, and
ii. the amplitude of these oscillatory changes is visibly higher at 6°C, than
at 22°C (an analogous observation was valid for oscillatory changes
of RF values also).Last, but not least, these oscillatory changes can be observed not
only for the optically pure enantiomers (i.e. S-(+)-ibuprofen and S-(+)-na-
proxen), but also with the racemic S , R-(±)-2-phenylpropionic acid sample,
although the observed amplitude of changes of optical rotation is incom-
parably greater with S-(+)-ibuprofen and S-(+)-naproxen, i.e. with the pure
enantiomers, than with the S , R-(±)-2-phenylpropionic acid. At 6°C this
amplitude ranges roughly from +70 to +90° for S-(+)-ibuprofen, and from
−70° to 350° for S-(+)-naproxen whereas for S , R-(±)-2-phenylpropionic
acid the amplitude ranges from 0° to slightly above +2° only. Thus these
direct polarimetric results seem sufficient evidence of steady transition of one enantiomeric structure of a given antipode into that of its mirror image
for all three of the profens examined in our study.
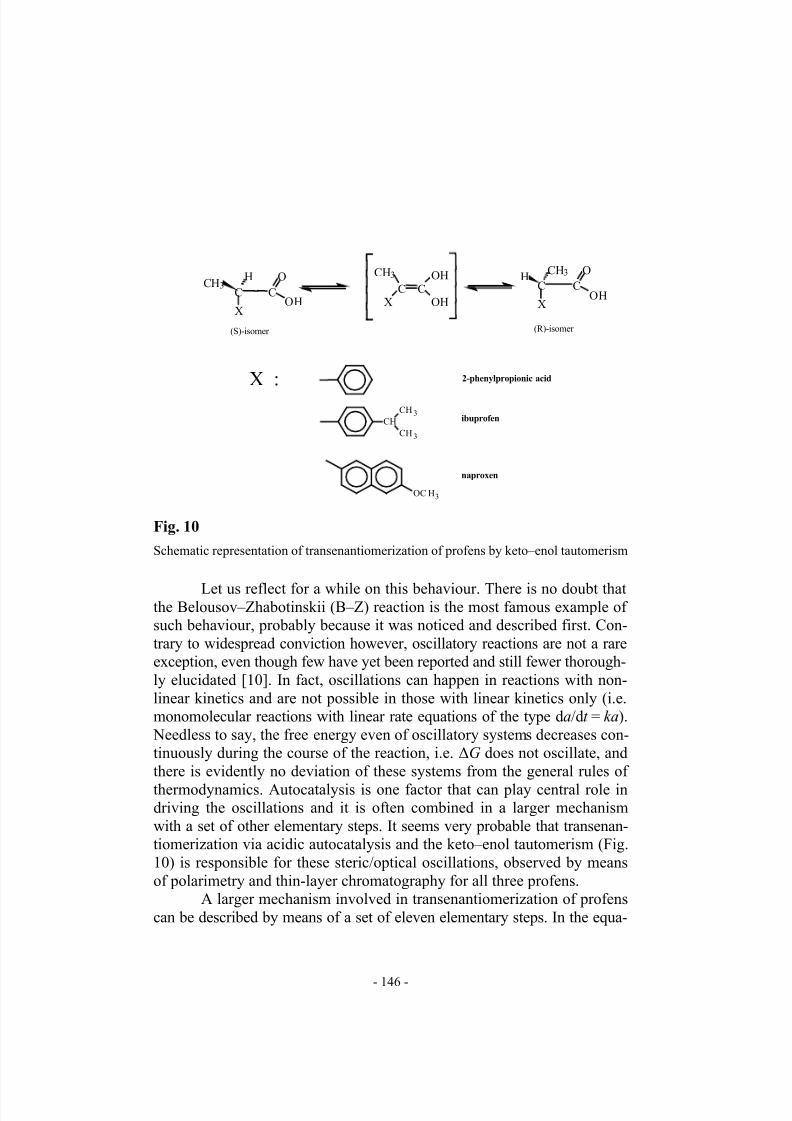
Our next step was to reflect on the molecular mechanism of this
transenantiomerization of profens. In the literature [9] we found a report
of a proved (and base-catalyzed) ibuprofen racemization mechanism oc-
curring as a result of keto–enol tautomerism. From a general knowledge
of keto–enol tautomerism we also know that this process can also be acid-
catalyzed, and all the profens are carboxylic acids with relatively well pro-
nounced electrolytic dissociation. Thus it seems fully justified to expect
keto–enol transenantiomerization of profens in aqueous media because of
the self-catalytic effect of the protons originating from the dissociated car- boxyl groups. A schematic diagram of such transenantiomerization of pro-
fens via keto–enol tautomerism is shown in Fig. 10. The greater amplitude
of oscillation at 6°C than at 22°C, apparent from both the RF = f (t ) and the
[α]D = f (t ) plots, seems to originate from the fact that reducing the tempe-
rature usually stabilizes short-living tautomers. This seems to be indirect
confirmation of the correctness of our assumption of the molecular-level
mechanism of the observed transenantiomerization. This assumption does
not, however, explain the oscillatory nature of the phenomenon discussed.
- 145 -
7/27/2019 07_AC15
http://slidepdf.com/reader/full/07ac15 16/19
CC H 3
X
H O
O H C C C
CH3 OH
OHX
CH
X
CH 3 O
O H C
(S)-isomer (R)-isomer
X : 2-phenylpropionic acid
CH
CH3
CH3
OC H3
ibuprofen
naproxen
Fig. 10
Schematic representation of transenantiomerization of profens by keto–enol tautomerism
Let us reflect for a while on this behaviour. There is no doubt thatthe Belousov–Zhabotinskii (B–Z) reaction is the most famous example of
such behaviour, probably because it was noticed and described first. Con-
trary to widespread conviction however, oscillatory reactions are not a rare
exception, even though few have yet been reported and still fewer thorough-
ly elucidated [10]. In fact, oscillations can happen in reactions with non-
linear kinetics and are not possible in those with linear kinetics only (i.e.
monomolecular reactions with linear rate equations of the type da/dt = ka).
Needless to say, the free energy even of oscillatory systems decreases con-
tinuously during the course of the reaction, i.e. ∆G does not oscillate, and
there is evidently no deviation of these systems from the general rules of
thermodynamics. Autocatalysis is one factor that can play central role indriving the oscillations and it is often combined in a larger mechanism
with a set of other elementary steps. It seems very probable that transenan-
tiomerization via acidic autocatalysis and the keto–enol tautomerism (Fig.
10) is responsible for these steric/optical oscillations, observed by means
of polarimetry and thin-layer chromatography for all three profens.
A larger mechanism involved in transenantiomerization of profens
can be described by means of a set of eleven elementary steps. In the equa-
- 146 -
7/27/2019 07_AC15
http://slidepdf.com/reader/full/07ac15 17/19
tions below – for greater clarity – we restrict ourselves to descriptors (e.g.
Ibu(S), Ibu(R)) which refer to ibuprofen only:
Ibu(S …S ) → tautomer + Ibu(S ); k 1
tautomer → Ibu(S ); k 2
tautomer → Ibu( R); k 3
2 Ibu(S ) → Ibu(S ...S ); k 4
2 Ibu( R) → Ibu( R... R); k 5
Ibu(S ) + Ibu( R) → Ibu(S ... R); k 6 Ibu( R… R) → tautomer + Ibu( R); k 7
Ibu(S … R) → tautomer + Ibu(S ); k 8
Ibu(S … R) → tautomer + Ibu( R); k 9
Ibu(S ) → tautomer; k 10
Ibu( R) → tautomer; k 11
where Ibu(S ) and Ibu( R) are, respectively, S-(+)- and R-(−)-ibuprofen;
Ibu(S…S), Ibu(R…R), and Ibu(S…R) are, respectively, cyclic dimers in-
volving two S species, two R species, and one S and one R species; and k i
is the rate constant of the ith elementary reaction (where i = 1, 2, …, 11).
By solution of the rate equations for this set of eleven elementarysteps the oscillatory transenantiomerization of the three profens can most
probably be modelled, although it is not absolutely certain whether we
have managed to take into account all the elementary steps involved. Then
the network of the elementary reactions participating in the process of
structural transformation can be changed and, finally, kinetic study of the
oscillatory instability of the profen enantiomers selected will possibly pro-
vide an ultimate elucidation of this striking and important phenomenon.
This will be the next step in our study of this oscillatory instability.
CONCLUSIONS
TLC is a sufficiently well performing separation technique to enab-
le satisfactory separation of enantiomer pairs (which is the question of a
sufficient number of theoretical plates ( N ) in thin-layer chromatographic
systems). There are, however, enantiomer pairs (for example the profens),
which cannot be separated even with aid of the best performing separation
tools. TLC can then prove a versatile multipurpose experimental tool (in
qualitative terms comparable, e.g., with polarimetry), applicable as an al-
- 147 -
7/27/2019 07_AC15
http://slidepdf.com/reader/full/07ac15 18/19
ternative solution for diverse experimental tasks from the field of physical
chemistry.
It seems likely that the oscillatory changes of the enantiomeric con-
figuration of profens are very likely to occur not only under laboratory
conditions, but also at the pharmacokinetic and the drug-interaction stage
in the human body. In view of our recent experimental results, the scienti-
fic reports claiming clearly predominant curing potential of the profen S
enantiomers (e.g. Refs. [11–15]) become less convincing and for this reason
certainly need to be carefully re-examined and re-considered.
ACKNOWLEDGEMENT
The authors wish to thank Merck KGaA (Darmstadt, Germany) for
supplying the TLC plates and the sample of S , R-(±)-2-phenylpropionic acid
used in our experiment.
REFERENCES
[1] R. Bhushan and V. Parshad, J. Chromatogr. A, 721, 369 (1996)
[2] M. Sajewicz, R. Pię tka, and T. Kowalska, J. Planar Chromatogr.,
17, 173 (2004)
[3] T. Bando, Y. Namba, and K. Shishido, Tetrahedron: Asymmetry,
8, 2159 (1997)
[4] E.J. Ebbers, G.J.A. Ariaans, A. Bruggink, and B. Zwanenburg,
Tetrahedron: Asymmetry, 10, 3701 (1999)
[5] Z.-L. Wu and Z.-Y. Li, Tetrahedron: Asymmetry, 12, 3305 (2001)
[6] X. Yuan, J. Li, Y. Tian, G.-H. Lee, X.-M. Peng, R. Zhu,
and X. You, Tetrahedron: Asymmetry, 12, 3015 (2001)
[7] V.K. Tandon, Tetrahedron Lett., 42, 5985 (2001)[8] A. Pieniak, K. Kaczmarski, M. Sajewicz, W. Zapała,
A. Gołę biowska, R. Tomala, T. Kowalska, Acta Chromatogr.,
14, 16 (2004)
[9] Y. Xie, H. Liu, and J. Chen, Int. J. Pharmaceutics, 196, 21 (2000)
[10] P. Gray and S.K. Scott, “Chemical Oscillations and Instabilities.
Non-linear Chemical Kinetics”, Clarendon Press, Oxford, 1994
[11] K. Yamamoto, Y. Ueno, K. Otsubo, K. Kawakami, and K. Komatsu,
Appl. Environ. Microbiol., 56, 3125 (1990)
- 148 -
7/27/2019 07_AC15
http://slidepdf.com/reader/full/07ac15 19/19
[12] W. Neupert, R. Brugger, C. Euchenhofer, K. Brune,
and G. Geisslinger, Br. J. Pharmacol., 122, 487 (1997)
[13] M.F. Landoni and A. Soraci, Current Drug Metabolism, 2, 37 (2001)
[14] N.M. Davies, M.R. Wright, A.S. Russell, and F. Jamali,
J. Pharm. Sci., 85, 1170 (2000)
[15] R.K. Janjikhel, J.D. Bricker, D. Borochovitz, and C.M. Adeyeye,
Drug Delivery, 6, 163 (1999)
- 149 -


