Embed Size (px)
Citation preview
____________________________________________________________________________ Department of Chemical Technology, Dr. Babasaheb Ambedkar Marathwada University Aurangabad
3
Chapter : 1
Introduction
____________________________________________________________________________ Department of Chemical Technology, Dr. Babasaheb Ambedkar Marathwada University Aurangabad
4
I n t r o d u c t i o n :
Efficiency and speed of research and development in order to meet growing
competition in the pharmaceutical industry is a challenge. Any registered
medicine represents approx. 10 years of research and development and an
investment of approx. 500 million US dollars.
Moreover, a new product is no guarantee of commercial success typically in
the pharmaceutical industry, only one in four new products brought onto the
market recoup its research and development investment [1].
Sales of pharmaceutical products in the last decade have increased i.e. in 1997
world wide sales of pharmaceutical products was total of $329 billion, an
increase of approximately 6% compared to the sales from 1996. From 1992 to
1997, global sales of pharmaceutical products increased by approximately
40%, which is an annual growth rate of 7%. Moreover, it is estimated that
world wide sales will rise to $420 billion in the year 2002.
Research and development of pharmaceuticals
Research and development of new drugs is a difficult and time consuming
process. Because of the arguments described in the introduction (Investment
of 500 $ million, high risk) the time pressure on research, development and
investment is large. The research and development pathway takes a
pharmaceutical compound through three stages; the drug discovery research
phase, the pre clinical development phase and the clinical development phase.
The drug discovery research phase primarily involves the design of a
biological model. In the pre and early clinical development phase safety is the
crucial issue. Also pharmacokinetics, dosage forms and stability are studied in
this stage.
In clinical phase- I the compound is tested in healthy volunteers. Given
dosages which for safety reasons, start much lower on a mg/kg basis than
those used to study the safety, pharmacokinetics and pharmacodynamics in
animals. After behaviour of the compound has been assessed in a limited
number of volunteers, resulting in a detailed profile, the compound is studied
on a larger scale in patients.
____________________________________________________________________________ Department of Chemical Technology, Dr. Babasaheb Ambedkar Marathwada University Aurangabad
5
In phase- II a group of usually 100-200 carefully selected patients receive the
lead compound in its expected therapeutic dose to establish the efficacy and
safety.
In phase- III the medication efficacy and safety is compared against placebo
and active compounds in typically a group of 3000- 5000 patients who
represent the population that will ultimately receive the treatment. This leads
on to submitting detailed files to registration authorities with a request for
marketing authorization.
In phase- IV the registration of the medication is followed with a view to
identify rare, unforeseen side effects in a real clinical situation by means of
post marketing surveillance, cost effectiveness and real life efficacy studies[2].
Past decade has witnessed some path breaking discoveries in the field of
chemistry and biology. These discoveries have almost significantly changed
the way pharmaceutical research was conducted. In the field of organic
chemical synthesis, combinatorial chemistry has tremendously increased the
throughput of chemical synthesis. Advances in the field of computational
chemistry and other branches of chemo metrics had made it possible to design
the drugs that give maximum therapeutic effect and minimum adverse effect.
In the field of biology discoveries in genomic, decoding of human gene, has
led to better understanding about the source of various ailments and will
ultimately help in designing better drugs in future. Thus the current trends in
drug development emphasize high volumes approaches to accelerate lead
candidate generation and evaluation. The impact of these developments on the
overall drug development cycle has been significant, creating unprecedented
opportunities for growth and focus particularly in analytical science.
Novel drug delivery system is another important area of pharmaceutical
research where most thrust is now placed. It aims at developing new and
improved drug delivery methods by which the maximum therapeutic effect
minimum toxic effect of a drug is experienced. The rate and extent of drug
released is precisely controlled. Some of these delivery systems or dosage
forms (pharmaceutical preparation) are usually prepared using different types
of polymers which form complex matrix. These matrices make quantification
____________________________________________________________________________ Department of Chemical Technology, Dr. Babasaheb Ambedkar Marathwada University Aurangabad
6
of drugs difficult, and analytical methods used for their analysis need to be
selective, accurate and robust.
Analytical chemistry in pharmaceutical research and development
Development of a pharmaceutical product involves both the optimization of
the chemistry and manufacturing, as well as determination of the bio medical
profile. The quality of drug substances (active compounds) and drug products
(e.g. tablet, liquid for injection) is determined by the design, development and
in process- control. Additionally, tests, procedures and acceptance criteria,
play a major role in assuring the quality. For monitoring the quality of the
drug substances and drug products the global tests and specifications has been
established in the form of guidelines and pharmacopeias [3-6]. The biomedical
profile is determined through e.g. pharmacokinetic and metabolism studies.
These development activities are supported by analytical techniques which can
be divided into specific (on a case by case basis) and universal (generally
applicable) techniques. Different analytical techniques are applicable to
characterize drug substances and drug products. Separation methods play an
important role in determining impurities and active compounds and coupled
on – line with spectroscopic techniques structural information can be obtained.
Limits for the presence of impurities in drugs are established by the
international conference on harmonization (ICH).
For metabolism studies separation methods are coupled on line with
techniques such as mass spectrometry for selective and sensitive detection.
From the separation methods, in the pharmaceutical industry reversed phase
liquid chromatography (RPLC) is most widely applied because of the broad
range of compounds that can be analysed i.e. non-ionic, ionisable and ionic
compounds [7]. Moreover, when a pharmaceutical product is on the market,
LC is the most widely used analytical technique in quality control to determine
the identity and content of drugs and impurities in production batches.
Pharmaceutical industry is highly regulated industry. It is under increased
scrutiny from the government regulatory authorities and public interest groups
to curtail costs and consistent delivery of safe and efficacious products to
market. Quality of drug products has become the focus of both industry and
regulatory authorities. Physico-chemical properties of drug substance and drug
____________________________________________________________________________ Department of Chemical Technology, Dr. Babasaheb Ambedkar Marathwada University Aurangabad
7
product are more closely monitored, both at the time of finished product
release and throughout the shelf life of product. Determining stability of drug
substance and drug product under accelerated and real time stability study
conditions is a mandatory requirement for registration of product. Very
sensitive and specific stability indicating analytical methods are required for
analysis of stability study samples. Thus faster drug discovery and drug
product development programs coupled with greater requirement from
industry and regulatory authorities, have resulted in increased pressures on
pharmaceutical analyst to deliver accurate and precise analytical data in a
shortest possible time.
Wet chemical and the classical methods of chemical are inadequate to meet
this challenge faced by pharmaceutical analyst. Today apart from high
throughput, better sensitivity and selectivity are desired from analytical
methods. Various instrumental methods used for chemical analysis have often
provided better sensitivity, selectivity, and high throughput as compared to
classical methods. Excellent progress in the field of analytical instrumentation
coupled with advances in the field of information technology has led to
automation of many instrumental methods of analysis. This has further
resulted into more precise and accurate analysis.
Research in analytical chemistry has also become very rapid with major
discoveries being reported almost on regular basis. Some of the more
important discoveries in recent times are in the area of Electrospray and
Nanoelectrospray (Ion source interface for LC-MS), Capillary electrophoresis,
Solid phase microextraction, matrix assisted laser desorption/ionization and
DNA analysis by CE. All these developments have unprecedented application
to pharmaceutical research. Research in analytical chemistry has also resulted
in significant improvement in other modern instrumental analytical techniques
like HPLC, HPTLC, GC, spectrophotometry etc. These developments have
revolutionized chemical analysis in many areas and more particularly in the
field of pharmaceutical analysis.
Some of the modern instrumental techniques, that find application for analysis
of different physico- chemical properties of drugs are,
� Ultraviolet, Visible Spectrophotometry
____________________________________________________________________________ Department of Chemical Technology, Dr. Babasaheb Ambedkar Marathwada University Aurangabad
8
� Infrared Spectrophotometry
� Nuclear magnetic resonance Spectroscopy
� Electron paramagnetic resonance
� X- ray diffraction and X-ray fluorescence methods
� Thermo analytical methods ( DSC, DTA and TGA)
� Electo-analytical methods (Voltametry, Amperometry,
Potentiometry, conductometry and ion- selective electrodes)
� Capillary elcetrophoresis and related techniques
� Thin layer chromatography
� Gas chromatography
� High performance liquid chromatography
� Supercritical fluid chromatography
� Liquid chromatography- mass spectrometry.
Of the above listed instrumental techniques, chromatographic methods are the
most important analytical techniques available to the today’s analytical
chemist for accurate quantitative work. Presently most of the pharmaceutical
analysis (nearly 80%) and most of the pharmacopoeial assay methods are
based on chromatographic techniques. The widespread use of
chromatographic techniques is because they posses a dual capability, the
mixture is separated into its components and simultaneously each component
are quantified accurately and precisely. In fact, all forms of chromatography
are primarily separation techniques, but by employing detectors with linear
response to monitor the eluents leaving from the chromatographic system, the
amount of each component present can also be determined. As different types
of sensitive detectors are now available, even trace components of mixture can
be accurately quantified. The simultaneous determination of multicomponent
drugs in the pharmaceutical products with impurities and degradants are
achieved by the new chromatographic techniques.
Considering the need of the pharmaceutical industry to analyse and released
the products in a shortest period attempt have been made to develop some new
chromatographic methods for the analysis of active ingredients in combined
____________________________________________________________________________ Department of Chemical Technology, Dr. Babasaheb Ambedkar Marathwada University Aurangabad
9
dosage forms and are presented in this thesis. To develop new analytical
methods for the estimation of the drugs are from antidiabetic category.
The brief discussion of the instruments and chromatographic methods used in
the present work viz. reverse phase high performance and micellar liquid
chromatography is presented below.
Discussion on chromatographic techniques used in the present work
Chromatography has been classically defined as separation process that is
achieved by the distribution of substances between two phases, a stationary
phase and a mobile phase. Those analytes distributed preferentially in the
mobile phase will move more rapidly through the system as compared to those
distributed preferentially in the stationary phase, and are thus separated from
each other. The analytes will elute or move with mobile phase in order of their
increasing distribution coefficients with respect to the stationary phase. This
distribution is affected by various phenomenon like, adsorption, partition, ion-
exchange and size exclusion.
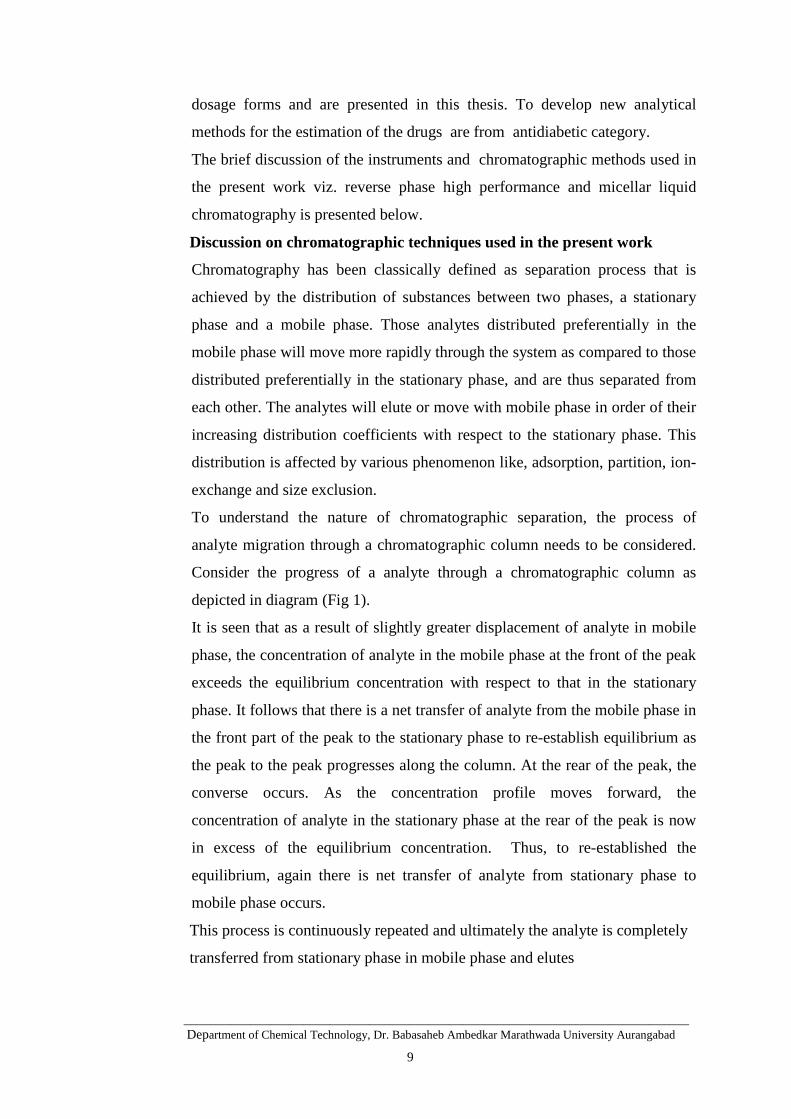
To understand the nature of chromatographic separation, the process of
analyte migration through a chromatographic column needs to be considered.
Consider the progress of a analyte through a chromatographic column as
depicted in diagram (Fig 1).
It is seen that as a result of slightly greater displacement of analyte in mobile
phase, the concentration of analyte in the mobile phase at the front of the peak
exceeds the equilibrium concentration with respect to that in the stationary
phase. It follows that there is a net transfer of analyte from the mobile phase in
the front part of the peak to the stationary phase to re-establish equilibrium as
the peak to the peak progresses along the column. At the rear of the peak, the
converse occurs. As the concentration profile moves forward, the
concentration of analyte in the stationary phase at the rear of the peak is now
in excess of the equilibrium concentration. Thus, to re-established the
equilibrium, again there is net transfer of analyte from stationary phase to
mobile phase occurs.
This process is continuously repeated and ultimately the analyte is completely
transferred from stationary phase in mobile phase and elutes
____________________________________________________________________________ Department of Chemical Technology, Dr. Babasaheb Ambedkar Marathwada University Aurangabad
10
Fig 1 : Showing passage of analyte band along a chromatographic column
Following important chromatographic techniques uses in the pharmaceutical
analysis are.
� Thin layer chromatography (TLC) and High Performance thin layer
chromatography (HPTLC).
� Gas Chromatography (GC).
� High Performance Liquid Chromatography (HPLC)
-Reverse phase high performance liquid chromatography (RP-
HPLC).
- Normal phase high performance liquid chromatography.
- Ion – exchange chromatography (IEC)
- Micellar liquid chromatography (MLC)
- Size- exclusion chromatography (SEC)
� Super critical fluid chromatography (SFC)
Of the above mentioned techniques used, RP-HPLC is mostly used in
pharmaceutical analysis. Micellar liquid chromatography is another
important variant of liquid chromatography, which has been shown to be useful
for analysis of drugs of different physico-chemical characteristics. The other
important advantages of micellar mobile phases, they are significantly less
polluting biodegradable, less inflammable, and inexpensive when compared to
hydro-organic mobile phases. These techniques have been used in the present
work to develop new analytical methods and are discussed in more detail
below.
____________________________________________________________________________ Department of Chemical Technology, Dr. Babasaheb Ambedkar Marathwada University Aurangabad
11
Reversed Phase High Performance Liquid Chromatogrphy
Instrumentation :
HPLC system consists of a solvent reservoir, a pump, an injector system or
autosampler, a column , a detector and a data collection and processing unit
( mostly microcomputer using a appropriate software).
Solvent Reservoir
A modern HPLC unit is equipped with one or more glass or stainless steel
reservoirs, each of which contains 500 ml or more of solvent. Provisions are
often included to remove dissolved gases and dust from the liquids.
An elution with a single solvent mixture of constant composition is termed as
isocratic elution. In gradient elution two or more solvent systems that differ
significantly in polarity are employed. The ratios of the two solvents are varied
in a preprogrammed way to improve the separation efficiency.
Pump
A HPLC pump should satisfy the following basic requirements
1. Pulse free output
2. Flow rates ranging from 0.1 to 10 ml/min
3. Flow rated reproducibilities of 0.5% relative or better
4. Resist to corrosion by a variety of solvents.
These requirements can be satisfied by a number of different designs but most
systems use either reciprocating or diaphragm pumps, out of which
reciprocating pumps are most widely used. The pumping action is achieved by
a cam – driven reciprocating piston driven by a constant speed motor. It is dual
headed pump with two pistons.
Sample injection system and Autosamplers
The most widely used method for sample introduction is based on sampling
loop. Interchangeable loops that provide a choice of sample size ranging from 5
to 500 µl are commercially available. Now–a-days autosamplers with
calibrated syringes are used to inject variable volumes of sample. This mode of
injection is also called as variable loop injection system. Auto samplers can be
programmed to inject sample at regular time intervals or at predetermined time.
In built column ovens in auto samplers provide means of controlling column
temperature.
____________________________________________________________________________ Department of Chemical Technology, Dr. Babasaheb Ambedkar Marathwada University Aurangabad
12
Columns
a ) Analytical columns : HPLC columns are constructed from smooth bore
stainless steel tubing. The majority of the columns range in length from 10 to
30 cm. The inside diameter of the columns often range from 4 to 10 mm. the
common particle sizes of the packing are 3,5 and 10 µm. The most commonly
used packing material is silica, alkyl bonded silica and polymer based particles.
b) Guard columns :
Often a short guard column is introduced before the analytical column to
increase the life of the analytical column by removing particulate matter and
contaminants from the solvent. The composition of the guard column packing
should be similar to the analytical column.
Detectors
The important characteristics sought in a HPLC detector are sensitivity,
reproducibility, selectivity, stability, low operating cost and a wide linear range.
Commonly used detectors are,
a) UV- Visible spectrophotometry : Majority of organic compounds can be
detected by their absorption of UV or visible light. Most of the drugs have
chromophores and auxochromes, like conjugated double bonds, aromatic rings,
unsaturated bonds, aromatic rings, carbonyl, ester, nitro, nitrile, amine
functional groups and heterocyclic rings, etc. In spectrophotometric detection
the sensitivity and response, depends primarily on the extinction coefficient of
the analyte at the wavelength used for the detection. It differs markedly for
different compounds depending on their chromophores. The advantage of the
spectrophotometric detector is that it responds to most compounds and hence is
known as pseudo- universal detector. The various types of UV- visible
detectors used in HPLC are,
i ) Single wavelength detector
ii) Variable wavelength detector
iii) Photo-diode array detector
These utilize a deuterium or xenon lamp that emits light over the UV spectral
range. The light from lamp is focused by means of an achromatic lens through
the sample cell onto a holographic grating. The dispersed light from the grating
is arranged to fall on a linear diode array. The diode array gives signal in
____________________________________________________________________________ Department of Chemical Technology, Dr. Babasaheb Ambedkar Marathwada University Aurangabad
13
proportion of the intensity of radiation incident on it and this entire spectrum of
the analyte eluting from the column can be continuously recorded. By
examining the spectrum of analyte peak from beginning to end, peak purity
(peak homogeneity) can be evaluated. If a single component is present in the
peak (i.e. no co-eluting component is present), the UV spectra obtained across
the peak should be superimposable. Chromatography softwares used for
intergration and data processing usually provide spectral analysis option, which
compares the spectrum obtained over the entire peak and provides peak purity
data.
b) Refractive index (RI) detector :
These detectors sense the difference in refractive index between the column
eluent and a reference stream of pure mobile phase. As any analyte can be
detected as long as there is a difference between RI of analyte and mobile
phase, hence it is a universal detector. But these detectors are less sensitive as
compared to UV detectors and are only used for analysis of compounds that do
not absorb UV radiation.
c) Fluorescence detector :
Analytes that show fluorescence properties can be analyze using these
detectors. As relatively few compounds possessed this property the use of this
detector is limited. But some analytes can be converted to fluorescent
derivatives by pre-column or post column derivatization. Due to the
spectroscopic and chemical specificity, fluorescence detection is very selective
and very useful for analyzing compounds from complex matrix like biological
fluids. As fluorescence is a emission technique in which the background signal
in the absence of fluorophore is virtually zero, therefore the sensitivity is more
in this technique.
d) Electrochemical detector :
Electrochemical detectors measure either the conductance of the eluent or
current associated with the oxidation or reduction of analytes. To be capable of
detection using the first method the analytes must be ionic and using the second
method the analytes must be relatively easy to oxidize or reduce.
Data collection and processing unit
____________________________________________________________________________ Department of Chemical Technology, Dr. Babasaheb Ambedkar Marathwada University Aurangabad
14
Signals from detectors are integrated using integrator or microcomputers.
Now – a – days microcomputers (PC’s) are widely used for data collection and
processing. The collected data is processed using various chromatography
softwares. These softwares provide variety of options for peak integration. The
spectral analysis option provides for determining the chromatographic peak
purity, comparing spectrums of analyte peaks acquired using diode array
detector, and matching them with library spectra for better identification of
unknown peaks.
Technique
RP-HPLC is generally considered as a type of partition chromatography in
which the analytes distribute between the non polar bonded stationary phase
and polar mobile phase. It is similar to extraction of different compounds from
water into an organic solvent such as octanol, where more hydrophobic (non-
polar) compounds preferentially extract into the non polar octanol phase. In RP
HPLC the stationary phase is packed into a column and is generally made up of
a silica support modified with a C8 or C18 bonded phase. More recently, the use
of macro-porous polymer resins as a support material is also gaining more
acceptance. These resins are generally formed by copolymerization of
polystyrene and divinylbenzene. Resin based packing material has advantage
over silica based ones, in that they can be used with mobile phases having very
high and low pH (pH 1 to 13) which is required in the analysis of peptides and
proteins. But columns packed with macro- porous polymer resins have less
efficiency as compared to those packed with silica particles. Semi polar
stationary phases consisting of silica support modified with either cyanoalkyl
groups (CN) are used for analysis of hydrophilic compounds (polar) in RP-
HPLC as stationary phase. The stationary phases used in RP HPLC are less
polar than water-organic mobile phase because of which the analyte molecules
partition between the polar mobile phase and non polar C8 or C18 stationary
phase. The hydrophobic (non polar) compounds are retained more strongly on
the stationary phase while the relatively hydrophilic (polar) compounds weakly
retained on stationary phase and elute first with the mobile phase while the
most hydrophobic compounds elute last thus for a given mobile phase
____________________________________________________________________________ Department of Chemical Technology, Dr. Babasaheb Ambedkar Marathwada University Aurangabad
15
composition , the result is a differential retention of analyte according to their
hydrophobocity .
The retention in RP HPLC is also determined by the other experimental
conditions like mobile phase composition and pH , temperature , particle size of
column packing material (silica or polymer) used , and dimensions of column (
length and diameter) . The effects of these parameters on retention of analyte
on different types have been well studied and they can lead to a systematic
approach of RP HPLC method development.
Some of these important parameters are discussed below.
i) Mobile phase composition and pH :
Mobile phases used in RP HPLC consist of water (or aqueous buffer) and
organic solvents. The retention of analytes can be changed by changing the
phase composition i.e. proportion of water and organic solvent. The retention is
less stronger for mobile phase which is less polar i.e. containing a higher
proportion of organic solvent. Initial goal of method development is to obtain
adequate retention of all the analytes. An adequate retention range is mostly k’
values in the range of 1-10 , i.e 1 < k’< 10.
The retention of analytes is studied with change in proportion of organic
solvent and values of k’ are plotted against the percentage of organic solvent in
mobile phase to determine the mobile phase composition in which most of the
analytes are separated and have retention in the above mentioned range. The
strength of mobile phase to elute the analytes also depends on the type of
organic solvent used. The most commonly used solvents are acetonitrile,
methanol and tetrahydrofuran. Among these solvents, acetonitrile has the
highest solvent strength (elution strength) primarily because its low viscosity,
higher polarity index, and its ability to solubalise most of the organic
compounds. Generally, better peak shape is also achieved with the use of
acetonitrile as compared to methanol or tetrahydrofuran.
Organic compounds used as drugs often have one or more functional groups
like COOH, -NHR, -CONH2, SH, -COOR etc and /or also contain heterocyclic
rings. These compounds can have their pka values in the working pH range or
silica based column (pH 2 .0 – 8.0). Thus with the change in pH a
transformation of analytes between ionized and non ionized can occur. For
____________________________________________________________________________ Department of Chemical Technology, Dr. Babasaheb Ambedkar Marathwada University Aurangabad
16
acidic compounds, a pH higher than their pka value will result in ionized
species, whereas for basic compounds a pH lower than their pka value will
result in ionization. As ionized species are weakly retained as compared to
their unionized once on stationary phases used in RP HPLC, changing the pH
of mobile phase used for elution can modify retention of analytes. The situation
is somewhat complex for compounds containing more than one functional
group. Thus to optimize the elution retention behaviour of analytes are studied
with change of pH of mobile phase and the k’ values of different analytes
present in mixture are plotted against the pH of mobile phase. From this plot
the optimum pH of mobile phase at which most of the analytes are separated
and have reasonable retention times is selected.
ii) Column type and temperature:
A change in the type of column used, often produces significant changes in
retention of analytes. The columns most frequently used in RP HPLC are C8,
C18 , Phenyl and CN . Hydrophobic (non polar) analytes are better retained on
non polar stationary phases like C18, C8 and phenyl whereas more hydrophilic
( polar) analytes are retained on semi polar stationary phases like CN. Change
in selectivity by changing the column type may also be advantageous if only
one organic solvent used in mobile phase. Thus a change in column type can be
useful parameter for attaining difficult separation. Retention of analytes
generally decreases with increase in column temperature. However, this change
usually does not modify the selectivity significantly for non ionic compounds.
For ionic compounds, the change in temperature can result in large variation in
selectivity as in this case retention is dependent on more than one processes and
this respond differently to change in temperature. But the use of higher
temperatures in combination with low or high mobile phase pH can lead to a
rapid loss of bonded phase with most columns. Thus the use of temperature for
modifying selectivity should be made with caution.
iii) Column packing materials of different particle sizes have different
applications. There are three types of silica particles used in column packing,
a) Micropellicular particles
____________________________________________________________________________ Department of Chemical Technology, Dr. Babasaheb Ambedkar Marathwada University Aurangabad
17
The size of these particles ranges from 1.5 to 2.5 µm. Micropellicular particles
have very thin outer skin of interacting stationary phase that allows fast mass
transfer and thus displace outstanding efficiency for micromolecules.
b) Perfusion particles
The size of these porous particles are in 0.4 to 0.8 µm. Perfusion particles
allow high flow rates with less band broadening and pressure drop. However,
experiences with this type of particles are limited and hence their practical
implication are incomplete.
c) Totally porous microspheres
The particle diameters are in the range of 3 or 5 µm. Totally porous particles
are the most commonly used particle type because they provide of favourable
compromise of desired properties: efficiency, sample loading, durability,
convenience, and availability. The particles are available in a variety of
diameters, pore sizes, and surface areas, so that all types of HPLC methods can
be developed with this packing material. Totally porous particles of diameter
about 5 µm represent a good compromise for analytical columns in terms of
column efficiency, back pressure, and lifetime. The analytical columns
containing silica packing material having 5 µm diameters are used to develop
the methods in the present thesis.
Micellar Liquid chromatography
The instrumentation used in MLC is same as that used for RP-HPLC
Technique
Micellar liquid chromatography used surfactant solution, above its critical
micellization concentration (c.m.c) as the mobile phase instead of hydro-
organic mobile phase used in RP-HPLC. These aqueous solutions of surfactants
at concentrations above their cmc contain micelles, along with monomers,
dimmers, etc. and constitute a complex mobile phase modifier. The analytes are
eluted from column with micellar aggregates and bulk solvent (water).
____________________________________________________________________________ Department of Chemical Technology, Dr. Babasaheb Ambedkar Marathwada University Aurangabad
18
Micellar solutions are microscopically heterogeneous, being composed of the
amphillic micellar aggregates and the bulk surrounding solvent that contains
surfactants whose concentration is approximately equal to the cmc. Micelles
are not static but exist in equilibrium with surfactant monomer. The monomer
adsorbs on alkyl bonded stationary phases (e.g. C1, C18 and C8) in at least two
ways, i) the hydrophobic adsorption where the alkyl tail of the surfactant would
be adsorbed and the ionic group would then be in contact with the polar
solution, giving stationary phase some ion exchange capacity for charged
analytes., ii) sylanophillic adsorption, where the ionic head group of the
surfactant would be adsorbed. The amount of surfactant adsorbed on the
stationary phase remains constant after equilibration once the concentration is
above cmc and such a stationary phase is also called a surfactant modified
stationary phase.
Different types of interactions are possible in MLC (electrostatic, hydrophobic
and steric) between analyte and micellar mobile phase and surfactant modified
stationary phase. None of these interactions can occur with hydro-organic
system. The analytes are separated based on their differential partitioning
between the bulk aqueous phase and the micelllar aggregates in the mobile
phase and between the bulk aqueous phase and the surfactant –coated
stationary phase. For water insoluble species, partitioning can also occur via
direct transfer of the analyte in the micellar aggregates to the surfactant
modified stationary phase. Hence, the elution of analytes in MLC depends on
three partition coefficients, that between stationary phase and water (PSM),
between stationary phase and micelle (Psm) and between the micelle and water
(PMW).
First Armstrong and Nome and late Arunyanar and Clive Love proposed
different models to describe the relation between retention of analytes and
micelle concentration in purely micellar mobile phase. The equation as
mentioned by Garcia Alvarez- Coque etal .
1 = KAM [M] + 1 k’ ΦPSW ΦPSW
Where k’ is the capacity factor, (M) is the total concentration of surfactant in
the mobile phase minus the cmc. In this equation Φ is the ratio of the volume of
____________________________________________________________________________ Department of Chemical Technology, Dr. Babasaheb Ambedkar Marathwada University Aurangabad
19
stationary phase Vs, to the volume of mobile phase Vm, in the column, KAM is
the analyte micelle binding constant and PSW is analyte stationary phase-water
partition constant.
This equation can be used to describe the retention of apolar, polar and even
ionic analytes, chromatographed with anionic, cationic and non-ionic
surfactants. The non- homogenous nature of the micelle creates a unique
situation in which different analytes can experience various micro-environment
polarities in a given mobile phase. Retention of analyte will depend on the type
of interaction it has with the micelle and the surfactant modified stationary
phase. Non-polar analytes should be affected by hydrophobic interactions but
for analytes that are charged two distinct situations can be considered.
i) charge on the analyte and surfactant have same sign,
ii) charge on analyte and surfactant have opposite sign.
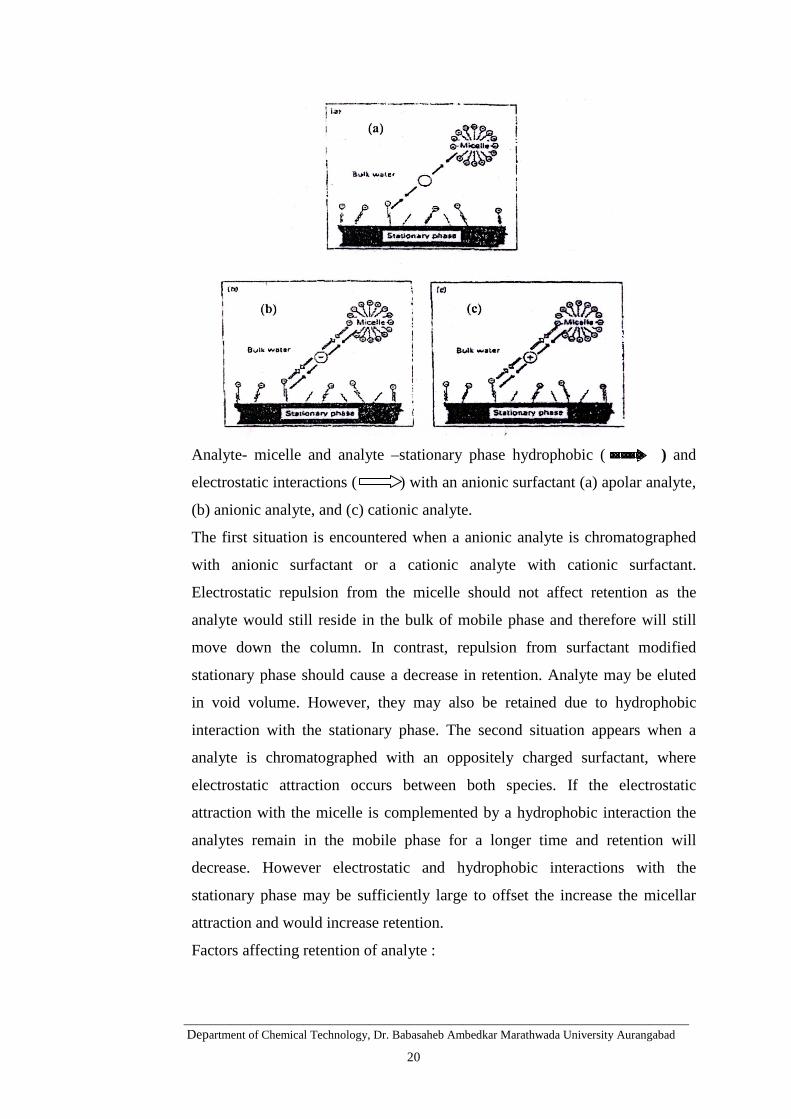
Fig 2 (a), (b) and (c) show diagrammatically the analyte micelle and analyte
and analyte stationary phase interactions.
Figure 2
____________________________________________________________________________ Department of Chemical Technology, Dr. Babasaheb Ambedkar Marathwada University Aurangabad
20
Analyte- micelle and analyte –stationary phase hydrophobic ( ) and
electrostatic interactions ( ) with an anionic surfactant (a) apolar analyte,
(b) anionic analyte, and (c) cationic analyte.
The first situation is encountered when a anionic analyte is chromatographed
with anionic surfactant or a cationic analyte with cationic surfactant.
Electrostatic repulsion from the micelle should not affect retention as the
analyte would still reside in the bulk of mobile phase and therefore will still
move down the column. In contrast, repulsion from surfactant modified
stationary phase should cause a decrease in retention. Analyte may be eluted
in void volume. However, they may also be retained due to hydrophobic
interaction with the stationary phase. The second situation appears when a
analyte is chromatographed with an oppositely charged surfactant, where
electrostatic attraction occurs between both species. If the electrostatic
attraction with the micelle is complemented by a hydrophobic interaction the
analytes remain in the mobile phase for a longer time and retention will
decrease. However electrostatic and hydrophobic interactions with the
stationary phase may be sufficiently large to offset the increase the micellar
attraction and would increase retention.
Factors affecting retention of analyte :
____________________________________________________________________________ Department of Chemical Technology, Dr. Babasaheb Ambedkar Marathwada University Aurangabad
21
i) Concentration of surfactant: For many analytes, an increase in concentration
of surfactant in mobile phase results in decrease in retention. Thus, elution
strength of mobile phase increases with increase in concentration of surfactant.
However, this is possible only when the analyte interacts with the mobile
phase. Different analytes show any of the following three types of interaction
a) binding interaction- the compound binds to micelle in mobile phase and its
retention decreases with increase in concentration of micelle, (Kam> 0)
b) non binding interaction compound does not bind to micelle and thus
retention remains unaltered with increase in concentration of micelle,
( Kam=0 )
c) Anti-binding interaction-compounds is strongly excluded from micelle and
thus results in increase in retention with increase in micelle concentration
(Kam <0) .
Non binding and anti- binding interaction are rare as compared to binding
interactions. Non binding interaction occurs only when analyte and micelle
have similar type of charge (i.e. both are either positively or negatively
charged). However, in this case sometimes binding is observed. Antibinding
can only be observed when analyte and micelle have similar type of charge
and stationary phase does not adsorb significant amount of surfactant. Thus,
anti-binding can only be observed with stationary phase like C1 or CN.
ii) pH of mobile phase : Retention of weak acid or bases are affected by
change in pH of micellar mobile phase. As the dissociated and undissociated
forms of anaytes have different analyte-micelle partition constant, retention is
altered significantly only when pH of mobile phase is near to pka value of
analyte. C18 and CN bonded phase interact very differently with surfactant
monomers, resulting in a different elution behavior of organic acids and bases
as a function of pH and concentration of micelle.
iii) Organic additives : Organic additives, mostly short chained alcohols to
micellar mobile phase alter the chromatographic retention and efficiency
significantly. Small amounts of alcohols like propan-2-ol , butan-1-ol penta-1-
ol etc., bring about significant decrease in the amount of surfactant coated on
the stationary phase and thickness of surfactant monomamer layer, which
results in better mass transfer and hence better efficiency and reduced
____________________________________________________________________________ Department of Chemical Technology, Dr. Babasaheb Ambedkar Marathwada University Aurangabad
22
retention . The effect of modifier increases with increase in its concentration
and hydrophobocity. Thus reduction in retention of analytes is greater with
pentan-1-ol, followed by butan-1-ol and propan-1-ol. The reduction in
retention of analyte and increased efficiency is also attributed better solubility
of analyte in mobile phase in presence of alcohols.
iv) Ionic strength: An increase in ionic strength of mobile phase (by addition
of salt like NaCl) decreases the thickness of charged double layer surrounding
the micelle. Thus analytes which are excluded out of micelle due to the
charged double layer (non-binding and anti-binding interaction), can interact
hydrophobically with micelle with the increase in ionic strength and thus can
have lesser retention.
Validation of Method
Once a particular method is optimised, it is necessary to validate the method.
Valdiation is the process of establishing the suitability of a method for
authorization for its use in the laboratory. Validation of a chromatographic
method is not limited to pharmaceuticals, it is applicable to all sample types
and all chromatographic techniques. A huge validation work is done in the
pharmaceutical industry because it is initiated by various agencies that to
monitor the development, manufacture, and sale of pharmaceutical products.
These requirements are essential so that only safe and effective products are
made available for the sale to the public. Ensuring that the analytical methods
for assay and control of these products are operating correctly is one way to
protect the safety of the patients using the product. The developed analytical
method needs to be validated for following common parameters.
a) Specificity- selectivity
Specificity is the ability of the method to measure the analyte without
interference from other sample matrix components. The term specificity is
used to express the quality of the separation when not all peaks are of equal
importance. The term selectivity is generally used when all the peaks are of
equal importance. This is determined by spiking a solution with all the known
possible interfering components of the sample. In the case of drug substance
and drug products these would include synthetic precursors and degradation
products.
____________________________________________________________________________ Department of Chemical Technology, Dr. Babasaheb Ambedkar Marathwada University Aurangabad
23
b) Linearity
The linearity of an analytical procedure is its ability to produce responses that
are directly proportional to the concentration of the analytes in the sample
within a given working range. The range of the procedure is an expression of
the lowest and highest levels of the analytes that the method can determine
with reasonable accuracy and precision. Results of linearity test are analysed
by a method of linear regression and represented in terms of the coefficient of
regression (r).
c ) Precision
The precision of the analytical method relates to the degree of agreement
among individual test results and how individual results are scattered from the
mean value. This is generally determined by assaying multiple replicates from
a homogenous sample and calculating the standard deviation of the results.
The precision of the method is a combination of several factors including the
homogeneity of the samples, the sample preparation techniques and the actual
separation and detection of the components. Also replicate analysis to be done
in different labs, with different analysts, different day and different columns to
determine the actual variability of the method over a period of time. This
determination is often called as method ruggedness.
d) Recovery
Recovery is simply a determination that all the species of interest are carried
through the sample preparation scheme without loss. This determination is
also referred as the accuracy of the method. Recovery is determined by
assaying samples of matrix to which known amounts of analyte have been
added and comparing results of their assay to those of standards prepared
without matrix. The recovery is the amount of analyte recovered from the
spiked samples compared to that from the standards. The acceptance criteria
for recovery must depend on the nature of the samples.
e) Limit of detection
It is defined as the lowest concentration of substance in a sample can be
detected, but not necessarily determined quantitatively, under the stated
experimental conditions. ICH guidelines recommended three types of method
____________________________________________________________________________ Department of Chemical Technology, Dr. Babasaheb Ambedkar Marathwada University Aurangabad
24
for determination of LOD. In the present work slope method is used in which
LOD is determined by the following equation
LOD= 3.3 x Standard deviation of residuals (�)
Slope (S)
f) Limit of quantitation
This is defined as the lowest concentration of a substance that can be
determined quantitatively with acceptable accuracy and precision using the
recommended procedure of analysis. The LOQ is determined by the following
equation
LOQ= 10 x Standard deviation of residuals (�)
Slope (S)
g) Robustness
Robustness of the method is established by carrying out analysis of the same
sample by deliberately varying certain experimental conditions such as pH,
composition of the mobile phase and temperature in chromatographic analysis,
sample preparation using different volume of solvent and different time of
sonication etc.
h) Solution stability
The extended use of auto-injectors for HPLC assays has certainly increased
the number of samples that one analyst may run in a given length of time.
However these automated systems are not infallible, and occasionally a
problem will occur while the instrument is running unattended that will
prevent the completion of the run. In this event, it is useful to know if the
samples and standards may simply be reused and run again. Testing the
stability of these samples solutions provide an assurance that the integrity of
the analytes has not changed. Solution stability is established by analyzing a
standard solution or sample solution at different time intervals and comparing
it with a freshly prepared standard solution of comparable concentration.
Typically solution is considered to be stable for the time till its assay is within
+ 2.0% of its original assay level.
i) System suitability
____________________________________________________________________________ Department of Chemical Technology, Dr. Babasaheb Ambedkar Marathwada University Aurangabad
25
Both the FDA and the pharmacopoeia have recommended the use of system
suitability tests for chromatographic assays. The purpose of this test is to
demonstrate that the chromatographic system is properly operating at that
particular time. This generally entails a test of both the precision and
chromatographic performance of the system. The precision is demonstrated by
the injections of one standard or sample solution five times. The response of
the peak of interest is measured and its reproducibilities is calculated.
Bioanalytical Method development and Validation
Bioanalytical chemistry is the qualitative and quantitative analysis of drug
substances in biological fluids (mainly plasma and urine) or tissue. It plays a
significant role in the evaluation and interpretation of bioavailability,
bioequivalence and pharmacokinetic data [16]. The main analytical phases
that comprise bioanalytical services are, method development, method
validation and sample analysis (method application).
Owing to increased interdependence among countries in recent times it has
become necessary for results of many analytical methods to be accepted
internationally. Consequently, to assure a common level of quality, the need
for and use of validated methods has increased [17].
Analytical methods are used for product research, product development,
process control and chemical quality control proposes. Each of the techniques
used, chromatographic or spectroscopic, have their own special features and
deficiencies, which must be considered. Whatever way the analysis is done it
must be checked to see whether it does what it was intended to do i.e. it must
be validated. Each step in the method must be investigated to determine the
extent to which environment, matrix, or procedural variables can affect the
estimation of analyte in the matrix from the time of collection up to the time of
analysis.
A full validation requires a high workload and should therefore only start
when promising results are obtained from explorative validation performed
during the method development phase. The process of validating a method
cannot be separated from the actual development of method conditions,
because the developer will not know whether the method conditions are
____________________________________________________________________________ Department of Chemical Technology, Dr. Babasaheb Ambedkar Marathwada University Aurangabad
26
acceptable until validation studies are performed [18]. Method development
clears the way for the further processes on the validation stage. It must be
recognized that proper validation requires a lot of work. However, this effort is
repaid by the time saved when running the method routinely during sample
analysis.
Method development
A bioanalytical method is a set of all the procedures involved in the collection,
processing, storing and analysis of a biological matrix for an analyte [19].
Analytical methods employed for quantitative determination of drugs and their
metabolites in biological fluids are the key determinations in generating
reproducible and reliable data that in turn are used in the evaluation and
interpretation of bioavailability , bioequivalency and pharmacokinetics [20].
Method development involves evaluation and optimization of the various
stages of sample preparation, chromatographic separation, detection and
quantification. To start these work an extensive literature survey, reading work
done on the same or similar analyte and summarizing main starting points for
future work is of primary importance. Based on the information from this
survey, the following can be done.
The choice of instrument that is suitable for the analysis of analyte of interest.
This include the choice of the column associated with instrument of choice ,
the detector, the mobile phase in the HPLC, and the choice of carrier in gas
chromatography (GC).
Choice of internal standard, which is suitable for study, must have similar
chromatographic properties to the analyte.
Choice of extraction procedure, which is time economical, gives the highest
possible recovery without interference at the elution time of the analyte of
interest and has acceptable accuracy and precision.
Different procedures for the extraction of sample are as follows
Sample Preparation
In sample preparation there are two major objectives: to remove as much and
as many of the endogenous components of the bio-fluid as possible, while at
the same time concentrating the analyte in a small volume as possible. In
____________________________________________________________________________ Department of Chemical Technology, Dr. Babasaheb Ambedkar Marathwada University Aurangabad
27
general, precipitation techniques are used for analytes at higher concentration
where it is possible to inject the sample into a liquid chromatography (LC)
system and obtain adequate sensitivity.
Precipitation Techniques
The simplest sample preparation procedure for plasma is precipitation of the
proteins. Where whole plasma is processed, acetonitrile (x 1 vol.) or methanol
(x 2 vol.) can be added and the precipitated plasma proteins removed by
centrifugation. The supernatant containing the analyte of interest can be
processed further depending upon the end point detection system to be used.
In general, precipitation techniques are used for analytes at higher
concentration where it is possible to inject the sample into a liquid
chromatography system and obtain adequate sensitivity.
Liquid-Liquid extraction
Liquid-liquid extraction is still the most widely used method for extracting
analytes from aqueous media and separating them from endogenous
interference. In addition it provides a simple means of concentrating the drug
by evaporation of the solvent.
An essential characteristic of a solvent used for this purpose is its
immiscibility with water. The most widely used solvents in increasing solvent
strength are: ethyl acetate, methylene chloride, chloroform, methyl tertiary
butylether (MTBE), chloroform, butyl chloride, hexane, petroleum ether and
pentane. The actual order may vary depending upon the criteria used to
determine solvent strength. Ideally the polarity of the solvent used should be
sufficient to remove the drug from the aqueous phase without removing
closely related endogenous compounds. In addition it is important to consider
the volatility, density and toxicity of solvents.
The procedure that is usually followed is to adjust the pH of the sample such
that the ionization of the analyte is suppressed and it therefore exists in its
more lipophilic form. The amount of organic solvent should be as low as
possible compatible with the partition coefficient. Although the partition
process is essentially a rapid and immediate process the presence of proteins,
which physically hinder the mixing process, coupled with protein binding of
____________________________________________________________________________ Department of Chemical Technology, Dr. Babasaheb Ambedkar Marathwada University Aurangabad
28
the drug, may necessitate shaking for 1 hr or more in order to maximize
recovery.
Endogenous interferences may still be present after one extraction. Further
clean-ups can be effected by back-extracting the analyte into an aqueous layer
(pH depends on analyte) followed by re-extraction into an organic solvent
which then is evaporated to dryness and re-dissolved in an appropriate solvent
prior to analysis. For LC methods, the aqueous back-extraction usually
provides an adequate clean up. Provided that the back-extraction phase is of
the appropriate pH and molarity, it is possible to inject this extract onto the LC
systems.
Solid-Phase Extraction (SPE)
Solid-phase extraction (SPE) is a technique, which can avoid many of the
problems associated with liquid-liquid extraction.
The general approach to solid-phase (liquid-solid) extraction is adsorption of
the drug from a liquid onto a solid adsorbent or stationary phase immobilized
on a solid support. SPE using silica, alumina, celite, talc, charcoal, ion-
exchanger or hydrophobic resins has long been a common practice in the
clinical laboratory. The manufacture of modern HPLC stationary phases has
led to new methods in the solid-phase extraction technique. Nowadays, the
materials available for SPE are myriad and silica gels bonded with a variety of
functional groups, e.g. alkyl, phenyl, cyano and diol-moieties, are commonly
employed to provide specific interactions with analytes.
SPE is usually carried out in small columns packed with a material similar to
those used for analytical separations.
Method performance is determined primarily by the quality of the procedure
itself. The two factors that are most important in determining the quality of the
method are selective recovery and standardization. Analytical recovery of a
method refers to whether the analytical method in question provides response
for the entire amount of analyte that is contained in a sample. Recovery is
usually defined as the percentage of the reference material that is measured, to
that which is added to a blank. This should not be confused with the test of
matrix effect in which recovery is defined as the response measured from the
matrix (e.g.plasma) as a percentage of that measured from the pure solvent
____________________________________________________________________________ Department of Chemical Technology, Dr. Babasaheb Ambedkar Marathwada University Aurangabad
29
(e.g. water) . Results of the experiment that compare matrix to pure solvent is
referred to as relative recovery and true test of recovery is referred to as
absolute recovery [21].
Another important issue in method development stage is the choice of
internal versus external standardization. Internal standardization is common
in bioanalytical methods especially with chromatographic procedures. The
assumption for the use of internal standard is that the partition coefficient of
the analyte and the internal standard are very similar [21]. For internal
standardization, a structural or isotopic analogue of the analyte is added to the
sample prior to sample pre-treatment and the ratios of the response of the
analyte to that of the internal standard is plotted against the concentration [22].
Another important point is that the tests performed at the stage of method
development should be done with the same equipment that will actually be used
for subsequent routine analysis. The differences found between individual
instruments representing similar models from the same manufacturer is not
surprising and should be accounted for [23].
The following two parameters must be determined at the method development
stage as they are the benchmark for further work.
i. LOD and LOQ
The US pharmacopoeia define LOD as the lowest concentration of an analyte
in a sample that can be detected but not necessarily quantitated. LOQ is the
lowest amount of a sample that can be determined with acceptable precision
and accuracy under the stated operational condition of the method [24].
In the case of LOD, analyst often use S/N (signal to noise ratio) of 2:1 or 3:1,
while a S/N of 10:1 is often considered to be necessary for the LOQ.
The ICH Q2B guideline on validation methodology lists two options in
addition to the S/N method of determining limits of detection and
quantification: visual non- instrumental methods and limit calculations. The
calculation is based on the standard deviation of the response (�) and the slope
of the calibration curve (S) at levels approaching the limits according to
equations below [24].
LOD = 3.3 x (�/S)
____________________________________________________________________________ Department of Chemical Technology, Dr. Babasaheb Ambedkar Marathwada University Aurangabad
30
LOQ =10 x (�/S)
The standard deviation of the response can be determined based on the standard
deviation of the blank, based on the residual standard deviation of the
regression line, or the standard deviation of the y- intercept of the regression
line. This method can reduce the bias that sometimes occurs when determining
the S/N. The bias can result because of difference in opinion about how to
determine and measure noise.
ii. Calibration curve
A calibration line is a curve showing the relation between the concentration of
the analyte in the sample and the detected response. It is necessary to use a
sufficient number of standards to define adequately the relationship between
response and concentration. The relationship between response and
concentration must be demonstrated to be continuous and reproducible. The
number of standards to be used will be a function of the dynamic range and
nature of the concentration –response relationship. In many cases, five to eight
concentrations (excluding blank values) may define the standard curve. More
standard concentrations may be necessary for non-linear relationships than
would be for a linear relationship [19].
The difference between the observed y- value and fitted y- value is called a
residual. One of the assumptions involved in linear regression analysis is that
the calculated residuals are independent, are normally distributed and have
equal variance, which is termed as homoscedasticity. If the variance is not
equal, the case is termed as heteroscedasticity, in which case a weighted
regression may be performed. The most appropriate weighting factor is the
inverse of the variance of the standard, although 1/x, 1/x2, 1/y and 1/y2 (x=
concentration and y= response) are suitable approximations [25].
It is important to use a standard curve that will cover the entire range of the
concentration of the unknown sample. Estimation of the unknown by
extrapolation of standard curve below the lower standard and above the higher
standard is not recommended. Instead, it is suggested that the standard curve be
re-determined or sample re-assayed after dilution [19].
Method validation
____________________________________________________________________________ Department of Chemical Technology, Dr. Babasaheb Ambedkar Marathwada University Aurangabad
31
The search for reliable range of method and continuous application of this
knowledge is called validation [23]. It can be defined as the process of
documenting that the method under consideration is suitable for its intended
purpose [17]. Method validation involves all the procedures required to
demonstrate that a particular method for quantitative determination of the
concentration of an analyte ( or a series of analytes) in a particular biological
matrix is reliable for the intended application [19]. Validation is also a proof of
the repeatability, specificity and suitability of the method.
Bioanalytical methods must be validated if the results are used to support the
registration of a new drug or a new formulation of an existing one. Validation
is required to demonstrate the performance of the method and reliability of
analytical results [26]. If a bioanalytical method is claimed to be for
quantitative biomedical application, then it is important to ensure that a
minimum package of validation experiments has been conducted and yields
satisfactory results [22].
Fundamental parameters for bioanalytical method are accuracy, precision,
selectivity, sensitivity, reproducibility, recovery and stability. For a
bioanalytical method to be considered valid, specific acceptance criteria should
be set in advance and achieved for accuracy and precision for the validation of
the QC samples.
1 Selectivity
A method is said to be specific when there is no interference from the matrix at
the retention times of analytes. Interferences in biological samples arise from a
number of endogenous (analyte metabolite, degradation products, co-
administered drugs and chemicals normally occurring in biological fluids) and
exogenous sources (impurities in reagents and dirty lab-ware). Zero level
interference of the analyte is desired but it is hardly ever the case. The
interference is acceptable at the 20% of LLOQ.
2. Precision
It is expressed as the percentage of coefficient of variance (%CV) or relative
standard deviation (%RSD) of the replicate measurements.
a. Intra assay precision
____________________________________________________________________________ Department of Chemical Technology, Dr. Babasaheb Ambedkar Marathwada University Aurangabad
32
This is also known as repeatability i.e. the ability to repeat the same procedure
with the same analyst, using the same reagent and equipment in a short interval
of time.
b. Inter assay precision
The ability to repeat the same method under different conditions e.g. change of
analyst, reagent, or equipment or on subsequent occasions.
A minimum of three concentrations in the range of expected concentrations is
recommended. The % CV determined at each concentration level, should not
exceed 15% except for the LOQ, where it should not exceed 20%. [27].
3. Accuracy
It is defined as agreement between the measured value and the true value.
Accuracy is best reported as percentage bias that is calculated from the
expression
% Bias= (measured value-true value) x 100 true value
Accuracy should be measured using a minimum of five determinations per
concentration. A minimum of three concentrations in the expected range is
recommended. The mean value should be within 15% of the actual value
except at LLOQ, where it should not deviate by more than 20% [27].
4 Recovery
Absolute recovery of a bioanalytical method is the measured response of a
processed spiked matrix standard expressed as a percentage of the response of a
pure standard, which has not been subjected to sample pre-treatment and
indicates whether the method provides a response for the entire amount of the
analyte that is present in the sample [16].
Absolute recovery = ( Response of processed sample) x 100 Response of unprocessed standard
5 Stability
An essential aspect of method validation is to demonstrate that analyte(s) is
(are) stable in the biological matrix and in all solvents encountered during the
sample work up process, under the conditions to which study samples will be
subjected [28].
According to the recommendations on the Washington conference report by
Shah et al., (1992), the stability of the analyte in matrix at ambient temperature
____________________________________________________________________________ Department of Chemical Technology, Dr. Babasaheb Ambedkar Marathwada University Aurangabad
33
should be evaluated over a time that encompass the duration of typical sample
preparation, sample handling and analytical run time.
Acceptable stability is 2% change in standard solution or sample solution
response relative to freshly prepared standard. Acceptable stability at the
LLOQ for standard solution and sample solution is 20% change in response
relative to a freshly prepared sample (Green, 1996).
Chromatographic Parametres
Chromatographic parameters used in the present work are defined below
a ) Capacity factor
The capacity factor is an important experimental parameter that is widely used
to describe the migration rates of analytes on columns. The capacity factor k’ is
expressed as
k’ = t1- t0 t0 Where, t1 = Retention time of the first component
t0 = Retention time of the nonretained component
b). Resolution
The resolution (RS) of two components in a chromatogram is determined from
the difference in their retention times and the widths of the peaks.
RS = 2 (tR2- tR1) tw1 + tw2
C) Plate height and number
Ideally, an analyte placed on a column , as a sharp band should spread out as
little as possible during the separations. Any broadening of the peaks can cause
overlap and loss of resolution. The efficiency of the column is
the measure of the broadening of sample peak as it passed through the column.
Plate height H and plate number of theoretical plates N are the two widely used
terms for the quantitative measures of the efficiency of chromatographic
columns. The two terms are related by the equation :
N= L/H
Where L= length of the column
The mathematical expression of the number of theoretical plates N in a
chromatographic system is obtained from the width of the peak in relation to
the retention time
____________________________________________________________________________ Department of Chemical Technology, Dr. Babasaheb Ambedkar Marathwada University Aurangabad
34
N= 16 [tR/tW]2
Where, tW= peak width at base
tR= retention time of the peak
The more difficult separation problems can be solved with greater plate number
of a chromatographic system. In principle number of plates can be increased by
using a longer column.
d) Tailing factor or asymmetry factor
Determination of the shape of the chromatographic peak can be performed
using various methods. Generally the asymmetry factor, which is determined at
10% of the peak height is used however. However in the pharmaceutical
industry often the tailing factor calculated by USP, which is determined at 5%
peak height.
It is determined by following formula
T= W 0.05
2f
Where,
W 0.05 = width of peak at 5% height.
f = distance from the peak maximum to the leading edge of the peak, the
distance being measured at a point 5% of the peak height from the baseline.
____________________________________________________________________________ Department of Chemical Technology, Dr. Babasaheb Ambedkar Marathwada University Aurangabad
35
References:
1. S.S.Cheng, Spectrum, Pharmaceutical Industry Dynamics, World-wide
sales of Health Care Products to 2002.
2. Our Commitment to innovation, NV Organon, 1998.
3. CPMP/ICH/367/96, Note for guidance specifications: test procedures
and acceptance criteria for new drug substances and new drug
products: chemical substances, October 1999.
4. United states Pharmacopeia.
5. Japanese Pharmacopeia.
6. European Pharmacopeia.
7. C.F.Poole and S.A. Scheutte, Contemporary practice of
Chromatogrphy, Elsevier, Amsterdam, 1984.
8. Anal. Chem., 2001,661A-666A.
9. Galen Wood Ewing, Ed., Analytical Instruments Handbook , Marcel
Dekker Inc., 1997.
10. Lindsay, S., High performance Liquid Chromatography, John Wiley
and Sons, 1992.
11. Snyder, L. R., Krikland, J. J., and Glajch, J. C., Practical HPLC
method Development , 2nd Edn, Wiley Interscience Publication, 1997.
12. Skoog D., A., Principles of Instrumental Analysis, Saunders College
Publishing, 1985.
13. Lopez-Grio, S., Garcia-Alvarez-Coque, M. C., Hinze, W. L., Quina, F.
H. and Bethod, A., Anal. Chem., 2000, 72, 4826-4835.
14. Hernandez-Medina, J.M., and Garcia-Alvarez-Coque, M.C., Analyst,
1992, 117, 831-837.
15. Internataional Council on Harmonisation, Guidance For industry In :
Q2B Validation of Analytical procedures : Methodology, 1996, 2.
16. Bressolle, F., Bromet-pitit, M. & Audran, M. Journal of
Chromatography B. 1996,686, 3-10.
17. Hartmann, C., Smeyers-Verbeke, J., Massart, D.L.& McDowall, R.D.
Journal of pharmaceutical and Biomedical Analysis, 1998, 17, 193-
218.
18. Green, M.J. Analytical Chemistry, 1996, 68,305A-309A.
____________________________________________________________________________ Department of Chemical Technology, Dr. Babasaheb Ambedkar Marathwada University Aurangabad
36
19. Shah, P.V., Midha, K.K., Dighe, S., McGilveray, J.I, Skelly, P.J,
Yacobi, A., Layloff, T., Vishwanathan, C.T., Cook, E.C. Mcdowall,
R.D., Pittman, A.K.& Spector S. Journal of Pharmaceutical Sciences,
1992, 81, 309-312.
20. Shah, P.V., Midha, K.K., Findlay, W.A.J., Hill, M.H., Hulse, D.J.,
McGilveray, J.I, Mckay,G., Miller, J.K., Patnaik, N.R., Powell, L.M.,
Tonelli, A., Viswanathan, C.T. & Yacobi, A. Pharmaceutical Research,
2000, 17 (12), 1551-1557.
21. Karnes, H.T., Shiu, G. & Shah,V.P. Pharmaceutical Research, 1991,
8(40) 221-225.
22. Causon, R. Journal of Chromatography B. 1997,689,175-180.
23. Bruce,P., Minkkinen, P.& Riekkola,M.L. Mikrochimica Acta 1998,
128,93-106.
24. Krull J., & Swartz, M. Validation view point 1998, 16(10).
25. Lang, J.R. & Bolton,S. Journal of Pharmaceutical and Biomedical
Analysis, 1991, 9(6),435-442.
26. Wieling,J., Hendriks,G., Tamminga,W.J., Hempenius, J.,
Mensink,C.K., Oosterhuis,B. & Jonkman, J.H.G. Canadian Journal of
Analytical Sciences and Spectroscopy, 1996, 46(2), 40-45.
27. Guide for Industry, Bioanalytical Method Validation, USFDA, May
2001.
28. Dadgar,D., Burnett,P.E., Choc,M.G., Gallicano, K. & Hooper, J.W.
1995, Journal of Pharmaceutical and Biomedical analysis 1995,
13(2),89-97.
![De artment ofManlib.um.ac.id/wp-content/uploads/2017/08/Dwi Wulandari 07... · 2017. 8. 13. · ISBN 978·602·7577·63·3 ~ held in UMY, Indonesia~ on March 10, 20]6 De artment ofMan](https://img.pdfslide.us/doc/110x75/608913198116a8749b7f11a4/de-artment-wulandari-07-2017-8-13-isbn-9786027577633-held-in-umy-indonesia.jpg)
![DE])ARTMENT OF WOMEN AND CHILD …it.delhigovt.nic.in/writereaddata/Odr201684584.pdf(Ci) PLAN-BUDGET Time Bound/Most Urgent DE])ARTMENT OF WOMEN AND CHILD DEVELOPMENT GOVERNMENT OF](https://img.pdfslide.us/doc/110x75/5e8df290629e953c7e1e2807/deartment-of-women-and-child-it-ci-plan-budget-time-boundmost-urgent-deartment.jpg)