Embed Size (px)
Citation preview

07 / 05 / 2009
FIRST QUARTER 2009 RESULTS

2FIRST QUARTER 2009 RESULTS 07 / 05 / 2009
DisclaimerThe following presentation contains a number of forwardThe following presentation contains a number of forward--looking statements relating to looking statements relating to Societe Generale’sSociete Generale’s targets and strategy. These targets and strategy. These forecasts are based on a series of assumptions, both general andforecasts are based on a series of assumptions, both general and specific. As a result, there is a risk that these projections wspecific. As a result, there is a risk that these projections will not be met. ill not be met. Readers are therefore advised not to rely on these figures more Readers are therefore advised not to rely on these figures more than is justified as the Group’s future results are liable to bethan is justified as the Group’s future results are liable to be affected by a affected by a number of factors and may therefore differ from current estimatenumber of factors and may therefore differ from current estimates. Readers should take into account elements of uncertainty and s. Readers should take into account elements of uncertainty and risk when risk when basing their investment decisions on information provided in thibasing their investment decisions on information provided in this presentation. Neither s presentation. Neither Societe GeneraleSociete Generale nor its representatives shall have nor its representatives shall have any liability whatsoever for any loss arising from any use of thany liability whatsoever for any loss arising from any use of this presentation or its contents or otherwise arising in connectiis presentation or its contents or otherwise arising in connection with this on with this presentation or any other information or material discussed. presentation or any other information or material discussed. The Group’s quarterly financial statements at March 31st 2009 weThe Group’s quarterly financial statements at March 31st 2009 were examined by the Board of Directors on May 6th 2009. The statere examined by the Board of Directors on May 6th 2009. The statements ments are audited by the Statutory Auditor.are audited by the Statutory Auditor.The figures provided for the first quarter ofThe figures provided for the first quarter of 2009 2009 have been prepared in accordance with IFRS (International Financhave been prepared in accordance with IFRS (International Financial Reporting Standards) ial Reporting Standards) adopted by the European Union and applicable at these dates. Theadopted by the European Union and applicable at these dates. These figures do not constitute interim financial statements as defse figures do not constitute interim financial statements as defined by ined by IAS 34, "Interim Financial Reporting". IAS 34, "Interim Financial Reporting". Societe Generale'sSociete Generale's Management intends to publish halfManagement intends to publish half--yearly income statements for the six months yearly income statements for the six months ending June 30th 2009.ending June 30th 2009.
Changes to the financial communication:Changes to the financial communication:(i) All the core business results have been prepared on the basi(i) All the core business results have been prepared on the basis of an average capital allocation calculated according to Basels of an average capital allocation calculated according to Basel Il standards. Il standards. The figures for Q1 08 and the financial information presented inThe figures for Q1 08 and the financial information presented in the 2008 historical quarterly series have therefore been restatthe 2008 historical quarterly series have therefore been restated for ed for comparative purposes.comparative purposes.(ii) The Group adapted its organisation in the first quarter of (ii) The Group adapted its organisation in the first quarter of 2009. All the real estate subsidiaries previously affiliated wit2009. All the real estate subsidiaries previously affiliated with Corporate and h Corporate and Investment Banking (Financing and Advisory), except for ODIPROM,Investment Banking (Financing and Advisory), except for ODIPROM, have joined the French Networks. The entities transferred notabhave joined the French Networks. The entities transferred notably ly include GENEFIM, SOGEPROM and GENEFIMMO, as well as their respecinclude GENEFIM, SOGEPROM and GENEFIMMO, as well as their respective subsidiaries. This new affiliation does not change the tive subsidiaries. This new affiliation does not change the internal structure and operation of these entities. The financiainternal structure and operation of these entities. The financial information presented in the historical quarterly series has tl information presented in the historical quarterly series has therefore been herefore been restated and the restatements are disclosed in supplementary datrestated and the restatements are disclosed in supplementary data.a.
Unless otherwise specified, the sources for the business rankingUnless otherwise specified, the sources for the business rankings are internal.s are internal.

3FIRST QUARTER 2009 RESULTS 07 / 05 / 2009
Quarter highlights
Good operating and commercial performance against a backdrop of severe recession
Effect of the environment's decline on the Group's resultsAdditional write-downs linked to the fall in the US real estate market and to the downgrading of monoline insurersRise in cost of risk
Quarterly net loss of EUR -0.3bn
Maintaining of a solid financial structure: Tier 1 ratio of 8.7%Decision to issue the 2nd tranche subscribed by the State: proforma Tier 1 of 9.2%
SOCIETE GENERALE GROUP

4FIRST QUARTER 2009 RESULTS 07 / 05 / 2009
Satisfactory operating performance
NBI of core businesses excluding non-recurring items of EUR 7.0bn (+15.9% vs. Q1 08)
Robustness of franchises in the French Networks and International Retail BankingDynamic growth of loan and deposit outstandings in the French Networks• Loans: +7.3% vs. Q1 08 • Deposits: +8.4% vs. Q1 08 Continued rise in new individual and business customers (+451,000 vs. Q1 08) in International Retail Banking
Targeted realignment of Financial Services' activity with the negative environment
Limited fall in assets under management at end-March 2009 for Asset Management and Private Banking
Securities Services businesses affected by the decline in the equity market indices and the fall in interest rates
Very strong commercial development and good performance of trading activities for Corporate and Investment Banking
SOCIETE GENERALE GROUP

5FIRST QUARTER 2009 RESULTS 07 / 05 / 2009
Group result: net loss of EUR -0.3bn
SOCIETE GENERALE GROUP
* When adjusted for changes in Group structure and at constant exchange rates
In EUR m Q1 08 Q1 09
Net banking income 5,679 4,913 -13.5% -11.9%*
Operating expenses (3,905) (3,777) -3.3% -2.5%*
Gross operating income 1,774 1,136 -36.0% -33.1%*
Net allocation to provisions (598) (1,354) x2.3 x2.3*
Operating income 1,176 (218) NM NM*
Group share of net income 1,096 (278) NM NM*
ROE (after tax) 16.8% NM
Change Q1/Q1

6FIRST QUARTER 2009 RESULTS 07 / 05 / 2009
Effects of exposures at riskImpact in terms of NBI
Impact in terms of Net Cost of Risk for reclassified assets
SOCIETE GENERALE GROUP
ABS (including ABS portfoliosbought from SGAM)
Fall of European and US ABS' . ABX AAA: -25% over Q1 09 . CMBX AAA: -10% over Q1 09
-166
CDOs of unhedgedUS RMBS'
Fall in the US real estate market: rise in loss rates . 2005 subprime: 13% (vs.11%) . 2006 subprime: 30% (vs. 25%) . 2007 subprime: 36% (vs. 27%)
-116
Monolines and CDPCs
Fall in value of underlying assets(CDOs of RMBS' and CLOs)Increase in provisions due to the decline in the quality of certain protection
-866
Exotic credit derivatives
Additional write-downs to incorporate the fall of European and US ABS' -364
Total: NBI -1,512
Total: NCR -58
Q1 09 (EUR m)

7FIRST QUARTER 2009 RESULTS 07 / 05 / 2009
Increase in cost of risk in a deteriorated environmentFrench Networks
68 bp in Q1 09 (vs. 56 bp in Q4 08)Continuing rise for business customers, notablylinked to auto suppliers and constructionLow levels maintained for individual customers
International Retail Banking173 bp in Q1 09 (vs. 122 bp in Q4 08)Rise mainly in Russia (381 bp in Q1 09) Contained levels in other countries
Financial Services197 bp in Q1 09 (vs. 160 bp in Q4 08)Rise in consumer credit risk, particularly in Central and Eastern Europe
Corporate and Investment Banking139 bp in Q1 09 (vs. 116 bp in Q4 08)Increase reflecting the deterioration in the portfolio and the increase in collective provisions (EUR 127m(1))Cost of risk for transferred assets: EUR 58m
Group cost of risk in Q1 09: 120 bp(vs. 97 bp in Q4 08)
Net allocation to provisions Net allocation to provisions (in EUR m) and (in EUR m) and Cost of risk Cost of risk (in annualised Basel I (in annualised Basel I bpbp))
FinancialServices
FrenchNetworks
Corporate andInvestment Banking
InternationalRetail Banking
SOCIETE GENERALE GROUP
Group
Collective provisions on assets transferred to L&R
134 149
78 127
98 116230
509356270
72312
58
234191113
29920788
19387
1,354983687387598
Q1 08 Q2 08 Q3 08 Q4 08 Q1 09
68 bp
173 bp
197 bp
120 bp
28 bp
61 bp
105 bp
158 bp
71 bp
56 bp
122 bp
160 bp
116 bp
97 bp
139 bp
(1) Excluding transferred assets

8FIRST QUARTER 2009 RESULTS 07 / 05 / 2009
6.7% 7.0%
2.1% 2.2%2.2%
2.9%
6.5%
3.0%3.0%
12.2%11.6% 11.7%
9.2%8.8% 8.7%
Dec. 31st 2008excluding floor
effect
March 31st 2009 ProformaMarch 31st 2009 *
Basel II Tier 1 Ratio of 8.7%: a solid Group
Risk-weighted assets stable compared toend-2008
Growth in loan outstandings in FranceStrong fall in market risk-weighted assets linked to the continued application of the risk reduction policy
Tier 1 ratio of 8.7% and Core Tier 1 ratio of 6.5% at end-March 2009
Decision to issue the 2nd tranche of EUR 1.7bn subscribed by the State
Tier 1 ratio of 9.2%• Preference shares*: Core Tier 1 ratio of 7.0%
Good capacity to face a severe credit stress
Tier 2
Tier 1
Solvency ratio (2)
SOCIETE GENERALE GROUP
Change in Basel II Tier 1 RatioChange in Basel II Tier 1 Ratio
* Proforma of 2nd State tranche, with issuance of preference shares - subject to approval by the AGM of May 19th 2009(1) Core Tier 1: Tier 1 - Hybrid capital(2) Solvency ratio: Tier 1 + Tier 2 - prudential deductions
CoreTier 1(1)
Hybridcapital
Tier 1 ratio

9FIRST QUARTER 2009 RESULTS 07 / 05 / 2009
Significant rise in revenues excluding non-recurring items In EUR mIn EUR m
SOCIETE GENERALE GROUP
Corporate and InvestmentBanking
Global Investment andManagement Services
Retail Bankingand Financial Services
Group (excluding Corporate Centre and non-recurring items)
(1) Excluding non-recurring items in the supplementary data, page 8The French Network changes do not include PEL/CEL
Financial ServicesInternational Retail Banking
French Networks
CIB NBI excluding non-recurring items
In absolute terms
+76.3%( 1)
-4.4%
+3.4%
-0.9%( 1)( 1)
-0.1% ( 1)
-22.9%( 1)
Change Q1 / Q1
1,556 655 643 1,136 841
600 873 747 598 652
771 820 801 709 737
1,123 1,215 1,303 1,349 1,161
1,741 1,758 1,774 1,906 1,732
1,525 1,895 1,761 311 2,688
3,635 3,793 3,878 3,964 3,630
6,9924,9096,3236,5616,034
Q1 08 Q2 08 Q3 08 Q4 08 Q1 09
+15.9%( 1)

10FIRST QUARTER 2009 RESULTS 07 / 05 / 2009
478
399
68
616
169
2-5 -1
72482 493493
499
384364356354
1329411891
644639
610605
179203 193180
1,7321,741 1,758 1,774 1,906
Q1 08 Q2 08 Q3 08 Q4 08 Q1 09
98.096.497.592.090.4
153.6153.7151.1147.8
143.1
Q1 08 Q2 08 Q3 08 Q4 08 Q1 09
Good resilience of activity in a difficult environment
FRENCH NETWORKS
* Excluding medium-term notes issued to French Network customers of EUR 7.4bn in Q1 09 vs. EUR 10.7bn in Q1 08
(a) Excluding a EUR 2m PEL/CEL provision reversal in Q1 09 vs. a EUR 5m provision in Q1 08
Individual cust. interest margin: -3.0% vs. Q1 08
Bus. customer interestmargin: +12.7% vs. Q1 08
Service com.: +1.8% vs. Q1 08
Financial com.: -16.7% vs. Q1 08
Others: -25.3% vs. Q1 08
Breakdown of net banking income Breakdown of net banking income (in EUR m)(in EUR m)
PEL/CEL provision or reversal
Loans
Deposits
Average Average outstandingsoutstandings (in EUR (in EUR bnbn))
Capital gain
Activity: rise in deposit inflows and growth in loan outstandings despite the fall in demand
Business customers • On-balance sheet deposits: +31.2%* vs. Q1 08
– Sight deposits: 8.0% vs. Q1 08– Term deposits: x2.4 vs. Q1 08
• Loans: +9.8% vs. Q1 08– o.w. investment loans: +14.3% vs. Q1 08
Individual customers • On-balance sheet deposits: +1.3% vs. Q1 08
o.w. regulated savings accounts: +6.3% vs. Q1 08• +13,000 sight accounts in Q1 09• Success of Livret A:
– 1.3 million accounts at end-March 2009 – EUR 3.5bn of outstandings at end-March 2009
• Loans: +5.2% vs. Q1 08Revenues: limited impact of the fallin financial commissions
NBI: -0.9% (a) vs. Q1 08• Interest margin: +0.7%(a) vs. Q1 08• Commissions: -2.8% vs. Q1 08Operating expenses under control: -0.7% vs. Q1 08C/I ratio(a): 67.5% (vs. 67.3% in Q1 08)

11FIRST QUARTER 2009 RESULTS 07 / 05 / 2009
53.558.6
63.5 62.8 61.4
Q1 08 Q2 08 Q3 08 Q4 08 Q1 09
59.162.9 63.5 61.3 61.0
Q1 08 Q2 08 Q3 08 Q4 08 Q1 09Q1 08 Q2 08 Q3 08 Q4 08 Q1 09
1,1611,123 1,215 1,303 1,349
22%24%24%25%24%
15%18%22%16%16%
21%20%19%23%20%
13%11%12%
12%12%
29%
26%24%25%27%
Q1 08 Q2 08 Q3 08 Q4 08 Q1 09
CzechRepublic
RomaniaRussia
Others Central and Eastern
Europe
Others
Loans Deposits
Satisfactory results despite a deteriorated environment
INTERNATIONAL RETAIL BANKING
* When adjusted for changes in Group structure and at constant exchange rates** When adjusted for changes in Group structure
Loan and deposit Loan and deposit outstandings outstandings (in EUR (in EUR bnbn -- in absolute terms)in absolute terms)
Breakdown of net banking income Breakdown of net banking income (in EUR m)(in EUR m)
CzechRepublic
Romania
Russia
Others Central and Eastern
Europe
Others
12.2 million individual customersat end-March 2009
+ 428,000** vs. end-March 2008
Growth in outstandings at constant exchange rates
Deposits: +9.5%* vs. end-March 2008, +1.8* vs. end-Dec. 2008
Loans: +21.9%* vs. end-March 2008, +0.5* vs. end-Dec. 2008
Effects of measures taken in 2008 Improving loan to deposit ratio: 101% at end-March 2009
Satisfactory operating income despite the effect of currency devaluation
NBI: EUR 1,161m, +10.8%* vs. Q1 08• o.w. +11.9%* vs. Q1 08 for the Central and Eastern
Europe regionCost/income ratio: 57.1% in Q1 09ROE: 15.4%
12FIRST QUARTER 2009 RESULTS 07 / 05 / 2009
INTERNATIONAL RETAIL BANKING
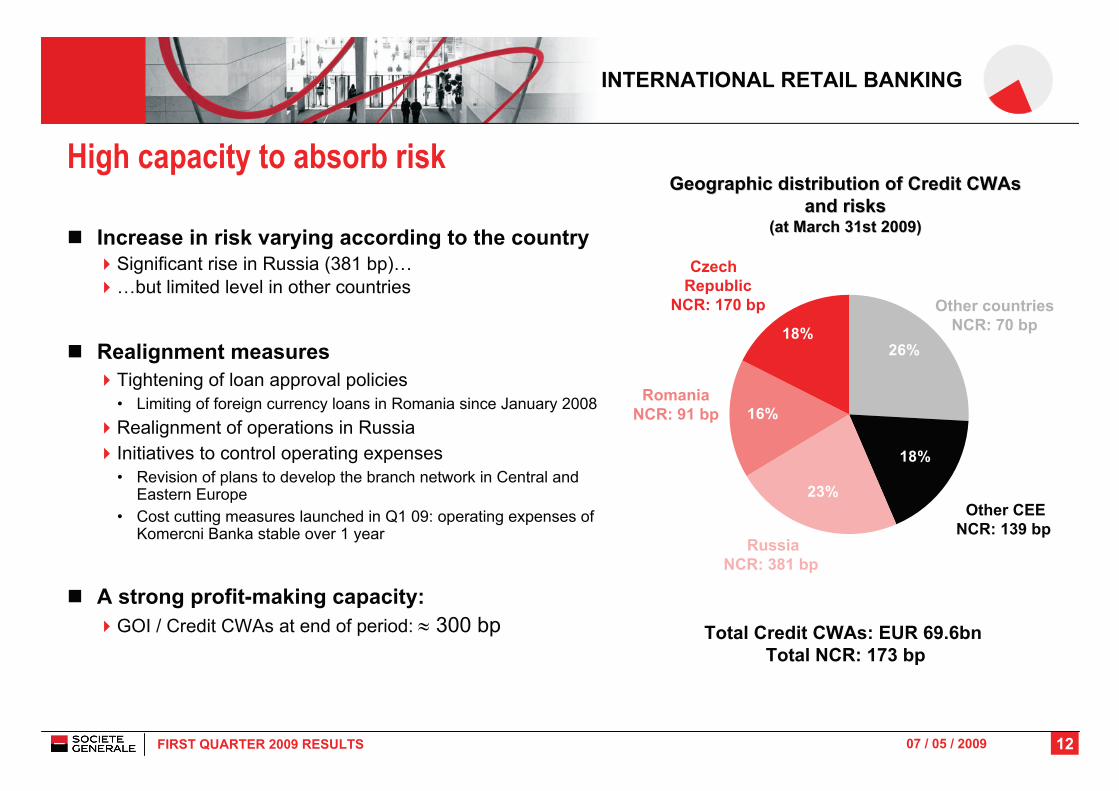
Geographic distribution of Credit Geographic distribution of Credit CWAsCWAsand risks and risks
(at March 31st 2009)(at March 31st 2009)
RomaniaNCR: 91 bp
RussiaNCR: 381 bp
Czech Republic
NCR: 170 bp Other countriesNCR: 70 bp
High capacity to absorb risk
Increase in risk varying according to the countrySignificant rise in Russia (381 bp)… …but limited level in other countries
Realignment measuresTightening of loan approval policies• Limiting of foreign currency loans in Romania since January 2008Realignment of operations in RussiaInitiatives to control operating expenses• Revision of plans to develop the branch network in Central and
Eastern Europe• Cost cutting measures launched in Q1 09: operating expenses of
Komercni Banka stable over 1 year
A strong profit-making capacity:GOI / Credit CWAs at end of period: ≈ 300 bp
Other CEENCR: 139 bp
Total Credit CWAs: EUR 69.6bn Total NCR: 173 bp
26%
18%
23%
16%
18%
13FIRST QUARTER 2009 RESULTS 07 / 05 / 2009
40%
10%4%
30%
3%13%
* When adjusted for changes in Group structure and at constant exchange rates (1) Excluding factoring (2) Excluding French Networks
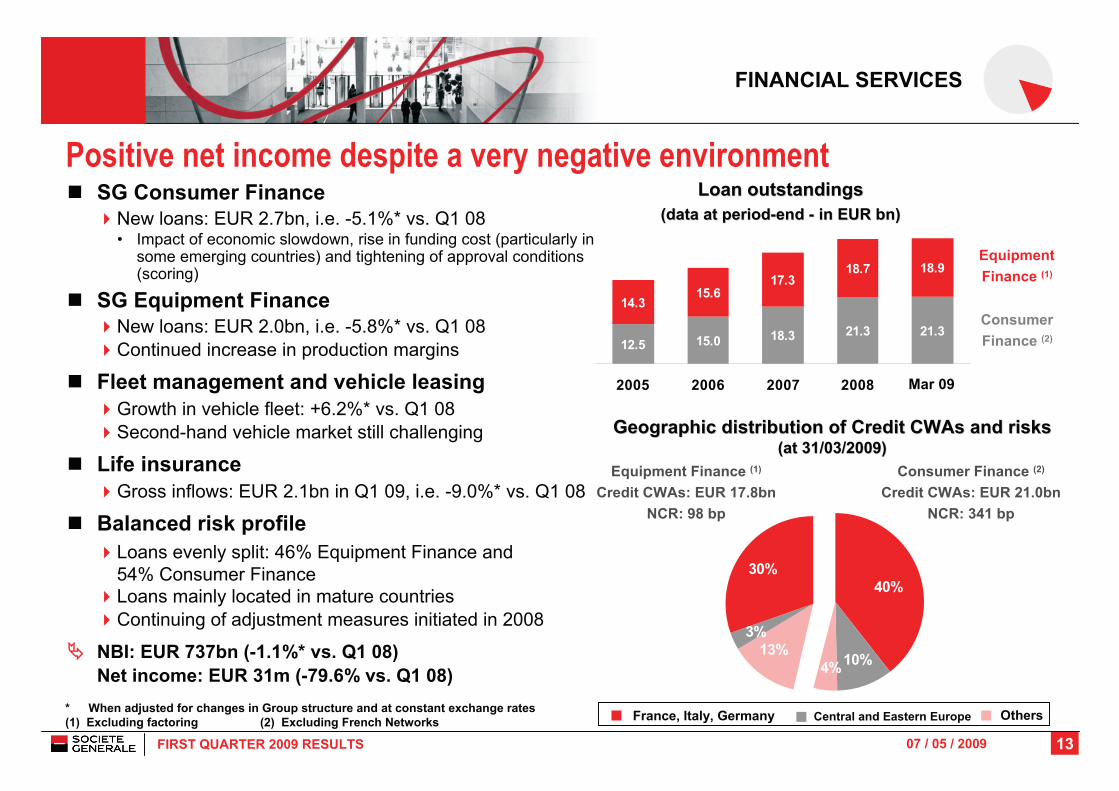
Positive net income despite a very negative environment
FINANCIAL SERVICES
12.5 15.0 18.3 21.3 21.3
14.315.6
17.318.7 18.9
2005 2006 2007 2008
Consumer Finance (2)
Equipment Finance (1)
Loan Loan outstandingsoutstandings(data at period(data at period--end end -- in EUR in EUR bnbn))
Geographic distribution of Credit Geographic distribution of Credit CWAsCWAs and risks and risks (at 31/03/2009)(at 31/03/2009)
SG Consumer Finance New loans: EUR 2.7bn, i.e. -5.1%* vs. Q1 08• Impact of economic slowdown, rise in funding cost (particularly in
some emerging countries) and tightening of approval conditions (scoring)
SG Equipment Finance New loans: EUR 2.0bn, i.e. -5.8%* vs. Q1 08 Continued increase in production margins
Fleet management and vehicle leasingGrowth in vehicle fleet: +6.2%* vs. Q1 08Second-hand vehicle market still challenging
Life insuranceGross inflows: EUR 2.1bn in Q1 09, i.e. -9.0%* vs. Q1 08
Balanced risk profileLoans evenly split: 46% Equipment Finance and54% Consumer FinanceLoans mainly located in mature countriesContinuing of adjustment measures initiated in 2008
NBI: EUR 737bn (-1.1%* vs. Q1 08)Net income: EUR 31m (-79.6% vs. Q1 08)
Mar 09
Equipment Finance (1)
Credit CWAs: EUR 17.8bnNCR: 98 bp
Consumer Finance (2)
Credit CWAs: EUR 21.0bnNCR: 341 bp
France, Italy, Germany Central and Eastern Europe Others

14FIRST QUARTER 2009 RESULTS 07 / 05 / 2009
164.5
24.5
74.2
269.2 264.2-6.6 +3.8
SGAM SGAM AI
TCW
-2.1 -0.6
(1)Others Market
effectForexeffect
Netinflow
Dec 08 Mar 09
73.1
+3.5 -3.1
164.6
20.1
6.46.0
GLOBAL INVESTMENT MANAGEMENT AND SERVICES
TCWSGAM AISGAM (1) Others (SGAM UK+Others)
67.966.9
+0.6 -0.2 +0.6
Dec 08 Mar 09
Netinflow
Marketeffect
Forexeffect
Asset Management: Asset Management: AuMAuM (in EUR (in EUR bnbn) )
Private Banking: Private Banking: AuMAuM (in EUR (in EUR bnbn) )
Limited decrease in assets under managementAsset management
Assets under management at end-March 2009: EUR 264.2bn (vs. EUR 269.2bn at end-2008)Net outflows in Q1 09: EUR -2.2bn(vs. EUR -7.3bn in Q1 08)• EUR +3.2bn for money market funds and EUR +1.0bn for bonds• EUR -3.6bn for alternative funds and EUR -2.0bn for equities and
diversified productsNBI: EUR 137m (negative revenue of EUR -13m in Q1 08)• o.w. effects of crisis: EUR -30m• o.w. seed money effect: EUR -21mSignificant reduction in operating losses:• GOI of EUR -41m (EUR -214m in Q1 08)
Private BankingAssets under management at end-March 2009: EUR 67.9bn (+1.5% at end-2008) Net inflows in Q1 09: EUR +0.6bnMargin rate maintained at a high level: 116 bp in Q1 09NBI: EUR 196m (-9.0%* vs. Q1 08)GOI: EUR 65m (-18.8% vs. Q1 08)Operating income: EUR 48m (-39.2% vs. Q1 08)
(1) Including contribution through the merger with CAAM

15FIRST QUARTER 2009 RESULTS 07 / 05 / 2009
2,762
1,521
2,4482,731
Q1 06 Q1 07 Q1 08 Q1 09
Securities Services: activity and revenues affected by the fall in the markets and interest rates
Securities services to institutionals and fund management
Assets under custody: EUR 2,762bn (+1% vs. Q1 08)Assets under administration: EUR 404bn (-19% vs. Q1 08)
BoursoramaNumber of orders executed: -4.8% vs. Q1 085,960 net account openings in Q1 09, i.e. ~83,500 accounts at end-March 2009
NewedgeTrading volumes: 733 million lots (-17.8% vs. Q1 08)Consolidation of global market share (at 12.1%) (1)
NBI: -19.8%* vs. Q1 08GOI: -78.8% vs. Q1 08
GLOBAL INVESTMENT MANAGEMENT AND SERVICES
Assets under custodyAssets under custody (in EUR (in EUR bnbn))
Deposits of Deposits of NewedgeNewedge clients in the clients in the United States (in USD United States (in USD bnbn) )
(Futures Commission Merchants ) (Futures Commission Merchants )
29.627.832.4
26.7
22.7
Mar-08 Jun-08 Sep-08 Dec-08 Feb-09* When adjusted for changes in Group structure and at constant exchange rates(1) On the main markets of which Newedge is a member

16FIRST QUARTER 2009 RESULTS 07 / 05 / 2009
2,688
841
-1,507
+132-472
NBI excl.Non-recurr.
Items
CDS Mark-to- Market
Reval.of fin.
liabilities& own shares
Impairmentsand
write-downs
Book NBI
1,525 1,895 1,761
311
2,68831
-1,240 -1,118
825
-1,847
1,556 655 643 1,136 841
Q1 08 Q2 08 Q3 08 Q4 08 Q1 09
Good operating performance mitigated by additional write-downs
NBI excluding non-recurring items(1):EUR 2,688m (+76.3% vs. Q1 08)
Book NBI: EUR 841m (-46.0% vs. Q1 08)Non-recurring items(1): EUR -1,847m
No IAS 39 reclassifications in Q1 09
Operating expenses: -8.2%* vs. Q1 08Front office headcount: -6.8% vs. Q1 08
Realignment of the structure of variable compensation
CORPORATE AND INVESTMENT BANKING
Impact of nonImpact of non--recurring items on total NBI recurring items on total NBI (in EUR m) (in EUR m)
NBI excluding nonNBI excluding non--recurring items vs. book NBI recurring items vs. book NBI (in EUR m)(in EUR m)
NBI excluding non-recurring items
Non-recurring items
Non-recurring items: EUR -1,847m
(1) Non-recurring items disclosed in the supplementary data, page 8* When adjusted for changes in Group structure and at constant exchange rates
Book NBI

17FIRST QUARTER 2009 RESULTS 07 / 05 / 2009
382 502 514 267166 281 156
-497
354
294 377 329 547 509
440 442 541296 348
648
1,028
-10
326-367
397
49%73%70%66%2,6881,525 1,895 1,761 311
498537301376254
1,569281790736723
621-507670783548
Q1 08 Q2 08 Q3 08 Q4 08 Q1 09
NM
Highly dynamic activities and reduction of market risks Fixed income, currencies and commodities: an excellent quarter (x2.2 vs. Q1 08)
Very strong performance of flow and structured fixed income and currency productsTrading: high contribution from all activities with an exceptional performance from interest rate and treasury products
Financing and Advisory: a very good start to theyear (+96.1% vs. Q1 08)
Continued strong performance of natural resources (+44%) and infrastructure (+54%) financing and cross-selling (x3)Euro capital market: rise in market share against a backdropof increasing volumes
Equities: satisfactory performance (+13.3% vs.Q1 08) despite the fall in customer revenues
Commercial production down for flow (-31%) and structured(-18%) products against a backdrop of falling volumesVery strong trading performance
Reduction of market risksLowering of limits and reinforced risk monitoringDecrease in VaRPreference for liquid assets
CORPORATE AND INVESTMENT BANKING
(1) Excluding non-recurring items in the supplementary data, page 8
Equities
Fixed Income, Currencies and Commodities
Financing and Advisory
Change Q1 / Q1
In absoluteterms
Client NBI Trading NBI
SG CIB totalClient NBI
x 2.2
+96.1%
+13.3%

18FIRST QUARTER 2009 RESULTS 07 / 05 / 2009
182
324
148 131
401
7.3%
5.0%6.5%
5.9%6.7%
Q1 08 Q2 08 Q3 08 Q4 08 Q1 09
Market value (in EUR bn) SG Market share
3.0%1.3%
12.4%
7.6%
3.0%3.4%
Q1 08 Q1 09
Continued commercial successes Leading equity derivatives house
Ranked 1st for warrants with a 15.7% market share Ranked 2nd in Europe for ETFs with a 23% market shareLyxor: positive inflows in 2008 and in Q1 09
Increasing recognition for Financing and Advisory
Ranked 3rd Euro Bonds bookrunnerAcquisition financing: ranked 5th syndicated loan EMEAbookrunner(1)
Export Financing: best global arranger(2)
Projects: best loan arranger(3)
Gains in market share for fixed income, currencies and commodities
Ranked 3rd global provider of commodities derivatives(4)
Debt trading: ranked 1st in the "AAA-rated Government and Supranational category"(5)
CORPORATE ANDINVESTMENT BANKING
Number 3Number 3 for bond issuesfor bond issues(in Euro) (in Euro)
GainsGains(1)(1) in market share since Q1 08in market share since Q1 08Source: IFR - Data from January 1st to March 31st 2009
Governmentbonds*
Credit**
Forex***
(1) Market share calculated based on electronic platform volumes*Bondvision TradeWeb, ** MarketAxess, Bloomberg, ***FX All
(1) IFR - (2) Trade Finance - (3) Euroweek February 2009 -(4) Energy Risk Rankings/Risk Commodity Rankings Feb. 2009, 2008 - (5) Euromoney
19FIRST QUARTER 2009 RESULTS 07 / 05 / 2009
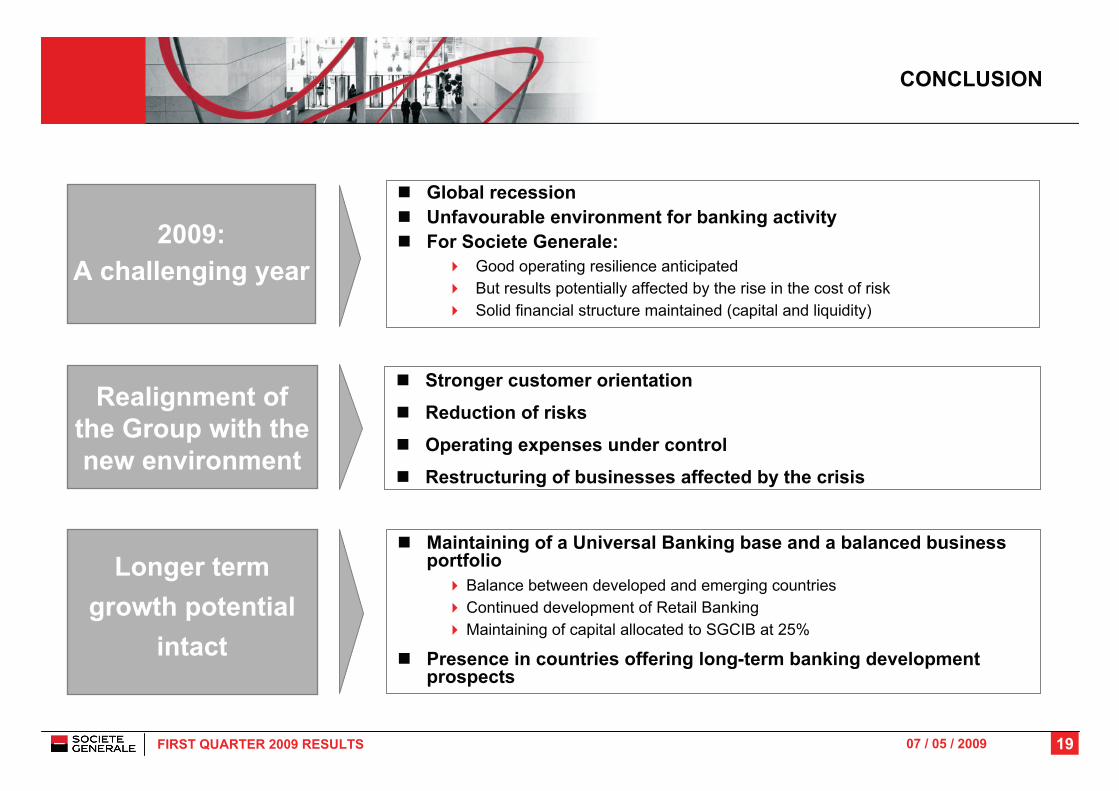
CONCLUSION
2009: A challenging year
Realignment of the Group with the new environment
Global recession Unfavourable environment for banking activityFor Societe Generale:
Good operating resilience anticipatedBut results potentially affected by the rise in the cost of riskSolid financial structure maintained (capital and liquidity)
Stronger customer orientation
Reduction of risks
Operating expenses under control
Restructuring of businesses affected by the crisis
Maintaining of a Universal Banking base and a balanced business portfolio
Balance between developed and emerging countriesContinued development of Retail BankingMaintaining of capital allocated to SGCIB at 25%
Presence in countries offering long-term banking development prospects
Longer term growth potential
intact

07 / 05 / 2009
Investor RelationsPatrick SOMMELET, Louise DE L’ESTANG, Stéphane MARTY, Nathalie SAND
Tel.: +33 (0) 1 42 14 47 72E-mail: [email protected] - Internet: www.investor.socgen.com