Embed Size (px)
Citation preview

Technical Report Documentation Page
1. Report No. FHWA/TX-12/0-6306-1
2. Government Accession No.
3. Recipient’s Catalog No.
4. Title and Subtitle Shear Strengthening of Reinforced and Prestressed Concrete Beams Using Carbon Fiber Reinforced Polymer (CFRP) Sheets and Anchors
5. Report Date October 2011, Rev. February 2012
6. Performing Organization Code
7. Author(s) Yungon Kim, Kevin Quinn, Neil Satrom, Jose Garcia, Wei Sun, Wassim M. Ghannoum, James O. Jirsa
8. Performing Organization Report No. 0-6306-1
9. Performing Organization Name and Address Center for Transportation Research The University of Texas at Austin 1616 Guadalupe Street, Suite 4.202 Austin, TX 78701
10. Work Unit No. (TRAIS) 11. Contract or Grant No.
0-6306
12. Sponsoring Agency Name and Address Texas Department of Transportation Research and Technology Implementation Office P.O. Box 5080 Austin, TX 78763-5080
13. Type of Report and Period Covered Technical Report, 09/2008-08/2011
14. Sponsoring Agency Code
15. Supplementary Notes Project performed in cooperation with the Texas Department of Transportation and the Federal Highway Administration.
16. Abstract The ability to quickly apply carbon fiber reinforced polymer (CFRP) materials with a minimum of disruption to the use of a structure and with virtually no change in the geometry or weight of the element makes CFRP a viable and attractive material for strengthening existing elements. However, without adequate anchorage of CFRP sheets to the concrete surface, premature failures by debonding of the CFRP from the concrete significantly limit the capacity of CFRP strengthening systems. The objective of the study was to demonstrate the feasibility of using anchored CFRP for shear strengthening of large bridge girders or supporting elements. An extensive experimental program was undertaken on several full-scale T-beams and I-girders to achieve project objectives. CFRP anchors used in the study performed well and were able to develop the full capacity of CFRP sheets thereby precluding debonding failures. Studied anchored CFRP systems were thus able to generate significant shear strength gains of up to 50% of the unstrengthened beam capacity. Experimental results, installation procedures for CFRP sheets and anchors, specifications for fabrication and installation of CFRP anchors, and anchored CFRP shear design guidelines are presented.
17. Key Words Carbon Fiber Reinforced Polymers (CFRP), reinforced concrete, shear, anchors, strengthening
18. Distribution Statement No restrictions. This document is available to the public through the National Technical Information Service, Springfield, Virginia 22161; www.ntis.gov.
19. Security Classif. (of report) Unclassified
20. Security Classif. (of this page) Unclassified
21. No. of pages 326
22. Price
Form DOT F 1700.7 (8-72) Reproduction of completed page authorized


Shear Strengthening of Reinforced and Prestressed Concrete Beams Using Carbon Fiber Reinforced Polymer (CFRP) Sheets and Anchors Yungon Kim Kevin Quinn Neil Satrom Jose Garcia Wei Sun Wassim M. Ghannoum James O. Jirsa CTR Technical Report: 0-6306-1 Report Date: October 2011; Rev. February 2012 Project: 0-6306 Project Title: Shear Strengthening of Large Reinforced and Prestressed Concrete Elements
Using Carbon Fiber Reinforced Polymer (CFRP) Sheets and CFRP Anchors Sponsoring Agency: Texas Department of Transportation Performing Agency: Center for Transportation Research at The University of Texas at Austin Project performed in cooperation with the Texas Department of Transportation and the Federal Highway Administration.

iv
Center for Transportation Research The University of Texas at Austin 1616 Guadalupe, Suite 4.202 Austin, TX 78701 www.utexas.edu/research/ctr Copyright (c) 2012 Center for Transportation Research The University of Texas at Austin All rights reserved Printed in the United States of America

v
Disclaimers Author's Disclaimer: The contents of this report reflect the views of the authors, who
are responsible for the facts and the accuracy of the data presented herein. The contents do not necessarily reflect the official view or policies of the Federal Highway Administration or the Texas Department of Transportation (TxDOT). This report does not constitute a standard, specification, or regulation.
Patent Disclaimer: There was no invention or discovery conceived or first actually reduced to practice in the course of or under this contract, including any art, method, process, machine manufacture, design or composition of matter, or any new useful improvement thereof, or any variety of plant, which is or may be patentable under the patent laws of the United States of America or any foreign country.
Engineering Disclaimer NOT INTENDED FOR CONSTRUCTION, BIDDING, OR PERMIT PURPOSES.
James O. Jirsa, Texas P.E. #31360
Research Supervisor

vi
Acknowledgments This project was funded by the Texas Department of Transportation (TxDOT) under
Project No. 0-6306. The support of the project director, Dingyi Yang, and project panel members Brian Merrill, Carl Johnson, Duncan Stewart, Keith Ramsey, Leon Flournoy, Nicholas Horiszny, and Sylvia Medina is greatly appreciated.
Products Research Product P1, Installation Procedures for CFRP Sheets and Anchors,
Specifications for Fabrication and Installation of CFRP Anchors, and CFRP Shear Design Recommendations, is included as Appendix A of this report.

vii
Table of Contents Chapter 1. Introduction ............................................................................................................... 1
1.1 Objective ................................................................................................................................1 1.2 Research Significance ............................................................................................................1 1.3 Research Scope ......................................................................................................................2 1.4 Report Organization ...............................................................................................................2
Chapter 2. Background ................................................................................................................ 5 2.1 Carbon Fiber Reinforced Polymers (CFRP) ..........................................................................5
2.1.1 Properties of FRP materials: GFRP, AFRP, CFRP ....................................................... 6 2.1.2 CFRP materials .............................................................................................................. 7 2.1.3 Mechanical properties of CFRP ..................................................................................... 8
2.2 Externally Applied CFRP Systems ........................................................................................9 2.2.1 Typical installations of CFRP materials in shear applications .................................... 10 2.2.2 Failure modes of externally applied CFRP .................................................................. 12
2.3 Parameters Affecting CFRP Contribution to Shear Strength ..............................................15 2.3.1 The shear span-to-depth ratio ....................................................................................... 16 2.3.2 Different CFRP layouts and configurations ................................................................. 16 2.3.3 Internal shear reinforcement ........................................................................................ 18 2.3.4 Multiple layers of CFRP material ................................................................................ 19 2.3.5 Strain distribution across the critical crack .................................................................. 20 2.3.6 Other parameters effecting CFRP’s contribution to shear strength ............................. 20
2.4 The Need for CFRP anchorage ............................................................................................20 2.5 Methods of CFRP anchorage ...............................................................................................21
2.5.1 Threaded anchor rods ................................................................................................... 22 2.5.2 L-shaped CFRP plates .................................................................................................. 22 2.5.3 CFRP straps ................................................................................................................. 23 2.5.4 CFRP U-Anchors ......................................................................................................... 25 2.5.5 Continuous and discontinuous CFRP plates ................................................................ 26 2.5.6 Modified anchor bolt system........................................................................................ 29
2.6 CFRP Anchors .....................................................................................................................30 2.6.1 Overview ...................................................................................................................... 30 2.6.2 CFRP anchor details .................................................................................................... 32
2.7 Shear Strengthening Using CFRP........................................................................................36 2.7.1 Previous studies of shear strengthening ....................................................................... 36 2.7.2 ACI 440.2R .................................................................................................................. 37 2.7.3 NCHRP Report 655 (2010) .......................................................................................... 40 2.7.4 NCHRP Report 678 (2011) .......................................................................................... 42 2.7.5 Other guidelines discussed in NCHRP 678 ................................................................. 45
2.8 Fatigue Behavior of CFRP Strengthened Specimens ..........................................................45 2.8.1 Interaction between internal steel and CFRP ............................................................... 45 2.8.2 Degradation of bond .................................................................................................... 46
2.9 Failure Modes of Fatigue Specimens Strengthened with CFRP ..........................................48 2.9.1 CFRP de-bonding ......................................................................................................... 48 2.9.2 Steel reinforcement rupture .......................................................................................... 48
2.10 Behavior of CFRP under Sustained Loading .....................................................................49

viii
2.10.1 Changes in strain over time ........................................................................................ 49 2.10.2 Epoxy creep between the concrete-FRP interface ..................................................... 51 2.10.3 Deflection characteristics of strengthened specimens ............................................... 52
Chapter 3. Experimental Program ............................................................................................ 55 3.1 CFRP Sheet and Anchor Installation ...................................................................................55
3.1.1 Surface preparation ...................................................................................................... 55 3.1.2 CFRP anchor hole preparation ..................................................................................... 56 3.1.3 Wet lay-up procedure ................................................................................................... 58 3.1.4 Dry lay-up procedure ................................................................................................... 64 3.1.5 CFRP anchor installation ............................................................................................. 67
3.2 CFRP Anchor Details ..........................................................................................................71 3.2.1 Initial CFRP anchorage detail ...................................................................................... 72 3.2.2 Improved CFRP anchorage detail ................................................................................ 73
3.3 T-Beam Monotonic Tests ....................................................................................................75 3.3.1 Selection of test parameters ......................................................................................... 76 3.3.2 Test configurations and design .................................................................................... 78 3.3.3 Material properties ....................................................................................................... 86 3.3.4 Estimates of beam capacities ....................................................................................... 88 3.3.5 Test setup ..................................................................................................................... 89 3.3.6 Specimen construction ................................................................................................. 95 3.3.7 Concrete ....................................................................................................................... 99
3.4 T-Beam Fatigue and Sustained Loading Tests ..................................................................101 3.4.1 Fatigue test series ....................................................................................................... 101 3.4.2 Sustained load test series ........................................................................................... 103 3.4.3 Material properties ..................................................................................................... 105 3.4.4 Instrumentation .......................................................................................................... 105 3.4.5 Specimen construction ............................................................................................... 112
3.5 I-Girder Monotonic Tests ..................................................................................................112 3.5.1 Specimen information ................................................................................................ 112 3.5.2 CFRP properties and layouts ..................................................................................... 114 3.5.3 Test configuration ...................................................................................................... 119 3.5.4 Instrumentation .......................................................................................................... 123
Chapter 4. Test Results............................................................................................................. 127 4.1 Monotonic Test Series .......................................................................................................127
4.1.1 Overview of test results.............................................................................................. 127 4.1.2 Methodology for extracting shear contributions ........................................................ 129 4.1.3 Test results ................................................................................................................. 133 4.1.4 Analysis of results by parameters .............................................................................. 178 4.1.5 Summary of test performance at major events........................................................... 194
4.2 Fatigue Test Series .............................................................................................................196 4.2.1 24-3-Fatigue-1 & 2 (uncracked specimen) ................................................................ 197 4.2.2 24-3-Fatigue-3 & 4 (cracked specimen) .................................................................... 200 4.2.3 General observations .................................................................................................. 204
4.3 Fatigue Failure Load Test Series .......................................................................................206 4.3.1 24-3-Fatigue-Fail-1 & 2 (uncracked specimen) ......................................................... 207 4.3.2 24-3-Fatigue-Fail-3&4 (cracked specimen) ............................................................... 211

ix
4.3.3 Discussion of results of loading to failure after completion of fatigue loading ......... 215 4.4 Sustained Load Test Series ................................................................................................217
4.4.1 24-3-Sust-1 (uncracked specimen, bonded CFRP) .................................................... 217 4.4.2 24-3-Sust-2 (uncracked specimen, unbonded CFRP) ................................................ 219 4.4.3 24-3-Sust-3 (cracked specimen, bonded CFRP) ........................................................ 220 4.4.4 24-3-Sust-4 (cracked specimen, unbonded CFRP) .................................................... 222 4.4.5 Displacements ............................................................................................................ 223 4.4.6 Discussion of results .................................................................................................. 224
4.5 I-Girder Monotonic Tests ..................................................................................................226 4.5.1 Cracking and ultimate loads ....................................................................................... 226 4.5.2 Shear deformation response ....................................................................................... 229 4.5.3 Load-displacement response ...................................................................................... 229 4.5.4 CFRP strain comparisons ........................................................................................... 230 4.5.5 Conclusions from I-beam tests ................................................................................... 236
Chapter 5. Design Recommendations and Specifications ..................................................... 237 5.1 Specifications for Fabrication and Installation of CFRP Anchors ....................................237 5.2 CFRP Shear Reinforcement Design Considerations .........................................................239
5.2.1 CFRP elastic modulus ................................................................................................ 239 5.2.2 CFRP strip layout/spacing ......................................................................................... 239 5.2.3 Orientation of CFRP strips ......................................................................................... 240
5.3 Design of Anchored CFRP Shear Strengthening Systems ................................................240 5.3.1 OPTION 1: Equivalent to ACI 440.2R-08 Provisions for Completely Wrapped Systems ............................................................................................................................... 240 5.3.2 OPTION 2: Modified ACI 440.2R-08 Provisions Including Interaction Terms ....... 244
5.4 Design Example .................................................................................................................253
Chapter 6. The Feasibility of Using FEM Programs to Simulate the Shear Capacity of CFRP-Strengthened Elements ............................................................................................. 257
6.1 Introduction ........................................................................................................................257 6.2 Methods .............................................................................................................................257
6.2.1 General analytical models .......................................................................................... 257 6.3 Parameters Affecting FRP Behavior in Shear ...................................................................260
6.3.1 Non-uniform strain distribution in CFRP .................................................................. 260 6.3.2 Influence of anchorage ............................................................................................... 262 6.3.3 Influence of internal transverse steel reinforcement .................................................. 262
6.4 Feasibility of the Application of FEM Program ................................................................262 6.5 Conclusions ........................................................................................................................263
Chapter 7. Conclusions ............................................................................................................. 265 7.1 Overview of Project ...........................................................................................................265 7.2 Conclusions: Experimental Program .................................................................................265 7.3 General Conclusions: System Performance and Applicability ..........................................267 7.4 Design Guidelines ..............................................................................................................268 7.5 Future Work .......................................................................................................................268
References .................................................................................................................................. 271

x
Appendix A: Installation Procedures for CFRP Sheets and Anchors, Specifications for Fabrication and Installation of CFRP Anchors, and CFRP Shear Design Recommendations ..................................................................................................................... 279

xi
List of Figures Figure 2-1 Scanning electron microscope image of CFRP ..............................................................5 Figure 2-2 Schematic diagram of a CFRP sheet ..............................................................................6 Figure 2-3 Layered CFRP sheet to obtain strength in two directions ..............................................6 Figure 2-4 Comparison of material properties for steel and CFRP .................................................8 Figure 2-5 CFRP used in flexural strengthening (Yang, 2007) .......................................................9 Figure 2-6 CFRP used in shear strengthening (Yang, 2007) ...........................................................9 Figure 2-7 CFRP used in an axial confinement application (Yang, 2007) ....................................10 Figure 2-8 Shear strengthening with a CFRP wrap .......................................................................10 Figure 2-9 Shear strengthening with CFRP side bonding .............................................................11 Figure 2-10 Side bonded CFRP strips installed perpendicular to an assumed crack angle
of 45 degrees ......................................................................................................................11 Figure 2-11 Shear strengthening with CFRP “U”-wraps ...............................................................12 Figure 2-12 CFRP on the concrete surface a) before cracking and b) after cracking ....................13 Figure 2-13 An experimentally debonded CFRP strip ..................................................................14 Figure 2-14 Illustration depicting differences in strain across a CFRP strip .................................15 Figure 2-15 Diagram defining dfv (ACI 440.2R-08, 2008) ............................................................17 Figure 2-16 ACI 440 factor for increase in strength with different FRP application angle ..........17 Figure 2-17 Three possible configurations of the threaded anchor rod system (Deifalla &
Ghobarah, 2006) ................................................................................................................22 Figure 2-18 L-shaped CFRP plate (Basler, White, & Desroches, 2005) .......................................22 Figure 2-19 Experimental test specimen of L-shaped CFRP plates (Basler, White, &
Desroches, 2005)................................................................................................................23 Figure 2-20 Side view of the CFRP strap system (Hoult & Lees, 2009).......................................24 Figure 2-21 Cross section of the CFRP strap system using metallic inserts with a flat
bearing surface (Hoult & Lees, 2009) ................................................................................24 Figure 2-22 Cross section of the CFRP strap system using preformed strap profile in
grout and concrete (Hoult & Lees, 2009) ..........................................................................25 Figure 2-23 The CFRP U-Anchor system (Khalifa, Alkhrdaji, Nanni, & Lansburg, 1999) .........26 Figure 2-24 Glass FRP rod used to anchor a CFRP sheet a concrete beam (Khalifa,
Alkhrdaji, Nanni, & Lansburg, 1999) ................................................................................26 Figure 2-25 Continuous CFRP plates used to anchor CFRP sheets (Ortega, Belarbi, &
Bae, 2009) ..........................................................................................................................27 Figure 2-26 Schematic elevation view of the continuous CFRP plate anchorage system
(Ortega, Belarbi, & Bae, 2009) ..........................................................................................27 Figure 2-27 Buckling of the continuous CFRP plate observed at failure (Ortega, Belarbi,
& Bae, 2009) ......................................................................................................................28 Figure 2-28 Discontinuous CFRP plates used to anchor CFRP sheets (Ortega, Belarbi, &
Bae, 2009) ..........................................................................................................................28

xii
Figure 2-29 Schematic elevation view of the discontinuous CFRP plate anchorage system (Ortega, Belarbi, & Bae, 2009) ..........................................................................................29
Figure 2-30 A CFRP strip that has slipped out of the discontinuous anchorage (Ortega, Belarbi, & Bae, 2009) ........................................................................................................29
Figure 2-31 3-layer connection of the modified anchor bolt system (Ortega, Belarbi, & Bae, 2009) ..........................................................................................................................30
Figure 2-32 CFRP Anchor with a 360 degree fan (Orton, 2007) ..................................................30 Figure 2-33 CFRP Anchor with a fan in one direction (Pham, 2009) ...........................................31 Figure 2-34 The CFRP anchor detail (used in this project) ...........................................................32 Figure 2-35 Isometric view of U-wrap with CFRP anchorage system ..........................................33 Figure 2-36 CFRP anchor holes before and after making hole chamfer .......................................34 Figure 2-37 Reduction in capacity due to diameter and bend radius (Eq. [2-4]) ...........................35 Figure 2-38 Anchor detail according to the different fan angles ...................................................35 Figure 2-39 Wrapping schemes in shear applications ...................................................................37 Figure 2-40 Description of the variables used in shear strengthening calculations for
using FRP laminates ..........................................................................................................38 Figure 2-41 Shear strength using procedures of ACI 440.2R ........................................................39 Figure 2-42 Shear calculation equations and procedures (NCHRP report 655) ............................42 Figure 2-43 Frequency of occurrence of failure mode related to strengthening scheme
(NCHRP report 678 2011) .................................................................................................43 Figure 2-44 Proposed shear equations for evaluating FRP contribution in NCHRP 678 ..............44 Figure 2-45 Double-lap shear test set-up (Ferrier, Bigaud, Clement, & Hamelin, 2011) .............47
Figure 2-46 ∆τ/∆τu as a function of the number of cycles to failure (Ferrier, Bigaud, Clement, & Hamelin, 2011) ...............................................................................................47
Figure 2-47 CFRP Strap Shear Strengthening System (Hoult & Lees, 2005) ...............................50 Figure 2-48 Long-term CFRP strap strain vs. time under applied load (Hoult & Lees,
2005) ..................................................................................................................................51 Figure 2-49 Long-term displacement of test specimens obtained from test and FE analysis
(Choi, Meshgin, & Taha, 2007) .........................................................................................52 Figure 2-50 Long-term midspan deflection vs. time (Hoult & Lees, 2005) ..................................53 Figure 3-1 Bottom corner of I-beam is rounded to prevent a local failure of the CFRP ...............56 Figure 3-2: (a) Hole drilled into the concrete specimen; (b) removing debris from the
anchorage hole ...................................................................................................................57 Figure 3-3 Drilled and cleared anchorage hole ..............................................................................57 Figure 3-4 Completed preparation of CFRP anchorage hole.........................................................58 Figure 3-5 Two components of the high strength structural epoxy: the resin (left) and
hardener (right) ..................................................................................................................58 Figure 3-6 Mixing the two components of the epoxy together ......................................................59 Figure 3-7 Completed high strength structural epoxy ...................................................................59 Figure 3-8 Applying epoxy to the surface of the concrete specimen (wetting) .............................60

xiii
Figure 3-9 Applying epoxy to the surface of the drilled anchor hole (wetting) ............................60 Figure 3-10 Impregnating the carbon fiber sheets with epoxy ......................................................61 Figure 3-11 Folding the impregnated sheets in half for ease of handling .....................................61 Figure 3-12 Placing the CFRP sheet onto the surface of the beam and aligning the free
end of the installed CFRP strip ..........................................................................................62 Figure 3-13 Removing excess epoxy from the installed CFRP strip .............................................62 Figure 3-14 Creating an opening for the CFRP anchor .................................................................63 Figure 3-15 Completed installation of a CFRP strip .....................................................................63 Figure 3-16 Application of the concrete surface primer ................................................................64 Figure 3-17 Wetting the surface of the CFRP anchor holes ..........................................................65 Figure 3-18 Serrated roller used to impregnate the CFRP strips ...................................................65 Figure 3-19 Impregnating the CFRP strip while on the surface of the beam ................................66 Figure 3-20 Sealing the CFRP laminates with epoxy ....................................................................66 Figure 3-21 Completed installation using the dry lay-up procedure .............................................67 Figure 3-22 Materials required to construct a CFRP anchor – a strip of CFRP, a rebar tie
and a pair of needle nose pliers ..........................................................................................68 Figure 3-23 CFRP strip folded in half and clasped with a rebar tie ..............................................68 Figure 3-24 A close up view of the rebar tie clasp ........................................................................69 Figure 3-25 CFRP anchors prepared for installation .....................................................................69 Figure 3-26 Impregnation of the CFRP anchor with high strength structural epoxy ....................70 Figure 3-27 Insertion of the CFRP anchor .....................................................................................70 Figure 3-28 Using a rebar tie to properly insert the CFRP anchor into a predrilled hole. .............70 Figure 3-29 Construction of CFRP anchorage fan ........................................................................71 Figure 3-30 Completed installation of CFRP anchors ...................................................................71 Figure 3-31 Anchorage detail developed by Kim (2008) ..............................................................72 Figure 3-32 Rupture of the CFRP anchor near the anchor hole opening .......................................73 Figure 3-33 Free body diagram of force transferred through anchorage fan .................................73 Figure 3-34 Isometric view of U-wrap with CFRP anchorage system ..........................................74 Figure 3-35 Improved anchorage detail developed to relieve high stresses at opening of
anchorage hole ...................................................................................................................75 Figure 3-36 Completed CFRP anchor utilizing 5-in. by 5-in. CFRP plies ....................................75 Figure 3-37 Experimental program test parameters .......................................................................76 Figure 3-38 Anchor details in 24 in. and 48 in. beams ..................................................................78 Figure 3-39 Cross-section of 24 in. beams ....................................................................................79 Figure 3-40 Reinforcing steel and CFRP layout for 24 in. beams with a/d=3 ..............................80 Figure 3-41 Comparisons of CFRP anchor detail between typical type and 24-3-10 ...................81 Figure 3-43 Reinforcing steel and CFRP layout for 24 in. beams with a/d=1.5 ...........................82 Figure 3-44 Reinforcement layout of 48 in.-deep beams ..............................................................83 Figure 3-45 Typical reinforcement layouts for tests 1~4 in 48 in. beams .....................................84

xiv
Figure 3-46 Conceptual design comparing 48-3-3 and 48-3-4 ......................................................85 Figure 3-47 Typical reinforcement layouts of test 5 to 8 in 48 in. beams .....................................86 Figure 3-48 Photo of loading setup for 24 in. depth beams ...........................................................90 Figure 3-49 Loading setup for 24 in. beams ..................................................................................90 Figure 3-50 Photo of loading setup for 48 in. depth beams ...........................................................91 Figure 3-51 Loading setup for 48 in. beams ..................................................................................91 Figure 3-52 Grid system of strain gauges in the steel stirrups (24 in. beams) ...............................92 Figure 3-53 Grid system of strain gauges in the stirrups (48-3-1 ~4: #3@18”) ............................92 Figure 3-54 Grid system of strain gauges in the stirrups (48-3-5 ~8: #3@10”) ............................93 Figure 3-55 Grid system of strain gauge in the CFRP (24 in. beams) ...........................................93 Figure 3-56 Grid system of strain gauge in the CFRP (48 in. beams) ...........................................94 Figure 3-57 LVDTs configuration for shear strain in 24 in. beam ................................................95 Figure 3-58 Schematic cross section of the specimens’ formwork ...............................................95 Figure 3-59 Cross section of wood formwork as constructed .......................................................96 Figure 3-60 Formwork constructed for two separate specimens ...................................................96 Figure 3-61 Lateral kicker braces and internal form divider .........................................................97 Figure 3-62 Chamfer strips provided at 90 degree corners to provide a sufficiently
rounded corner for CFRP materials ...................................................................................97 Figure 3-63 12-ft. steel reinforcing cage with stirrups spaced at 4-in. for deep beam test
specimen ............................................................................................................................98 Figure 3-64 Lifting inserts provided near the ends of each specimen ...........................................98 Figure 3-65 A completed reinforcing cage with slab reinforcement installed ...............................99 Figure 3-66 Placing concrete within the formwork .....................................................................100 Figure 3-67 Vibrating the concrete ..............................................................................................100 Figure 3-68 Screeding the top surface of the beams ....................................................................101 Figure 3-69 Test Nomenclature ...................................................................................................102 Figure 3-70 Fatigue load test setup ..............................................................................................103 Figure 3-71 Test Nomenclature ...................................................................................................104 Figure 3-72 Long-term load test setup .........................................................................................104 Figure 3-73 Average concrete compressive strength for each cast ..............................................105 Figure 3-74 Steel strain gauge grid for all test specimens ...........................................................106 Figure 3-75 Steel strain gauge nomenclature...............................................................................106 Figure 3-76 CFRP strain gauge (Pham, 2009) .............................................................................107 Figure 3-77 Rubber pad used to protect CFRP gauge .................................................................107 Figure 3-78 Long-term load gauge protection covering ..............................................................108 Figure 3-79 CFRP strain gauge grid for all test specimens .........................................................108 Figure 3-80 CFRP strain gauge nomenclature .............................................................................109 Figure 3-81 LVDT used to monitor displacements during fatigue testing ..................................110 Figure 3-82 DEMEC measuring device .......................................................................................110

xv
Figure 3-83 DEMEC point grid ...................................................................................................111 Figure 3-84 As-built DEMEC point grid .....................................................................................111 Figure 3-85 DEMEC points used to track changes in end displacements ...................................112 Figure 3-86 Side view of wooden panel inserts ...........................................................................112 Figure 3-87 Cross Section Showing Shear Reinforcement (left) and Tendon Profile
(right) ...............................................................................................................................113 Figure 3-88-T-beam Showing Anchor Holes ..............................................................................114 Figure 3-89 I-Girder Showing Anchor Holes ..............................................................................115 Figure 3-90 Tension Forces Resisted by the CFRP Anchor ........................................................115 Figure 3-91 Elevation View of I-2 ...............................................................................................116 Figure 3-92 Elevation View of I-3 ...............................................................................................116 Figure 3-93 Elevation View of I-4 ...............................................................................................117 Figure 3-94 I-2 Vertical Strips Only ............................................................................................117 Figure 3-95 I-3 Fully Wrapped Beam with Vertical and Horizontal Sheets ...............................118 Figure 3-96 I-4 Vertical and Horizontal Strips ............................................................................118 Figure 3-97 Material Breakdown of all Tests ..............................................................................119 Figure 3-98 Test Setup .................................................................................................................120 Figure 3-99 Elevation View of Test Setup ..................................................................................121 Figure 3-100 Post-Tensioning System .........................................................................................122 Figure 3-101 Clamps....................................................................................................................123 Figure 3-102 Grid System Used in I-2 .........................................................................................124 Figure 3-103 Grid System Used in I-3 .........................................................................................124 Figure 3-104 Grid System Used in I-4 (Horizontal strips are not shown for clarity
purposes) ..........................................................................................................................125 Figure 3-105 Strain Gauge Nomenclature ...................................................................................125 Figure 3-106 LVDT Used to Monitor the Deflection at the Loading Point ................................126 Figure 3-107 Shear Deformation Configuration ..........................................................................126 Figure 4-1 Free body diagram for evaluating shear contributions ...............................................130 Figure 4-2 Comparison of strain response in the same CFRP strip (48-3-2)...............................131 Figure 4-3 Typical response of steel, CFRP, and concrete contributions to shear strength .....................132 Figure 4-4 Photos of both sides of test 24-3-2 after failure .........................................................133 Figure 4-5 Component contribution to shear force vs. deformation response of 24-3-2 .............133 Figure 4-6 Component contribution to shear force vs. deformation response of 24-3-1/1r ........134 Figure 4-7 Photos of both sides of test 24-3-1R at ultimate load ................................................135 Figure 4-8 Poor application of CFRP strip and anchor due to plastic wrapping .........................136 Figure 4-9 Component contribution to shear force vs. deformation response of 24-3-3 .............136 Figure 4-10 Photos of both sides of test 24-3-3 at ultimate load .................................................137 Figure 4-11 Fracture of CFRP Anchor in test 24-3-3 ..................................................................137 Figure 4-12 CFRP installation without bond using adhesive shelf liner .....................................138

xvi
Figure 4-13 Photos of CFRP anchor detail before and after modification ..................................138 Figure 4-14 Component contribution to shear force vs. deformation response of 24-3-4 ...........139 Figure 4-15 Photos of both sides of test 24-3-4 at peak load.......................................................139 Figure 4-16 Photos of both sides of test 24-3-5 at peak load.......................................................140 Figure 4-17 Component contribution to shear force vs. deformation response of 24-3 ..............141 Figure 4-18 Failure sequence in test 24-3-5 ................................................................................141 Figure 4-19 Component contribution to shear force vs. deformation response of 24-3-6 ...........142 Figure 4-20 Photos of both sides of test 24-3-6 at failure............................................................143 Figure 4-21 Photos of explosive rupture of strip D .....................................................................144 Figure 4-22 CFRP strip detail between continuous sheet and typical layout ..............................144 Figure 4-23 Images from infra-red camera in test 24-3-7 (front side) .........................................145 (a) Debonding (front) ...................................................................................................................145 Figure 4-24 Photos of both sides of test 24-3-7 ...........................................................................145 Figure 4-25 Component contribution to shear force vs. deformation response of 24-3-7 ...........145 Figure 4-26 Component contribution to shear force vs. deformation response of 24-3-8 ...........146 Figure 4-27 Photos of both sides of test 24-3-8 at ultimate load .................................................147 Figure 4-28 CFRP anchor failure of front side in 24-3-8 ............................................................147 Figure 4-29 Photos of both sides of test 24-3-9 at ultimate load .................................................148 Figure 4-30 Component contribution to shear force vs. deformation response of 24-3-9 ...........148 Figure 4-31 Comparisons of typical CFRP anchor detail and that of 24-3-10 ............................149 Figure 4-32 Failure sequences of test 24-3-10 .............................................................................150 Figure 4-33 Component contribution to shear force vs. deformation response of 24-3-10 .........150 Figure 4-34 Photos of both sides of test 24-3-10 at ultimate load ...............................................151 Figure 4-35 Component contribution to shear force vs. deformation response of 24-2.1-2 ........152 Figure 4-36 Photos of both sides of test 24-2.1-2 at ultimate load ..............................................152 Figure 4-37 Component contribution to shear force vs. deformation response of 24-2.1-1 ........153 Figure 4-38 Photos of both sides of test 24-2.1-1 at ultimate load ..............................................153 Figure 4-39 Component contribution to shear force vs. deformation response of 24-1.5-3 ........154 Figure 4-40 Photos of test 24-1.5-3 at failure ..............................................................................154 Figure 4-41 Component contribution to shear force vs. deformation response of 24-1.5-4 ........155 Figure 4-42 Photos of both sides of test 24-1.5-4 at ultimate load ..............................................155 Figure 4-43 Photos of test 24-1.5-1 and 24-1.5-1r at maximum load..........................................156 Figure 4-44 Photos of test 24-1.5-1r2 at failure ...........................................................................156 Figure 4-45 Component contribution to shear force vs. deformation response of 24-1.5-
1/1r ...................................................................................................................................157 Figure 4-46 Component contribution to shear force vs. deformation response of 24-1.5-2 ........157 Figure 4-47 Photos of test 24-1.5-2 at failure ..............................................................................158 Figure 4-48 Debonding in test 24-1.5-2 at failure .......................................................................158

xvii
Figure 4-49 Component contribution to shear force vs. deformation response of 48-3-1 ...........159 Figure 4-50 Photos of both sides of test 48-3-1 ...........................................................................160 Figure 4-51 Component contribution to shear force vs. deformation response of 48-3-2 ...........161 Figure 4-52 Photos of both sides of test 48-3-2 at end of test .....................................................162 Figure 4-53 Photos of stirrup fracture after CFRP rupture ..........................................................162 Figure 4-54 Component contribution to shear force vs. deformation response of 48-3-3 ...........163 Figure 4-55 Photos of both sides of test 48-3-3 at ultimate load .................................................164 Figure 4-56 Debonding of CFRP strip of 48-3-3 at locations shown in Figure 4-55 ..................164 Figure 4-57 Overlapping of diagonal strips on bottom of beam ..................................................165 Figure 4-58 Component contribution to shear force vs. deformation response of 48-3-4 ...........165 Figure 4-59 Photos of both sides of test 48-3-4 at ultimate load .................................................166 Figure 4-60 Component contribution to shear force vs. deformation response of 48-3-6 ...........167 Figure 4-61 Photos of both sides of test 48-3-6 when load stopped ............................................167 Figure 4-62 Component contribution to shear force vs. deformation response of 48-3-5 ...........168 Figure 4-63 Photos of both sides of test 48-3-5 at end of test .....................................................169 Figure 4-64 Photo of debonding of CFRP strip in test 48-3-5 at end of test ...............................169 Figure 4-65 Epoxy injection and surface preparation ..................................................................170 Figure 4-66 Component contribution to shear force vs. deformation response of 48-3-6r .........170 Figure 4-67 Photos of both sides of test 48-3-6r at ultimate........................................................171 Figure 4-68 Photos of rupture of CFRP strip and anchor in test 48-3-6r ....................................171 Figure 4-69 Component contribution to shear force vs. deformation response of 48-3-7 ...........172 Figure 4-70 Photos of both sides of test 48-3-7 when load stopped ............................................173 Figure 4-71 Photo of debonding of CFRP strip in test 48-3-7 when load stopped ......................173 Figure 4-72 Component contribution to shear force vs. deformation response of 48-3-8 ...........174 Figure 4-73 Photos of both sides of test 48-3-8 at ultimate load .................................................175 Figure 4-74 Fracture of CFRP anchors ........................................................................................175 Figure 4-75 Cases in which the point of max. capacity was not used for shear evaluations .......177 Figure 4-76 Envelope response of 24-3-ref .................................................................................179 Figure 4-77 Comparison of response between control test and strengthened tests .....................180 Figure 4-78 Comparison of response between control test and strengthened test according
to shear span to depth ratio ..............................................................................................182 Figure 4-79 Comparison of response of shear-span-to-depth ratio of 1.5 ...................................183 Figure 4-80 Comparison between with and without CFRP anchors ............................................184 Figure 4-81 Comparison of the amount of CFRP material ..........................................................185 Figure 4-82 Comparison of test results according to different transverse steel ratio ..................186 Figure 4-83 Comparison of test results of different laminates ....................................................187 Figure 4-84 Comparison of test results with and without bond ...................................................188 Figure 4-85 Comparison of test results between 24 in. beams and 48 in. beams ........................189

xviii
Figure 4-86 Comparison of test results between continuous sheet and multi-layers strip...........190 Figure 4-87 Comparison of test results for evaluating the feasibility of diagonal strips .............191 Figure 4-88 Comparison between inclined anchor and typical anchor ........................................192 Figure 4-89 Anchor fracture in test 24-3-10 ................................................................................192 Figure 4-90 Comparison of behavior test with intermediate anchor ...........................................193 Figure 4-91 Strain distribution in the CFRP from camera image ................................................193 Figure 4-92 Normalized load ratio about maximum load of various loading levels ...................195 Figure 4-93 Average strain in the CFRP when the maximum strain of 0.009.............................196 Figure 4-94 24-3-Fatigue-1&2 unbonded (left) and bonded (right) CFRP test specimen ...........197 Figure 4-95 Load displacement response, test 24-3-Fatigue-1&2 ...............................................198 Figure 4-96 Steel strains, Tests 24-3-Fatigue-1&2 ......................................................................199 Figure 4-97 CFRP strains, Tests 24-3-Fatigue-1&2 ....................................................................200 Figure 4-98 24-3-Fatigue-3&4 unbonded (left) and bonded (right) CFRP test specimen ...........201 Figure 4-99 Load displacement response, test 24-3-Fatigue-3&4 ...............................................202 Figure 4-100 Steel strains, Tests 24-3-Fatigue-3&4 ....................................................................203 Figure 4-101 CFRP strains, Tests 24-3-Fatigue-3&4 ..................................................................204 Figure 4-102 Load displacement response, test 24-3-Fatigue-Fail-1&2 .....................................208 Figure 4-103 24-3-Fatigue-Fail-1 before (left) and after (right) loading .....................................208 Figure 4-104 Rupture of a CFRP anchor observed during 24-3-Fatigue-Fail-1 ..........................209 Figure 4-105 Rupture of a CFRP strip observed during 24-3-Fatigue-Fail-1 .............................209 Figure 4-106 24-3-Fatigue-Fail-2 before (left) and after (right) loading .....................................210 Figure 4-107 CFRP anchor failure observed during 24-3-Fatigue-Fail-2 ...................................210 Figure 4-108 Rupture of CFRP strip observed during 24-3-Fatigue-Fail-2 ................................211 Figure 4-109 Load displacement response, test 24-3-Fatigue-Fail-3&4 .....................................212 Figure 4-110 24-3-Fatigue-Fail-3 before (left) and after (right) loading .....................................212 Figure 4-111 First CFRP anchor failure observed during 24-3-Fatigue-Fail-3 ...........................213 Figure 4-112 Second CFRP anchor failure observed during 24-3-Fatigue-Fail-3 ......................213 Figure 4-113 24-3-Fatigue-Fail-4 before (left) and after (right) loading .....................................214 Figure 4-114 CFRP sheet rupture observed during 24-3-Fatigue-Fail-4 .....................................214 Figure 4-115 CFRP anchor failure observed during 24-3-Fatigue-Fail-4 ...................................215 Figure 4-116 Front and back of test 24-3-Sust-1 .........................................................................218 Figure 4-117 Strains, test 24-3-Sust-1 .........................................................................................219 Figure 4-118 Front and back of test 24-3-Sust-2 .........................................................................219 Figure 4-119 Strains, test 24-3-Sust-2 .........................................................................................220 Figure 4-120 Front and back of test 24-3-Sust-3 .........................................................................221 Figure 4-121 Strains, test 24-3-Sust-3 .........................................................................................222 Figure 4-122 Front and back of test 24-3-Sust-4 .........................................................................222 Figure 4-123 Strains, test 24-3-Sust-4 .........................................................................................223

xix
Figure 4-124 End displacement DEMEC points .........................................................................224 Figure 4-125 Average total displacement ....................................................................................224 Figure 4-126 Cracking and Ultimate Shear Loads for Each Test ................................................226 Figure 4-127- Percent Increase in Cracking and Ultimate Shear Load for Each Test .................226 Figure 4-128 I-1 Failure ...............................................................................................................227 Figure 4-129 I-2 Failure ...............................................................................................................227 Figure 4-130 I-3 Failure ...............................................................................................................228 Figure 4-131 I-4 Failure ...............................................................................................................228 Figure 4-132 Applied Shear vs. Shear Strain...............................................................................229 Figure 4-133 Load Displacement Response ................................................................................229 Figure 4-134 Strain Gauge Readings (Top) and Locations (Bottom)..........................................230 Figure 4-135 Strain Gauge Readings (Top) and Locations (Bottom)..........................................231 Figure 4-136 Strain Gauge Readings (Top) and Locations (Bottom)..........................................232 Figure 4-137 Strain Gauge Readings (Top) and Locations (Bottom)..........................................233 Figure 4-138 Strain Gauge Readings (Top) and Locations (Bottom)..........................................234 Figure 4-139 Strain Readings at 300 kips ....................................................................................235 Figure 4-140 Strain Readings at 400 kips ....................................................................................235 Figure 4-141 Strain Readings at 500 kips ....................................................................................235 Figure 5-1 Recommended detail of CFRP anchors .....................................................................237 Figure 5-2 Isometric view of U-wrap with CFRP anchorage system ..........................................237 Figure 5-3 Average strain in the CFRP at maximum strain of 0.009 (reproduced Figure 4-
93) ....................................................................................................................................241 Figure 5-4 Proposed shear design equations – Option 1 (adapted from ACI 440.2R-08). ..........242 Figure 5-5 Description of the variables used in FRP shear strengthening calculations...............243 Figure 5-6 Proposed shear design equations – Option 2 (adapted from ACI 440.2R-08). ..........245 Figure 5-7 Comparison between ACI 440.2R-08 linear relation of transverse steel versus
shear contribution and test data ........................................................................................246 Figure 5-8 𝒌𝒔 and 𝑽𝒔(= 𝒌𝒔𝑽𝒔𝟎) ................................................................................................247 Figure 5-9 Marginal increase in steel contribution ......................................................................247 Figure 5-10 Comparison between estimate from proposed equation and test results (a/d
ratio≥ 2.0, stirrup spacing ≤ d/2 ) .....................................................................................248 Figure 5-11 𝒌𝒇 and 𝑽𝒇(= 𝒌𝒔𝑽𝒔𝟎)..............................................................................................249 Figure 5-12 Comparison between test results and estimates from proposed equations and
ACI 440 ............................................................................................................................249 Figure 5-13 Comparison of measured shear capacities with estimates .......................................250 Figure 5-14 Comparison of measured shear capacities with estimates (U-wrap with
anchor tests only) .............................................................................................................251 Figure 5-15 Evaluation of proposed Option 2 equations using Chaallal et al. (2002) test
results ...............................................................................................................................252
xx
Figure 5-16 Comparison between ACI 440.2R-08 and proposed Option 2 equations with tests reported by Chaallal et al. (2002) ............................................................................252
Figure 5-17 Comparison of shear capacity between proposed and ACI equations .....................254 Figure 5-18 Comparison of steel contribution between proposed and ACI equations ................254 Figure 5-19 Comparison of CFRP contribution between proposed and ACI equations ..............254 Figure 6-1 FRP to concrete bond-slip relationship [15] ..............................................................261 Figure 6-2 Computational models and its finite element models ................................................263 Figure A-1 Bottom corner of I-beam is rounded to prevent a local failure of the CFRP ............279 Figure A-2: (a) Hole drilled into the concrete specimen; (b) removing debris from the
anchorage hole .................................................................................................................280 Figure A-3 Drilled and cleared anchorage hole ...........................................................................281 Figure A-4 Completed preparation of CFRP anchorage hole ......................................................281 Figure A-5 Mixing the two components of the epoxy together ...................................................282 Figure A-6 Completed high strength structural epoxy ................................................................282 Figure A-7 Wetting the surface of the concrete specimen ...........................................................283 Figure A-8 Wetting the drilled anchor hole with epoxy ..............................................................283 Figure A-9 Impregnating the carbon fiber sheets with epoxy .....................................................284 Figure A-10 Folding the impregnated sheets in half for ease of handling ...................................284 Figure A-11 Placing the CFRP sheet onto the surface of the beam and aligning the free
end of the installed CFRP strip ........................................................................................285 Figure A-12 Removing excess epoxy from the installed CFRP strip ..........................................285 Figure A-13 Creating an opening for the CFRP anchor ..............................................................286 Figure A-14 Completed installation of a CFRP strip...................................................................286 Figure A-15 Application of the concrete surface primer .............................................................287 Figure A-16 Wetting the surface of the CFRP anchor holes .......................................................288 Figure A-17 Impregnating the CFRP strip while on the surface of the beam with a
serrated roller ...................................................................................................................288 Figure A-18 Sealing the CFRP laminates with epoxy .................................................................289 Figure A-19 Completed installation using the dry lay-up procedure ..........................................289 Figure A-20 Materials required to construct a CFRP anchor – a strip of CFRP, a rebar tie
and a pair of needle nose pliers ........................................................................................290 Figure A-21 CFRP strip folded in half and clasped with a rebar tie............................................290 Figure A-22 A close-up view of the rebar tie clasp .....................................................................291 Figure A-23 CFRP anchors prepared for installation ..................................................................291 Figure A-24 Impregnation of the CFRP anchor with high strength structural epoxy .................292 Figure A-25 Insertion of the CFRP anchor ..................................................................................292 Figure A-26 Using a rebar tie to properly insert the CFRP anchor into a predrilled hole. ..........292 Figure A-27 Construction of CFRP anchorage fan......................................................................293 Figure A-28 Completed installation of CFRP anchors ................................................................293

xxi
Figure A-29 Recommended detail of CFRP anchors ..................................................................294 Figure A-30 Isometric view of U-wrap with CFRP anchorage system .......................................294 Figure A-31 Average strain in the CFRP at maximum strain of 0.009 .......................................298 Figure A-32 Description of the variables used in FRP shear strengthening calculations ............298 Figure A-33 Proposed shear design equations – Option 1 (adapted from ACI 440.2R-08). .......299 Figure A-34 Proposed shear design equations – Option 2 (adapted from ACI 440.2R-08). .......301

xxii

xxiii
List of Tables Table 2-1 Typical tensile properties of fibers used in FRP systems (ACI 440.2R) .........................7 Table 2-2 Typical tensile properties of FRP laminates (ACI 440.2R) ............................................7 Table 2-3 Environmental reduction factor for various exposure conditions (ACI 440.2R) .............8 Table 2-4 Various experimental results of FRP shear tests presented in terms of percent
increase compared to the control specimen .......................................................................18 Table 3-1 CFRP Material Properties..............................................................................................55 Table 3-2 Test matrix for 24in.-deep beams with a/d=3.0 (24-3-1 to10) ......................................79 Table 3-3 Test Matrix for transitional beams with a/d=2.1 (24-2.1-1 and 2) ................................81 Table 3-4 Test Matrix in deep beams with a/d=1.5 (24-1.5-1 ~4) .................................................82 Table 3-5 Test Matrix in minimum transverse steel ratio (48-3-1 ~4) ..........................................84 Table 3-6 Test Matrix in same transverse steel ratio with 24 in. beams (48-3-5 ~8) ....................86 Table 3-7 Compressive strength of concrete according to the cast ...............................................87 Table 3-8 CFRP laminate properties from manufacturer’s specifications.....................................88 Table 3-9 Estimate of shear contribution using ACI provisions....................................................89 Table 3-10 Concrete Strengths at Different Stages ......................................................................113 Table 3-11 Span Lengths (in inches) ...........................................................................................122 Table 4-1 Summary of test results for 24in. beams .....................................................................128 Table 4-2 Summary of test results for 48in. beams .....................................................................129 Table 4-3 Comparison between shear estimates from equation and test in 24-3-1r ....................135 Table 4-4 CFRP properties of laminates A and B .......................................................................140 Table 4-5 Comparison of stiffness between laminate A and laminate C .....................................142 Table 4-6 Comparison between shear estimates from equation and test in 24-3-1r ....................143 Table 4-7 Comparison between design estimate and test estimate ..............................................176 Table 4-8 Statistical summary of test results (a/d=3) ..................................................................177 Table 4-9 Comparison between stopped tests and tests to failure (a/d=3) ..................................178 Table 4-10 Comparison of design estimate and test capacity between control and
strengthened tests .............................................................................................................179 Table 4-11 Comparison of CFRP shear contribution from measured strain gauge and
compared with difference in strength relative to control test ..........................................181 Table 4-12 Comparison between estimate and test of different laminates ..................................187 Table 4-13 Summary of load ratio at major events......................................................................195 Table 4-14 Fatigue Loading Test Matrix .....................................................................................196 Table 4-15 Summary of highest strains recorded during fatigue loading ....................................205 Table 4-16 Summary of crack widths recorded during fatigue loading ......................................206 Table 4-17 Fatigue failure load test matrix ..................................................................................207 Table 4-18 Summary of tests to failure........................................................................................215 Table 4-19 Sustained loading test matrix.....................................................................................217

xxiv
Table 4-20 Summary of sustained load results ............................................................................225 Table 5-1 Comparison between stopped tests and tests to failure (a/d=3) ..................................243 Table 5-2 Comparison of contributions for #3@10” between proposed and ACI equation .......253 Table 5-3 Comparison of contributions for #3@18” between proposed and ACI equation .......253
1
Chapter 1. Introduction
1.1 Objective The objective of the study was to demonstrate the feasibility of using carbon fiber
reinforced polymers (CFRP) for shear strengthening of large bridge girders or supporting elements. Although many tests have been done on small elements to show the efficiency of CFRP anchors and sheets, data were needed where large elements are to be strengthened to carry substantial shear forces. Also, there has been little work done regarding the effect of creep of polymer materials and anchors in structural elements under sustained or fatigue loads.
Applications of CFRP shear strengthening in bridges include 1) repair and strengthening of bridges showing signs of distress due to overloads, and 2) strengthening of bridges to increase the load capacity in order to minimize re-routing.
1.2 Research Significance Carbon fiber reinforced polymer (CFRP) materials provide a relatively new option to
strengthen or repair concrete elements that have been damaged either by overload or other action such as impact, corrosion or concrete deterioration, fire, or settlement. CFRP laminates consist of a textile like fabric woven with thin carbon fiber strands that are impregnated with a high strength structural epoxy. When properly installed, the CFRP material possesses a high axial tensile strength in the direction of the carbon fiber strands. CFRP materials offer a light-weight, high-strength, and non-corrosive option when strengthening or rehabilitating a concrete structure. The ability to quickly apply CFRP materials with a minimum of disruption to the use of a structure and with virtually no change in the geometry or weight of the element makes CFRP a viable and attractive method for strengthening existing elements.
A large amount of research has been conducted regarding the use of CFRP materials to provide additional strength in structural applications; however, the majority of this research has been conducted on small scale test specimens that may not reflect typical layouts of internal steel reinforcement. In many experimental studies, the interface bond between the CFRP laminates and concrete surface is the only means by which shear forces are transferred between the two materials. Interfacial bond between the epoxy and the concrete substrate is one of the weakest elements of the CFRP strengthening system. The CFRP laminates generally will separate from the concrete substrate at tensile loads on the order of 40 to 50% of their ultimate capacity (at best). A direct pull off test provides information about the quality of the substrate concrete (existing or repaired) and the surface preparation. This premature debonding failure creates an undesirable limitation on the useful strength of the CFRP materials that designers must consider.
Without proper anchorage of the CFRP laminates, premature debonding failure is practically unavoidable and many researchers have noted the importance of providing some means of end anchorage. Most of the currently researched CFRP anchorage systems consist of mechanical means to effectively pin the ends of the CFRP laminates to the concrete surface. However, recent research on the use of CFRP materials to anchor CFRP strengthening systems has been reported. CFRP anchors have been proven capable of preventing debonding failures of CFRP laminates and developing the full tensile strains of the carbon fiber material.
Research on the strength and behavior of the CFRP anchors is limited. Design procedures for CFRP anchors have not been developed. Research on full scale test specimens utilizing the
2
CFRP anchorage system in shear applications are needed to provide realistic data that will allow design engineers to implement CFRP anchors and utilize a larger fraction of the inherent strength of CFRP laminates.
1.3 Research Scope
The scope of the proposed research includes the following tasks: 1. Assess the performance of CFRP anchor and sheet performance under shear loading.
2. Conduct tests to determine creep and fatigue characteristics of CFRP shear reinforcement.
3. Determine the behavior of CFRP shear reinforcement on full-scale typical TxDOT elements.
4. Explore the feasibility of using a commercially available FEM analysis program to simulate the response of shear strengthened elements.
5. Develop design guidelines for the use of CFRP sheets as shear reinforcement.
6. Develop material and construction specifications for the use of CFRP sheets as shear reinforcement.
An extensive experimental program was undertaken on several full-scale T-beams and I-girders to achieve project objectives. Sixteen tests were conducted under monotonically increasing loading on 24 in.-deep T-beams. Eight monotonic tests were conducted on 48in.-deep T-beams. Two 24in.-deep beams were tested under sustained loading and two 24 in.-deep beams were tested under fatigue loading. Finally, four tests were conducted on 54 in.-deep pre-stressed I-girders. Parameters investigated in the experimental program included: 1) beam shear span to depth ratio, 2) beam depth, 3) beam or girder shape, 4) amount of transverse steel, 5) amount and layout of CFRP sheets, 6) amount and layout of CFRP anchors (including tests without anchorage), and 7) surface preparation.
From the experimental program, guidelines for designing and installing anchored CFRP shear strengthening systems were developed and are presented. Specific anchor design and installation guidelines are also presented in this report.
1.4 Report Organization Chapter 2 presents background information on the state-of-the-art in externally applies
CFRP strengthening applications. The chapter includes discussions on CFRP material properties, material applications, and anchorage systems.
Chapter 3 presents the details of the experimental program. Specimen designs and details are presented in this chapter along with details on specimen construction, test setup, and instrumentation. A section is introduced at the beginning of Chapter 3 that describes in detail the installation process of CFRP sheets and anchors.
Chapter 4 summarizes all experimental test results. Results are discussed for each individual test and for groups of tests that highlight the influence of certain key parameters on the performance of the CFRP systems.
Chapter 5 presents design guidelines for externally applied, anchored CFRP shear-strengthening systems. Design guidelines for CFRP anchors are presented first in Chapter 5. Design guidelines are then presented for anchored U-wrap shear strengthening systems.

3
Chapter 6 discuses currently available FEM modeling approaches for CFRP/concrete interfaces. Limitations of available approaches to model anchored CFRP systems are discussed.
Chapter 7 presents the main conclusions of the project. Two master’s theses and one PhD dissertation were compiled in this report. More detail
can be found in Kim Y. (2011), Quinn K. (2009), and Satrom N. (2011).

4

5
Chapter 2. Background
2.1 Carbon Fiber Reinforced Polymers (CFRP) The use of carbon fiber reinforced polymers (CFRP) is rapidly gaining acceptance for
strengthening concrete structures. CFRP is an externally applied heterogeneous reinforcing material consisting of two parts. The first is a textile-like fabric of carbon strands and the second is a high strength structural epoxy or resin. At the smallest level, the diameter of a carbon fiber filament is merely 7 to 10 micrometers. These filaments are used to form a single carbon fiber strand and the strands are woven together with a transverse thread (glass or nylon) to produce a fabric like sheet (Kobayashi, Kanakubo, & Jinno, 2004). The carbon fiber sheets are then impregnated with a structural epoxy or resin and the individual fibers act as a unit. Figure 2-1 provides a magnified image of an FRP from a scanning electron microscope.
Figure 2-1 Scanning electron microscope image of CFRP
CFRP materials have many positive qualities that make them attractive to engineers for use in strengthening. These include mechanical strength and stiffness, corrosion resistance, light weight, easy handling, and the ability to apply CFRP in long strips, eliminating many lap splices (Triantafillou, 1998). Carbon fibers are not affected by harsh conditions such as exposure to high humidity, acids, bases or other solvents and they can withstand direct contact with concrete (Malvar, Warren, & Inaba, 1995).
In terms of its mechanical properties, CFRP is classified as an anisotropic material that maintains high strength in the direction of its fibers as seen in Figure 2-2 (Yang 2007). It also is an elastic material that maintains a linear stress strain relationship up to failure with typical ultimate strain values of 1 to 1.5%. This means that a CFRP system can provide a large amount of strength with a relatively small amount of material.

6
Figure 2-2 Schematic diagram of a CFRP sheet
As seen in Figure 2-2, there are no carbon fibers woven in the transverse direction of the sheet. Without these fibers, the CFRP sheet cannot resist forces in a direction perpendicular to its longitudinal axis. Therefore, in order to develop strength in the transverse direction, at least two layers of carbon fiber sheets must be applied to the concrete substrate in an orthogonal pattern (Figure 2-3); that is, with the longitudinal axis of the individual layers perpendicular to each other.
Figure 2-3 Layered CFRP sheet to obtain strength in two directions
Another drawback of CFRP as a retrofitting technique is the high cost of the material. While the structural epoxy or resin is relatively inexpensive, carbon fiber fabric is expensive. In comparison to other fiber reinforced polymers (FRPs) such as glass or aramid, carbon fiber reinforced polymers may cost more, but they are stronger and more durable. CFRP is a durable material that requires minimal maintenance after installation. Engineers’ concerns regarding durability have led to the selection of CFRP in many reinforced concrete applications in spite of its higher cost (Malvar, Warren, & Inaba, 1995).
2.1.1 Properties of FRP materials: GFRP, AFRP, CFRP FRP materials are composite materials that typically consist of fibers embedded in a resin
matrix. The most common fibers are glass, aramid, and carbon. Typical tensile properties are shown in Table 2-1 and 2.2. Resin matrices are typically epoxies, polyesters, vinylesters, or phenolics. Epoxy resin is the most widely used resin. Typical tensile properties of FRP laminates (sheets of FRP saturated in resin) are shown in Table 2-2.
Polymer Resin
Directions of Strength
Carbon Fibers

7
By comparing the properties, it can be seen that the tensile properties of FRP laminates are less than those of FRP fibers. In general, FRP bars have fiber volumes of 50 to 70%, precured systems have fiber volumes of 40 to 60%, and wet lay-up laminate systems have fiber volumes of 25 to 40%. Because the fiber volume influences the gross-laminate properties, precured laminates usually have higher mechanical properties than laminates created using the wet layup technique. (ACI 440.2R)
Table 2-1 Typical tensile properties of fibers used in FRP systems (ACI 440.2R)
Fiber type Elastic modulus
(ksi)
Ultimate strength
(ksi)
Rupture strain Minimum
Carbon (High-strength) 32000 ~ 34000 550 ~ 700 0.014
Glass ( E-glass) 10000 ~ 10500 270 ~ 390 0.045
Aramid ( High-performance) 16000 ~ 18000 500 ~ 600 0.016
Table 2-2 Typical tensile properties of FRP laminates (ACI 440.2R)
FRP system (w/epoxy)
Young’s modulus
(ksi)
Ultimate strength
(ksi) Rupture strain
Carbon (High-strength) 15000 ~ 21000 150 ~ 350 0.010 ~ 0.015
Glass ( E-glass) 3000 ~ 6000 75 ~ 200 0.015 ~ 0.030
Aramid ( High-performance) 7000 ~ 10000 100 ~ 250 0.020 ~ 0.030
Note: The fiber volume fraction of the laminate is about 40 to 60 percent.
2.1.2 CFRP materials Despite being the most expensive FRP material, Carbon Fiber Reinforced Polymer
(CFRP) is widely used for structural purposes due mainly to its higher strength, stiffness, and durability. In addition, CFRP performs well when subjected to fatigue and sustained loads. CFRP does not absorb moisture and has a very low coefficient of thermal expansion in the longitudinal direction. As shown in Table 2-3, the environmental reduction factor (CE) for CFRP is the highest among FRP materials (per ACI 440.2R) indicating that the design strength reduction due to environmental conditions is the least in CFRP. A disadvantage for all FRP materials is their sensitivity to heat. As a result, some method of fire proofing may need to be considered.

8
Table 2-3 Environmental reduction factor for various exposure conditions (ACI 440.2R)
Exposure conditions Fiber type Environmental reduction factor CE
Interior exposure
Carbon 0.95
Glass 0.75
Aramid 0.85
Exterior exposure (bridges, piers, and unenclosed parking garages)
Carbon 0.85
Glass 0.65
Aramid 0.75
Aggressive environment (chemical plants and wastewater treatment plants)
Carbon 0.85
Glass 0.50 Aramid 0.70
2.1.3 Mechanical properties of CFRP
CFRP is a uniaxial and brittle material that has no yield stress plateau. CFRP has a linear stress-strain relationship up to failure. The nominal material properties of Grade 60 steel and CFRP laminates used in this project are illustrated in Figure 2-4. Compared to reinforcing steel, the stiffness of CFRP laminates (14800 ksi) is roughly half and the ultimate stress of CFRP (154 ksi) is two and a half times at a rupture strain of 0.0105. Thus, to utilize the full CFRP material capacity, large strains must be developed. These large strains may cause cracking and deflection serviceability problems, as well as compatibility issues with steel reinforcement.
Figure 2-4 Comparison of material properties for steel and CFRP
Manufacturer specification sheets typically report values of the ultimate design tensile strength, which is defined as the mean tensile strength of a sample of test specimens minus three times the standard deviation (f ∗ f 3σ . Specifications may also report the ultimate design rupture strain, which is defined similarly (ε∗ ε 3σ . This approach provides a 99.87% probability that the material will exceed these statistically-based design values for a standard
Gr60 Steel
CFRP

9
sample distribution. It is recommended usually to evaluate the laminate Young’s modulus as the chord modulus between strains of 0.003 and 0.006. A minimum number of 20 replicate test specimens should be used to determine these properties.
Based on this approach, the greater the standard deviation of the material strength, the lower would be the design strength compared to the mean value. Because the variation of FRP properties is greater than that of steel, the design efficiency of FRP will be lower. These characteristics are typical of brittle materials such as CFRP.
2.2 Externally Applied CFRP Systems
While FRP are used in structures both internally (e.g., FRP bars) and externally (e.g., FRP laminates), typical strengthening applications involve external applications. The following section provides background information on externally applied CFRP systems as the project focus was on external CFRP shear applications.
CFRP laminates can be installed in all types of structural applications including but not limited to flexural strengthening (Figure 2-5), shear strengthening (Figure 2-6), and axial confinement (Figure 2-7) applications (Khalifa, Alkhrdaji, Nanni, & Lansburg, 1999). Flexibility in usage is one of the most appealing aspects of the rehabilitation system.
Figure 2-5 CFRP used in flexural strengthening (Yang, 2007)
Figure 2-6 CFRP used in shear strengthening (Yang, 2007)

10
Figure 2-7 CFRP used in an axial confinement application (Yang, 2007)
In almost all instances, the geometrical layout of the CFRP material is dictated by the function the material is intended to perform. For example, in a flexural application, the CFRP material is installed along the tensile face of the beam with the fiber direction oriented along the longitudinal axis of the beam. In a concrete confinement application, the CFRP material would be installed so that the material surrounds the column to be strengthened with the fiber direction circling the column.
2.2.1 Typical installations of CFRP materials in shear applications The most efficient shear application of CFRP is one that completely wraps the concrete
element as depicted in Figure 2-8. The CFRP material in this method of installation can take the form of discrete strips spaced at some interval defined by the design engineer or it can take the form of a continuous sheet in which the entire concrete element is covered with a wrap of CFRP material. Complete wrapping of the element strengthens the beam in shear and eliminates any possibility of a debonding failure. In this type of installation, the CFRP wrap must be continuous around the element. Direct bond between the CFRP and the concrete substrate is not critical because the continuous CFRP wrap adheres directly to itself.
Figure 2-8 Shear strengthening with a CFRP wrap
Although this method of installation is ideal, it is rarely seen in practice. Often, concrete beam elements are constructed with a monolithic slab that prohibits access to all surfaces of the beam. In these cases, it is not possible to fully wrap the specimen with CFRP material (Hoult &

11
Lees, 2009). Therefore, alternative configurations of CFRP materials have been adopted to provide some additional shear strength, but still fall short of completely wrapping the specimen.
A popular method that has been studied by some researchers (Uji [1992], Al-Sulaimani et al. [1994], Chajes et al. [1995], Sato et al. [1996], Triantafillou [1998], Adhikary & Mutsuyoshi [2004], Teng et al. [2004], and Zhang & Hsu [2005]) is the method of CFRP side bonding (Figure 2-9). Just as with the full CFRP wraps, side bonding can be applied in discrete strips or continuous sheets. The CFRP material is only applied along the sides of the concrete beam. Therefore, this method of installation allows the design engineer to specify the angle of application with respect to longitudinal axis of the beam.
Figure 2-9 Shear strengthening with CFRP side bonding
Side bonded CFRP materials can be installed perpendicular to an assumed crack angle as seen in Figure 2-10. Experimental test results indicate that this type of fiber orientation outperforms vertical side bonded CFRP in both ultimate shear capacity and in arresting shear crack propagation. Thus, if side bonded strips are to be used in design, it is recommended that they be installed perpendicular to the assumed crack angle. However, because the side bonded strips are not wrapped around any 90 degree corners, they are highly susceptible to debonding failures.
Figure 2-10 Side bonded CFRP strips installed perpendicular to an assumed crack angle of 45
degrees
Another common method of installation in shear applications, in which full wrapping of the specimen is not possible, is the “U”-wrap or “U’-jacket approach. An illustration of the “U”-

12
wrap installation is provided in Figure 2-11. Again, this method has attracted the attention of many researchers such as Chajes et al. (1995), Sato et al. (1996), Khalifa et al. (1999), Khalifa et al. (2000), Deniaud & Cheng (2001), Chaallal et al. (2002), and Bousselham & Chaallal (2006). In laboratory testing, the “U”-wrap has outperformed the CFRP side bonded specimens with regard to debonding failures. Because the CFRP “U”-wrap is bent around two 90 degree corners, debonding at one end of the side-bonded sheet is effectively delayed, allowing the CFRP material to achieve a higher tensile load (Bousselham & Chaallal, 2006).
Figure 2-11 Shear strengthening with CFRP “U”-wraps
2.2.2 Failure modes of externally applied CFRP As an externally applied structural material, CFRP experiences two main types of failure
modes. The first is rupture. In this case, the carbon fibers achieve their ultimate strain value and fracture at the point of maximum stress. The second failure mode is CFRP debonding. This failure mode is experienced at strains lower than ultimate when the CFRP material separates from the concrete substrate (Chen & Teng, FRP Rupture, 2003). At these lower strain levels, the CFRP material is not able to utilize its full tensile capacity, effectively lowering the efficiency of the material (Orton, Jirsa, & Bayrak, 2008). The following sections provide more detail regarding failure modes.
CFRP Debonding
One of the biggest problems with CFRP strengthening systems is their tendency to debond or separate from the surface before the material is able to obtain its ultimate tensile capacity. In cases where CFRP materials are installed in a “U”-wrap or side bonded manner, debonding failures are a major concern because once the CFRP begins to separate from the concrete substrate, the beam can fail very quickly—thereby limiting the ductility of the member. In fact, a current design guideline for externally applied FRP materials, limits the effective tensile strain of the material to 0.004-in./in. or about 40% of its ultimate value in order to prevent this mode of failure (ACI 440.2R-08, 2008). However, this means that nearly 60% of the capacity of the CFRP system is never utilized in practice.
Chen & Teng (2003) performed an extensive review of research concerning the failure mode of CFRP debonding. They investigated 46 beams that failed by debonding. Of those 46 beams, 33 of them were strengthened by CFRP side bonding while the other 13 were strengthened with CFRP “U”-wraps. They concluded that almost all beams strengthened with side bonding and most strengthened by “U”-wraps failed in a debonding mode.

13
Although debonding is considered a mode of failure in CFRP systems, some debonding is required for the carbon fiber sheets to act effectively (Uji, 1992). Just as steel stirrups require cracks in the concrete to resist shear forces, so too do CFRP sheets. A certain amount of CFRP debonding is expected without causing failure of the beam. Large strains in the CFRP near cracks result from strain incompatibilities with the concrete substrate. A concrete crack will produce local debonding of the CFRP material at the crack as shown in Figure 2-12. Once locally debonded, the CFRP sheets are able to resist shear forces (Triantafillou & Antonopoulos, 2000).
Figure 2-12 CFRP on the concrete surface a) before cracking and b) after cracking
Many precautions are taken to prevent debonding from causing a structural failure. Some of the major factors that affect CFRP debonding are the quality of surface preparation before the CFRP is installed, the effective bond length between the CFRP and concrete substrate, the concrete compressive strength, and the axial stiffness of the applied system.
Currently, a lot of time and effort are dedicated to the preparation of the installation surface onto which CFRP materials will be applied. Cases in which the CFRP material cannot be completely wrapped around a concrete member are known as bond-critical applications and therefore, require sufficient bond between CFRP and concrete substrate. ACI 440.2R-08 recommends that surface preparation can be accomplished by using an abrasive or water blasting technique and that all laitance, dust, oil, existing coatings or any other materials that could interfere with the CFRP system be removed from the surface. Once this layer of laitance is removed, air-blasting is usually utilized to remove any loose particles from the surface (Chajes, Januszka, Mertz, Thomson, & Finch, 1995).
A sufficient bond length must be provided for the CFRP sheets to resist shear forces. However, the amount of shear force resisted by the CFRP does not increase linearly with the bond length provided. Khalifa et al. (1998) referred to observations made by Maeda et al. (1997) in noting that for bonded lengths over 100-mm (4-in.) the ultimate tensile force carried by CFRP strips is not dependent on its bonded length (regardless of whether the CFRP strip failed by debonding or by rupture). Once a shear crack develops, however, only the bonded portion of CFRP material extending past the crack is able to resist shear forces. Therefore, if the shear crack crosses near the ends of the “U”-wrap or side bonded CFRP strips, the tensile force carried by the strip before debonding occurs will be small due to the reduction in bond length.
One of the key factors that effects the bond strength between the concrete and CFRP is the concrete compressive strength. Debonding almost always occurs in the concrete at a small distance away from the concrete/CFRP interface. When debonding occurs, some concrete is still

14
adhered to the CFRP. Because the failure actually occurs in the concrete, it is obvious that the concrete strength of the beam plays a key role in the overall strength of the system (Chen & Teng, FRP Debonding, 2003). Figure 2-13 illustrates this concept clearly. The debonded strip has pulled some of the concrete substrate away from the beam.
Figure 2-13 An experimentally debonded CFRP strip
Finally, the axial stiffness of the applied system also plays a key role in its tendency to debond from the surface. Differing from Maeda et al. (1997), Triantafillou (1998) stated that the effective bond length needed to acquire the ultimate tensile force carried by the CFRP strips is almost proportionally dependent on the axial stiffness of the applied CFRP. The axial stiffness of the CFRP sheet is defined as:
(Eq. 2-1) and
(Eq. 2-2) where ρfrp is the CFRP reinforcement ratio, Efrp is the elastic modulus of the CFRP, tfrp is the thickness of the CFRP sheet, wfrp is the width of each individual CFRP strip, sfrp is the center to center spacing of the CFRP strips and b is the width of the concrete section. A factor of two is included in Equation 2-2 assuming that the CFRP is applied to both sides of the concrete element. The implication of Triantafillou’s argument is that as the CFRP laminates become stiffer (i.e., thicker or containing multiple layers), debonding failure will dominate over tensile fracture or rupture of the CFRP strips.
CFRP Rupture
To fully utilize CFRP materials, the failure must be by rupture rather than debonding. The effectiveness of the CFRP sheets, or the load carried by the sheets at the ultimate limit state, depends heavily on the mode of failure (Triantafillou, 1998). Much attention has been directed as to how to force the CFRP laminates to fail in a rupture mode. Teng et al. (2004) observed that in almost all experimental tests in which the concrete specimen was completely wrapped by CFRP materials, the mode of failure was CFRP rupture. Teng et al. also noticed that some experimental specimens strengthened with “U”-wraps failed in this manner as well. This further supports Triantafillou’s (1998) argument that there exists a certain “development” length for each CFRP strip that is necessary in order to fracture the strip. As discussed earlier, this “development”

15
length is dependent on the axial stiffness of the applied materials. Thus, it can be deduced that the mode of failure depends on the axial stiffness of the CFRP laminates. If the CFRP laminate is very thin and slender, a CFRP rupture failure mode would be expected; whereas if the CFRP laminate was very thick and wide, the expected mode of failure would be CFRP debonding.
In order to reach CFRP rupture, local debonding must occur over a shear crack so that the CFRP material can be engaged by tensile forces. Since the concrete can no longer provide additional shear resistance, the CFRP must contribute to the resistance and a rapid increase in strain is observed (Chajes, Januszka, Mertz, Thomson, & Finch, 1995). As these cracks become wider, the strain in the CFRP reaches the material’s ultimate value and rupture occurs. Due to the nature of a shear crack, rupture will often initiate at the lower end of a shear crack, where strains are higher (Chen & Teng, FRP Rupture, 2003). Figure 2-14 illustrates this in more detail.
Figure 2-14 Illustration depicting differences in strain across a CFRP strip
Tensile fracture of CFRP strips can also occur at a lower stress than the tensile strength of the material if stress concentrations are present within the laminates (Triantafillou, 1998). These stress concentrations may result from poor surface preparation of the substrate or at bends in the CFRP material. ACI 440.2R-08 recommends that all corners be rounded to a radius of 0.5-in. This allows a smooth transition over which tensile forces can be redirected, effectively reducing the chances of premature rupture.
2.3 Parameters Affecting CFRP Contribution to Shear Strength
Several factors can play a role in determining the overall strength of CFRP materials. Some of these factors are not associated with the material properties alone, but rather with the location and manner of application. These factors include, but are not limited to:
• The shear span-to-depth ratio
• Different CFRP layouts and configurations
• Internal shear reinforcement
• Multiple layers of CFRP material
• Strain distribution across the critical crack

16
2.3.1 The shear span-to-depth ratio
The shear span-to-depth ratio (a/d) is defined as the shear span (a) divided by the effective depth of the beam (d). The shear span is defined as the distance between the location of a point load applied to the beam and the nearest face of a support. The current ACI design guideline for FRP composites (ACI 440.2R-08) does not address the effects of the shear span-to-depth ratio; however, many researchers have noted the importance of shear span-to-depth ratio in design (Chaallal et al. [2002], Bousselham & Chaallal [2004], Adhikary & Mutsuyoshi [2004], and Bousselham & Chaallal [2006]).
As the shear span-to-depth ratio becomes smaller, a concrete beam will tend to experience a different mode of shear failure than the traditional sectional shear mode. ACI 318-08 classifies a shear span-to-depth ratio equal to two as the transition point between a beam failing in a sectional manner as compared to a deep beam failure. As the shear span-to-depth ratio decreases below two, deep beam shear failure typically controls and is evidenced by crushing of the concrete rather than yielding of the internal steel reinforcement. Confinement (with internal steel reinforcement) of the concrete may result in some gain in strength, but that gain is limited beyond a certain amount of reinforcement.
The addition of CFRP laminates in deep beam situations produces much the same results. Adhikary and Mutsuyoshi (2004) observed that when CFRP was applied to deep beams, the beams typically failed by concrete splitting and crushing behind the CFRP sheets. This caused the concrete to bulge outwards, causing the sheets to debond in some instances. Chaallal et al. (2002) observed that in cases where CFRP materials were applied to beams with shear span-to-depth ratios equal or close to two, the addition of the laminates tended to modify the behavior of the beam towards a sectional failure mode, or a failure typically seen in beams with larger shear span-to-depth ratios.
Bousselham and Chaallal (2006) noted that without transverse steel, concrete beams classified as deep by ACI 318-08 will experience a large gain in shear strength with CFRP laminates applied. However, once transverse steel is included (as is the case in all practical instances), this gain in strength drastically decreases. This indicates that when no transverse steel reinforcement is included in a beam strengthened with CFRP laminates, the CFRP laminates provide some confinement and crack control of the concrete strut (Bousselham & Chaallal, 2004). However, this condition may only exist when the concrete beams can be fully wrapped by the CFRP material. When applied in a side bonded or “U”-wrapped manner, the CFRP material may debond from the concrete substrate eliminating any presence of confinement.
In comparison to beams with shear span-to-depth ratios greater than two, the contribution of the CFRP laminates seems to be more significant than in deeper beams. This may indicate that when CFRP laminates are applied in deep beam applications, they cannot provide a gain in strength beyond the concrete strut capacity (Bousselham & Chaallal, 2004).
2.3.2 Different CFRP layouts and configurations
The American Concrete Institute’s Committee 440 has produced a design guideline (ACI 440.2R-08) that is intended to aid designers in using FRP in structural applications. However, due to a lack of a numerical model to describe shear behavior with FRP reinforcement and a small database of experimental studies, the ACI 440 document includes equations that may be misleading or overly conservative (Teng, Lam, & Chen, 2004). In analyzing the ACI 440.2R-08 equations for shear strength of the FRP materials, a major problem arises in determining the FRP

17
contribution to shear strength when the FRP is applied at an angle that is not perpendicular to the longitudinal axis of the member.
In most design guidelines, the shear contribution of the applied FRP materials can be determined using a truss analogy as in determining the contribution of steel reinforcement to shear strength. With this analogy, the shear crack angle is an important perameter. Many factors effect the shear crack angle; therefore, it needs to take into account to accurately predict strength (Teng, Lam, & Chen, 2004). In ACI 440.2R-08, a crack inclination angle of 45 degrees is assumed. This indicates that, in theory, shear FRP reinforcement then becomes most effective when placed perpendicular to the assumed crack inclination angle. Uji (1992) noted that a larger tensile stress can be reached when the FRP reinforcement is applied at a right angle to the diagonal shear cracks.
The ACI 440 equation for the contribution of the FRP shear reinforcement is given in the following equation:
(Eq. 2-3) where Afv is the cross sectional area of FRP crossing a shear crack, ffe is the tensile stress in the FRP shear reinforcement, α is the angle at which the FRP is applied to the member, dfv is the effective depth of FRP shear reinforcement (Figure 2-15) and sf is the center to center spacing of discreet FRP strips (ACI 440.2R-08, 2008).
Figure 2-16 shows a plot of the strength increase factor (sinα + cosα) versus angle, α. The factor fits well with the experimental data for a 45 degree angle as indicated in Table 2-4.
Figure 2-15 Diagram defining dfv (ACI 440.2R-08, 2008)
Figure 2-16 ACI 440 factor for increase in strength with different FRP application angle
dfv
00.20.40.60.8
11.21.41.6
0 10 20 30 40 50 60 70 80 90
Sin(α)
+ C
os(α
)
Application Angle, α
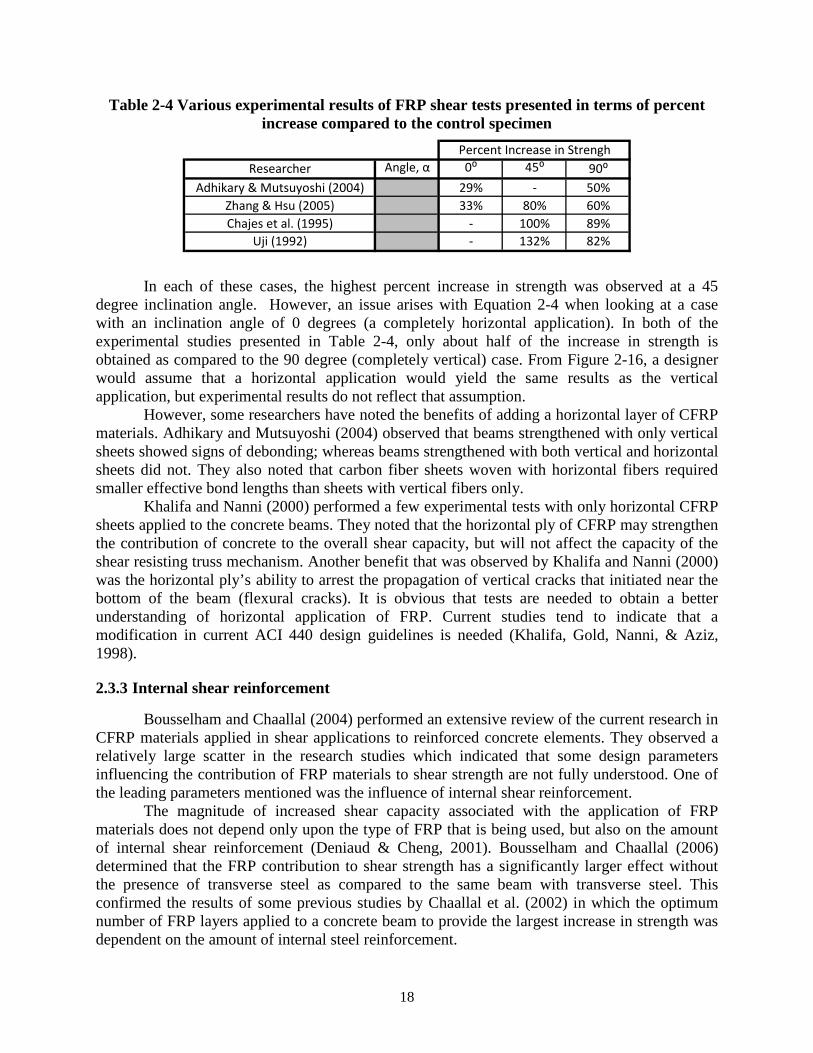
18
Table 2-4 Various experimental results of FRP shear tests presented in terms of percent increase compared to the control specimen
In each of these cases, the highest percent increase in strength was observed at a 45 degree inclination angle. However, an issue arises with Equation 2-4 when looking at a case with an inclination angle of 0 degrees (a completely horizontal application). In both of the experimental studies presented in Table 2-4, only about half of the increase in strength is obtained as compared to the 90 degree (completely vertical) case. From Figure 2-16, a designer would assume that a horizontal application would yield the same results as the vertical application, but experimental results do not reflect that assumption.
However, some researchers have noted the benefits of adding a horizontal layer of CFRP materials. Adhikary and Mutsuyoshi (2004) observed that beams strengthened with only vertical sheets showed signs of debonding; whereas beams strengthened with both vertical and horizontal sheets did not. They also noted that carbon fiber sheets woven with horizontal fibers required smaller effective bond lengths than sheets with vertical fibers only.
Khalifa and Nanni (2000) performed a few experimental tests with only horizontal CFRP sheets applied to the concrete beams. They noted that the horizontal ply of CFRP may strengthen the contribution of concrete to the overall shear capacity, but will not affect the capacity of the shear resisting truss mechanism. Another benefit that was observed by Khalifa and Nanni (2000) was the horizontal ply’s ability to arrest the propagation of vertical cracks that initiated near the bottom of the beam (flexural cracks). It is obvious that tests are needed to obtain a better understanding of horizontal application of FRP. Current studies tend to indicate that a modification in current ACI 440 design guidelines is needed (Khalifa, Gold, Nanni, & Aziz, 1998).
2.3.3 Internal shear reinforcement
Bousselham and Chaallal (2004) performed an extensive review of the current research in CFRP materials applied in shear applications to reinforced concrete elements. They observed a relatively large scatter in the research studies which indicated that some design parameters influencing the contribution of FRP materials to shear strength are not fully understood. One of the leading parameters mentioned was the influence of internal shear reinforcement.
The magnitude of increased shear capacity associated with the application of FRP materials does not depend only upon the type of FRP that is being used, but also on the amount of internal shear reinforcement (Deniaud & Cheng, 2001). Bousselham and Chaallal (2006) determined that the FRP contribution to shear strength has a significantly larger effect without the presence of transverse steel as compared to the same beam with transverse steel. This confirmed the results of some previous studies by Chaallal et al. (2002) in which the optimum number of FRP layers applied to a concrete beam to provide the largest increase in strength was dependent on the amount of internal steel reinforcement.
Angle, α 0⁰ 45⁰ 90⁰29% - 50%33% 80% 60%
- 100% 89%- 132% 82%
ResearcherPercent Increase in Strengh
Adhikary & Mutsuyoshi (2004)Zhang & Hsu (2005)Chajes et al. (1995)
Uji (1992)

19
It is becoming increasingly apparent that there is a relation between the CFRP contribution to shear strength and the spacing of internal steel stirrups. As the spacing of the transverse steel decreases, the CFRP contribution to shear strength decreases as well (Deniaud & Cheng, 2001). In a test of two identically dimensioned reinforced concrete beams, one having a transverse steel spacing of 8 inches and the other having a spacing of 16 inches, they observed that the applied FRP materials provided a 21% and 40% increase respectively in shear capacity. These results clearly indicate that the benefit of using FRP materials will be reduced as a beam becomes heavily reinforced with transverse steel.
Some researchers are trying to incorporate the influence of internal steel reinforcement into design models. Khalifa et al. (1998) suggested a limit on the total shear reinforcement ratio. This ratio would contain contributions from both the transverse steel and the applied FRP material. Chaallal et al. (2002) suggested making the effective strain of the FRP material dependent upon the same total shear reinforcement ratio. In fact, Chaallal et al. (2002) determined that the gain in shear capacity due to the FRP is directly proportional to the product of two ratios: the elastic moduli of FRP and steel (Efrp/Es) and the shear reinforcement ratio of FRP and steel (ρfrp/ρs).
The effect of FRP on strain in the internal shear reinforcement has also been studied. It has been shown that the presence of CFRP materials reduces strains in the transverse steel and delays yielding of the transverse steel reinforcement (Bousselham & Chaallal, 2006). The strains in the FRP and the transverse steel are different, even at the same locations; because of this, the tensile forces in the two will be different as well (Uji, 1992).
It is well known that the contributions to shear strength of internal steel reinforcement and the externally applied FRP materials interact. However, there is a lack of data on strains in both the FRP material and the transverse steel. As research proceeds and this data becomes more readily available, these measurements will prove to be extremely valuable to the understanding of the materials and to the development of more accurate design models (Bousselham & Chaallal, 2004).
2.3.4 Multiple layers of CFRP material
Another parameter that effects the contribution to shear strength of FRP materials is the amount of material that is applied to the surface of the beam. The gain in shear capacity associated with FRP materials is not directly proportional to the number of applied layers (Chaallal, Shahawy, & Hassan, 2002). Research studies have indicated that there may be a limit with respect to axial rigidity of the applied materials beyond which no increase in shear strength gain is expected (Bousselham & Chaallal, 2004).
When more FRP layers are applied to the beam, the ultimate shear strength gain is limited by premature debonding from the concrete substrate (Bousselham & Chaallal, 2006). Another reason for a disproportionate strength gain is that as the number of FRP layers increases, concrete cracking, splitting and loss of aggregate interlock primarily govern the ultimate failure (Adhikary & Mutsuyoshi, 2004). As the number of FRP layers increases, the effective strains in the laminates diminish and prevent the FRP materials from reaching their expected capacity before the beam fails in shear due to a concrete failure (Chaallal, Shahawy, & Hassan, 2002).
Current design guidelines fail to incorporate this finding for strengthened beams when the thickness of FRP laminates is high (Bousselham & Chaallal, 2006). The design guidelines are based on Triantafillou’s (1998) statement that the contribution to shear strength will increase linearly with low values of axial stiffness (Equation 2-1). Therefore, when only a small amount

20
of FRP material is applied, the current design guidelines are satisfactory (Khalifa & Nanni, 2000).
2.3.5 Strain distribution across the critical crack As the applied load increases on a beam, the location and orientation of shear cracks
change. Furthermore, crack width and crack angle are not constant along a crack. For this reason, the strains in the reinforcing elements, such as steel stirrups and CFRP sheets, are not uniform along the crack.
Many researchers have studied the non-uniform distribution of strains in FRP across the critical shear crack. Chen and Teng (2003, 2004) concluded that the stress distribution in the FRP along the crack plane is not uniform and proposed a model that takes into account fiber rupture and debonding. Carolin and Taljseten (2005) recommended using only 55 to 65% of the maximum measured strain value for engineering design based on non-uniform strain distribution.
2.3.6 Other parameters effecting CFRP’s contribution to shear strength
Many other parameters affect the overall contribution to shear strength associated with the use of CFRP materials. Three examples are the longitudinal steel reinforcement ratio, proper handling and mixing procedures for epoxy adhesives, and size effect (laboratory specimens compared to beams in practice).
Bousselham and Chaallal (2004) compiled a large amount of experimental data for beams strengthened in shear with FRP materials. For all of these beams, no transverse steel reinforcement was included, only FRP shear reinforcement. The data indicated that as the longitudinal steel ratio increased, the contribution to shear strength of the FRP reinforcement decreased. However, this argument needs further study because no beams with transverse reinforcement were included in their analysis.
Kobayashi et al. (2004) determined that the right mixing ratio of the two-part epoxy adhesives is extremely important to the overall strength of the FRP system. This is because an inadequate mixing ratio will decrease the strength of the epoxy. Also, the uniformity of mixing is important as well. A locally inadequate mixing ratio will produce weak points in the epoxy adhesive and offer locations of premature failure. Finally, Kobayashi et al. (2004) noted that if an epoxy has reached its pot life, it must be discarded because a decrease in strength might be associated with this adhesive material as well.
Chaallal et al. (2002), Deniaud and Cheng (2003) and Bousselham and Chaallal (2004) all note a size effect when moving from experimentally tested specimens to full scale specimens used in practice. Small scale specimens are particularly problematic (Bousselham & Chaallal, 2004). Chaallal et al. (2002) noted that the differences observed between calculated and experimentally measured strains of large girders used in the study may be associated with the fact that the current design guidelines are based on Triantafillou’s (1998) small slender beams. All of these research studies concluded that full scale tests should be conducted to fully understand the scale factor associated with FRP materials.
2.4 The Need for CFRP anchorage
As discussed earlier, the premature failure of CFRP materials due to debonding is a major concern as research on contribution of CFRP to shear strength continues to progress. Unless a concrete specimen is completely wrapped with carbon fiber sheets, some type of anchorage

21
system must be provided in order to prevent debonding failure. In the course of their experimental studies, many researchers have noted the importance of providing some type of anchorage (mechanical or otherwise) near the ends of the CFRP strips or sheets to prevent this premature debonding failure from occurring (Uji [1992], Khalifa et al. [1999], Khalifa & Nanni [2000], Triantafillou & Antonopoulos [2000], Chen & Teng[2003], Teng et al. [2004], Orton [2007], Kim [2008], Ortega et al. [2009], and Kim & Smith [2009]).
Uji (1992) originally stated that sufficient anchorage of the carbon fiber sheets is required similarly to steel stirrups in order to properly carry the shear force without debonding. However, at the time, this was seen as difficult in all cases except for columns in which wrapping the specimen completely was possible. In many cases, this option is not available when strengthening a concrete beam in shear. Triantafillou and Antonopoulos (2000) recommended that if no access is available to the top side of T-beams, the CFRP sheets should be attached to the compression zone of the concrete element with some type of simple mechanical anchorage device.
When a concrete crack intersects a CFRP “U”-wrap or side bonded strip, the CFRP material may have minimal bonded length above the crack, leading to a sudden debonding failure. When sufficient anchorage is provided, this failure is prevented because the development of strength in the CFRP strip depends solely on the strength of the anchor, not on the bond between the strip and the concrete substrate. This is even more important in negative moment regions, where cracks initiate from the top sides of concrete elements (Khalifa, Alkhrdaji, Nanni, & Lansburg, 1999).
When an anchorage device is utilized in practice, the failure mode of debonding is effectively prevented, changing the failure mode to a more desirable CFRP rupture mode (Teng, Lam, & Chen, 2004; and Khalifa, Alkhrdaji, Nanni, & Lansburg, 1999). It is important to note that when an anchorage device is installed, it does not entirely prevent debonding from occurring along the CFRP strips or sheets; a certain amount of debonding must be encountered in order to effectively engage the anchorage system. However, failure due to debonding is prevented, allowing the CFRP material to experience higher strains, utilizing its full tensile capacity. The use of anchorage allows the CFRP strips to carry load after debonding has occurred, promoting a more ductile response of the strips (Ortega, Belarbi, & Bae, 2009).
Without an anchorage system in place, the strength of the entire strengthening system relies completely on the bond between the CFRP material and the concrete substrate (Uji, 1992). As has been discussed before, relying on bond for developing strength leads to highly variable debonding failures.
2.5 Methods of CFRP anchorage
Providing sufficient anchorage of CFRP strips and sheets is difficult to accomplish. Improper anchorage of the material can create unwanted stress concentrations that will cause the material to fail prematurely. Thus, researchers have developed methods of CFRP anchorage that will develop the full strength of the CFRP laminates. These methods include:
• Threaded anchor rods
• L-shaped CFRP plates
• CFRP straps
• CFRP U-anchors

22
• Continuous and discontinuous CFRP plates
• Modified anchor bolt systems
The following sections will briefly describe the previously mentioned methods.
2.5.1 Threaded anchor rods
Deifalla and Ghobarah (2006) developed an anchorage system that utilizes threaded anchor rods along with steel plates and angles to act as clamps for the CFRP material as seen in Figure 2-17. The location of the clamps depends on the configuration of the CFRP sheets. If a CFRP “U”-wrap is applied to the concrete element, the clamps will be placed through the web of the member (Figure 2-17, left); whereas, if an extended “U”-wrap (Figure 2-17, center) or complete wrap (Figure 2-17, right) is utilized, the clamps are placed through the flange or protruding slab element. In the last two cases, steel angles are provided at locations of reentrant corners to prevent the CFRP from debonding at these locations when an axial tensile load is applied to the sheet. However, this causes some concern regarding corrosion due to steel-carbon fiber contact (Khalifa, Alkhrdaji, Nanni, & Lansburg, 1999).
Figure 2-17 Three possible configurations of the threaded anchor rod system (Deifalla &
Ghobarah, 2006)
Although these clamps prevent debonding of the CFRP strips, installation proves to be difficult and costly. Also, because the clamps extend through the flange in some cases, their effectiveness might be limited to only a few installations, depending on the use of the structure.
2.5.2 L-shaped CFRP plates
Basler et al. (2005) developed another anchorage technique involving CFRP plates bent into an L-shape as seen in Figure 2-18. Because the plates themselves serve as both anchors and the strengthening scheme, the CFRP plates replace the CFRP strips in design.
Figure 2-18 L-shaped CFRP plate (Basler, White, & Desroches, 2005)
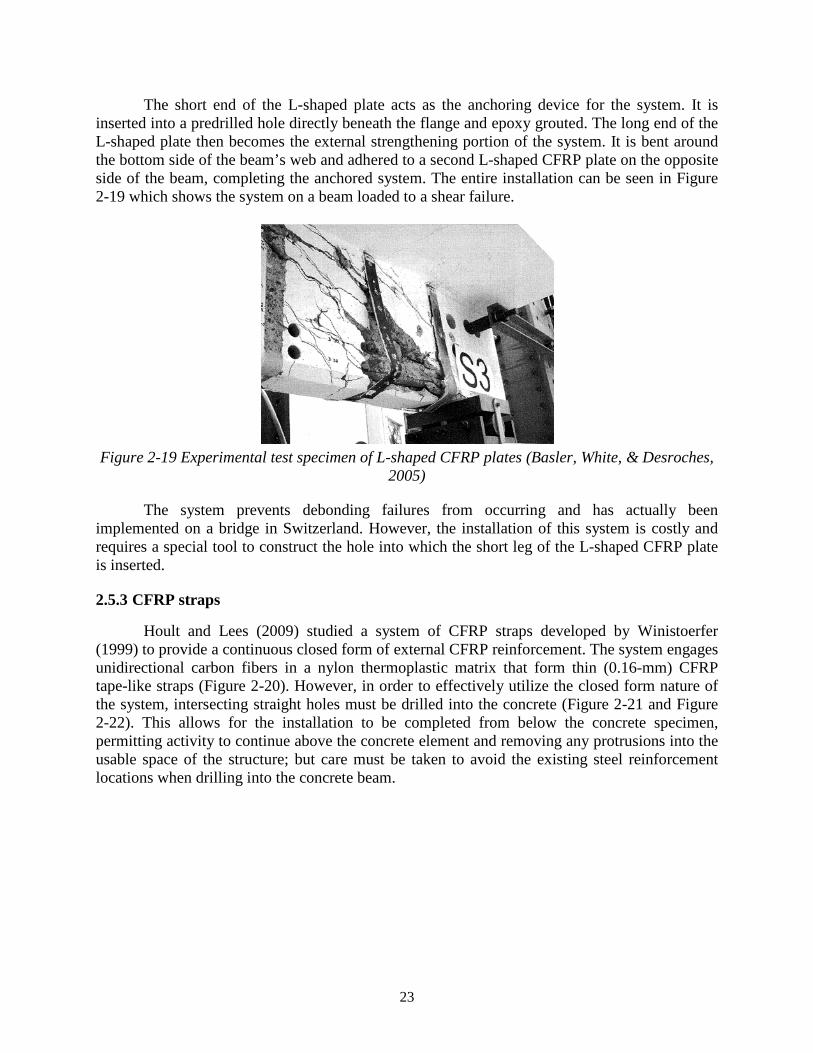
23
The short end of the L-shaped plate acts as the anchoring device for the system. It is inserted into a predrilled hole directly beneath the flange and epoxy grouted. The long end of the L-shaped plate then becomes the external strengthening portion of the system. It is bent around the bottom side of the beam’s web and adhered to a second L-shaped CFRP plate on the opposite side of the beam, completing the anchored system. The entire installation can be seen in Figure 2-19 which shows the system on a beam loaded to a shear failure.
Figure 2-19 Experimental test specimen of L-shaped CFRP plates (Basler, White, & Desroches,
2005)
The system prevents debonding failures from occurring and has actually been implemented on a bridge in Switzerland. However, the installation of this system is costly and requires a special tool to construct the hole into which the short leg of the L-shaped CFRP plate is inserted.
2.5.3 CFRP straps
Hoult and Lees (2009) studied a system of CFRP straps developed by Winistoerfer (1999) to provide a continuous closed form of external CFRP reinforcement. The system engages unidirectional carbon fibers in a nylon thermoplastic matrix that form thin (0.16-mm) CFRP tape-like straps (Figure 2-20). However, in order to effectively utilize the closed form nature of the system, intersecting straight holes must be drilled into the concrete (Figure 2-21 and Figure 2-22). This allows for the installation to be completed from below the concrete specimen, permitting activity to continue above the concrete element and removing any protrusions into the usable space of the structure; but care must be taken to avoid the existing steel reinforcement locations when drilling into the concrete beam.

24
Figure 2-20 Side view of the CFRP strap system (Hoult & Lees, 2009)
Hoult and Lees (2009) note the importance of tying the concrete compression zone to the concrete tension zone when anchoring CFRP strips. This allows for the CFRP strips to carry shear forces in a truss-like mechanism involving steel stirrups and concrete compression struts. The system allows the CFRP straps to be anchored in the compression zone of the reinforced concrete element.
Figure 2-21 Cross section of the CFRP strap system using metallic inserts with a flat bearing
surface (Hoult & Lees, 2009)
Hoult and Lees proposed two different CFRP strap installation techniques. The first is seen in Figure 2-21. As stated previously, this technique requires drilling of holes into the compression zone of the concrete specimen. Once drilled, metallic pads are adhered to the rough edges of concrete exposed by the drilling and the CFRP straps are installed over the metallic pads.

25
Figure 2-22 Cross section of the CFRP strap system using preformed strap profile in grout and
concrete (Hoult & Lees, 2009)
The second technique involves casting preformed grooves into the concrete specimen or forming a groove and injecting grout into holes drilled into the compression zone of the concrete beam (Figure 2-22). This technique offers a smooth curve for the CFRP strap into the compression region of the concrete beam. The CFRP strap system has proven to increase the shear capacity of concrete specimens by 15%–59% (Hoult & Lees, 2009). The increased difficulty of installation diminishes the attractiveness of this anchorage option.
2.5.4 CFRP U-Anchors
Another form of anchorage is the CFRP U-anchor system as depicted in Figure 2-23. To construct this anchorage system, a groove is cut into the concrete element at the intersection between the web and flange. The groove is coated with the adhesive epoxy material recommended by the manufacturer of the CFRP laminates. The CFRP sheet is then installed onto the surface of the beam and a glass FRP rod is used to insert the CFRP sheet into the preformed groove as seen in Figure 2-24. This rod also serves to anchor the sheet to the beam. Finally, an epoxy paste is used to cover the glass FRP rod and to fill the groove so that it is flush with the concrete surface (Khalifa, Alkhrdaji, Nanni, & Lansburg, 1999).
One of the major benefits of this system is that it eliminates the need to drill into the concrete beam, removing any possibility of damaging internal steel reinforcement. To construct the groove, two parallel saw cuts can be made at a predetermined depth. Then, the groove can be completed by chipping out the concrete between the two saw cuts (Khalifa, Alkhrdaji, Nanni, & Lansburg, 1999). The groove can be cut into the concrete coverage area of the beam, avoiding any reinforcement; however, because the grove is not cut into the core of the beam, shear forces cannot be easily transferred to the concrete and surrounding internal steel reinforcement, creating problems with concrete pull-out and breakout failures.

26
Figure 2-23 The CFRP U-Anchor system (Khalifa, Alkhrdaji, Nanni, & Lansburg, 1999)
Figure 2-24 Glass FRP rod used to anchor a CFRP sheet a concrete beam (Khalifa, Alkhrdaji,
Nanni, & Lansburg, 1999)
Tests by Khalifa et al. (1999) and Khalifa and Nanni (2000) indicated that the U-anchor system has performed well. Khalifa et al. (1999) achieved higher strains in the CFRP material at ultimate when the U-anchor system was installed. Also, in testing beams strengthened with CFRP materials anchored with the U-anchor system, no debonding was observed at failure.
Khalifa and Nanni (2000) also performed a test using the U-anchor system in which a flexural failure was observed. The capacity of the beam was increased by 145% as compared to a control specimen and by 42% as compared to a specimen strengthened with unanchored CFRP laminates. However, it is important to note that none of the beams tested by Khalifa and Nanni were reinforced with any internal steel reinforcement. Therefore, these high percentages in increased capacity are likely to decrease with the inclusion of internal reinforcement.
2.5.5 Continuous and discontinuous CFRP plates
Ortega et al. (2009) developed an anchorage system that relies on anchored CFRP plates to prevent debonding of CFRP sheets. Because CFRP plates are used, the risk of galvanic

27
corrosion due to steel-carbon fiber contact is eliminated (Khalifa, Alkhrdaji, Nanni, & Lansburg, 1999). Continuous or discontinuous CFRP plates can be used.
As seen in Figure 2-25 and Figure 2-26, the anchorage system consisted of continuous CFRP plates bonded to the CFRP strips with epoxy and securely anchored to the concrete with wedge anchors and steel bolts. A CFRP plate was placed near the ends of the CFRP strips in an effort to prevent debonding from occurring. A second CFRP plate was installed close to the reentrant corner of the specimen to prevent the debonding associated with the strips’ high tendency to debond at reentrant corners when an axial tension load is applied to the strip.
Figure 2-25 Continuous CFRP plates used to anchor CFRP sheets (Ortega, Belarbi, & Bae,
2009)
Figure 2-26 Schematic elevation view of the continuous CFRP plate anchorage system (Ortega,
Belarbi, & Bae, 2009)
This method of anchorage proved to be ineffective due to the tendency of the continuous CFRP plate to buckle (Figure 2-27). Short embedment lengths of the wedge anchors and steel bolts caused them to pull out from the concrete. Because these wedge anchors and bolts were no longer able to keep the CFRP strips adhered to the beam, severe debonding occurred. Therefore, a new method of anchorage was developed by Ortega et al. (2009) consisting of discontinuous CFRP plates.
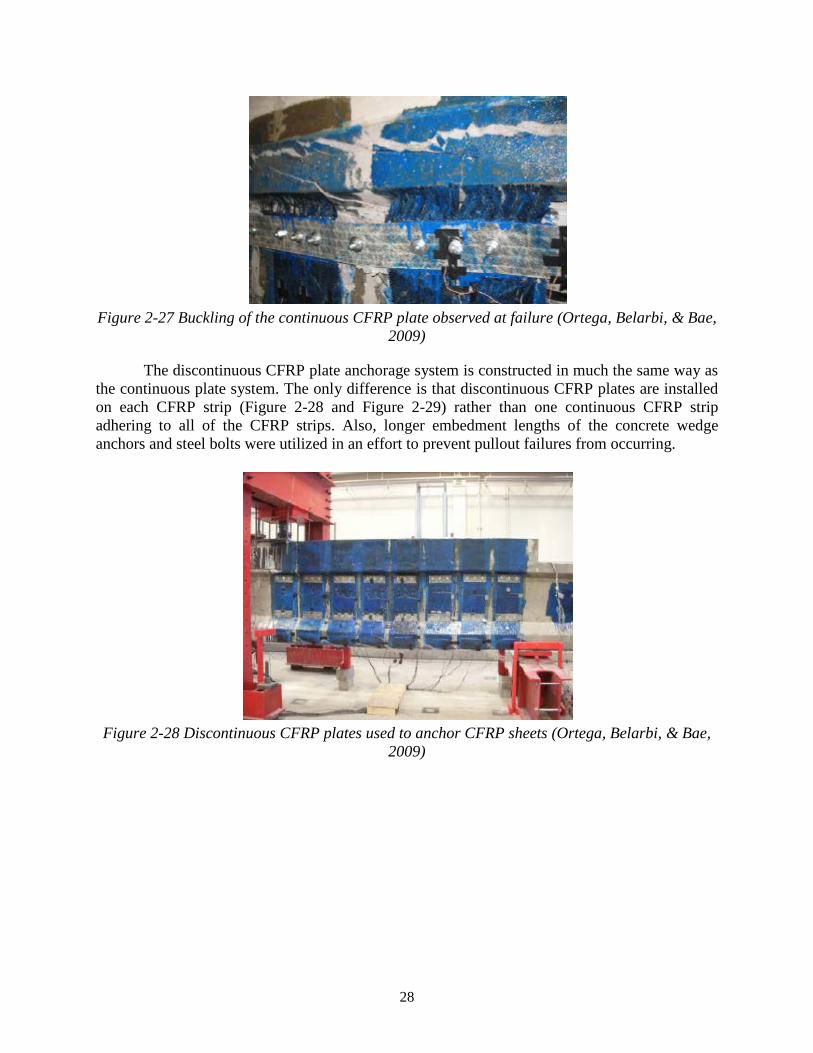
28
Figure 2-27 Buckling of the continuous CFRP plate observed at failure (Ortega, Belarbi, & Bae,
2009)
The discontinuous CFRP plate anchorage system is constructed in much the same way as the continuous plate system. The only difference is that discontinuous CFRP plates are installed on each CFRP strip (Figure 2-28 and Figure 2-29) rather than one continuous CFRP strip adhering to all of the CFRP strips. Also, longer embedment lengths of the concrete wedge anchors and steel bolts were utilized in an effort to prevent pullout failures from occurring.
Figure 2-28 Discontinuous CFRP plates used to anchor CFRP sheets (Ortega, Belarbi, & Bae,
2009)

29
Figure 2-29 Schematic elevation view of the discontinuous CFRP plate anchorage system
(Ortega, Belarbi, & Bae, 2009)
The discontinuous system performed much better than the continuous system. The concrete specimen did not fail until it was loaded to a much higher shear load; however, an interesting failure mode was observed. As seen in Figure 2-30, the CFRP strips slipped out of the anchorage provided by the discontinuous CFRP plates at failure. The CFRP strip might slip from the anchorage device at a load lower than the ultimate failure load. Since this was an undesirable mode of failure, Ortega et al. (2009) developed a modified anchor bolt system.
Figure 2-30 A CFRP strip that has slipped out of the discontinuous anchorage (Ortega, Belarbi,
& Bae, 2009)
2.5.6 Modified anchor bolt system
In order to avoid the slipping mode of failure, a modified anchor bolt system was developed. The system consists of two discontinuous CFRP plates. The CFRP strip is wrapped around the first plate and allowed to overlap the second. This forms a four-layer connection that can then be anchored to the concrete beam with wedge anchors or steel bolts. A cross section of the system can be seen in Figure 2-31 (Ortega, Belarbi, & Bae, 2009).

30
Figure 2-31 3-layer connection of the modified anchor bolt system (Ortega, Belarbi, & Bae,
2009)
The modified anchorage system did not experience the slipping failure mode observed by Ortega et al. (2009) in the discontinuous CFRP plate anchorage system. However, wrapping the CFRP sheet around the CFRP plate at such a tight radius creates stress concentrations in the CFRP strips and might cause rupture of the CFRP to occur before the strength of the CFRP can be reached.
2.6 CFRP Anchors
2.6.1 Overview
CFRP anchors are a relatively new technique used to provide anchorage of CFRP materials (Figure 2-32). Recently a number of experimental studies have been conducted concerning CFRP anchors: Kobayashi et al. (2001), Kobayashi et al. (2004), Özdemir (2005), Orton (2007), Orton et al. (2008), Kim (2008), Kim & Smith (2009), and Ozbakkaloglu & Saatcioglu (2009).
Figure 2-32 CFRP Anchor with a 360 degree fan (Orton, 2007)
Any anchor, regardless of its material composition, is classified by two distinguishing characteristics. The first is its load transfer mechanism that can occur through mechanical interlock, friction, or chemical bond. The second characteristic is the anchor installation. Cast in

31
place anchors, drilled in anchors, or pneumatically installed anchors are examples of typical installation procedures. CFRP anchors are classified as drilled in anchors with a chemical bond load transfer mechanism (Kim & Smith, 2009).
The mechanism of a CFRP anchor is similar to that of an adhesive anchor. An adhesive anchor consists of a threaded rod or reinforcing bar which is inserted into a predrilled hole and anchored with a structural adhesive, such as epoxy, polyester, or vinylester. The CFRP anchor consists of a tight bundle of carbon fibers inserted into a predrilled hole and adhered to the concrete surface with a high strength structural epoxy (Ozbakkaloglu & Saatcioglu, 2009).
The CFRP anchor is constructed out of the same carbon fiber material that is applied to strengthen the concrete member. They are inserted into predrilled holes and fanned out over the CFRP sheets to create a path for tensile load to transfer from the CFRP sheet into the concrete beam. Depending on its orientation, the CFRP anchor can be subjected to different types of forces. These forces can include pull-out forces or shear forces (which also include a pull-out component as the forces are transferred into the predrilled hole). An anchor with a 360 degree fan is shown in Figure 2-32. This type of anchor is typically used in flexural applications and can accept forces from any direction and transfer them into the concrete beam.
Figure 2-33, on the other hand, displays an anchor that is fanned out in only one direction. This type of anchor can be used in both flexural and shear applications in which tensile forces are transferred through the anchor into the concrete element from one direction. In both of these instances, the CFRP anchors are subjected to shear forces. As the shear force is transferred around the bend between the fanned and embedded portions of the anchor, the shear force transitions from a bearing force to a tensile pull-out force which can only be resisted by bond between the concrete hole and the CFRP anchor.
CFRP anchors were first developed by the Shimizu Corporation in Japan and studied by Kobayashi et al. (2001) as a construction technique to provide continuity for CFRP wraps of columns in cases where concrete infill walls were preventing the columns from being completely wrapped with CFRP material. Kobayashi noticed that the CFRP anchors effectively provided continuity to the columns in the cases mentioned.
Figure 2-33 CFRP Anchor with a fan in one direction (Pham, 2009)
Orton (2007) and Kim (2008) both researched CFRP anchors and their effectiveness at providing continuity to the exterior frames of buildings vulnerable to progressive collapse. Previous building codes did not require that continuous reinforcement be provided through the column/beam intersection in buildings. This created a vulnerability to progressive collapse as the ductility of the framing system was limited without continuous reinforcement. Orton and Kim
Concrete
CFRP Anchor
CFRP SheetConcrete

32
developed a reinforcement detail that consisted of CFRP sheets and CFRP anchors that provided the necessary continuity.
Orton and Kim noticed that the strains developed within the CFRP sheets were considerably higher when the CFRP sheets were installed with CFRP anchors as compared to installations without CFRP anchors. Also, in an experiment done by both Orton and Kim, clear plastic wrap was placed on the concrete surface before installing the CFRP sheets. The plastic wrap effectively eliminated all bond between the CFRP sheets and the concrete substrate, forcing the system to rely solely on the CFRP anchors for strength. During testing, the CFRP sheets reached their full tensile strain capacity, eventually failing by CFRP rupture. The tests demonstrated that the CFRP anchors alone could develop the ultimate tensile capacity of the CFRP sheets, regardless of the quality of surface preparation before installation.
Research on the strength and behavior of the CFRP anchors is limited. Therefore, current design procedures concerning CFRP anchors are often left to recommendations rather than experimentally produced equations.
2.6.2 CFRP anchor details
CFRP anchors were used to improve the performance of CFRP sheets. The following parameters have been found to influence the strength of anchor and sheet installation: 1) depth of hole, 2) hole chamfer radius, 3) amount of CFRP material in anchors, 4) diameter of hole, 5) fan length, 6) fan angle, and 7) corner chamfer radius. See Figures 2-34 and 2-35.
Figure 2-34 The CFRP anchor detail (used in this project)
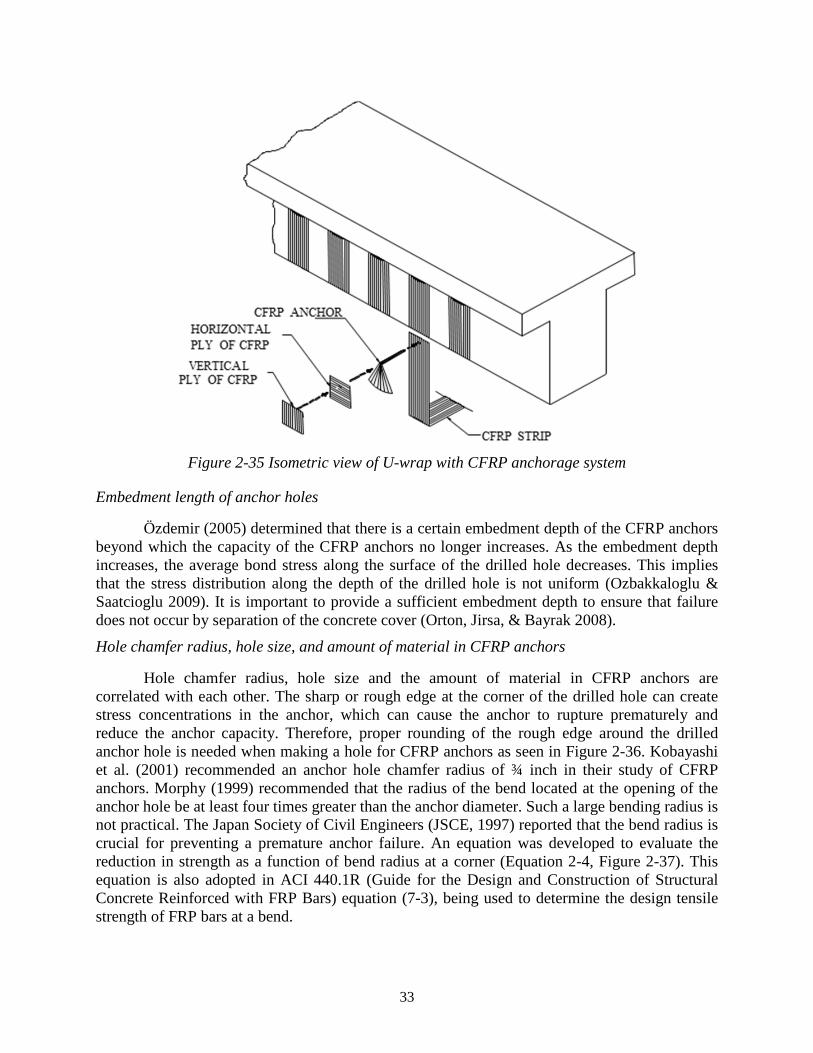
33
Figure 2-35 Isometric view of U-wrap with CFRP anchorage system
Embedment length of anchor holes
Özdemir (2005) determined that there is a certain embedment depth of the CFRP anchors beyond which the capacity of the CFRP anchors no longer increases. As the embedment depth increases, the average bond stress along the surface of the drilled hole decreases. This implies that the stress distribution along the depth of the drilled hole is not uniform (Ozbakkaloglu & Saatcioglu 2009). It is important to provide a sufficient embedment depth to ensure that failure does not occur by separation of the concrete cover (Orton, Jirsa, & Bayrak 2008).
Hole chamfer radius, hole size, and amount of material in CFRP anchors
Hole chamfer radius, hole size and the amount of material in CFRP anchors are correlated with each other. The sharp or rough edge at the corner of the drilled hole can create stress concentrations in the anchor, which can cause the anchor to rupture prematurely and reduce the anchor capacity. Therefore, proper rounding of the rough edge around the drilled anchor hole is needed when making a hole for CFRP anchors as seen in Figure 2-36. Kobayashi et al. (2001) recommended an anchor hole chamfer radius of ¾ inch in their study of CFRP anchors. Morphy (1999) recommended that the radius of the bend located at the opening of the anchor hole be at least four times greater than the anchor diameter. Such a large bending radius is not practical. The Japan Society of Civil Engineers (JSCE, 1997) reported that the bend radius is crucial for preventing a premature anchor failure. An equation was developed to evaluate the reduction in strength as a function of bend radius at a corner (Equation 2-4, Figure 2-37). This equation is also adopted in ACI 440.1R (Guide for the Design and Construction of Structural Concrete Reinforced with FRP Bars) equation (7-3), being used to determine the design tensile strength of FRP bars at a bend.

34
Figure 2-36 CFRP anchor holes before and after making hole chamfer
𝒇𝒇𝒃 = (𝟎.𝟑 + 𝟎.𝟎𝟗 𝒓𝒃𝒅𝒃
)𝒇𝒇𝒖 (Eq. 2-4) where 𝑓𝑓𝑏 = design tensile strength of the bend of FRP bar, psi (MPa); 𝑟𝑏 = radius of the bend, in. (mm); 𝑑𝑏 = diameter of reinforcing bar, in. (mm); and 𝑓𝑓𝑢 = design tensile strength of FRP, considering reductions for environment,
psi (MPa). Limited research on FRP hooks (Ehsani et al. 1995) indicates that the tensile force
developed by the bent portion of a GFRP bar is mainly influenced by the ratio of the bend radius to the bar diameter rb/db, the tail length, and, to a lesser extent, the concrete strength (ACI440.1R). This equation is not intended for CFRP anchors but is useful for understanding the factors influencing the required anchor bend radius. According to this equation, the design tensile strength at the bend of a FRP bar will be lower than the design tensile strength of the FRP material. In this experimental program, a hole diameter of 7/16 in. with a bend radius of ½ in. was used. From the equation, only 40 percent of full capacity of CFRP anchors can be mobilized. For this reason, the amount of FRP material for CFRP anchors was at first increased 50% and then doubled (see Chapter 3 for details).
As shown in Figure 2-37, tensile strength is less sensitive to bend radius as the diamenter of the hole increases, which means that the strength variation due to a change in bend radius is negligible for large-diameter hole. In addition, the strength variabtion is also negligible within the typical range of hole diameters used in this study; hole diameter is directly related to the amount of material (shaded in Figure 2-37). That is the why the hole chamfer radius was kept constant in this study regardless of the change in the amount of material.

35
Figure 2-37 Reduction in capacity due to diameter and bend radius (Eq. [2-4])
For design, the amount of material in a CFRP anchor can be determimed by the amount of CFRP material in the sheet. Kim (2008) and Orton (2007) recommended that the amount of material in the CFRP anchor be 1.5 to 2 times the amount of material in the CFRP sheet. To accommodate the amount of FRP material in the anchor area, the area of hole was increased by 40% as recommended by Kim (2008). A hole diameter that was too small or too large would make installation of the anchor more difficult and would create quality control problems.
Fan length and fan angle
The total required length of a CFRP anchor is the sum of the embedment depth of the anchor and the fan length of the anchors. The fan length depends on the required bond strength between the fan and the main sheet and on the fan angle. The maximum load resisted by the anchorage system increases as the length of the anchorage fan increases (Kobayashi et al, 2001). The CFRP anchor must be long enough to allow the fan to cover the width of CFRP sheet. The fan should extend 0.5 in. beyond the strip width as shown in Figure 2-34.
Kobayashi et al. (2001) recommended that the angle of the CFRP anchor fan be limited to less than 90 degrees. A fan angle of 60 degrees was used in this experimental study (see Figure 2-38).
Figure 2-38 Anchor detail according to the different fan angles
0
0.2
0.4
0.6
0.8
1
0 0.2 0.4 0.6 0.8 1
fb/f
fu
diameter (db , inch)
rb=0.5 inrb=0.25 inrb=0.75 in

36
Overlapping length
Kobayashi et al. (2001) recommended that the overlapping length of 4 in. (100-mm) or more between the anchorage fans of adjacent anchors to reduce stress concentrations in the center of the CFRP sheets and to increase the efficiency of CFRP anchors when multiple anchors are installed on the same CFRP sheet. Kim (2008) recommended that the overlaping length be at least 0.5 in.
Corner chamfer radius
ACI 440 recommended a corner chamfer of 0.5 in. radius to minimize stress concentrations at concrete corners.
Number of CFRP anchors
The number of CFRP anchors per strip depends on the amount of material in the CFRP anchor. Orton et al. (2008) observed that the use of a larger number of smaller anchors was more effective in developing the full tensile capacity of CFRP sheets under the same amount of total material. However, a small number of CFRP anchors are preferable for ease of installation. A compromise between ease of installation and efficiency of the anchor should be achieved. Kobayashi et al. (2001) recommended the distance between anchors be less than 8 in. (200 mm).
Additional anchor patches
Kobayashi et al. (2001) recommend the use of a horizontal ply of fibers under the CFRP anchors. These patches were applied after several tests because some CFRP anchors failed before the CFRP sheets ruptured.
2.7 Shear Strengthening Using CFRP
2.7.1 Previous studies of shear strengthening
To date, there is no unique theory available to evaluate the shear behavior of FRP strengthened beams. Most researchers have defined the contribution of the FRP to shear strength as the product between the effective stress in FRP, the area of the FRP, partial reduction factors that intend to take into account the quality of material and/or workmanship, and a geometrical factor depending on the type of strengthening system used, as well as fiber inclination with respect to the beam longitudinal axis (Sas et al. 2009).
Triantafillou (1998) and Triantafillou and Antonopoulos (2000) developed a model based on regression analysis and truss analogy. They developed different effective FRP strain equations with respect to the type of strengthening schemes. Triantafillou (1998) and Khalifa et al. (1998) modified the conventional shear equation with a modified effective strain, which is the product of a reduction factor and rupture strain. This reduction factor was applied to both fiber rupture and debonding failure. Pellegrino and Modena (2006) continued to study this model and modified the reduction factor. Chen and Teng (2001, 2003 a, b) developed a reduction factor for the FRP stress using a truss model. The reduction factor was different for FRP rupture or FRP debonding. They stressed the importance of non-uniform strain distribution in the material. Diniaud and Cheng (2001, 2004) used modified shear friction with different crack patterns for the flange and web of T-beams. Zhang and Hsu (2005) proposed a shear bond model derived by

37
curve fitting and different bond mechanisms. They concluded that debonding dominates over tensile rupture of CFRP laminates as they become thicker and stiffer, thus the effective strain needs to be reduced with increasing amount of FRP. Sas et al. (2009) studied existing shear models and compared computed values with an experimental database. They stated that the results of the comparison were not very promising and that using a shear contribution for the FRP based on existing shear design equations should be questioned. However, it is adopted in present guidelines despite such inadequacy. More viable and reliable models continue to be needed. They also stated that many studies have calibrated models with data from laboratory specimens that had unrealistic geometric conditions.
2.7.2 ACI 440.2R
ACI 440.2R is the most widely used guideline for externally bonded FRP systems. The design recommendations in ACI 440.2R-08 are based on limit-states design principles and are compatible with ACI 318-05. This approach sets acceptable levels of safety for the occurrence of both serviceability limit states (excessive deflections and cracking) and ultimate limit states (failure, stress rupture, and fatigue). FRP-related reduction factors were calibrated to produce reliability indexes typically above 3.5.
Wrapping schemes
Figure 2-39 shows three types of FRP wrapping schemes used to increase the shear strength. Completely wrapping the FRP system around the section on all four sides is the most efficient wrapping scheme and is most commonly used in column applications where access to all four sides is usually available. In beam applications where an integral slab makes it impractical to completely wrap the member, the shear strength can be improved by wrapping the FRP system around three sides of the member (U-wrap) or bonding to two opposite sides of the member. The three-sided U-wrap is less efficient than a complete wrap and bonding to two sides is the least efficient scheme (ACI 440.2R).
Completely wrapped U-wrap 2-sides bonded
(a) Contact-critical application (b) Bond-critical application
Figure 2-39 Wrapping schemes in shear applications
Nominal shear strength
The design equations for FRP shear strengthening (ACI 440.2R) are adapted from shear strength equations of ACI 318-05. FRP shear contribution is evaluated in the same manner as for steel except that an effective FRP stress is used instead of a yield stress. The effective stress used is based on an effective strain that can be developed in the FRP sheets and depends on the wrapping scheme (Figure 2-39). ACI 440.2R shear provisions are summarized in Figure 2-40 and Figure 2-41.
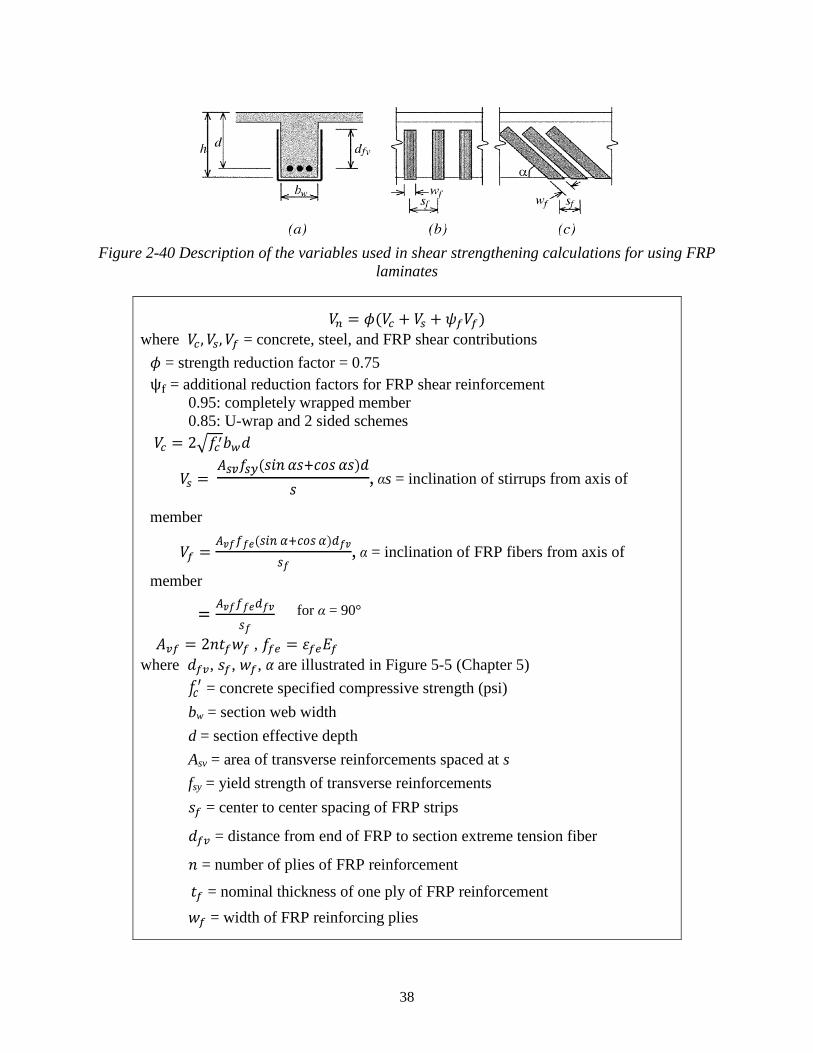
38
Figure 2-40 Description of the variables used in shear strengthening calculations for using FRP
laminates
𝑉𝑛 = 𝜙(𝑉𝑐 + 𝑉𝑠 + 𝜓𝑓𝑉𝑓) where 𝑉𝑐,𝑉𝑠,𝑉𝑓 = concrete, steel, and FRP shear contributions 𝜙 = strength reduction factor = 0.75 ψf = additional reduction factors for FRP shear reinforcement
0.95: completely wrapped member 0.85: U-wrap and 2 sided schemes
𝑉𝑐 = 2�𝑓𝑐′𝑏𝑤𝑑
𝑉𝑠 = 𝐴𝑠𝑣𝑓𝑠𝑦(𝑠𝑖𝑛 𝛼𝑠+𝑐𝑜𝑠 𝛼𝑠)𝑑
𝑠, αs = inclination of stirrups from axis of
member
𝑉𝑓 = 𝐴𝑣𝑓𝑓𝑓𝑒(𝑠𝑖𝑛 𝛼+𝑐𝑜𝑠 𝛼)𝑑𝑓𝑣𝑠𝑓
, α = inclination of FRP fibers from axis of
member
= 𝐴𝑣𝑓𝑓𝑓𝑒𝑑𝑓𝑣𝑠𝑓
𝐴𝑣𝑓 = 2𝑛𝑡𝑓𝑤𝑓 , 𝑓𝑓𝑒 = 𝜀𝑓𝑒𝐸𝑓 where 𝑑𝑓𝑣, 𝑡𝑓, 𝑤𝑓, 𝛼 are illustrated in Figure 5-5 (Chapter 5)
𝑓𝑐′ = concrete specified compressive strength (psi) bw = section web width d = section effective depth Asv = area of transverse reinforcements spaced at s fsy = yield strength of transverse reinforcements 𝑡𝑓 = center to center spacing of FRP strips
𝑑𝑓𝑣 = distance from end of FRP to section extreme tension fiber
𝑛 = number of plies of FRP reinforcement
𝑡𝑓 = nominal thickness of one ply of FRP reinforcement 𝑤𝑓 = width of FRP reinforcing plies
for α = 90°

39
(2-sides bonded)
𝐸𝑓 = tensile modulus of elasticity of FRP
𝜀𝑓𝑒 = effective strain level in FRP reinforcement attained at failure 𝜀𝑓𝑒= 0.004 ≤ 0.75𝜀𝑓𝑢 (completely wrapped members) 𝜀𝑓𝑒= κv𝜀𝑓𝑢 ≤ 0.004 (Bonded U-wraps or bonded face plies) 𝜀𝑓𝑢 = ultimate strain capacity of CFRP reinforcement
𝜅𝑣 = 𝑘1𝑘2𝐿𝑒468𝜀𝑓𝑢
≤ 0.75
𝐿𝑒 = 2500(𝑛𝑓𝑡𝑓𝐸𝑓)0.58 , 𝑘1 = � 𝑓𝑐′
4000�2/3
, 𝑘2 = �
𝑑𝑓𝑣−𝐿𝑒𝑑𝑓𝑣
𝑑𝑓𝑣−2𝐿𝑒𝑑𝑓𝑣
where 𝐿𝑒 = active bond length (in.) 𝑛𝑓 = modular ratio of elasticity between FRP and concrete (=𝐸𝑓/𝐸𝑐)
𝑡𝑓 = nominal thickness of one ply of FRP reinforcement (in.)
Figure 2-41 Shear strength using procedures of ACI 440.2R
Effective strain in FRP laminates
ACI 440.2R defines the FRP effective strain as the maximum strain that can be achieved in the FRP system at nominal strength. That strain is governed by the failure mode of the FRP system and of the strengthened reinforced concrete member. The following subsections provide guidance on determining the effective strain for different configurations of FRP laminates used for shear strengthening of reinforced concrete members.
Completely wrapped members—For reinforced concrete column and beam members completely wrapped by FRP, loss of aggregate interlock of the concrete has been observed to occur at fiber strains less than the ultimate fiber strain. To preclude this mode of failure, the maximum strain used for design is limited to 0.004 for members that can be completely wrapped with FRP. This strain limitation is based on testing (Priestley et al.1996) and experience. Higher strains should not be used for FRP shear-strengthening applications.
Bonded U-wraps or bonded face plies—FRP systems that do not enclose the entire section (two-sided wraps and U-wraps) have been observed to delaminate from the concrete before the loss of aggregate interlock of the section (if not properly anchored). For this reason, bond stresses have been analyzed to determine the usefulness of these systems and the effective strain level that can be achieved (Triantafillou, 1998a). The effective strain is calculated using a bond-reduction coefficient (𝜅𝑣) applicable to shear. The bond-reduction coefficient is a function of the concrete strength (𝑓𝑐′), the type of wrapping scheme used (k2), and the stiffness of the laminate (𝐿𝑒-active bond length). (Khalifa et al. 1998)
Reinforcement limits
The total shear strength provided by reinforcement should be taken as the sum of the contribution of the FRP shear reinforcement and the steel shear reinforcement. The sum of the shear strengths provided by the shear reinforcement should be limited based on the criteria given
(U-wraps)

40
for steel (ACI 440.2R-08 refers to ACI 318-05, Section 11.5.6.9). This limit is stated in Equation 2-5.
𝑽𝒔 + 𝑽𝒇 ≤ 𝟖�𝒇𝒄′ 𝒃𝒘𝒅 (Eq. 2-5)
Mechanical anchorage
Mechanical anchorages can be used at termination points to develop larger tensile forces (Khalifa et al. 1999). The effectiveness of such mechanical anchorages, along with the level of tensile stress they can develop, should be substantiated through representative physical testing. In no case, however, should the effective strain allowed in FRP laminates exceed 0.004.
Mechanical anchorages can be effective in increasing stress transfer (Khalifa et al. 1999), although their efficacy is believed to result from their ability to resist the tensile normal stresses rather than in enhancing the interfacial shear capacity (Quattlebaum et al. 2005). Limited data suggest a modest increase in FRP strain at debonding can be achieved with the provision of transverse anchoring FRP wraps (Reed et al. 2005). The performance of any anchorage system should be substantiated through testing.
Development length
The bond capacity of FRP is developed over a critical length (ldf). To develop the effective FRP stress at a section, the available anchorage length of FRP should exceed the value given by Equation 2-6 (Teng et al. 2001). (see Figure 2-41 for definition of terms).
𝑙𝑑𝑓 = 0.057�𝑛𝐸𝑓𝑡𝑓
�𝑓𝑐′ (Eq. 2-6)
FRP strip spacing
For external FRP reinforcement in the form of discrete strips, the center-to-center spacing between the strips should not exceed the sum of d/4 plus the width of the strip. This limitation requires that a minimum number of FRP strips cross the critical section.
Existing substrate strain
ACI 440.2R has a limitation on existing substrate strain. Unless all loads on a member, including self-weight and any prestressing forces, are removed before installation of FRP reinforcement, the substrate to which the FRP is applied will be strained. These strains should be considered as initial strains and should be excluded from the strain in the FRP (Arduini and Nanni 1997; Nanni and Gold 1998). The initial strain level on the bonded substrate can be determined from an elastic analysis of the existing member, considering all loads that will be on the member during the installation of the FRP system. The elastic analysis of the existing member should be based on cracked section properties.
2.7.3 NCHRP Report 655 (2010)
This Guide Specification summarizes the research conducted in NCHRP Project 10-73 to develop a guide for the design of externally bonded FRP composite systems for repair and strengthening of reinforced and prestressed concrete highway bridge elements. The Guide Specification is presented in a format resembling that of the AASHTO LRFD Bridge Design
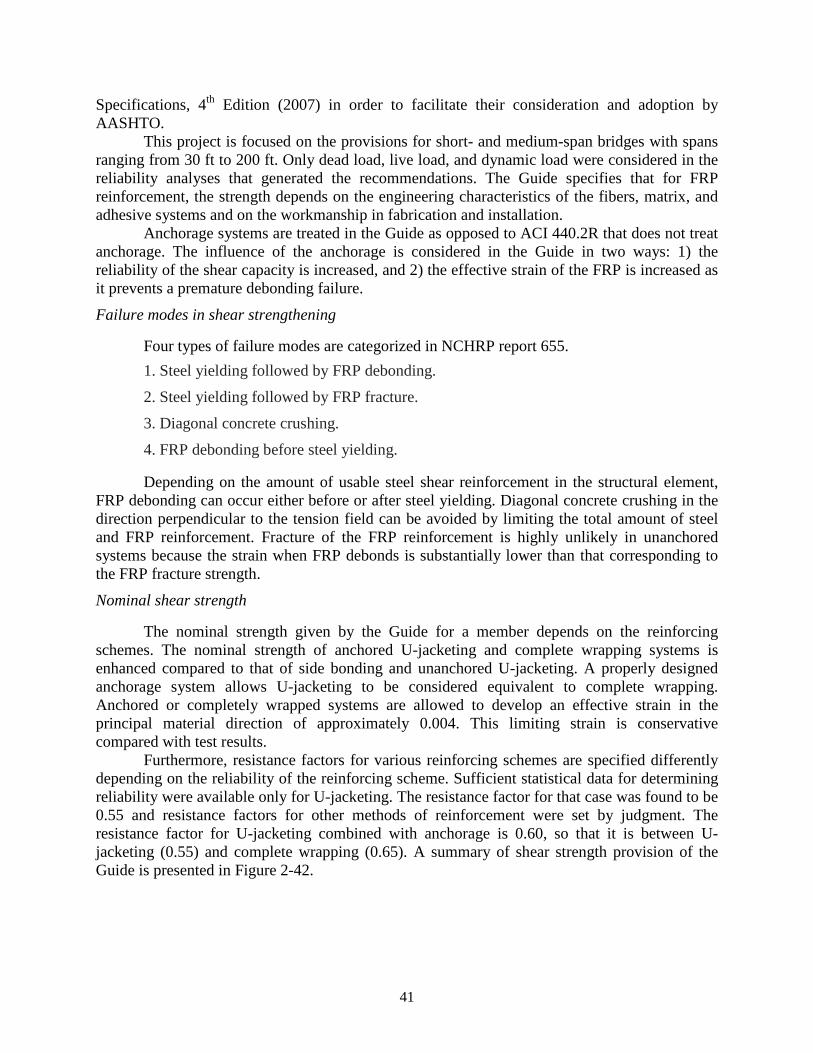
41
Specifications, 4th Edition (2007) in order to facilitate their consideration and adoption by AASHTO.
This project is focused on the provisions for short- and medium-span bridges with spans ranging from 30 ft to 200 ft. Only dead load, live load, and dynamic load were considered in the reliability analyses that generated the recommendations. The Guide specifies that for FRP reinforcement, the strength depends on the engineering characteristics of the fibers, matrix, and adhesive systems and on the workmanship in fabrication and installation.
Anchorage systems are treated in the Guide as opposed to ACI 440.2R that does not treat anchorage. The influence of the anchorage is considered in the Guide in two ways: 1) the reliability of the shear capacity is increased, and 2) the effective strain of the FRP is increased as it prevents a premature debonding failure.
Failure modes in shear strengthening
Four types of failure modes are categorized in NCHRP report 655.
1. Steel yielding followed by FRP debonding.
2. Steel yielding followed by FRP fracture.
3. Diagonal concrete crushing.
4. FRP debonding before steel yielding.
Depending on the amount of usable steel shear reinforcement in the structural element, FRP debonding can occur either before or after steel yielding. Diagonal concrete crushing in the direction perpendicular to the tension field can be avoided by limiting the total amount of steel and FRP reinforcement. Fracture of the FRP reinforcement is highly unlikely in unanchored systems because the strain when FRP debonds is substantially lower than that corresponding to the FRP fracture strength.
Nominal shear strength
The nominal strength given by the Guide for a member depends on the reinforcing schemes. The nominal strength of anchored U-jacketing and complete wrapping systems is enhanced compared to that of side bonding and unanchored U-jacketing. A properly designed anchorage system allows U-jacketing to be considered equivalent to complete wrapping. Anchored or completely wrapped systems are allowed to develop an effective strain in the principal material direction of approximately 0.004. This limiting strain is conservative compared with test results.
Furthermore, resistance factors for various reinforcing schemes are specified differently depending on the reliability of the reinforcing scheme. Sufficient statistical data for determining reliability were available only for U-jacketing. The resistance factor for that case was found to be 0.55 and resistance factors for other methods of reinforcement were set by judgment. The resistance factor for U-jacketing combined with anchorage is 0.60, so that it is between U-jacketing (0.55) and complete wrapping (0.65). A summary of shear strength provision of the Guide is presented in Figure 2-42.
42
𝑉𝑛 = 𝜙�𝑉𝑐 + 𝑉𝑠 + 𝑉𝑝� + 𝜙𝑓𝑟𝑝𝑉𝑓𝑟𝑝
𝑉𝑐 + 𝑉𝑠 ≤ 0.25𝑓𝑐′𝑏𝑣𝑑𝑣 (AASHTO provision) 𝜙 = 0.9 ( defined as AASHTO ) 𝜙𝑓𝑟𝑝 is a resistance factor, defined as follows:
0.40 for side bonding shear reinforcement; 0.55 for U-jacketing; 0.60 for U-jacketing combined with anchorages; 0.65 for complete wrapping.
𝑉𝑓𝑟𝑝 = 𝑁𝑓𝑟𝑝𝑒 𝑤𝑓(𝑠𝑖𝑛 𝛼+𝑐𝑜𝑠 𝛼)𝑑𝑓
𝑠𝑓=
𝑁𝑓𝑟𝑝𝑒 𝑤𝑓𝑑𝑓𝑠𝑓
* continuous FRP (𝑤𝑓 = 𝑡𝑓)
a) For side bonding and U-jacketing 𝑁𝑓𝑟𝑝𝑒 = 𝑁𝑠
b) For u-jacketing combined with anchorage
𝑁𝑓𝑟𝑝𝑒 = 𝑁𝑠 + 𝑘𝑎12�𝑁𝑓𝑟𝑝,𝑤 − 𝑁𝑠�
c) For completely wrapping (closed jackets)
𝑁𝑓𝑟𝑝𝑒 = 𝑁𝑠 +12�𝑁𝑓𝑟𝑝,𝑤 − 𝑁𝑠�
𝑁𝑓𝑟𝑝𝑒 = effective strength per unit width of the FRP reinforcement 𝑁𝑠 = FRP tensile strength /1-in width corresponding to a tensile strain of 0.004 𝑁𝑓𝑟𝑝,𝑤𝑒 = the tensile strength of a closed(wrapped) jacket applied to a member of
radius at the corners of the cross section not less than ½ in., defined as: 𝑁𝑓𝑟𝑝,𝑤𝑒 = 0.5𝑁𝑢𝑡 ≥ 𝑁𝑠
𝑁𝑢𝑡 = nominal tensile strength of the FRP reinforcement; ka = 1 ; If the anchorage system is engineered in accordance with Articles D.3 and D.4
of Appendix D in ACI Standard 318-05; Otherwise, ka =0
Figure 2-42 Shear calculation equations and procedures (NCHRP report 655)
2.7.4 NCHRP Report 678 (2011)
Recently, NCHRP report 678 “Design of FRP Systems for Strengthening Concrete Girders in Shear” was published. This report identifies the parameters affecting the behavior of systems strengthened with FRP from a database of reported test results and presents design provisions for shear strengthening with externally bonded FRP systems. Existing shear models were summarized and a statistical evaluation of existing models was conducted using the database.
An experimental program was developed to further study parameters that were considered to have not been sufficiently investigated in earlier tests, including the effects of pre-cracking, continuity (negative moment), long-term conditioning (such as fatigue loading and
(α=90°)

43
corrosion of internal steel reinforcement), and prestressing. The experimental program included full-scale tests on RC T-beams and AASHTO type PC I-girders because most current design equations used in design specifications are based on small-scale test results.
Evaluation of existing design methods
The existing models were divided into four groups based on their approaches: 1) Models relying on an empirically determined value of FRP strain/stress from which
the shear contribution of the FRP is determined.
2) Models based on the determination of an effective FRP strain.
3) Models focused on the non-uniformity of the strain distribution in externally bonded FRP reinforcements.
4) Models of mechanics-based theoretical approaches that do not rely on experimental results for regression or calibration.
An assessment of the existing design methods found significant differences in the magnitude of the FRP shear contribution calculated by various design methods. This assessment revealed the deficiencies of the existing design methods in predicting the shear resistance of a wide range of girders.
Statistical evaluation of the influence of FRP configurations
The frequency of occurrence of each mode of failure for different FRP configurations (side bonding, U-wrap, or complete wrap), as determined from examination of the database information, is illustrated in Figure 2-43. The figure indicates that (a) debonding is the dominant mode of failure for beams strengthened with FRP and bonded on the sides only, (b) FRP debonding almost never occurs in beams retrofitted with complete FRP wrap and U-wraps with anchorage systems, and (c) failure of beams retrofitted with U-wraps occurs by debonding (65%) or by other failure modes (35%), such as diagonal tension failure in the web, shear compression failure in the compression zone, and flexural failure.
Figure 2-43 Frequency of occurrence of failure mode related to strengthening scheme (NCHRP
report 678 2011)
Complete Wrap seems to include U-wraps with
anchorage systems

44
Proposed new design equations
New shear design equations for predicting the shear contribution of externally bonded FRP systems were developed and calibrated.
As shown in Figure 2-44, the effective FRP strain used in evaluating the FRP shear contribution can be expressed by two separate design expressions, each considering one of the two predominant failure modes (i.e., debonding and FRP rupture). One expression is for members in which sufficient anchorage is provided (FRP rupture failure mode), and the other is for members in which insufficient anchorage is provided (FRP debonding failure mode).
𝑉𝑓 = 𝐴𝑓𝑓𝑓𝑒𝑑𝑓𝑠𝑓
, 𝑓𝑓𝑒 = 𝜀𝑓𝑒𝐸𝑓
1) FRP rupture “full-anchorage” : Complete Wrap or U-Wrap with Anchors 𝜀𝑓𝑒 = 𝑅𝜀𝑓𝑢 , 𝜀𝑓𝑢 = 𝑓𝑓𝑢 𝐸𝑓⁄
𝑅 = 4(𝜌𝑓𝐸𝑓) −0.67 2) FRP debonding or another mode of failure before FRP rupture : Side bonding or U-Wrap εfe = Rεfu ≤ 0.012
R = 3(ρfEf) −0.67 where 𝜌𝑓𝐸𝑓is in ksi units and limited to 300 ksi. * Spacing requirement is the same as AASHTO 5.8.2.7
Figure 2-44 Proposed shear equations for evaluating FRP contribution in NCHRP 678
Suggestions for further research
1) An interaction exists between the internal transverse steel reinforcement and externally bonded FRP shear reinforcement, but there are insufficient data to quantify this interaction. Further investigations are needed to better quantify the mechanisms involved in this interaction and incorporate it into an enhanced model for the shear resistance of RC beams strengthened with externally-bonded FRP.
2) The use of mechanical anchorage involving discontinuous CFRP plates attached with steel concrete wedge anchors or bolts through the web was found to delay or, in some cases, prevent debonding of FRP. However, because these anchors and bolts are susceptible to corrosion, research is needed to explore alternative mechanical anchorage techniques that are not susceptible to such corrosion.
3) The cross-sectional geometry of precast girders influences the effectiveness of externally bonded FRP. Also thin web and stiff flange geometry reduce the effectiveness of the FRP shear strengthening. However, limited results are available to fully understand the mechanisms involved in such behavior. Further research is needed to examine the effect of cross sectional geometry of girders.
4) The effective strain concept was adopted for design guidelines and codes to provide a simple and practical method for estimating the shear contribution of FRP. Research is needed to
45
investigate the effect of non-uniform FRP distribution and to develop more reliable design equations.
5) Research is needed to investigate the long-term fatigue performance of FRP systems for shear strengthening, particularly the effects of cracks on bond characteristics.
2.7.5 Other guidelines discussed in NCHRP 678
In addition to ACI 440.2R and NCHRP 655, other guidelines were also investigated. In the Canadian Design and Construction of Building Composites with Fiber Reinforced
Polymers (CAN/CSA S806 2002), the equations are based on the simplified method for shear design used in the concrete design code (CAN/CSA A23.3 1994), which is limited to the usual cases of shear reinforcement (including FRP) perpendicular to the longitudinal axis of beams. The ultimate strain is limited to 0.004 for failure due to FRP rupture and 0.002 for bond critical applications.
The British Concrete Society Technical Report 55, Design Guidelines on Strengthening Concrete Structures Using Fiber Composite Materials (Concrete Society 2004), is similar to fib-Bulletin 14 (fib-TG9.3 2001) in approach and scope; however it addresses construction issues associated with the use of externally bonded FRP materials. Externally bonded FRP strips are treated using a 45-degree truss analogy. The strain in the FRP is limited to one half of the ultimate design strain for FRP rupture failure. For debonding failure, British Concrete Society Technical Report 55 adopts an equation proposed by Neubauer and Rostasy (1997); the strain is limited to 0.004 for all cases.
2.8 Fatigue Behavior of CFRP Strengthened Specimens
Most of the research on the performance of Carbon Fiber Reinforced Polymers (CFRP) has been conducted on specimens loaded monotonically. Recently, some attention has been given to the behavior of CFRP under fatigue loading. Performance in fatigue is important due to the fact that many structures strengthened with CFRP will be implemented in applications where there is a fluctuation in live loads due to traffic flow or building occupancy. Harries, Reeve, and Zorn (2007) observed that beams loaded more than 2,000,000 cycles failed at lower loads compared to similar beams loaded monotonically.
In terms of fatigue loading, two major areas affect the performance of specimens strengthened using CFRP, 1) interaction between internal steel and CFRP and 2) the degradation of bond between CFRP and the concrete surface.
2.8.1 Interaction between internal steel and CFRP
In structures strengthened using CFRP, a composite section is created with the CFRP carrying some of the load being applied to the structure. This results in lower strains in the internal transverse reinforcement. When considering the fatigue performance of reinforced concrete beams strengthened with CFRP, proper attention needs to be given to the fatigue capacity of the component parts. “The fatigue capacity of a composite beam is limited by the fatigue capacity of its component parts” (Hoult & Lees, 2005). They suggest that the unstrengthened specimen needs to be evaluated to ensure that the internal steel has not already reached its fatigue life. CFRP is a very resilient material under fatigue loading. In all cases where
46
failure occurred prior to the loss of bond between the concrete surface and the CFRP laminate, fatigue failure was observed to be controlled by the fracture of steel stirrups (Harries, Reeve, & Zorn, 2007).
Reinforced concrete beams strengthened with FRP have an increased fatigue life due to the FRP “relieving the stress demand on the existing steel” (Aidoo, Harries, & Petrou, 2004). Ferrier, Bigaud, Clement, & Hamelin (2011) observed a 40% increase in service load in beams strengthened using FRP composites, where service load is defined by the load producing allowable service deflections and deformations in the reinforced concrete beams. They also observed that the strain reduction seen in the internal steel in beams strengthened after the initial cracking of a specimen was not as great as the strain reduction in the steel of specimens strengthened prior to cracking. Therefore, in cases where FRP composites are used to repair beams where cracks have already formed, increases in service load capacity will not be as great.
Gussenhoven & Brena (2005) studied thirteen “small-scale” beams strengthened with CFRP and tested under repeated loading. They found that specimens cycled under a load range of less than 70% of yield of the longitudinal steel failed due to the fracture of the steel reinforcement. Whereas, specimens cycled at a load range in excess of 70% of yield of the longitudinal reinforcement failed due to delamination of the CFRP strips. Their tests showed that as long as bond between the CFRP and concrete surface was maintained, the fatigue life of the strengthened specimen was controlled by the internal steel. Papakonstantinou, Petrou, & Harries (2001) tested strengthened and unstrengthened specimens where stresses in the internal steel were kept within a constant range. In both cases, no discernible difference was seen in the fatigue life of specimens where the same stress levels were observed. These tests confirmed the earlier assertion that the fatigue life of a strengthened specimen is dependent on the fatigue life of the internal steel reinforcement.
2.8.2 Degradation of bond
One area of concern in the use of FRP laminates in strengthening applications is the propensity of the material to delaminate from the concrete surface when the material reaches higher strains. This is particularly an issue in cases where FRP laminates cannot be wrapped completely around a beam and therefore the strength of the composite member is based on the strength of the bond between the FRP and concrete surface. De-bonding failure is exacerbated in cases of fatigue, where de-bonding occurs at lower strains than specimens loaded monotonically (Harries, Reeve, & Zorn, 2007).
Brena, Benouaich, Kreger, & Wood (2005) conducted eight tests on reinforced concrete beams strengthened with CFRP laminates. Specimens cycled at load ranges typical of service-load levels in a bridge, between 30 and 60% of yielding, performed very well and did not “exhibit significant accumulation of damage with increased number of load repetitions.” However, in cases where strengthened specimens were loaded at higher levels, de-bonding failure was observed. These de-bonding failures occurred between 15-25% of the ultimate CFRP capacity. This agrees with the results of Gussenhoven & Brena (2005) who observed failure due to de-bonding in cases where fatigue loads surpassed 70% of yield.
Ferrier, Bigaud, Clement, & Hamelin (2011) performed twelve double-lap shear tests as depicted in Figure 2-45. Of these tests, static loads were applied to three of the tests and fatigue loads were applied to the remaining nine specimens. The three statically loaded specimens failed at an average shear stress of 1.5 MPa (0.22 ksi). These specimens all failed due to the delamination of the composite plate. The nine fatigue loaded specimens were cycled between a

47
load range of 0.10 MPa (0.015 ksi) and 45%, 60%, and 80% of the shear stress at fracture under monotonic loading: 0.67 MPa (0.10 ksi), 0.90 MPa (0.13 ksi), and 1.20 MPa (0.17 ksi).
Figure 2-45 Double-lap shear test set-up (Ferrier, Bigaud, Clement, & Hamelin, 2011)
Figure 2-46 summarizes the results of twelve tests. The figure shows that as the applied range of shear stress increases in the concrete to composite interface, the fatigue life of the specimen decreases. When the number of cycles is plotted on a logarithmic scale, a linear relationship between average shear stress and number of cycles to fatigue failure results and is expressed in Equation 2-7.
Figure 2-46 ∆τ/∆τu as a function of the number of cycles to failure (Ferrier, Bigaud, Clement, &
Hamelin, 2011)

48
bNmadh +•=∆ )log(τ (Eq. 2-7) with m = -0.07 and b = 0.98
These results effectively demonstrate how the bond between composite materials, such as CFRP, and the concrete surface degrade as applied shear stress and number of cycles applied increases.
2.9 Failure Modes of Fatigue Specimens Strengthened with CFRP
Two primary modes of failure have been observed during the fatigue testing of reinforced concrete beams strengthened with CFRP. The first is CFRP de-bonding. In this case, the CFRP material delaminates from the concrete surface prior to reaching rupture strain. Therefore, the CFRP is unable to utilize its full tensile capacity. The second failure mode is rupture of the internal steel. This failure mode is experienced when the internal steel reinforcement reaches its fatigue life and ruptures prior to the failure of the externally bonded CFRP.
2.9.1 CFRP de-bonding
The de-bonding of CFRP is a major concern in the fatigue testing of reinforced concrete beams. Many recent studies have noted the relation between fatigue loading of reinforced concrete beams and the degradation of bond between the surface of the concrete and FRP laminates (Brena et al. [2005], Aidoo et al. [2004], Gussenhaven et al. [2005], and Harries et al. [2007]). Once the bond was lost between the concrete surface and the FRP laminate, the reinforced concrete beam performed as an un-retrofitted specimen (Aidoo, Harries, & Petrou, 2004). In these cases failure can often be instantaneous due to the sudden increase in load applied to the internal steel when the FRP de-bonds. Therefore, the fatigue life of a specimen is limited by the quality of bond between the FRP and concrete surface. In cases where the bond between the FRP laminates and concrete surface does not degrade, fatigue life is based on the internal steel reinforcement (Harries, Reeve, & Zorn, 2007).
2.9.2 Steel reinforcement rupture
The second, more preferred mode of failure in fatigue tested specimens is the rupture of internal steel reinforcement. As mentioned previously, one of the greatest benefits of externally bonded FRP is its ability to increase the fatigue life of a reinforced concrete beam by decreasing the demand on the internal steel (Aidoo, Reeve, & Zorn, 2004). The FRP delays cracking of reinforced concrete beams and therefore increases the service load levels of structures, while decreasing the demand on the internal steel. In cases where specimens are cracked prior to strengthening, the strain reduction in the internal steel is not as pronounced (Ferrier, Bigaud, Clement, & Hamelin, 2011).
A failure due to the rupture of internal steel is preferred because it infers that the CFRP has functioned satisfactorily by increasing the service cracking load of the beam as much as possible. Increasing fatigue life may be a primary goal for strengthening some beams with FRP laminates.

49
2.10 Behavior of CFRP under Sustained Loading
In addition to the study of fatigue loaded specimens strengthened using FRP; attention must be given to sustained load behavior of strengthened specimens. FRP laminates are an excellent source of strengthening for specimens loaded over long durations due to their non-corrosive nature and the low additional weight they add to structures (Hoult & Lees, 2005). The lighter weight of the FRP material means that the dead load of the strengthened specimen will be unchanged.
Several factors need to be considered when determining the performance of FRP strengthened structures loaded over long durations. These factors include, but are not limited to:
• Changes in strain over time
• Epoxy creep between the concrete-FRP interface
• Deflection characteristics of strengthened specimens
2.10.1 Changes in strain over time
It is important to examine the change in strain behavior of FRP materials over time. Hoult & Lees (2005), along with many others, have examined the long-term behavior of CFRP strengthening systems. They tested a CFRP strap shear strengthening system shown in Figure 2-47. This system consisted of drilling four holes through the bottom and side of the top flange of a reinforced concrete T-beam. Once the holes were drilled “a strip of 3-mm (0.12-in) thick and 15-mm (0.59-in) wide polytetrafluoroethylene (PTFE) was placed in the holes to create the void that the CFRP straps would later pass through.” The holes were then filled with a high early strength concrete repair product and vibrated to minimize the voids in the grout. The CFRP straps were then inserted through the opening in the grout. A prestressing jack was placed on the bottom side of the test specimen and used to apply a prestressing force to the CFRP strap equivalent to 25% of the strap’s ultimate capacity. One set of beams was then left unloaded while the other set of beams was loaded for 220 days under shear loading.
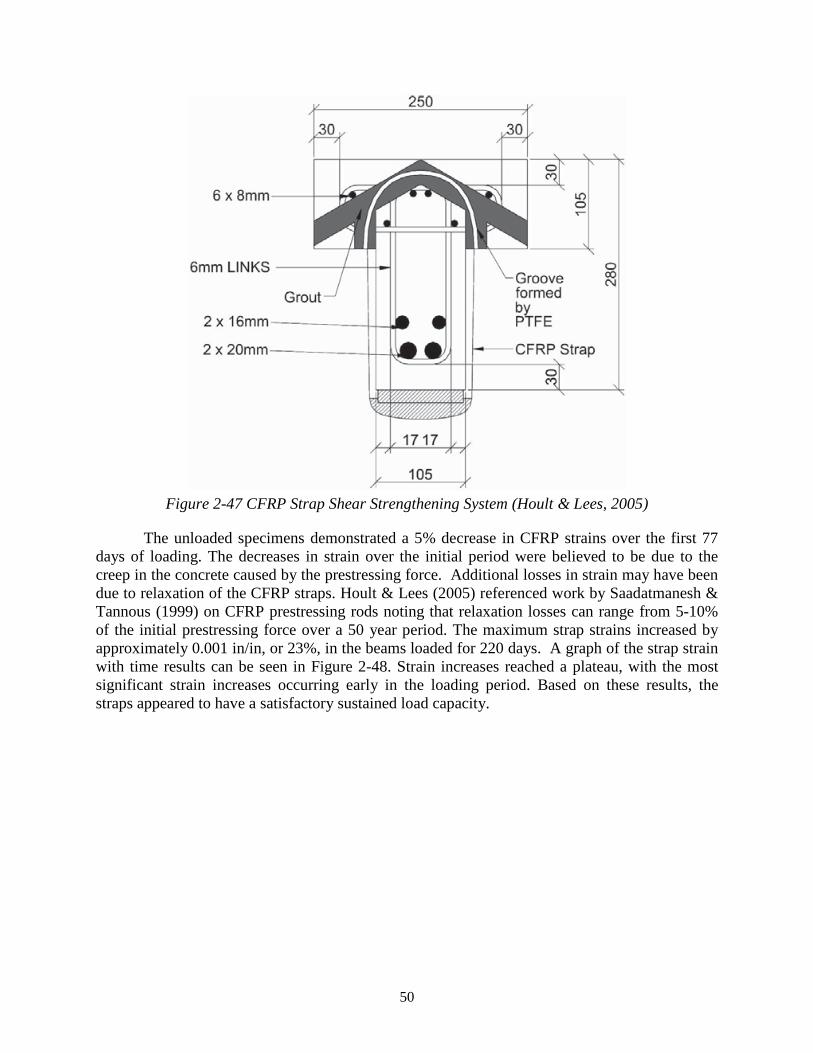
50
Figure 2-47 CFRP Strap Shear Strengthening System (Hoult & Lees, 2005)
The unloaded specimens demonstrated a 5% decrease in CFRP strains over the first 77 days of loading. The decreases in strain over the initial period were believed to be due to the creep in the concrete caused by the prestressing force. Additional losses in strain may have been due to relaxation of the CFRP straps. Hoult & Lees (2005) referenced work by Saadatmanesh & Tannous (1999) on CFRP prestressing rods noting that relaxation losses can range from 5-10% of the initial prestressing force over a 50 year period. The maximum strap strains increased by approximately 0.001 in/in, or 23%, in the beams loaded for 220 days. A graph of the strap strain with time results can be seen in Figure 2-48. Strain increases reached a plateau, with the most significant strain increases occurring early in the loading period. Based on these results, the straps appeared to have a satisfactory sustained load capacity.
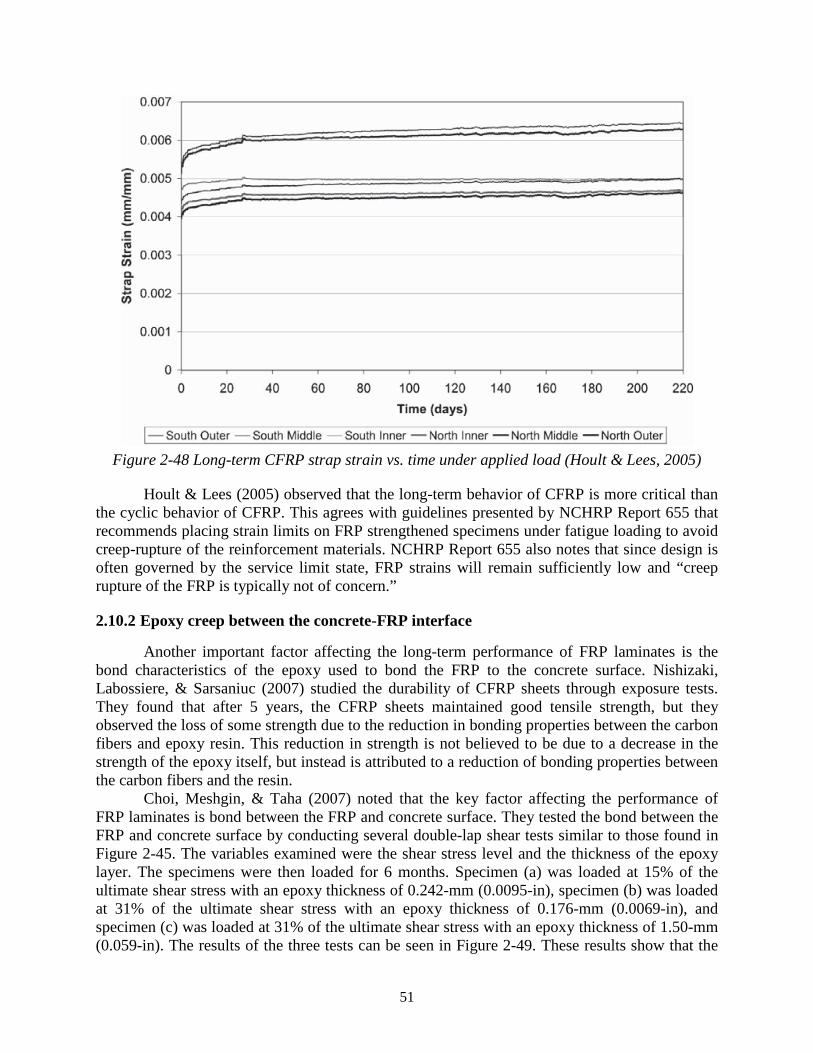
51
Figure 2-48 Long-term CFRP strap strain vs. time under applied load (Hoult & Lees, 2005)
Hoult & Lees (2005) observed that the long-term behavior of CFRP is more critical than the cyclic behavior of CFRP. This agrees with guidelines presented by NCHRP Report 655 that recommends placing strain limits on FRP strengthened specimens under fatigue loading to avoid creep-rupture of the reinforcement materials. NCHRP Report 655 also notes that since design is often governed by the service limit state, FRP strains will remain sufficiently low and “creep rupture of the FRP is typically not of concern.”
2.10.2 Epoxy creep between the concrete-FRP interface
Another important factor affecting the long-term performance of FRP laminates is the bond characteristics of the epoxy used to bond the FRP to the concrete surface. Nishizaki, Labossiere, & Sarsaniuc (2007) studied the durability of CFRP sheets through exposure tests. They found that after 5 years, the CFRP sheets maintained good tensile strength, but they observed the loss of some strength due to the reduction in bonding properties between the carbon fibers and epoxy resin. This reduction in strength is not believed to be due to a decrease in the strength of the epoxy itself, but instead is attributed to a reduction of bonding properties between the carbon fibers and the resin.
Choi, Meshgin, & Taha (2007) noted that the key factor affecting the performance of FRP laminates is bond between the FRP and concrete surface. They tested the bond between the FRP and concrete surface by conducting several double-lap shear tests similar to those found in Figure 2-45. The variables examined were the shear stress level and the thickness of the epoxy layer. The specimens were then loaded for 6 months. Specimen (a) was loaded at 15% of the ultimate shear stress with an epoxy thickness of 0.242-mm (0.0095-in), specimen (b) was loaded at 31% of the ultimate shear stress with an epoxy thickness of 0.176-mm (0.0069-in), and specimen (c) was loaded at 31% of the ultimate shear stress with an epoxy thickness of 1.50-mm (0.059-in). The results of the three tests can be seen in Figure 2-49. These results show that the

52
creep between the FRP and concrete surface occurs within a relatively short amount of time (15-30 days), compared with the typical retardation time of concrete which ranges between 300 and 900 days. The finite element results presented in Figure 2-49 display a displacement plot that plateaus after the initial loading period, while experimental results demonstrate gradual increases in displacements throughout the testing process.
Figure 2-49 Long-term displacement of test specimens obtained from test and FE analysis (Choi,
Meshgin, & Taha, 2007)
One area of concern is the redistribution of stresses in the concrete due to the creep of the epoxy. The creep in the epoxy can cause stress relief in some areas or stress increases in other areas resulting in additional tensile cracking. The magnitude of this stress redistribution is dependent on several parameters including level of shear stress, epoxy layer thickness, concrete stiffness, and creep criteria (Choi, Meshgin, & Taha, 2007).
2.10.3 Deflection characteristics of strengthened specimens
In addition to monitoring changes in strain over time of sustained load tests of CFRP strap systems, Hoult & Lees (2005) also observed significant changes in deflections over time of specimens strengthened using CFRP strap reinforcement systems. In the case of specimens loaded for a period of 220 days, they found that deflections increase by a total of 8.7-mm (0.34-in) over that time from 15.4-mm (0.61-in) to 24.1-mm (0.95-in). The greatest increase in deflections occurred over the first 25 days, but then the deflections continued to slowly increase for the remainder of the 220 days. The deflections appeared to be leveling out toward the end of the 220 day period. The results of the long-term load deflections can be seen in Figure 2-50.

53
Figure 2-50 Long-term midspan deflection vs. time (Hoult & Lees, 2005)
The changes in deflection over time are based on a combination of flexural deflections and shear deflections due to creep. While design codes base long-term deflection calculations on flexural effects, increases over time in the strains in the CFRP straps and internal steel suggest that a shear component is present in the total deflection (Hoult & Lees, 2005). CFRP strap strains increased by 23% and the internal steel strains increased by 31%. These findings show that it is necessary to account for the increases in deflection due to shear effects and not strictly those attributed to flexural behavior.
Although adequate attention should be given to creep effects in structures strengthened using FRP systems, it should be noted that most structures using FRP reinforcement systems will already have been loaded for a considerable length of time and most of the concrete creep will have already taken place and therefore increases in deflection will not be as great in field repair applications as they were in laboratory specimens (Hoult & Lees, 2005).

54

55
Chapter 3. Experimental Program
3.1 CFRP Sheet and Anchor Installation One of the most important aspects of the specimen construction process was the
installation of the CFRP materials. The quality with which the materials are applied to the surface can contribute significantly to how the materials perform in practice. Therefore, care was taken to ensure that the installation of CFRP was done correctly. On multiple occurrences, representatives of CFRP material manufacturers were asked to observe the installation procedure to ensure quality in application.
Three different CFRP material manufacturers (A, B and C) were used in four different CFRP systems (two from manufacturer A, one from manufacturer B and one from manufacturer C). Table 3-1 presents the manufacturer reported mechanical properties of each of the materials used in this experimental study. In Table 3-1, material properties of cured CFRP laminates are presented for Materials A-1, A-2 and B. For Material C, only the material properties of the dry carbon fiber sheets are presented.
Table 3-1 CFRP Material Properties
These materials were installed on the concrete specimens using recommended procedures that were observed during each of the CFRP applications. The following sections will discuss in detail the procedures involved with the installation process including:
• Surface preparation
• Anchor hole preparation
• Wet lay-up procedure
• Dry lay-up procedure
• CFRP anchor installations
3.1.1 Surface preparation Since anchors provided in this project are able to fully develop the ultimate strength of
the CFRP sheets, bond between CFRP and concrete is not essential structurally. Surface preparation for anchored CFRP applications can therefore be simplified compared to surface preparation for unanchored bond-critical CFRP applications. It is recommended that for anchored applications the concrete surface should be clean, free of any loose material, and smooth (i.e., limited roughness and no protrusions).
0.011 14800 0.0105 1540.041 13900 0.01 1430.02 8200 0.01 105
0.0065 33000 0.0167 550
CFRP MaterialThickness
(in)
Elastic Modulus
(ksi)
Ulitimate Strain (in/in)
Ultimate Stress (ksi)
Material A-1
Material BMaterial C
Material A-2

56
ACI 440.2R-08 recommends that all 90 degree corners be rounded to a radius of 0.5-in. to minimize stress concentrations in the CFRP at the corners. In this experimental program, T-beam specimens were cast with chamfered corners. For the I-beam specimens, the corners of the soffit and any sharp edges were smoothed (Figure 3-1).
Figure 3-1 Bottom corner of I-beam is rounded to prevent a local failure of the CFRP
3.1.2 CFRP anchor hole preparation The proper preparation of a CFRP anchor hole plays a key role in the overall strength of
the CFRP anchor. Improper preparation of the hole can create locations where high stress concentrations can develop within the CFRP anchor.
Drilling the hole into the concrete specimen is the first step (Figure 3-2 [a]). Recommended hole dimensions are discussed in Section 3.2. A standard hammer drill is used to abrasively bore into the concrete specimen. It is recommended that a new drill bit be used when drilling these holes. Old, dull, and worn bits will chip excessive amounts of concrete away from the edge of the anchorage hole, creating locations of high stress in the CFRP anchor.
Abrasively drilling into the concrete specimen produces a large amount of debris. Most of the debris is discharged from the anchorage hole through the flutes of the concrete drill bit; however, a small amount of debris remains in the hole after completing the drilling procedure. This debris can affect the bond strength between the concrete anchor and the surface of the prepared anchor hole and, therefore, must be removed. A vacuum cleaner with an adapted nozzle (designed to fit into the anchorage hole) quickly and effectively removed all debris from the anchorage hole, as shown in Figure 3-2 (b). A freshly drilled anchorage hole that has been cleared of all debris is shown in Figure 3-3.
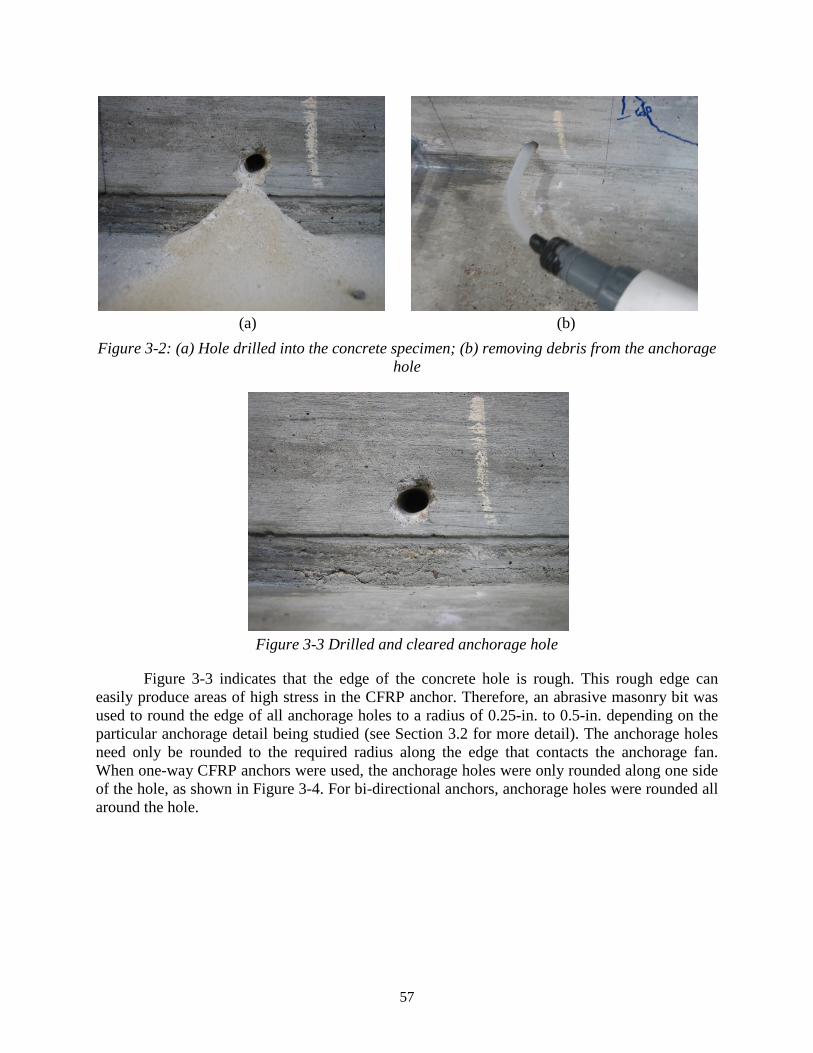
57
(a) (b)
Figure 3-2: (a) Hole drilled into the concrete specimen; (b) removing debris from the anchorage hole
Figure 3-3 Drilled and cleared anchorage hole
Figure 3-3 indicates that the edge of the concrete hole is rough. This rough edge can easily produce areas of high stress in the CFRP anchor. Therefore, an abrasive masonry bit was used to round the edge of all anchorage holes to a radius of 0.25-in. to 0.5-in. depending on the particular anchorage detail being studied (see Section 3.2 for more detail). The anchorage holes need only be rounded to the required radius along the edge that contacts the anchorage fan. When one-way CFRP anchors were used, the anchorage holes were only rounded along one side of the hole, as shown in Figure 3-4. For bi-directional anchors, anchorage holes were rounded all around the hole.

58
Figure 3-4 Completed preparation of CFRP anchorage hole
3.1.3 Wet lay-up procedure A common procedure used to install carbon fiber materials in practice is known as the
wet lay-up procedure. In this procedure, the carbon fiber sheets are first impregnated with a high strength structural epoxy, and then adhered to the concrete substrate. This method is popular for small scale applications where the carbon fiber materials can be easily handled by one or two workers. This wet lay-up procedure was used in all but one of the carbon fiber applications associated with this project. Materials A-1, A-2 and B were installed using the wet lay-up procedure.
Specific volumes of the two epoxy components (Figure 3-5) are measured. One component consists of a high strength resin while the other component is a chemical hardener which reacts with the resin, causing the epoxy to set. Vapors from one component can react with the second component, causing portions of the material to begin setting up. This causes the overall strength of the epoxy to decrease. Therefore, it is important to keep the two components separate until they are ready for use.
Figure 3-5 Two components of the high strength structural epoxy: the resin (left) and hardener
(right)
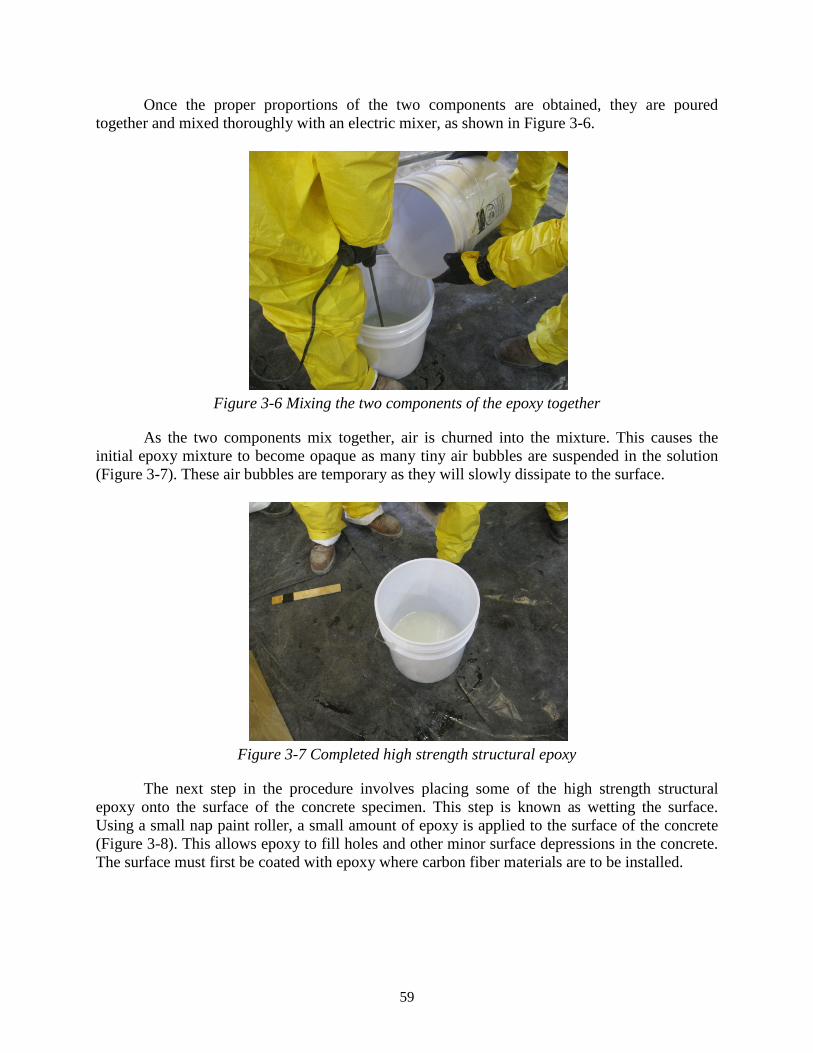
59
Once the proper proportions of the two components are obtained, they are poured together and mixed thoroughly with an electric mixer, as shown in Figure 3-6.
Figure 3-6 Mixing the two components of the epoxy together
As the two components mix together, air is churned into the mixture. This causes the initial epoxy mixture to become opaque as many tiny air bubbles are suspended in the solution (Figure 3-7). These air bubbles are temporary as they will slowly dissipate to the surface.
Figure 3-7 Completed high strength structural epoxy
The next step in the procedure involves placing some of the high strength structural epoxy onto the surface of the concrete specimen. This step is known as wetting the surface. Using a small nap paint roller, a small amount of epoxy is applied to the surface of the concrete (Figure 3-8). This allows epoxy to fill holes and other minor surface depressions in the concrete. The surface must first be coated with epoxy where carbon fiber materials are to be installed.

60
Figure 3-8 Applying epoxy to the surface of the concrete specimen (wetting)
The inner surface of the prepared anchor holes must be coated as well. This surface is covered with epoxy using a swab made of a small amount of carbon fiber fabric bundled together with a rebar tie (Figure 3-9). Lining the hole with a layer of epoxy helps to fill any voids along the surface of the hole created by the abrasive drilling procedure described in 3.1.1.
Figure 3-9 Applying epoxy to the surface of the drilled anchor hole (wetting)
Once all surfaces that are in contact with the CFRP laminates have been wet, the installation of the carbon fiber sheets can begin. The key distinction between the wet lay-up and dry lay-up procedures exists in the point in the process where the CFRP sheets are impregnated with epoxy. In the wet lay-up procedure, the sheets are impregnated before they are applied to the surface of the beam; whereas in the dry lay-up procedure, the sheets are first applied to a freshly epoxied concrete surface and then impregnated with epoxy.
During the wet lay-up procedure, the CFRP sheets are laid on the ground on a clean sheet of heavy duty plastic. Using the same roller that was used to wet the surface of the beam, epoxy is firmly pressed into the carbon fiber sheets (Figure 3-10). The sheet is flipped over and epoxy is again forced into the CFRP sheet from the opposite side.
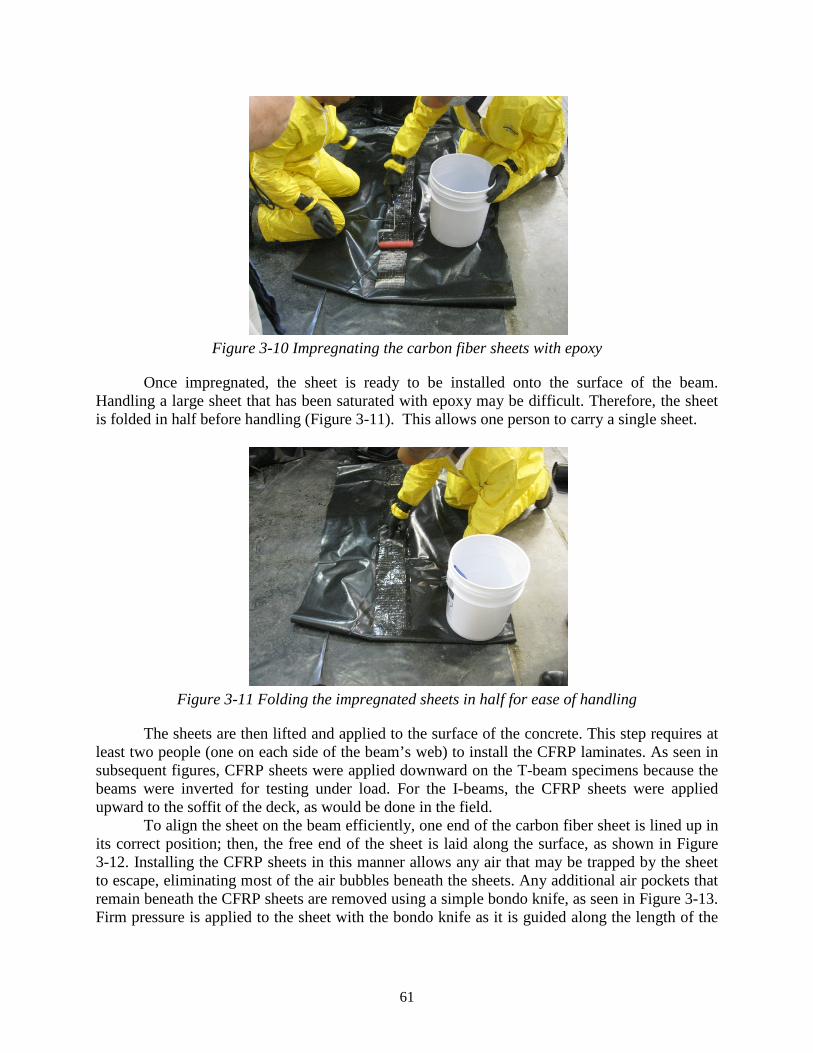
61
Figure 3-10 Impregnating the carbon fiber sheets with epoxy
Once impregnated, the sheet is ready to be installed onto the surface of the beam. Handling a large sheet that has been saturated with epoxy may be difficult. Therefore, the sheet is folded in half before handling (Figure 3-11). This allows one person to carry a single sheet.
Figure 3-11 Folding the impregnated sheets in half for ease of handling
The sheets are then lifted and applied to the surface of the concrete. This step requires at least two people (one on each side of the beam’s web) to install the CFRP laminates. As seen in subsequent figures, CFRP sheets were applied downward on the T-beam specimens because the beams were inverted for testing under load. For the I-beams, the CFRP sheets were applied upward to the soffit of the deck, as would be done in the field.
To align the sheet on the beam efficiently, one end of the carbon fiber sheet is lined up in its correct position; then, the free end of the sheet is laid along the surface, as shown in Figure 3-12. Installing the CFRP sheets in this manner allows any air that may be trapped by the sheet to escape, eliminating most of the air bubbles beneath the sheets. Any additional air pockets that remain beneath the CFRP sheets are removed using a simple bondo knife, as seen in Figure 3-13. Firm pressure is applied to the sheet with the bondo knife as it is guided along the length of the

62
CFRP strip to force all air and excess epoxy out from beneath the CFRP strip, producing a high quality, flush finish of the CFRP materials to the concrete substrate.
Figure 3-12 Placing the CFRP sheet onto the surface of the beam and aligning the free end of
the installed CFRP strip
Figure 3-13 Removing excess epoxy from the installed CFRP strip
When the CFRP strip has been installed on the surface of the concrete beam, it should completely cover the previously prepared anchor hole. In order to provide easy access to the anchor hole, the individual fibers of the carbon fiber fabric should be separated to provide space for the insertion of the CFRP anchor without snagging on the CFRP strip itself. This can be done easily by inserting a wire tapered rod or screwdriver through the saturated carbon fiber sheets into the anchor hole and circling it along the edge of the hole to produce the condition shown in Figure 3-14.

63
Figure 3-14 Creating an opening for the CFRP anchor
The previously mentioned steps can be repeated to install multiple CFRP strips or sheets. A completed installation of two CFRP strips is shown in Figure 3-15. The wetted surface for the third strip and the anchor hole can be seen on the right. Depending on the layout of the carbon fiber materials, multiple layers of CFRP strips or sheets may be used. In these cases, the second layer can be installed in the same manner as described previously; however, there is no need to wet the surface because the previously installed first layer is an appropriate surface on which the additional layer can be installed.
Figure 3-15 Completed installation of a CFRP strip
Care must be taken to work within the workability time limits specified by the manufacturer of the epoxy resin. Epoxy should be mixed in small batches as it is needed, to ensure that partially set epoxy is not used in the installation.

64
3.1.4 Dry lay-up procedure Another common procedure used to install carbon fiber materials in practice is known as
the dry lay-up procedure. In this procedure, the carbon fiber sheets are impregnated with a high strength structural epoxy while on the surface of the beam. This method is popular for large scale applications where the carbon fiber materials cannot be easily handled by one or two workers. This allows workers to handle dry sheets of CFRP fabrics which are lighter and easier to work with than the large, saturated sheets associated with the wet lay-up procedure. The dry lay-up procedure presented within this section was used in only one of the tests. Material C was the only CFRP material installed using the dry lay-up procedure.
Many of the installation procedures associated with the dry lay-up procedure are identical to those of the wet lay-up procedure; however, a couple of major differences exist between the two procedures: the need to apply a concrete surface primer and the method used to impregnate the carbon fiber sheets.
The concrete surface primer consists of a two part chemical saturate. It is applied to the surface of the concrete specimen with an ordinary 3/8-in. nap paint roller, as shown in Figure 3-16. According to the manufacturer’s website, this primer has been proven to increase the bond strength between the CFRP laminates and the concrete substrate. All surfaces onto which CFRP laminates are to be installed must be primed, including the inner surface of the CFRP anchor holes.
Figure 3-16 Application of the concrete surface primer
Once all surfaces have been primed, a two part structural epoxy is mixed and used to wet the surface of the beam; in a manner identical to the procedure described in 3.1.3. Just as with the wet lay-up procedure, the anchor holes are wet with epoxy using a small swab of CFRP material (Figure 3-17). In order to provide enough epoxy to impregnate the carbon fiber laminates while on the surface of the beam, a generous amount of structural epoxy is used to wet the surface of the concrete beam.
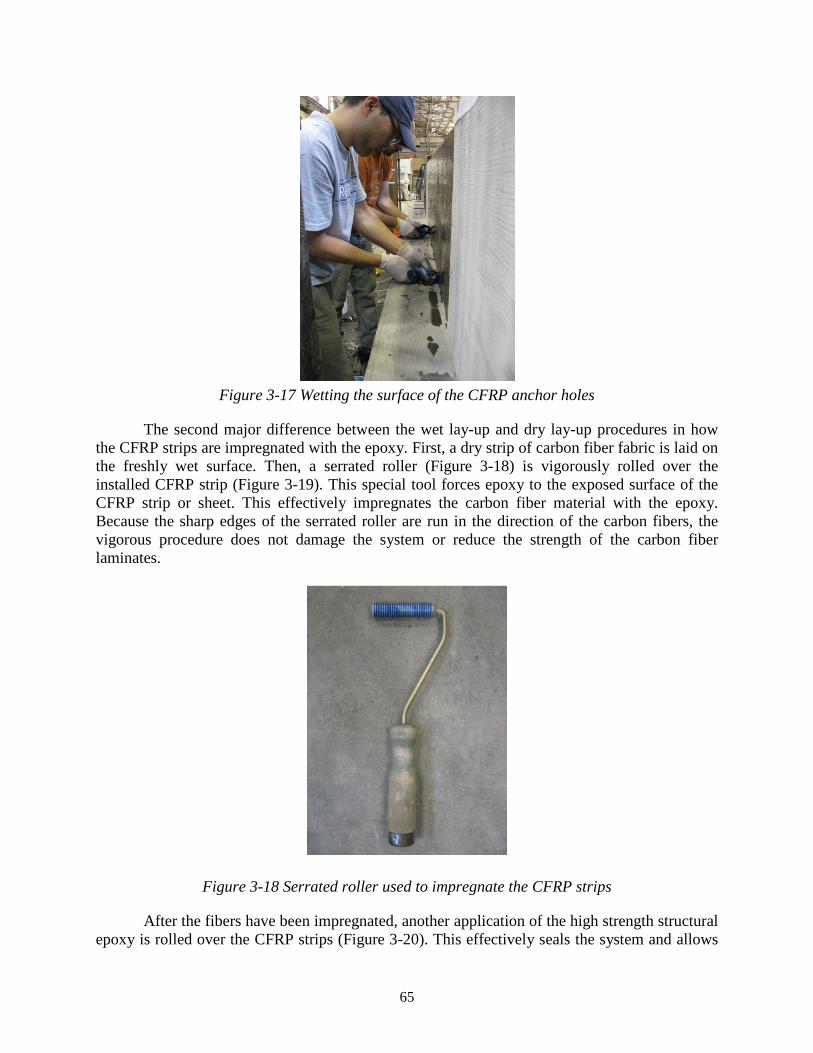
65
Figure 3-17 Wetting the surface of the CFRP anchor holes
The second major difference between the wet lay-up and dry lay-up procedures in how the CFRP strips are impregnated with the epoxy. First, a dry strip of carbon fiber fabric is laid on the freshly wet surface. Then, a serrated roller (Figure 3-18) is vigorously rolled over the installed CFRP strip (Figure 3-19). This special tool forces epoxy to the exposed surface of the CFRP strip or sheet. This effectively impregnates the carbon fiber material with the epoxy. Because the sharp edges of the serrated roller are run in the direction of the carbon fibers, the vigorous procedure does not damage the system or reduce the strength of the carbon fiber laminates.
Figure 3-18 Serrated roller used to impregnate the CFRP strips
After the fibers have been impregnated, another application of the high strength structural epoxy is rolled over the CFRP strips (Figure 3-20). This effectively seals the system and allows

66
the epoxy to fully saturate the carbon fiber materials. A completed installation of a CFRP system using the dry lay-up procedure is shown in Figure 3-21.
Figure 3-19 Impregnating the CFRP strip while on the surface of the beam
Figure 3-20 Sealing the CFRP laminates with epoxy

67
Figure 3-21 Completed installation using the dry lay-up procedure
3.1.5 CFRP anchor installation CFRP anchors are constructed in a series of steps. It is noted that in each of these steps,
workmanship in construction is of utmost importance. Poor execution of the required steps can, at times, reduce the capacity of the CFRP anchors by up to 50% (Ozbakkaloglu & Saatcioglu, 2009).
Once the hole has been drilled and the edge rounded (as described previously), construction of the actual anchor can begin. The materials needed to create the CFRP anchor are displayed in Figure 3-22. These include a strip of CFRP fabric, a rebar tie, and a pair of needle nose pliers. The width of this strip to be used in the anchor is determined by the amount of CFRP material the CFRP anchor is to develop (see Section 3.2 for more details). The length of the strip used to create the CFRP anchor is determined by the embedment depth of the anchor and the length of the bonded portion of the anchors (also known as the anchor fan); see Section 3.2 for more details. To make installation of the CFRP anchor easier, this strip of CFRP fabric is folded in half (Figure 3-23). As a result, the required length of the anchor must be doubled while the required width of the CFRP strip used to create the anchor only needs to be half the required width.

68
Figure 3-22 Materials required to construct a CFRP anchor – a strip of CFRP, a rebar tie and a
pair of needle nose pliers
Figure 3-23 CFRP strip folded in half and clasped with a rebar tie
A rebar tie is used to clasp the strip at its midpoint (Figure 3-24). The rebar tie serves as an installation tool offering the installer leverage for inserting the anchor into the drilled hole. Once folded in half, the ends of the anchor are frayed (Figure 3-25), which allows the CFRP materials located within the portion of anchorage fan to be spread out.

69
Figure 3-24 A close up view of the rebar tie clasp
Figure 3-25 CFRP anchors prepared for installation
The first step in installing an anchor is the impregnation of the anchors with the high strength structural epoxy used to install the CFRP strips (Figure 3-26). This can be done effectively by submersing the CFRP anchor into a bucket of epoxy and squeezing the strands to force epoxy into the anchor. Once impregnated with the structural epoxy, the CFRP anchor is inserted into the predrilled hole using the rebar tie that was used to clasp the anchor. Figure 3-27 and Figure 3-28 display the proper procedure for inserting the CFRP anchor into the concrete specimen.
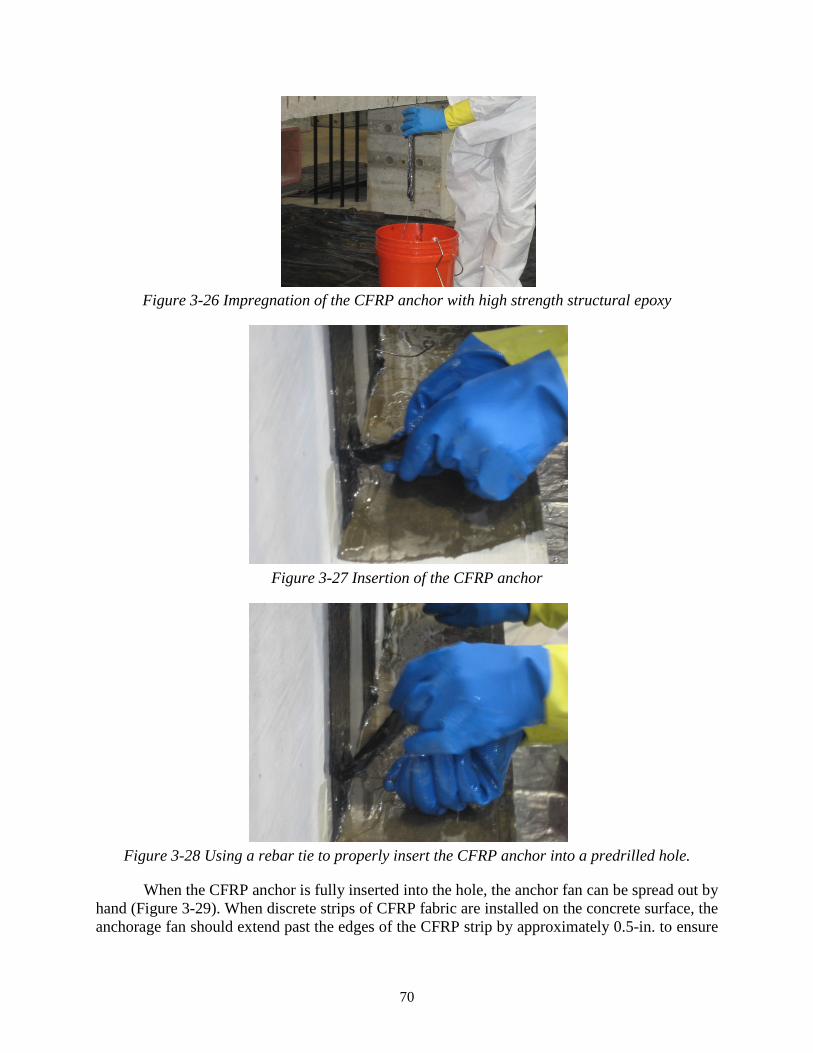
70
Figure 3-26 Impregnation of the CFRP anchor with high strength structural epoxy
Figure 3-27 Insertion of the CFRP anchor
Figure 3-28 Using a rebar tie to properly insert the CFRP anchor into a predrilled hole.
When the CFRP anchor is fully inserted into the hole, the anchor fan can be spread out by hand (Figure 3-29). When discrete strips of CFRP fabric are installed on the concrete surface, the anchorage fan should extend past the edges of the CFRP strip by approximately 0.5-in. to ensure

71
that all carbon fiber strands of the anchor intersect fibers from the CFRP strip. A completed installation of the CFRP anchors is shown in Figure 3-30.
Figure 3-29 Construction of CFRP anchorage fan
Figure 3-30 Completed installation of CFRP anchors
A slight problem was encountered when installing an anchorage system using Material A-1. This material was coated with a chemical substance that increased the stiffness of the physical CFRP sheet. The additional stiffness greatly increased the workability associated with the material when saturated with epoxy. But, the increased stiffness also made bundling the material together to create the anchor extremely difficult. The bundled anchor was too large to be inserted into the anchorage hole. Thus, a different material (Material A-2) produced by the same manufacturer was used to create all anchors associated with the installation of Material A-1.
3.2 CFRP Anchor Details Background information regarding CFRP anchors was presented in Chapter 2 while the
installation procedure for the anchors was given in Section 3.1.5. Recommended details for CFRP anchors are given in this section. Two different anchorage details were utilized during the different installations of the CFRP materials:

72
• Initial Detail: A detail developed by Kim (2008)
• Improved Detail: A new detail developed based on recommendations by Kobayashi (2001)
3.2.1 Initial CFRP anchorage detail The first anchorage detail used in the experimental program was consistent with the detail
proposed by Kim (2008). This detail was mainly used by Kim in flexural applications and consisted of an anchor containing 1.5 times the amount of material contained within the CFRP strip itself. The increase in the amount of material was necessary to offset the loss in strength associated with the small bend radius at the opening of the anchorage hole. A bend radius around the anchor hole of 0.25-in. was recommended by Kim (2008). The hole diameter for this anchorage detail was selected to provide a hole area that was 40% larger than the area of the anchor material. The embedded portion of the anchor was inserted 6-in. into the concrete beam, providing a minimum of 4-in. embedment into the concrete core. The remaining 6-in. of the CFRP anchor was then utilized as the anchorage fan. The anchor fan was distributed over an angle of 60 degrees to completely cover the CFRP strip and provide an overhang of 0.5-in on either side of the strip. A schematic diagram of this particular anchorage detail can be found in Figure 3-31 and an image of the as-built detail can be seen in Figure 3-30.
Figure 3-31 Anchorage detail developed by Kim (2008)
Although this detail performed fairly well in experimental studies, it was noted that many of the failures associated with this detail occurred due to fracture of the anchor at a location near the opening of the anchor hole before the CFRP strip reached its ultimate strain (Figure 3-32). Stress concentrations large enough to fracture the CFRP anchor were developed at the opening of the CFRP anchor hole. At this location, all shear forces must be transferred between the concrete and CFRP. Therefore, this location is crucial to the overall strength of the system.
4"

73
Figure 3-32 Rupture of the CFRP anchor near the anchor hole opening
3.2.2 Improved CFRP anchorage detail A new anchorage detail was developed to help reduce the high stresses developed at the
opening of the anchorage fan. During the development of the CFRP anchors, Kobayashi (2001) noted the importance of a horizontal ply over the anchor to transfer the transverse component of forces through the anchorage fan. In Figure 3-33, a free body diagram of the forces transferred through the anchorage fan is shown. As shear force is transferred from the CFRP strip into the anchor, transverse (FH) and vertical (FV) components of force are developed due to the angled fibers contained within the anchorage fan. While the vertical component of force can be resisted by the CFRP strip, the transverse component cannot be fully resisted by the anchorage fan.
Figure 3-33 Free body diagram of force transferred through anchorage fan
Therefore, Kobayashi recommended the use of a horizontal ply of fibers that would resist the transverse component of force. This concept was adopted in the new anchorage detail but

74
with two 5-in by 5-in plies of CFRP material applied over the anchorage hole (Figure 3-34). The first ply was installed so that the carbon fibers were oriented transversely to the main CFRP strip. The second ply was then installed over the first with its carbon fibers oriented perpendicularly to those of the first ply.
Figure 3-34 Isometric view of U-wrap with CFRP anchorage system
Also, the amount of material contained within the anchor was increased from 1.5 to 2 times the amount of material contained within the CFRP strip and the bend radius at the opening of the anchorage hole was increased from 0.25-in. to 0.5-in. The increase in the amount of material contained within the anchor was intended to provide additional strength to the key portion of the anchor that could be utilized if the anchor experienced high stress concentrations at the opening of the anchorage fan. The increase in bend radius at the opening of the anchorage hole was also intended to help reduce stress concentrations developed at this crucial location in the CFRP anchor. A schematic diagram of the modified anchorage detail can be seen in Figure 3-35 and the as-built detail can be seen in Figure 3-36.
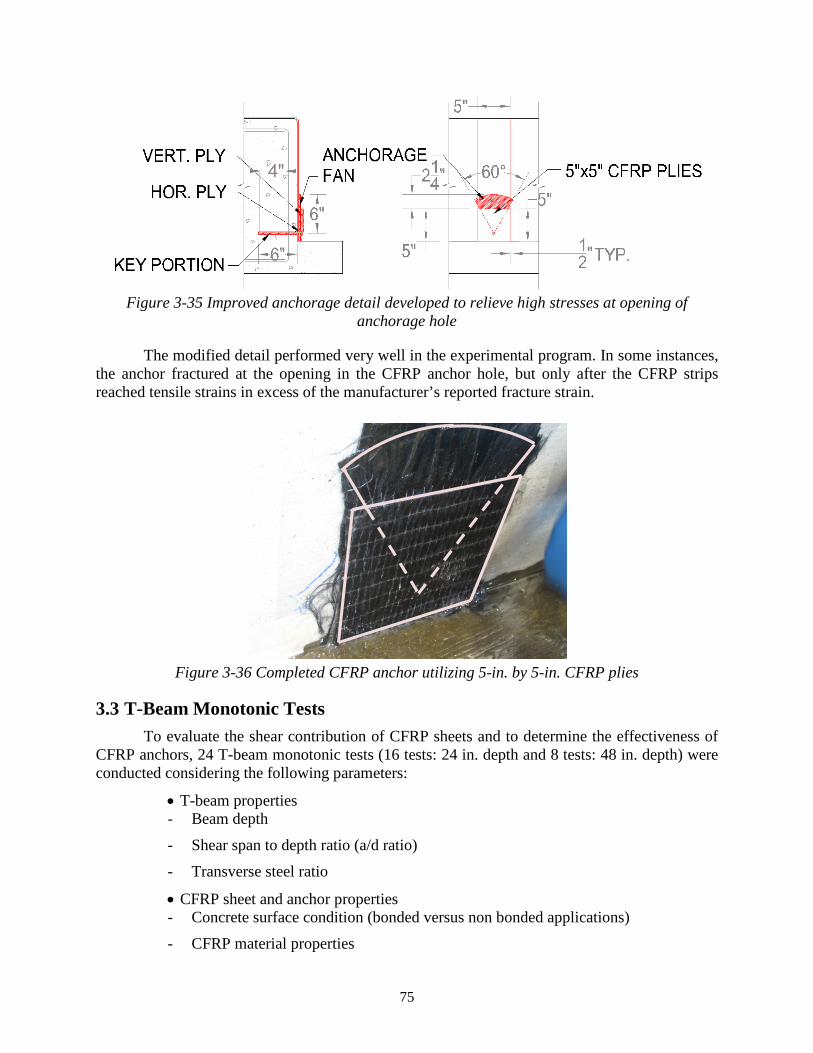
75
Figure 3-35 Improved anchorage detail developed to relieve high stresses at opening of
anchorage hole
The modified detail performed very well in the experimental program. In some instances, the anchor fractured at the opening in the CFRP anchor hole, but only after the CFRP strips reached tensile strains in excess of the manufacturer’s reported fracture strain.
Figure 3-36 Completed CFRP anchor utilizing 5-in. by 5-in. CFRP plies
3.3 T-Beam Monotonic Tests To evaluate the shear contribution of CFRP sheets and to determine the effectiveness of
CFRP anchors, 24 T-beam monotonic tests (16 tests: 24 in. depth and 8 tests: 48 in. depth) were conducted considering the following parameters:
• T-beam properties - Beam depth
- Shear span to depth ratio (a/d ratio)
- Transverse steel ratio
• CFRP sheet and anchor properties - Concrete surface condition (bonded versus non bonded applications)
- CFRP material properties

76
- CFRP sheet layout
- Amount of CFRP material
- Anchored and unanchored applications
- Anchor layout and detail
Full-scale T-beam specimens with at least the minimum amount of transverse reinforcement required by ACI 318-08 and NCHRP Design Requirements were selected to represent typical bridge beams. T-beam specimens were selected to simulate bridge beams or girders with a topping slab for which complete CFRP wrapping would not be possible. Full-scale, as opposed to reduced-scale, specimens were selected because past research has shown that small-scale test results may not be applicable to large beams in practice (Sas et al. 2009). Since current design codes generally require a minimum amount of transverse reinforcement, no specimens were considered without transverse steel reinforcement. Test parameters considered are shown in Figure 3-37.
Figure 3-37 Experimental program test parameters
3.3.1 Selection of test parameters Concrete and Steel Material Properties
A 28-day compressive strength of 4,000-psi was targeted for the T-beam specimens as it is a typical concrete strength used by TxDOT in bridge beams. Transverse steel was ASTM A615 Grade 60 steel as is commonly used in TxDOT bridge beams. Longitudinal steel was ASTM A615 Grade 75 to ensure sufficient flexural strength to fail the specimens in shear.
Shear Span to Depth Ratio
The current design guidelines (AASHTO, 2007; ACI 318-08) define beams with a shear span to depth of two or less as deep beams. In deep beams, a direct strut from the loading point
h = 48 in.
a/d =1.5
a/d =2.1
a/d =3
a/d =3
#3 @18”
#3 @10”
#3 @10”
Depth of beam
Shear span to depth ratio
Transverse steel ratio
CFRP material properties
The amount of CFRP material
With / without anchors
Anchor layout / detail
Surface condition
CFRP sheet layout
Beam dimensions FRP strengthening
h =24 in.
#3 @4”
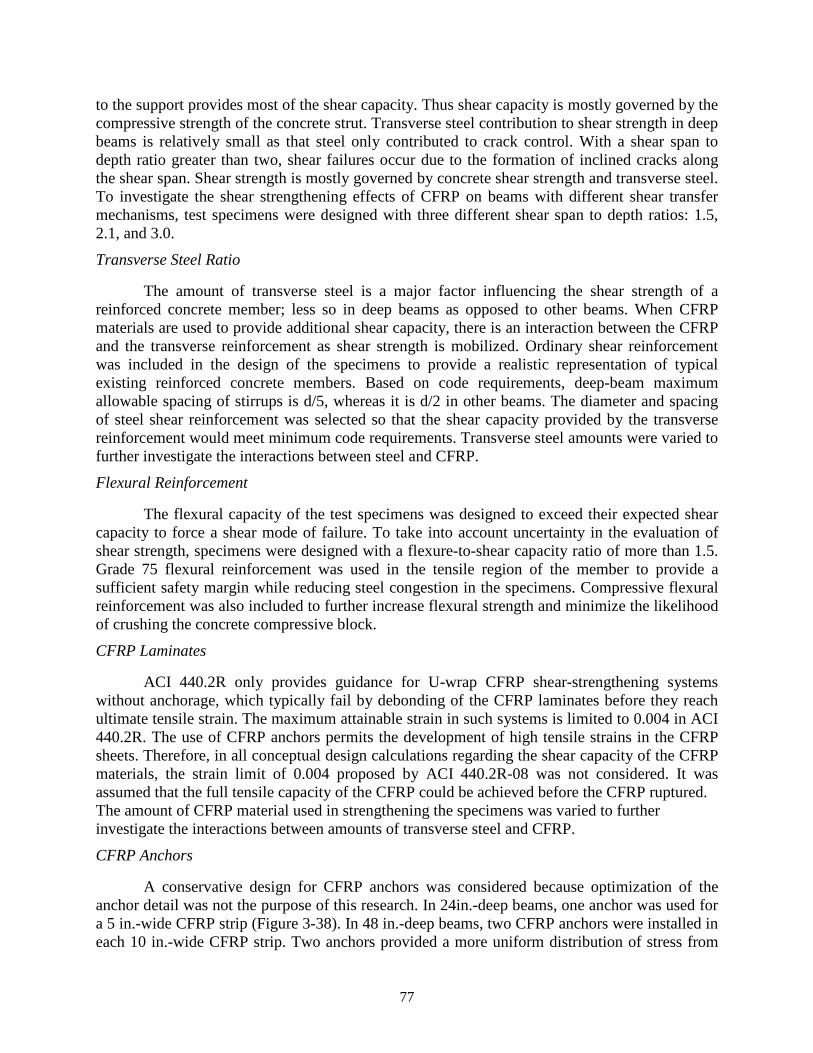
77
to the support provides most of the shear capacity. Thus shear capacity is mostly governed by the compressive strength of the concrete strut. Transverse steel contribution to shear strength in deep beams is relatively small as that steel only contributed to crack control. With a shear span to depth ratio greater than two, shear failures occur due to the formation of inclined cracks along the shear span. Shear strength is mostly governed by concrete shear strength and transverse steel. To investigate the shear strengthening effects of CFRP on beams with different shear transfer mechanisms, test specimens were designed with three different shear span to depth ratios: 1.5, 2.1, and 3.0.
Transverse Steel Ratio
The amount of transverse steel is a major factor influencing the shear strength of a reinforced concrete member; less so in deep beams as opposed to other beams. When CFRP materials are used to provide additional shear capacity, there is an interaction between the CFRP and the transverse reinforcement as shear strength is mobilized. Ordinary shear reinforcement was included in the design of the specimens to provide a realistic representation of typical existing reinforced concrete members. Based on code requirements, deep-beam maximum allowable spacing of stirrups is d/5, whereas it is d/2 in other beams. The diameter and spacing of steel shear reinforcement was selected so that the shear capacity provided by the transverse reinforcement would meet minimum code requirements. Transverse steel amounts were varied to further investigate the interactions between steel and CFRP.
Flexural Reinforcement
The flexural capacity of the test specimens was designed to exceed their expected shear capacity to force a shear mode of failure. To take into account uncertainty in the evaluation of shear strength, specimens were designed with a flexure-to-shear capacity ratio of more than 1.5. Grade 75 flexural reinforcement was used in the tensile region of the member to provide a sufficient safety margin while reducing steel congestion in the specimens. Compressive flexural reinforcement was also included to further increase flexural strength and minimize the likelihood of crushing the concrete compressive block.
CFRP Laminates
ACI 440.2R only provides guidance for U-wrap CFRP shear-strengthening systems without anchorage, which typically fail by debonding of the CFRP laminates before they reach ultimate tensile strain. The maximum attainable strain in such systems is limited to 0.004 in ACI 440.2R. The use of CFRP anchors permits the development of high tensile strains in the CFRP sheets. Therefore, in all conceptual design calculations regarding the shear capacity of the CFRP materials, the strain limit of 0.004 proposed by ACI 440.2R-08 was not considered. It was assumed that the full tensile capacity of the CFRP could be achieved before the CFRP ruptured. The amount of CFRP material used in strengthening the specimens was varied to further investigate the interactions between amounts of transverse steel and CFRP.
CFRP Anchors
A conservative design for CFRP anchors was considered because optimization of the anchor detail was not the purpose of this research. In 24in.-deep beams, one anchor was used for a 5 in.-wide CFRP strip (Figure 3-38). In 48 in.-deep beams, two CFRP anchors were installed in each 10 in.-wide CFRP strip. Two anchors provided a more uniform distribution of stress from
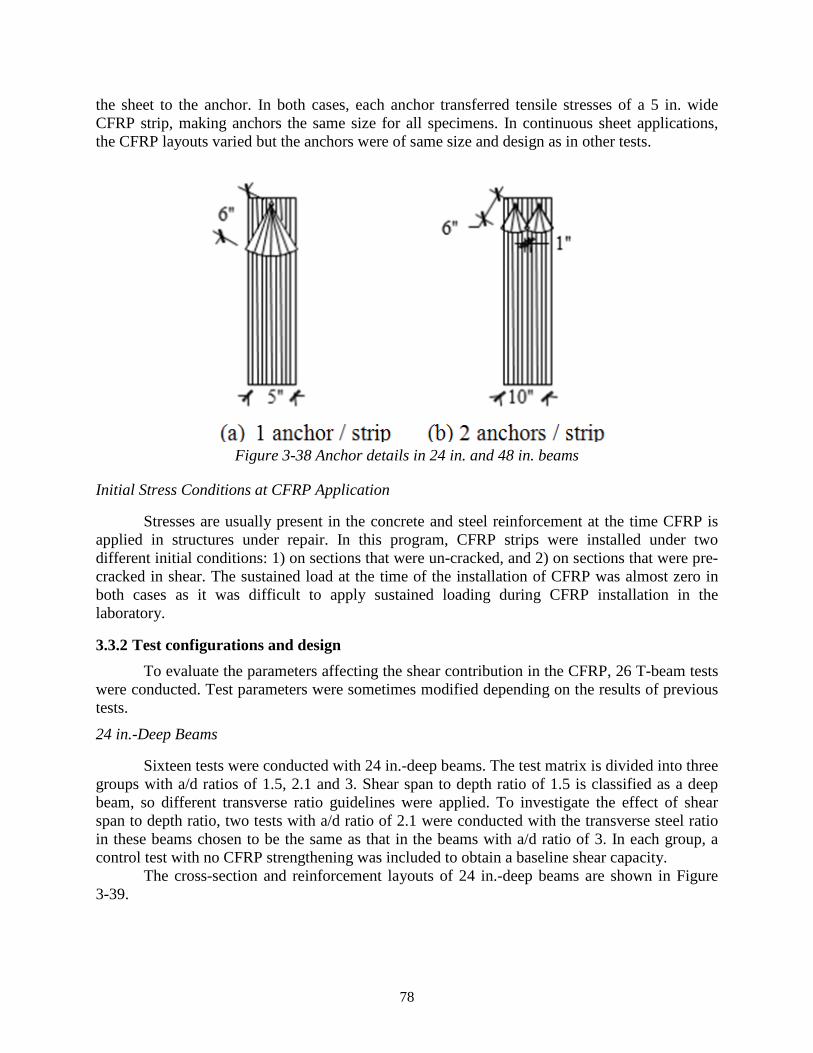
78
the sheet to the anchor. In both cases, each anchor transferred tensile stresses of a 5 in. wide CFRP strip, making anchors the same size for all specimens. In continuous sheet applications, the CFRP layouts varied but the anchors were of same size and design as in other tests.
Figure 3-38 Anchor details in 24 in. and 48 in. beams
Initial Stress Conditions at CFRP Application
Stresses are usually present in the concrete and steel reinforcement at the time CFRP is applied in structures under repair. In this program, CFRP strips were installed under two different initial conditions: 1) on sections that were un-cracked, and 2) on sections that were pre-cracked in shear. The sustained load at the time of the installation of CFRP was almost zero in both cases as it was difficult to apply sustained loading during CFRP installation in the laboratory.
3.3.2 Test configurations and design To evaluate the parameters affecting the shear contribution in the CFRP, 26 T-beam tests
were conducted. Test parameters were sometimes modified depending on the results of previous tests.
24 in.-Deep Beams
Sixteen tests were conducted with 24 in.-deep beams. The test matrix is divided into three groups with a/d ratios of 1.5, 2.1 and 3. Shear span to depth ratio of 1.5 is classified as a deep beam, so different transverse ratio guidelines were applied. To investigate the effect of shear span to depth ratio, two tests with a/d ratio of 2.1 were conducted with the transverse steel ratio in these beams chosen to be the same as that in the beams with a/d ratio of 3. In each group, a control test with no CFRP strengthening was included to obtain a baseline shear capacity.
The cross-section and reinforcement layouts of 24 in.-deep beams are shown in Figure 3-39.
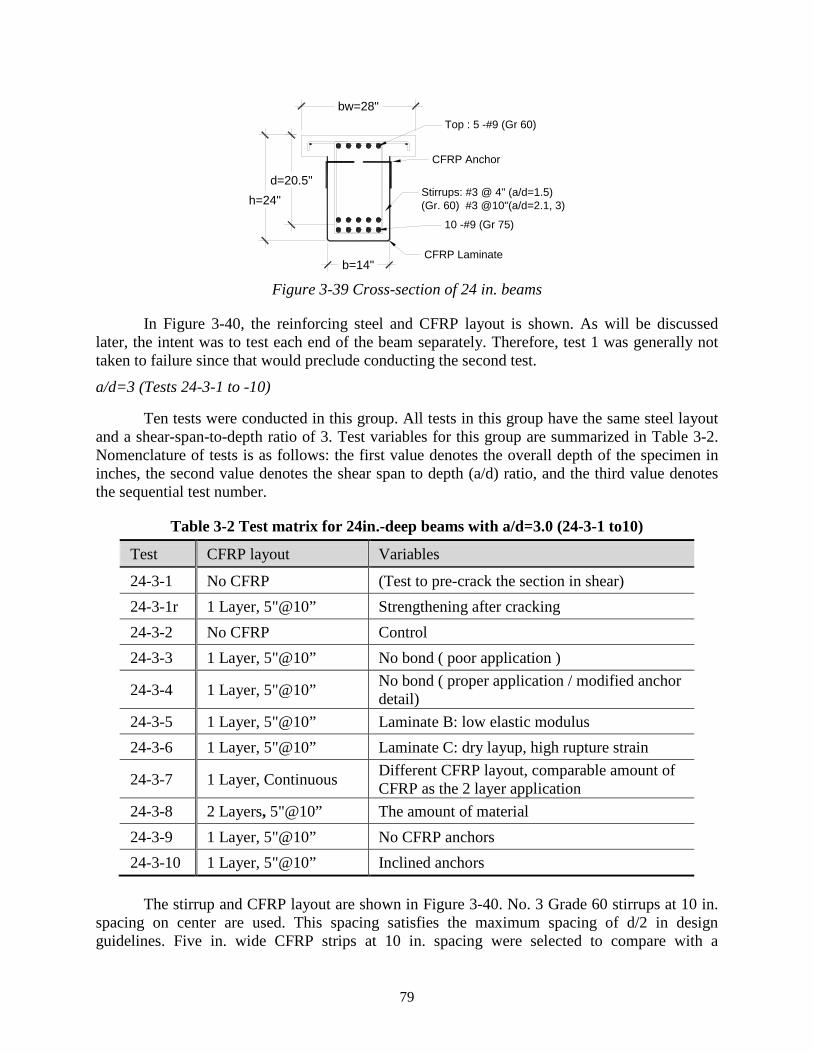
79
Figure 3-39 Cross-section of 24 in. beams
In Figure 3-40, the reinforcing steel and CFRP layout is shown. As will be discussed later, the intent was to test each end of the beam separately. Therefore, test 1 was generally not taken to failure since that would preclude conducting the second test.
a/d=3 (Tests 24-3-1 to -10)
Ten tests were conducted in this group. All tests in this group have the same steel layout and a shear-span-to-depth ratio of 3. Test variables for this group are summarized in Table 3-2. Nomenclature of tests is as follows: the first value denotes the overall depth of the specimen in inches, the second value denotes the shear span to depth (a/d) ratio, and the third value denotes the sequential test number.
Table 3-2 Test matrix for 24in.-deep beams with a/d=3.0 (24-3-1 to10)
Test CFRP layout Variables
24-3-1 No CFRP (Test to pre-crack the section in shear) 24-3-1r 1 Layer, 5"@10” Strengthening after cracking 24-3-2 No CFRP Control 24-3-3 1 Layer, 5"@10” No bond ( poor application )
24-3-4 1 Layer, 5"@10” No bond ( proper application / modified anchor detail)
24-3-5 1 Layer, 5"@10” Laminate B: low elastic modulus 24-3-6 1 Layer, 5"@10” Laminate C: dry layup, high rupture strain
24-3-7 1 Layer, Continuous Different CFRP layout, comparable amount of CFRP as the 2 layer application
24-3-8 2 Layers, 5"@10” The amount of material 24-3-9 1 Layer, 5"@10” No CFRP anchors 24-3-10 1 Layer, 5"@10” Inclined anchors
The stirrup and CFRP layout are shown in Figure 3-40. No. 3 Grade 60 stirrups at 10 in.
spacing on center are used. This spacing satisfies the maximum spacing of d/2 in design guidelines. Five in. wide CFRP strips at 10 in. spacing were selected to compare with a
bw=28"
d=20.5"h=24"
b=14"
Top : 5 -#9 (Gr 60)
Stirrups: #3 @ 4" (a/d=1.5)(Gr. 60) #3 @10"(a/d=2.1, 3)
10 -#9 (Gr 75)
CFRP Laminate
CFRP Anchor

80
continuous sheet and resulted in using half as much material. The maximum clear spacing (net spacing) in ACI 440 is d/4, which is 5 in. (20.5 in./4 = 5.1 in.) for these specimens.
Figure 3-40 Reinforcing steel and CFRP layout for 24 in. beams with a/d=3
Test 24-3-1 was conducted to crack the beam and increase the load to yielding of stirrups. Test 24-3-1r is a test of the same specimen after CFRP strengthening. To investigate the effect of a/d ratio, specimens with a/d ratio of 2.1 and 1.5 (24-2.1-1 and 24-1.5-4) having the same CFRP layout as 24-3-1r were also tested.
In test 24-3-3 and 24-3-4, there was no bond between the CFRP strip and concrete surface. However, in 24-3-3, CFRP anchor installation was flawed due to a problem with the procedure used for eliminating bond as will be discussed in the results section. Therefore, 24-3-4 was a repeated test with the same unbonded condition, but with proper anchor installation.
In test 24-3-5 and 24-3-6, the CFRP material was obtained from different suppliers to evaluate the effect of different material properties. The CFRP sheets used in 24-3-5 have a lower stiffness compared with laminate A, so the thickness of one sheet is greater than that of laminate A to provide similar strength. The laminate C was applied using a dry layup procedure and has a high rupture strain. The estimated strength increase using laminate C was greater than laminates A and B, but can only be developed at higher rupture strains.
In tests 24-3-7 and 24-3-8, the amount of CFRP material was doubled and the layout was changed. A continuous sheet layout was applied in 24-3-7 whereas CFRP strips with two layers were applied in 24-3-8. The number of CFRP anchors was doubled in 24-3-7, but in 24-3-8, the same number of CFRP anchors was used but the area of the anchor was doubled.
Test 24-3-9 was conducted with no CFRP anchors. Test 24-3-10 was intended to evaluate the effect of the orientation of the CFRP anchor. In practice, it may be difficult to access the corner between the web of a beams and the topping slab. This test investigated the effects of inclining the anchor hole for easier drilling (Figure 3-41).
3"
5' 5'5"
5"5"
10"2'-3"
TEST 1
2'-3"
TEST 2
1'-6"16'
Clear spacing
5’-8” 5’-8”

81
(a) Typical CFRP anchor (b) Anchor detail in 24-3-10
Figure 3-41 Comparisons of CFRP anchor detail between typical type and 24-3-10
Transitional Beams with a/d=2.1 (Tests 24-2.1-1 and -2)
Two tests including an unstrengthened control beam and a strengthened beam were conducted with shear-span-to-depth ratio of 2.1 to evaluate the effect of shear-span-to-depth ratio. The same reinforcement details were used in theses specimens as for the a/d=3 specimens; i.e., No. 3 Grade 60 stirrups at 10 in. spacing on center. See Figure 3-42 and Table 3-3.
Figure 3-42 Reinforcing steel and CFRP layout for 24 in. beams with a/d=2.1
Table 3-3 Test Matrix for transitional beams with a/d=2.1 (24-2.1-1 and 2)
Test CFRP layout Variables
24-2.1-1 1 Layer, 5"@10” a/d ratio 24-2.1-2 No CFRP Control
Deep beams with a/d=1.5 (Tests 24-1.5-1 to -4)
Four tests were conducted with shear-span-to-depth ratio of 1.5. As shown in Figure 3-43, the stirrups were No.3 Grade 60 at 4 in. spacing on center, which satisfied the maximum spacing requirement of d/5 for deep beams. The CFRP layout was the same as that of a/d=3 specimens but the number of CFRP strips was reduced from 6 to 3 due to the shorter span length.
10"
5"5"
2'-3" 3'-4" 2'-3"12'
3'-4"10"
TEST 1 TEST 2

82
Table 3-4 shows the test matrix of test 24-1.5-1~4. Similar to tests 24-3-1 and 24-3-1r, test 24-1.5-1 intended to pre-crack and damaged beam for test 24-1.5-1r. Because test 24-1.5-1r did not fail due to reaching the capacity of loading setup, the beam was re-tested in a different setup as 24-1.5-1r2.
Test 24-1.5-2 was tested with CFRP strips without anchors and test 24-1.5-3 was tested without strengthening as a control test. Finally, test 24-3-4 was tested with 1 layer of CFRP strips spaced at 10 in.
Figure 3-43 Reinforcing steel and CFRP layout for 24 in. beams with a/d=1.5
Table 3-4 Test Matrix in deep beams with a/d=1.5 (24-1.5-1 ~4)
Test CFRP layout Variable
24-1.5-1 No CFRP (test to pre-crack the specimen) 24-1.5-1R 2 Layers, 5"@10” Strengthened, but load stopped due to setup capacity 24-1.5-1R2 2 Layers, 5"@10” Strengthened, Reloaded as 24-1.5-1R 24-1.5-2 2 Layers, 5"@10” No CFRP Anchor 24-1.5-3 No CFRP CONTROL 24-1.5-4 1 Layer, 5"@10” a/d ratio
48 in.-Deep Beams
The effect of an increase in the effective depth of CFRP sheets was investigated by increasing the beam depth to 48 in. In addition, this depth is more likely to be representative of

83
actual bridge elements. All 48 in. beam tests were conducted with a shear span to depth ratio of 3 because the shear capacities of beams with a shear span to depth ratio of 2 or less were found not to increase with CFRP application in the 24 in. beam series.
Figure 3-44 shows a cross-section of the 48 in. beams and the reinforcement layout. The width of the web (14 in.) was the same as in the 24 in. beams, such that the cross-sectional area was doubled in the deeper beams. Two stirrup spacings were used to evaluate the effect of the transverse steel ratio. One group had No.3 stirrups at 18 in. spacing on center, which met the minimum requirements. The other group had No.3 stirrups at 10 in. spacing on center, which provided the same transverse steel ratio as in the 24 in. beams. Skin reinforcement was provided in the tensile zone as required for beam depths greater than 36 in.
Figure 3-44 Reinforcement layout of 48 in.-deep beams
Minimum transverse steel ratio (Tests 48-3-1 to -4)
Four tests were conducted with the minimum transverse steel ratio—No.3 Grade 60 stirrups at 18 in. spacing on center. The CFRP layout was 10 in. wide strips spaced at 20 in. on center. The reinforcement and CFRP layout are shown in Figure 3-45. The ratio of CFRP material to concrete cross section in this layout is the same as that in the 24 in. beams with a/d=3.
8"
h=48"d=43"
TOP: 6#9 (Gr 60)
BOT: 12#10 (Gr 75)
Side bar : #3@6"
Stirrups: #3@18" ( 1~ 4 ) (Gr 60) #3@10" ( 5~ 8 )
21"
b=14"
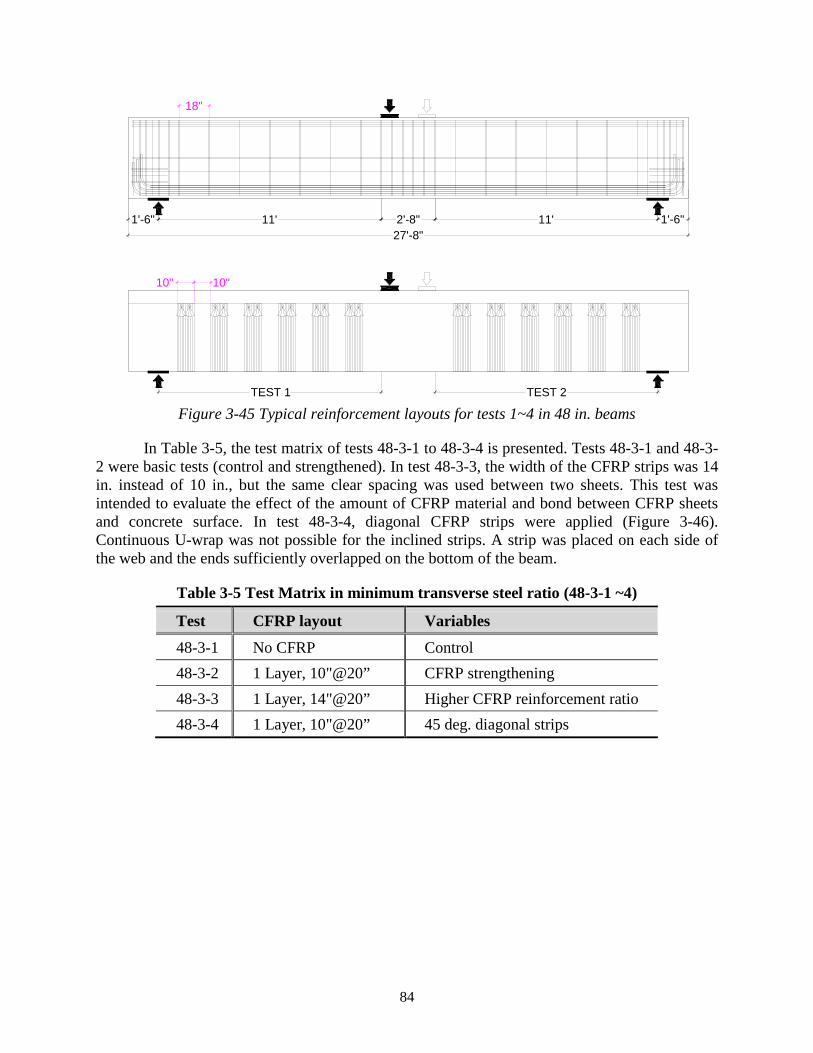
84
Figure 3-45 Typical reinforcement layouts for tests 1~4 in 48 in. beams
In Table 3-5, the test matrix of tests 48-3-1 to 48-3-4 is presented. Tests 48-3-1 and 48-3-2 were basic tests (control and strengthened). In test 48-3-3, the width of the CFRP strips was 14 in. instead of 10 in., but the same clear spacing was used between two sheets. This test was intended to evaluate the effect of the amount of CFRP material and bond between CFRP sheets and concrete surface. In test 48-3-4, diagonal CFRP strips were applied (Figure 3-46). Continuous U-wrap was not possible for the inclined strips. A strip was placed on each side of the web and the ends sufficiently overlapped on the bottom of the beam.
Table 3-5 Test Matrix in minimum transverse steel ratio (48-3-1 ~4)
Test CFRP layout Variables
48-3-1 No CFRP Control 48-3-2 1 Layer, 10"@20” CFRP strengthening 48-3-3 1 Layer, 14"@20” Higher CFRP reinforcement ratio 48-3-4 1 Layer, 10"@20” 45 deg. diagonal strips
TEST 2TEST 1
18"
10" 10"
2'-8"11'1'-6" 1'-6"11'27'-8"
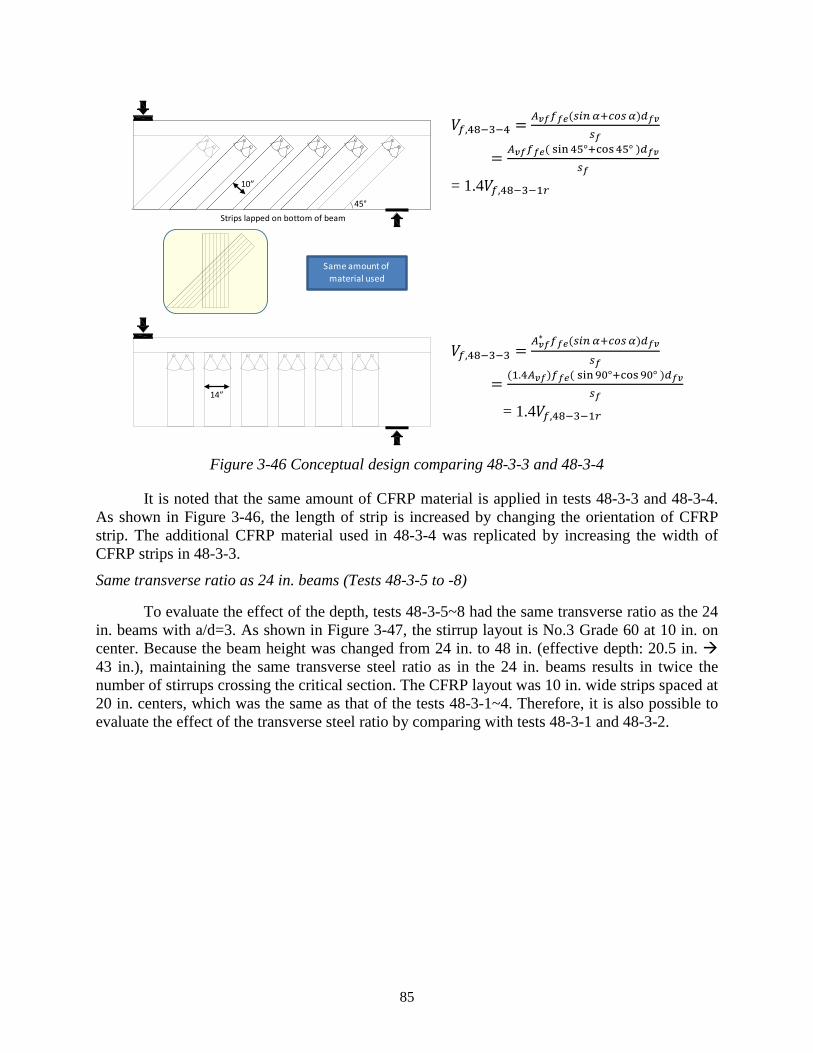
85
𝑉𝑓,48−3−4 = 𝐴𝑣𝑓𝑓𝑓𝑒(𝑠𝑖𝑛 𝛼+𝑐𝑜𝑠𝛼)𝑑𝑓𝑣𝑠𝑓
= 𝐴𝑣𝑓𝑓𝑓𝑒( sin45°+cos45° )𝑑𝑓𝑣𝑠𝑓
= 1.4𝑉𝑓,48−3−1𝑟
𝑉𝑓,48−3−3 = 𝐴𝑣𝑓∗ 𝑓𝑓𝑒(𝑠𝑖𝑛 𝛼+𝑐𝑜𝑠𝛼)𝑑𝑓𝑣
𝑠𝑓
= (1.4𝐴𝑣𝑓)𝑓𝑓𝑒( sin90°+cos90° )𝑑𝑓𝑣𝑠𝑓
= 1.4𝑉𝑓,48−3−1𝑟
Figure 3-46 Conceptual design comparing 48-3-3 and 48-3-4
It is noted that the same amount of CFRP material is applied in tests 48-3-3 and 48-3-4. As shown in Figure 3-46, the length of strip is increased by changing the orientation of CFRP strip. The additional CFRP material used in 48-3-4 was replicated by increasing the width of CFRP strips in 48-3-3.
Same transverse ratio as 24 in. beams (Tests 48-3-5 to -8)
To evaluate the effect of the depth, tests 48-3-5~8 had the same transverse ratio as the 24 in. beams with a/d=3. As shown in Figure 3-47, the stirrup layout is No.3 Grade 60 at 10 in. on center. Because the beam height was changed from 24 in. to 48 in. (effective depth: 20.5 in. 43 in.), maintaining the same transverse steel ratio as in the 24 in. beams results in twice the number of stirrups crossing the critical section. The CFRP layout was 10 in. wide strips spaced at 20 in. centers, which was the same as that of the tests 48-3-1~4. Therefore, it is also possible to evaluate the effect of the transverse steel ratio by comparing with tests 48-3-1 and 48-3-2.
Same amount of material used
Same shear contribution
14”
10”
45° Strips lapped on bottom of beam
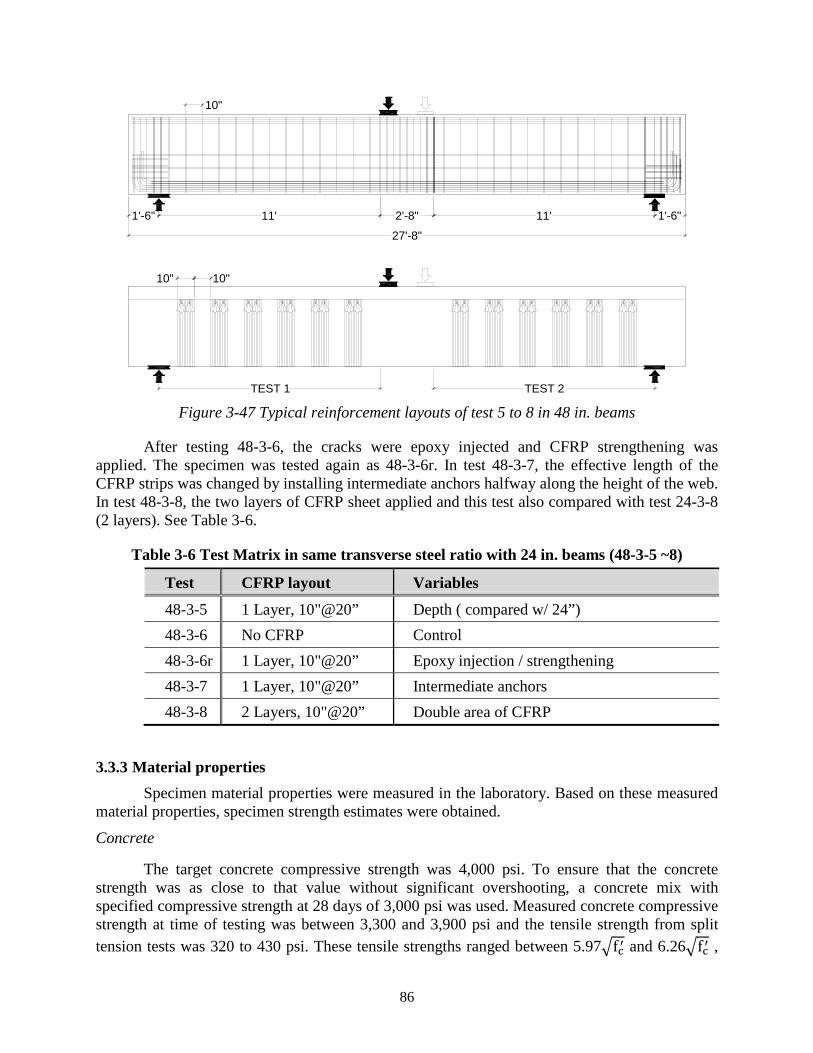
86
Figure 3-47 Typical reinforcement layouts of test 5 to 8 in 48 in. beams
After testing 48-3-6, the cracks were epoxy injected and CFRP strengthening was applied. The specimen was tested again as 48-3-6r. In test 48-3-7, the effective length of the CFRP strips was changed by installing intermediate anchors halfway along the height of the web. In test 48-3-8, the two layers of CFRP sheet applied and this test also compared with test 24-3-8 (2 layers). See Table 3-6.
Table 3-6 Test Matrix in same transverse steel ratio with 24 in. beams (48-3-5 ~8)
Test CFRP layout Variables
48-3-5 1 Layer, 10"@20” Depth ( compared w/ 24”) 48-3-6 No CFRP Control 48-3-6r 1 Layer, 10"@20” Epoxy injection / strengthening 48-3-7 1 Layer, 10"@20” Intermediate anchors 48-3-8 2 Layers, 10"@20” Double area of CFRP
3.3.3 Material properties Specimen material properties were measured in the laboratory. Based on these measured
material properties, specimen strength estimates were obtained.
Concrete
The target concrete compressive strength was 4,000 psi. To ensure that the concrete strength was as close to that value without significant overshooting, a concrete mix with specified compressive strength at 28 days of 3,000 psi was used. Measured concrete compressive strength at time of testing was between 3,300 and 3,900 psi and the tensile strength from split tension tests was 320 to 430 psi. These tensile strengths ranged between 5.97�fc′ and 6.26�fc′ ,
10" 10"
10"
TEST 2TEST 1
2'-8" 11' 1'-6"1'-6" 11'
27'-8"
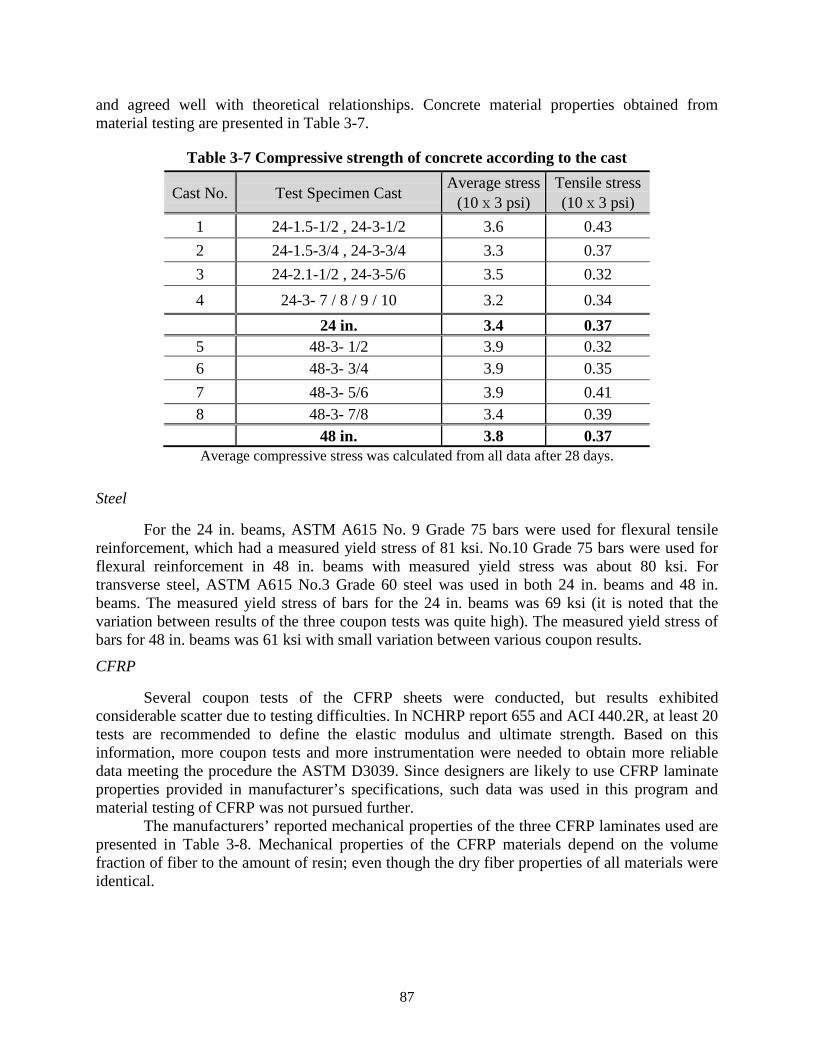
87
and agreed well with theoretical relationships. Concrete material properties obtained from material testing are presented in Table 3-7.
Table 3-7 Compressive strength of concrete according to the cast
Cast No. Test Specimen Cast Average stress (10ⅹ3 psi)
Tensile stress (10ⅹ3 psi)
1 24-1.5-1/2 , 24-3-1/2 3.6 0.43 2 24-1.5-3/4 , 24-3-3/4 3.3 0.37 3 24-2.1-1/2 , 24-3-5/6 3.5 0.32 4 24-3- 7 / 8 / 9 / 10 3.2 0.34
24 in. 3.4 0.37 5 48-3- 1/2 3.9 0.32 6 48-3- 3/4 3.9 0.35 7 48-3- 5/6 3.9 0.41 8 48-3- 7/8 3.4 0.39
48 in. 3.8 0.37 Average compressive stress was calculated from all data after 28 days.
Steel
For the 24 in. beams, ASTM A615 No. 9 Grade 75 bars were used for flexural tensile reinforcement, which had a measured yield stress of 81 ksi. No.10 Grade 75 bars were used for flexural reinforcement in 48 in. beams with measured yield stress was about 80 ksi. For transverse steel, ASTM A615 No.3 Grade 60 steel was used in both 24 in. beams and 48 in. beams. The measured yield stress of bars for the 24 in. beams was 69 ksi (it is noted that the variation between results of the three coupon tests was quite high). The measured yield stress of bars for 48 in. beams was 61 ksi with small variation between various coupon results.
CFRP
Several coupon tests of the CFRP sheets were conducted, but results exhibited considerable scatter due to testing difficulties. In NCHRP report 655 and ACI 440.2R, at least 20 tests are recommended to define the elastic modulus and ultimate strength. Based on this information, more coupon tests and more instrumentation were needed to obtain more reliable data meeting the procedure the ASTM D3039. Since designers are likely to use CFRP laminate properties provided in manufacturer’s specifications, such data was used in this program and material testing of CFRP was not pursued further.
The manufacturers’ reported mechanical properties of the three CFRP laminates used are presented in Table 3-8. Mechanical properties of the CFRP materials depend on the volume fraction of fiber to the amount of resin; even though the dry fiber properties of all materials were identical.
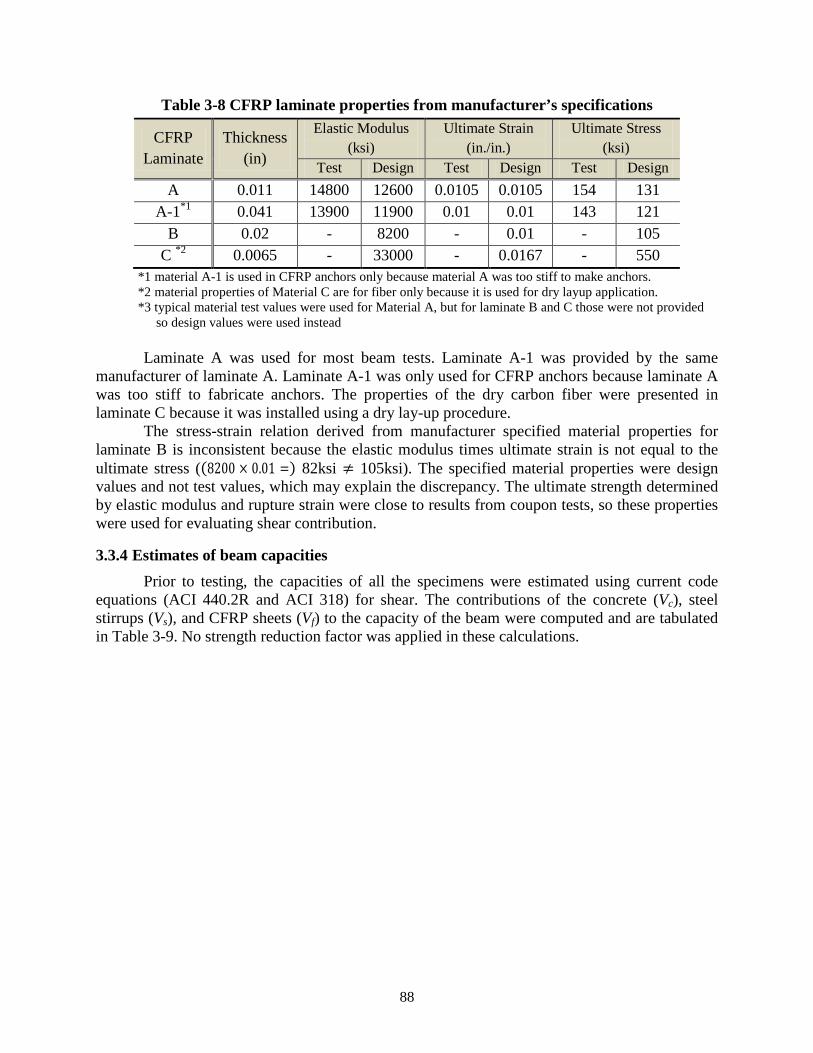
88
Table 3-8 CFRP laminate properties from manufacturer’s specifications
CFRP Laminate
Thickness (in)
Elastic Modulus (ksi)
Ultimate Strain (in./in.)
Ultimate Stress (ksi)
Test Design Test Design Test Design A 0.011 14800 12600 0.0105 0.0105 154 131
A-1*1 0.041 13900 11900 0.01 0.01 143 121 B 0.02 - 8200 - 0.01 - 105
C *2 0.0065 - 33000 - 0.0167 - 550 *1 material A-1 is used in CFRP anchors only because material A was too stiff to make anchors. *2 material properties of Material C are for fiber only because it is used for dry layup application. *3 typical material test values were used for Material A, but for laminate B and C those were not provided
so design values were used instead Laminate A was used for most beam tests. Laminate A-1 was provided by the same
manufacturer of laminate A. Laminate A-1 was only used for CFRP anchors because laminate A was too stiff to fabricate anchors. The properties of the dry carbon fiber were presented in laminate C because it was installed using a dry lay-up procedure.
The stress-strain relation derived from manufacturer specified material properties for laminate B is inconsistent because the elastic modulus times ultimate strain is not equal to the ultimate stress ((8200 × 0.01 =) 82ksi ≠ 105ksi). The specified material properties were design values and not test values, which may explain the discrepancy. The ultimate strength determined by elastic modulus and rupture strain were close to results from coupon tests, so these properties were used for evaluating shear contribution.
3.3.4 Estimates of beam capacities Prior to testing, the capacities of all the specimens were estimated using current code
equations (ACI 440.2R and ACI 318) for shear. The contributions of the concrete (Vc), steel stirrups (Vs), and CFRP sheets (Vf) to the capacity of the beam were computed and are tabulated in Table 3-9. No strength reduction factor was applied in these calculations.
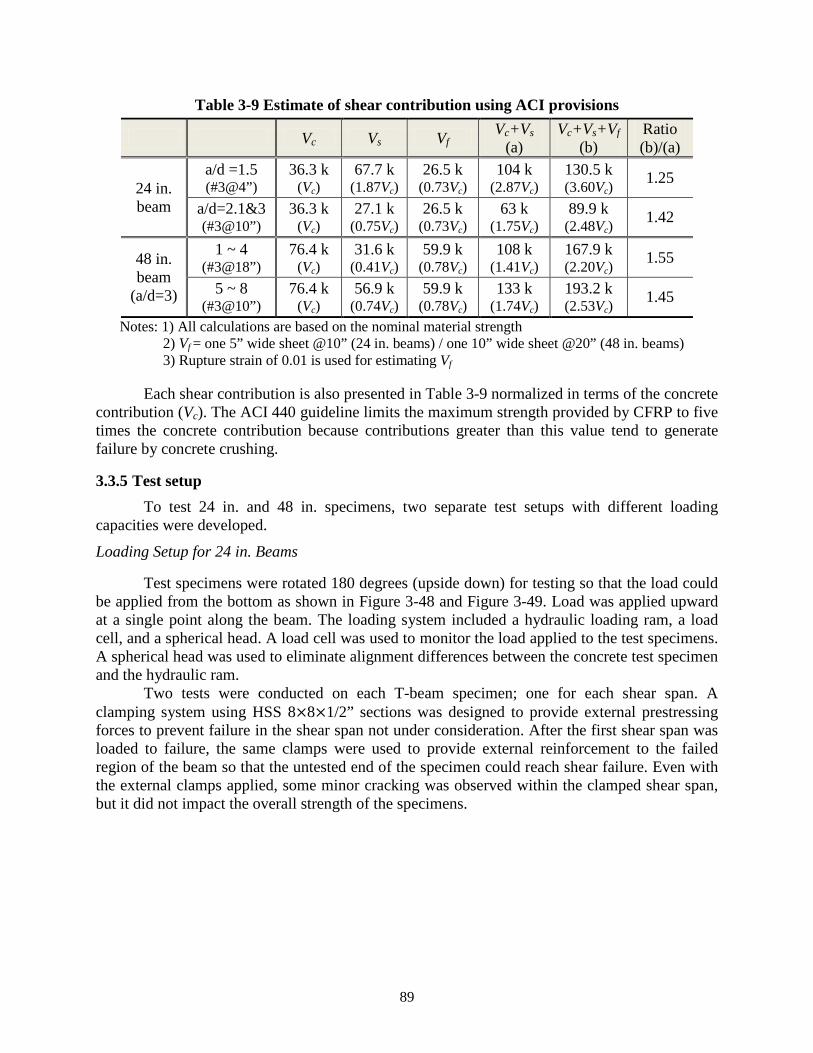
89
Table 3-9 Estimate of shear contribution using ACI provisions
Vc Vs Vf Vc+Vs
(a) Vc+Vs+Vf
(b) Ratio (b)/(a)
24 in. beam
a/d =1.5 (#3@4”)
36.3 k (Vc)
67.7 k (1.87Vc)
26.5 k (0.73Vc)
104 k (2.87Vc)
130.5 k (3.60Vc)
1.25
a/d=2.1&3 (#3@10”)
36.3 k (Vc)
27.1 k (0.75Vc)
26.5 k (0.73Vc)
63 k (1.75Vc)
89.9 k (2.48Vc)
1.42
48 in. beam
(a/d=3)
1 ~ 4 (#3@18”)
76.4 k (Vc)
31.6 k (0.41Vc)
59.9 k (0.78Vc)
108 k (1.41Vc)
167.9 k (2.20Vc)
1.55
5 ~ 8 (#3@10”)
76.4 k (Vc)
56.9 k (0.74Vc)
59.9 k (0.78Vc)
133 k (1.74Vc)
193.2 k (2.53Vc)
1.45
Notes: 1) All calculations are based on the nominal material strength 2) Vf = one 5” wide sheet @10” (24 in. beams) / one 10” wide sheet @20” (48 in. beams) 3) Rupture strain of 0.01 is used for estimating Vf
Each shear contribution is also presented in Table 3-9 normalized in terms of the concrete contribution (Vc). The ACI 440 guideline limits the maximum strength provided by CFRP to five times the concrete contribution because contributions greater than this value tend to generate failure by concrete crushing.
3.3.5 Test setup To test 24 in. and 48 in. specimens, two separate test setups with different loading
capacities were developed.
Loading Setup for 24 in. Beams
Test specimens were rotated 180 degrees (upside down) for testing so that the load could be applied from the bottom as shown in Figure 3-48 and Figure 3-49. Load was applied upward at a single point along the beam. The loading system included a hydraulic loading ram, a load cell, and a spherical head. A load cell was used to monitor the load applied to the test specimens. A spherical head was used to eliminate alignment differences between the concrete test specimen and the hydraulic ram.
Two tests were conducted on each T-beam specimen; one for each shear span. A clamping system using HSS 8×8×1/2” sections was designed to provide external prestressing forces to prevent failure in the shear span not under consideration. After the first shear span was loaded to failure, the same clamps were used to provide external reinforcement to the failed region of the beam so that the untested end of the specimen could reach shear failure. Even with the external clamps applied, some minor cracking was observed within the clamped shear span, but it did not impact the overall strength of the specimens.

90
Figure 3-48 Photo of loading setup for 24 in. depth beams
Figure 3-49 Loading setup for 24 in. beams
Loading Setup for 48 in. Beams
A W-section supported a loading ram that allowed the test specimens to be loaded in a downward direction (Figure 3-50). An elevation view of the high capacity test setup is shown in Figure 3-51. Similar to the loading setup of 24 in. beams, two tests were conducted per beam with same clamping system.
5'-8"6'-4"
2'12'2'
2'
EXTERNAL PRESTRESSEDCLAMPS TYP.
HYDRAULIC RAMLOAD CELLSPHERICAL HEAD
PIN SUPPORT
BEARING PL. 14"x12"x1"
BEAM SECTION

91
Figure 3-50 Photo of loading setup for 48 in. depth beams
Figure 3-51 Loading setup for 48 in. beams
Bearing pads were used for both end supports to stabilize the slender beams. Moreover, lateral rods were installed to monitor and resist unexpected lateral beam movement caused by uneven loading.
W-SECTION CROSS BEAM
EXTERNALPRESTRESSEDCLAMPS
CONCRETE BLOCK
BEARING PADSTEEL PLATEHYDROSTONE
27'-8"
1'-6" 11' 13'-8" 1'-6"
HYDRAULIC RAM
SPHERICAL HEAD
MAIN LOAD CELL
W-SECTION CROSS BEAM
LOADING BEAM
STEEL COLUMNS
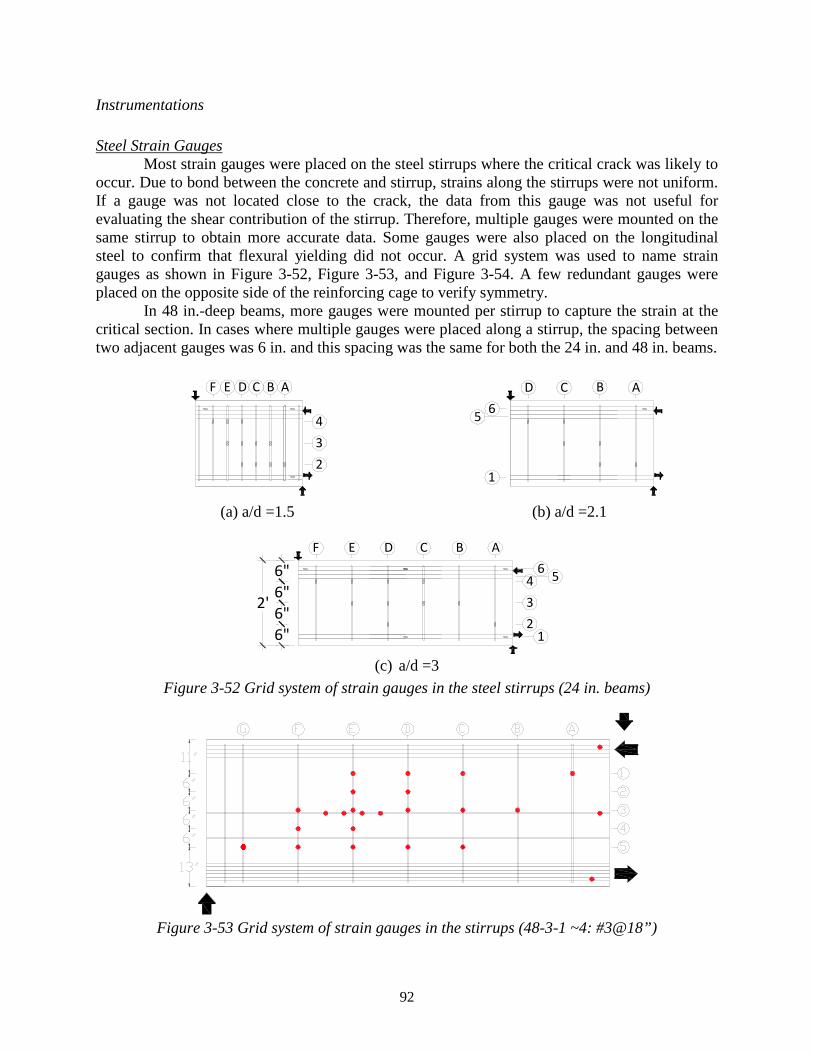
92
Instrumentations
Steel Strain Gauges Most strain gauges were placed on the steel stirrups where the critical crack was likely to
occur. Due to bond between the concrete and stirrup, strains along the stirrups were not uniform. If a gauge was not located close to the crack, the data from this gauge was not useful for evaluating the shear contribution of the stirrup. Therefore, multiple gauges were mounted on the same stirrup to obtain more accurate data. Some gauges were also placed on the longitudinal steel to confirm that flexural yielding did not occur. A grid system was used to name strain gauges as shown in Figure 3-52, Figure 3-53, and Figure 3-54. A few redundant gauges were placed on the opposite side of the reinforcing cage to verify symmetry.
In 48 in.-deep beams, more gauges were mounted per stirrup to capture the strain at the critical section. In cases where multiple gauges were placed along a stirrup, the spacing between two adjacent gauges was 6 in. and this spacing was the same for both the 24 in. and 48 in. beams.
(a) a/d =1.5 (b) a/d =2.1
(c) a/d =3
Figure 3-52 Grid system of strain gauges in the steel stirrups (24 in. beams)
Figure 3-53 Grid system of strain gauges in the stirrups (48-3-1 ~4: #3@18”)
ABCDEF
234
D C B A
1
5 6
6"6"6"6"
234
1
56ABCDEF
2'

93
Figure 3-54 Grid system of strain gauges in the stirrups (48-3-5 ~8: #3@10”)
CFRP Strain Gauges To evaluate the CFRP shear contribution, several gauges were also mounted on the
surface of CFRP sheets. Because the strain range of CFRP is up to 0.01, much greater than that of steel, a different type of strain gauge was used. No waterproofing treatment was needed because the CFRP gauges were mounted on the surface of the CFRP sheets.
A separate grid system was developed for naming CFRP gauges, as shown in Figure 3-55 and Figure 3-56. Strain gauges were placed at intersections of the grid lines that were likely to be near the critical crack. Similar to the steel gauges, a few redundant CFRP gauges were placed on the opposite side of the concrete specimen. The strain distribution in the CFRP strip was not uniform along the length of the strip and across the width. Therefore multiple gauges were mounted across the width of some CFRP strips.
Figure 3-55 Grid system of strain gauge in the CFRP (24 in. beams)
1
2
ABCDABC
(a) a/d=1.5 (b) a/d=2.1
(c) a/d=3
ABCDEF
1
24"
6"
2'
14"

94
Figure 3-56 Grid system of strain gauge in the CFRP (48 in. beams)
Linear Variable Differential Transformers (LVDTs) Beam displacements and shear deformations were monitored by several linear variable
differential transformers (LVDTs). According to the loading setup, different measurement schemes were used.
In the 24 in. beam tests, six LVDTs were used to monitor the beam displacements. To adjust for the rigid body motion due to support movements (elongation of support rods), the displacements of both supports as well as the displacement at the loading point were measured. In addition, to monitor and adjust the possible uneven displacement between the front and back sides, LVDTs were mounted on both sides. In the 48 in. beam tests, only two LVDTs were used to monitor the overall beam displacement at the loading point because support displacements were negligible. Therefore the actual displacement was equal to the measured displacement at the loading point.
In the 24 in. beams, three LVDTs were used to monitor the shear deformation and were arranged in a triangular shape as shown in Figure 3-57. Because the data collected from LVDT’s is not the strain value, each deformation value needs to be divided by the original measurement length. Using Mohr’s circle, the shear strain was evaluated from these three strains and the angle of the diagonal leg. It should be noted that strain measurements obtained using this system are average strain measurements across the measurement length. In most but not all tests, the LVDT setup intersected the main shear cracks. Shear strain measurements were much smaller in the cases where the cracks were not intersected.

95
Figure 3-57 LVDTs configuration for shear strain in 24 in. beam
3.3.6 Specimen construction 24in.-deep beams
A cross section of the formwork for the 24in.-deep specimens is presented in Figure 3-58. The formwork consisted of multiple 8-ft. and 4-ft. modules of 2x4 and 2x6 frames. This modular construction allowed the formwork to be bolted together to develop the desired lengths (12-ft. or 16-ft.) of the specimens. Since the forms were bolted together, they could easily be disassembled for removal and quickly reassembled for another casting.
Figure 3-58 Schematic cross section of the specimens’ formwork
All 2x6 framing, faced with plywood, created the 7-in. by 19-in. block outs of the T-section. The 2x4 framing formed the outer edge of the flange with a 0.75-in. screed lip along the top most surface of the concrete specimen. This lip provided an area for loose aggregate to fall while a screed leveled the surface of the specimens. Well oiled, higher grade B/C plywood was used to form all the surfaces of the concrete beams in order to limit excessive wear and tear on the forms due to multiple uses. In Figure 3-59, an image of the wood formwork during construction is shown.
The formwork permitted construction of two specimens at one time, thereby reducing the required concrete pouring operations. The modular construction of the forms aided in this,
2’ 1’
1’-8 13/16”
30°
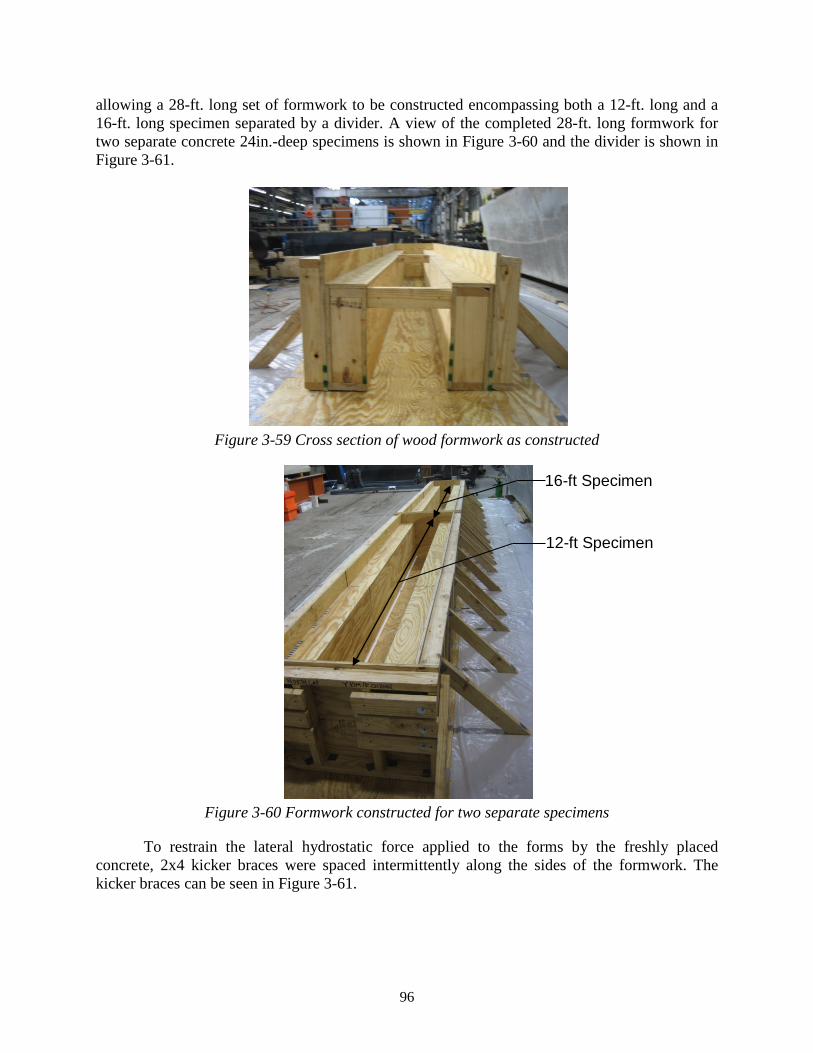
96
allowing a 28-ft. long set of formwork to be constructed encompassing both a 12-ft. long and a 16-ft. long specimen separated by a divider. A view of the completed 28-ft. long formwork for two separate concrete 24in.-deep specimens is shown in Figure 3-60 and the divider is shown in Figure 3-61.
Figure 3-59 Cross section of wood formwork as constructed
Figure 3-60 Formwork constructed for two separate specimens
To restrain the lateral hydrostatic force applied to the forms by the freshly placed concrete, 2x4 kicker braces were spaced intermittently along the sides of the formwork. The kicker braces can be seen in Figure 3-61.
16-ft Specimen
12-ft Specimen

97
Figure 3-61 Lateral kicker braces and internal form divider
To minimize sharp corners where CFRP will be placed, chamfer strips were installed along each of the 90 degree corners to develop a rounded edge with a radius of 0.5-in. (Figure 3-62). The chamfer strips consisted of decorative molding purchased at a local hardware store. The molding was ripped to the appropriate dimensions using a standard band saw.
Figure 3-62 Chamfer strips provided at 90 degree corners to provide a sufficiently rounded
corner for CFRP materials
In all specimens, the longitudinal reinforcement consisted of ten #9, grade 75 bars placed in two rows of 5 bars within each row. These bars were hooked according to ACI 318-08 guidelines to provide enough anchorage to develop the full flexural strength of the steel bars. Additional longitudinal reinforcement was placed within the compression region of the concrete specimens to prevent a flexural concrete crushing failure from occurring. This reinforcement consisted of five #9, grade 60 bars placed in one row. Figure 3-63 shows the longitudinal steel placed in the steel reinforcing cage.

98
Figure 3-63 12-ft. steel reinforcing cage with stirrups spaced at 4-in. for deep beam test
specimen
Because the test specimens were to be cast in a location different from where they were to be tested, consideration had to be given to transportation of the specimens through the research laboratory. Steel lifting inserts were provided near the ends of each specimen as shown in Figure 3-64.
Additional consideration had to be given to the orientation of the specimens during testing. It was required to rotate the concrete specimens 180° before inserting them into the loading test setup. In order to place the specimens in their test positions, it was necessary to install a second lifting insert along the bottom surface of the beam’s web (Figure 3-64).
Figure 3-64 Lifting inserts provided near the ends of each specimen
The completed reinforcing cages were placed in the formwork (Figure 3-65) with reinforcing chairs to maintain a minimum concrete cover of 1.5-in on all reinforcement. Reinforcement (slab steel) for the flange of the T-beam specimens consisted of #3 bars with spacing equal to that of the transverse reinforcement.

99
Figure 3-65 A completed reinforcing cage with slab reinforcement installed
3.3.7 Concrete
A 28-day compressive strength of 3,000-psi was specified to keep the concrete contribution to shear strength low which would allow the internal steel reinforcement and external CFRP to provide larger contributions to the total shear capacity of the test specimens.
The typical concrete mix design used by the ready mix provider consisted of the following:
• 4-1/4 Sack (A measure of the amount of Portland cement included)
• 25% Fly Ash
• 3/4-in. Maximum Aggregate Size
• 6 to 8-in. Slump No admixtures were included in the mix design other than a super plasticizer used to
increase workability and to control the curing time in the high temperature laboratory conditions. A sufficient number of 4-in. by 8-in. concrete compressive cylinders were cast with each set of specimens to monitor the compressive strength of the concrete. Care was taken to allow the cylinders to cure in an environment similar to that of the test specimens. A concrete bucket was used to move concrete from the delivery truck to the forms (Figure 3-66). This allowed the concrete to be placed in three lifts. The first lift covered only the tensile reinforcement at the bottom of the forms. The second filled the web of the specimens and finally, the third lift completed placement of the flange portion of the beam. Each lift of concrete was vibrated to ensure that all voids were filled in the closely spaced reinforcing cage (Figure 3-67). The top surface of the concrete was then screeded and leveled with trowels (Figure 3-68).

100
Figure 3-66 Placing concrete within the formwork
Figure 3-67 Vibrating the concrete

101
Figure 3-68 Screeding the top surface of the beams
The specimens were cured under plastic for a minimum of 3-days and then forms were removed to expose all surfaces of the beams to air. The beams were then left to cure in the laboratory until testing.
48in.-deep beams
Formwork for 48 in.-deep beams consisted of steel forms available at the Fergusson laboratory that were modified for this application. Chamfers strips were also used in the 48in.-deep forms. Construction and pouring of the 48in.-deep beams proceeded in the same fashion as for 24in.-deep beams.
3.4 T-Beam Fatigue and Sustained Loading Tests Four full scale reinforced concrete T-beams were constructed. CFRP was applied to the
surface of the reinforced concrete beams in various layouts in accordance with the research objectives. The CFRP strips were anchored using anchors made of CFRP. The specimens were then tested to determine the effectiveness of differing CFRP layouts in fatigue and sustained loading shear applications. Test specimen design and material specifications were the same as for the 24in.-deep specimens tested monotonically.
3.4.1 Fatigue test series Two test specimens were subjected to fatigue loading. The following sections describe
the test nomenclature system and testing procedures used throughout fatigue testing.
Test Nomenclature
A nomenclature system was developed to designate each test. Each test label consisted of four parts separated by hyphens. The first number indicated the overall depth of the test specimen in inches. The second number indicated the shear span-to-depth ratio. The third part indicated the type of test being conducted. Tests represented with the word “Fatigue” describe test specimens that were subjected to cycled loading and tests represented with the words “Fatigue-Fail” describe previously fatigue loaded specimens that were then monotonically

102
loaded to ultimate failure. Finally, the fourth number represents the specific test number within the test series. For specimens tested under fatigue loading, a letter “B” follows the test number to represent the testing end of the specimen strengthened using bonded CFRP and the letter “U” represents the testing end strengthened using unbonded CFRP. A graphical representation of this nomenclature system is presented in Figure 3-69.
Figure 3-69 Test Nomenclature
Testing Procedure
Each test specimen was placed in the test setup displayed in Figure 3-70. The first specimen was strengthened using CFRP laminates prior to the initial cracking of the specimen. This specimen was initially loaded after strengthening using an open loop pump to a level great enough to produce shear crack widths equal to 0.013-in. on each end of the specimen, the maximum allowable crack width of in-service reinforced concrete beams in the region where testing was conducted. Once the test specimen was cracked, the load was removed and the hydraulic ram was attached to a closed loop pump that would control fatigue loading. The second specimen was loaded using the same open loop pump to a level producing crack widths equal to 0.013-in. on each end of the specimen prior to the application of CFRP laminates. The specimen was then strengthened using CFRP laminates before cyclic loads were applied. Each test specimen was then tested between a range of 70-kips and 90-kips for approximately 1 million cycles. After this, the test specimen was unloaded and then reloaded and cycled between a load of 110-kips and 130-kips for approximately 2.5 million additional cycles.
24" 3 FATIGUE
4
SPECIMENDEPTH
SPAN TODEPTHRATIO
TESTTYPE
3
2
1
TESTNUMBER
FATIGUE-FAIL
U
B
CFRPAPPLICATION
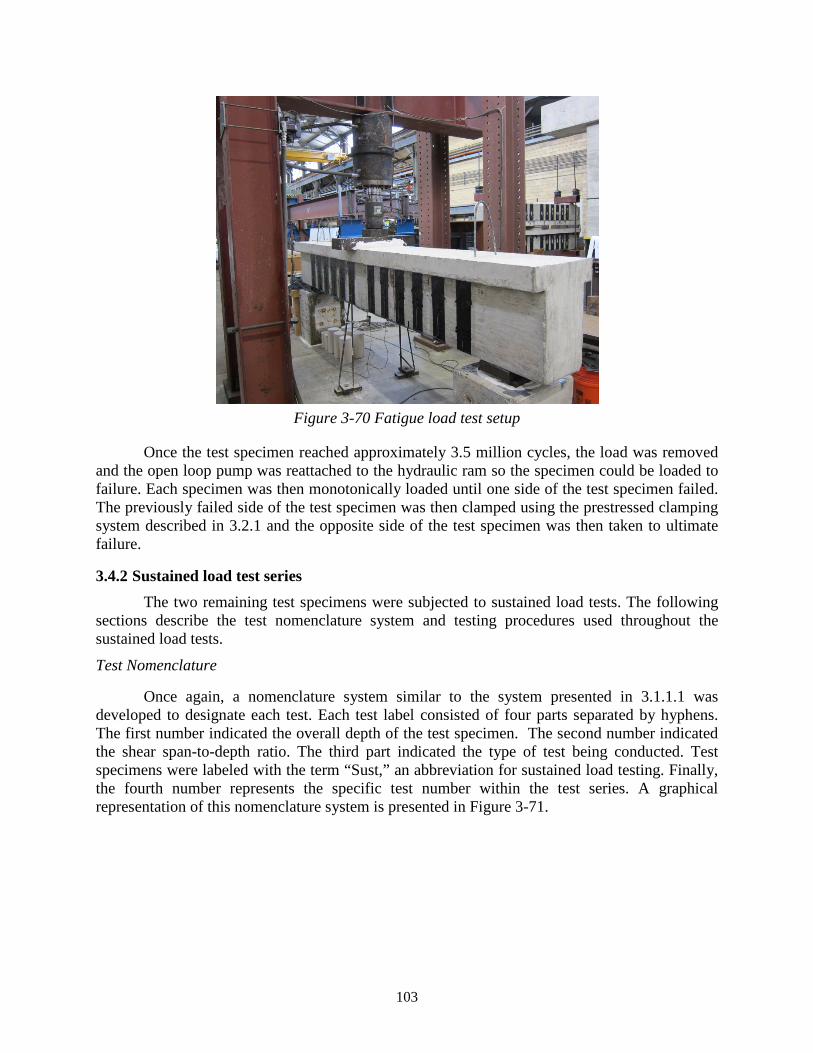
103
Figure 3-70 Fatigue load test setup
Once the test specimen reached approximately 3.5 million cycles, the load was removed and the open loop pump was reattached to the hydraulic ram so the specimen could be loaded to failure. Each specimen was then monotonically loaded until one side of the test specimen failed. The previously failed side of the test specimen was then clamped using the prestressed clamping system described in 3.2.1 and the opposite side of the test specimen was then taken to ultimate failure.
3.4.2 Sustained load test series The two remaining test specimens were subjected to sustained load tests. The following
sections describe the test nomenclature system and testing procedures used throughout the sustained load tests.
Test Nomenclature
Once again, a nomenclature system similar to the system presented in 3.1.1.1 was developed to designate each test. Each test label consisted of four parts separated by hyphens. The first number indicated the overall depth of the test specimen. The second number indicated the shear span-to-depth ratio. The third part indicated the type of test being conducted. Test specimens were labeled with the term “Sust,” an abbreviation for sustained load testing. Finally, the fourth number represents the specific test number within the test series. A graphical representation of this nomenclature system is presented in Figure 3-71.
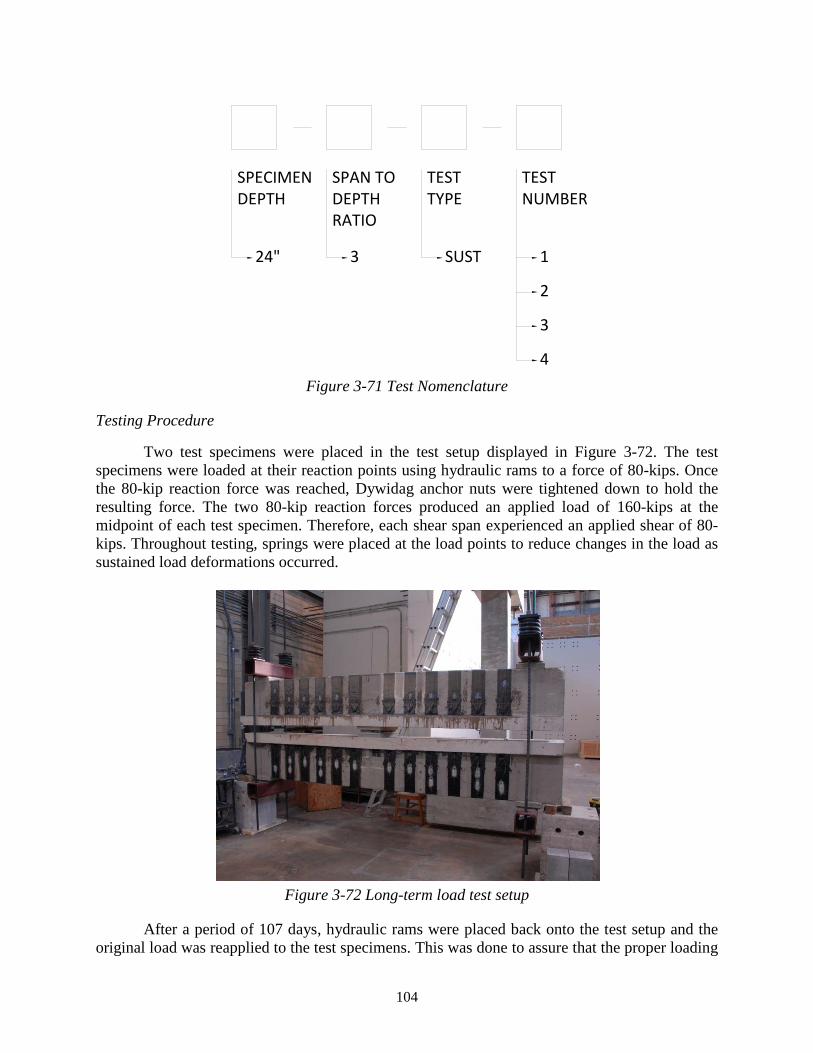
104
Figure 3-71 Test Nomenclature
Testing Procedure
Two test specimens were placed in the test setup displayed in Figure 3-72. The test specimens were loaded at their reaction points using hydraulic rams to a force of 80-kips. Once the 80-kip reaction force was reached, Dywidag anchor nuts were tightened down to hold the resulting force. The two 80-kip reaction forces produced an applied load of 160-kips at the midpoint of each test specimen. Therefore, each shear span experienced an applied shear of 80-kips. Throughout testing, springs were placed at the load points to reduce changes in the load as sustained load deformations occurred.
Figure 3-72 Long-term load test setup
After a period of 107 days, hydraulic rams were placed back onto the test setup and the original load was reapplied to the test specimens. This was done to assure that the proper loading
24" 3 SUST
4
SPECIMENDEPTH
SPAN TODEPTHRATIO
TESTTYPE
3
2
1
TESTNUMBER

105
level was maintained throughout testing. The reapplication of load resulted in a slight increase in steel and CFRP strains at the 107 day point of loading.
3.4.3 Material properties Steel material properties were the same as those of the 24in.-deep beams series tested
monotonically. CFRP materials were Laminate A for strips and Laminate A-1 for anchors (see Table 3-8). The same concrete mix was also used in the fatigue and sustained loading test specimens as in the 24in.deep beam series. Measured concrete properties for the sustained and fatigue tests specimens are given Figure 3-73.
Figure 3-73 Average concrete compressive strength for each cast
3.4.4 Instrumentation Steel strain gauges
The strain in the steel reinforcement was monitored using strain gauges. These gauges were placed on the steel stirrups and on the longitudinal steel. The majority of gauges were placed on the steel stirrups to monitor changes in strain in the stirrups. Some additional gauges were then placed on the longitudinal steel to monitor flexural response.
A grid system was developed to maintain consistency in the placement of the steel strain gauges for all the test specimens. The grid developed for the steel strain gauges is displayed in Figure 3-74. For each test specimen, gauges were placed along certain intersections of the grid lines on one side of the test specimen. Several redundant gauges were also placed on the opposite side of the reinforcement cage in critical locations along the shear span. Steel strain gauges were placed in the same grid locations for all four test specimens.

106
Figure 3-74 Steel strain gauge grid for all test specimens
In order to keep track of the gauges used during testing, nomenclature was developed to organize the strain information. Each gauge was designated by its grid placement. Redundant gauges were labeled with an additional R and gauges located on the side strengthened using unbonded CFRP were labeled with an additional O. Figure 3-75 presents details of the nomenclature described above.
Figure 3-75 Steel strain gauge nomenclature
CFRP Strain Gauges
CFRP strains were monitored using a system similar to that used for monitoring steel strains. The CFRP gauges consisted of a standard electrical resistor similar to the ones used in the steel gauges and displayed in Figure 3-76. Since the CFRP gauges would be exposed on the surface of the CFRP strips, it was important to protect the gauges from any external damage. In the case of gauges used during fatigue testing, a black rubber pad was placed over the surface of the CFRP gauge to shield the gauge from damage prior to and during testing (Figure 3-77).
ABCDEF1
3456
A.1
TEST REGION
212"
3"
6"
112"
3"
2'-8" 10" 10" 10" 10" 10" 812"
5"
1'-7"2'
23"
312" 2.1
24" 3 FATIGUE
SUST
1 THRU 6
A THRU F
R
SPECIMENDEPTH
SPAN TODEPTHRATIO
TESTTYPE
INDICATESREDUNDANCY
GRID GRID
O
INDICATESUNBONDED CFRP

107
Figure 3-76 CFRP strain gauge (Pham, 2009)
Figure 3-77 Rubber pad used to protect CFRP gauge
For gauges used to monitor CFRP strains in the sustained load tests, a different protection system was used. Since the tests were going to be conducted over a long period of time, preparations were made so that the test specimens could be moved possibly outdoors. Because of this, the CFRP gauges needed to be protected against the elements. A small wax coating was placed over the surface of the gauge to prevent water from damaging the gauge. Then a silicone coating was used to seal the wax around the gauge and to provide an additional layer of protection against any external damage throughout the course of testing. A photo of the protection system used for the long-term CFRP gauges is shown in Figure 3-78.

108
Figure 3-78 Long-term load gauge protection covering
A second grid system was developed to help maintain consistency in the placement of the CFRP strain gauges for all the test specimens. The grid developed for the CFRP strain gauges is displayed in Figure 3-79. For each test specimen, gauges were placed along certain intersections of the grid lines on one side of the test specimen. Once again, several redundant gauges were also placed on the opposite side of the test specimen in critical locations along the shear span. Similar to the steel gauges, CFRP strain gauges were placed in the same grid locations for all four test specimens.
Figure 3-79 CFRP strain gauge grid for all test specimens
In order to keep track of the CFRP gauges used during testing, separate nomenclature (Figure 3-80) was developed to organize the strain information. Each gauge was once again designated by its grid placement, but each CFRP gauge was prefaced by a letter F, denoting a gauge placed directly on the fiber material. Redundant gauges were labeled with an additional R and gauges located on unbonded CFRP were labeled with an additional O.
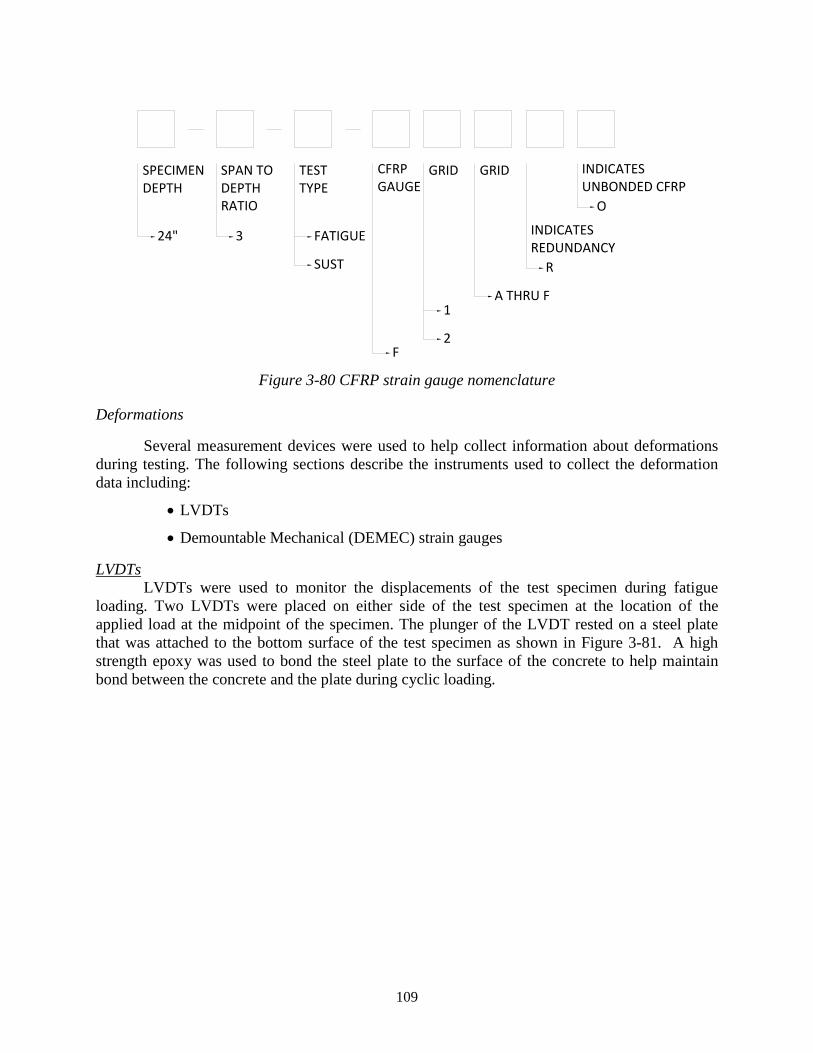
109
Figure 3-80 CFRP strain gauge nomenclature
Deformations
Several measurement devices were used to help collect information about deformations during testing. The following sections describe the instruments used to collect the deformation data including:
• LVDTs
• Demountable Mechanical (DEMEC) strain gauges
LVDTs LVDTs were used to monitor the displacements of the test specimen during fatigue
loading. Two LVDTs were placed on either side of the test specimen at the location of the applied load at the midpoint of the specimen. The plunger of the LVDT rested on a steel plate that was attached to the bottom surface of the test specimen as shown in Figure 3-81. A high strength epoxy was used to bond the steel plate to the surface of the concrete to help maintain bond between the concrete and the plate during cyclic loading.
24" 3 FATIGUE
SUST
1A THRU F
R
SPECIMENDEPTH
SPAN TODEPTHRATIO
TESTTYPE
INDICATESREDUNDANCY
GRID GRID
O
INDICATESUNBONDED CFRP
F
CFRPGAUGE
2
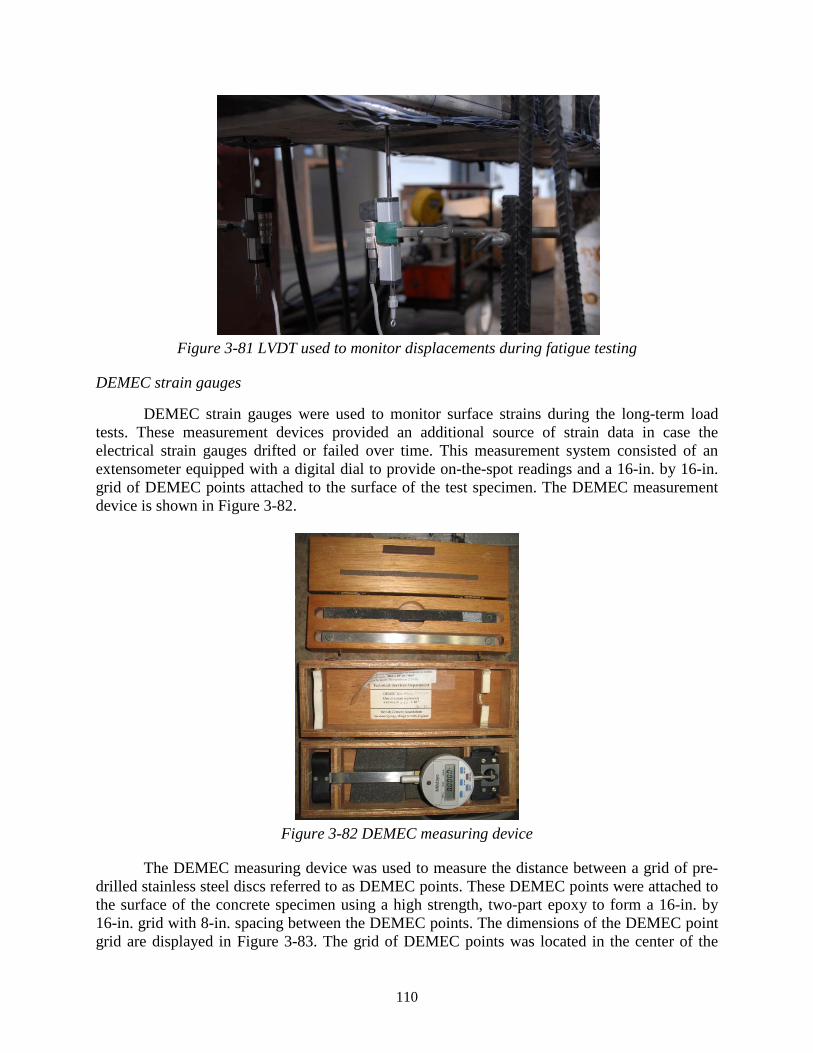
110
Figure 3-81 LVDT used to monitor displacements during fatigue testing
DEMEC strain gauges
DEMEC strain gauges were used to monitor surface strains during the long-term load tests. These measurement devices provided an additional source of strain data in case the electrical strain gauges drifted or failed over time. This measurement system consisted of an extensometer equipped with a digital dial to provide on-the-spot readings and a 16-in. by 16-in. grid of DEMEC points attached to the surface of the test specimen. The DEMEC measurement device is shown in Figure 3-82.
Figure 3-82 DEMEC measuring device
The DEMEC measuring device was used to measure the distance between a grid of pre-drilled stainless steel discs referred to as DEMEC points. These DEMEC points were attached to the surface of the concrete specimen using a high strength, two-part epoxy to form a 16-in. by 16-in. grid with 8-in. spacing between the DEMEC points. The dimensions of the DEMEC point grid are displayed in Figure 3-83. The grid of DEMEC points was located in the center of the

111
shear span of the test specimen as displayed in Figure 3-84. The DEMEC measuring system was used to track changes in surface strain throughout testing and also provided information about the changes in crack width over time.
The DEMEC measuring system was also used to track the changes in end deflections between the two test specimens during testing. DEMEC points were placed on the surface of the end regions of the top and bottom specimens at each end of the test specimen as shown in Figure 3-85.
Figure 3-83 DEMEC point grid
Figure 3-84 As-built DEMEC point grid
.
8" 8"
8"
8"
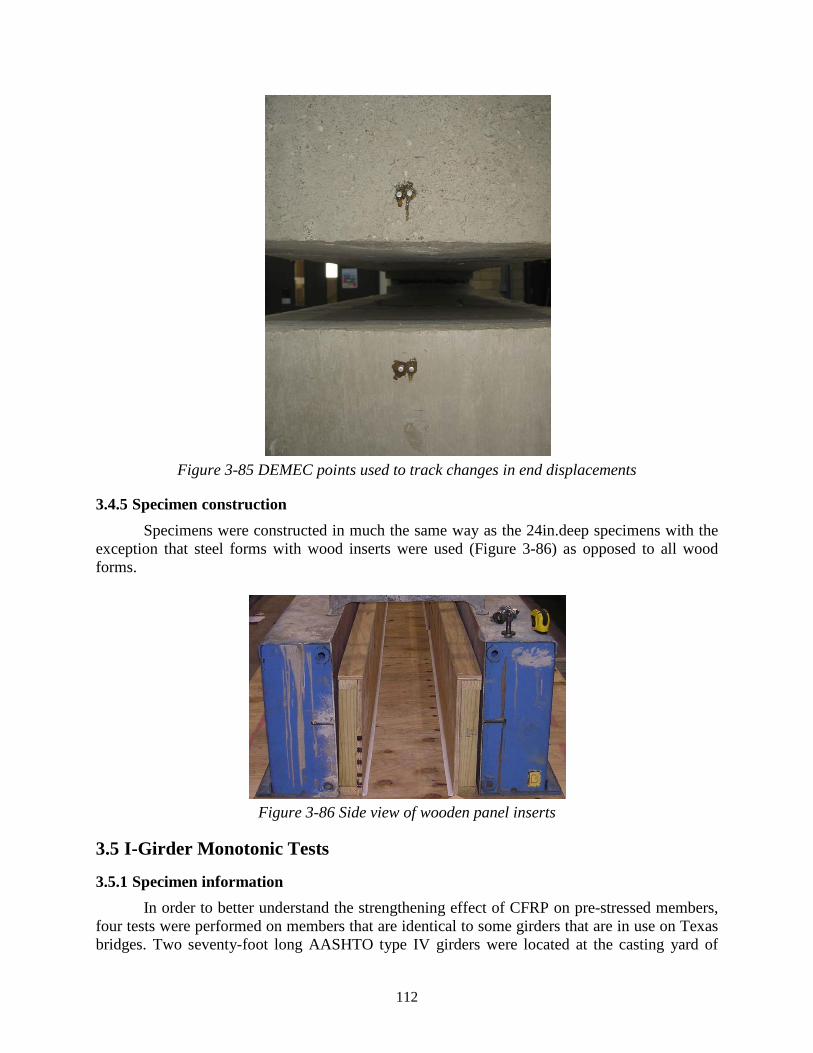
112
Figure 3-85 DEMEC points used to track changes in end displacements
3.4.5 Specimen construction Specimens were constructed in much the same way as the 24in.deep specimens with the
exception that steel forms with wood inserts were used (Figure 3-86) as opposed to all wood forms.
Figure 3-86 Side view of wooden panel inserts
3.5 I-Girder Monotonic Tests
3.5.1 Specimen information In order to better understand the strengthening effect of CFRP on pre-stressed members,
four tests were performed on members that are identical to some girders that are in use on Texas bridges. Two seventy-foot long AASHTO type IV girders were located at the casting yard of

113
Texas Concrete in Victoria, Texas. The beams were fabricated in 2003 and were rejected due to problems with the mix design. A cross section of the girders can be seen in Figure 3-87. The beams were cut in half and a test was performed on each half.
Figure 3-87 Cross Section Showing Shear Reinforcement (left) and Tendon Profile (right)
Twenty-six ½ inch, low-relaxation tendons with a nominal tensile strength of 270 ksi were used. The stirrups were specified as ASTM A615 Grade 60 and were placed at a spacing of 18in. on center in the region that is tested. Specified concrete strengths are summarized in Table 3-10.
Table 3-10 Concrete Strengths at Different Stages Stage Strength
(ksi) Release 4 Design 5 Actual* 11
*The actual strength is estimated to be 11 ksi based on cores taken from the specimens

114
3.5.2 CFRP properties and layouts The CFRP material used on I-girders was Laminate A for the strips and A-1 for the
anchors (see Table 3-8); the same materials that were mostly used in the T-Beam tests. One-way and two-way anchors were used in the I-girder specimens. Two-way anchors fan in two opposite directions to resist forces in both directions. One-way anchors only fan in one direction and therefore only resist tensile forces in that direction.
Six inch long holes were drilled into the concrete to provide anchorage for the CFRP anchors. The one-way anchors were drilled using a drill bit with a diameter of 7/16” and for the two-way anchors, a 5/8”-diameter drill bit was used. Two-way anchors required a larger hole diameter because they contained twice as much material as one-way anchors. For the one-way anchors used in previous specimens, the hole was drilled perpendicular to the surface as in Figure 3-88. For the I-girders, Figure 3-89 shows that the holes were drilled at an angle of about 45o, and were slightly skewed to ensure that the holes would not meet. The top horizontal holes in the top flange are exactly the same length and diameter as those used for the T-Beams; the inclined holes are the same length, but they are bigger in diameter to accommodate the two-way anchors. Another illustration of the angled holes can be seen in Figure 3-90. The tensile forces that develop in the CFRP, Tf, must be resisted by the force in the anchor, Fa, to ensure that the CFRP does not debond.
Figure 3-88-T-beam Showing Anchor Holes

115
Figure 3-89 I-Girder Showing Anchor Holes
Figure 3-90 Tension Forces Resisted by the CFRP Anchor
The first test, denoted as I-1, was the control, in which no CFRP was applied to the girder. Elevation views of test I-2, I-3, and I-4 showing the CFRP and anchor layouts can be seen in Figure 3-91, Figure 3-92, and Figure 3-93. A picture of test I-2 can be seen in Figure 3-94. I-3 and I-4 can be seen in Figure 3-95 and Figure 3-96, respectively. In I-3 and I-4, intermediate horizontal anchors were used in addition to the end horizontal anchors. Also, note that while vertical strips were used for I-2 and I-4 (I-3 was fully wrapped), in I-2 the strips only extended to the top of the web, and in I-3 and I-4 the CFRP extended all the way to the top of the beam.

116
Figure 3-91 Elevation View of I-2
Figure 3-92 Elevation View of I-3
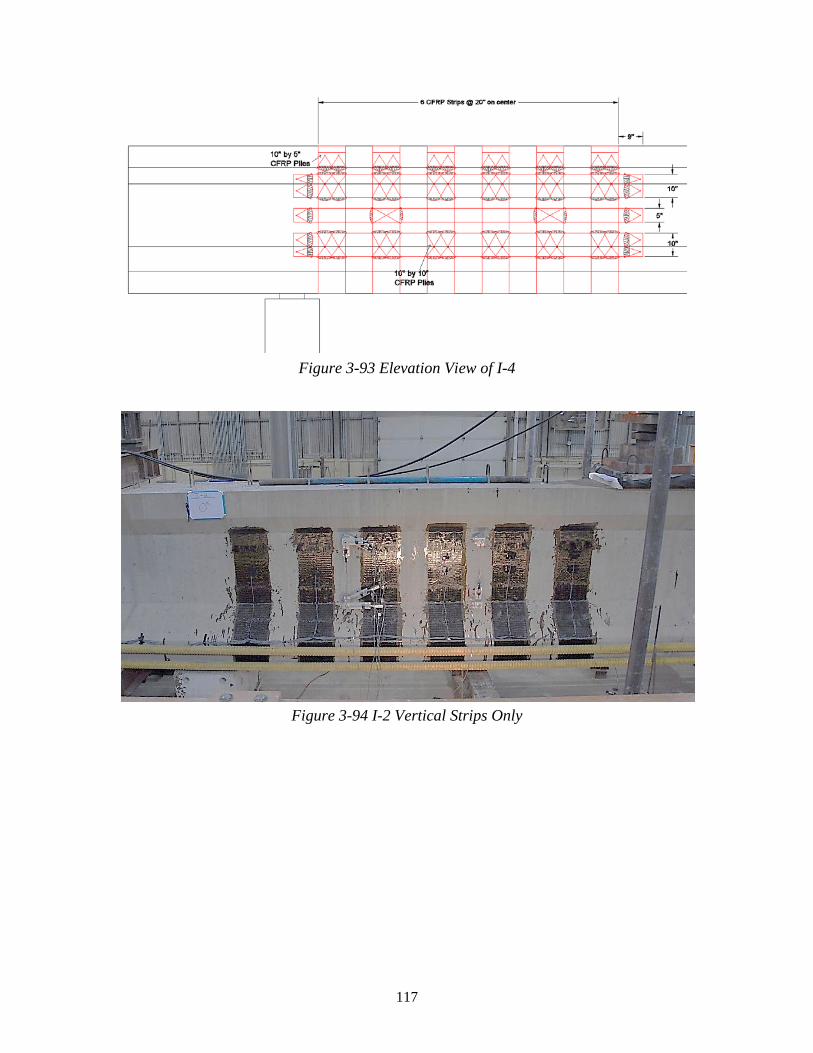
117
Figure 3-93 Elevation View of I-4
Figure 3-94 I-2 Vertical Strips Only
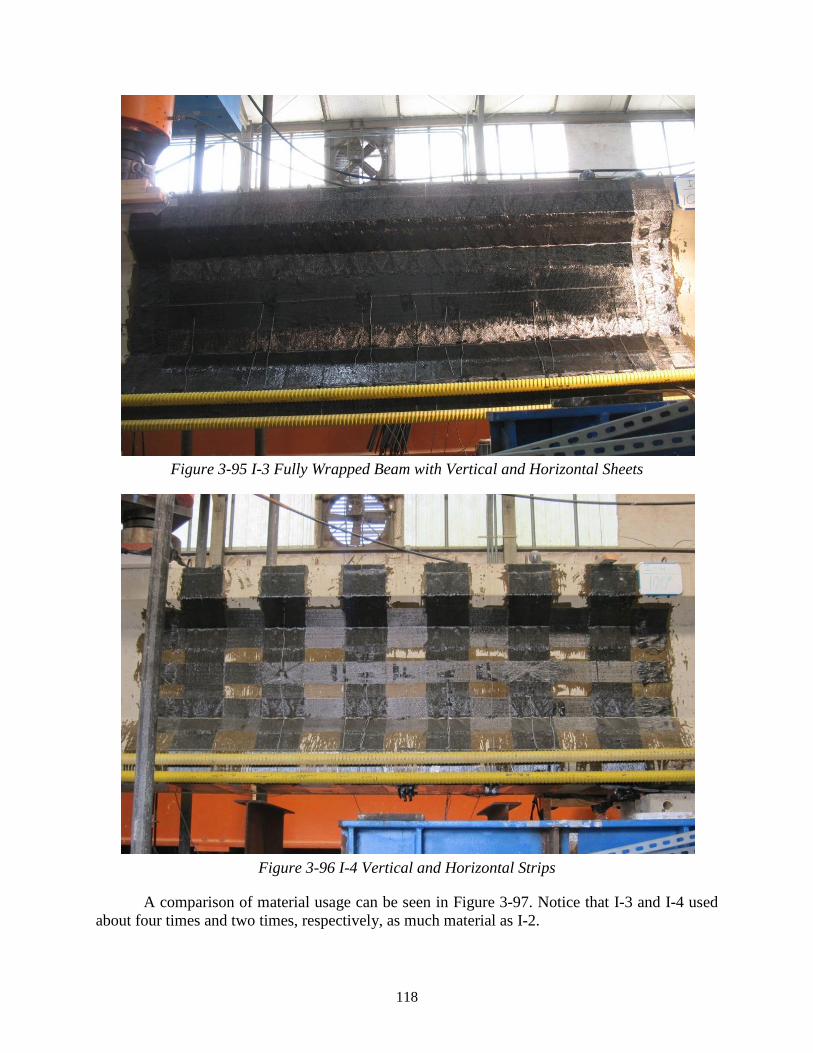
118
Figure 3-95 I-3 Fully Wrapped Beam with Vertical and Horizontal Sheets
Figure 3-96 I-4 Vertical and Horizontal Strips
A comparison of material usage can be seen in Figure 3-97. Notice that I-3 and I-4 used about four times and two times, respectively, as much material as I-2.

119
Figure 3-97 Material Breakdown of all Tests
3.5.3 Test configuration A picture of the test setup can be seen in Figure 3-98. The green arrows pointing up
indicate where the supports are located, and the green arrow pointing down shows the location of the loading point. Each support consists of a concrete block that is leveled using hydrostone (a quick-setting, high-strength, gypsum-based grout material) and a neoprene pad on top of the block. The neoprene pads are 22 inches long by 9 inches wide and 2 inches deep. The orange loading ram has a spherical head attached to ensure that the load is as evenly distributed as possible. The shear span to depth ratio is about 2.8. A schematic of the test setup can also be seen in Figure 3-99.
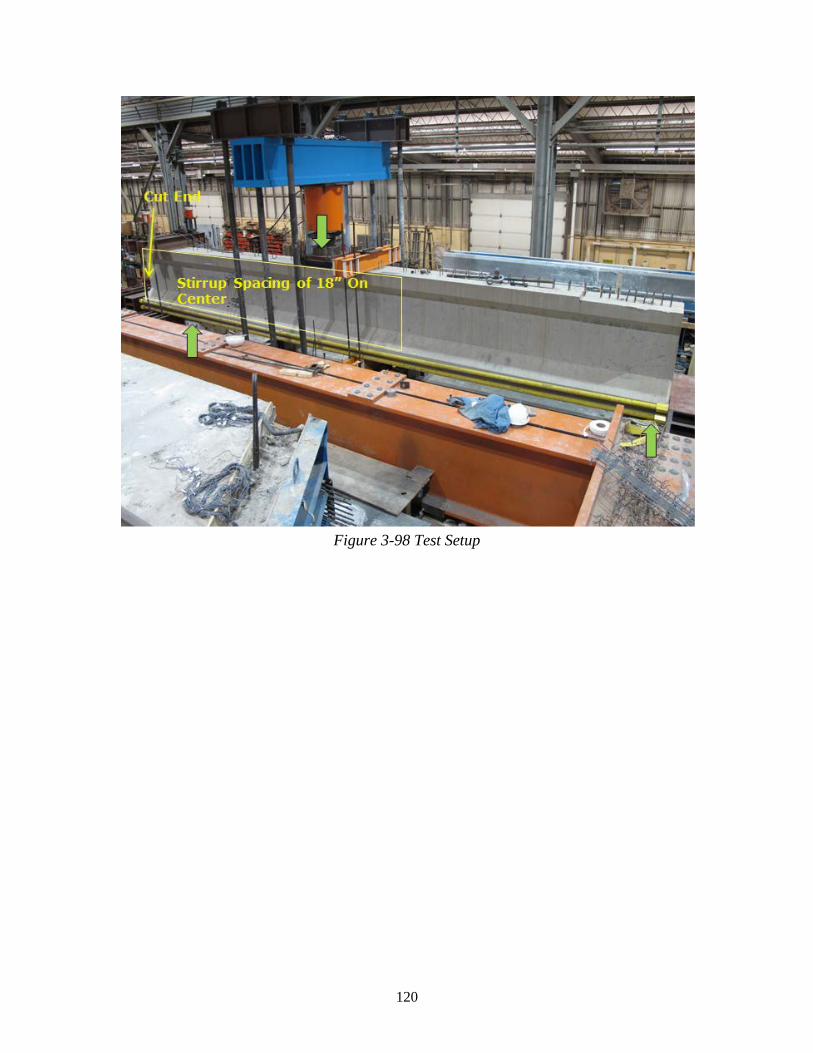
120
Figure 3-98 Test Setup

121
Figure 3-99 Elevation View of Test Setup
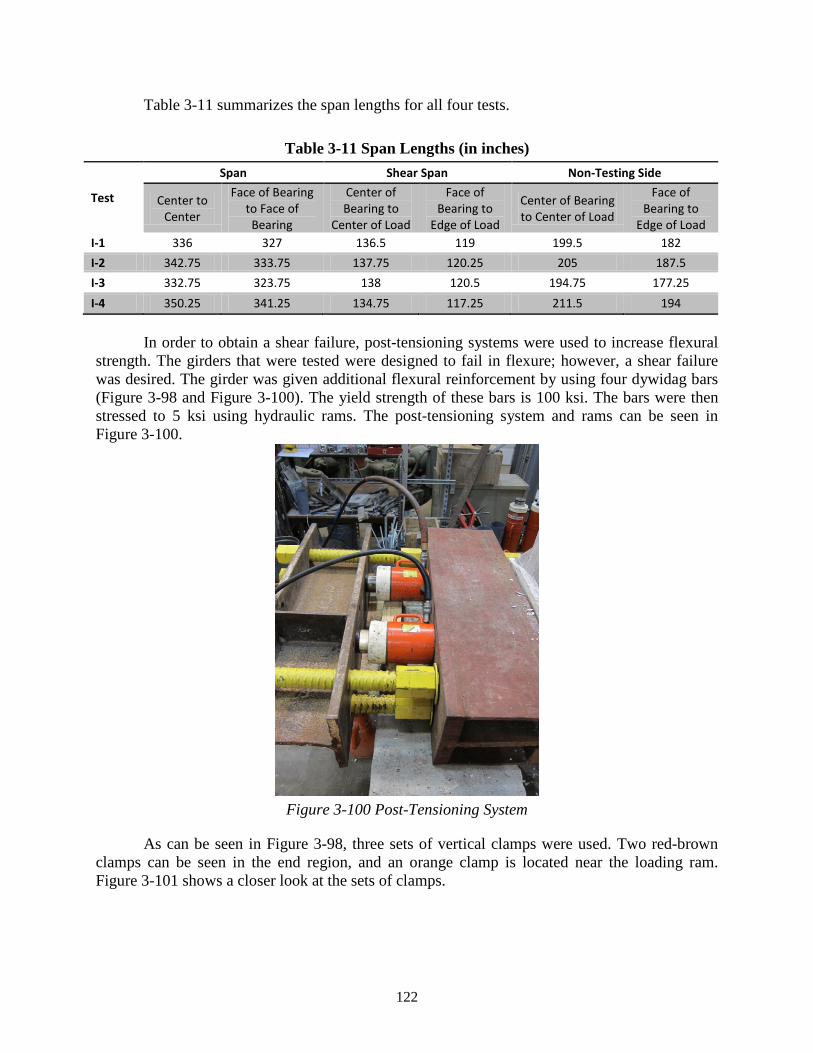
122
Table 3-11 summarizes the span lengths for all four tests.
Table 3-11 Span Lengths (in inches)
Test
Span Shear Span Non-Testing Side
Center to Center
Face of Bearing to Face of Bearing
Center of Bearing to
Center of Load
Face of Bearing to
Edge of Load
Center of Bearing to Center of Load
Face of Bearing to
Edge of Load I-1 336 327 136.5 119 199.5 182 I-2 342.75 333.75 137.75 120.25 205 187.5 I-3 332.75 323.75 138 120.5 194.75 177.25 I-4 350.25 341.25 134.75 117.25 211.5 194
In order to obtain a shear failure, post-tensioning systems were used to increase flexural
strength. The girders that were tested were designed to fail in flexure; however, a shear failure was desired. The girder was given additional flexural reinforcement by using four dywidag bars (Figure 3-98 and Figure 3-100). The yield strength of these bars is 100 ksi. The bars were then stressed to 5 ksi using hydraulic rams. The post-tensioning system and rams can be seen in Figure 3-100.
Figure 3-100 Post-Tensioning System
As can be seen in Figure 3-98, three sets of vertical clamps were used. Two red-brown clamps can be seen in the end region, and an orange clamp is located near the loading ram. Figure 3-101 shows a closer look at the sets of clamps.

123
Figure 3-101 Clamps
The two red-brown clamps near the end region are stressed to 100 kips each (50 kips per bar). These clamps were provided to prevent “horizontal shear,” that may occur when pre-stressed members develop horizontal cracks of the bottom web-flange interface. The intent was to develop a shear failure, thus the clamps were used.
The orange clamp near the loading ram was stressed to 60 kips (15 kips per bar.) The orange clamp was provided to prevent a failure to the right of the loading point, where there was a small length with wide stirrup spacing. The left side of the beam was the side being tested.
3.5.4 Instrumentation Strain Gauges
Strain gauges were used to monitor the strains in the CFRP sheets. The grid systems shown in Figure 3-102, Figure 3-103, and Figure 3-104 were employed to determine the location of the strain gauges in each test. A nomenclature system was developed to differentiate between the strain gauges, and a schematic can be seen in Figure 3-105.

124
Figure 3-102 Grid System Used in I-2
Figure 3-103 Grid System Used in I-3

125
Figure 3-104 Grid System Used in I-4 (Horizontal strips are not shown for clarity purposes)
Figure 3-105 Strain Gauge Nomenclature
LVDTs
In addition to strain gauges, LVDTs were used to measure displacements in the specimen during testing. Two LVDTs were used to measure the deflection at the loading point, which can be seen in Figure 3-106. Meanwhile, six LVDTs were used to measure shear deformations, shown in Figure 3-107.

126
Figure 3-106 LVDT Used to Monitor the Deflection at the Loading Point
Figure 3-107 Shear Deformation Configuration

127
Chapter 4. Test Results
4.1 Monotonic Test Series
4.1.1 Overview of test results A total of 24 tests were conducted: 16 tests with 24-in. deep beams and 8 tests with 48-in.
deep beams. All test results for this series are summarized in Table 4-1 and Table 4-2. For 24-in. beams, the results are tabulated according to the shear span to depth (a/d) ratios (i.e., 3, 2.1, and 1.5). For 48-in. beams, the results are tabulated according to two different transverse steel ratios (Tests 1~4: #3@18,” Tests 5~8: #3@10”). The a/d ratio of all 48-in. beams was 3. Specimen shear capacities were compared with that of the reference tests (or control tests) in the same group. Percent increases in shear capacity from control are indicated in the fourth column of Table 4-1 and Table 4-2. The failure mode is provided in the last column. Unless otherwise noted, the use of Laminate A, anchors, and a bonded application are implied. Some tests were stopped before failure to permit testing of the other end of the beam. These tests can be identified through the last column of the tables.

128
Table 4-1 Summary of test results for 24in. beams
Test Description Shear (kips)
Percent Increase Failure mode
24-3-2 No CFRP CONTROL 105 0% Diagonal tension
24-3-1 No CFRP
Loaded to stirrup yield and shear cracking
74 - Only loaded to yield of stirrup
24-3-1r 1 Layer, 5"@10” Strengthening after initial cracking 152 44% Rupture of CFRP strip
24-3-3 1 Layer, 5"@10” No Bond ( poor application ) 118 12% Rupture of CFRP anchor
24-3-4 1 Layer, 5"@10” No Bond ( proper application) 152 44% Rupture of CFRP strip
24-3-5 1 Layer, 5"@10” Laminate B 145 38% Rupture of CFRP strip
24-3-6 1 Layer, 5"@10” Laminate C 134 27% Rupture of CFRP strip
24-3-7 1 Layer, continuous sheet
(same area of CFRP as 2 layer applications)
165 56%*1 Rupture of CFRP strip
24-3-8 2 Layers, 5"@10” 153 45%*1 Rupture of CFRP anchor
24-3-9 1 Layer, 5"@10” No CFRP anchor 109 4% debonding
24-3-10 1 Layer, 5"@10” Inclined anchor 145 38% Rupture of CFRP strip and
CFRP anchor
24-2.1-2 No CFRP CONTROL 129 0% Diagonal tension
24-2.1-1 1 Layer, 5"@10” a/d ratio 170 32% Rupture of CFRP strip and
CFRP anchor
24-1.5-3 No CFRP CONTROL 233 0% Diagonal tension
24-1.5-1 No CFRP
Loaded to stirrup yield and shear cracking
134 - Only loaded to yield of stirrup
24-1.5-1r 2 Layers, 5"@10” Strengthening after initial loading 242 - Loading stopped at
capacity of setup
24-1.5-1r2 Retest with 24-1.5-1r 252*2 8% Reloading to failure by concrete crushing
24-1.5-2 2 Layers, 5"@10” No CFRP Anchors 255 9% Debonding of CFRP
24-1.5-4 1 Layer, 5"@10” a/d ratio 264 13% Rupture of CFRP strip
*1. The amount of CRRP strip material is as twice much as the other test, which means the percent increase was expected to be 84%.
*2. The capacity of 24-1.5-1r2 might be reduced by concrete damage due to loading in 24-1.5-1r

129
Table 4-2 Summary of test results for 48in. beams
Test Description Shear (kips)
Percent Increase Failure mode
48-3-1 No CFRP CONTROL 147*1 0% Stopped loading
48-3-2 1 Layer, 10"@20” transverse steel ratio 226 54% Rupture of CFRP strip
48-3-3 1 Layer, 14"@20” width of strip 239*1 63% Stopped loading
48-3-4 1 Layer, 10"@20” 45 deg. diagonal strip 236 61% Rupture of CFRP strip
48-3-6 No CFRP CONTROL 228*1 0% Stopped loading
48-3-6r 1 Layer, 10"@20” epoxy injection / repair 327 43% Rupture of CFRP strip and
CFRP anchor
48-3-5 1 Layer, 10"@20” depth ( compared w/ 24”) 242*1 6% Stopped loading
48-3-7 1 Layer, 10"@20” intermediate anchors 242*1 6% Stopped loading
48-3-8 2 Layers, 10"@20” double CFRP area 255 12% Rupture of CFRP anchor
1. To conduct two tests from one specimen, loading was stopped before failure. It is likely that tests 48-3-1, 3, 5, 6, and 7 would have exhibited additional capacity
4.1.2 Methodology for extracting shear contributions In this section, the methodology for estimating the shear contributions of each material
based on strain data is presented. The estimations of shear contributions depend on the location of the critical crack with respect to the location of strain gauges. When a strain gauge is not located at, or close to the critical crack, the measured strain is under-estimated. The installation of more strain gauges along the length of a steel stirrup or a CFRP strip increases the chance of having a gauge crossing a crack. A very close spacing of gauges however is impractical. In the experimental study a balance between accuracy and practicality was achieved with the gauge layouts shown in Chapter 3.
Monitored strains were used to estimate the shear forces resisted by steel stirrups and CFRP strips that crossed the main shear crack. The critical crack angle of most tests was shallower than 45 degrees, which translated into more steel stirrups and CFRP strips contributing to shear resistance than estimated using ACI provisions. The free body diagram used to estimate the shear contribution of stirrups, CFRP, and concrete is illustrated in Figure 4-1.

130
Figure 4-1 Free body diagram for evaluating shear contributions
As is common in RC elements, the strains in the stirrups varied depending on their distance from the shear crack. In this study, stirrup shear contribution was calculated from the gauge closest to the critical crack. Therefore, the calculated stirrup shear contribution likely underestimated the actual contribution; especially at lower load levels at which stirrups may not have yielded. A bi-linear stress-strain relationship with a flat yield plateau was assumed for the transverse steel. The estimated force in the transverse steel reinforcement crossing the critical shear section was calculated using Equation 4-1.
𝑭𝒔,𝒊 = �𝑨𝒔𝑬𝒔𝜺𝒔,𝒊 𝜺𝒔𝒊 ≤ 𝜺𝒚 𝑨𝒔𝒇𝒚 𝜺𝒔𝒊 > 𝜺𝒚 (Eq. 4-1)
where Fs,i is the estimated force in the portion of reinforcement of interest, As is the cross sectional area of the transverse steel, Es is the elastic modulus of steel, εs,i is the measured strain, fy is the yield stress of the transverse reinforcement (as determined from material testing), and εy is the yield strain of the transverse reinforcement (as determined from material testing).
The total estimated shear force resisted by the steel stirrups can be calculated using Equation 4-2 where n is the number of stirrups crossing the observed critical shear crack. The critical crack at failure was used to estimate n.
𝐹𝑠 = ∑ 𝐹𝑠,𝑖𝑛𝑖=1 (Eq. 4-2)
The monitored strains in CFRP strips are sensitive to the distance between crack and gauge locations. Furthermore, since the critical crack angle is not aligned with the CFRP fiber direction and that angle continuously changes over the span, tensile strains differ both along the length and across the width of CFRP strips. The strain variations along the length and across the width of a typical CFRP strip are shown in Figure 4-2. Strains at various locations of the strip are seen to increase abruptly as cracks form at different locations along the section and finally converge once sufficient debonding has occurred.
1 2 3 4
Fs,2
Fs,4
Ffrp,1
Ffrp,2
Ffrp,3
Ffrp,4
FC
R
Fs,1
Fs,3
Fn

131
(a) Strain response along the strip direction
(b) Strain response across the width
Figure 4-2 Comparison of strain response in the same CFRP strip (48-3-2)
From this illustrative example, several important points can be drawn. The load transfer pattern changed as load increased, which means that the critical shear crack was also changing and the gauges for evaluating the shear contribution also would need to be changed as the load increased. In addition, if the strain difference between adjacent gauges is significant, a single gauge in a CFRP strip will not be enough to evaluate the CFRP contribution. Thus, depending on
0
50
100
150
200
250
300
0 0.002 0.004 0.006 0.008 0.01
Appl
ied
Shea
r (ki
ps)
Strain (in./in.)
FD1 FD2FD3
0
50
100
150
200
250
300
0 0.002 0.004 0.006 0.008 0.01
Appl
ied
Shea
r (ki
ps)
Strain (in./in.)
FD2.1FD2FD2.2
FD1
FD2
FD3
FD1
FD2
FD3
FD2
FD2.1
FD2.2
FD2.1
FD2
FD2.2

132
which gauges are selected for calculations, the CFRP contributions can be either over-estimated or under-estimated. The shear contribution evaluated from strain gauges is therefore only considered to be an indicator of overall response, but not an exact measure of it.
For simplicity, an average value of strains recorded by gauges closest to the critical crack is used to evaluate the shear contribution of CFRP strips in this study. Even though the critical crack changed as loading increased, the critical crack at ultimate capacity of the beam was always used to locate the gauges because the values of most interest were the shear contributions at ultimate. A linear stress-strain relationship and a uniform average strain distribution across the width of the CFRP strip were assumed to simplify calculations. The estimated force in the CFRP crossing the critical shear section was calculated using Equation 4-3.
𝐹𝑓,𝑖 = 𝑤𝑓 ∙ 𝑡𝑓 ∙ 𝐸𝑓 ∙ 𝜀𝑓,𝑖 (Eq. 4-3) where Ff,i is the estimated force in a portion of the CFRP, wf is the width of the CFRP strip, tf is the thickness of the CFRP strip, Ef is the elastic modulus of CFRP material, and εf,i is the strain determined from strain gauges attached to the CFRP strip.
The total estimated shear force resisted by CFRP strips can be calculated using Equation 4-4 where n is the number of CFRP strips crossing the observed critical shear crack. The critical crack at failure was used to estimate n.
𝐹𝑓 = ∑ 𝐹𝑓,𝑖𝑛𝑖=1 (Eq. 4-4)
The total shear force resisted by the concrete can then be determined from equilibrium
using Equation 4-5. 𝐹𝑐 = 𝐹−𝐹𝑠−𝐹𝑓 (Eq. 4-5)
where Fc is the estimated shear force resisted by the concrete and F is the total shear force applied to the critical shear section.
Typical evaluations of material contributions to shear strength are plotted in Figure 4-3. The shear contribution of each material changes as loads increase. Before concrete cracking, most shear resistance comes from concrete. Steel and CFRP contributions start to increase after concrete shear cracking.
Figure 4-3 Typical response of steel, CFRP, and concrete contributions to shear strength
0
25
50
75
100
125
150
175
0 0.2 0.4 0.6 0.8 1
Appl
ied
Shea
r (ki
ps)
Displacement (in.)
0
25
50
75
100
125
150
175
0 0.004 0.008 0.012 0.016 0.02
Appl
ied
Shea
r (ki
ps)
Shear Strain (in./in.)
Fs
Fc
Ff
Fs
Fc
Ff

133
4.1.3 Test results 24 in. Deep Beam Series Ι (a/d=3)
Test 24-3-2 (no CFRP, control) Test 24-3-2 was conducted to determine the shear strength without CFRP. Failure
occurred at a shear of 105 k and the mode of failure was yielding of stirrups. As seen in Figure 4-4, large shear cracks formed in the concrete member. The crack width was 0.03 in. at a shear of 84 k and over 0.05 in. at a shear of 90 k. As shown in Figure 4-5, after reaching a load of 90 k, shear strain increased dramatically.
(a) Front side
(b) Back side
Figure 4-4 Photos of both sides of test 24-3-2 after failure
Figure 4-5 Component contribution to shear force vs. deformation response of 24-3-2
0
25
50
75
100
125
150
175
0 0.2 0.4 0.6 0.8 1
Appl
ied
Shea
r (ki
ps)
Displacement (in.)
0
25
50
75
100
125
150
175
0 0.004 0.008 0.012 0.016 0.02
Appl
ied
Shea
r (ki
ps)
Shear Strain (in./in.)
Fs
Fc
Fs
Fc

134
Test 24-3-1/1r (pre-cracked/strengthened) The specimen was initially loaded to a shear of 74 k at which a stirrup yielded. The
specimen was then unloaded and repaired with CFRP laminates. Figure 4-6 shows the shear contributions of stirrups, CFRP, and concrete plotted against beam displacement or shear strain. The dotted lines show the response of test 24-3-1, i.e., response before strengthening.
Figure 4-6 Component contribution to shear force vs. deformation response of 24-3-1/1r
The relation of beam displacement versus shear force was nearly linear up to failure. At a shear of 50 k, the slope of the shear strain response changed, indicating that a shear crack had formed. Prior to shear cracking, flexural cracks occurred near the loading point but did not result in a significant softening due to the large ratio of longitudinal reinforcement. Small residual displacements and shear strains remained after the initial loading of Test 24-3-1. As the loading level was increased, the shear contribution of CFRP increased. The shear contribution of CFRP continued to increase although the shear contribution of steel leveled off once all stirrups across the critical crack yielded.
As shown in Figure 4-7, failure of the specimen strengthened after cracking was initiated by a combination of rupture of the CFRP strips and the CFRP anchors.
0
25
50
75
100
125
150
175
0 0.2 0.4 0.6 0.8 1
Appl
ied
Shea
r (ki
ps)
Displacement (in.)
0
25
50
75
100
125
150
175
0 0.004 0.008 0.012 0.016 0.02Ap
plie
d Sh
ear (
kips
)Shear Strain (in./in.)
Fs
Fc
Ff
Fs
Fc
Ff
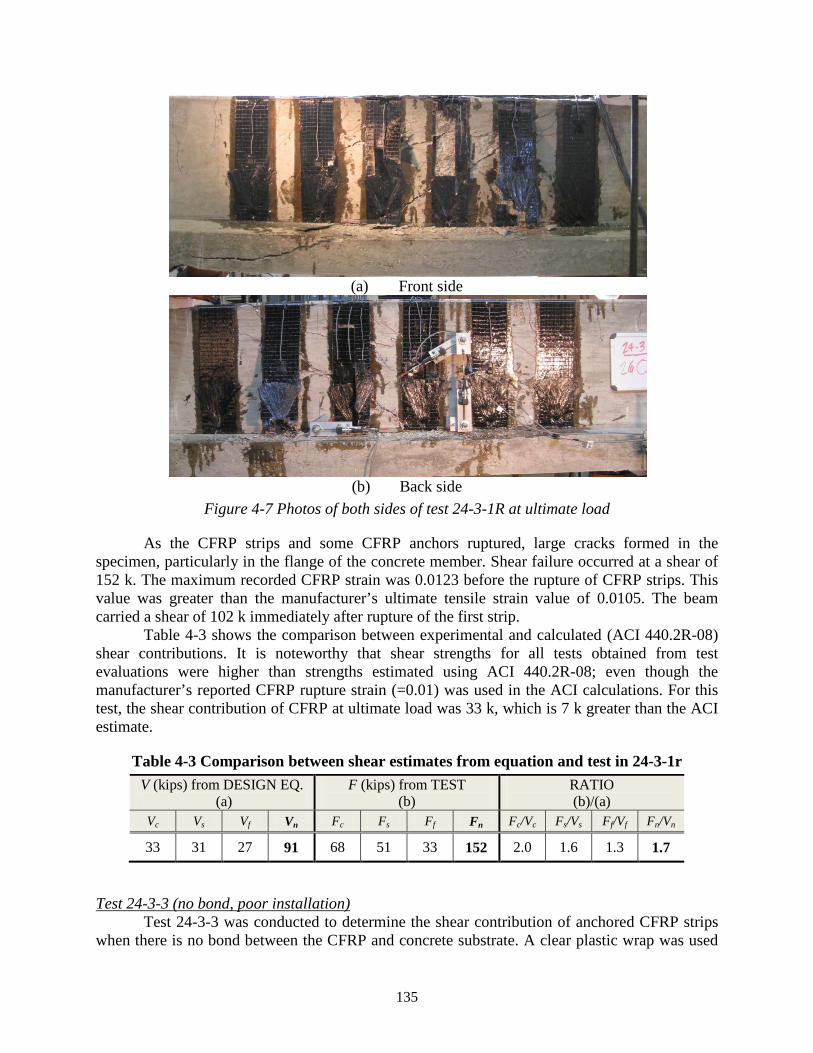
135
(a) Front side
(b) Back side
Figure 4-7 Photos of both sides of test 24-3-1R at ultimate load
As the CFRP strips and some CFRP anchors ruptured, large cracks formed in the specimen, particularly in the flange of the concrete member. Shear failure occurred at a shear of 152 k. The maximum recorded CFRP strain was 0.0123 before the rupture of CFRP strips. This value was greater than the manufacturer’s ultimate tensile strain value of 0.0105. The beam carried a shear of 102 k immediately after rupture of the first strip.
Table 4-3 shows the comparison between experimental and calculated (ACI 440.2R-08) shear contributions. It is noteworthy that shear strengths for all tests obtained from test evaluations were higher than strengths estimated using ACI 440.2R-08; even though the manufacturer’s reported CFRP rupture strain (=0.01) was used in the ACI calculations. For this test, the shear contribution of CFRP at ultimate load was 33 k, which is 7 k greater than the ACI estimate.
Table 4-3 Comparison between shear estimates from equation and test in 24-3-1r V (kips) from DESIGN EQ.
(a) F (kips) from TEST
(b) RATIO (b)/(a)
Vc Vs Vf Vn Fc Fs Ff Fn Fc/Vc Fs/Vs Ff/Vf Fn/Vn
33 31 27 91 68 51 33 152 2.0 1.6 1.3 1.7
Test 24-3-3 (no bond, poor installation) Test 24-3-3 was conducted to determine the shear contribution of anchored CFRP strips
when there is no bond between the CFRP and concrete substrate. A clear plastic wrap was used

136
to prevent bond. It was difficult to install CFRP strips and anchors under this condition. Because the clear plastic wrap did not adhere to the concrete, large gaps formed between the concrete substrate and the plastic wrap as shown in Figure 4-8.
As shown in Figure 4-9, at the shear strain of 0.008, shear decreased from 115 k to 110 k and CFRP contribution also dropped from 19 k to 11 k. At that time, the maximum strain at F1D (Figure 4-10) was 0.0087, which was the maximum measured CFRP strain during test 24-3-3.
Figure 4-8 Poor application of CFRP strip and anchor due to plastic wrapping
Figure 4-9 Component contribution to shear force vs. deformation response of 24-3-3
It is clear that strip D lost some capacity at a shear of 115 k. However, failure occurred at a shear of 118 k due to fracture of the CFRP anchors in strips D and E (Figure 4-10 and Figure 4-11). After losing the capacity of strip D, most of the force in strip D was redistributed to strip E and the shear dropped to 109 k at rupture of strip E. The poor installation of the CFRP strips with poorly placed (non-straight) CFRP laminates and CFRP anchors resulted in a significant reduction in the overall capacity of the member.
0
25
50
75
100
125
150
175
0 0.2 0.4 0.6 0.8 1
Appl
ied
Shea
r (ki
ps)
Displacement (in.)
0
25
50
75
100
125
150
175
0 0.004 0.008 0.012 0.016 0.02
Appl
ied
Shea
r (ki
ps)
Shear Strain (in./in.)
Fs
Fc
Ff
Failure of CFRP strip
Fs
Fc
Ff
Failure of CFRP strip

137
(a) Front side
(b) Back side
Figure 4-10 Photos of both sides of test 24-3-3 at ultimate load
Figure 4-11 Fracture of CFRP Anchor in test 24-3-3
Test 24-3-4 (no bond, proper installation) Because Test 24-3-3 failed by premature CFRP anchor fracture due to the poor
installation, another test with the same parameters was conducted. Instead of a plastic wrap, a clear plastic shelf liner with adhesive on one side was adhered to the surface of the concrete before installation of the CFRP to eliminate bond as shown in Figure 4-12.
D E
F1D
FD.t
1
D E
F1Dr
2
1 2

138
Figure 4-12 CFRP installation without bond using adhesive shelf liner
The improved CFRP anchor detail (Chapter 3) was used in this and subsequent test (the only tests with the older anchor detail were 24-3-1r, 24-3-3, 24-1.5-1r). As presented in Chapter 3, the modifications of anchor details were: 1) the area of CFRP anchors was changed from 1.5 to 2 times of the area of the CFRP strip, 2) two additional patches were attached over the CFRP anchors, and 3) bend radius at the hole edge was increased from 0.25 in. to 0.5 in. The differences in anchor details are shown in Figure 4-13.
Figure 4-13 Photos of CFRP anchor detail before and after modification
Because the strain gauge data from the CFRP strips was considered to be unreliable after the peak load was reached (Point 1 in Figure 4-14), the shear contributions at ultimate of the steel, CFRP, and concrete were evaluated at Point 1 rather than Point 3. Strip E ruptured at a shear of 148 k (at Point 2) and the shear dropped to 139 k. However, failure occurred at a shear of 152 k with rupture of additional CFRP strips (C & D). No CFRP anchors failed as shown in Figure 4-15. The maximum reported CFRP strain was 0.0126. This test thus demonstrated that anchors are able to develop the full capacity of the CFRP sheets regardless of bond between the sheets and the concrete. The maximum crack width was 0.05 in. at a shear of 94 k and increase significantly at peak load; it was too dangerous to measure cracks closer to the peak load.
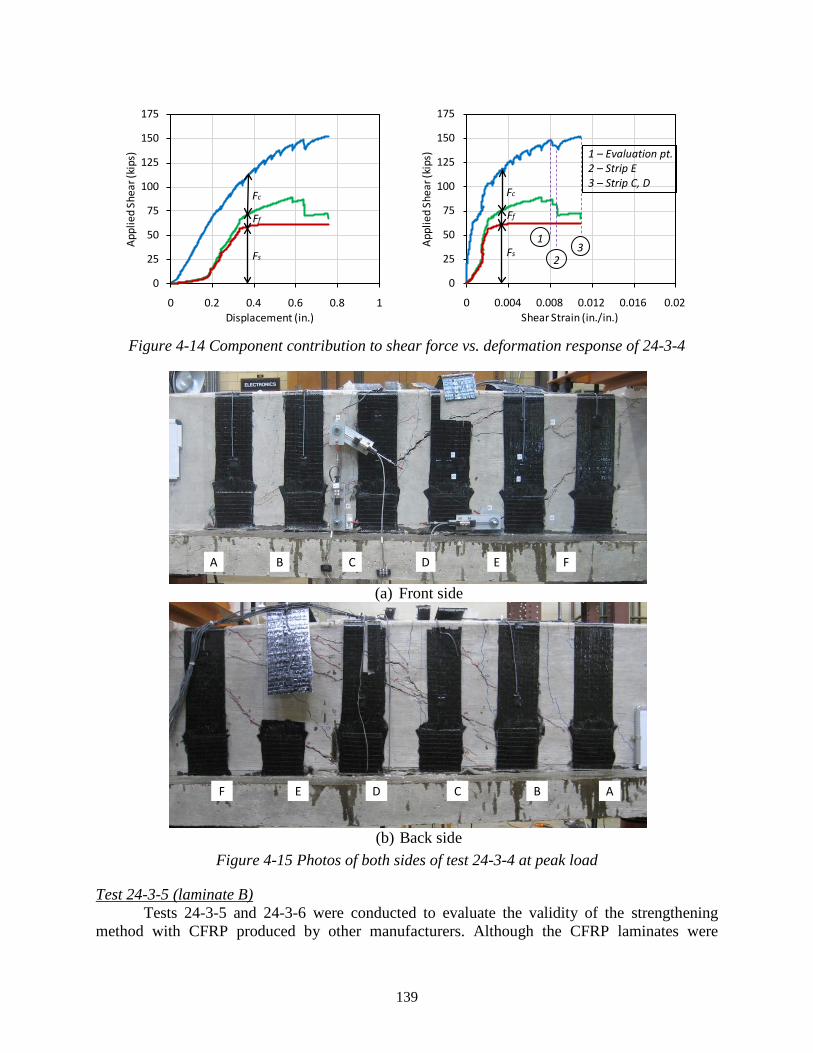
139
Figure 4-14 Component contribution to shear force vs. deformation response of 24-3-4
(a) Front side
(b) Back side
Figure 4-15 Photos of both sides of test 24-3-4 at peak load
Test 24-3-5 (laminate B) Tests 24-3-5 and 24-3-6 were conducted to evaluate the validity of the strengthening
method with CFRP produced by other manufacturers. Although the CFRP laminates were
0
25
50
75
100
125
150
175
0 0.2 0.4 0.6 0.8 1
Appl
ied
Shea
r (ki
ps)
Displacement (in.)
0
25
50
75
100
125
150
175
0 0.004 0.008 0.012 0.016 0.02
Appl
ied
Shea
r (ki
ps)
Shear Strain (in./in.)
Fs
Fc
Ff
Fs
Fc
Ff
1
2 3
1 – Evaluation pt. 2 – Strip E 3 – Strip C, D
D E C B A F
D E C B A F
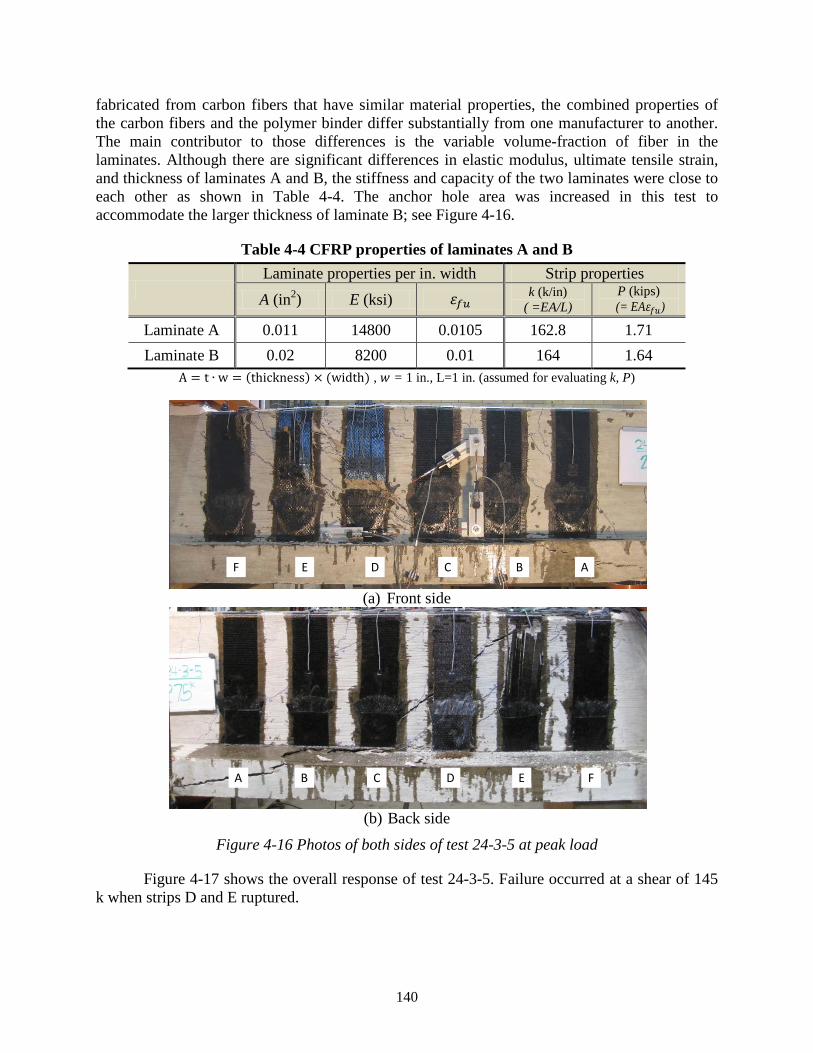
140
fabricated from carbon fibers that have similar material properties, the combined properties of the carbon fibers and the polymer binder differ substantially from one manufacturer to another. The main contributor to those differences is the variable volume-fraction of fiber in the laminates. Although there are significant differences in elastic modulus, ultimate tensile strain, and thickness of laminates A and B, the stiffness and capacity of the two laminates were close to each other as shown in Table 4-4. The anchor hole area was increased in this test to accommodate the larger thickness of laminate B; see Figure 4-16.
Table 4-4 CFRP properties of laminates A and B
Laminate properties per in. width Strip properties A (in2) E (ksi) 𝜀𝑓𝑢 k (k/in)
( =EA/L) P (kips)
(= EA𝜀𝑓𝑢)
Laminate A 0.011 14800 0.0105 162.8 1.71 Laminate B 0.02 8200 0.01 164 1.64
A = t ∙ w = (thickness) × (width) , 𝑤 = 1 in., L=1 in. (assumed for evaluating k, P)
(a) Front side
(b) Back side
Figure 4-16 Photos of both sides of test 24-3-5 at peak load
Figure 4-17 shows the overall response of test 24-3-5. Failure occurred at a shear of 145 k when strips D and E ruptured.
D E C B A F
D E C B A F

141
Figure 4-17 Component contribution to shear force vs. deformation response of 24-3
Figure 4-18 shows the images captured from video at failure; (a) the front side of strip E partially ruptured and shear force decreased to 143 k, (b) shear force dropped to 134 k when strip D ruptured, (c) strip E totally ruptured right after that. Finally, shear force dropped to 90 k with (d) fracture of the CFRP anchor in the back side of strip D and (e) concrete crushing. Although the time durations between these events depend on the loading rate, the relative duration is of interest. The time intervals were 8 sec. between (a)-(b), 3 sec. between (b)-(c), 6 sec. between (c)-(d), and 1 sec. between (d)-(e). The maximum reported CFRP strain was 0.0115.
Figure 4-18 Failure sequence in test 24-3-5
0
25
50
75
100
125
150
175
0 0.2 0.4 0.6 0.8 1
Appl
ied
Shea
r (ki
ps)
Displacement (in.)
0
25
50
75
100
125
150
175
0 0.004 0.008 0.012 0.016 0.02
Appl
ied
Shea
r (ki
ps)
Shear Strain (in./in.)
0
20
40
60
80
100
120
140
160
0 0.005 0.01 0.015 0.02 0.025 0.03 0.035
Appl
ied
Shea
r (ki
ps)
Shear Strain (in./in.)
a b
c d
e
a b c
d
e
DEDEE
crushing
Fs
Fc
Ff
Fs
Fc
Ff

142
Test 24-3-6 (laminate C) Test 24-3-6 was conducted with laminate C that was applied using the dry layup
procedure. The manufacturer only reported the rupture strain and elastic modulus for the carbon fiber (not the laminate). Based on this information, the stiffness and ultimate strength of laminate C were twice those of laminate A as shown in Table 4-5 and Figure 4-19.
Table 4-5 Comparison of stiffness between laminate A and laminate C
Laminate properties per in. width Strip properties A (in2) E (ksi) 𝜀𝑓𝑢 k (k/in)
( =EA/L) P (kips)
(= EA𝜀𝑓𝑢) Laminate A 0.011 14800 0.0105 162.8 1.71 Laminate C 0.0065 33000 0.0167 214.5 3.58
A = t ∙ w = (thickness) × (width), 𝑤 = 1 in., L=1 in. (assumed for evaluating k, P)
Figure 4-19 Component contribution to shear force vs. deformation response of 24-3-6
Shear failure was initiated by fracture of the CFRP anchors. After reaching the maximum shear of 135 k, a crack extended into the flange of the T-beam. The shear decreased to 132 k. Then shear increased slightly up to 134 k when a CFRP anchor in the strip C ruptured and the load dropped to 128 k. The difference in shear strain between shear at maximum and shear at failure was 0.0045 (= 0.0123−0.0078). After the explosive rupture of strip D as seen in Figure 4-20 and Figure 4-21, the shear dropped to 103 k.
Estimated CFRP shear contribution in this test was higher than for other tests at the same level of CFRP strain. This is due to the higher specified elastic modulus of the CFRP material. The CFRP shear contribution continued to increase after the beam reached peak capacity and accounts for the capacity being sustained as the concrete contribution decreased with increasing crack widths. In other words, the CFRP shear contribution did not reach its maximum when the beam reached peak capacity. The maximum recorded strain in the CFRP was 0.0078 at peak shear. At fracture of the CFRP anchor, the CFRP strain reached a maximum of 0.0114.
The maximum capacity of 24-3-6 was 29 k less than estimated using ACI design equations. Moreover, the shear contributions of each material were varied significantly between the point of maximum shear and the point of CFRP rupture. Test 24-3-6 clearly illustrates a case where the maximum shear contributions of each material do not develop at the same time, which
0
25
50
75
100
125
150
175
0 0.2 0.4 0.6 0.8 1
Appl
ied
Shea
r (ki
ps)
Displacement (in.)
0
25
50
75
100
125
150
175
0 0.004 0.008 0.012 0.016 0.02
Appl
ied
Shea
r (ki
ps)
Shear Strain (in./in.)

143
indicates that the maximum beam shear-capacity is not the equal to the sum of the maximum possible contribution of each material. See Table 4-6.
Table 4-6 Comparison between shear estimates from equation and test in 24-3-1r V (k) from DESIGN EQ.
(a) F (k) from TEST
(b) RATIO (b)/(a)
Vc Vs Vf Vn Fc Fs Ff Fn Fc/Vc Fs/Vs Ff/Vf Fn/Vn 24-3-1r 33 31 27 91 68 51 33 152 2.04 1.63 1.25 1.67
Max Rupture 34 31 56 120
57 42 37 135 1.69 1.35 0.66 1.13 10 61.6 62.3 134 0.30 1.98 1.12 1.11
(a) Front side
(b) Back side
Figure 4-20 Photos of both sides of test 24-3-6 at failure
D E C B A F
D E C B A F
1
2

144
Figure 4-21 Photos of explosive rupture of strip D
Test 24-3-7 (continuous sheet) Test 24-3-7 was conducted with a continuous sheet resulting in twice the amount of
material as in test 24-3-1r (same amount of material as test 24-3-8). As shown in Figure 4-22, the number of CFRP anchors also was doubled to transfer the stress in the CFRP strip. Individual anchor dimensions were therefore maintained for this test. The overlapping width between adjacent anchors was 1 in.
(a) Typical CFRP strip configuration (b) Continuous CFRP sheets (24-3-7)
Figure 4-22 CFRP strip detail between continuous sheet and typical layout
Because the CFRP sheet covered all concrete surfaces, there was no way to observe cracking during the test. An infra-red camera was used to monitor the crack pattern and the debonding of CFRP. Failure occurred at a shear of 165 k and was initiated by partial rupture of the CFRP strip. This rupture was determined by visual inspection and from the infra-red camera images. As shown in Figure 4-23, a rupture of CFRP appeared as a higher temperature while the location of debonding CFRP appeared as a lower temperature. The maximum measured CFRP strain was 0.014 from gauge F1D (Figure 4-24).
After reaching maximum load, there was no sudden load drop and no additional ruptures in the CFRP, but load decreased slowly and steadily (Figure 4-25). A crack at the web-flange interface at the end of the CFRP sheet was seen and this crack extended into the flange of T-beam (Figure 4-24).
1”

145
(a) At cracking load (b) Maximum load Figure 4-23 Images from infra-red camera in test 24-3-7 (front side)
(a) Debonding (front) (b) Front side
(c) Rupture (back) (d) Back side (removal of CFRP after test)
Figure 4-24 Photos of both sides of test 24-3-7
Figure 4-25 Component contribution to shear force vs. deformation response of 24-3-7
0
25
50
75
100
125
150
175
0 0.2 0.4 0.6 0.8 1
Appl
ied
Shea
r (ki
ps)
Displacement (in.)
0
25
50
75
100
125
150
175
0 0.004 0.008 0.012 0.016 0.02
Appl
ied
Shea
r (ki
ps)
Shear Strain (in./in.)
debonding rupture F1D
Principal stress
rupture
F1D
1 1
Fs
Fc
Ff
Fs
Fc
Ff
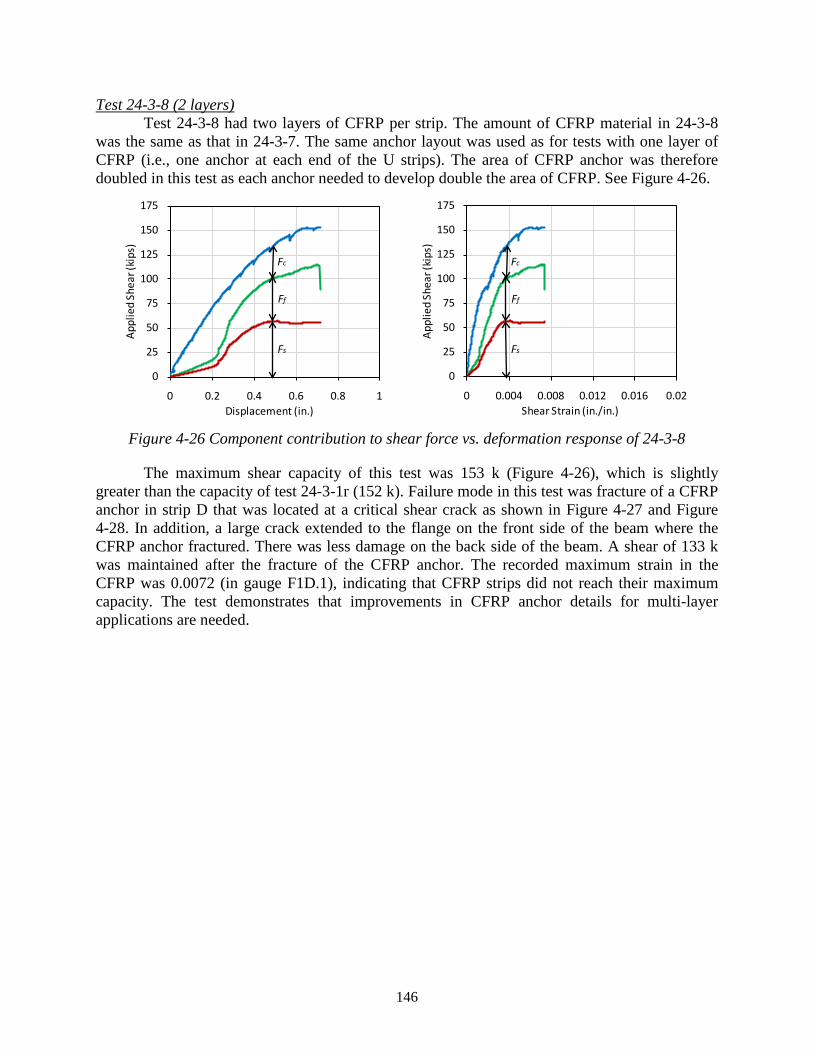
146
Test 24-3-8 (2 layers) Test 24-3-8 had two layers of CFRP per strip. The amount of CFRP material in 24-3-8
was the same as that in 24-3-7. The same anchor layout was used as for tests with one layer of CFRP (i.e., one anchor at each end of the U strips). The area of CFRP anchor was therefore doubled in this test as each anchor needed to develop double the area of CFRP. See Figure 4-26.
Figure 4-26 Component contribution to shear force vs. deformation response of 24-3-8
The maximum shear capacity of this test was 153 k (Figure 4-26), which is slightly greater than the capacity of test 24-3-1r (152 k). Failure mode in this test was fracture of a CFRP anchor in strip D that was located at a critical shear crack as shown in Figure 4-27 and Figure 4-28. In addition, a large crack extended to the flange on the front side of the beam where the CFRP anchor fractured. There was less damage on the back side of the beam. A shear of 133 k was maintained after the fracture of the CFRP anchor. The recorded maximum strain in the CFRP was 0.0072 (in gauge F1D.1), indicating that CFRP strips did not reach their maximum capacity. The test demonstrates that improvements in CFRP anchor details for multi-layer applications are needed.
0
25
50
75
100
125
150
175
0 0.2 0.4 0.6 0.8 1
Appl
ied
Shea
r (ki
ps)
Displacement (in.)
0
25
50
75
100
125
150
175
0 0.004 0.008 0.012 0.016 0.02
Appl
ied
Shea
r (ki
ps)
Shear Strain (in./in.)
Fs
Fc
Ff
Fs
Fc
Ff
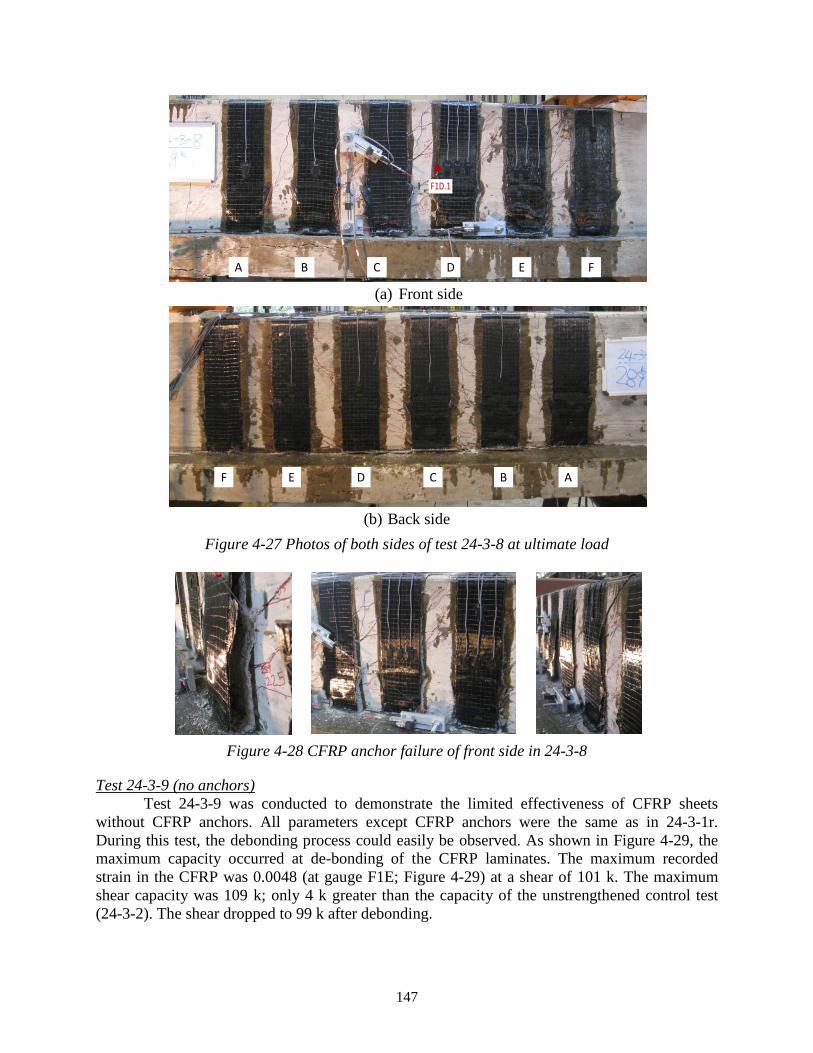
147
(a) Front side
(b) Back side
Figure 4-27 Photos of both sides of test 24-3-8 at ultimate load
Figure 4-28 CFRP anchor failure of front side in 24-3-8
Test 24-3-9 (no anchors) Test 24-3-9 was conducted to demonstrate the limited effectiveness of CFRP sheets
without CFRP anchors. All parameters except CFRP anchors were the same as in 24-3-1r. During this test, the debonding process could easily be observed. As shown in Figure 4-29, the maximum capacity occurred at de-bonding of the CFRP laminates. The maximum recorded strain in the CFRP was 0.0048 (at gauge F1E; Figure 4-29) at a shear of 101 k. The maximum shear capacity was 109 k; only 4 k greater than the capacity of the unstrengthened control test (24-3-2). The shear dropped to 99 k after debonding.
D E C B A F
D E C B A F
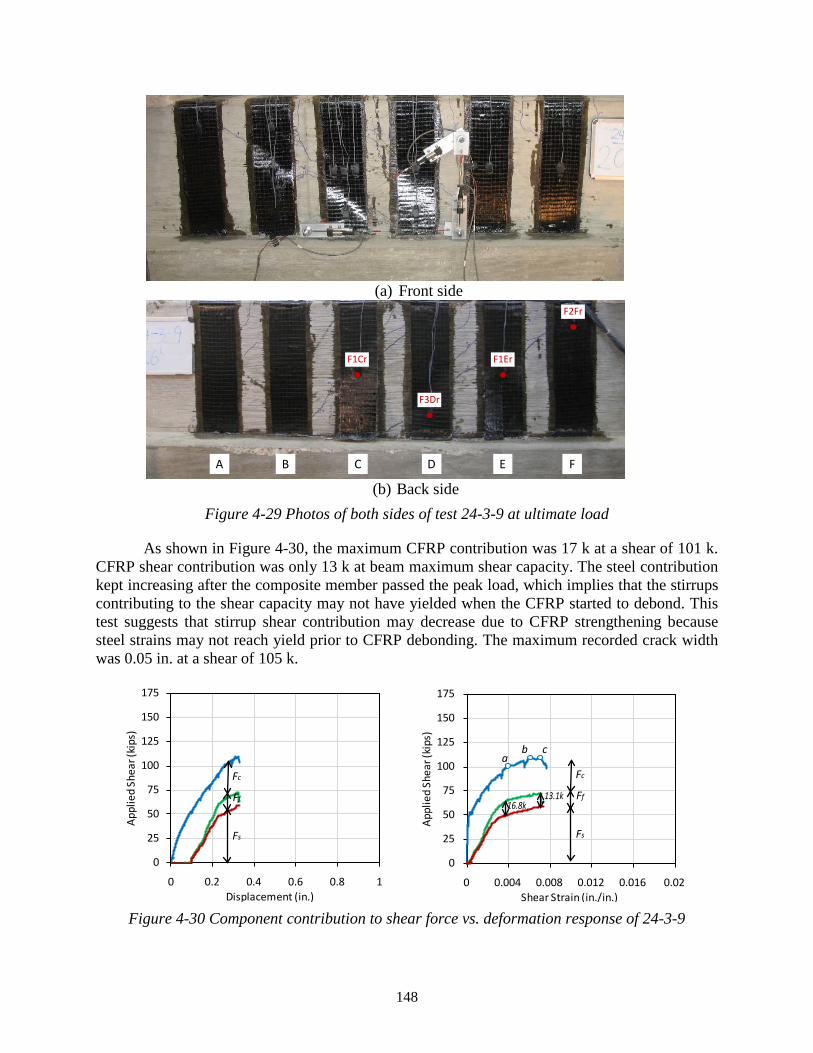
148
(a) Front side
(b) Back side
Figure 4-29 Photos of both sides of test 24-3-9 at ultimate load
As shown in Figure 4-30, the maximum CFRP contribution was 17 k at a shear of 101 k. CFRP shear contribution was only 13 k at beam maximum shear capacity. The steel contribution kept increasing after the composite member passed the peak load, which implies that the stirrups contributing to the shear capacity may not have yielded when the CFRP started to debond. This test suggests that stirrup shear contribution may decrease due to CFRP strengthening because steel strains may not reach yield prior to CFRP debonding. The maximum recorded crack width was 0.05 in. at a shear of 105 k.
Figure 4-30 Component contribution to shear force vs. deformation response of 24-3-9
0
25
50
75
100
125
150
175
0 0.2 0.4 0.6 0.8 1
Appl
ied
Shea
r (ki
ps)
Displacement (in.)
0
25
50
75
100
125
150
175
0 0.004 0.008 0.012 0.016 0.02
Appl
ied
Shea
r (ki
ps)
Shear Strain (in./in.)
F1Cr
F3Dr
F1Er
F2Fr
D E C B A F
a b c
Fs
Fc
Ff
Fs
Fc
Ff
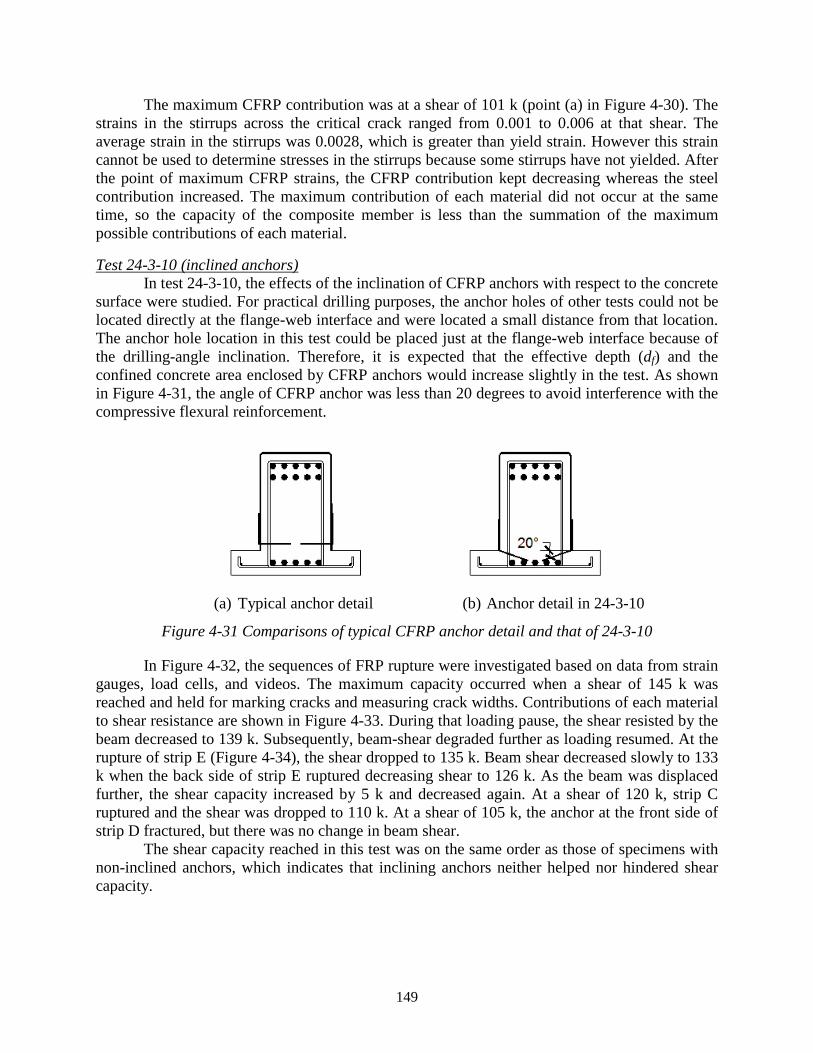
149
The maximum CFRP contribution was at a shear of 101 k (point (a) in Figure 4-30). The strains in the stirrups across the critical crack ranged from 0.001 to 0.006 at that shear. The average strain in the stirrups was 0.0028, which is greater than yield strain. However this strain cannot be used to determine stresses in the stirrups because some stirrups have not yielded. After the point of maximum CFRP strains, the CFRP contribution kept decreasing whereas the steel contribution increased. The maximum contribution of each material did not occur at the same time, so the capacity of the composite member is less than the summation of the maximum possible contributions of each material.
Test 24-3-10 (inclined anchors) In test 24-3-10, the effects of the inclination of CFRP anchors with respect to the concrete
surface were studied. For practical drilling purposes, the anchor holes of other tests could not be located directly at the flange-web interface and were located a small distance from that location. The anchor hole location in this test could be placed just at the flange-web interface because of the drilling-angle inclination. Therefore, it is expected that the effective depth (df) and the confined concrete area enclosed by CFRP anchors would increase slightly in the test. As shown in Figure 4-31, the angle of CFRP anchor was less than 20 degrees to avoid interference with the compressive flexural reinforcement.
(a) Typical anchor detail (b) Anchor detail in 24-3-10
Figure 4-31 Comparisons of typical CFRP anchor detail and that of 24-3-10
In Figure 4-32, the sequences of FRP rupture were investigated based on data from strain gauges, load cells, and videos. The maximum capacity occurred when a shear of 145 k was reached and held for marking cracks and measuring crack widths. Contributions of each material to shear resistance are shown in Figure 4-33. During that loading pause, the shear resisted by the beam decreased to 139 k. Subsequently, beam-shear degraded further as loading resumed. At the rupture of strip E (Figure 4-34), the shear dropped to 135 k. Beam shear decreased slowly to 133 k when the back side of strip E ruptured decreasing shear to 126 k. As the beam was displaced further, the shear capacity increased by 5 k and decreased again. At a shear of 120 k, strip C ruptured and the shear was dropped to 110 k. At a shear of 105 k, the anchor at the front side of strip D fractured, but there was no change in beam shear.
The shear capacity reached in this test was on the same order as those of specimens with non-inclined anchors, which indicates that inclining anchors neither helped nor hindered shear capacity.

150
Figure 4-32 Failure sequences of test 24-3-10
Figure 4-33 Component contribution to shear force vs. deformation response of 24-3-10
0
25
50
75
100
125
150
175
0 0.005 0.01 0.015 0.02 0.025 0.03
Appl
ied
Shea
r (ki
ps)
Shear Strain (in./in.)
0
25
50
75
100
125
150
175
0 0.2 0.4 0.6 0.8 1
Appl
ied
Shea
r (ki
ps)
Displacement (in.)
0
25
50
75
100
125
150
175
0 0.004 0.008 0.012 0.016 0.02
Appl
ied
Shea
r (ki
ps)
Shear Strain (in./in.)
(a) (b)
(c)
(d)
105
120110
128
145
126133
123
135139
(a) Rupture : Strip E (front) (b) Rupture : Strip E (back) (c) Rupture : Strip C (front & back) (d) Fracture : CFRP anchor strip D (front)
Fs
Fc
Ff
Fs
Fc
Ff
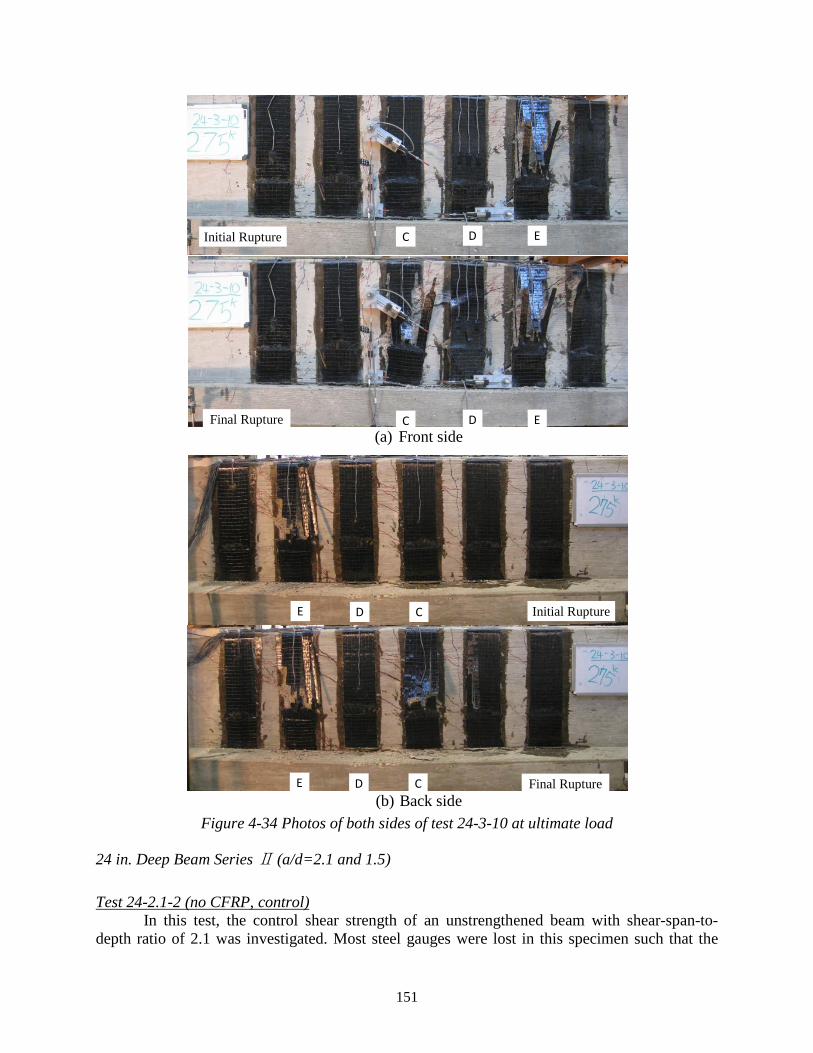
151
(a) Front side
(b) Back side
Figure 4-34 Photos of both sides of test 24-3-10 at ultimate load
24 in. Deep Beam Series Ⅱ (a/d=2.1 and 1.5)
Test 24-2.1-2 (no CFRP, control) In this test, the control shear strength of an unstrengthened beam with shear-span-to-
depth ratio of 2.1 was investigated. Most steel gauges were lost in this specimen such that the
D C E Initial Rupture
D E C Initial Rupture
Final Rupture D E C
Final Rupture D C E

152
steel contribution was evaluated from just one gauge (Figure 4-35). At the shear of 119 k, the maximum crack width exceeded 0.05 in. and kept increasing after that. Shear failure occurred at a shear of 129 k with a failure mode of diagonal tension (Figure 4-36). After peak load, the shear capacity decreased slowly over large deformations.
Figure 4-35 Component contribution to shear force vs. deformation response of 24-2.1-2
(a) Front side (b) Back side
Figure 4-36 Photos of both sides of test 24-2.1-2 at ultimate load
Test 24-2.1-1(1 layer, strengthened) The failure mode in test 24-2.1-1 was a combination of CFRP rupture and CFRP anchor
failure. The maximum crack width exceeded 0.05 in. at a shear of 125 k and kept increasing up to failure. At a shear of 135 k, one strain at one CFRP location was greater than 0.01. At a shear of 162 k, a strain at another CFRP CFPR location exceeded 0.01. At that load, there was no visual evidence of rupture. A high strain reading in one gauge causes over-estimation the CFRP contribution as it does not reflect the variations in strain along the length and across the width of the strips. For this test, the CFRP shear contribution was therefore estimated using a range of values with the lower bound based on strips rupturing at the reported ultimate strain, and the upper bound based on the strips maintaining a strain of 0.01 without rupturing (Figure 4-37).
0
25
50
75
100
125
150
175
0 0.1 0.2 0.3 0.4 0.5
Appl
ied
Shea
r (ki
ps)
Displacement (in.)
0
25
50
75
100
125
150
175
0 0.004 0.008 0.012 0.016 0.02
Appl
ied
Shea
r (ki
ps)
Shear Strain (in./in.)
Fs
Fc
Fs
Fc

153
Figure 4-37 Component contribution to shear force vs. deformation response of 24-2.1-1
This capacity of the strengthened beam was greater than that of the longer beam with nominally identical CFRP and transverse steel layouts (24-3-2). This increase in shear capacity was primarily due to the difference in shear-span-depth ratio. The front side of strip C partially ruptured at a shear of 162 k. Failure occurred at a shear of 170 k (Figure 4-38), which was 18 k greater than the capacity of 24-3-1r and 24 k greater than the capacity of 24-3-1r. The percent increase of shear strength due to CFRP was lower for a/d = 2.1 than for a/d = 3.
(a) Front side (b) Back side
Figure 4-38 Photos of both sides of test 24-2.1-1 at ultimate load
Test 24-1.5-3 (no CFRP, control) A control test (24-1.5-3) was conducted to determine the unstrengthened shear strength of
the test specimen with a shear span-to-depth ratio equal to 1.5. The failure mode was controlled by the crushing of the concrete strut at a shear of 233 k (Figure 4-39 and Figure 4-40).
0
25
50
75
100
125
150
175
0 0.2 0.4 0.6 0.8 1
Appl
ied
Shea
r (ki
ps)
Displacement (in.)
0
25
50
75
100
125
150
175
0 0.004 0.008 0.012 0.016 0.02
Appl
ied
Shea
r (ki
ps)
Shear Strain (in./in.)
Fs
Fc
Ff
Fs
Fc
Ff
A B C D A B C D

154
Figure 4-39 Component contribution to shear force vs. deformation response of 24-1.5-3
(a) Front side (b) Back side
Figure 4-40 Photos of test 24-1.5-3 at failure
Test 24-1.5-4 (1 layers, strengthened) Test 24-1.5-4 was conducted in the high-capacity loading setup because the expected
shear strength was greater than the capacity of the original setup (240 k). Maximum shear capacity was reached just prior to the rupture of CFRP strips. The shear capacity at failure was 264 k (Figure 4-41 and Figure 4-42). The relatively small increase in capacity due to strengthening (= 264-233 = 31 k) indicated that CFRP strengthening is not likely to be efficient if the capacity is governed by a compression failure in the concrete strut.
0255075
100125150175200225250275
0 0.1 0.2 0.3 0.4 0.5
Appl
ied
Shea
r (ki
ps)
Displacement (in.)
0255075
100125150175200225250275
0 0.004 0.008 0.012 0.016 0.02
Appl
ied
Shea
r (ki
ps)
Shear Strain (in./in.)
Fs
Fc
Fs
Fc
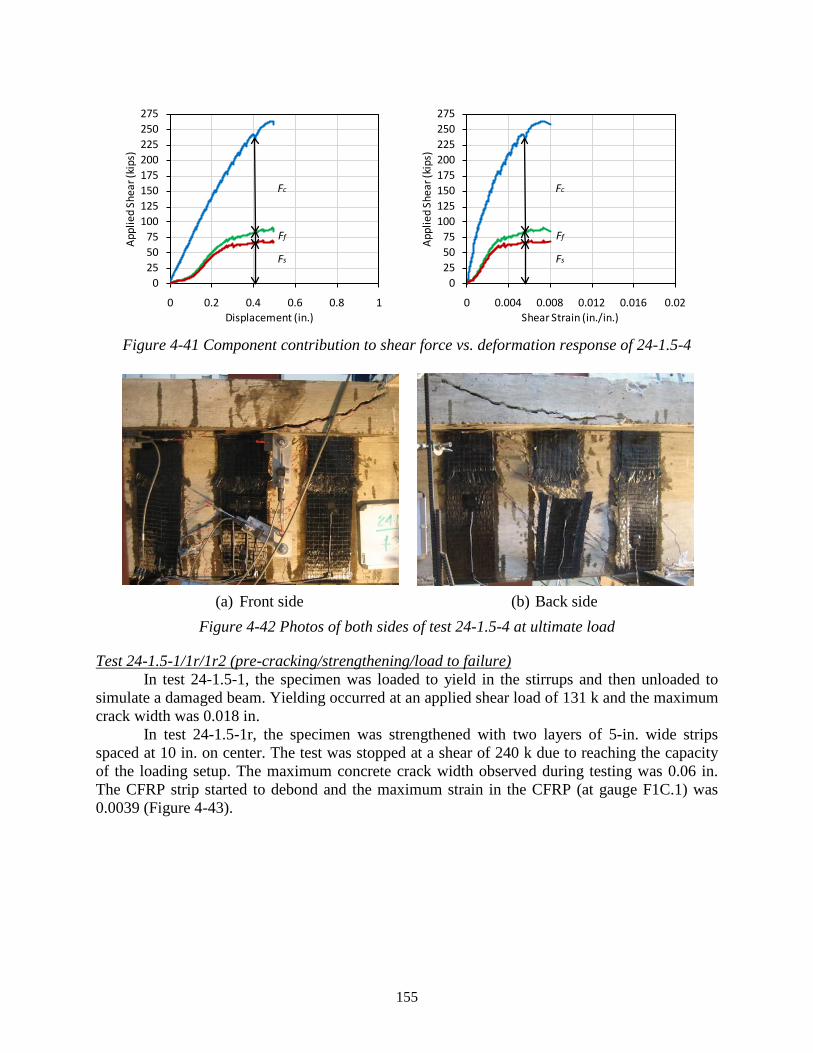
155
Figure 4-41 Component contribution to shear force vs. deformation response of 24-1.5-4
(a) Front side (b) Back side
Figure 4-42 Photos of both sides of test 24-1.5-4 at ultimate load
Test 24-1.5-1/1r/1r2 (pre-cracking/strengthening/load to failure) In test 24-1.5-1, the specimen was loaded to yield in the stirrups and then unloaded to
simulate a damaged beam. Yielding occurred at an applied shear load of 131 k and the maximum crack width was 0.018 in.
In test 24-1.5-1r, the specimen was strengthened with two layers of 5-in. wide strips spaced at 10 in. on center. The test was stopped at a shear of 240 k due to reaching the capacity of the loading setup. The maximum concrete crack width observed during testing was 0.06 in. The CFRP strip started to debond and the maximum strain in the CFRP (at gauge F1C.1) was 0.0039 (Figure 4-43).
0255075
100125150175200225250275
0 0.2 0.4 0.6 0.8 1
Appl
ied
Shea
r (ki
ps)
Displacement (in.)
0255075
100125150175200225250275
0 0.004 0.008 0.012 0.016 0.02
Appl
ied
Shea
r (ki
ps)
Shear Strain (in./in.)
Fs
Fc
Ff
Fs
Fc
Ff
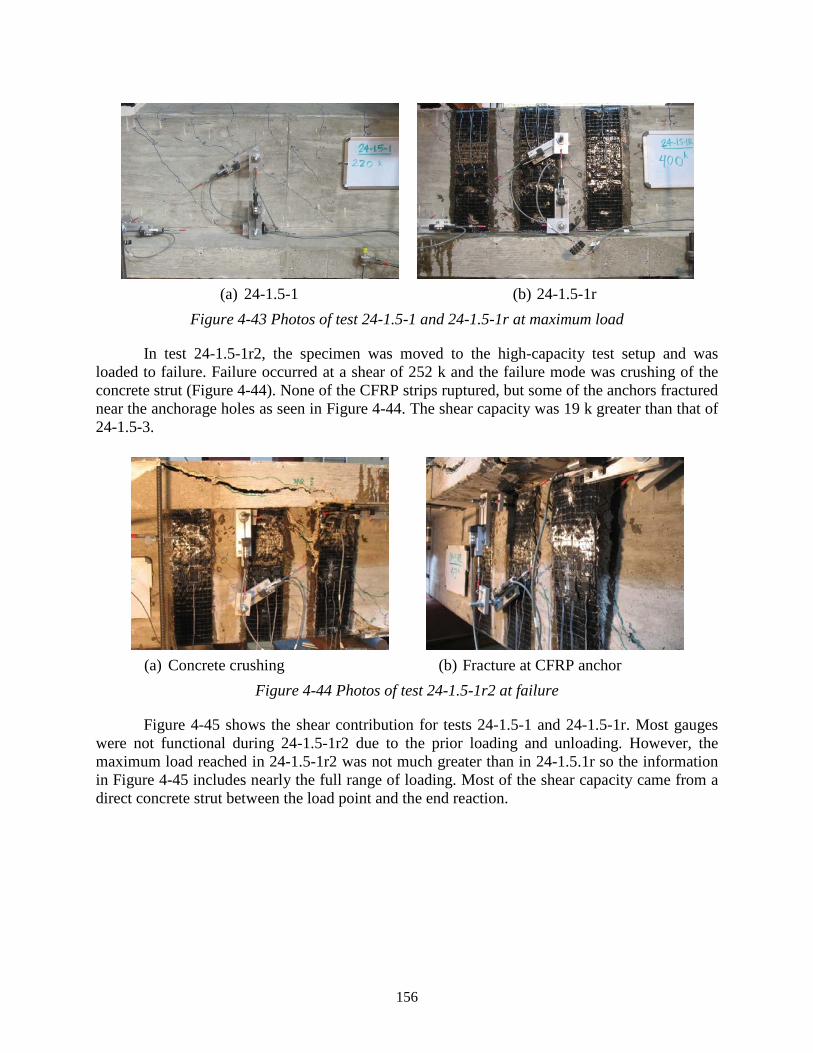
156
(a) 24-1.5-1 (b) 24-1.5-1r
Figure 4-43 Photos of test 24-1.5-1 and 24-1.5-1r at maximum load
In test 24-1.5-1r2, the specimen was moved to the high-capacity test setup and was loaded to failure. Failure occurred at a shear of 252 k and the failure mode was crushing of the concrete strut (Figure 4-44). None of the CFRP strips ruptured, but some of the anchors fractured near the anchorage holes as seen in Figure 4-44. The shear capacity was 19 k greater than that of 24-1.5-3.
(a) Concrete crushing (b) Fracture at CFRP anchor
Figure 4-44 Photos of test 24-1.5-1r2 at failure
Figure 4-45 shows the shear contribution for tests 24-1.5-1 and 24-1.5-1r. Most gauges were not functional during 24-1.5-1r2 due to the prior loading and unloading. However, the maximum load reached in 24-1.5-1r2 was not much greater than in 24-1.5.1r so the information in Figure 4-45 includes nearly the full range of loading. Most of the shear capacity came from a direct concrete strut between the load point and the end reaction.

157
Figure 4-45 Component contribution to shear force vs. deformation response of 24-1.5-1/1r
Test 24-1.5-2 (no anchor) Test 24-1.5-2 was conducted with the same configuration as test 24-1.5-1r, but no CFRP
anchors were used. Figure 4-46, Figure 4-47, and Figure 4-48 provide an indication of the performance. Failure occurred at a shear of 255 kips, which is nearly the same as the capacity in 24-1.5-1r2. Such results indicate that the effects of CFRP strips were minimal on shear strength; which was dominated by the compression strut. Failure in 24-1.5-2 was triggered by CFRP debonding. The maximum strain in the CFRP was 0.004.
Figure 4-46 Component contribution to shear force vs. deformation response of 24-1.5-2
0255075
100125150175200225250275
0 0.2 0.4 0.6 0.8 1
Appl
ied
Shea
r (ki
ps)
Displacement (in.)
0255075
100125150175200225250275
0 0.004 0.008 0.012 0.016 0.02
Appl
ied
Shea
r (ki
ps)
Shear Strain (in./in.)
0255075
100125150175200225250275
0 0.2 0.4 0.6 0.8 1
Appl
ied
Shea
r (ki
ps)
Displacement (in.)
0255075
100125150175200225250275
0 0.004 0.008 0.012 0.016 0.02
Appl
ied
Shea
r (ki
ps)
Shear Strain (in./in.)
Fs
Fc
Ff
Fs
Fc
Ff
Fs
Fc
Ff
Fs
Fc
Ff

158
(a) Front side (b) Back side
Figure 4-47 Photos of test 24-1.5-2 at failure
(a) Strip-end debonding (b) Intermediate crack debonding
Figure 4-48 Debonding in test 24-1.5-2 at failure
48 in. Deep Beam Series Ι (18 in. stirrups spacing)
Test 48-3-1 (no CFRP, control for tests 1~4) The estimated capacity of 48-3-1 was 108 k calculated using ACI shear design equations.
Based on the ratio of computed to observed strengths of 1.66 for 24-3-2 (control), the capacity of this test was expected to be around 180 k. Loading was stopped at a shear of 147 k as shown in Figure 4-49 to prevent excessive damage in the other span and to allow a subsequent test of that span. At around 30 k, the slope of the load-displacement graph inclined slightly and several flexural cracks occurred at the loading point. At 67 k, one of the flexural cracks developed into a flexural-shear crack (Figure 4-50). The shear stiffness also changed at that load while strains in stirrup D (D2, D3 and D3r) increased abruptly. The range of the crack widths at that load was 0.007 ~ 0.016 in. Diagonal cracking extended across stirrups C to E. At 94 k, another shear crack formed from stirrups D to F and was parallel to the previous shear crack. The crack widths of that crack ranged from 0.010 to 0.025 in. at that load; which were almost identical to widths of the first crack. The shallow diagonal crack that spread from stirrups C to F was the dominant crack and extended to the flange region. At 147 k, a new shear crack formed across stirrups A to C and the test was stopped to avoid damage that would prevent testing the other end of the beam.

159
At that load, the maximum crack width was about 3/16 in. (Figure 4-50). The maximum stirrup strain was 0.009 and all stirrups crossing the critical crack yielded.
Figure 4-49 Component contribution to shear force vs. deformation response of 48-3-1
0
50
100
150
200
250
300
0 0.4 0.8 1.2 1.6 2
Appl
ied
Shea
r (ki
ps)
Displacement (in.)
0
50
100
150
200
250
300
0 0.002 0.004 0.006 0.008 0.01
Appl
ied
Shea
r (ki
ps)
Shear Strain (in./in.)
Fs
Fc
Fs
Fc
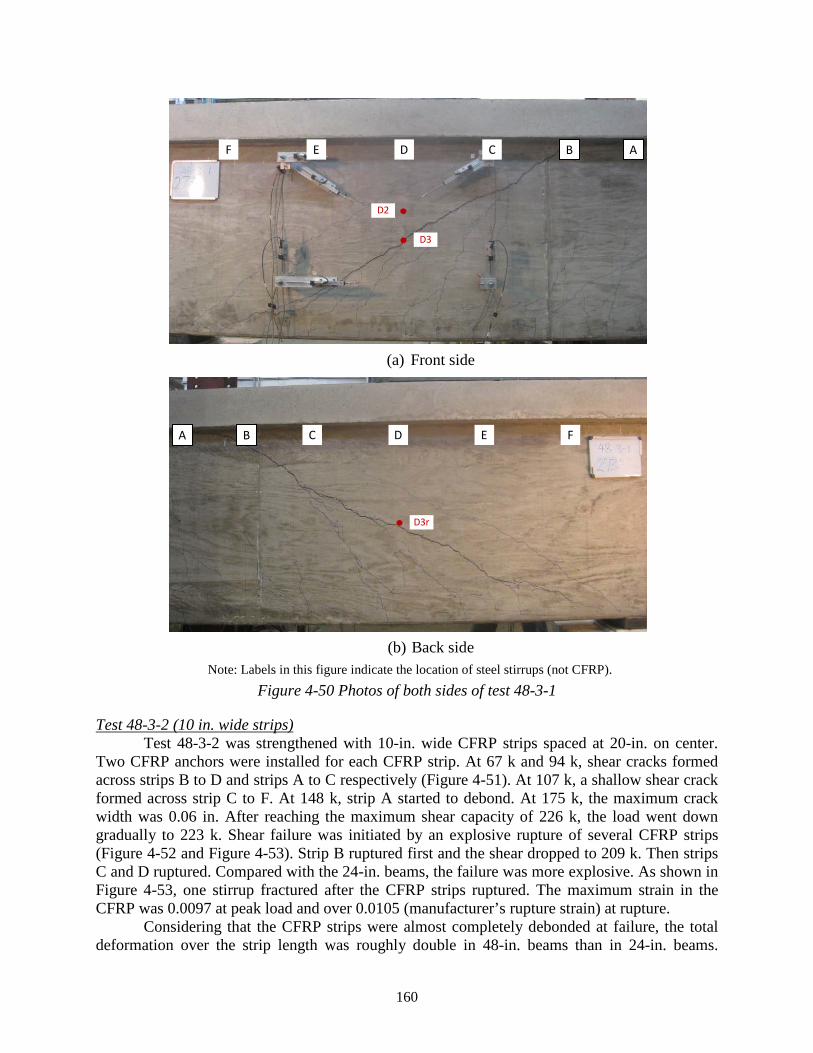
160
(a) Front side
(b) Back side
Note: Labels in this figure indicate the location of steel stirrups (not CFRP). Figure 4-50 Photos of both sides of test 48-3-1
Test 48-3-2 (10 in. wide strips) Test 48-3-2 was strengthened with 10-in. wide CFRP strips spaced at 20-in. on center.
Two CFRP anchors were installed for each CFRP strip. At 67 k and 94 k, shear cracks formed across strips B to D and strips A to C respectively (Figure 4-51). At 107 k, a shallow shear crack formed across strip C to F. At 148 k, strip A started to debond. At 175 k, the maximum crack width was 0.06 in. After reaching the maximum shear capacity of 226 k, the load went down gradually to 223 k. Shear failure was initiated by an explosive rupture of several CFRP strips (Figure 4-52 and Figure 4-53). Strip B ruptured first and the shear dropped to 209 k. Then strips C and D ruptured. Compared with the 24-in. beams, the failure was more explosive. As shown in Figure 4-53, one stirrup fractured after the CFRP strips ruptured. The maximum strain in the CFRP was 0.0097 at peak load and over 0.0105 (manufacturer’s rupture strain) at rupture.
Considering that the CFRP strips were almost completely debonded at failure, the total deformation over the strip length was roughly double in 48-in. beams than in 24-in. beams.
D2
D3
C D E F B A
D3r
C D E F B A

161
Deformations in steel stirrups however are concentrated around the critical shear crack due to bond between the steel and concrete. Thus, strains in the steel stirrups are substantially larger in the 48 in. beams than in the 24 in. beams at rupture of CFRP strip, which may explain the fracture of the stirrup in this test.
Figure 4-51 Component contribution to shear force vs. deformation response of 48-3-2
0
50
100
150
200
250
300
0 0.4 0.8 1.2 1.6 2
Appl
ied
Shea
r (ki
ps)
Displacement (in.)
0
50
100
150
200
250
300
0 0.002 0.004 0.006 0.008 0.01
Appl
ied
Shea
r (ki
ps)
Shear Strain (in./in.)
Fs
Fc
Ff
Fs
Fc
Ff
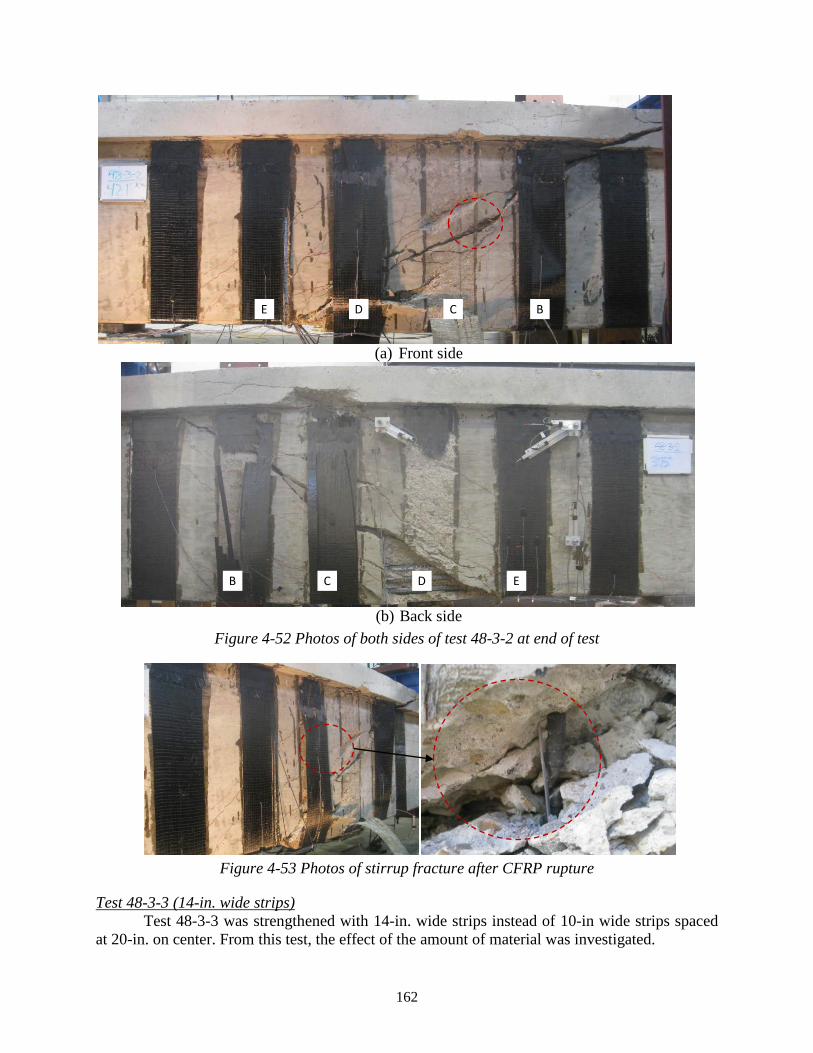
162
(a) Front side
(b) Back side
Figure 4-52 Photos of both sides of test 48-3-2 at end of test
Figure 4-53 Photos of stirrup fracture after CFRP rupture
Test 48-3-3 (14-in. wide strips) Test 48-3-3 was strengthened with 14-in. wide strips instead of 10-in wide strips spaced
at 20-in. on center. From this test, the effect of the amount of material was investigated.
C D E B
D C B E

163
The response of 48-3-3 is shown in Figure 4-54. At 67 k, steep shear cracks formed between strips A and B and strips B and C. A shallow shear crack then occurred between strips C and E at 107 k. At that load, the maximum strain was 0.001 in the stirrups and 0.0015 in the CFRP strips. At 121 k, another shear crack parallel to previous one occurred from strips D to F. At 148 k, a malfunction caused the load to drop, but the beam was reloaded up to same level of shear. At 188 k, the CFRP strips began to debond. At 228 k, a small crack extended into the flange. When the test was stopped at 239 k to protect the other side of the beam, the CFRP strain was 0.009 at gauge FD2.2 (FC1: 0.0083, FE4: 0.0072, FF5: 0.0048) and stirrup strain was over 0.01 at D2. The maximum crack width was 0.04 inches (Figure 4-55 and Figure 4-56). In previous tests, ultimate strength was reached shortly after CFRP strains reached 0.009. Therefore, the maximum shear reached can be considered very close to the failure load.
Figure 4-54 Component contribution to shear force vs. deformation response of 48-3-3
0
50
100
150
200
250
300
0 0.4 0.8 1.2 1.6 2
Appl
ied
Shea
r (ki
ps)
Displacement (in.)
0
50
100
150
200
250
300
0 0.002 0.004 0.006 0.008 0.01
Appl
ied
Shea
r (ki
ps)
Shear Strain (in./in.)
Fs
Fc
Ff
Fs
Fc
Ff
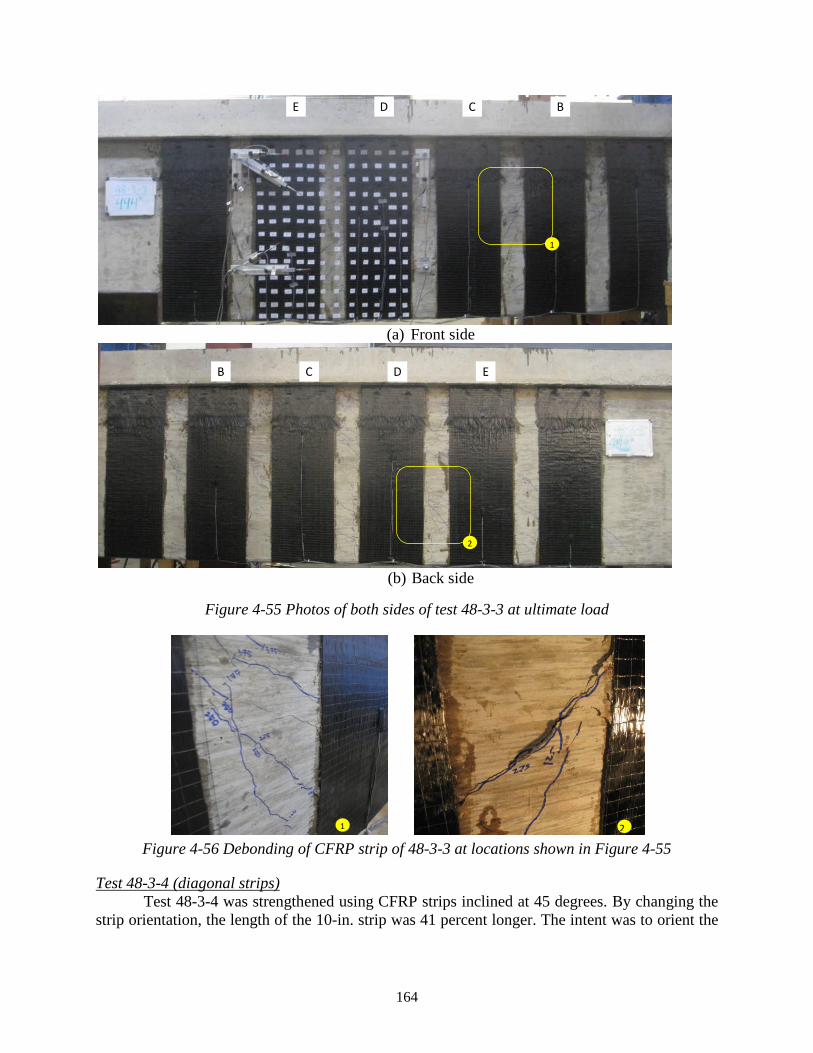
164
(a) Front side
(b) Back side
Figure 4-55 Photos of both sides of test 48-3-3 at ultimate load
Figure 4-56 Debonding of CFRP strip of 48-3-3 at locations shown in Figure 4-55
Test 48-3-4 (diagonal strips) Test 48-3-4 was strengthened using CFRP strips inclined at 45 degrees. By changing the
strip orientation, the length of the 10-in. strip was 41 percent longer. The intent was to orient the
2
C D E B
C D E B
2
1
1
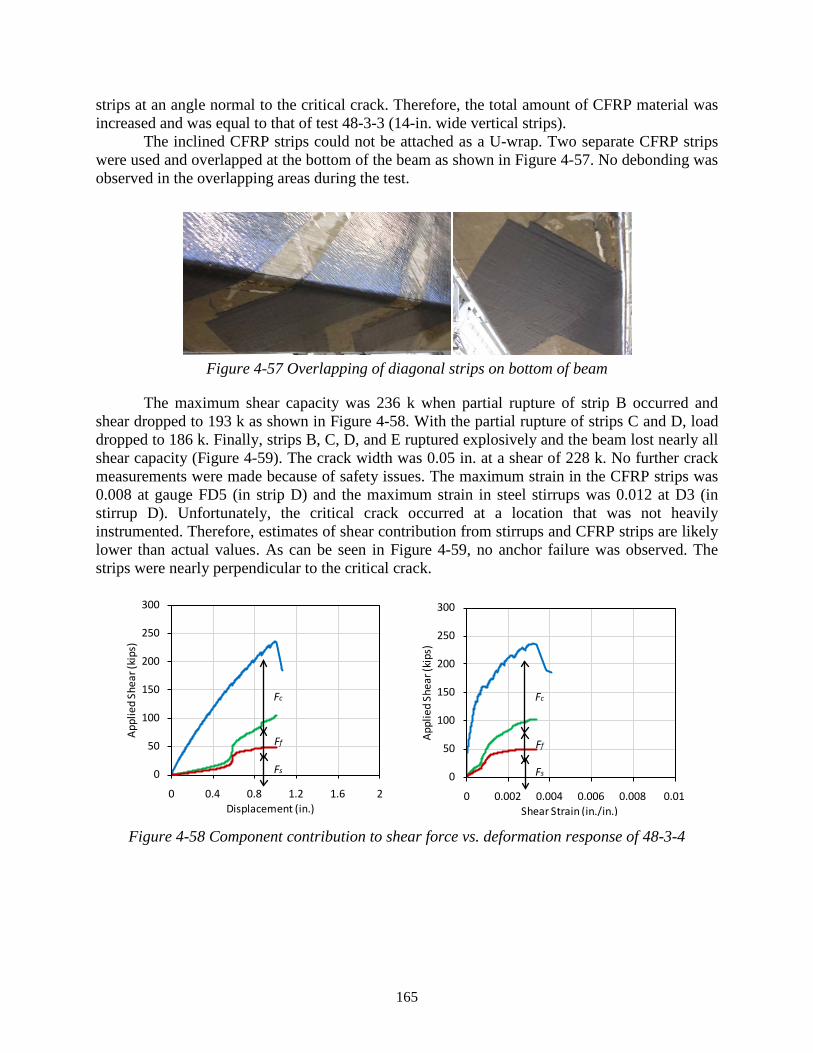
165
strips at an angle normal to the critical crack. Therefore, the total amount of CFRP material was increased and was equal to that of test 48-3-3 (14-in. wide vertical strips).
The inclined CFRP strips could not be attached as a U-wrap. Two separate CFRP strips were used and overlapped at the bottom of the beam as shown in Figure 4-57. No debonding was observed in the overlapping areas during the test.
Figure 4-57 Overlapping of diagonal strips on bottom of beam
The maximum shear capacity was 236 k when partial rupture of strip B occurred and shear dropped to 193 k as shown in Figure 4-58. With the partial rupture of strips C and D, load dropped to 186 k. Finally, strips B, C, D, and E ruptured explosively and the beam lost nearly all shear capacity (Figure 4-59). The crack width was 0.05 in. at a shear of 228 k. No further crack measurements were made because of safety issues. The maximum strain in the CFRP strips was 0.008 at gauge FD5 (in strip D) and the maximum strain in steel stirrups was 0.012 at D3 (in stirrup D). Unfortunately, the critical crack occurred at a location that was not heavily instrumented. Therefore, estimates of shear contribution from stirrups and CFRP strips are likely lower than actual values. As can be seen in Figure 4-59, no anchor failure was observed. The strips were nearly perpendicular to the critical crack.
Figure 4-58 Component contribution to shear force vs. deformation response of 48-3-4
0
50
100
150
200
250
300
0 0.4 0.8 1.2 1.6 2
Appl
ied
Shea
r (ki
ps)
Displacement (in.)
0
50
100
150
200
250
300
0 0.002 0.004 0.006 0.008 0.01
Appl
ied
Shea
r (ki
ps)
Shear Strain (in./in.)
Fs
Fc
Ff
Fs
Fc
Ff
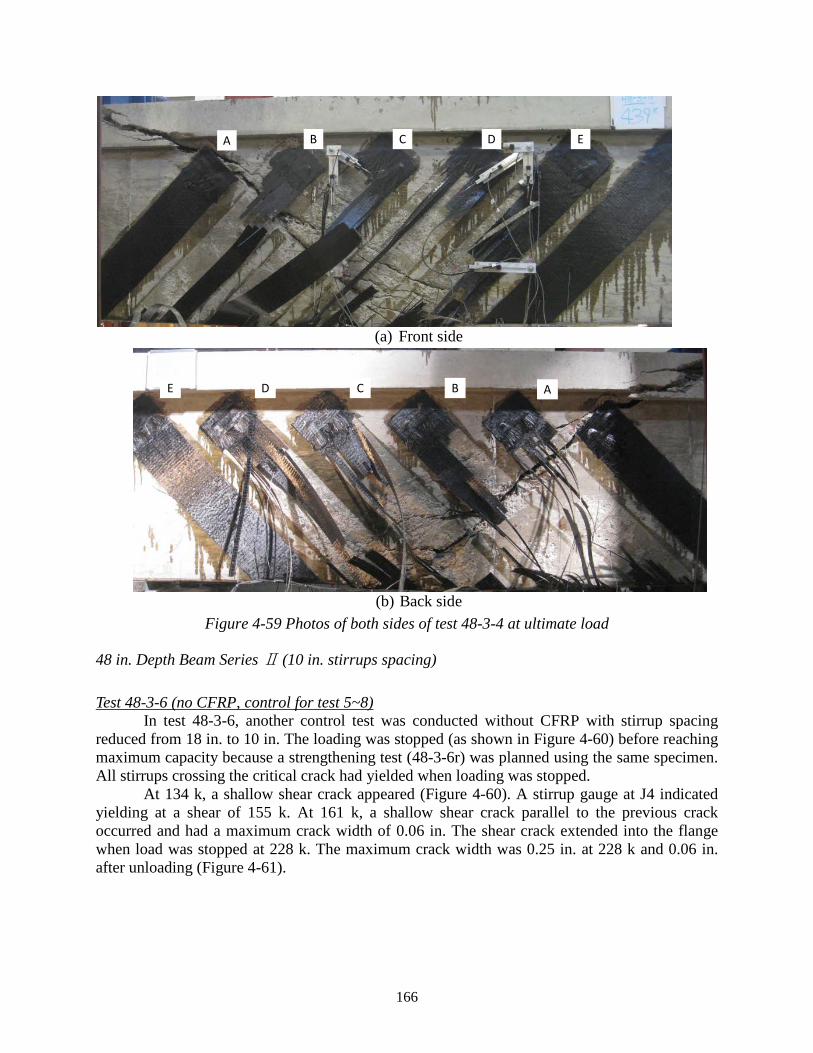
166
(a) Front side
(b) Back side
Figure 4-59 Photos of both sides of test 48-3-4 at ultimate load
48 in. Depth Beam Series Ⅱ (10 in. stirrups spacing)
Test 48-3-6 (no CFRP, control for test 5~8) In test 48-3-6, another control test was conducted without CFRP with stirrup spacing
reduced from 18 in. to 10 in. The loading was stopped (as shown in Figure 4-60) before reaching maximum capacity because a strengthening test (48-3-6r) was planned using the same specimen. All stirrups crossing the critical crack had yielded when loading was stopped.
At 134 k, a shallow shear crack appeared (Figure 4-60). A stirrup gauge at J4 indicated yielding at a shear of 155 k. At 161 k, a shallow shear crack parallel to the previous crack occurred and had a maximum crack width of 0.06 in. The shear crack extended into the flange when load was stopped at 228 k. The maximum crack width was 0.25 in. at 228 k and 0.06 in. after unloading (Figure 4-61).
D C B E A
D C B E A

167
Figure 4-60 Component contribution to shear force vs. deformation response of 48-3-6
(a) Front side
(b) Back side
Figure 4-61 Photos of both sides of test 48-3-6 when load stopped
0
50
100
150
200
250
300
0 0.4 0.8 1.2 1.6 2
Appl
ied
Shea
r (ki
ps)
Displacement (in.)
0
50
100
150
200
250
300
0 0.002 0.004 0.006 0.008 0.01
Appl
ied
Shea
r (ki
ps)
Shear Strain (in./in.)
Fs
Fc
Fs
Fc

168
Test 48-3-5 (strengthened) Test 48-3-5 was conducted with 10 in. wide strips spaced at 20 in. on center and stirrups
spaced at 10 in. The CFRP strengthening scheme was the same as for 48-3-2 that had stirrups at 18in. The transverse steel reinforcement ratio in this test was the same as that of the 24 in. beams.
The response of 48-3-5 is shown in Figure 4-62. At 94 k, a shallow web shear crack was observed from strip C to strip E. Several steep shear cracks formed earlier. The maximum crack width was 0.01 in. at 94 k. Steel strain at J3 was 0.0022, which indicated the yielding of the stirrup. At 107 k, another shear crack parallel to the previous crack occurred from strip D to strip F (Figure 4-63). At 121 k, Strip D started to debond (Figure 4-64). Loading was stopped at 242 k. All stirrups along the critical crack yielded, and the maximum recorded strain in the CFRP was 0.0088 at FC1. The maximum crack width was 1/8 in.
Figure 4-62 Component contribution to shear force vs. deformation response of 48-3-5
0
50
100
150
200
250
300
0 0.4 0.8 1.2 1.6 2
Appl
ied
Shea
r (ki
ps)
Displacement (in.)
0
50
100
150
200
250
300
0 0.002 0.004 0.006 0.008 0.01
Appl
ied
Shea
r (ki
ps)
Shear Strain (in./in.)
Fs
Fc
Ff
Fs
Fc
Ff
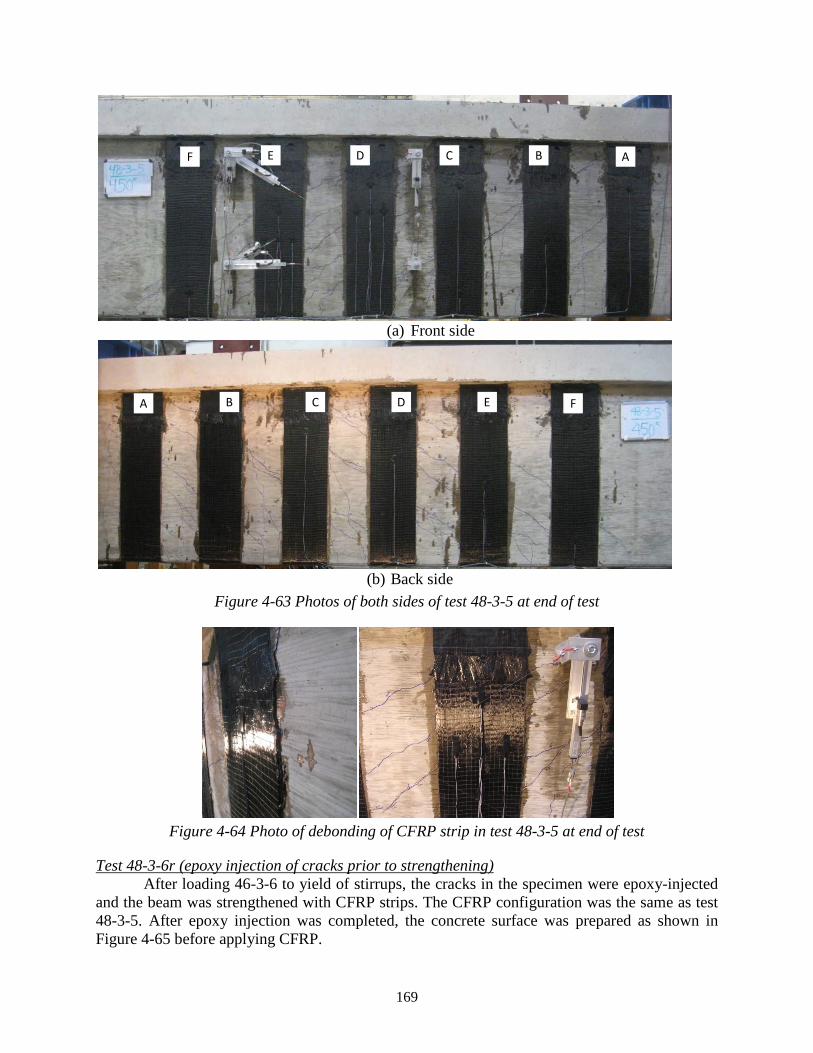
169
(a) Front side
(b) Back side
Figure 4-63 Photos of both sides of test 48-3-5 at end of test
Figure 4-64 Photo of debonding of CFRP strip in test 48-3-5 at end of test
Test 48-3-6r (epoxy injection of cracks prior to strengthening) After loading 46-3-6 to yield of stirrups, the cracks in the specimen were epoxy-injected
and the beam was strengthened with CFRP strips. The CFRP configuration was the same as test 48-3-5. After epoxy injection was completed, the concrete surface was prepared as shown in Figure 4-65 before applying CFRP.
D C B E A F
D C B E A F

170
(a) Epoxy injection (b) Chipping
(c) Before grinding the surface (d) After grinding the surface
Figure 4-65 Epoxy injection and surface preparation
The response is shown in Figure 4-66. At 215 k, the maximum CFRP strain was 0.0037. At 228 k, cracks extended to the loading point and the CFRP strips started to debond. At 269 k, the maximum crack width was 0.04 in. At 327 k, flexural steel strain in the bottom layer of bars were as high as 0.0073. The tensile strains were high enough to produce strains near 0.003 in the concrete in compression indicating that the beam was near flexural capacity. After a gradual strength loss, an explosive rupture of CFRP strips occurred at 293 k (Figure 4-67 and Figure 4-68). The strain in the CFRP (FC2) was 0.009 at peak load and 0.012 at rupture. Although the beam reached flexural capacity, failure was triggered by loss of shear capacity when the CFRP strips ruptured.
Figure 4-66 Component contribution to shear force vs. deformation response of 48-3-6r
0
50
100
150
200
250
300
350
0 0.4 0.8 1.2 1.6 2
Appl
ied
Shea
r (ki
ps)
Displacement (in.)
0
50
100
150
200
250
300
350
0 0.002 0.004 0.006 0.008 0.01
Appl
ied
Shea
r (ki
ps)
Shear Strain (in./in.)
Fs
Fc
Ff
Fs
Fc
Ff

171
The measured shear stiffness of 48-3-6r was much greater than that of similar beams, because the critical crack occurred in a region outside of the points where shear measurements were determined as shown in Figure 4-67.
(a) Front side
(b) Back side
Figure 4-67 Photos of both sides of test 48-3-6r at ultimate
Figure 4-68 Photos of rupture of CFRP strip and anchor in test 48-3-6r

172
Most gauges on the stirrups had residual strain from the previous test (48-3-6), but the effects of residual strain were not included in determining the steel contributions because most stirrups yielded and the stress-strain relationship was no longer linear and could not be monitored. When test 48-3-6 was unloaded, some stirrups might have been in compression because some cracks remained open. Residual stresses may thus have shifted the material stress-strain relationship such that strain hardening plays a more significant role. Such phenomena may explain the significantly higher capacity obtained in this test as compared with other tests and indicate that the maximum capacity of this test cannot be directly compared with others.
Test 48-3-7 (intermediate anchors) Test 48-3-7 was identical to 48-3-5 except for the use of intermediate anchors at mid
height of the CFRP strips. The purpose of immediate anchors was to increase stiffness and reduce cracking by reducing the effective length of the CFRP strips after debonding occurred. The strength of the specimen was not expected to increase because the amount of CFRP material did not change. As shown in Figure 4-70, the intermediate anchors were applied at the middle of the strip and fans were spread vertically in both directions. It was difficult to monitor strain in the CFRP because no gauge could be mounted at the anchor locations.
The response of 48-3-7 is shown in Figure 4-69. At 94 k, a shallow shear crack occurred across strips D and E after several steep shear cracks occurred. At 121 k, the region around the immediate anchors of strips D and E started to debond. At 134 k, stirrups started to yield. At 188 k, audible popping was heard due to debonding. At 215 k, the strain at FA1 exceeded 0.01, but there was no evidence of rupture from visual observation and FA1 was not considered as a reliable gauge. The test was stopped at 242 k and the maximum CFRP strain (FD2r) was 0.0098 and the maximum crack width was 3/32 in. (Figure 4-70 and Figure 4-71).
Figure 4-69 Component contribution to shear force vs. deformation response of 48-3-7
0
50
100
150
200
250
300
0 0.4 0.8 1.2 1.6 2
Appl
ied
Shea
r (ki
ps)
Displacement (in.)
0
50
100
150
200
250
300
0 0.002 0.004 0.006 0.008 0.01
Appl
ied
Shea
r (ki
ps)
Shear Strain (in./in.)
Fs
Fc
Ff
Fs
Fc
Ff

173
(a) Front side
(b) Back side
Figure 4-70 Photos of both sides of test 48-3-7 when load stopped
Figure 4-71 Photo of debonding of CFRP strip in test 48-3-7 when load stopped
Test 48-3-8 (2 layers) Test 48-3-8 was conducted with two layers of CFRP in each strip to evaluate the effect of
the amount of CFRP material. The response of 48-3-8 is shown in Figure 4-72. At 188 k, the
D C B E A F
D C B E A F
debonding debonding

174
steel strain at gauge J4 was 0.0021, which indicated yielding of steel. The maximum CFRP strain at that load was 0.0024 in gauge FD2. At 228 k, strips B, C, and D debonded and the maximum crack width was 0.05 in. The maximum shear in this test was 255 k and was maintained briefly near that level as beam displacement and shear strain increased. The shear dropped when several anchors fractured (Figure 4-73 and Figure 4-74). No CFRP strip rupture was observed. Maximum recorded CFRP strain was 0.0079 (FE4) when the anchors fractured. The strain data indicates that after the steel stirrups yielded, the CFRP strips carried a higher portion of the total shear (Figure 4-72).
Figure 4-72 Component contribution to shear force vs. deformation response of 48-3-8
0
50
100
150
200
250
300
0 0.4 0.8 1.2 1.6 2
Appl
ied
Shea
r (ki
ps)
Displacement (in.)
0
50
100
150
200
250
300
0 0.002 0.004 0.006 0.008 0.01
Appl
ied
Shea
r (ki
ps)
Shear Strain (in./in.)
Fs
Fc
Ff
Fs
Fc
Ff

175
(a) Front side
(b) Back side
Figure 4-73 Photos of both sides of test 48-3-8 at ultimate load
Figure 4-74 Fracture of CFRP anchors

176
Summary of Shear Contribution for Each Material
Estimates of shear contributions for each material that were evaluated using ACI 440 design equations and test strain measurements are presented in Table 4-7. Measured rather than specified concrete and steel material properties were used for all evaluations. Manufacturer specified material properties were used for CFRP due to difficulties in material testing. In particular, estimates using ACI design equations were made with the ultimate specified strain values of the CFRP.
Table 4-7 Comparison between design estimate and test estimate V (k) from DESIGN EQ.
(a) F (k) from TEST
(b) RATIO (b) / (a)
Vc Vs Vf Vn Fc Fs Ff Fn* Fc/Vc Fs/Vs Ff/Vf Fn/Vn 24-3-1r 33 31 27 91 68 51 33 152 2.04 1.63 1.25 1.67
24-3-2 33 31 64 44 62 105 1.33 1.98 1.65
24-3-3 32 31 27 89 54 52 12 118 1.69 1.67 0.46 1.32
24-3-4 31 31 27 89 61 62 25 148* 1.99 1.98 0.96 1.68
24-3-5 31 31 25 91 60 54 31 145 1.76 1.72 1.23 1.60
24-3-6 34 31 56 120 57 42 37 135* 1.69 1.35 0.66 1.13
24-3-7 34 31 53 117 45 56 62 163* 1.40 1.81 1.16 1.40
24-3-8 32 31 53 118 38 56 59 153 1.14 1.80 1.10 1.30
24-3-9 34 31 10 74 37 59 13 109 1.12 1.91 1.30 1.48
24-3-10 33 31 27 89 55 57 34 146 1.77 1.82 1.27 1.64
24-2.1-1 35 31 27 92 84 51 35 170 2.42 1.65 1.31 1.84
24-2.1-2 34 31 66 67 62 129 1.95 1.98 1.96
24-1.5-1r 34 78 53 165 161 68 14 242 4.77 0.87 0.26 1.47
24-1.5-2 33 78 20 131 157 92 6 255 4.76 1.19 0.28 1.95
24-1.5-3 33 78 111 146 87 233 4.44 1.12 2.11
24-1.5-4 30 78 27 135 175 69 21 264 5.74 0.88 0.78 1.96
48-3-1 74 33 107 94 53 147 1.27 1.61 1.38
48-3-2 74 33 60 167 97 49 79 226 1.31 1.51 1.33 1.36
48-3-3 76 33 84 193 76 55 108 239 1.00 1.67 1.29 1.24
48-3-4 77 33 84 193 133 49 55 236 1.72 1.48 0.66 1.22
48-3-5 75 59 60 194 91 96 55 242 1.21 1.62 0.92 1.25
48-3-6 75 59 134 120 109 228 1.59 1.85 1.70
48-3-6r 75 59 60 194 185 92 50 327 2.46 1.56 0.83 1.68
48-3-7 71 59 60 190 85 109 48 242 1.20 1.86 0.80 1.24
48-3-8 67 59 120 245 91 96 68 255 1.37 1.62 0.57 1.04
Note: Due to round-off, total shear may not equal the summation of each contribution.

177
In tests 24-3-4, 24-3-6, and 24-3-7, the shear contributions estimated from strain data were not evaluated at maximum shear. Test 24-3-4 reached the maximum capacity after the rupture of several strips. However, shear estimates were based on strain values at first rupture (Figure 4-75 [a]). In tests 24-3-6 and 24-3-7, maximum shear capacities were maintained for a significant deformation range through which CFRP strains increased while the estimated concrete contribution decreased (Figure 4-75 [b]). Shear estimates for tests 24-3-6 and 24-3-7 were based on values at initiation of loss of concrete contribution.
(a) 24-3-4 (b) 24-3-6
Figure 4-75 Cases in which the point of max. capacity was not used for shear evaluations
Sectional shear equations were used for all a/d ratios as ACI 440 does not treat deep beams. Thus, CFRP shear contributions of tests with shear span to depth ratio of 1.5 were smaller than estimated using design equations and the concrete contributions were greater than estimated (deep beam arch action). Since CFRP strengthening was not effective in a/d = 1.5 beams, only the test results for shear-span-to depth ratio of 3 were included in the statistical summary shown in Table 4-8.
Table 4-8 Statistical summary of test results (a/d=3) 24 in. (a/d=3) (10 tests) 48 in. (a/d=3) (8 tests) All tests of a/d=3 Fc/Vc Fs/Vs Ff/Vf Fn/Vn Fc/Vc Fs/Vs Ff/Vf
Fn/Vn
Fc/Vc
Fs/Vs Ff/Vf Fn/Vn
Mean 1.43 2.03 1.04 1.49 1.41 1.70 0.91 1.34 1.42 1.87 0.99 1.42 Standard
Deviation 0.29 0.22 0.30 0.19 0.44 0.14 0.30 0.23 0.36 0.25 0.29 0.22
In all cases, shear strengths were greater than design estimates. CFRP shear contributions
evaluated from test data were close to design estimates in 24 in. beams, and less than design estimates in 48 in. beams. It should be noted that the mean value of capacity ratios in 48 in. beams was less than in 24 in. beams because half of the 48 in. beams were not tested to failure.
The overall margin of safety on shear estimates for design equations came from conservative estimates of concrete and steel contributions rather than from those of CFRP. For
0
25
50
75
100
125
150
175
0 0.004 0.008 0.012 0.016 0.02
Appl
ied
Shea
r (ki
ps)
Shear Strain (in./in.)
0
25
50
75
100
125
150
175
0 0.004 0.008 0.012 0.016 0.02
Appl
ied
Shea
r (ki
ps)
Shear Strain (in./in.)
Max. capacity
Evaluation capacity
Evaluation capacity Evaluation
capacity Max.
capacity
Fs
Fc
Ff
Fs
Fc
Ff

178
this reason, the design estimates of CFRP need to be more conservative to result in safety margins similar to those for the steel and concrete components of shear.
The ratios from a reduced set of tests (filtered tests) are presented in Table 4-9. Test results in which the failure mode was fracture of CFRP anchors was excluded from results. These include tests 24-3-8 and 48-3-8 with two layers per CFRP strip, test 24-3-6 with dry lay-up that failed at high rupture strains, and test 24-3-3 with poor application of CFRP. Due to improper gauge location in 48-3-4 and residual strains from previous tests in 48-3-6r, their shear contribution could not be evaluated properly and were excluded. In addition, test 48-3-1, -3, -5, -6, and -7 were excluded because the loading was not taken to failure. Compared with Table 4-8, the ratio of CFRP contribution increased because tests that failed by the fracture of CFRP anchors were excluded. Furthermore, the standard deviation of CFRP contribution decreased.
Table 4-9 Comparison between stopped tests and tests to failure (a/d=3) Tests to failure
(24-3-1r,2,4,5,7,9,10, 48-3-2) (a)
Tests stopped before failure
(48-3-1,3,5,6,7) (b)
(a) + (b)
Fc/Vc Fs/Vs Ff/Vf Fn/Vn Fc/Vc Fc/Vc Ff/Vf Fn/Vn Fc/Vc Fs/Vs Ff/Vf Fn/Vn
Mean 1.54 1.80 1.20 1.53 1.22 1.78 1.00 1.36 1.43 1.79 1.15 1.47 Standard
Deviation 0.35 0.16 0.12 0.15 0.21 0.12 0.25 0.20 0.34 0.14 0.18 0.18
Strength ratios evaluated from tests stopped before failure are also presented in Table 4-9
and compared with those of filtered tests. As expected, the mean of capacity ratios was 12 percent less for stopped tests than for filtered tests. It is noteworthy that such a relatively small difference indicates that the specimens were close to ultimate when loading was stopped.
4.1.4 Analysis of results by parameters In Section 4.1.3, results were described for each test and shear contributions of concrete,
steel and CFRP were evaluated from strain gauges and compared with design estimates. The CFRP shear contribution cannot, however, be taken independently without considering the role of CFRP in improving the concrete capacity by reducing crack widths. Furthermore, the presence of CFRP strips changes the steel shear contribution due to interaction between steel and CFRP. A more detailed investigation of the shear contribution of CFRP is presented through direct comparisons of test results from strengthened tests with results from control or unstrengthened tests. The following discussion is organized around key influencing parameters.
CFRP Strengthening with Anchorage versus Unstrengthened
Each beam series included a control test that was not strengthened with CFRP. The shear capacities for key tests estimated from design equations in ACI440.2R are compared with strengths obtained from test measurements in Table 4-10. The corresponding force-deformation responses are compared in Figure 4-77.
Test 24-3-1r was strengthened after cracking of specimen 24-3-1, the initial response from 24-3-1r is not appropriate for comparison due to residual deformations from the previous loading. Test 24-3-9 was conducted without anchors, the response before debonding can be considered to represent the response of a strengthened beam with the same layout as 24-3-1r.

179
Thus, to get an estimate of the full response of a specimen strengthened with the same CFRP layout as 24-3-1r, a hybrid combination of the two responses is used for reference as shown in Figure 4-76; the hybrid response will be referred to as 24-3-ref.
Table 4-10 Comparison of design estimate and test capacity between control and strengthened tests
V (k) from DESIGN EQ. F (k) from TEST RATIO
control
test (a)
Strength-ened (b)
Increase due to CFRP (c)
control test (d)
Strength- ened (e)
Increase due to CFRP (f)
control test
(d)/ (a)
Strength-ened
(e)/ (b)
Effect of CFRP (f)/(c)
24
a/d=1.5 110.1 136.6 26.5 233 264 31 (13%) 2.1 1.9 1.2
a/d=2.1 69.5 96 26.5 129 170 41 (32%) 1.9 1.8 1.6
a/d=3.0 69.5 96 26.5 105 152 46 (44%) 1.5 1.6 1.7
48
#3@18” 120.7 180.6 59.9 147* 226 79* (54%) 1.2* 1.3 1.3*
#3@10” 146 205.9 59.9 228*
242* 14* (6%) 1.6*
1.2* 0.2*
#3@10”(R) 327 99* (43%) 1.6 1.7*
Note: Estimates from design equation were based on the measured material properties. To conduct two tests out of one beam, tests were stopped before failure
Figure 4-76 Envelope response of 24-3-ref
0
25
50
75
100
125
150
175
0 0.004 0.008 0.012 0.016 0.02
Appl
ied
Shea
r (ki
ps)
Shear Strain (in./in.)
24-3-1r
24-3-ref.
24-3-9 Combined at 90k

180
(a) a/d=1.5 (24 in. beam) (b) a/d=2.1(24 in. beam)
(c) a/d=3(24 in. beam) (d) #3@18” (48 in. beam)
(e) #3@10” (48 in. beam) (f) #3@10” (epoxy injection)
Figure 4-77 Comparison of response between control test and strengthened tests
0
50
100
150
200
250
300
0 0.004 0.008 0.012 0.016 0.02
Appl
ied
Shea
r (ki
ps)
Shear Strain (in./in.)
24-1.5-4
24-1.5-3
0
25
50
75
100
125
150
175
0 0.004 0.008 0.012 0.016 0.02
Appl
ied
Shea
r (ki
ps)
Shear Strain (in./in.)
24-2.1-1
24-2.1-2
0
25
50
75
100
125
150
175
0 0.004 0.008 0.012 0.016 0.02
Appl
ied
Shea
r (ki
ps)
Shear Strain (in./in.)
24-3-ref
24-3-2
0
50
100
150
200
250
300
0 0.002 0.004 0.006 0.008 0.01
Appl
ied
Shea
r (ki
ps)
Shear Strain (in./in.)
48-3-2
48-3-1
0
50
100
150
200
250
300
0 0.002 0.004 0.006 0.008 0.01
Appl
ied
Shea
r (ki
ps)
Shear Strain (in./in.)
48-3-5
48-3-6
0
50
100
150
200
250
300
350
0 0.002 0.004 0.006 0.008 0.01
Appl
ied
Shea
r (ki
ps)
Shear Strain (in./in.)
48-3-6r
48-3-5
48-3-6
Control
strengthening
Control
strengthening
Control
strengthening
Control
strengthening
Control
Strengthening
Control
Strengthening

181
Overall, the shear contributions of CFRP estimated from tests were greater than those calculated using design equations, except for 48-in. beams with a 10-in spacing of stirrups (tests 48-3-5 and 6). Tests 48-3-5 and 48-3-6 were stopped before reaching maximum capacity, which may explain that discrepancy. Although 48-3-6r was tested with the same FRP layout as 48-3-5, the capacity of 48-3-6r was 327 k, which is much greater than the capacity of 48-3-5. 48-3-6r was tested after epoxy injection with residual stresses present; which likely caused the large strength difference. The unstrengthened and strengthened capacities of specimens having 10-in. stirrup spacing could not therefore be evaluated directly.
For the 24 in. beams, the measured increase in load relative to the control test was greater than the estimated CFRP shear contribution from strain data (Table 4-11). Strain gauge location can partially explain that observation as strain gauges may not have been at the points of maximum strain. Another explanation lays in the reduction of concrete tensile strains and cracking that CFRP strengthening causes. Such reductions tend to increase the concrete shear capacity and thus result in the observed higher beam shear capacity than estimated through CFRP contribution.
Table 4-11 Comparison of CFRP shear contribution from measured strain gauge and compared with difference in strength relative to control test
CFRP shear contribution (k)
(Test) Compared with control test
From strain gauge
24
a/d=1.5 31 21 24-1.5-4
a/d=2.1 41 35 24-2.1-1
a/d=3 46 33 24-3-1r
48
#3@18” 79* 79 48-3-2
#3@10” 14* 55 48-3-5
#3@10”(R) 99* 50 48-3-6r *48 in. beam tests were stopped before failure.
Shear Span to Depth Ratio
To evaluate the effect of shear span to depth ratio (a/d ratio) for shear strengthening, three different a/d ratios (1.5, 2.1, and 3.0) were used in 24-in. beams. In Figure 4-78, the difference between strengthened and control beams with three different a/d ratios is shown. All tests compared in the figure have the same CFRP layout (5 in. strips at 10 in. spacing on center). Test 24-1.5-3 (control) had much greater shear capacity and lower shear deformations mainly because of the compression-strut shear mechanism and partly because the stirrup spacing was changed from 10 in. to 4 in. to satisfy deep beam code provisions (ACI 318-08).

182
Figure 4-78 Comparison of response between control test and strengthened test according to
shear span to depth ratio
Even though the same CFRP layouts were used, the CFRP shear contribution was smaller for shorter beams. In comparing 24-3-2 with 24-3-ref. and 24-2.1-2 with 24-2.1-1, the strengthened beams exhibited higher strength and failed at lower deformations. However, when comparing 24-1.5-3 with 24-1.5-4, there was little difference in stiffness and both beams failed at lower shear deformation capacity than the beams with higher a/d ratios. Strengthening efficiency of beams with a/d ratio of 1.5 was less than for longer beams and the small increase in strength was due to an increase in shear deformation at failure. It can be concluded here that shear strengthening efficiency of CFRP depends on the shape of the strengthened beams.
Figure 4-79 shows the shear strain versus shear force for all tests with shear span to depth ratio of 1.5. Regardless of the amount of CFRP used in strengthening, all responses are quite similar. The difference between them was that the capacity of strengthened beams was greater than that of the control beam because ultimate shear strain was increased even though shear stiffness remained unchanged. Since the shear transfer mechanism is primarily through direct compression struts, CFRP may have contributed to shear strength primarily through confinement and crack control in the struts. Further experimental studies are needed to investigate the mechanisms by which CFRP strengthens short beams in shear.
0
50
100
150
200
250
300
0 0.004 0.008 0.012 0.016 0.02
Appl
ied
Shea
r (ki
ps)
Shear Strain (in./in.)
24-1.5-424-1.5-324-2.1-124-2.1-224-3-ref24-3-2
31.1k
41.0k
46.3k
a/d=1.5
a/d=2.1
a/d=3.0 24-2.1-1
24-2.1-2
24-3-2
24-3-ref
24-1.5-3
24-1.5-4
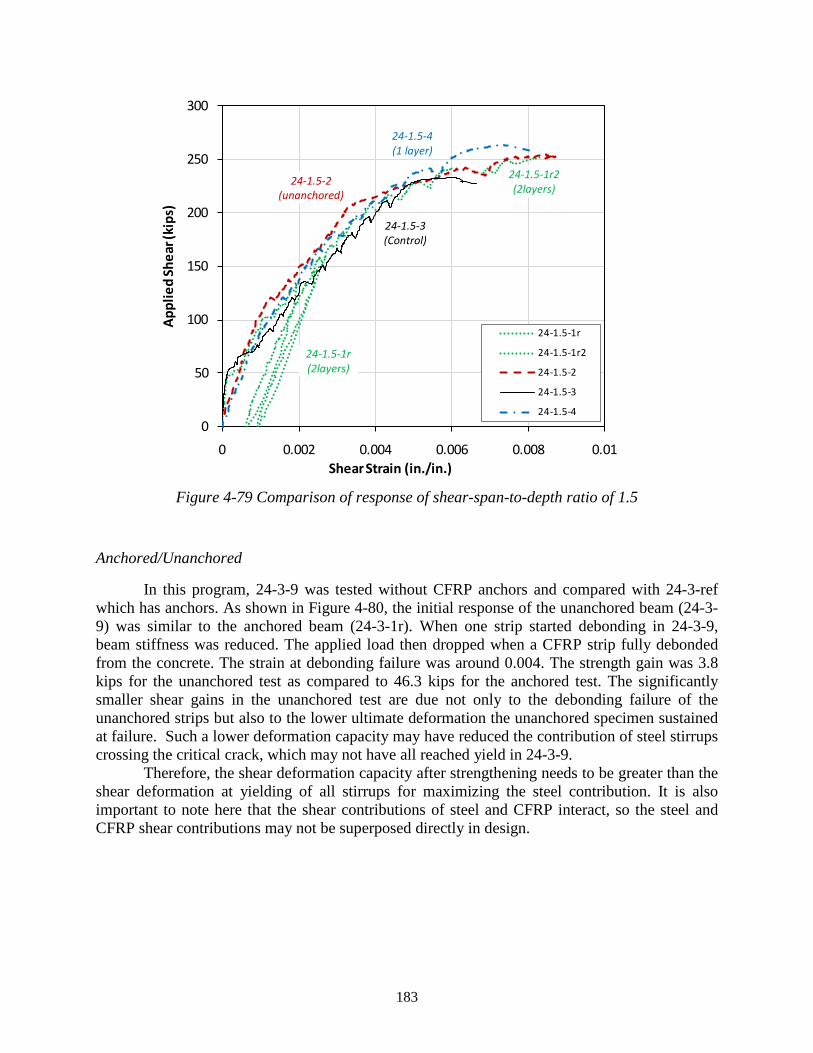
183
Figure 4-79 Comparison of response of shear-span-to-depth ratio of 1.5
Anchored/Unanchored
In this program, 24-3-9 was tested without CFRP anchors and compared with 24-3-ref which has anchors. As shown in Figure 4-80, the initial response of the unanchored beam (24-3-9) was similar to the anchored beam (24-3-1r). When one strip started debonding in 24-3-9, beam stiffness was reduced. The applied load then dropped when a CFRP strip fully debonded from the concrete. The strain at debonding failure was around 0.004. The strength gain was 3.8 kips for the unanchored test as compared to 46.3 kips for the anchored test. The significantly smaller shear gains in the unanchored test are due not only to the debonding failure of the unanchored strips but also to the lower ultimate deformation the unanchored specimen sustained at failure. Such a lower deformation capacity may have reduced the contribution of steel stirrups crossing the critical crack, which may not have all reached yield in 24-3-9.
Therefore, the shear deformation capacity after strengthening needs to be greater than the shear deformation at yielding of all stirrups for maximizing the steel contribution. It is also important to note here that the shear contributions of steel and CFRP interact, so the steel and CFRP shear contributions may not be superposed directly in design.
0
50
100
150
200
250
300
0 0.002 0.004 0.006 0.008 0.01
Appl
ied
Shea
r (ki
ps)
Shear Strain (in./in.)
24-1.5-1r
24-1.5-1r2
24-1.5-2
24-1.5-3
24-1.5-4
24-1.5-3 (Control)
24-1.5-2 (unanchored)
24-1.5-4 (1 layer)
24-1.5-1r (2layers)
24-1.5-1r2 (2layers)

184
Figure 4-80 Comparison between with and without CFRP anchors
Amount of CFRP Material
Two layers of CFRP were applied in tests 24-3-8 and 48-3-8. Unfortunately, these tests failed by fracture of CFRP anchors. It is still possible, however, to compare their stiffness with other tests before failure. Test 48-3-3 had a 14-in. wide CFRP strip instead of a 10-in. wide strip. A continuous sheet was used in Test 24-3-7, which had double the amount of CFRP material and twice the number of CFRP anchors as specimens with 5 in. strips. This test failed by rupture of CFRP strips.
Comparisons between the responses of specimens with different amounts of CFRP material and with similar beam configurations are shown in Figure 4-81. Responses of specimens with different transverse steel ratios are shown in Figure 4-81 (a) and (b). Direct comparison between these tests was not possible because tests highlighted in the legend were stopped before failure. As shown in Figure 4-81 (c) and (d), the CFRP shear contribution was not proportional to the amount of material used because the shear strains at maximum capacity decreased as the amount of material increased. The difference between the 2-layer application and the continuous sheet application was in the number of anchors (both had the same area of CFRP). The continuous sheet application had twice as many half-area anchors as the 2-layer application. To develop the rupture of CFRP strips in multiple-layers, it is clear that the CFRP anchor details must be modified. Moreover, the continuous sheet with more CFRP anchors had more redundancy and greater bond area between the concrete and CFRP strip.
0
25
50
75
100
125
150
175
0 0.004 0.008 0.012 0.016 0.02
Appl
ied
Shea
r (ki
ps)
Shear Strain (in./in.)
24-3-ref
24-3-9
24-3-2
3.8k 46.3k
Reduction in deforomation
Capacity loss due to the interaction
between steel and CFRP
Anchored
Control
Unanchored

185
(a) 18” stirrup spacing in 48 in. beam (b) 10” stirrup spacing in 48 in. beam
(c) Compared w/ 2 layers (24 in. beam) (d) Compared w/ continuous sheet
Figure 4-81 Comparison of the amount of CFRP material
Different Transverse Steel Ratio
Many previous studies indicated that the transverse steel ratio influences CFRP shear contribution. As shown in Figure 4-82, the CFRP shear contribution of the beam with lower transverse steel ratio was greater although the same amount of CFRP material was used. Basically, CFRP strips have the same function as steel stirrups in a truss mechanism in which the shear forces will distribute according to the stiffness ratio of steel and CFRP. As a result, the shear force share of CFRP would be greater in a beam with low transverse steel. Furthermore, as the transverse reinforcement ratio increases, the critical crack angle tends to become steeper and fewer CFRP strips and steel stirrups contribute to the shear resistance.
0
50
100
150
200
250
300
0 0.002 0.004 0.006 0.008 0.01
Appl
ied
Shea
r (ki
ps)
Shear Strain (in./in.)
48-3-348-3-248-3-1
0
50
100
150
200
250
300
0 0.002 0.004 0.006 0.008 0.01
Appl
ied
Shea
r (ki
ps)
Shear Strain (in./in.)
48-3-848-3-548-3-6
0
25
50
75
100
125
150
175
0 0.004 0.008 0.012 0.016 0.02
Appl
ied
Shea
r (ki
ps)
Shear Strain (in./in.)
24-3-824-3-ref24-3-2
0
25
50
75
100
125
150
175
0 0.004 0.008 0.012 0.016 0.02
Appl
ied
Shea
r (ki
ps)
Shear Strain (in./in.)
24-3-724-3-ref24-3-2
10-in. width
14-in. width
Test was stopped Before failure
#3@18”
Test was stopped Before failure
1 layer (10-in.)
2 layers #3@10”
1layer
2 layers
1layer
continuous
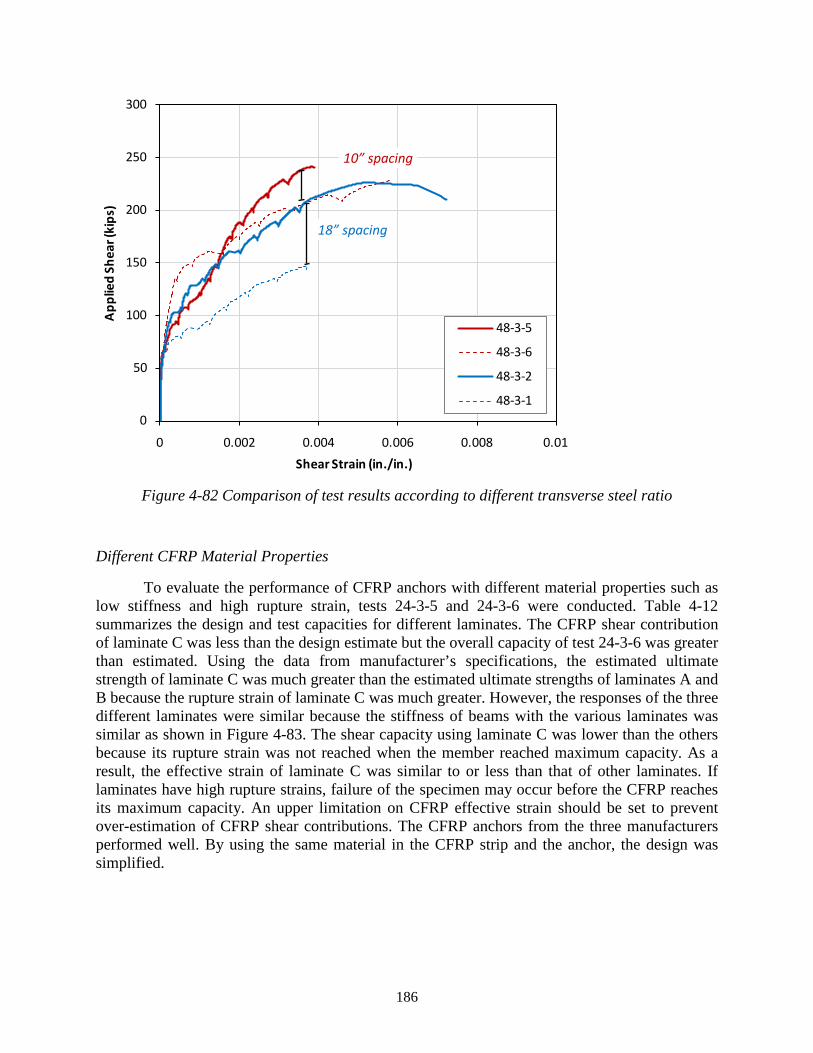
186
Figure 4-82 Comparison of test results according to different transverse steel ratio
Different CFRP Material Properties
To evaluate the performance of CFRP anchors with different material properties such as low stiffness and high rupture strain, tests 24-3-5 and 24-3-6 were conducted. Table 4-12 summarizes the design and test capacities for different laminates. The CFRP shear contribution of laminate C was less than the design estimate but the overall capacity of test 24-3-6 was greater than estimated. Using the data from manufacturer’s specifications, the estimated ultimate strength of laminate C was much greater than the estimated ultimate strengths of laminates A and B because the rupture strain of laminate C was much greater. However, the responses of the three different laminates were similar because the stiffness of beams with the various laminates was similar as shown in Figure 4-83. The shear capacity using laminate C was lower than the others because its rupture strain was not reached when the member reached maximum capacity. As a result, the effective strain of laminate C was similar to or less than that of other laminates. If laminates have high rupture strains, failure of the specimen may occur before the CFRP reaches its maximum capacity. An upper limitation on CFRP effective strain should be set to prevent over-estimation of CFRP shear contributions. The CFRP anchors from the three manufacturers performed well. By using the same material in the CFRP strip and the anchor, the design was simplified.
0
50
100
150
200
250
300
0 0.002 0.004 0.006 0.008 0.01
App
lied
Shea
r (ki
ps)
Shear Strain (in./in.)
48-3-5
48-3-6
48-3-2
48-3-1
10” spacing
18” spacing

187
Table 4-12 Comparison between estimate and test of different laminates
EQUATION TEST RATIO TEST/EQUATION
control test
strengthening CFRP control
test strengthening CFRP control
test strengthening CFRP
24-3-1r (A) 63.4
89.9 26.5 105.3
151.6 46.3 1.66
1.69 1.75 24-3-5 (B) 88.8 25.4 145.1 39.8 1.63 1.57 24-3-6 (C) 118.9 55.5 133.8 28.5 1.13 0.51
Figure 4-83 Comparison of test results of different laminates
Surface Condition
As shown in Figure 4-84, the maximum capacity of 24-3-4(no bond) was very similar to that of 24-3-ref. It implied that bond was not essential for strength. At early stages of loading, the shear stiffness was determined by the concrete and bond had little influence on member stiffness. However, before debonding occurred, the member with the bonded CFRP was stiffer than the member with the unbonded CFRP. In a bonded strip, high strains were concentrated near the diagonal crack, whereas in an unbonded strip, strains were distributed over a longer distance.
0
25
50
75
100
125
150
175
0 0.004 0.008 0.012 0.016 0.02
Appl
ied
Shea
r (ki
ps)
Shear Strain (in./in.)
24-3-ref24-3-524-3-624-3-2
Laminate B
Control
Laminate C
Laminate A
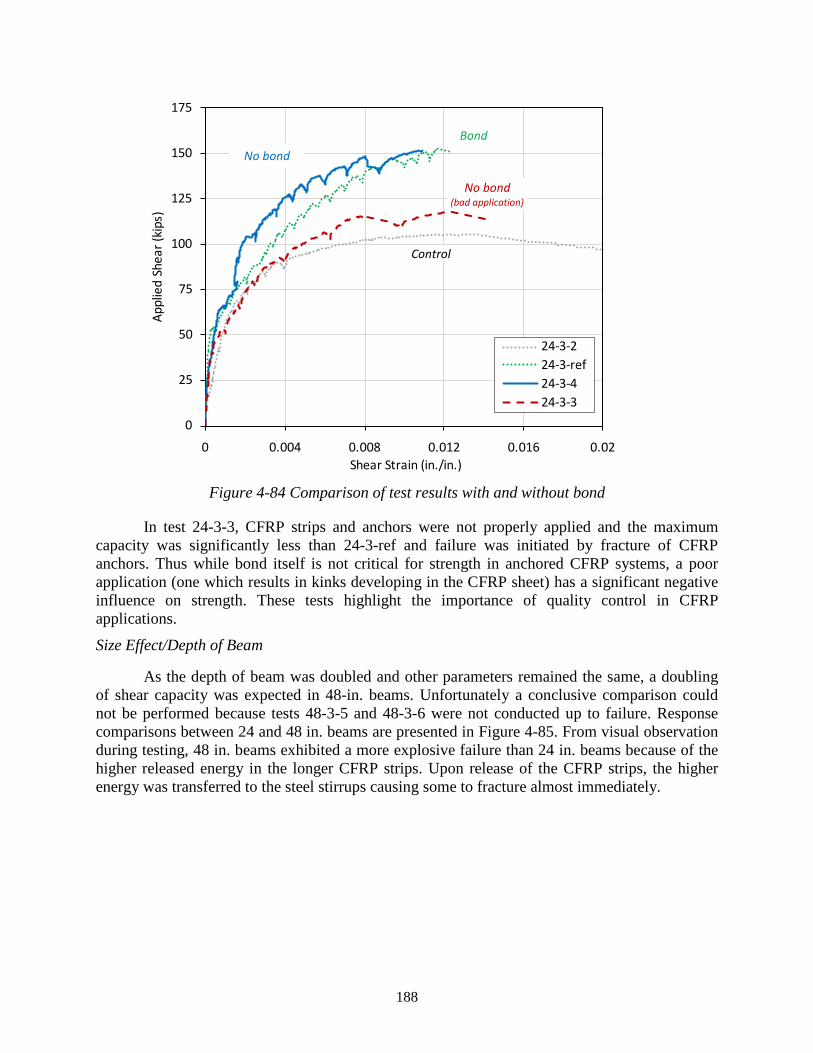
188
Figure 4-84 Comparison of test results with and without bond
In test 24-3-3, CFRP strips and anchors were not properly applied and the maximum capacity was significantly less than 24-3-ref and failure was initiated by fracture of CFRP anchors. Thus while bond itself is not critical for strength in anchored CFRP systems, a poor application (one which results in kinks developing in the CFRP sheet) has a significant negative influence on strength. These tests highlight the importance of quality control in CFRP applications.
Size Effect/Depth of Beam
As the depth of beam was doubled and other parameters remained the same, a doubling of shear capacity was expected in 48-in. beams. Unfortunately a conclusive comparison could not be performed because tests 48-3-5 and 48-3-6 were not conducted up to failure. Response comparisons between 24 and 48 in. beams are presented in Figure 4-85. From visual observation during testing, 48 in. beams exhibited a more explosive failure than 24 in. beams because of the higher released energy in the longer CFRP strips. Upon release of the CFRP strips, the higher energy was transferred to the steel stirrups causing some to fracture almost immediately.
0
25
50
75
100
125
150
175
0 0.004 0.008 0.012 0.016 0.02
Appl
ied
Shea
r (ki
ps)
Shear Strain (in./in.)
24-3-224-3-ref24-3-424-3-3
No bond (bad application)
Control
No bond Bond
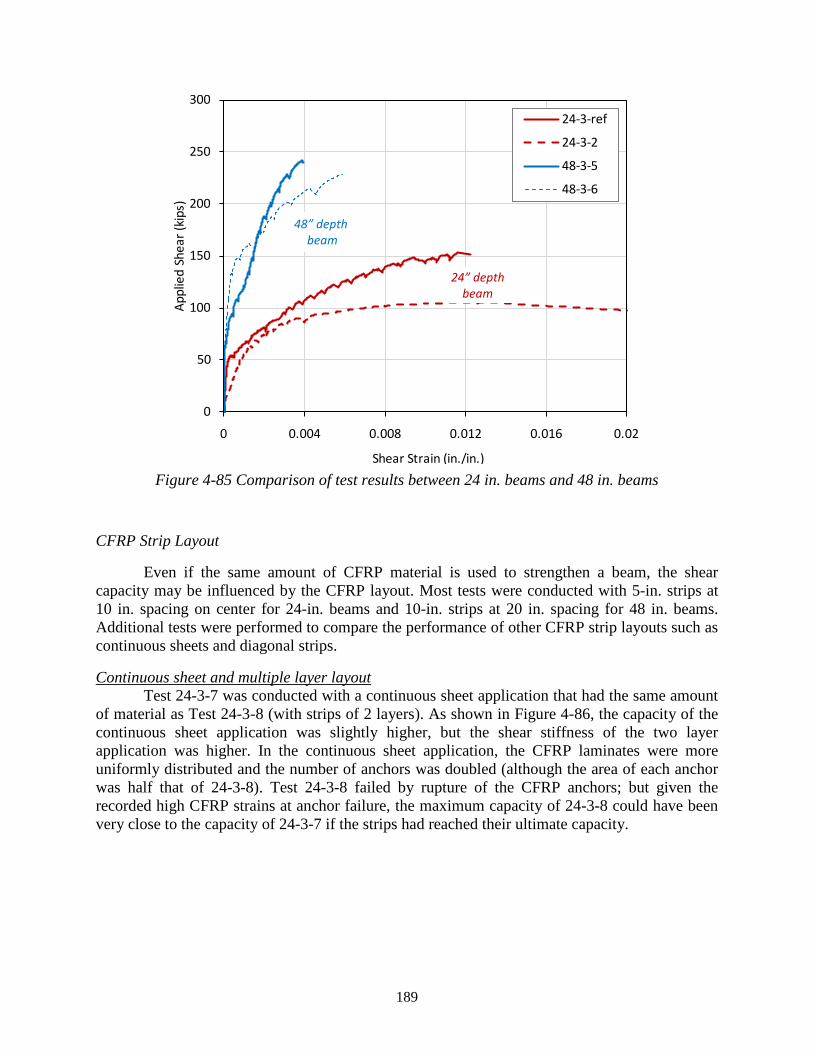
189
Figure 4-85 Comparison of test results between 24 in. beams and 48 in. beams
CFRP Strip Layout
Even if the same amount of CFRP material is used to strengthen a beam, the shear capacity may be influenced by the CFRP layout. Most tests were conducted with 5-in. strips at 10 in. spacing on center for 24-in. beams and 10-in. strips at 20 in. spacing for 48 in. beams. Additional tests were performed to compare the performance of other CFRP strip layouts such as continuous sheets and diagonal strips.
Continuous sheet and multiple layer layout Test 24-3-7 was conducted with a continuous sheet application that had the same amount
of material as Test 24-3-8 (with strips of 2 layers). As shown in Figure 4-86, the capacity of the continuous sheet application was slightly higher, but the shear stiffness of the two layer application was higher. In the continuous sheet application, the CFRP laminates were more uniformly distributed and the number of anchors was doubled (although the area of each anchor was half that of 24-3-8). Test 24-3-8 failed by rupture of the CFRP anchors; but given the recorded high CFRP strains at anchor failure, the maximum capacity of 24-3-8 could have been very close to the capacity of 24-3-7 if the strips had reached their ultimate capacity.
0
50
100
150
200
250
300
0 0.004 0.008 0.012 0.016 0.02
Appl
ied
Shea
r (ki
ps)
Shear Strain (in./in.)
24-3-ref
24-3-2
48-3-5
48-3-6
24” depth beam
48” depth beam

190
Figure 4-86 Comparison of test results between continuous sheet and multi-layers strip
Diagonal layout If the critical crack angle is known, the most efficient direction to apply CFRP strips is
perpendicular to the crack. Diagonal application of strips would, therefore, be expected to increase shear capacity. More material, however, is needed in diagonal applications because the lengths of strips increase. Moreover, the field application of diagonal strips is more difficult than that of vertical strips because lapping of the strips must be provided at the soffit of beams.
Based on the shear equation (11-3) in ACI 440.2R, the CFRP shear contribution in this application should increase 41 percent from 60 k to 84 k by changing the direction of CFRP strips from vertical to 45 degrees. It implied that the shear capacity of 48-3-4 was expected to be at least 24 k greater than that of 48-3-2. However, the maximum capacity was only 10 k greater than that of 48-3-2 (Figure 4-87). Furthermore, this capacity was 6 k less than the shear capacity of 48-3-3, which had 14” wide strips and an identical shear strength estimate based on ACI 440.2R. One should note that 48-3-3 was not tested to ultimate capacity and, therefore, the difference in strength with 48-3-4 would have been greater had that not been the case. General conclusions on the use of inclined CFRP cannot be extracted from just one comparison; but, from a practical standpoint, vertical strips are easier to apply and are preferable over inclined strips.
0
25
50
75
100
125
150
175
0 0.004 0.008 0.012 0.016 0.02
Appl
ied
Shea
r (ki
ps)
Shear Strain (in./in.)
24-3-824-3-724-3-ref24-3-2
2-layers continuous
1-layer
control

191
Figure 4-87 Comparison of test results for evaluating the feasibility of diagonal strips
CFRP Anchor Layout
This research focuses on the shear behavior of beams strengthened with CFRP and not on the CFRP anchors themselves. The purpose of the CFRP anchors is simply to develop the full capacity of CFRP strips and, thus, a conservative CFRP anchor design was used. Issues relating the anchor layouts were of more direct concern in this project. In general, a larger number of smaller CFRP anchors performed better; at the expense of increased labor. Inclined anchors that could increase the effective depth of the strips were investigated. Such anchors did not show significantly different performance over anchors drilled perpendicular to concrete surface. The effects of introducing intermediate anchors along the length of CFRP strips were also investigated.
Inclined anchors Although the capacity of the test with inclined anchors (24-3-10) was expected to be
greater than 24-3-1r because the effective depth of the strengthened web was slightly longer, the maximum capacity in test 24-3-10 was 7 k less than that of 24-3-1r (152 k) as shown in Figure 4-88. It was observed that the CFRP anchor that failed in 24-2-10 was located in the middle of a crack as shown in Figure 4-89. The crack may have triggered failure. Based on this one comparison, the difference in response between inclined and non-inclined anchored systems is not significant. Further investigations are needed to validate this conclusion.
0
50
100
150
200
250
300
0 0.002 0.004 0.006 0.008 0.01
Appl
ied
Shea
r (ki
ps)
Shear Strain (in./in.)
48-3-4
48-3-3
48-3-2
48-3-1
10” -diagonlal 14” vertical
10” vertical
control
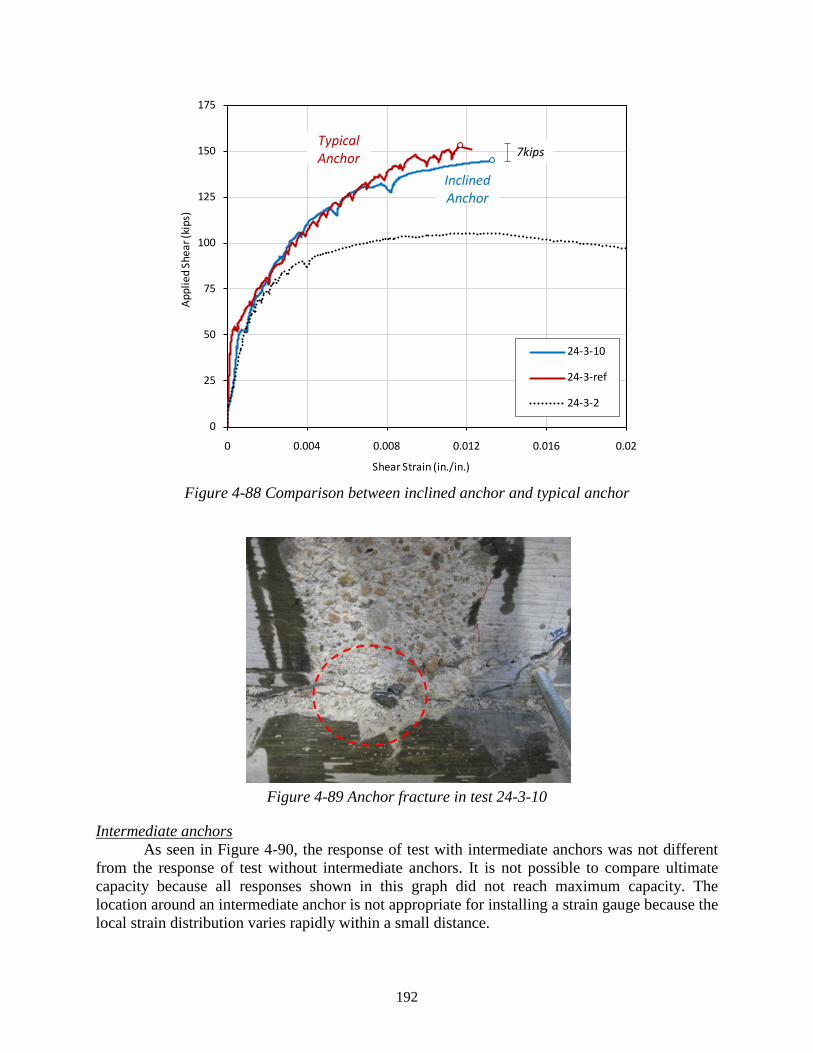
192
Figure 4-88 Comparison between inclined anchor and typical anchor
Figure 4-89 Anchor fracture in test 24-3-10
Intermediate anchors As seen in Figure 4-90, the response of test with intermediate anchors was not different
from the response of test without intermediate anchors. It is not possible to compare ultimate capacity because all responses shown in this graph did not reach maximum capacity. The location around an intermediate anchor is not appropriate for installing a strain gauge because the local strain distribution varies rapidly within a small distance.
0
25
50
75
100
125
150
175
0 0.004 0.008 0.012 0.016 0.02
Appl
ied
Shea
r (ki
ps)
Shear Strain (in./in.)
24-3-10
24-3-ref
24-3-2
7kips Typical Anchor
Inclined Anchor

193
Figure 4-90 Comparison of behavior test with intermediate anchor
To monitor the strain around intermediate anchors, strains were evaluated from camera images as shown in Figure 4-91. From this figure, it was observed that the strain distributions both along the fiber and across the width are not uniform. Furthermore, intermediate anchors are shown in the figure to decrease the debonded length and to increase the stiffness of individual CFRP strips. Overall specimen stiffness was not affected by intermediate anchors, however.
Figure 4-91 Strain distribution in the CFRP from camera image
0
50
100
150
200
250
300
0 0.002 0.004 0.006 0.008 0.01
App
lied
Shea
r (ki
ps)
Shear Strain (in./in.)
48-3-7
48-3-5
48-3-6
Typical Anchor
Intermediate anchor
control
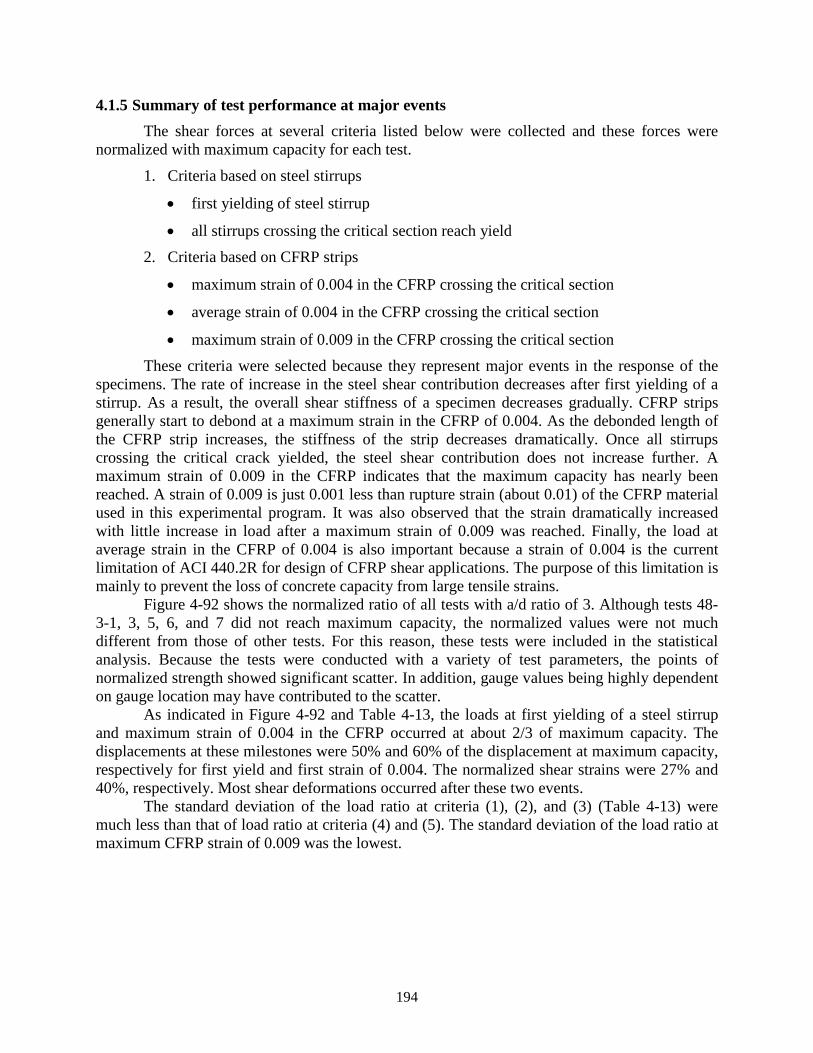
194
4.1.5 Summary of test performance at major events The shear forces at several criteria listed below were collected and these forces were
normalized with maximum capacity for each test.
1. Criteria based on steel stirrups
• first yielding of steel stirrup
• all stirrups crossing the critical section reach yield 2. Criteria based on CFRP strips
• maximum strain of 0.004 in the CFRP crossing the critical section
• average strain of 0.004 in the CFRP crossing the critical section
• maximum strain of 0.009 in the CFRP crossing the critical section These criteria were selected because they represent major events in the response of the
specimens. The rate of increase in the steel shear contribution decreases after first yielding of a stirrup. As a result, the overall shear stiffness of a specimen decreases gradually. CFRP strips generally start to debond at a maximum strain in the CFRP of 0.004. As the debonded length of the CFRP strip increases, the stiffness of the strip decreases dramatically. Once all stirrups crossing the critical crack yielded, the steel shear contribution does not increase further. A maximum strain of 0.009 in the CFRP indicates that the maximum capacity has nearly been reached. A strain of 0.009 is just 0.001 less than rupture strain (about 0.01) of the CFRP material used in this experimental program. It was also observed that the strain dramatically increased with little increase in load after a maximum strain of 0.009 was reached. Finally, the load at average strain in the CFRP of 0.004 is also important because a strain of 0.004 is the current limitation of ACI 440.2R for design of CFRP shear applications. The purpose of this limitation is mainly to prevent the loss of concrete capacity from large tensile strains.
Figure 4-92 shows the normalized ratio of all tests with a/d ratio of 3. Although tests 48-3-1, 3, 5, 6, and 7 did not reach maximum capacity, the normalized values were not much different from those of other tests. For this reason, these tests were included in the statistical analysis. Because the tests were conducted with a variety of test parameters, the points of normalized strength showed significant scatter. In addition, gauge values being highly dependent on gauge location may have contributed to the scatter.
As indicated in Figure 4-92 and Table 4-13, the loads at first yielding of a steel stirrup and maximum strain of 0.004 in the CFRP occurred at about 2/3 of maximum capacity. The displacements at these milestones were 50% and 60% of the displacement at maximum capacity, respectively for first yield and first strain of 0.004. The normalized shear strains were 27% and 40%, respectively. Most shear deformations occurred after these two events.
The standard deviation of the load ratio at criteria (1), (2), and (3) (Table 4-13) were much less than that of load ratio at criteria (4) and (5). The standard deviation of the load ratio at maximum CFRP strain of 0.009 was the lowest.

195
Figure 4-92 Normalized load ratio about maximum load of various loading levels
Table 4-13 Summary of load ratio at major events
(1)
Yielding of all stirrups
(2)
𝜀𝑓,𝑚𝑎𝑥 = 0.009
(3)
𝜀𝑓,𝑎𝑣𝑔 = 0.004
(4) First yielding of
a stirrup
(5)
𝜀𝑓,𝑚𝑎𝑥 = 0.004
MEAN 0.87 0.98 0.92 0.66 0.71
STD. 0.081 0.024 0.065 0.083 0.109
COV. 9% 2% 7% 13% 15%
In the beginning of this research project, a rupture strain was considered to be an
effective strain for design if CFRP rupture can be achieved through the use of CFRP anchors. However, all CFRP strips crossing the critical crack did not rupture simultaneously. Because CFRP shear contribution must be the summation of all CFRP strip contributions, the effective strain for design equation should be taken as the average strain of all strips crossing the critical crack.
As shown in Figure 4-93, the average strain was monitored when the maximum CFRP strain reached 0.009. The mean of average strain in the CFRP was 0.0051 and this value was greater than 0.004, which is the strain limitation in ACI 440.2R. The coefficient of variation (COV = 17%) of average strain values when the maximum strain is 0.009 showed that average strains showed significant scatter. A conservative value for this average strain is therefore recommended for design; from Figure 4-93 a value of 0.004 seems appropriate.
0.3
0.4
0.5
0.6
0.7
0.8
0.9
1
48-3
-1
48-3
-2
48-3
-3
48-3
-4
48-3
-5
48-3
-6
48-3
-6r
48-3
-7
48-3
-8
24-3
-1R
24-3
-2
24-3
-3
24-3
-4
24-3
-5
24-3
-6
24-3
-7
24-3
-8
24-3
-9
24-3
-10
Nor
mal
ized
stre
ngth
(Fi/
Fu)
TEST NAME
yielding of all steel stirrupmax. strain of CFRP =0.009 average strain of CFRP =0.004max strain of CFRP =0.004first yield of a steel stirrup
(1) (2) (3) (4) (5)
(1)
(2)
(3)
(4) (5)
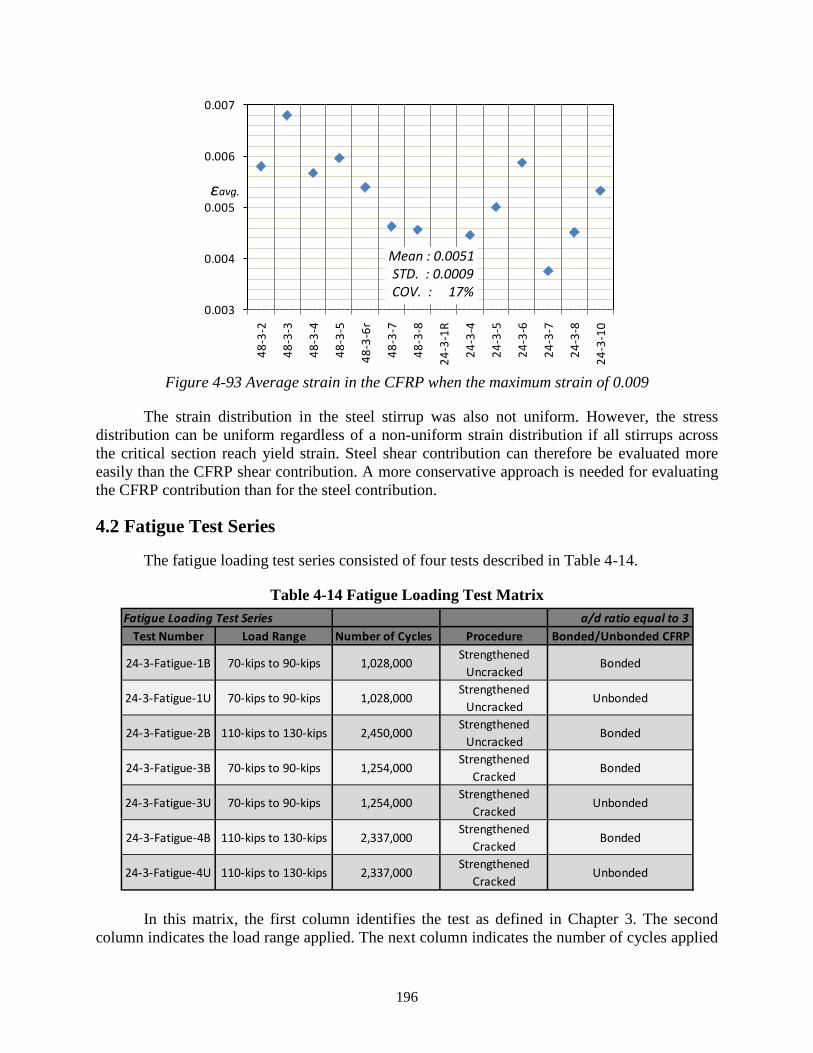
196
Figure 4-93 Average strain in the CFRP when the maximum strain of 0.009
The strain distribution in the steel stirrup was also not uniform. However, the stress distribution can be uniform regardless of a non-uniform strain distribution if all stirrups across the critical section reach yield strain. Steel shear contribution can therefore be evaluated more easily than the CFRP shear contribution. A more conservative approach is needed for evaluating the CFRP contribution than for the steel contribution.
4.2 Fatigue Test Series
The fatigue loading test series consisted of four tests described in Table 4-14.
Table 4-14 Fatigue Loading Test Matrix
In this matrix, the first column identifies the test as defined in Chapter 3. The second
column indicates the load range applied. The next column indicates the number of cycles applied
0.003
0.004
0.005
0.006
0.007
48-3
-2
48-3
-3
48-3
-4
48-3
-5
48-3
-6r
48-3
-7
48-3
-8
24-3
-1R
24-3
-4
24-3
-5
24-3
-6
24-3
-7
24-3
-8
24-3
-10
Fatigue Loading Test Series a/d ratio equal to 3Test Number Load Range Number of Cycles Procedure Bonded/Unbonded CFRP
24-3-Fatigue-1B 70-kips to 90-kips 1,028,000Strengthened
UncrackedBonded
24-3-Fatigue-1U 70-kips to 90-kips 1,028,000Strengthened
UncrackedUnbonded
24-3-Fatigue-2B 110-kips to 130-kips 2,450,000Strengthened
UncrackedBonded
24-3-Fatigue-3B 70-kips to 90-kips 1,254,000Strengthened
CrackedBonded
24-3-Fatigue-3U 70-kips to 90-kips 1,254,000Strengthened
CrackedUnbonded
24-3-Fatigue-4B 110-kips to 130-kips 2,337,000Strengthened
CrackedBonded
24-3-Fatigue-4U 110-kips to 130-kips 2,337,000Strengthened
CrackedUnbonded
Mean : 0.0051 STD. : 0.0009 COV. : 17%
εavg.

197
to the test specimen at the load range noted in the previous column. The CFRP layout used in all instances consisted of 5-in. CFRP strips spaced at 10-in. on-center. Each CFRP strip was anchored to the top of the concrete web using one CFRP anchor on each side of the test specimen. As a result, each CFRP strip was anchored using two CFRP anchors. The next column specifies whether the test specimen was strengthened with CFRP laminates prior to or after initial cracking of the specimen. The final column specifies whether the CFRP laminates used were bonded to the surface of the concrete or unbonded.
4.2.1 24-3-Fatigue-1 & 2 (uncracked specimen)
The test specimen was strengthened before cracking using CFRP laminates. One end of the test specimen was strengthened using bonded CFRP laminates and the other end was strengthened using unbonded CFRP laminates. The test specimen was then loaded until a crack width of 0.013-in. developed on each end of the test specimen. As a result of the increased stiffness due to the presence of bonded CFRP, an initial load of 125-kips was needed to produce the desired crack width on each end of the specimen. The test specimen was then unloaded prior to the application of the cycled load.
Two different series of cyclic loads were applied. For the first series 24-3-Fatigue-1, beams were cycled between a load of 70-kips and 90-kips for approximately 1 million cycles. For the second series, 24-3-Fatigue-2, the cycled load range was increased to 110-kips and 130-kips and cycled for an additional 2.5 million cycles. Photos of the test specimen after completion of the cycled load series can be seen in Figure 4-94. Concrete cracks observed during testing are outlined in red.
Figure 4-94 24-3-Fatigue-1&2 unbonded (left) and bonded (right) CFRP test specimen
The load-displacement response was recorded for the initial cracking of the test specimen as well as for both series of cycled load tests. The data for the unloading curve of the load displacement response was not recorded for tests 24-3-Fatigue-1 and 2. The load-displacement response of these tests is shown in Figure 4-95 and a linear unloading curve was assumed for tests 24-3-Fatigue-1 and 2. For the purpose of the load-displacement plot, the peak load and displacement values were used to plot the portion of the load-displacement curve during the cycled loading portion of the test. This resulted in a plateau forming at the peak of the load-displacement plot for tests 24-3-Fatigue-1 and 2.

198
Figure 4-95 Load displacement response, test 24-3-Fatigue-1&2
Test 24-3-Fatigue-1U (uncracked specimen, unbonded CFRP)
For the end strengthened using unbonded CFRP, large cracks were observed during the course of testing. One large shear crack developed in the shear span after the initial loading of the test specimen and continued to widen throughout the course of the cycled loading. Crack widths increased from 0.025-in. at the start of cyclic loading to 0.037-in. after the completion of 1,028,000 cycles. Steel strains were relatively high throughout the course of testing and remained near yielding for the duration of loading.
CFRP strains remained very low throughout testing. In cases where bond between the CFRP and the surface of the concrete was removed, large deformations were observed in the concrete without large increases in the CFRP strain. The lack of bond allowed for large strains to develop in the steel stirrups with minimal strain in the CFRP.
After the completion of test 24-3-Fatigue-1, clamps were placed on the unbonded end of the test specimen prior to the increasing of the cycled load to prevent a premature failure of the specimen on the unbonded end due to increasingly high strains in the internal stirrups.
Test 24-3-Fatigue-1B & 2B (uncracked specimen, bonded CFRP)
For the end strengthened using bonded CFRP, relatively small cracks were observed during the course of testing. Several small shear cracks developed throughout the shear span as opposed to the one large shear crack that developed on the unbonded end of the test specimen. Crack widths increased from 0.007-in. at the start of cyclic loading to 0.011-in. after the completion of 1,028,000 cycles at the lower load level. Once fatigue testing resumed following
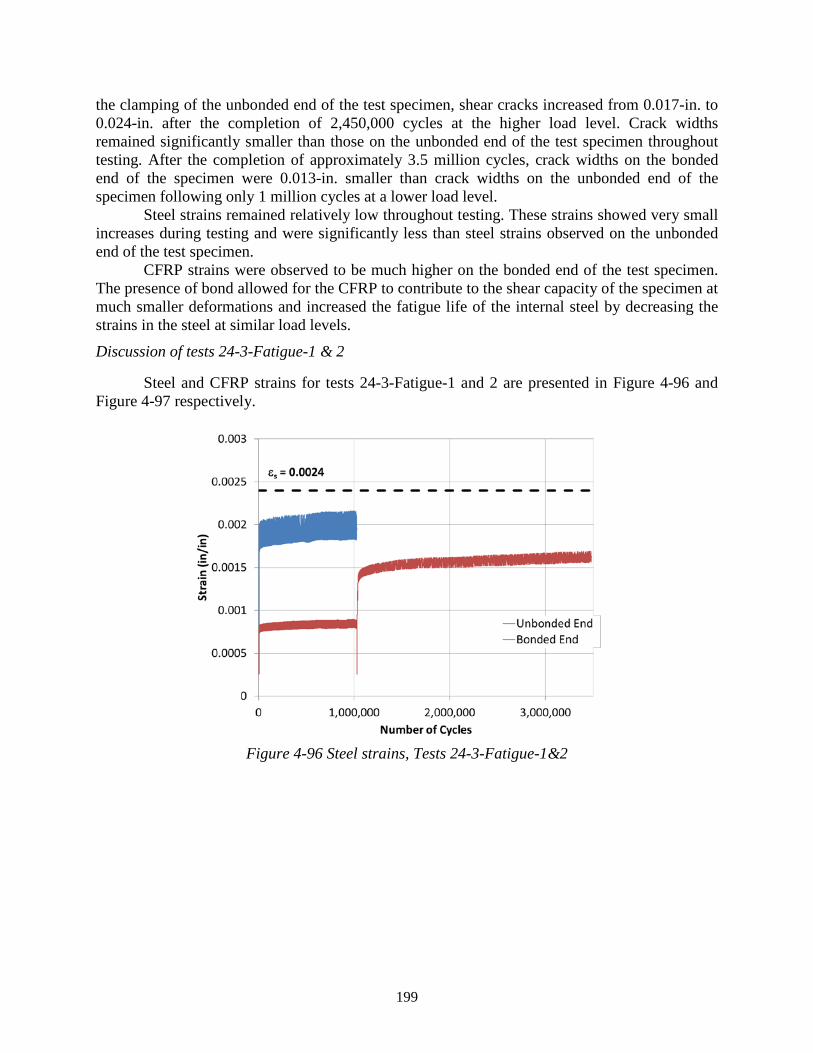
199
the clamping of the unbonded end of the test specimen, shear cracks increased from 0.017-in. to 0.024-in. after the completion of 2,450,000 cycles at the higher load level. Crack widths remained significantly smaller than those on the unbonded end of the test specimen throughout testing. After the completion of approximately 3.5 million cycles, crack widths on the bonded end of the specimen were 0.013-in. smaller than crack widths on the unbonded end of the specimen following only 1 million cycles at a lower load level.
Steel strains remained relatively low throughout testing. These strains showed very small increases during testing and were significantly less than steel strains observed on the unbonded end of the test specimen.
CFRP strains were observed to be much higher on the bonded end of the test specimen. The presence of bond allowed for the CFRP to contribute to the shear capacity of the specimen at much smaller deformations and increased the fatigue life of the internal steel by decreasing the strains in the steel at similar load levels.
Discussion of tests 24-3-Fatigue-1 & 2
Steel and CFRP strains for tests 24-3-Fatigue-1 and 2 are presented in Figure 4-96 and Figure 4-97 respectively.
Figure 4-96 Steel strains, Tests 24-3-Fatigue-1&2

200
Figure 4-97 CFRP strains, Tests 24-3-Fatigue-1&2
The presence of bond between the concrete surface and CFRP laminates greatly reduced the recorded steel strains in test 24-3-Fatigue-1B compared with test 24-3-1U. The highest strains observed in the internal transverse reinforcement in test 24-3-Fatigue-2B after 3.5-million cycles were lower than the strains observed in the internal steel for test 24-3-Fatigue-1U after only 1-million cycles at a lower load range. These lower strain values indicate an increase in fatigue life in specimens strengthened using bonded CFRP laminates. This agrees with work done by Aidoo, Harries, and Zorn (2004) where they found that specimens strengthened using bonded CFRP laminates demonstrated an increased fatigue life due to the bonded laminates relieving stress demand on the steel. It is noteworthy here that the location of steel strain gauges with respect to the critical shear cracks affects the recorded strains significantly. Steel strain gauges were located very close to the critical shear crack for both bonded and unbonded tests.
The CFRP strains in the testing end strengthened with bonded CFRP laminates were considerably higher than the strains present in the CFRP on the end strengthened using unbonded CFRP. The presence of bond allowed for localized strains to form in regions near cracks, resulting in higher strain readings. This same effect was not present in the end strengthened using unbonded laminates. For the unbonded laminates, strains resulted from elongation of the CFRP strip over the entire length of the CFRP sheet. Therefore, larger steel strains and crack widths developed without larger corresponding strains in the CFRP. CFRP strains on both ends of the test specimen increased gradually throughout testing, but no deteriorations in strength were observed.
4.2.2 24-3-Fatigue-3 & 4 (cracked specimen)
The second fatigue test specimen was strengthened using CFRP laminates following the cracking of the reinforced concrete beam. The unstrengthened specimen was initially loaded until a crack width of 0.013-in. developed on each end of the test specimen. Since neither end was strengthened prior to the initial cracking of the test specimen, the desired crack widths were produced using a much lower applied load than the cracking load in tests 24-3-Fatigue-1 and 2.

201
The test specimen was then unloaded and CFRP laminates were applied to the test specimen prior to the application of the cycled load. One end of the test specimen was strengthened using bonded CFRP laminates and the alternate end of the specimen was strengthened using unbonded CFRP laminates.
Similar to the previous beam tested, each specimen was subjected to two different series of cyclic loads. The first series, 24-3-Fatigue-3, was cycled between a load of 70-kips and 90-kips for approximately 1 million cycles. For the second series, 24-3-Fatigue-4, the cycled load range was increased to a load between 110-kips and 130-kips and cycled for approximately 2.5 million more cycles. Photos of the test specimen after completion of the cycled load series can be seen in Figure 4-98. Concrete cracks observed during testing are outlined in red.
Figure 4-98 24-3-Fatigue-3&4 unbonded (left) and bonded (right) CFRP test specimen
Once again, the load-displacement response was recorded for the initial cracking of the test specimen as well as for both series of cycled load tests. The data for the unloading curve of the load displacement response was not recorded for tests 24-3-Fatigue-3 and 4. The load-displacement response of these tests is shown in Figure 4-99 and a linear unloading curve is assumed for tests 24-3-Fatigue-3 and 4. As stated previously, the peak load and displacement values were used to plot the portion of the load-displacement curve during the cycled loading portion of the test. This resulted in a plateau forming at the peak of the load-displacement plot for tests 24-3-Fatigue-3 and 4.

202
Figure 4-99 Load displacement response, test 24-3-Fatigue-3&4
Test 24-3-Fatigue-3U & 4U (Cracked specimen , unbonded CFRP)
For the end strengthened using unbonded CFRP, a shear crack opened near the support after the initial loading of the test specimen with few additional cracks forming throughout testing at the lower load level. The main shear crack continued to widen throughout testing in a similar manner to test 24-3-Fatigue-1U. Since shear crack widths were relatively equivalent on both the bonded and unbonded ends of the test specimen and strains in the internal steel on the unbonded end were lower than previously observed in test 24-3-Fatigue-1U, the unbonded end of the test specimen was left unclamped for the second series of fatigue loading, test 24-3-Fatigue-4. A second large shear crack opened near the loading point within 100,000 cycles of the increased loading test. Shear cracks increased from 0.037-in. to 0.055-in. after the completion of 2,337,000 cycles at the higher load level. The two main shear cracks accounted for the majority of increased deformations, with few other cracks forming during testing.
Steel strains were measured at approximately sixty percent of yield during testing at the lower load level and increased to near yielding levels throughout the higher load test. These strains showed very little increases throughout testing.
CFRP strains were observed to be much higher on the unbonded end of the test specimen that was strengthened after cracking compared with the specimen that was strengthened prior to cracking. The increased load being carried by the CFRP strips resulted in lower strains in the internal steel.

203
Test 24-3-Fatigue-3B & 4B (Cracked specimen , bonded CFRP)
For the testing end strengthened using bonded CFRP, the main shear crack opened in the middle of the shear span and no other major cracks formed during fatigue testing. Similar to the previous bonded CFRP test, smaller cracks formed near the main shear crack during the lower range of fatigue loading as opposed to the widening of the major crack observed in the unbonded tests. Additional small shear cracks formed closer to the loading point during the higher range of loading, but no additional major shear cracks formed during fatigue testing at the higher load range. Shear cracks increased from 0.028-in. to 0.033-in. after the completion of 2,337,000 cycles at the higher load level.
Steel strains remained lower at corresponding load levels compared to the end of the specimen strengthened using unbonded CFRP sheets, but the strains were closer than for tests 24-3-Fatigue-1 and 2. These strains showed gradual increases throughout testing.
Once again, CFRP strains were observed to be higher on the bonded end of the test specimen compared to the unbonded end of the test specimen. An increased load sharing effect was seen on the bonded end of the test specimen. Higher strains were present in the bonded CFRP laminates as compared with the unbonded CFRP laminates of tests 24-3-Fatigue-1U and 2U. Also, steel strains were much lower at the same location in tests 24-3-Fatigue-1B and 2B compared with tests 24-3-Fatigue-1U and 2U.
Discussion of tests 24-3-Fatigue-3 & 4
Steel and CFRP strains for tests 24-3-Fatigue-3 and 4 are presented in Figure 4-100 and Figure 4-101 respectively.
Figure 4-100 Steel strains, Tests 24-3-Fatigue-3&4

204
Figure 4-101 CFRP strains, Tests 24-3-Fatigue-3&4
Once again, the presence of bond helped to decrease the strains present in the internal transverse reinforcement. The steel strain reduction in the end strengthened using bonded CFRP laminates was not as great as the reduction observed in tests 24-3-Fatigue-1B and 2B. This agrees with work done by Ferrier, Bigaud, Clement, and Hamelin (2011) where they found that the strain reduction in the internal steel reinforcement was not as great in specimens cracked prior to the application of CFRP compared with those strengthened prior to the cracking of the specimen.
The initial cracking of the specimen allowed for greater strains to develop in the unbonded CFRP. This enabled the unbonded CFRP to share more of the force with the internal steel, resulting in lower strains in the transverse steel reinforcement in test 24-3-Fatigue-3U compared with test 24-3-Fatigue-1U. Once again, CFRP strains were higher in the bonded CFRP compared with the unbonded CFRP due to localized strains developing in the bonded CFRP. The greater contribution from the unbonded CFRP helped to increase the fatigue life of the specimen in a similar way as the previous tests strengthened using bonded CFRP laminates. CFRP strains on both ends of the test specimen increased gradually throughout testing, but no deteriorations in strength were observed. A small increase in strain occurred after approximately 1.5-million cycles due to the fatigue testing machine being tripped and subsequently restarted.
4.2.3 General observations
A summary of the highest strains recorded in the internal transverse reinforcement and the CFRP sheets are presented in Table 4-15.

205
Table 4-15 Summary of highest strains recorded during fatigue loading
In general, steel strains in the end strengthened using bonded CFRP laminates were lower
than steel strains in the end strengthened using unbonded CFRP laminates. In a similar manner, strains were higher in the bonded CFRP compared with the unbonded CFRP in all tests. For both tests strengthened with bonded CFRP laminates, CFRP strains were 50-percent higher than the code allowable strain of 0.004 required for cases where CFRP laminates cannot be completely wrapped around a specimen and no deterioration of strength was observed. This demonstrated that CFRP anchors are capable of maintaining large strains in the CFRP in cases of cyclic loading.
Higher strains developed in the bonded CFRP for the test strengthened prior to cracking due to increased localized strains in the CFRP. While strains in the unbonded CFRP for the test strengthened after initial cracking of the specimen were substantially higher than strains in the unbonded CFRP on the specimen strengthened prior to cracking. This demonstrates that for specimens strengthened after the initial cracking of the specimen, the quality of bond between the surface of the concrete and the CFRP laminates is not as vital as for cases of uncracked beams being strengthened. The initial deformations present in the beam following cracking allow for the unbonded CFRP to demonstrate a greater strength contribution during loading for specimens strengthened using unbonded CFRP laminates after initial cracking.
A summary of the maximum crack widths recorded at the beginning and completion of loading are presented in Table 4-16.
StrainGauge
LocationStrain
Gauge Location
Bonded/ Unbonded
Cracked/ Uncracked
24-3-Fatigue-1U 0.0022 4DO 0.0004 F1DO Unbonded Uncracked24-3-Fatigue-1B 0.0010 3C 0.0032 F1DR Bonded Uncracked24-3-Fatigue-2B 0.0018 3C 0.0068 F1D Bonded Uncracked24-3-Fatigue-3U 0.0016 4EO 0.0018 F2EO Unbonded Cracked24-3-Fatigue-3B 0.0010 4DR 0.0030 F1DR Bonded Cracked24-3-Fatigue-4U 0.0025 4EO 0.0039 F2EO Unbonded Cracked24-3-Fatigue-4B 0.0019 4DR 0.0059 F1DR Bonded Cracked
Test Number
Steel CFRP Testing Conditions

206
Table 4-16 Summary of crack widths recorded during fatigue loading
In general, a large crack would form on the end of the specimen strengthened with
unbonded CFRP laminates and widen throughout cyclic loading. The end strengthened with bonded CFRP laminates tended to develop several smaller cracks throughout loading as opposed to having one larger crack. Crack widths increased at a greater rate initially and then plateaued as cyclic loading continued. For the specimen strengthened prior to cracking, crack widths were significantly smaller in the bonded end of the specimen compared with the unbonded specimen. But for the specimen strengthened after initial cracking, crack widths remained closer in value throughout loading and both ends demonstrated similar cracking patterns.
4.3 Fatigue Failure Load Test Series
After completion of the fatigue testing described in the previous section, each test specimen was taken to failure. The end of the test specimen that failed first was strengthened using external prestressed clamps described in 3.3.1.2. This allowed the alternate end of the test specimen to also be loaded to failure. Thus, each test specimen produced two separate failure loads.
The fatigue failure load test series consisted of four tests described in Table 4-17.
Start of Cycled Load
End of Cycled Load
Bonded/ Unbonded
Cracked/ Uncracked
24-3-Fatigue-1U 0.015-in. 0.037-in. Unbonded Uncracked24-3-Fatigue-1B 0.003-in. 0.011-in. Bonded Uncracked24-3-Fatigue-2B 0.017-in. 0.024-in. Bonded Uncracked24-3-Fatigue-3U x* x* Unbonded Cracked24-3-Fatigue-3B x* x* Bonded Cracked24-3-Fatigue-4U 0.037-in. 0.055-in. Unbonded Cracked24-3-Fatigue-4B 0.028-in. 0.033-in. Bonded Cracked
* - Crack width information was unavailable for test 24-3-Fatigue-3
Test Number
Max Crack Widths Testing Conditions

207
Table 4-17 Fatigue failure load test matrix
In this matrix, the first column identifies the test as defined in Chapter 3. The second
column indicates whether the CFRP laminates used were bonded to the surface of the concrete or unbonded. The next column specifies whether the test specimen was strengthened using CFRP laminates prior to or following the initial cracking of the specimen. The last column specifies failure load of the test. Since the load was applied to the test specimen at the midpoint of the specimen, the applied shear load for each test is equal to approximately one half of the total applied load.
4.3.1 24-3-Fatigue-Fail-1 & 2 (uncracked specimen)
As mentioned previously, the first fatigue test specimen was strengthened using CFRP laminates prior to the cracking of the reinforced concrete beam. One end of the test specimen was strengthened using bonded CFRP laminates and the alternate end of the specimen was strengthened using unbonded CFRP laminates. The unbonded end of the test specimen failed first at an applied load of 214-kips (applied shear equal to 107-kips). The bonded end of the test specimen failed second at an applied load of 270-kips (applied shear equal to 135-kips). The complete load-displacement response of tests 24-3-Fatigue-Fail-1 and 2 are presented in Figure 4-102.
Fatigue Failure Load Test Series a/d ratio equal to 3Test Number Bonded/Unbonded CFRP Procedure Failure Load
24-3-Fatigue-Fail-1 UnbondedStrengthening
Uncracked214-kips
24-3-Fatigue-Fail-2 BondedStrengthening
Uncracked270-kips
24-3-Fatigue-Fail-3 BondedStrengthening
Cracked256-kips
24-3-Fatigue-Fail-4 UnbondedStrengthening
Cracked284-kips

208
Figure 4-102 Load displacement response, test 24-3-Fatigue-Fail-1&2
24-3-Fatigue-Fail-1 (uncracked specimen, unbonded CFRP)
Test 24-3-Fatigue-Fail-1 failed at an applied load of 214-kips (applied shear = 107-kips). Shear failure of the test specimen was initiated by rupture of a CFRP anchor. Photos of the test specimen before loading and after failure are displayed in Figure 4-103. Concrete cracks observed during testing are marked in green, cracks marked in blue and red developed during the previous fatigue testing of the specimen.
Figure 4-103 24-3-Fatigue-Fail-1 before (left) and after (right) loading
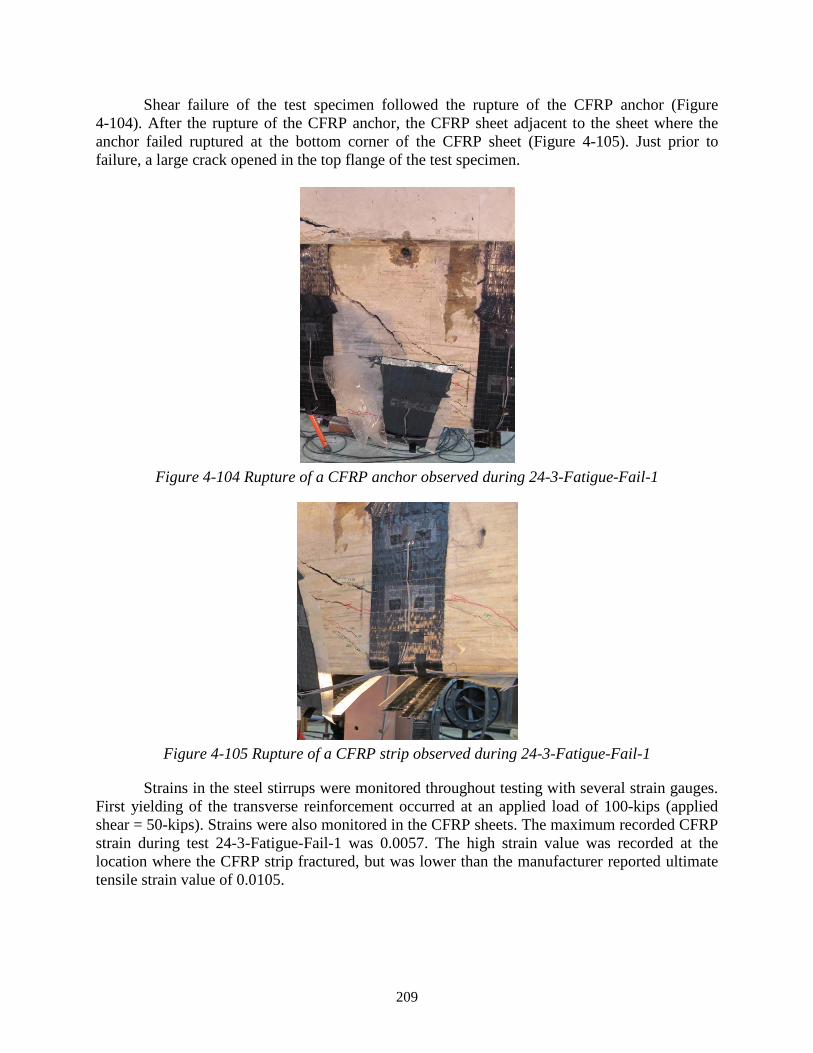
209
Shear failure of the test specimen followed the rupture of the CFRP anchor (Figure 4-104). After the rupture of the CFRP anchor, the CFRP sheet adjacent to the sheet where the anchor failed ruptured at the bottom corner of the CFRP sheet (Figure 4-105). Just prior to failure, a large crack opened in the top flange of the test specimen.
Figure 4-104 Rupture of a CFRP anchor observed during 24-3-Fatigue-Fail-1
Figure 4-105 Rupture of a CFRP strip observed during 24-3-Fatigue-Fail-1
Strains in the steel stirrups were monitored throughout testing with several strain gauges. First yielding of the transverse reinforcement occurred at an applied load of 100-kips (applied shear = 50-kips). Strains were also monitored in the CFRP sheets. The maximum recorded CFRP strain during test 24-3-Fatigue-Fail-1 was 0.0057. The high strain value was recorded at the location where the CFRP strip fractured, but was lower than the manufacturer reported ultimate tensile strain value of 0.0105.

210
24-3-Fatigue-Fail-2 (uncracked specimen, bonded CFRP)
Test 24-3-Fatigue-Fail-2 failed at an applied load of 270-kips (applied shear = 135-kips). Once again, shear failure of the test specimen was initiated by rupture of a CFRP anchor. Photos of the test specimen before loading and after failure are displayed in Figure 4-106. Concrete cracks observed during testing are marked in green, cracks marked in blue and red developed during the previous fatigue testing of the specimen.
Figure 4-106 24-3-Fatigue-Fail-2 before (left) and after (right) loading
Shear failure of the test specimen was initiated by a combination of rupture of the CFRP strips and the CFRP anchors. First, the CFRP anchor ruptured on one side of the test specimen and the same sheet fractured on the opposite side of the specimen. A photo of the failed anchor can be seen in Figure 4-107. The CFRP sheet adjacent to the initially failed strip then ruptured due to increased load from the redistribution of shear force following the initial strips failure (Figure 4-108).
Figure 4-107 CFRP anchor failure observed during 24-3-Fatigue-Fail-2

211
Figure 4-108 Rupture of CFRP strip observed during 24-3-Fatigue-Fail-2
Strains in the steel stirrups were monitored throughout testing with several strain gauges. First yielding of the transverse reinforcement occurred at an applied load of 173-kips (applied shear = 87-kips). Strains were also monitored in the CFRP sheets. The maximum recorded CFRP strain during test 24-3-Fatigue-Fail-2 was 0.0130. The high strain value was recorded at the location where the CFRP strip fractured on the opposite side of the anchor failure location and was higher than the manufacturer reported ultimate tensile strain value of 0.0105.
4.3.2 24-3-Fatigue-Fail-3&4 (cracked specimen)
As described previously, the second fatigue test specimen was strengthened using CFRP laminates following the initial cracking of the reinforced concrete beam. One end of the test specimen was strengthened using bonded CFRP laminates and the alternate end of the specimen was strengthened using unbonded CFRP laminates. The bonded end of the test specimen failed first at an applied load of 256-kips (applied shear equal to 128-kips). The unbonded end of the test specimen failed second at an applied load of 283-kips (applied shear equal to 142-kips). The complete load-displacement response of tests 24-3-Fatigue-Fail-3 and 4 are presented in Figure 4-109.

212
Figure 4-109 Load displacement response, test 24-3-Fatigue-Fail-3&4
24-3-Fatigue-Fail-3 (Cracked specimen, bonded CFRP)
Test 24-3-Fatigue-Fail-3 failed at an applied load of 256-kips (applied shear = 128-kips). Once again, shear failure of the test specimen was initiated by rupture of a CFRP anchor. Photos of the test specimen before loading and after failure are displayed in Figure 4-110. Concrete cracks observed during testing are marked in red. Cracks marked in blue and green developed during the previous fatigue testing of the specimen.
Figure 4-110 24-3-Fatigue-Fail-3 before (left) and after (right) loading

213
Shear failure of the test specimen was initiated by the rupture of a CFRP anchor. First, the CFRP anchor ruptured on one side of the test specimen and then the anchor on the same sheet on the opposite side of the specimen failed. Photos of the failed anchors can be seen in Figure 4-111 and Figure 4-112. Once again, a large crack developed in the top flange prior to failure. In addition, a second large shear crack opened above the support prior to failure.
Figure 4-111 First CFRP anchor failure observed during 24-3-Fatigue-Fail-3
Figure 4-112 Second CFRP anchor failure observed during 24-3-Fatigue-Fail-3
Strains in the steel stirrups were monitored throughout testing with several strain gauges. First yielding of the transverse reinforcement occurred at an applied load of 163-kips (applied shear = 82-kips). Strains were also monitored in the CFRP sheets. The maximum recorded CFRP strain during test 24-3-Fatigue-Fail-3 was 0.0154. The high strain value was recorded at the location where the CFRP strip failed due to the rupture of the CFRP anchor and was higher than the manufacturer reported ultimate tensile strain value of 0.0105.

214
24-3-Fatigue-Fail-4 (Cracked specimen, unbonded CFRP)
Test 24-3-Fatigue-Fail-4 failed at an applied load of 283-kips (applied shear = 142-kips). Once again, shear failure of the test specimen was initiated by rupture of a CFRP anchor. Photos of the test specimen before loading and after failure are displayed in Figure 4-113. Concrete cracks observed during testing are marked in red. Cracks marked in blue and green developed during the previous fatigue testing of the specimen.
Figure 4-113 24-3-Fatigue-Fail-4 before (left) and after (right) loading
Shear failure of the test specimen was initiated by the rupture of a CFRP anchor in the second strip nearest to the support. Once the first CFRP anchor failed, then the adjacent strip failed due to the rupture of a CFRP anchor. After the second sheet failed due to the rupture of a CFRP anchor, then a third CFRP sheet failed due to the rupture of the CFRP sheet at the bottom bend of the CFRP sheet (Figure 4-114). A photo of one of the failed anchors can be seen in Figure 4-115. Two large shear cracks formed in the middle of the shear span with the ultimate failure resulting from the shear crack closest to the support.
Figure 4-114 CFRP sheet rupture observed during 24-3-Fatigue-Fail-4

215
Figure 4-115 CFRP anchor failure observed during 24-3-Fatigue-Fail-4
Strains in the steel stirrups were monitored throughout testing with several strain gauges. First yielding of the transverse reinforcement occurred at an applied load of 150-kips (applied shear = 75-kips). Strains were also monitored in the CFRP sheets. The maximum recorded CFRP strain during test 24-3-Fatigue-Fail-3 was 0.0129. The high strain value was recorded at the location where the first CFRP strip failed due to the rupture of the CFRP anchor and was higher than the manufacturer reported ultimate tensile strain value of 0.0105.
4.3.3 Discussion of results of loading to failure after completion of fatigue loading
The results of the failure load tests and previous monotonically loaded failure tests conducted by Quinn (2009) are summarized in Table 4-18.
Table 4-18 Summary of tests to failure
Test TypeTest
NumberBonded/
UnbondedCracked/
UncrackedLoad Steel
Yielded (Shear)Max CFRP
StrainFailure Load
(Shear)
Ratio of Measured/
Control
24-3-Fatigue-Fail-1 Unbonded Uncracked 50-kips 0.0057 107-kips 1.02
24-3-Fatigue-Fail-2 Bonded Uncracked 87-kips 0.0130 135-kips 1.29
24-3-Fatigue-Fail-3 Bonded Cracked 82-kips 0.0154 128-kips 1.22
24-3-Fatigue-Fail-4 Unbonded Cracked 75-kips 0.0129 142-kips 1.35
Test 1 Control - 73-kips - 105-kips 1.0
Test 2 Unbonded Cracked 103-kips 0.0126 151-kips 1.44
Test 3 Bonded Cracked 73-kips* 0.0123 151-kips 1.44
-Fatigue specimens were cast from the same truck and differences in concrete compressive strength are assumed to be negligible.
-Fatigue beams consisted of steel and CFRP materials were from the same batches and assumed to have nominally identical properties.
* - Specimen was previously loaded to yielding of the steel stirrups prior to the application of CFRP
Load to Failure of Fatigue
Specimens
Monotonic to Failure

216
The first column distinguishes between tests that had been previously fatigued prior to failure and monotonic tests. The second column identifies the test as defined by Figure 3-1. The third column indicates whether the CFRP laminates were installed using a bonded or unbonded application. The fourth column specifies whether the beam was cracked or uncracked prior to the installation of CFRP. The fifth column specifies the load at which the transverse steel reinforcement yielded. The sixth column displays the highest recorded strain in the CFRP laminates. The next column displays the shear at failure. The final column presents the ratio of increased strength compared with the control specimen tested by Quinn (2009). His specimens also consisted of a T-beam with a 24-in. depth and a 14-in. web.
Both monotonic tests of strengthened specimens produced shear failure loads of approximately 151-kips. In monotonic tests, the absence of bond between the surface of the concrete and the CFRP laminates did not decrease the ultimate capacity of the test specimen. Both tests were able to develop strains in the CFRP laminates that were higher than the manufacturer reported ultimate tensile strain value of 0.0105. The strengthened specimens produced an ultimate shear failure load that was 44-percent greater than the unstrengthened specimen, which failed at a shear load of 105-kips.
Test 24-3-Fatigue-Fail-1 was strengthened using unbonded CFRP prior to cracking and failed at an applied shear of 107-kips. The capacity of test 24-3-Fatigue-Fail-1 is only slightly greater than the control specimen tested monotonically (a 2-percent increase in strength). During fatigue testing, the strains in the transverse steel reinforcement on the unbonded end reached values near yielding. The CFRP laminates had very small strains and were contributing little additional strength to the specimen. The high strain levels may have caused the internal steel to be close to its fatigue capacity prior to monotonic loading and thus contributed to a premature failure.
Hoult and Lees (2005) noted that attention needs to be given to the fatigue capacity of a beams component parts. Failure in test 24-3-Fatigue-Fail-1 may have resulted from a premature fracture of the internal steel stirrups prior to the anchor rupture due to their capacity being decreased as a result of fatigue loading. Following the initial cyclic loading series, this end of the specimen was clamped to prevent premature failure during the cyclic loading of the other end of the specimen at higher levels. It is unknown if the clamping procedure resulted in further decreases in the ultimate shear capacity of the unbonded end.
The results of the other three tests were favorable with strength gains between 20 and 35-percent. All four tests resulted in lower failure loads than monotonically loaded tests that had not been fatigue loaded. This agrees with results of tests conducted by Harries, Reeve, and Zorn (2007) where they found that beams that had been fatigue tested more than 2-million cycles failed at lower loads than non-fatigued, monotonically loaded specimens. These tests show that while the ultimate capacity of strengthened specimens decreases after substantial fatigue loading, considerable gains in strength are still possible as a result of CFRP strengthening after extreme fatigue loading.
CFRP failure occurred initially due to rupture of the CFRP anchor in each of the four tests. Even though failure occurred due to rupture of the CFRP anchor, the final three failure tests produced strains in the CFRP that were higher than the manufacturer reported ultimate tensile strain value of 0.0105. This demonstrates that the CFRP anchors are capable of developing the full capacity of the CFRP strip. Therefore, in cases where it is not possible to fully wrap CFRP laminates around a specimen, CFRP anchors should be used so that the full capacity of the CFRP laminate can be utilized. Attention must be given to the amount of damage accumulated in the

217
internal steel due to fatigue loading when calculating the ultimate capacity of a specimen strengthened using CFRP laminates.
4.4 Sustained Load Test Series
The sustained load test series consisted of four tests described in Table 4-19.
Table 4-19 Sustained loading test matrix
In this matrix, the first column identifies the test as defined in Chapter 3. The second
column indicates the load applied to the midpoint of each test specimen. The next column indicates whether the CFRP material was bonded to the surface of the concrete specimen or if bond was removed by placing a layer of clear plastic shelf liner between the CFRP and the concrete surface. The CFRP layout used in all instances consisted of 5-in. CFRP strips spaced at 10-in. on-center. Each CFRP strip was anchored to the top of the concrete web using one CFRP anchor on each side of the test specimen. So each CFRP strip was anchored using two CFRP anchors. The last column specifies whether the test specimen was strengthened using CFRP laminates prior to the initial cracking of the specimen or after cracking.
4.4.1 24-3-Sust-1 (uncracked specimen, bonded CFRP)
Test 24-3-Sust-1 consisted of a specimen that was strengthened using CFRP laminates prior to the initial cracking of the test specimen. CFRP was applied to the test specimen using a bonded application. Photos of the loaded test specimen can be seen in Figure 4-116. Concrete cracks observed during testing are outlined in red.
Sustained Load Test Series a/d ratio equal to 3Test Number Applied Load Bonded/Unbonded CFRP Procedure
24-3-Sust-1 160-kips BondedStrengthened
Uncracked
24-3-Sust-2 160-kips UnbondedStrengthened
Uncracked
24-3-Sust-3 160-kips BondedStrengthened
Cracked
24-3-Sust-4 160-kips UnbondedStrengthened
Cracked

218
Figure 4-116 Front and back of test 24-3-Sust-1
Multiple small cracks opened in the shear span after loading with few additional cracks opening up after the final load was applied. Concrete crack widths changed slightly with crack widths increasing from 0.013-in. at the start of loading to 0.020-in. after 217 days of loading. Strains in the transverse steel reinforcement, CFRP laminates, and concrete surface were monitored during testing. A small increase in strain was observed at the 107-day point when the load was adjusted to the desired level. Steel strains remained relatively constant throughout testing. The maximum reported strain in the steel stirrups during test 24-3-Sust-1 was 0.00180. The maximum steel strain was recorded after the load was reapplied 107 days after initial loading. Steel strains then decreased slightly after this point.
CFRP strains increased moderately during test 24-3-Sust-1 with a maximum reported strain of 0.00459. CFRP strains continued increasing during testing with the maximum CFRP strain being recorded on day 217. The average CFRP strain of all strips crossing shear cracks was 0.00376. The lowest strain of any CFRP strip crossing a shear crack was 0.00276. Surface strains were monitored using the DEMEC measuring system described in 3.4.3.2. Surface strains remained relatively constant throughout testing with minimal increases in strain. The bonded application of CFRP materials greatly reduced the size of crack widths and minimized increases in surface strains during testing. A plot of the strains recorded using steel gauges, CFRP gauges, and the DEMEC device are presented in Figure 4-117. DEMEC readings measure the average strain over an 8-in. gauge length, whereas the steel and CFRP gauges measure strain at a specific point on the steel and CFRP. Because of this, DEMEC readings can be higher compared with steel and CFRP strains in locations where large cracks formed in the concrete. These differences in strain may also be related to the location of the critical crack compared with the location of the steel and CFRP gauges. The closer these gauges were to the critical crack, the more precise the measurements.

219
Figure 4-117 Strains, test 24-3-Sust-1
4.4.2 24-3-Sust-2 (uncracked specimen, unbonded CFRP)
Test 24-3-Sust-2 consisted of a specimen that was strengthened using CFRP laminates prior to the initial cracking of the test specimen. CFRP was applied to the test specimen using an unbonded application. Photos of the loaded test specimen can be seen in Figure 4-118. Concrete cracks observed during testing are outlined in red.
Figure 4-118 Front and back of test 24-3-Sust-2
Cracking in the unbonded specimen was limited to two large shear cracks that formed in the shear span. Few additional cracks formed after the initial loading of the test specimen. Concrete crack widths increased from 0.040-in. at the start of loading to 0.080-in. after 217 days of loading. Strains in the transverse steel reinforcement, CFRP laminates, and concrete surface were monitored during testing. A small increase in strain was observed at the 107-day point when the load was adjusted. Once again, steel strains remained little changed during testing. The maximum reported strain in the steel stirrups during test 24-3-Sust-2 was 0.00251. The

220
maximum steel strain was recorded after the application of the initial load. Steel strains decreased after initial loading, but remained near 0.0020 throughout testing.
Similar to the previous test, CFRP strains increased moderately during test 24-3-Sust-2 with a maximum reported strain of 0.00477. CFRP strains increased rapidly at the beginning of testing, but then remained relatively constant thereafter. The maximum CFRP strain was recorded near the end of the 217 day period. In contrast to the previous test, the average CFRP strain of all strips crossing shear cracks was 0.00196. After the CFRP strip that recorded the maximum strain of 0.00477, no other strip had a strain greater than 0.0020. Once again, surface strains were monitored using the DEMEC measuring system described in 3.4.3.2. Surface strains increased steadily during testing and coincided to similar increases seen in concrete crack widths. The lack of bond between the surface of the concrete and the CFRP laminates allowed for greater increases in deformations during testing. A plot of the strains recorded using steel gauges, CFRP gauges, and the DEMEC device are presented in Figure 4-119. DEMEC readings measure the average strain over an 8-in. gauge length, whereas the steel and CFRP gauges measure strain at a specific point on the steel and CFRP. DEMEC readings were significantly higher than steel and CFRP gauge readings for test 24-3-Sust-2 due to a large crack that formed between the DEMEC points used to take measurements.
Figure 4-119 Strains, test 24-3-Sust-2
4.4.3 24-3-Sust-3 (cracked specimen, bonded CFRP)
Test 24-3-Sust-3 was strengthened using CFRP laminates following the initial cracking of the test specimen. CFRP was applied to the test specimen using a bonded application. Photos of the loaded test specimen can be seen in Figure 4-120. Once again, concrete cracks observed during testing are outlined in red.

221
Figure 4-120 Front and back of test 24-3-Sust-3
The majority of shear cracks formed in test 24-3-Sust-3 during the initial cracking of the test specimen prior to the application of CFRP materials. Initial cracks widened after application of the sustained load, with minimal additional cracks forming. Concrete crack widths increased from 0.030-in. at the start of loading to 0.060-in. after 217 days of loading. Strains in the transverse steel reinforcement, CFRP laminates, and concrete surface were monitored during testing. Once again, a small increase in strain was observed at the 107-day point when the load was adjusted. After initial increases, strains in the transverse steel reinforcement remained constant throughout the test. Several steel stirrups reached yielding during the initial loading of the test specimen. After this, the stirrups remained near yielding for the duration of the test with a maximum recorded strain of 0.00233 in the steel stirrups after 217 days of loading.
Similar to the other tests, CFRP strains increased moderately during test 24-3-Sust-3 with a maximum reported strain of 0.00637. CFRP strains increased throughout testing and the maximum reported CFRP strain was recorded on day 217. The average strain in all CFRP strips crossing shear cracks was 0.00296. The CFRP strain gauges on this specimen were placed at the known locations of the cracks that formed prior to the application of CFRP. The higher recorded CFRP strains compared to those recorded in 24-3-Sust-1 could be the product of CFRP gauges being placed closer to the critical cracks. Once again, surface strains were monitored using the DEMEC measuring system described in 3.4.3.2. Surface strains remained relatively constant throughout testing. Similar to the initial bonded test, 24-3-Sust-1, the presence of bond between the surface of the concrete and the CFRP laminates appears to have limited increases in surface strains during testing. A plot of the strains recorded using steel gauges, CFRP gauges, and the DEMEC device are presented in Figure 4-121. DEMEC readings measure the average strain over an 8-in. gauge length, whereas the steel and CFRP gauges measure strain at a specific point on the steel and CFRP. Once again, DEMEC readings were slightly higher than steel and CFRP gauge readings for test 24-3-Sust-3 due to a large crack that formed between the DEMEC points used to take measurements.

222
Figure 4-121 Strains, test 24-3-Sust-3
4.4.4 24-3-Sust-4 (cracked specimen, unbonded CFRP)
Test 24-3-Sust-4 consisted of a specimen that was strengthened using CFRP laminates following the initial cracking of the test specimen. CFRP was applied to the test specimen using an unbonded application. Photos of the loaded test specimen can be seen in Figure 4-122. Once again, concrete cracks observed during testing are outlined in red.
Figure 4-122 Front and back of test 24-3-Sust-4
Similar to test 24-3-Sust-3, the majority of shear cracks formed in test 24-3-Sust-4 during the initial cracking of the test specimen prior to the application of CFRP materials. Initial cracks widened after application of the sustained load, with only minor cracks forming after initial loading. Concrete crack widths increased from 0.075-in. at the start of loading to 0.125-in. after 217 days of loading. Strains in the transverse steel reinforcement, CFRP laminates, and concrete surface were monitored during testing. Once again, a small increase in strain was observed at the 107-day point when the load was adjusted. No steel strain gauges were located in regions near

223
the critical crack. As a result, strain data cannot be properly compared to other tests. The strains in the available gauges remained relatively constant throughout testing with a maximum recorded strain of 0.00146.
Similar to the other tests, CFRP strains increased moderately during test 24-3-Sust-4 with a maximum reported strain of 0.00461. CFRP strains remained relatively constant throughout testing, and the maximum reported CFRP strain was recorded near the end of the 217 day testing period. The average strain in all CFRP strips crossing shear cracks was 0.00228. Surface strains were monitored using the DEMEC measuring system described in 3.4.3.2. The critical crack did not intersect with the grid of DEMEC points placed on the surface of the test specimen. Therefore, DEMEC measurements taken for test 24-3-Sust-4 cannot be compared properly with the other three tests. The monitored surface strains remained relatively constant throughout testing. Concrete crack width comparisons between test 24-3-Sust-4 and the other three tests will result in a more accurate assessment of specimen behavior. A plot of the strains recorded using steel gauges, CFRP gauges, and the DEMEC device are presented in Figure 4-123. DEMEC readings measure the average strain over an 8-in. gauge length, whereas the steel and CFRP gauges measure strain at a specific point on the steel and CFRP.
Figure 4-123 Strains, test 24-3-Sust-4
4.4.5 Displacements
End displacements were monitored on each end of the test specimens using DEMEC points similar to those used to obtain surface strain values. A photo of the DEMEC points placed on the surface of the end region of the test set-up is presented in Figure 4-124. The average displacements throughout testing are presented in Figure 4-125. Displacements increased dramatically during the first several days of loading and then continued to increase slowly for the duration of the test. A large jump in displacements was recorded when the load was adjusted at 107 days.
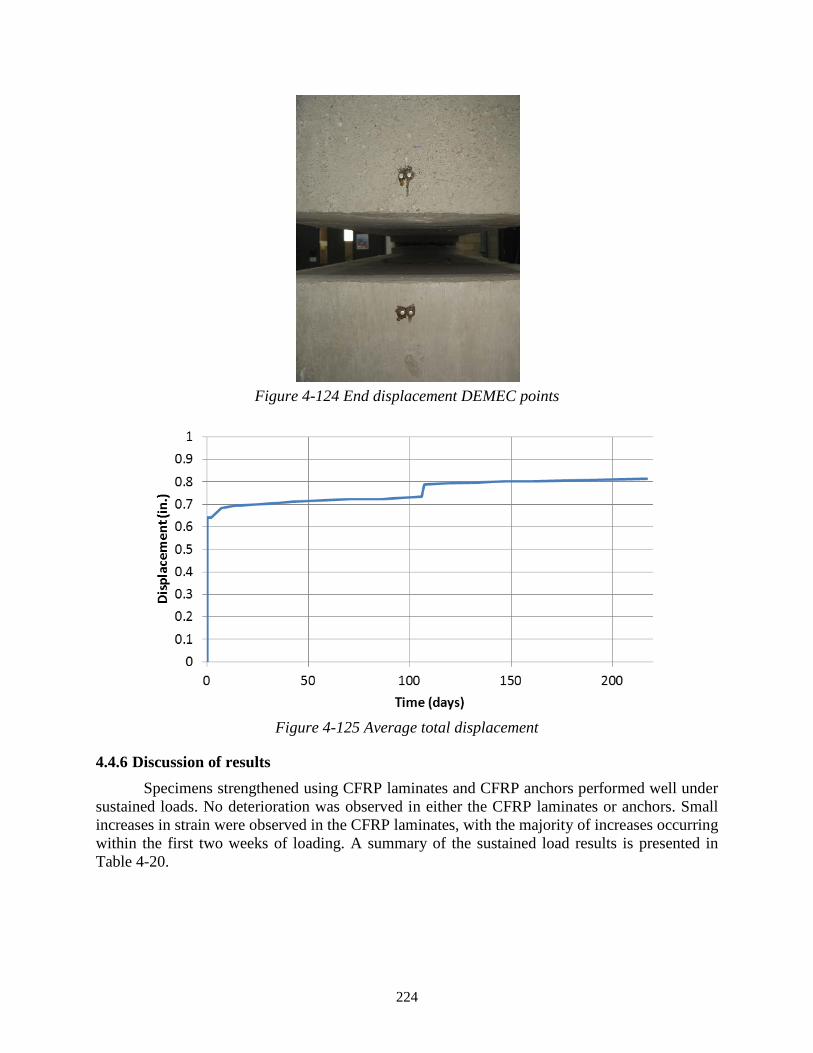
224
Figure 4-124 End displacement DEMEC points
Figure 4-125 Average total displacement
4.4.6 Discussion of results Specimens strengthened using CFRP laminates and CFRP anchors performed well under
sustained loads. No deterioration was observed in either the CFRP laminates or anchors. Small increases in strain were observed in the CFRP laminates, with the majority of increases occurring within the first two weeks of loading. A summary of the sustained load results is presented in Table 4-20.

225
Table 4-20 Summary of sustained load results
CFRP strain increases ranged between 0.0011 and 0.0018 for all tests. The findings are
similar to test results conducted by Hoult and Lees (2005) where they found that CFRP strains increased by 0.001 in CFRP laminates over a sustained loading period of 220-days. The strains in the tests presented are higher than those of Hoult and Lees (2005) mainly due to the process of checking the load after 2, 7, and 107-days to verify the applied load. CFRP strains reached values greater than 0.004, the code allowable strain value for specimens strengthened using CFRP laminates in applications where the laminates cannot be wrapped completely around the specimen. Once again, the CFRP anchors allowed the CFRP sheets to reach higher strain values without any observed deterioration.
In test 24-3-Sust-1, the bonded CFRP laminates continued to relieve stress on the internal transverse reinforcement throughout testing and kept the steel from yielding for the duration of the test. Steel strains reached yielding during the initial loading of test 24-3-Sust-2, but remained near 0.0019 for the majority of testing. Bonded and unbonded CFRP laminates helped to reduce the strain demand on the internal transverse reinforcement compared with the specimen strengthened after initial cracking. This confirms work by Uji (1992) that showed that the presence of CFRP laminates helps to reduce the strains in steel stirrups. Steel strains in test 24-3-Sust-3 were at yielding for the majority of testing. While steel strains were not available for the critical section in test 24-3-Sust-4, crack widths in excess of 1/8-in. give evidence that the steel stirrups in this test were above yielding throughout testing.
Similar to the fatigue tests, crack widths on the end strengthened with unbonded CFRP were much larger than the end strengthened using bonded CFRP. One large shear crack opened and continued to widen during the tests strengthened using unbonded CFRP. Multiple smaller cracks formed in the specimens strengthened using bonded CFRP with deformations being spread out over the depth of the section. Shear cracks were larger in the specimen strengthened after initial cracking compared with the specimen strengthened before cracking. The additional stiffness gained due to the application of CFRP laminates is not as great in specimens strengthened after the initial cracking of the specimen.
The average displacements of the two specimens increased gradually throughout testing with the bulk of the increases coming within the first few weeks of testing. This agrees with results found by Hoult and Lees (2005) where they observed that the majority of increases in the deflections of beams strengthened using CFRP laminates occurred during the first 25 days of loading. They also observed similar increases in CFRP strains during loading signifying possible deflection increases as a result of a shear contribution in addition to flexural effects. In general, CFRP laminates applied using CFRP anchors demonstrated excellent sustained behavior with little loss of strength observed during testing.
Initial Crack Width
Final Crack Width
Initial CFRP Strain
Max CFRP Strain
Max Steel Strain
Bonded/ Unbonded
Cracked/ Uncracked
24-3-Sust-1 0.013-in. 0.020-in. 0.0035 0.0045 0.0018 Bonded Uncracked
24-3-Sust-2 0.040-in. 0.080-in. 0.0030 0.0048 Yielded Unbonded Uncracked
24-3-Sust-3 0.030-in. 0.060-in. 0.0053 0.0064 Yielded Bonded Cracked
24-3-Sust-4 0.075-in. 0.125-in. 0.0033 0.0046 Yielded Unbonded Cracked
Test Number
Crack Widths Application ProcedureStrains
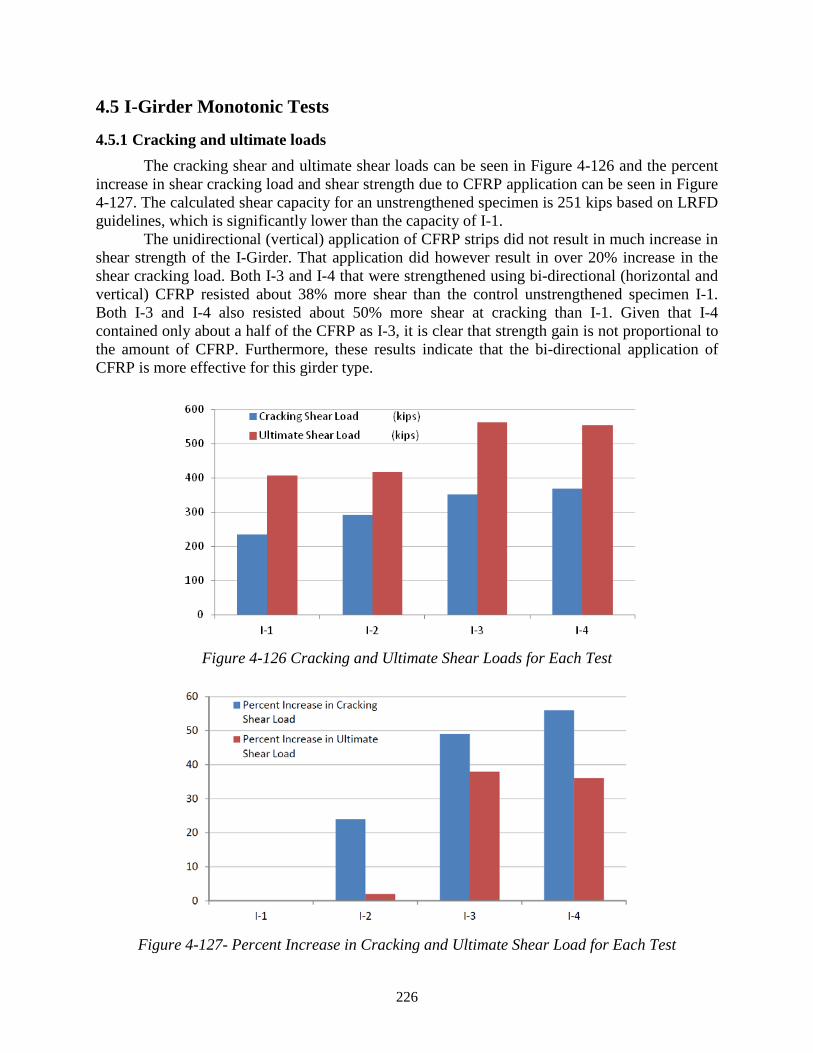
226
4.5 I-Girder Monotonic Tests
4.5.1 Cracking and ultimate loads The cracking shear and ultimate shear loads can be seen in Figure 4-126 and the percent
increase in shear cracking load and shear strength due to CFRP application can be seen in Figure 4-127. The calculated shear capacity for an unstrengthened specimen is 251 kips based on LRFD guidelines, which is significantly lower than the capacity of I-1.
The unidirectional (vertical) application of CFRP strips did not result in much increase in shear strength of the I-Girder. That application did however result in over 20% increase in the shear cracking load. Both I-3 and I-4 that were strengthened using bi-directional (horizontal and vertical) CFRP resisted about 38% more shear than the control unstrengthened specimen I-1. Both I-3 and I-4 also resisted about 50% more shear at cracking than I-1. Given that I-4 contained only about a half of the CFRP as I-3, it is clear that strength gain is not proportional to the amount of CFRP. Furthermore, these results indicate that the bi-directional application of CFRP is more effective for this girder type.
Figure 4-126 Cracking and Ultimate Shear Loads for Each Test
Figure 4-127- Percent Increase in Cracking and Ultimate Shear Load for Each Test

227
Failure photos can be seen in Figure 4-128 through Figure 4-131.
Figure 4-128 I-1 Failure
Figure 4-129 I-2 Failure
698k

228
Figure 4-130 I-3 Failure
Figure 4-131 I-4 Failure

229
4.5.2 Shear deformation response Shear forces versus shear strains are shown in Figure 4-132. Notice that the responses of
I-3 and I-4 are very similar in both strength and stiffness, even though I-3 had more than twice as much material and almost twice as many anchors as I-4.
Figure 4-132 Applied Shear vs. Shear Strain
4.5.3 Load-displacement response Using the LVDTs at the loading point and a load cell that measured the applied load, the
load-deflection response was obtained and can be seen in Figure 4-133. Please note that the unstrengthened specimen (I-1), and specimen I-2, which only had vertical strips, have a nearly identical response. The maximum deflection capacity is much larger when fibers were added in the horizontal direction.
Figure 4-133 Load Displacement Response

230
4.5.4 CFRP strain comparisons Only CFRP strain gauges were available for these tests. The rupture strain of the CFRP
fabric is 0.0105, as reported by the manufacturer. The maximum recorded CFRP strain was about 0.008 for I-2, 0.005 for I-3, and 0.0075 for I-4.
Graphs are presented in Figure 4-134 through Figure 4-138 in which readings from the strain gauges and the location of each gauge can be seen. The strain readings shown are from the same gauge at different stages in loading. The approximate crack locations and sizes at failure are indicated in red. Please note that, in all three cases, most of the action happens around the middle of the shear span. Higher strains were observed in I-4 than in I-3 because of the lower amount of CFRP material in I-4. Also, the strain readings for all three tests at a given load were superimposed. They can be seen in Figure 4-139, Figure 4-140, and Figure 4-141.
Figure 4-134 Strain Gauge Readings (Top) and Locations (Bottom)

231
Figure 4-135 Strain Gauge Readings (Top) and Locations (Bottom)

232
Figure 4-136 Strain Gauge Readings (Top) and Locations (Bottom)

233
Figure 4-137 Strain Gauge Readings (Top) and Locations (Bottom)

234
Figure 4-138 Strain Gauge Readings (Top) and Locations (Bottom)

235
Figure 4-139 Strain Readings at 300 kips
Figure 4-140 Strain Readings at 400 kips
Figure 4-141 Strain Readings at 500 kips
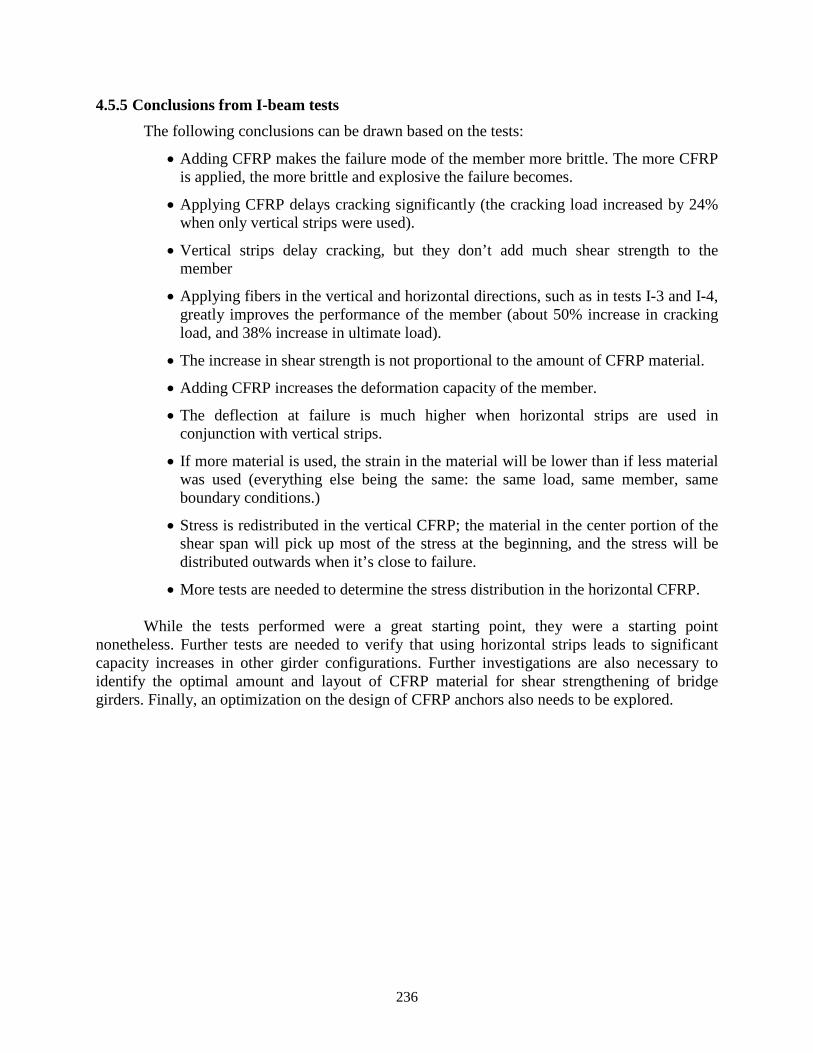
236
4.5.5 Conclusions from I-beam tests The following conclusions can be drawn based on the tests:
• Adding CFRP makes the failure mode of the member more brittle. The more CFRP is applied, the more brittle and explosive the failure becomes.
• Applying CFRP delays cracking significantly (the cracking load increased by 24% when only vertical strips were used).
• Vertical strips delay cracking, but they don’t add much shear strength to the member
• Applying fibers in the vertical and horizontal directions, such as in tests I-3 and I-4, greatly improves the performance of the member (about 50% increase in cracking load, and 38% increase in ultimate load).
• The increase in shear strength is not proportional to the amount of CFRP material.
• Adding CFRP increases the deformation capacity of the member.
• The deflection at failure is much higher when horizontal strips are used in conjunction with vertical strips.
• If more material is used, the strain in the material will be lower than if less material was used (everything else being the same: the same load, same member, same boundary conditions.)
• Stress is redistributed in the vertical CFRP; the material in the center portion of the shear span will pick up most of the stress at the beginning, and the stress will be distributed outwards when it’s close to failure.
• More tests are needed to determine the stress distribution in the horizontal CFRP. While the tests performed were a great starting point, they were a starting point
nonetheless. Further tests are needed to verify that using horizontal strips leads to significant capacity increases in other girder configurations. Further investigations are also necessary to identify the optimal amount and layout of CFRP material for shear strengthening of bridge girders. Finally, an optimization on the design of CFRP anchors also needs to be explored.

237
Chapter 5. Design Recommendations and Specifications
5.1 Specifications for Fabrication and Installation of CFRP Anchors The following parameters are most influential to the strength of CFRP anchor
installations: 1) anchor layout, 2) anchor inclination, 3) depth of anchor hole, 4) anchor hole chamfer radius, 5) area of anchor hole, 6) amount of CFRP material in anchors, 7) anchor fan length, 8) anchor fan angle, and 9) anchor reinforcement. Figure 5-1 and Figure 5-2 illustrate typical CFRP anchor and strip details used in this project.
Figure 5-1 Recommended detail of CFRP anchors
Figure 5-2 Isometric view of U-wrap with CFRP anchorage system

238
As mentioned previously, it was not within the scope of this project to optimize anchor design and details. A conservative anchor design was therefore used in the study. The anchor design was improved during testing as the original design did not perform as well as anticipated. The improved anchor design is presented next. 1. Anchor layout
In general, it is better to increase the number of anchors and the number of strips across the critical section to provide more redundancy and reduce stress concentrations. However, increasing the number of anchors increases installation time. A balance between adding redundancy and reducing construction time should be achieved.
One CFRP anchor per width of CFRP strip is recommended. However, if the width of a CFRP strip exceeds df /4, multiple anchors should be considered to reduce stress concentrations at the anchor fan and key; (df = effective CFRP length = distance from anchor to tension chord of beam). For a continuous sheet, the number of CFRP anchors is determined by the width of CFRP to be covered by each anchor. It is recommended that this width not exceed df /4.
Anchors should be placed such that the effective CFRP length (df) is maximized (i.e., as close to the top of a beam as possible). Anchors should always be placed within the concrete core; i.e., within the volume of concrete enclosed by transverse reinforcement.
CAUTION: recommended anchor details are provided for use with single-layer CFRP applications. These details did not provide acceptable performance in the limited work done using multi-layer CFRP applications. 2. Anchor hole inclination from axis perpendicular to surface
In this study anchor holes were investigated with up to 10 degrees of inclination from the perpendicular to the concrete surface. Inclinations of that amount did not show any adverse effects on anchor performance. It is recommended to provide anchor holes that are perpendicular to the concrete surface or bisecting the angle created by concrete surfaces at re-entrant corners (e.g., at the intersection of the flange and web in an I-Girder). A deviation of less than 10 degrees from that preferred angle direction did not affect the performance of anchors.
It is recommended to perform non-destructive testing to locate steel bars in concrete members prior to drilling so as to minimize drilling into bars. If, however, a steel bar is intersected while drilling, the anchor hole can be kept at the same location and inclined 10 degrees to either side of the bar without any adverse effect on its performance. 3. Depth of anchor hole
A 6 in. hole depth was used in all specimens and is recommended to ensure that the anchor engages the concrete core. 4. Area of anchor hole
An anchor hole area that is 1.4 times the area of the CFRP anchor is recommended. Hole diameter should be determined from that area and rounded up to the nearest 1/16th of an inch. Holes that are either smaller or larger can reduce anchor performance. A small hole makes it difficult to insert the anchor and a large hole requires more epoxy to fill the space.

239
5. Anchor hole chamfer radius An anchor hole chamfer radius of 0.5 in. was found to perform well and is
recommended. This chamfer can be achieved by using a grinder to grind the edge of the hole at the beam surface to the desired radius or a drill bit with a diameter larger than the hole to serve as a “countersink” bit. 6. Amount of CFRP material in anchors
It is recommended to use an area of CFRP material in anchors that is at least twice as large as the material area in the CFRP strips that are developed. 7. Anchor fan length
It is recommended to use an anchor fan length of at least 6 in. in all applications. Longer lengths may be needed to ensure at a minimum of ½ in. overhang of the fan on either side of the strip being developed (see Figure 5-1 for illustration). 8. Anchor fan angle
A fan angle of 60 degrees is recommended in all applications. 9. Anchor reinforcement
Two additional patches in perpendicular directions should be attached over the CFRP anchors (Figure 5-2). Patches should be square with sides equal to the strip width.
5.2 CFRP Shear Reinforcement Design Considerations
In this section, certain design considerations are presented that may be useful for engineers considering CFRP shear-strengthening systems.
5.2.1 CFRP elastic modulus All other parameters being equal, CFRP materials with high elastic moduli are preferred.
The higher the elastic modulus, the more shear load the CFRP material will attract and, thus, the more effective the CFRP shear strengthening system will be. Furthermore, CFRP materials with high moduli will reduce tensile strains across critical shear cracks, thereby maximizing the concrete contribution to shear capacity. In fact, a CFRP material with a high elastic modulus may be preferred over one with a high ultimate stress because ultimate stress may not be reached (due to strain limitations) while CFRP stiffness will contribute positively to performance at all load levels.
5.2.2 CFRP strip layout/spacing At least one CFRP anchor is likely to be located close to the critical shear crack and will
be subjected to high stress concentrations. As a result, the capacity of the CFRP strip restrained by that anchor may be lowered as the anchor may rupture prematurely. Using a larger number of strips of smaller area is, therefore, recommended to increase system redundancy and minimize strength loss arising from the premature loss of any particular strip. The downside to designing for a larger number of smaller strips is that additional labor is required in installation. A

240
compromise between redundancy and ease of construction needs to be achieved in the design process.
Continuous sheet applications may be the better option when it comes to providing continuity of the stresses along the member and increasing redundancy. However, it is impossible to monitor cracking or any damage visually in such applications. To allow for monitoring of strengthened members, discrete strip applications are preferred.
5.2.3 Orientation of CFRP strips The most efficient use of CFRP strips is achieved when the fibers are oriented
perpendicular to the critical shear crack. A test with strips inclined at 45 degrees was conducted and demonstrated adequate performance of inclined CFRP applications. However, the location and orientation of critical shear cracks is not easily estimated during design, making it difficult to design for the optimal orientation. Moreover, the application of inclined CFRP strips cannot be made in a U-shape but rather individual strips need to be lapped on the tension face of a section. Such application is more difficult to construct than U-wraps.
5.3 Design of Anchored CFRP Shear Strengthening Systems Design guidelines for shear strengthening of RC beams using externally bonded and
anchored CFRP systems are presented in this section. The guidelines are closely based on ACI 440.2R-08 shear strengthening provisions for externally bonded FRP systems reviewed in Chapter 2, Section 2.7.2. The guidelines do not apply to prestressed members nor members with a shear span to depth ratio smaller than 2.0. Two options are provided for designing such systems:
• Option 1: A direct use of ACI 440.2R-08 provisions that utilizes the effective strain value for completely wrapped applications in anchored applications.
• Option 2: A modified version of ACI 440.2R-08 provisions that introduces two factors that account for transverse steel and CFRP interactions.
The first option is presented as it is easy to use and familiar to designers of CFRP shear
strengthening systems. This method, however, does not take into account the interactions between transverse steel and CFRP and is very conservative. The second option modifies ACI 440.2R-08 provisions to take into account the interactions between steel and CFRP. It provides more accurate estimates of shear strength than the first option.
5.3.1 OPTION 1: Equivalent to ACI 440.2R-08 Provisions for Completely Wrapped Systems
ACI 440.2R-08 is the most widely used guideline for externally bonded FRP systems. The design recommendations in ACI 440.2R-08 are based on limit-states design principles and are compatible with ACI 318-05. Three types of FRP wrapping schemes are treated in ACI 440.2R-08 for shear strengthening: completely wrapped systems, U-wrap systems, and side bonded systems. Note that anchored systems are not currently treated in the document.
The design equations for FRP shear strengthening in ACI 440.2R-08 are adapted from shear strength equations of ACI 318-05. FRP shear contribution is evaluated in the same manner as for steel except that an effective FRP stress is used instead of a yield stress. The effective stress used is based on an effective strain that can be developed in the FRP sheets and depends
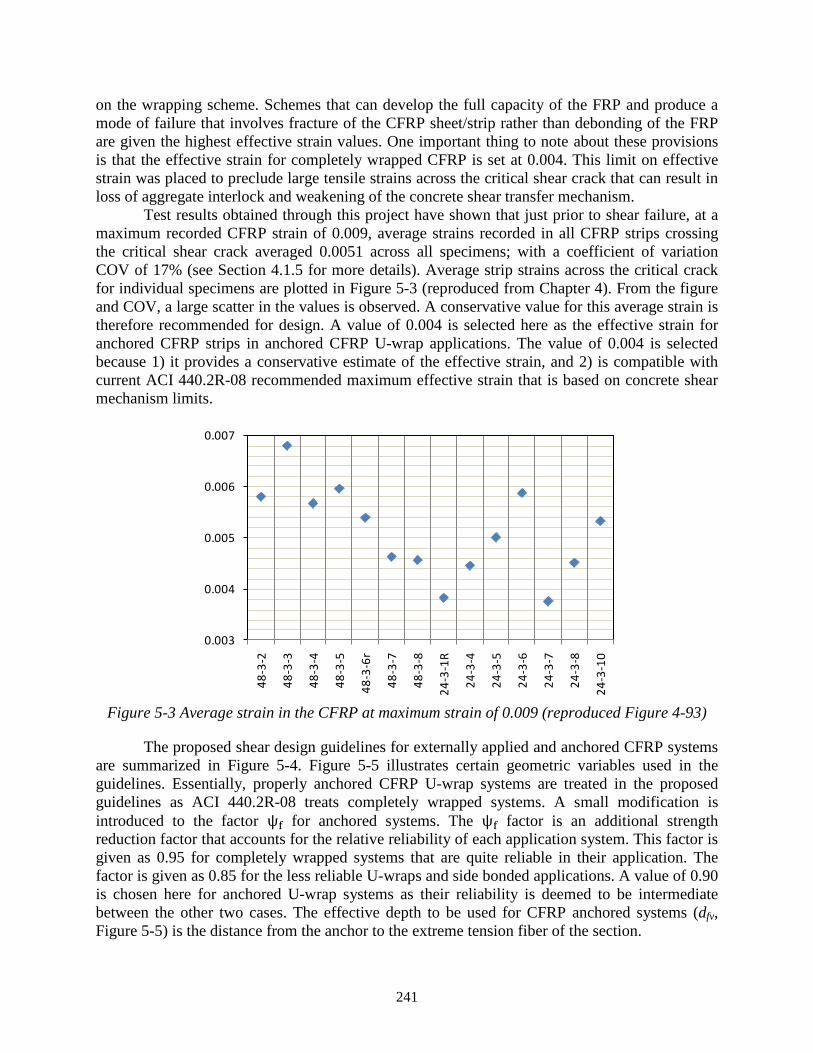
241
on the wrapping scheme. Schemes that can develop the full capacity of the FRP and produce a mode of failure that involves fracture of the CFRP sheet/strip rather than debonding of the FRP are given the highest effective strain values. One important thing to note about these provisions is that the effective strain for completely wrapped CFRP is set at 0.004. This limit on effective strain was placed to preclude large tensile strains across the critical shear crack that can result in loss of aggregate interlock and weakening of the concrete shear transfer mechanism.
Test results obtained through this project have shown that just prior to shear failure, at a maximum recorded CFRP strain of 0.009, average strains recorded in all CFRP strips crossing the critical shear crack averaged 0.0051 across all specimens; with a coefficient of variation COV of 17% (see Section 4.1.5 for more details). Average strip strains across the critical crack for individual specimens are plotted in Figure 5-3 (reproduced from Chapter 4). From the figure and COV, a large scatter in the values is observed. A conservative value for this average strain is therefore recommended for design. A value of 0.004 is selected here as the effective strain for anchored CFRP strips in anchored CFRP U-wrap applications. The value of 0.004 is selected because 1) it provides a conservative estimate of the effective strain, and 2) is compatible with current ACI 440.2R-08 recommended maximum effective strain that is based on concrete shear mechanism limits.
Figure 5-3 Average strain in the CFRP at maximum strain of 0.009 (reproduced Figure 4-93)
The proposed shear design guidelines for externally applied and anchored CFRP systems are summarized in Figure 5-4. Figure 5-5 illustrates certain geometric variables used in the guidelines. Essentially, properly anchored CFRP U-wrap systems are treated in the proposed guidelines as ACI 440.2R-08 treats completely wrapped systems. A small modification is introduced to the factor ψf for anchored systems. The ψf factor is an additional strength reduction factor that accounts for the relative reliability of each application system. This factor is given as 0.95 for completely wrapped systems that are quite reliable in their application. The factor is given as 0.85 for the less reliable U-wraps and side bonded applications. A value of 0.90 is chosen here for anchored U-wrap systems as their reliability is deemed to be intermediate between the other two cases. The effective depth to be used for CFRP anchored systems (dfv, Figure 5-5) is the distance from the anchor to the extreme tension fiber of the section.
0.003
0.004
0.005
0.006
0.007
48-3
-2
48-3
-3
48-3
-4
48-3
-5
48-3
-6r
48-3
-7
48-3
-8
24-3
-1R
24-3
-4
24-3
-5
24-3
-6
24-3
-7
24-3
-8
24-3
-10

242
𝑉𝑛 = 𝜙(𝑉𝑐 + 𝑉𝑠 + 𝜓𝑓𝑉𝑓) where 𝑉𝑐,𝑉𝑠,𝑉𝑓 = concrete, steel, and CFRP shear contributions 𝜙 = strength reduction factor = 0.75 ψf = additional reduction factors for CFRP shear reinforcement 0.90: U-wraps with anchorage 𝑉𝑐 = 2�𝑓𝑐′𝑏𝑤𝑑
𝑉𝑠 = 𝐴𝑠𝑣𝑓𝑠𝑦(𝑠𝑖𝑛 𝛼𝑠+𝑐𝑜𝑠 𝛼𝑠)𝑑
𝑠, αs = inclination of stirrups from axis of member
= 𝐴𝑠𝑣𝑓𝑠𝑦𝑑𝑠
for αs = 90°
𝑉𝑓 = 𝐴𝑣𝑓𝑓𝑓𝑒(𝑠𝑖𝑛 𝛼+𝑐𝑜𝑠 𝛼)𝑑𝑓𝑣𝑠𝑓
, α = inclination of CFRP fibers from axis of member
= 𝐴𝑣𝑓𝑓𝑓𝑒𝑑𝑓𝑣𝑠𝑓
𝐴𝑣𝑓 = 2𝑡𝑓𝑤𝑓 , 𝑓𝑓𝑒 = 𝜀𝑓𝑒𝐸𝑓 where 𝑑𝑓𝑣, 𝑡𝑓, 𝑤𝑓, 𝛼 are illustrated in Figure 5-5
𝑓𝑐′ = concrete specified compressive strength (psi) bw = section web width d = section effective depth Asv = area of transverse reinforcements spaced at s fsy = yield strength of transverse reinforcements 𝑡𝑓 = center to center spacing of CFRP strips
𝑑𝑓𝑣 = distance from anchor to section extreme tension fiber
𝑡𝑓 = nominal thickness of one ply of CFRP reinforcement 𝑤𝑓 = width of CFRP reinforcing plies 𝐸𝑓 = tensile modulus of elasticity of CFRP
𝜀𝑓𝑒 = effective strain level in CFRP reinforcement attained at failure 𝜺𝒇𝒆= 0.004 ≤ 0.75𝜺𝒇𝒖 (U-wraps with anchorage) 𝜀𝑓𝑢 = ultimate strain capacity of CFRP reinforcement
Figure 5-4 Proposed shear design equations – Option 1 (adapted from ACI 440.2R-08). In bold are modifications to ACI 440.2.R-08 provisions.
for α = 90°

243
Figure 5-5 Description of the variables used in FRP shear strengthening calculations
In Table 5-1, estimated shear strengths using the proposed guidelines (without the strength reduction factor ϕ = 0.75) are compared with experimental results for the filtered tests described in Section 4.1.3.5. The filtered experimental set only contains results from specimens with a shear span to depth ratio (a/d) of 3, and excludes any experiments in which the failure mode was not rupture of CFRP strips. As the table indicates, even without the strength reduction factor, the proposed guidelines produce shear estimates with a significant margin of safety.
Table 5-1 Comparison between stopped tests and tests to failure (a/d=3) Tests to failure
(24-3-1r,2,4,5,7,9,10, 48-3-2) (a)
Tests stopped before failure (48-3-1,3,5,6,7)
(b) All tests
Fc/Vc Fs/Vs Ff/Vf Fn/Vn Fc/Vc Fc/Vc Ff/Vf Fn/Vn Fc/Vc Fs/Vs Ff/Vf Fn/Vn
Mean No strength reduction factor (ϕ)
1.54 1.80 3.18 1.87 1.22 1.78 2.64 1.58 1.43 1.79 3.02 1.76
Coeff. of Variation No strength reduction factor (ϕ)
0.22 0.09 0.11 0.10 0.17 0.07 0.25 0.09 0.23 0.09 0.17 0.13
All other provisions of ACI 440.2R-08 apply to the proposed guidelines. These include
provisions for reinforcement limits, FRP strip spacing, and existing substrate strains.
Reinforcement limits
The total shear strength provided by reinforcement should be taken as the sum of the contribution of the FRP shear reinforcement and the steel shear reinforcement. The sum of the shear strengths provided by the shear reinforcements should be limited to prevent concrete crushing. ACI 440.2R-08 refers to ACI 318-05 that defines the limit with Equation 5-1:
𝑽𝒔 + 𝑽𝒇 ≤ 𝟖�𝒇𝒄′ 𝒃𝒘𝒅 (Eq. 5-1)

244
FRP strip spacing
For external FRP reinforcement in the form of discrete strips, the center-to-center spacing between the strips should not exceed the sum of d/4 plus the width of the strip. This limitation reflects the requirement that a minimum number of FRP strips cross the critical section.
Existing substrate strain
ACI 440.2R has a limitation on existing substrate strain. Unless all loads on a member, including self-weight and any prestressing forces, are removed before installation of FRP reinforcement, the substrate to which the FRP is applied will be strained. These strains should be considered as initial strains and should be excluded from the strain in the FRP. The initial strain level on the bonded substrate can be determined from an elastic analysis of the existing member, considering all loads that will be on the member during the installation of the FRP system. The elastic analysis of the existing member should be based on cracked section properties.
5.3.2 OPTION 2: Modified ACI 440.2R-08 Provisions Including Interaction Terms A second design option is presented here that improves shear strength estimates of beams
reinforced with CFRP. Similarly to Option 1, the proposed Option 2 is based on the shear design provisions of ACI 440.2R-08. In fact, Option 2 builds on the modifications of Option 1 on ACI 440 by introducing two new factors that account for the interactions between CFRP and transverse steel. Figure 5-6 summarizes the proposed shear design equations. The two additional factors, 𝑘𝑠 and 𝑘𝑓, are introduced to modify the ACI 440.2R-08 defined shear contributions of steel (termed here as Vs0) and CFRP (termed here as Vf0) respectively (Equations 5-4 and 5-5).
Steel (𝒌𝒔) and CFRP (𝒌𝒇) interaction factors
As observed experimentally, the efficiency of the CFRP shear strengthening depends on the amount of CFRP and the amount of transverse steel reinforcement. In essence, steel stirrups and CFRP strips are sharing the shear load across a critical shear crack. The more CFRP material that is provided, the stiffer that the CFRP strips will be and the more load they will attract. Conversely, the more steel stirrups that are present for a given amount of CFRP, the less shear load the CFRP will take. The shear contributions of CFRP and steel are not, however, directly related to the amounts of materials. Other factors such as changes in the inclination of the critical shear crack also influence the contribution of each material to shear strength. An empirical approach was taken to determine the interaction factors ks and kf. The shear database compiled by Birrcher (2009) was used in conjunction with experimental results of this study to determine the factors. The Birrcher database was filtered to include only beams with shear span to depth ratios (a/d) greater than 2.0 and stirrups with spacing less than d/2. In Figure 5-7 are plotted Vn/Vc versus Vn0/Vc=(Vc+Vs0)/Vc for the Birrcher database (where Vn = beam measured shear strength, Vc = concrete shear contribution according to ACI 440, Vn0 = beam estimated shear strength according to ACI 440, Vs0 = steel shear contribution according to ACI 440). One can note from that figure that, even without CFRP, the shear contribution of steel reinforcements is not linearly related to the amount of material. For simplicity, the rational function form shown below was considered to define both ks and kf factors.
y = ab+x

245
By trial-and-error, the following equations were found to fit experimental data well while providing simple and transparent equations for designers. The factors are a function of the ratio of steel and FRP contributions to concrete contribution. Both factors thus decrease as larger amounts of steel and FRP are used.
𝑘𝑠 = 8
4+𝑉𝑠0+𝑉𝑓0
𝑉𝑐
= 8𝑉𝑐4𝑉𝑐+𝑉𝑠0+𝑉𝑓0
, 𝑘𝑓 = 6𝑉𝑐4𝑉𝑐+𝑉𝑡0+𝑉𝑓0
𝜙𝑉𝑛 = 𝜙(𝑉𝑐 + 𝑉𝑠 + 𝜓𝑓𝑉𝑓) , ( 𝟎 ≤ 𝑽𝒔𝟎 + 𝑽𝒇𝟎 ≤ 𝟒𝑽𝒄) (Eq. 5-2) where 𝑉𝑐,𝑉𝑠,𝑉𝑓 = concrete, steel, and CFRP shear contributions
𝑉𝑠,𝑉𝑓 = steel and CFRP shear contributions considering interactions between materials
𝑉𝑠0,𝑉𝑓0 = steel and CFRP shear contributions without considering interactions between materials; same equations as ACI 440.2R-08
𝜙 = strength reduction factor = 0.75 ψf = additional reduction factors for CFRP shear reinforcement 0.90: U-wraps with anchorage
𝑉𝑐 = 2�𝑓𝑐′𝑏𝑤𝑑 (Eq. 5-3) 𝑽𝒔 = 𝒌𝒔𝑽𝒔𝟎 (Eq. 5-4) 𝑽𝒇 = 𝒌𝒇𝑽𝒇𝟎 (Eq. 5-5)
𝑉𝑠0 = 𝐴𝑠𝑣𝑓𝑠𝑦(𝑠𝑖𝑛 𝛼𝑠+𝑐𝑜𝑠 𝛼𝑠)𝑑
𝑠 (Eq. 5-6)
= 𝐴𝑠𝑣𝑓𝑠𝑦𝑑𝑠
𝑉𝑓0 = 𝐴𝑣𝑓𝑓𝑓𝑒(𝑠𝑖𝑛 𝛼+𝑐𝑜𝑠 𝛼)𝑑𝑓𝑣𝑠𝑓
(Eq. 5-7)
= 𝐴𝑣𝑓𝑓𝑓𝑒𝑑𝑓𝑣
𝑠𝑓
𝐴𝑣𝑓 = 2𝑡𝑓𝑤𝑓 (Eq. 5-8)
𝑓𝑓𝑒 = 𝜀𝑓𝑒𝐸𝑓 (Eq. 5-9) where
𝜺𝒇𝒆= 0.004 ≤ 0.75𝜺𝒇𝒖 (U-wraps with anchorage)
𝒌𝒔: steel interaction factor 𝒌𝒇: CFRP interaction factor
𝒌𝒔 = 𝟖𝑽𝒄𝟒𝑽𝒄+𝑽𝒔𝟎+𝑽𝒇𝟎
(Eq. 5-10) 𝒌𝒇 = 𝟔𝑽𝒄𝟒𝑽𝒄+𝑽𝒔𝟎 + 𝑽𝒇𝟎
(Eq. 5-11)
Figure 5-6 Proposed shear design equations – Option 2 (adapted from ACI 440.2R-08). In bold are modifications to ACI 440.2.R-08 provisions (see Figure 5-4 for term definitions).
(α=90°)
(αs=90°)

246
Figure 5-7 Comparison between ACI 440.2R-08 linear relation of transverse steel versus shear
contribution and test data
At 𝑉𝑠0 = 4𝑉𝑐 and Vfo = 0, the steel contribution will reach the limit of 𝑉𝑛 = 5 𝑉𝑐 and 𝑘𝑠 will be equal to 1. In this experimental program, the steel contribution to shear strength in test specimens was around 0.5𝑉𝑐 for #3@18” in 48 in. beams. With this layout, 𝑘𝑠 is 1.78. When the steel contribution (𝑉𝑠0) is equal to 𝑉𝑐, which is a typical reinforcement layout, 𝑘𝑠 is 1.6. These 𝑘𝑠 values (1.78 and 1.6) are roughly comparable to the increase in the steel shear contribution when the critical crack angle changes from 45 degrees (cot 45°=1) to 30 degrees (cot 30°≈1.73). The 𝑘𝑠 factor can therefore be considered to account for changes in the critical crack angle with varying reinforcement ratios. The ACI linear relationship between amount of transverse reinforcement and shear contribution of transverse reinforcement is shown by the dashed line in Figure 5-8 (b). As can be seen in the figure, the 𝑘𝑠 factor results in a higher steel contribution compared with the current ACI equations.
0
1
2
3
4
5
6
7
0 1 2 3 4 5 6
0
1
2
3
4
5
6
7
0 1 2 3 4 5 6
Vn/V
c0=
(Vc+
Vs)/
V c0
0
1
2
3
4
5
6
7
0 1 2 3 4 5 6
(Vc0 +Vs0)/Vc0
Best fit curve
Vc0
Vc
Vn(=
Vc
+Vs)/
Vc
(Vc +Vs0)/ Vc

247
(a) 𝑘𝑠 (b) 𝑘𝑠(𝑉𝑠0)
Figure 5-8 𝒌𝒔 and 𝑽𝒔(= 𝒌𝒔𝑽𝒔𝟎)
The marginal increase in steel contribution keeps decreasing as steel stirrups are added; as shown in Figure 5-9. Current code equations do not reflect this effect. Moreover, the steel contribution changes with the concrete capacity although the same amount of steel is placed because the ratio of steel capacity to concrete capacity changes. The CFRP contribution factor (𝑘𝑓) follows a similar interaction with the concrete.
Figure 5-9 Marginal increase in steel contribution
In Figure 5-10, shear contributions using 𝑘𝑠 are compared with shear contributions using ACI code provisions and experimental data from the Birrcher database. Both current and proposed equations are not conservative for a limited number of tests, but design capacities after applying a strength reduction factor are generally acceptable.
0.60.8
11.21.41.61.8
22.2
0 1 2 3 4 50
0.51
1.52
2.53
3.54
4.5
0 1 2 3 4 5
0
0.5
1
1.5
2
2.5
3
3.5
4
4.5
0 1 2 3 4 5
Vs0/Vc
ks
Max
Vf0=0
ksVs
0
Current Design
Vs0/Vc
Vs0/ Vc
Vs/V
c =ks
Vs0 /
Vc
Vs=8/5Vs0
1.6Vc
2.67Vc
3.43Vc
4Vc
1.07Vc
0.76Vc
0.57Vc
Vs=8/6Vs0
Vs=8/7Vs0
Vs=8/8Vs0
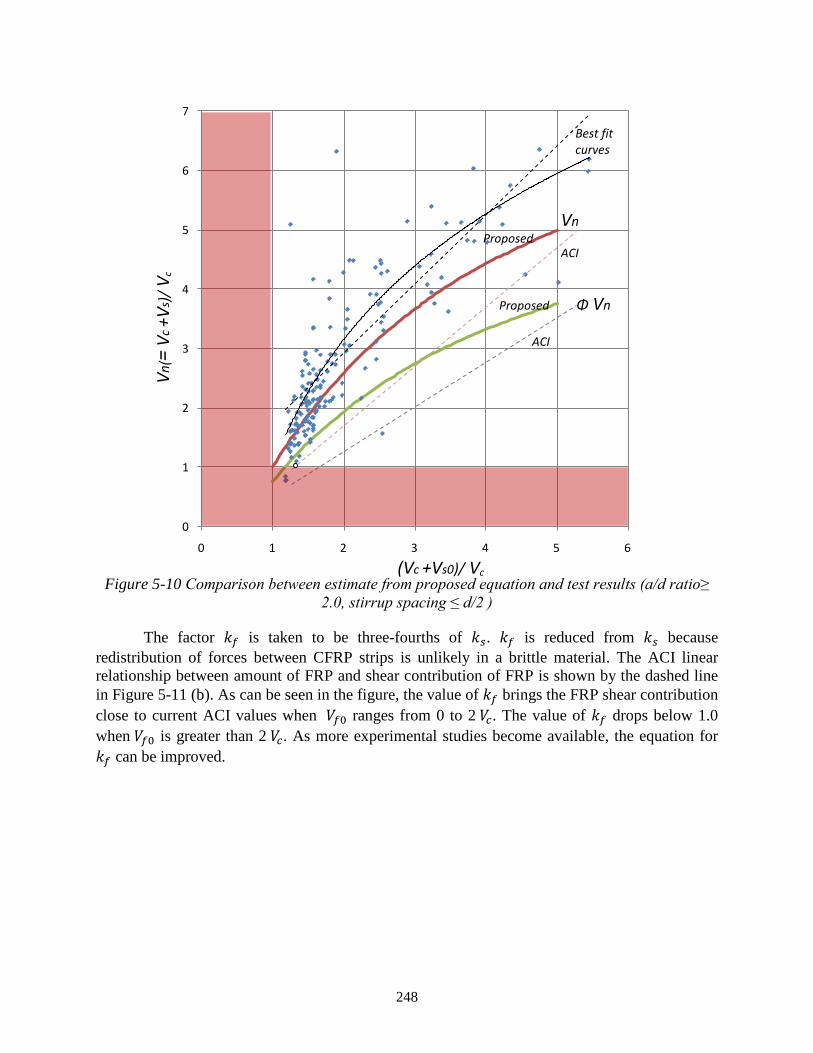
248
Figure 5-10 Comparison between estimate from proposed equation and test results (a/d ratio≥
2.0, stirrup spacing ≤ d/2 )
The factor 𝑘𝑓 is taken to be three-fourths of 𝑘𝑠. 𝑘𝑓 is reduced from 𝑘𝑠 because redistribution of forces between CFRP strips is unlikely in a brittle material. The ACI linear relationship between amount of FRP and shear contribution of FRP is shown by the dashed line in Figure 5-11 (b). As can be seen in the figure, the value of 𝑘𝑓 brings the FRP shear contribution close to current ACI values when 𝑉𝑓0 ranges from 0 to 2 𝑉𝑐. The value of 𝑘𝑓 drops below 1.0 when 𝑉𝑓0 is greater than 2 𝑉𝑐. As more experimental studies become available, the equation for 𝑘𝑓 can be improved.
0
1
2
3
4
5
6
7
0 1 2 3 4 5 6
(Vc +Vs0)/ Vc
Φ Vn
Vn
ACI
Best fit curves
Proposed
Proposed
ACI
Vn(=
Vc
+Vs)/
Vc

249
(a) 𝑘𝑓 (b) 𝑘𝑓(𝑉𝑓0)
Figure 5-11 𝒌𝒇 and 𝑽𝒇(= 𝒌𝒔𝑽𝒔𝟎)
Comparison with Experimental Results of this Study
In Figure 5-12, measured shear strengths of beam specimens tested under this study are compared with estimates using the proposed equations (Option 2) and current ACI 440 equations for completely wrapped systems (akin to Option 1).
(a) 48-3-1 ~4 (Vs0=0.41Vc) (b) 48-3-5~8 , 24-3-1~10 (Vs0=0.74 Vc)
Figure 5-12 Comparison between test results and estimates from proposed equations and ACI 440
Because two transverse steel ratios were used, two graphs are plotted. One plot is for tests 48-3-1~4 and the other is for tests 48-3-5~8 and tests 24-3-1~10. Test capacities are shown in diamond and triangle symbols. Furthermore, the points (open circles) on the proposed design curve indicate the estimate from proposed Option 2 equations at given areas of CFRP material. The ratios of measured to estimated strength are shown in Figure 5-13. The strengths computed from both methods are conservative for all tests, but strengths computed from Option 2 equations
0.60.8
11.21.41.61.8
22.2
0 1 2 3 4 50
0.51
1.52
2.53
3.54
4.5
0 1 2 3 4 5
0
1
2
3
4
5
0 1 2 3 4 50
1
2
3
4
5
0 1 2 3 4 5
(Vc +Vs0+Vf0)/Vc
Current ACI 440 Equation (linear)
Test data Estimates from equations for test specimens
Proposed: Curve for varying Vf and Vs=0
Proposed: Curve for varying Vf and V 0=0.41V
(Vc +Vs0+Vf0)/Vc
Vs=0
Vf=0
Test data Estimates from equations for test specimens
Proposed: Curve for varying Vf and Vs0=0.74Vc
Current ACI 440 Equation (linear)
Vn/V
c= (V
c +V
s+Vf
)/Vc
Vf0/Vc
kf
Max
Vs0=0
kfVf
0
Current Design
Vf0/Vc

250
exhibited less scatter. The strength ratios of beams strengthened with CFRP are generally greater than those of the control beams (48-3-1, 48-3-6, 24-3-2).
Because the loading on tests 48-3-1, 3, 5, 6 and 7 was stopped before the peak load was reached, the strength ratios for 48 in. beams are generally less than those for 24 in. beams. In addition, test 48-3-8 and 24-3-8 failed by fracture of anchors and test 24-3-9 failed by debonding, so the strength ratios for those beams are lower. The strength ratio of test 24-3-3 is excluded due to poor application of CFRP.
After eliminating the tests discussed above, the results for the remaining tests are shown in Figure 5-14. Although strength ratios varied considerably, the strength ratios for Option 2 design equations are closer to unity indicating a better fit with test data over ACI 440 or Option 1 estimates. The conservative strength ratios also indicate that an effective strain of 0.004 appears to be a conservative choice for beams with anchored U-wraps.
Figure 5-13 Comparison of measured shear capacities with estimates
0.80
1.00
1.20
1.40
1.60
1.80
2.00
2.20
48-3
-1
48-3
-2
48-3
-3
48-3
-4
48-3
-5
48-3
-6
48-3
-6r
48-3
-7
48-3
-8
24-3
-1R
24-3
-2
24-3
-4
24-3
-5
24-3
-6
24-3
-7
24-3
-8
24-3
-9
24-3
-10
Mean :1.76 Std: 0.22
Mean :1.42 Std: 0.18
Cont
rol
- Current ACI 440 equations - Proposed equations (option 2)
𝑉𝑡𝑡𝑡𝑡 𝑉𝑡𝑡𝑡𝑒𝑒𝑒𝑡𝑡

251
Figure 5-14 Comparison of measured shear capacities with estimates (U-wrap with anchor tests
only)
Further validation of proposed equations was performed on test data from Chaallal et al. (2002). That study investigated the interaction of steel and FRP contributions to shear strength of T-Beams strengthened with FRP U-wraps with no anchorage. Beams were tested with four different stirrup ratios and strengthened with 1 to 3 layers of FRP per strip. As shown in Figure 5-15, these test results provide data over a wide range of parameters for evaluating the proposed equations.
As shown in Figure 5-16, the measured capacity was generally about twice the estimated strength for both ACI 440 (completely wrapped) and Option 2 equations. The standard deviation of the ratio of measured capacity to estimated capacity was lower for Option 2 equations than ACI 440 equations. The ratio of test capacity to estimated capacity becomes smaller and closer to unity as the number of FRP layers increased; for both proposed and ACI equations. This validation exercise demonstrates that the proposed equations can also work with unanchored U-wrap systems.
0.8
1
1.2
1.4
1.6
1.8
2
2.2
48-3-2 24-3-1R 24-3-4 24-3-5 24-3-6 24-3-7 24-3-10
𝑉𝑡𝑡𝑡𝑡𝑉𝑡𝑡𝑡𝑒𝑒𝑒𝑡𝑡
Mean :1.93 Std: 0.13
Mean :1.56 Std: 0.10
- Current ACI 440 equations - Proposed equations (option 2)

252
Figure 5-15 Evaluation of proposed Option 2 equations using Chaallal et al. (2002) test results
Figure 5-16 Comparison between ACI 440.2R-08 and proposed Option 2 equations with tests
reported by Chaallal et al. (2002)
0
1
2
3
4
5
6
7
8
0 1 2 3 4 5
Vs0=0.44Vc
Vs0=0.88 Vc
Vs0=0.29Vc
Vs0=1.27Vc
Increasing number of FRP layers First point on curves = 0 layers, up to last point = 3 layers
(Vc +Vs0+Vf0)/Vc
Vn/V
c= (V
c +V
s+Vf
)/Vc
Test data
Estimates using proposed equations

253
5.4 Design Example To illustrate the use of the proposed Option 2 design equations, a design example for a
beam with the same configuration as the 48 in. beams tested in this study was developed. Several designs of anchored U-wrap CFRP systems performed using Option 2 are compared with several designs of completely wrapped and unanchored U-wrap systems performed using ACI 440.2R. The beam considered has a shear span to depth ratio is 3. The material strengths (𝑉𝑠 , 𝑉𝑓) in ACI 440 are the base capacities (𝑉𝑠0 , 𝑉𝑓0 ) in the proposed equations. Using Option 2, material shear contributions (𝑉𝑐 , 𝑉𝑠 , 𝑉𝑓 ) are evaluated after considering the interaction factors 𝑘𝑠 , 𝑘𝑓.
One to three layers of CFRP strengthening are considered in the comparisons. Contributions for beams with #3 stirrups @10” or #3@18” are summarized in Tables 5-2 and 5-3. Beam shear capacities, steel contributions, and CFRP contributions are plotted in Figure 5-17, Figure 5-18, and Figure 5-19 respectively.
CAUTION: this example is intended to illustrate the effects of varying the amounts of CFRP and stirrups on shear contribution of the various materials. Anchor details used in this study however, did not perform adequately in the limited work done using two-layer applications of CFRP, and should only be used with single-layer applications. More tests are needed to develop anchor details that can accommodate larger amounts of CFRP.
Table 5-2 Comparison of contributions for #3@10” between proposed and ACI equation
Vs =56.9k
Current ACI 440 U-wrap
(εfe=var.)
Current ACI 440 U-wrap+anchors
(εfe=0.004)
Proposed equation (ks, kf) U-wrap+anchors
(εfe=0.004) Vn Vc Vs Vf Vn Vc Vs Vf Vn Vc Vs Vf
No CFRP 133 76.4 56.9 133 76.4 56.9 172 76.4 95.9
1 layers 146 76.4 56.9 12.6 156 76.4 56.9 22.8 194 76.4 90.3 27.1
2 layers 150 76.4 56.9 16.8 179 76.4 56.9 45.6 213 76.4 85.2 51.3
3 layers 153 76.4 56.9 19.9 202 76.4 56.9 68.4 230 76.4 80.7 72.8
εfe =0.0021 (l layer), 0.0014(2layers) , 0.0011(3layers); All forces are in kips
Table 5-3 Comparison of contributions for #3@18” between proposed and ACI equation
Vs =31.6k
Current ACI 440 U-wrap
(εfe=var.)
Current ACI 440 U-wrap+anchors
(εfe=0.004)
Proposed equation (ks, kf) U-wrap+anchors
(εfe=0.004) Vn Vc Vs Vf Vn Vc Vs Vf Vn Vc Vs Vf
No CFRP 105 76.4 28.5 105 76.4 28.5 134 76.4 57.2
1 layers 117 76.4 28.5 12.6 128 76.4 28.5 22.8 159 76.4 53.6 29.1
2 layers 122 76.4 28.5 16.8 150 76.4 28.5 45.6 181 76.4 50.4 54.6
3 layers 125 76.4 28.5 19.9 173 76.4 28.5 68.4 201 76.4 47.6 77.4
All forces are in kips.

254
(a) #3@18” (b) #3 @10
Figure 5-17 Comparison of shear capacity between proposed and ACI equations
(a) #3@18” (b) #3 @10
Figure 5-18 Comparison of steel contribution between proposed and ACI equations
(a) #3@18” (b) #3 @10
Figure 5-19 Comparison of CFRP contribution between proposed and ACI equations
In Figure 5-17, the CFRP contribution for a beam with #3 stirrups at 18 in. spacing is greater than that for a 10 in. stirrup spacing based on the proposed Option 2 equations. That
020406080
100120140160180200220240260
020406080
100120140160180200220240260
0
20
40
60
80
100
0
20
40
60
80
100
0
20
40
60
80
0
20
40
60
80
Vs0
=1.27Vc
No.
Vn
1
2
Anchored U-wrap
ACI 0
3 No.
1
2
3
Anchored U-wrap
ACI
ACI
ACI
ACI 440
Vs
No.
1 2
3
0
Anchored U-wrap
ACI 440
0 Vn
No.
1 2
3
0
Anchored U-wrap
ACI 440
ACI 440
Vs
No.
1 2
3 0
No.
1 2
3
0
Anchored U-wrap Option 2
ACI 440 unanch
Vf (k)
Anchored U-wrap

255
CFRP contribution is the same for both transverse steel spacings based on ACI 440.2R equations. In addition, the CFRP contribution of anchored strips is much greater than that of unanchored strips and that difference becomes more evident when the number of CFRP layers increases.
The steel contribution using the proposed equations is greater when the number of CFRP layers is smaller and the marginal change in the steel contribution is smaller when the existing beam has a higher transverse steel ratio (Figure 5-18). The steel contribution using ACI 440 procedures remains constant regardless of the amount of CFRP.
The marginal increase in CFRP contribution from the proposed equations decreases as the number of CFRP layers increases (Figure 5-19). The CFRP contribution is estimated lower when the existing beam has a higher transverse steel ratio using Option 2. The CFRP contribution evaluated using ACI 440.2R is, on the other hand, proportional to the amount of CFRP material, regardless of the amount of transverse steel reinforcement. The CFRP contribution of unanchored U-wraps evaluated using ACI 440.2R decreases as the number of layers increases due to a decrease in the allowable effective strain.
In summary, the use of anchors can increase the CFRP contribution, thereby improving the effectiveness of the CFRP U-wraps. The proposed Option 2 equations take into account the interaction between the contributions to the shear capacity provided by the steel and CFRP. The proposed Option 2 equations result in a more consistent safety margin over a wide range of transverse reinforcement ratios.

256

257
Chapter 6. The Feasibility of Using FEM Programs to Simulate the Shear Capacity of CFRP-Strengthened Elements
6.1 Introduction Externally bonded carbon fiber-reinforced polymer (CFRP) composite systems have
received considerable attention as a promising shear strengthening system. For the last two decades, extensive experiments have been conducted on CFRP systems for strengthening elements subject to shear (Chajes et al. [1995]; Triantafillou et al. [1998]; Khalifa et al. [1998]; Al-Sulainmani et al. [1994]). These systems have shown potential to increase the shear strength and ductility of structural elements such as walls, columns, and girders/beams. The most common configurations of CFRP strengthening for shear capacity are side bonding, U-jacketing, and complete wrapping. Generally, shear capacity is governed by CFRP debonding for side bonding and U-jacketing configurations, and by CFRP fracture for complete wrapping. Anchor systems have been introduced for side bonding and U-jacketing to allow the CFRP material to reach higher strains after debonding.
Implementation of CFRP shear strengthening configurations will be enhanced by the development of numerical methods to predict the behavior of CFRP systems under shear. Such methods, however, are not readily available due to the lack of an in-depth understanding of 1) debonding and load transferring mechanisms between CFRP laminates and concrete, and 2) the behavior of anchors after CFRP laminates debonding occurs. Rational explanations of those issues are provided by reviewing previous studies and exploring the feasibility of numerical analysis of the shear capacity of CFRP-strengthened elements using FEM programs.
6.2 Methods
6.2.1 General analytical models The nominal shear capacity of a CFRP-strengthened concrete member can be determined
by adding FRP reinforcement to the contributions of the reinforcing steel and the concrete (ACI 440.2R), as shown in Equation 6-1.
𝑉𝑛 = 𝑉𝑐 + 𝑉𝑠 + 𝑉𝑓 (𝐴𝐶𝐼 440 𝑓𝑜𝑟𝑒𝑒𝑡) (Eq. 6-1)
Where 𝑉𝑓 represents the CFRP contribution The contribution of CFRP oriented at 0/45/90/135 degrees from a beam’s longitudinal
axis was computed by Chajes et al. (1995) assuming the following: 1) linear stress-strain behavior of CFRP laminates in tension, 2) failure is initiated at a concrete crack, and 3) perfect bonding between concrete and CFRP laminates before failure. The shear capacity of CFRP laminates was proposed in Equations 6-2 and 6-3 as:
𝑉𝑓 = 𝐴𝑓𝐸𝑓𝜀𝜐𝑐𝑣𝑑 (for CFRP oriented at 0/90 degrees) (Eq. 6-2) 𝑉𝑓 = 𝐴𝑓𝐸𝑓𝜀𝜐𝑐𝑣𝑑√2 (for CFRP oriented at 45/135 degrees ) (Eq. 6-3)
𝐴𝑓 = area of CFRP laminates per inch of beam 𝐸𝑓 = modulus of elasticity of CFRP laminates 𝑑 = depth of CFRP laminates

258
𝜀𝜐𝑐𝑣 = ultimate vertical tensile strain of concrete (𝜀𝜐𝑐𝑣 = 0.005 was taken as the average value)
Triantafillou et al. (2000) noted that the contribution of CFRP laminates could be computed by the classical truss analogy, which is applied in the same manner as for the contribution of internal steel shear reinforcement. The CFRP contribution to shear capacity is then written according to Eurocode format as Equation 6-4:
𝑉𝑓𝑟𝑝,𝑑 = 0.9𝛾𝑓𝑟𝑝
𝜌𝑓𝑟𝑝𝐸𝑓𝑟𝑝𝜀𝑓𝑟𝑝,𝑒𝑏𝑤𝑑(1 + cot𝛽) sin𝛽 (Eurocode format ) (Eq. 6-4)
Where 𝛾𝑓𝑟𝑝 = partial safety factor for CFRP 𝜌𝑓𝑟𝑝 = CFRP area fraction equal to 2tf/bw 𝐸𝑓𝑟𝑝 = CFRP elastic modulus 𝜀𝑓𝑟𝑝,𝑒 = effective CFRP strain tf = the thickness of CFRP strip 𝑏𝑤 = minimum width of cross-section over the effective depth 𝑑 = effective depth of cross-section 𝛽 = angle of strong CFRP orientation to longitudinal axis of the strengthened elements
Khalifa et al. (1998) also proposed a FRP contribution that is based on the approach used
to compute the shear contribution of steel reinforcement. The shear contribution of FRP is proposed in ACI 440 format in Equation 6-5 as:
𝑉𝑓 = 𝐴𝑓𝑣𝑓𝑓𝑒(𝑠𝑖𝑛𝛼+𝑐𝑜𝑠𝛼)𝑑𝑓𝑠𝑓
(𝐴𝐶𝐼 𝑓𝑜𝑟𝑒𝑒𝑡) (Eq. 6-5)
Where 𝑡𝑓 = spacing CFRP shear reinforcing 𝐴𝑓𝑣 = 2𝑛𝑡𝑓𝑤𝑓, area of CFRP external laminates 𝑑𝑓 = depth of CFRP laminates 𝛼 = angle representing the inclination of CFRP laminates 𝑓𝑓𝑒 = 𝜀𝑓𝑒𝐸𝑓, effective stress in the CFRP
Effective strain in FRP laminates
For the models mentioned above, the only unknown is the effective strain εfe, which represents the maximum stain that can be achieved in the FRP system. This strain is governed by the anticipated failure mode of the FRP system, mainly debonding and fracture of FRP laminates.
In the early studies, the value of effective strain was either estimated from experimental experience or assumed to be equal to the ultimate tensile strain of concrete. These two approaches underestimate the contribution of FRP laminates and produce conservative design shear values.

259
Triantafillou (1998) is the first document to base effective strain on the analysis of experimental results to establish a relationship between 𝜌𝑓𝑟𝑝𝐸𝑓𝑟𝑝 that depends on FRP axial rigidity and effective strain. The effective strain for debonding is given as Equations 6-6 and 6-7:
𝜀𝑓𝑟𝑝,𝑒 = 0.0119 − 0.0205�𝜌𝑓𝑟𝑝𝐸𝑓𝑟𝑝� + 0.0104�𝜌𝑓𝑟𝑝𝐸𝑓𝑟𝑝�2
𝑤ℎ𝑡𝑛 0 ≤ 𝜌𝑓𝑟𝑝𝐸𝑓𝑟𝑝 ≤ 1 𝐺𝑝𝑒
𝜀𝑓𝑟𝑝,𝑒 = −0.00065�𝜌𝑓𝑟𝑝𝐸𝑓𝑟𝑝� + 0.00245 𝑤ℎ𝑡𝑛 𝜌𝑓𝑟𝑝𝐸𝑓𝑟𝑝 ≥ 1 𝐺𝑝𝑒 (Eqs. 6-6 and 6-7)
where 𝐸𝑓𝑟𝑝 is the CFRP elastic modulus and 𝜌𝑓𝑟𝑝 is the CFRP area fraction which the equal to 2tf/bw; tf = the thickness of CFRP strip; 𝑏𝑤 = minimum width of cross-section over the effective depth.
In 2000, Triantafillou et al. (2000) considered both the influence of the tensile strength and the two possible failure modes (debonding and fracture of CFRP). Based on experimental results, the updated equations are given in Equations 6-8 and 6-9:
𝜀𝑓,𝑒 = 0.00065 �𝑓𝑐2/3
𝐸𝑓𝜌𝑓�0.56
(𝑑𝑡𝑏𝑜𝑛𝑑𝑒𝑛𝑔 𝑓𝑒𝑒𝑙𝑢𝑟𝑡 𝑒𝑜𝑑𝑡) (Eq. 6-8)
𝜀𝑓,𝑒 = 0.17 �𝑓𝑐2/3
𝐸𝑓𝜌𝑓�0.3𝜀𝑓,𝑢 (𝐶𝐹𝑅𝑃 𝑓𝑟𝑒𝑐𝑡𝑢𝑟𝑡) (Eq. 6-9)
Where 𝜀𝑓,𝑒 represents effective strain in CFRP laminates; 𝐸𝑓 is the elastic modulus of CFRP laminates; 𝜌𝑓is the CFRP area fraction; fc is the compressive strength of concrete; 𝜀𝑓,𝑢 is the ultimate CFRP tensile strain.
In 1998, Khalifa et al. (1998) introduced the ratio R to represent the relationship between effective strain and ultimate strain. The effective strain is computed from Equations 6-10 and 6-11.
𝜀𝑓𝑒 = 𝑅𝜀𝑓𝑢 (Eq. 6-10)
When 𝜌𝑓𝑟𝑝𝐸𝑓𝑟𝑝 ≤ 1.1 𝐺𝑝𝑒
𝑅 = 0.5622�𝜌𝑓𝑟𝑝𝐸𝑓𝑟𝑝�2− 1.2188�𝜌𝑓𝑟𝑝𝐸𝑓𝑟𝑝� + 0.778 ≤ 0.5 (Eq. 6-11)
When 𝜌𝑓𝑟𝑝𝐸𝑓𝑟𝑝 ≥ 1.1 𝐺𝑝𝑒, the failure mode is governed by debonding, which relates to 1) 𝑑𝑓 depth of CFRP laminates, 2) tf thickness of CFRP laminates on one side of beam, 3) Efrp elastic modulus of CFRP laminates, 4) wfe effective length of CFRP strips, 5) Le effective bond length, 6) εfu ultimate strain in CFRP laminate, and 7) f’
c nominal concrete compressive strength. Moreover, Khalifa et al. (1998) adjusted for three surface bond configurations. The reduction factor R was then rewritten as follows in Equations 6-12 and 6-13:
𝑅 = 0.0042�𝑓𝑐′�2/3
𝑤𝑓𝑒
�𝐸𝑓𝑟𝑝𝑡𝑓�0.58
𝜀𝑓𝑢𝑑𝑓 (Eq. 6-12)
Where the effective length for complete wrapping is

260
𝑤𝑓𝑒 = 𝑑𝑓 (Eq. 6-13)
The effective length for U-wrap is given in Equation 6-14:
𝑤𝑓𝑒 = 𝑑𝑓 − 𝐿𝑒 (Eq. 6-14) The effective length for side bond is given in Equation 6-15:
𝑤𝑓𝑒 = 𝑑𝑓 − 2𝐿𝑒 (Eq. 6-15) Equations 6-10 to 6-15 have been cited by ACI 440 for the design of CFRP systems that
contribute to shear strength. Based on additional test results, Khalifa et al. (2000) defined the values of R as the least
of the values obtained from Equations 6-11, 6-16, and 6-17. Equations 6-16 and 6-17 are given as follows:
𝑅 = �𝑓𝑐′�2/3
𝑤𝑓𝑒
𝜀𝑓𝑢𝑑𝑓�738.93 − 4.06�𝐸𝑓𝑟𝑝𝑡𝑓��× 10−6 (Eq. 6-16)
𝑅 = 0.006𝜀𝑓𝑢
(Eq. 6-17)
In 2002, definition of R was redefined by Pellegrino et al. (2002) replacing Equation 6-
16. The reduction factor of R is then given by the least of equation 6-11, 6-17, and 6-18.
R=𝑅∗ �0.0042(𝑓𝑐)2/3𝑤𝑓𝑒/ ��𝐸𝑓𝑟𝑝𝑡𝑓�0.58
𝜀𝑓𝑢𝑑�� (Eq. 6-18)
In which
𝑅∗ = the reduction factor which is 0 ≤ 𝑅∗ = −0.53𝑙𝑛𝜌𝑠,𝑓 + 0.29 ≤ 1 (Eq. 6-19)
𝜌𝑠,𝑓 = CFRP area fraction 𝜌𝑠,𝑓 = 𝐸𝑠𝐴𝑠𝑤𝐸𝑓𝐴𝑓
(Eq. 6-20)
6.3 Parameters Affecting FRP Behavior in Shear
6.3.1 Non-uniform strain distribution in CFRP The models mentioned above provide conservative methods for the design of CFRP
systems in shear applications. Such models do not predict from a fundamental level the behavior of CFRP systems under shear load since: 1) all lack theoretical explanations for the reduction factor R, which was obtained from either experimental data or empirical analysis; 2) a uniform effective strain was applied to compute the shear contribution of CFRP, but in reality the strain distribution in CFRP system is non-uniform; and 3) the bond strength models provided from Chajes et al. (1995), Triantafillou et al. (1998, 2000), Khalifa et al. (1998, 2000), Al-Sulainmani et al. (1994), ACI 440, and Pellegrino (2002) failed to predict the effective bond length (Chen et al. [2001]), which depends on the location of the shear crack relative to the ends of the CFRP (Chen et al. [2003a]). In summary, such models do not account for the strain distribution in
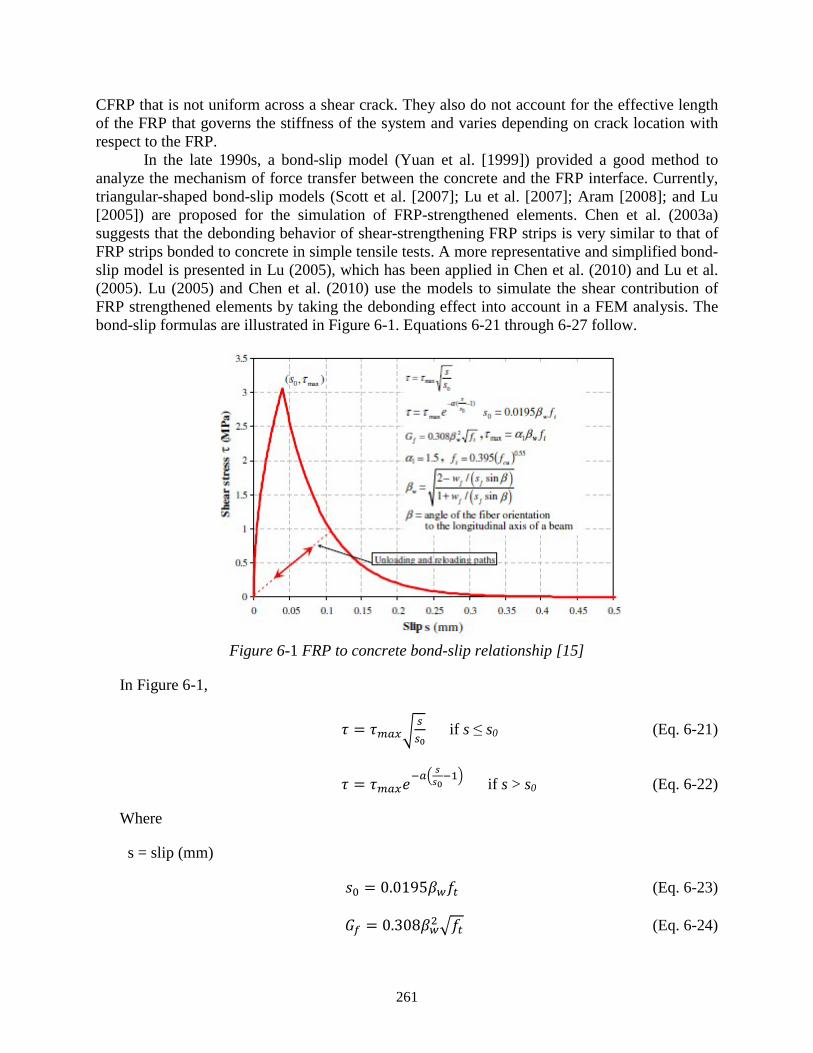
261
CFRP that is not uniform across a shear crack. They also do not account for the effective length of the FRP that governs the stiffness of the system and varies depending on crack location with respect to the FRP.
In the late 1990s, a bond-slip model (Yuan et al. [1999]) provided a good method to analyze the mechanism of force transfer between the concrete and the FRP interface. Currently, triangular-shaped bond-slip models (Scott et al. [2007]; Lu et al. [2007]; Aram [2008]; and Lu [2005]) are proposed for the simulation of FRP-strengthened elements. Chen et al. (2003a) suggests that the debonding behavior of shear-strengthening FRP strips is very similar to that of FRP strips bonded to concrete in simple tensile tests. A more representative and simplified bond-slip model is presented in Lu (2005), which has been applied in Chen et al. (2010) and Lu et al. (2005). Lu (2005) and Chen et al. (2010) use the models to simulate the shear contribution of FRP strengthened elements by taking the debonding effect into account in a FEM analysis. The bond-slip formulas are illustrated in Figure 6-1. Equations 6-21 through 6-27 follow.
Figure 6-1 FRP to concrete bond-slip relationship [15]
In Figure 6-1,
𝜏 = 𝜏𝑚𝑎𝑥�𝑠𝑠0
if s ≤ s0 (Eq. 6-21)
𝜏 = 𝜏𝑚𝑎𝑥𝑡−𝑎� 𝑠𝑠0
−1� if s > s0 (Eq. 6-22)
Where
s = slip (mm)
𝑡0 = 0.0195𝛽𝑤𝑓𝑡 (Eq. 6-23)
𝐺𝑓 = 0.308𝛽𝑤2�𝑓𝑡 (Eq. 6-24)

262
𝛼 = 1𝐺𝑓
𝜏𝑚𝑎𝑥𝑠0−23
(Eq. 6-25)
𝑓𝑡 = 0.395(𝑓𝑐𝑢)0.55 (Eq. 6-26)
𝛽𝑤 = �2−𝑤𝑓/�𝑠𝑓 sin𝛽�1+𝑤𝑓/�𝑠𝑓 sin𝛽�
(Eq. 6-27)
Where β= angle of the fiber orientation to the longitudinal axis of a beam.
6.3.2 Influence of anchorage Anchorage systems have been introduced to prevent the premature failure of the FRP
configurations of side debonding and U-wrap. Carolin et al. (2005) indicated that the potential use of anchors may change the failure mode of FRP strengthened elements. It is therefore reasonable to assume that 1) effectively anchored connections will never fail before FRP fracture, 2) before debonding the tensile force in the FRP will decay exponentially toward the anchored end (Chen et al. [2001]), once the FRP starts to peel off, this debonding trend propagates quickly (Chen et al. [2001]) and results in a more even strain distribution in FRP laminates.
6.3.3 Influence of internal transverse steel reinforcement Pellegrino (2002) suggested that increasing the amount of transverse steel reinforcement
results in decreasing the efficiency of the shear contribution of FRP strips. Therefore, the ratios between transverse steel reinforcement and FRP reinforcement should be considered in the FRP-rehabilitated design.
6.4 Feasibility of the Application of FEM Program Currently, commercial FEM software such as ANSYS is used to simulate the interactions
at the interface of different materials. This software may provide a reasonable approach to analyze the problems of the interaction between transverse reinforcement and externally bonded CFRP shear reinforcement.
Lu et al. (2005) are among the few to successfully apply a FEM model to simulate the shear transfer from FRP to concrete along the cracking area of beam, as illustrated in Figure 6-2. The FRP laminates could be modeled by the LINK1 element in ANSYS, and the bond-slip model is ideally simulated by the COMBIN39 element to analyze the interface behavior between concrete and FRP laminates. There are two nodes on the COMBIN 39. One element connected to FRP elements and the other connected to concrete elements. Displacements are applied at the end of FRP strip to simulate the opening crack using a prescribed crack width distribution. It may be a possible approach to simulate the bonding behavior of anchor area by constructing the FRP elements on the nodes of concrete elements.

263
a) Computational models b) Finite element models based on a)
Figure 6-2 Computational models and its finite element models
While such FEM work is promising in terms of simulating the interactions between concrete elements and FRP reinforcements, much remains to be done in the field before FRP-reinforced beam elements can be fully modeled. As presented in previous chapters, the shear crack angle and crack width distribution is critical to the efficacy and contribution of FRP reinforcements. Therefore a FEM model that can accurately predict shear cracking in beams is the first essential part in efforts to simulate FRP reinforcing effects. FEM models with the required crack prediction accuracy are not yet available and are stifled by numeric convergence problems. Furthermore, even though the existing bond-slip models (Lu et al. [2007]; Aram [2008]; and Lu [2005]) have shown promise for simulating one-directional debonding typical of flexural and tensile strengthening situations, FRP strips subjected to shear tend to debond both along and across the strips. This bi-directional debonding associated with shear strengthening cannot be easily simulated. Besides, lack of numeric convergence can be expected if slip in one direction is much larger than in the other direction. Finally, the application of an anchor may change the local debonding mechanism; which makes it harder to predict the distribution of effective strains. There are no FEM models yet for the anchorage systems of interest in this study; given the novelty of the anchors. FEM models that properly capture the behavior of FRP anchors are essential to accurately simulating the behavior of FRP-reinforced beams. The development of anchor FEM models is not within the scope of this project and is left for future work.
6.5 Conclusions 1. The shear contribution of CFRP laminates can be expressed by the same formula used to
calculate to the shear contribution of internal steel reinforcement. However, the shear contribution of CFRP laminates is uneven along the concrete elements due to the non-uniform distribution of the effective strain and the brittle nature of FRP material.
2. Bond-slip models for the interaction between concrete and CFRP laminates take into account both the influence of crack propagation and shear transfer between concrete and CFRP laminates.
264
3. A perfect connection could be assumed between concrete and FRP laminates around the anchor zone. An effectively anchored connection therefore will never fail before FRP fracture. Before debonding, the tensile force in the FRP decays exponentially toward the anchors. After debonding, an even strain distribution in the FRP from the loaded end to the anchor end can be expected until FRP fracture or anchor failure occurs.
4. The following issues need to be better understood before a FEM program can be designed to predict the shear behavior of CFRP-strengthened elements:
1) The effect of the application of anchors to the local debonding mechanism.
2) The influence of internal transverse steel and FRP reinforcements on cracking and load transfer.
3) The bi-directional debonding mechanism induced by diagonal cracking.
4) The behavior of the anchorage region itself.

265
Chapter 7. Conclusions
7.1 Overview of Project The feasibility of using carbon fiber reinforced polymers (CFRP) for shear strengthening
of large bridge girders was investigated in this study. Particularly, the external U-wrap application of CFRP sheets anchored with CFRP anchors was the focus of the project. Although many tests have been done on small elements to show the efficiency of CFRP anchors and sheets, data were needed where large elements are to be strengthened to carry substantial shear forces. Also, there has been only limited work done regarding the effect of creep of polymer materials and anchors under sustained or fatigue loads.
An extensive experimental program was undertaken on several full-scale T-beams and I-girders to achieve project objectives. Sixteen tests were conducted under monotonically increasing loading on 24 in.-deep T-beams. Eight monotonic tests were conducted on 48in.-deep T-beams. Two 24in.-deep beams were tested under sustained loading and two 24 in.-deep beams were tested under fatigue loading. Finally, four tests were conducted on 54 in.-deep pre-stressed I-girders. Key parameters investigated in the experimental program included: 1) beam shear span to depth ratio, 2) beam depth, 3) beam or girder shape, 4) amount of transverse steel, 5) amount and layout of CFRP sheets, 6) amount and layout of CFRP anchors (including tests without anchorage), and 7) surface preparation.
From the experimental program, guidelines for designing and installing anchored CFRP shear strengthening systems were developed. Specific anchor design and installation guidelines were also presented.
7.2 Conclusions: Experimental Program Based on the test results, the following conclusions are drawn with respect to the effects
of key parameters on the performance of anchored CFRP systems.
1. Shear span to depth ratio The anchored U-wrap CFRP shear strengthening system was found to be more effective
for beams with a shear span to depth ratio (a/d) above 2. For beams with an a/d ratio of 3, CFRP increased beam shear strength by up to 50%. For beams with a/d ratio of 1.5, CFRP shear strengthening did not result in much shear strength increase; less than 15% for the same CFRP layout as in longer beams. CFRP strengthening does not appear to be effective for beams with an a/d ratio less than 2.
2. Beam depth Although a direct comparison between 24 in. and 48 in. deep beams could not be made
due to some differences in the loading applied to the beams beam depth did not seem to significantly affect the shear contribution of the CFRP because both series of beams were large compared with many tests reported in the literature.

266
3. Amount of transverse steel and CFRP reinforcements Steel stirrups and CFRP U-wraps share the shear load across a critical shear crack
depending on the stiffness of each material. The more transverse steel is provided the more load it attracts and the less the applied CFRP contributes to shear strength. Conversely, the more CFRP is applied the more load it attracts and the less steel stirrups contribute to shear strength. Current shear design codes do not account for such an effect.
An increase in the amount of CFRP strengthening does not, therefore, produce a proportional increase in shear strength. In the I-girder tests, the section that was completely wrapped using continuous sheets and the section that was wrapped with intermittent strips having only half the amount of CFRP, produced the same increase in shear capacity of the girder. The test results indicate that there is an upper bound on the amount of shear strength gain that can be achieved using CFRP.
4. CFRP layout
a. Continuous versus discrete strips
Both continuous sheet and discrete strip layouts were investigated for anchored U-wrap applications. Shear performance of both layouts were comparable. Continuous sheet layouts showed slight benefits in terms of added redundancy and better stress distribution. However, the main disadvantage of using continuous sheet applications is that cracks and concrete damage cannot be monitored after installation.
b. Strip inclination
Both vertical and inclined (at 45 degrees) CFRP U-wrap applications were investigated. Shear performance of both layouts were comparable after the angle of inclination is taken into account. Inclined applications, however, are more difficult to install as strips need to be lapped at the bottom of beams and cannot be applied in a U-wrap fashion as the vertical strips.
c. Unidirectional versus bidirectional applications
In I-girders, unidirectional anchored U-wraps as well as bidirectional applications consisting of anchored U-wraps and anchored horizontal sheets were investigated. The unidirectional application did not result in much shear strength increase whereas the bidirectional applications produced about 40% shear strength gains. It is not clear what mechanisms are at play in the bidirectional applications that improve performance given that only two bidirectional tests were conducted on one I-girder type. Additional testing is necessary to understand the role of bidirectional applications regarding shear strength and to provide design recommendations for such applications.
5. CFRP anchor layout
a. Number of anchors
In general, it was found that a larger number of smaller anchors is preferable because increased redundancy and reduced stress concentrations are achieved.
b. Anchor inclination
Tests were conducted where anchor holes were not drilled perpendicular to the concrete surface. A deviation of anchor holes from perpendicular of up to 10 degrees did not adversely influence the performance.

267
6. Different CFRP materials Materials from three CFRP manufacturers were investigated. The three materials
performed adequately, but inconsistencies in manufacturer reported material properties lead to large differences between test results and shear design equation estimates. A consistent reporting of material properties in needed from manufacturers.
7.3 General Conclusions: System Performance and Applicability From the extensive experimental study, several conclusions can be drawn with respect to
the design, efficiency, and limitations of anchored CFRP systems used for shear strengthening.
1. Efficacy of CFRP anchors Experiments with unanchored externally bonded CFRP only showed about a 5% shear
strength increase whereas anchored applications showed shear strength increases of up to 50%. CFRP anchors were able to mobilize the full capacity of CFRP sheets leading to failures due to rupture of CFRP strips and not debonding of the CFRP sheets. The use of CFRP anchors is, therefore, highly recommended to increase the efficacy of externally applied CFRP systems. By eliminating the highly variable debonding failure mechanism, CFRP anchors also produced more reliable strengthening systems.
2. Reduced surface preparation requirements for anchored systems In tests where anchored CFRP sheets were not bonded to the concrete substrate, CFRP
anchors were able to fully develop the CFRP sheets and allowed the strips to fracture at beam failure. Such a finding demonstrates that the bond between concrete and CFRP sheets is not essential for improving shear strength when anchors are provided. However, it is still important to provide a clean and smooth concrete surface to apply the CFRP sheets to avoid protrusions that can generate stress concentrations in the CFRP sheets and for controlling crack development. The role of surface preparation was not investigated for bidirectional applications but appears to be important in controlling crack width and improving overall performance.
3. Importance of proper installation In a test where the CFRP sheets were not adequately placed flush with the concrete
surface, a premature failure occurred with the CFRP system barely contributing much to the shear strength of the beam. Proper installation is therefore critical to the performance of the CFRP strengthening system.
4. Fatigue performance of strengthened beams Two beams strengthened with CFRP were subjected to about 3.5 million load cycles at
very high load values (significantly higher than what is expected in the service life of a bridge girder). The beams performed very well during the fatigue loading portion and showed only small strength decreases when tested to failure following the fatigue loading. The fatigue performance of the studied externally-applied and anchored CFRP system is therefore deemed acceptable. It was noted that proper bond between CFRP sheets and the concrete surface improved fatigue performance.
268
5. Sustained loading performance of strengthened beams Two beams strengthened with CFRP were loaded to approximately 50% of their ultimate
capacity and the load was maintained for over a year. Strains and crack widths did not increase significantly over the loading period and stabilized fairly rapidly. The sustained loading performance of the studied externally-applied and anchored CFRP system is therefore deemed acceptable.
7.4 Design Guidelines Design guidelines for shear strengthening of RC beams using externally bonded and
anchored CFRP U-wrap systems were presented. The guidelines are closely based on ACI 440.2R-08 shear strengthening provisions for externally bonded FRP systems. The guidelines do not apply to prestressed members nor members with a shear span to depth ratios smaller than 2.0. Two NCHRP reports regarding the use of CFRP materials for shear strengthening were also studied and used in the development of the design guidelines.
Two options are provided for designing CFRP shear strengthening systems:
• Option 1: A direct use of ACI 440.2R-08 provisions that utilizes an effective strain value for U-wrapped applications with anchors that is the same as specified for completely wrapped applications.
• Option 2: A modified version of ACI 440.2R-08 provisions that introduces two factors that account for transverse steel and CFRP interactions.
The first option is presented as it is easy to use and familiar to designers of CFRP shear
strengthening systems. However, this method does not take into account the interactions between transverse steel and CFRP. As a result, this first option provides a conservative approach for design. The second option modifies ACI 440.2R-08 provisions to take into account the interactions between steel and CFRP. It results in strength estimates that more closely reflect the shear strengths observed in this research study and those reported by other researchers. In both options, the maximum allowable CFRP strain for anchored U-wrap systems is taken as 0.004 just as is recommended in ACI 440.2R-08 for completely wrapped systems. In essence, properly anchored systems can achieve the same CFRP shear strengthening efficiency as completely wrapped systems.
One small difference was introduced for anchored systems from completely wrapped systems. A small modification was introduced to the factor ψf for anchored systems that is an additional strength reduction factor to account for the relative reliability of each CFRP application system. This factor is given in ACI 440.2R-08 as 0.95 for completely wrapped systems that are quite reliable in their application. The factor is given as 0.85 for the less reliable U-wraps and side bonded applications. A value of 0.90 is chosen here for anchored U-wrap systems, as their reliability is deemed to be intermediate between the other two cases.
7.5 Future Work The proposed anchored U-wrap CFRP system has proven to be very effective in shear
strengthening of rectangular reinforced concrete beams. In a bidirectional application, the system has proven effective in shear strengthening of pre-stressed I-girders. Further investigations are needed to extend the application to other beam geometries. Furthermore, since only two I-girder

269
tests with bidirectional CFRP applications were conducted, further investigations into the mechanisms that drive shear strengthening efficiency of bidirectionally applied CFRP are needed to produce design guidelines for such applications.
Proper CFRP installation was found to be critical in achieving the strength gains from CFRP systems. Further research is needed into quality assurance and quality control methods for ensuring that design CFRP shear strength can be reliably achieved in the field.

270

271
References
AASHTO (2007), AASHTO LRFD Bridge Design Specifications, 4th edition, Washington, DC, USA.
ACI-ASCE Committee 445 (1998). Recent Approaches to Shear Design of Structural Concrete. Journal of Structural Engineering, Vol. 124, No. 12, pp. 1375-1417.
ACI Committee 318 (2008). Building Code Requirements for Structural Concrete (ACI 318-08), American Concrete Institute, Farmington Hills, Michigan, USA
ACI Committee 440 (2004). Guide Test Methods for Fiber-Reinforced Polymers (FRPs) for Reinforcing or Strengthening Concrete Structures.(ACI 440.3R-04), American Concrete Institute, Farmington Hills, Michigan, USA
ACI Committee 440 (2006). Guide for the Design and Construction of Structural Concrete Reinforced with FRP Bars (ACI 440.1R-06), American Concrete Institute, Farmington Hills, MI, USA.
ACI Committee 440 (2007) Report on Fiber-Reinforced Polymer (FRP) Reinforcement for Concrete Structures.(ACI 440R-07), American Concrete Institute. Farmington Hills, MI, USA
ACI Committee 440 (2008). Guide for the Design and Construction of Externally Bonded FRP Systems for Strengthening Concrete Structures (ACI 440.2R-08), American Concrete Institute, Farmington Hills, Michigan, USA
Adhikary, Bimal Babu, and Mutsuyoshi, Hiroshi (2004). "Behavior of Concrete Beams Strengthened in Shear with Carbon Fiber Sheets," Journal of Composites for Construction, 258-264.
Adhikary, Bimal Babu and Mutsuyoshi, Hiroshi (2006). "Shear strengthening of RC beams with web-bonded continuous steel plates," Construction and Building Materials, Vol. 20, No. 5, pp. 296-307.
Ahmed, Ehab A., El-Salakawy, Ehab F. et al. (2008). "Tensile Capacity of GFRP Postinstalled
Adhesive Anchors in Concrete," Journal of Composites for Construction, Vol. 12, No. 6, pp. 596-607.
Aidoo, J., Harries, K.A., & Petrou, M.F. (2004). “Fatigue of Carbon Fiber Reinforcement Polymer-Strengthened Reinforced Concrete Bridge Girders,” Journal of Composites for Construction, 8 (6), 501-509.
Arduini, Marco and Nanni, Antonio (1997). "Behavior of Precracked RC Beams Strengthened with Carbon FRP Sheets," Journal of Composites for Construction, Vol. 1, No. 2, pp. 63-70.
Alrousan, R. Z., Issa, M. A., and Issa, M.A. (2009). “Size Effect of Reinforce Beams on Shear Contribution of CFRP Composite,” The Ninth International Symposium on Fiber Reinforced Polymer Reinforcement for Concrete Structures. Sydney, Australia, FRPRCS-9, pp.1-4
Al-Sulaimani, G. J., Sharif, A., Basunbul, I. A., Baluch, M. H., & Ghaleb, B. N. (1994). “Shear Repair for Reinforced Concrete by Fiberglass Plastic Bonding,” ACI Structural Journal, 91 (3), 458-464.
Al-Sulaimani, G. J., Shariff, A., Basanbul, I. A., Baluch, M.H, and Ghaleb, B. N. (1994), “Shear Repair of Reinforced Concrete by FiberGlass Plate Bonding,” ACI Structural Journal, Vol.91, No.4, pp.458-464.

272
Aram, M. R., Czaderski, C., and Motavalli, M. (2008), “Debonding Failure Modes of Flexural FRP-strengthened RC Beams,” Composites: Part B, Vol. 39, pp. 826-841.
ASTM D3039-07 (2007), Standard Test Method for Tensile Properties of Polymer Matrix Composite Materials, American Society for Testing Materials, (ASTM International).
Bakis, C. E., Bank, L. C., Brown, Vol. L., Cosenza, E., Davalos, J. F., Lesko, J. J., Machida, A., Rizkalla, S. H., and Trianatfillou, T. C. (2002), “Fiber-Reinforced Polymer Composites for Construction – State of the Art Review,” Journal of Composites for Construction, Vol. 6, No. 2, pp. 73-87.
Bank, Lawrence C. (2006), Composites for Construction – Structural Design with FRP Materials, John Wiley and Sons, Inc., Hoboken, New Jersey.
Barros, J., and Dias, S. (2003). “Shear Strengthening of Reinforced Concrete Beams with Laminate Strips of CFRP,” Proceedings, International Conference on Composites in Constructions (CCC2003), Italy, pp. 289-294.
Barros, J., and Dias, S. (2006). “Near Surface Mounted CFRP Laminates for Shear Strengthening of Concrete Beams,” Cement & Concrete Composites, Vol. 28, No. 3, pp. 276-292.
Basler, M., White, D., and Desroches, M. (2005). “Shear Strengthening with Bonded CFRP L-Shaped Plates,” SP 230 7th International Symposium on Fiber-Reinforced Polymer (FRP) Reinforcement for Concrete Structures, American Concrete Institute, pp. 373-384.
Birrcher, David (2009). Design of Reinforced Concrete Deep Beams for Strength and Serviceability, The Univesity of Texas at Austin, Ph.D Dissertation
Bonacci, J. F. and Maalej, M. (2001). "Behavioral Trends of RC Beams Strengthened with Externally Bonded FRP," Journal of Composites for Construction, Vol. 5, No. 2, pp. 102-113.
Bousselham, A., and Chaallal, O. (2004). "Shear Strengthening of Reinforced Concrete Beams with Fiber Reinforced Polymer: Assessment of Influencing Parameters and Required Research," ACI Structural Journal, Vol. 101, No. 2, pp. 219-227.
Bousselham, Abdelhak and Chaallal, Omar (2006a). "Behavior of Reinforced Concrete T-Beams Strengthened in Shear with Carbon Fiber Reinforced Polymer—An Experimental Study," ACI Structural Journal, Vol. 103, No. 3, pp. 339-347.
Bousselham, Abdelhak and Chaallal, Omar (2006b). "Effect of transverse steel and shear span on the performance of RC beams strengthened in shear with CFRP," Composites Part B: Engineering, Vol. 37, No. 1, pp. 37-46.
Bousselham, A., and Chaallal, O. (2008). "Mechanisms of Shear Resistance of Concrete Beams Strengthened in Shear with Externally Bonded FRP," Journal of Composites for Construction, Vol. 12, No. 5, pp. 499-512.
Brena, S.F., Benouaich, M.A., Kreger, M.E., & Wood, S.L. (2005). “Fatigue Tests of Reinforced Concrete Beams Strengthened Using Carbon Fiber-Reinforced Polymer Composites.” ACI Structural Journal, 102 (2), pp. 305-313.
Cao, S. Y., Chen, J. F., Teg J. G., Hao, Z., and Chen, J. (2005). "Debonding in RC Beams Shear Strengthened with Complete FRP Wraps," Journal of Composites for Construction, Vol. 9, No. 5, pp. 417-428.
Carolin, A., and Taljsten, B. (2005a). "Experimental Study of Strengthening for Increased Shear Bearing Capacity," Journal of Composites for Construction, Vol. 9, No. 6, pp. 488-496.
Carolin, A., and Taljsten, B. (2005b). "Theoretical Study of Strengthening for Increased Shear Bearing Capacity," Journal of Composites for Construction, Vol. 9, No. 6, pp. 497-506.

273
Ceroni, F., Pecce, M., Matthys, S., and Taerwe, L. (2008). "Debonding Strength and Anchorage Devices for Reinforced Concrete Elements Strengthened with FRP Sheets," Composites Part B: Engineering, Vol. 39, No. 3, pp. 429-441.
Ceroni, F. and Pecce, M. (2010). "Evaluation of Bond Strength in Concrete Elements Externally Reinforced with CFRP Sheets and Anchoring Devices," Journal of Composites for Construction, Vol. 14, No. 5, pp. 521-530.
Chaallal, O., Shahawy, M., Hassan, M. (2002). "Performance of reinforced concrete T-girders strengthened in shear with carbon fiber-reinforced polymer fabric," ACI Structural Journal, Vol. 99, No. 3, pp. 335-343.
Chajes, M. J., Thomson, T. A., Januszka, T. F., and Finch, W. W. (1994). "Flexural strengthening of concrete beams using externally bonded composite materials," Construction and Building Materials, Vol. 8, No. 3, pp. 191-201.
Chajes, M. J., Januszka, T. F., Mertz, D. R., Thomson, T. A., and Finch, W. W. (1995). "Shear Strengthening of Reinforced Concrete Beams Using Externally Applied Composite Fabrics," ACI Structural Journal, Vol. 92, No. 3, pp. 295-303.
Chen, G. M., Chen, J. F. and Teng, T. G. (2010) “On the Finite Element Modeling of RC Beams Shear-Strengthened with FRP,” Construction and Building Materials, in press— available online at online, doi:10.1016/j.conbuildmat.2010.11.101.
Chen, J. F., and Teng, J. G. (2001). "Anchorage Strength Models for FRP and Steel Plates Bonded to Concrete," Journal of Structural Engineering, Vol. 127, No. 7, pp. 784-791.
Chen, J. F., and Teng, T. G. (2003a), “Shear Capacity of FRP Strengthened RC Beams: FRP Debonding,” Construction Building Materials, Vol. 17, No.1, pp. 27-41.
Chen, J. F., and Teng, J. G. (2003a). "Shear Capacity of Fiber-Reinforced Polymer-Strengthened Reinforced Concrete Beams: Fiber Reinforced Polymer Rupture," Journal of Structural Engineering, Vol. 129, No. 5, pp. 615-625.
Chen, J. F. and Teng, J. G. (2003b). "Shear capacity of FRP-strengthened RC beams: FRP debonding," Construction and Building Materials, Vol. 17, No. 1, pp. 27-41.
Chen, G. M., Teng, J. G., Chen, J. F., and Rosenboom, O. A. (2010). "Interaction between Steel Stirrups and Shear-Strengthening FRP Strips in RC Beams," Journal of Composites for Construction, Vol. 14, No. 5, pp. 498-509.
Choi, K., Meshgin, P., and Taha, M. M. R. (2007). “Shear Creep of Epoxy at the Concrete-FRP Interfaces,” Composites Part B: Engineering, 38 (5-6), 772-780.
De Lorenzis, L., and Nanni, A. (2001a). “Shear Strengthening of Reinforced Concrete Beams with Near-Surface Mounted Fiber-Reinforced Polymer Rods,” ACI Structural Journal, Vol. 98, No. 1, pp. 60-68.
De Lorenzis, L., and Nanni, A. (2001b), “Characterization of NSM FRP Rods as Near Surface Mounted Reinforcement,” Journal of Composites for Construction, Vol. 4, pp. 114-121.
Deifalla, A. and Ghobarah, A. (2006). “Calculating the Thickness of FRP Jacket for Shear and Torsion Strengthening of RC Girders T-Girders,” Third International Conference on FRP Composites in Civil Engineering. CICE 2006. Miami, Florida.
Deniaud, C., and Cheng, J. R. (2000). “Shear Rehabilitation of G-Girder Bridges in Alberta Using Fiber Reinforced Polymer Sheets,” Canadian Journal of Civil Engineering, 27, 960-971.
Deniaud, C., and Cheng, J. J. Roger (2001). "Shear Behavior of Reinforced Concrete T-Beams with Externally Bonded Fiber-Reinforced Polymer Sheets," ACI Structural Journal, Vol. 98, No. 3, pp. 386-394.

274
Deniaud, C., and Cheng, J. J. Roger (2003). "Reinforced Concrete T-beams Strengthened in Shear with Fiber Reinforced Polymer Sheets," Journal of Composites for Construction, Vol. 7, No. 4, pp. 302-310.
Deniaud, Christophe and Cheng, J. J. Roger (2004). "Simplified Shear Design Method for Concrete Beams Strengthened with Fiber Reinforced Polymer Sheets," Journal of Composites for Construction, Vol. 8, No. 5, pp. 425-433.
El-Hacha, R., & Wagner, M. (2009). “Shear Strengthening of Reinforced Concrete Beams Using Near-Surface Mounted CFRP Strips,” Ninth International Symposium on Fiber Reinforced Polymer Reinforcement of Concrete Structures, FRPRCS-9 Sydney, Australia: (CD-ROM). (pp. 1-4).
Eshwar, N., Nanni, A., and Ibell, T. J. (2008). "Performance of Two Anchor Systems of Externally Bonded Fiber-reinforced Polymer Laminates," ACI Materials Journal, Vol. 105, No. 1, pp. 72-80.
Ferrier, E., Bigaud, D., Clement, J.C., and Hamelin, P. (2011). “Fatigue-Loading Effect on RC Beams Strengthened with Externally Bonded FRP,” Construction and Building Materials, 25 (2), 539-546.
Forrest, R. W. B., Higgins, C., and Senturk, A. E. (2010). “Experimental and Analytical Evaluation of Reinforced Concrete Girders under Low-Cycle Shear Fatigue” ACI Structural Journal, 107 (20), 199-207.
Grande, E., Imbimbo, M., Rasulo, A. (2009). "Effect of Transverse Steel on the Response of RC Beams Strengthened in Shear by FRP: Experimental Study," Journal of Composites for Construction, Vol. 13, No. 5, pp. 405-414.
Gussenhoven, R., and Brena, S. F. (2005). “Fatigue Behavior of Reinforced Concrete Beams Strengthened with Different FRP Laminate Configurations,” SP 230 7th International Symposium on Fiber-Reinforced Polymer (FRP) Reinforcement for Concrete Structures, American Concrete Institute, pp. 613-630.
Harries, K.A., Reeve, B., and Zorn, A. (2007). “Experimental Evaluation of Factors Affecting Monotonic and Fatigue Behavior of Fiber-Reinforced Polymer-to-Concrete Bond in Reinforced Concrete Beams,” ACI Structural Journal, 104 (6), 667-674.
Hoult, N., and Lees, J. (2005). “Long-Term Performance of a CFRP Strap Shear Retrofitting System,” SP 230 7th International Symposium on Fiber-Reinforced Polymer (FRP) Reinforcement for Concrete Structures, American Concrete Institute, pp. 685-704.
Hoult, N. A., and Lees, J. M. (2009). "Efficient CFRP Strap Configurations for the Shear Strengthening of Reinforced Concrete T-Beams," Journal of Composites for Construction, Vol. 13 No. 1, pp. 45-52.
Hoult, N. A., and Lees, J. M. (2009). “Modeling of an Unbonded CFRP Strap Shear Retrofitting System for Reinforced Concrete Beams,” Journal of Composites for Construction, 13 (4), 292-301.
Islam, M. R., Mansur, M. A. et al. (2005). "Shear Strengthening of RC Deep beams Using Externally Bonded FRP Systems," Cement and Concrete Composites, Vol. 27, No. 3, pp. 413-420.
Japanese Society of Civil Engineers (JSCE). (1997). “Recommendations for Design and Construction of Concrete Structures Using Continuous Fiber Reinforcing Materials,” Concrete Engineering Series , 23 . (A. Machida, Ed.), Tokyo, Japan.
Jirsa, James O and Kim, Yungon et al. (2011). “Shear Strengthening of Bridge Girders Using Cfrp Sheets and Anchors,” fib Symposium, Prague, 2011, pp.1137-1140

275
Khalifa, A., Alkhrdaji, T. et al. (1999). "Anchorage of Surface Mounted FRP Reinforcement," Concrete International, Vol. 21, No. 10, pp. 49-54.
Khalifa, Ahmed, Gold, William J. et al. (1998). "Contribution of Externally Bonded FRP to Shear Capacity of RC Flexural Members," Journal of Composites for Construction, Vol. 2, No. 4, pp. 195-202.
Khalifa, A., Gold, W., and Nanni, A., (2000), “Shear Performance of RC Members Strengthened with Externally Bonded FRP Wraps,” Proceedings, 12th World Conference on Earthquake Engineering, Auckland, New Zealand.
Khalifa, A., and Nanni, A. (2000). "Improving shear capacity of existing RC T-section beams using CFRP composites," Cement and Concrete Composites, Vol. 22, No. 3, pp. 165-174.
Khalifa, A., and Nanni, A. (2002). "Rehabilitation of rectangular simply supported RC beams with shear deficiencies using CFRP composites," Construction and Building Materials, Vol. 16, No. 3, pp. 135-146.
Kim, I. (2008). Use of CFRP to Provide Continuity in Existing Reinforced Concrete Members Subjected to Extreme Loads. Deparment of Civil, Environmental and Architectural Engineering. Austin, Texas, The University of Texas at Austin. Ph.D Dissertation.
Kim, S. J., and Smith, S. T. (2009). “Shear Strength and Behavior of FRP Spike Anchors in Cracked Concrete,” Ninth International Symposium on Fiber Reinforced Polymer Reinforcement for Concrete Structures, Sydney, Australia, FRPRCS-9: pp. 1-4 (CD-ROM).
Kim, S. J., and Smith, S. T. (2010). "Pullout Strength Models for FRP Anchors in Uncracked Concrete," Journal of Composites for Construction, Vol. 14, No. 4, pp 406-414.
Kim, Y. (2011). Shear Behavior of Reinforced Concrete T-Beams Strengthened with Carbon Fiber Reinforced Polymer (CFRP) Sheets and CFRP Anchors. Austin, TX, University of Texas at Austin, PhD Dissertation, pp. 405
Kim, Y. et al. (2011) “Shear Strengthening RC T-beams Using CFRP Laminates and Anchors,” Proceedings of the 10th International Symposium on Fiber-Reinforced Polymer (FRP) Reinforcement for Concrete Structures,.FRPRCS- 10 (ACI SP275-36), Tampa, Florida, April, 2011, pp. 1- 17
Kobayashi, K., Fujii, S., Yabe, Y., Tsukagoshi, H., & Sugiyama, T. (2001). Advanced Wrapping System with CF-Anchor. FRP-128 , pp.1-10.
Kobayashi, K., Fujii, S. et al.(2001). Advanced Wrapping System with CF Anchor-Stress Transfer Mechanism of CF Anchor. Proceedings of the 5th International Symposium on Fiber-Reinforced Polymer (FRP) Reinforcement for Concrete Structures,. FRPRCS-5. Cambridge, U.K. , pp. 379-388.
Kobayashi, K., Kanakubo, T., and Jinno, Y. (2004). “Seismic Retrofit of Structures Using Carbon Fibers,” VIII Simposio Nacional De Ingenieria Sismica, pp. 1-21.
Leung, C., Chen, Z., Lee, S., Mandy, N., Ming, X., and Tang, J. (2007), “Effect of Size on the Failure of Geometrically Similar Concrete Beams Strengthened in Shear with FRP Strips,” Journal of Composites for Construction, Vol. 11, No. 5, pp. 487-496.
Lu, X.Z., Ye, L. P., Teng, J. G., and Rotter, J. M. (2005), “Theoretical Analysis of FRP Stress Distribution in U Jacketed RC Beams,” Proceeding. 3rd Int. Conference on Composites Construction (CCC2005), July, Lyon, France, pp.541-548.
Lu, X.Z., Teng, J. G., Ye, L. P. and Jiang, J.J. (2005). “Bond-Slip Models for FRP Sheets/Plates Bonded to Concrete,” Engineering Structure, Vol. 27, pp.920-937.

276
Lu, X. Z., Teng, J. G., Ye, L. P., and Jiang, J. J. (2007). “Intermediate Crack Debonding in FRP-Strengthened RC Beams: FE Analysis and Strength Model,” Journal of Composites for Construction, Vol. 11, No. 2, pp.161-174.
Lu, X. Z., Chen, J. F., et al. (2009). "RC Beams Shear-strengthened with FRP: Stress Distributions in the FRP Reinforcement," Construction and Building Materials, Vol. 23, No. 4, pp. 1544-1554.
Maalej, M., and Bian, Y. (2001). "Interfacial Shear Stress Concentration in FRP-strengthened Beams," Composite Structures, Vol. 54, No. 4, pp. 417-426.
Maalej, M., and Leong, K. S. (2005). "Effect of Beam Size and FRP Thickness on Interfacial Shear Stress Concentration and Failure Mode of FRP-strengthened Beams," Composites Science and Technology, Vol. 65, No. 7-8, pp. 1148-1158.
Maeda, T., Asano, Y. et al. (1997). "A Study on Bond Mechanism of Carbon Fiber Sheets, Proceedings of the 3rd International Symposium," Non-Metallic (FRP) reinforcement for concrete structures, Vol., No. 1, pp 279-286.
Malek, A. M., Saadatmanesh, H. (1998a). "Analytical Study of Reinforced Concrete Beams Strengthened with Web-Bonded Fiber Reinforced Plastic Plates or Fabrics," ACI Structural Journal, Vol. 95, No. 3, pp. 343-352.
Malek, A. M., and Saasatmanesh, H. (1998b). "Ultimate Shear Capacity of Reinforced Concrete Beams Strengthened with Web-Bonded Fiber-Reinforced Plastic Plates," ACI Structural Journal, Vol. 95, No. 4, pp. 391-399.
Malvar, L. J., Warren, G. E., and Inaba, C. (1995). “Rehabilitation of Navy Pier Beams with Composite Sheets,” Non-Metallic (FRP) Reinforcement for Concrete Structures; Proceedings of the 2nd International RILEM Symposium, London, England, pp. 534-540.
Martin, J. A., and Lamanna, A. J. (2008). "Performance of Mechanically Fastened FRP Strengthened Concrete Beams in Flexure," Journal of Composites for Construction, Vol. 12, No. 3, pp 257-265.
Monti, G., and Liotta, M. A. (2005). “FRP-Strengthening in Shear: Tests and Design Equations,” Proceedings, 7th International RILEM Symposium on Non-Metallic (FRP) Reinforcement for Concrete Structures (FRPRCS-7), Kansas City, Missouri, USA, pp. 543-562.
NCHRP Report 514 (2004). Bonded Repair and Retrofit of Concrete Structures Using FRP Composites—Recommended Construction Specifications and Process Control Manual. Transportation Research Board. Washington, DC, USA.
NCHRP Report 655 (2010). Recommended Guide Specification for the Design of Externally Bonded FRP Systems for Repair and Strengthening of Concrete Bridge Elements. Transportation Research Board. Washington, DC, USA.
NCHRP Report 678 (2011). Design of FRP Systems for Strengthening Concrete Girders in Shear, Transportation Research Board. Washington, DC, USA.
Nishizaki, I., Labossiere, P., and Sarsaniuc, B. (2007). “Durability of CFRP Sheet Reinforcement through Exposure Tests.” SP 230 7th International Symposium on Fiber-Reinforced Polymer (FRP) Reinforcement for Concrete Structures, American Concrete Institute, pp. 1419-1428.
Nozaka, Katsuyoshi, Shield, Carol K. et al. (2005). "Effective Bond Length of Carbon-Fiber-Reinforced Polymer Strips Bonded to Fatigued Steel Bridge I-Girders," Journal of Bridge Engineering, Vol. 10, No. 2, pp. 195-205.
Ortega, C. A., Belarbi, A. et al. (2009). “End Anchorage of Externally Bonded FRP Sheets for the Case of Shear Strengthening of Concrete Girders,” The Ninth International
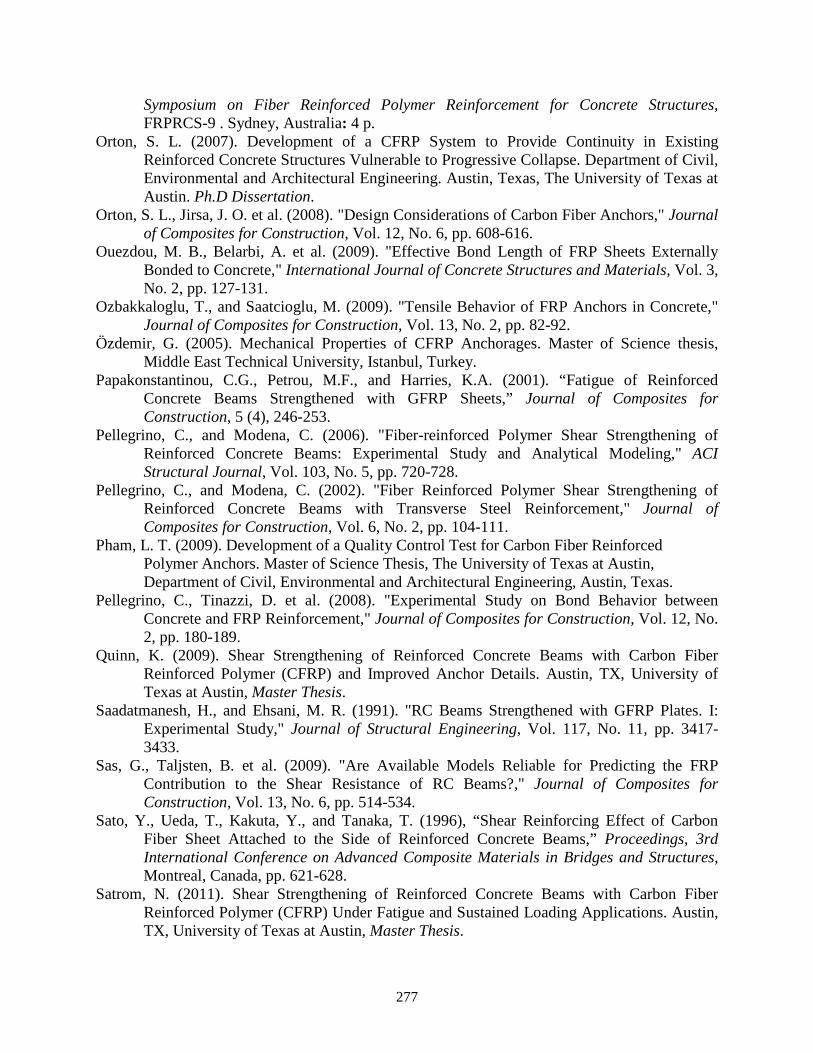
277
Symposium on Fiber Reinforced Polymer Reinforcement for Concrete Structures, FRPRCS-9 . Sydney, Australia: 4 p.
Orton, S. L. (2007). Development of a CFRP System to Provide Continuity in Existing Reinforced Concrete Structures Vulnerable to Progressive Collapse. Department of Civil, Environmental and Architectural Engineering. Austin, Texas, The University of Texas at Austin. Ph.D Dissertation.
Orton, S. L., Jirsa, J. O. et al. (2008). "Design Considerations of Carbon Fiber Anchors," Journal of Composites for Construction, Vol. 12, No. 6, pp. 608-616.
Ouezdou, M. B., Belarbi, A. et al. (2009). "Effective Bond Length of FRP Sheets Externally Bonded to Concrete," International Journal of Concrete Structures and Materials, Vol. 3, No. 2, pp. 127-131.
Ozbakkaloglu, T., and Saatcioglu, M. (2009). "Tensile Behavior of FRP Anchors in Concrete," Journal of Composites for Construction, Vol. 13, No. 2, pp. 82-92.
Özdemir, G. (2005). Mechanical Properties of CFRP Anchorages. Master of Science thesis, Middle East Technical University, Istanbul, Turkey.
Papakonstantinou, C.G., Petrou, M.F., and Harries, K.A. (2001). “Fatigue of Reinforced Concrete Beams Strengthened with GFRP Sheets,” Journal of Composites for Construction, 5 (4), 246-253.
Pellegrino, C., and Modena, C. (2006). "Fiber-reinforced Polymer Shear Strengthening of Reinforced Concrete Beams: Experimental Study and Analytical Modeling," ACI Structural Journal, Vol. 103, No. 5, pp. 720-728.
Pellegrino, C., and Modena, C. (2002). "Fiber Reinforced Polymer Shear Strengthening of Reinforced Concrete Beams with Transverse Steel Reinforcement," Journal of Composites for Construction, Vol. 6, No. 2, pp. 104-111.
Pham, L. T. (2009). Development of a Quality Control Test for Carbon Fiber Reinforced Polymer Anchors. Master of Science Thesis, The University of Texas at Austin, Department of Civil, Environmental and Architectural Engineering, Austin, Texas.
Pellegrino, C., Tinazzi, D. et al. (2008). "Experimental Study on Bond Behavior between Concrete and FRP Reinforcement," Journal of Composites for Construction, Vol. 12, No. 2, pp. 180-189.
Quinn, K. (2009). Shear Strengthening of Reinforced Concrete Beams with Carbon Fiber Reinforced Polymer (CFRP) and Improved Anchor Details. Austin, TX, University of Texas at Austin, Master Thesis.
Saadatmanesh, H., and Ehsani, M. R. (1991). "RC Beams Strengthened with GFRP Plates. I: Experimental Study," Journal of Structural Engineering, Vol. 117, No. 11, pp. 3417-3433.
Sas, G., Taljsten, B. et al. (2009). "Are Available Models Reliable for Predicting the FRP Contribution to the Shear Resistance of RC Beams?," Journal of Composites for Construction, Vol. 13, No. 6, pp. 514-534.
Sato, Y., Ueda, T., Kakuta, Y., and Tanaka, T. (1996), “Shear Reinforcing Effect of Carbon Fiber Sheet Attached to the Side of Reinforced Concrete Beams,” Proceedings, 3rd International Conference on Advanced Composite Materials in Bridges and Structures, Montreal, Canada, pp. 621-628.
Satrom, N. (2011). Shear Strengthening of Reinforced Concrete Beams with Carbon Fiber Reinforced Polymer (CFRP) Under Fatigue and Sustained Loading Applications. Austin, TX, University of Texas at Austin, Master Thesis.

278
Schuman, P. M. (2004), Mechanical Anchorage for Shear Rehabilitation of Reinforced Concrete Structures with FRP: An Appropriate Design Approach, Ph.D. Dissertation, Department of Structural Engineering, University of California, UCSD, San Diego, CA, USA.
Scott T. S., and Rebecca J. G. (2007), “Modeling Debonding Failure in FRP Flexurally Strengthened RC Members Using a Local Deformation Model,” Journal of Composites for Construction, Vol. 11, No. 2, pp.184-191.
Teng, J. G., Smith, S. T., et al. (2003). "Intermediate Crack-Induced Debonding in RC Beams and Slabs," Construction and Building Materials, Vol. 17, No. 6-7, pp. 447-462.
Teng, J. G., Lam, L., and Chen, J. F. (2004). “Shear Strengthening of RC Beams with FRP Composites,” Progress in Structural Engineering Materials, Vol. 6, pp. 173-184.
Teng, J. G. and Yao, J. (2007). "Plate End Debonding in FRP-plated RC Beams -II: Strength Model," Engineering Structures, Vol. 29, No. 10, pp. 2472-2486.
Triantafillou, T. C. (1998). "Shear Strengthening of Reinforced Concrete Beams Using Epoxy-bonded FRP Composites," ACI Structural Journal, Vol. 95, No. 2, pp. 107-115.
Triantafillou, T. C. (1998). "Composites: A New Possibility for the Shear Strengthening of Concrete, Masonry and Wood," Composites Science and Technology, Vol. 58, No. 8, pp. 1285-1295.
Triantafillou, T. C., and Antonopoulos, C. P. (2000). "Design of Concrete Flexural Members Strengthened in Shear with FRP," Journal of Composites for Construction, Vol. 4, No. 4, pp. 198-205.
Ueda, T., and Dai, J. (2005). "Interface Bond between FRP Sheets and Concrete Substrates: Properties, Numerical Modeling and Roles in Member Behavior," Progress in Structural Engineering and Materials John Wiley & Sons Ltd., Vol. 7, No. 1, pp. 27-43.
Uji, K. (1992). "Improving Shear Capacity of Existing RC Concrete Members by Applying Carbon Fiber Sheets," Transactions of the Japan Concrete Institute, Vol. 14, pp. 253-256.
Wu, Z., Shao, Y., et al. (2007). "Strengthening of Preloaded RC Beams Using Hybrid Carbon Sheets," Journal of Composites for Construction, Vol. 11, No. 3, pp. 299-307.
Yang, D., Hong, S., and Park, S. (2007). Experimental Observation on Bond-Slip Behavior between Concrete and CFRP Plate. International Journal of Concrete Structures and Materials, 1 (1), 37-43.
Yang, D. (2007). “Update on FRP Composites for Repair of Bridges in Texas”, TxDOT 81st Short Course, a presentation (Section 17), College Station, Texas, USA.
Yang, X., and Nanni, A. (2002). “Lap Splice Length and Fatigue Performance of Fiber-Reinforced Polymer Laminates,” ACI Materials Journal, Vol. 99, No. 4, pp. 386-392.
Yuan, H., and Wu, Z. (1999), “Interfacial Fracture Theory in Structures Strengthened with Composite of Continuous Fiber,” Proceedings, Symp. Of China and Japan: Sci and Technol. of 21st Century, Tokyo, Sept., pp. 142-155.
Zhang, Z. and Hsu, C.-T. T (2005). "Shear Strengthening of Reinforced Concrete Beams Using Carbon-fibre-reinforced Polymer Laminates," Journal of Composite for Construstion, Vol. 9, No. 2, pp. 158-169.

279
Appendix A: Installation Procedures for CFRP Sheets and Anchors, Specifications for Fabrication and Installation of CFRP Anchors,
and CFRP Shear Design Recommendations
A1. Installation Procedures for CFRP Sheets and Anchors
Surface preparation Since anchors provided in this project are able to fully develop the ultimate strength of
the CFRP sheets, bond between CFRP and concrete is not essential structurally. Surface preparation for anchored CFRP applications can therefore be simplified compared to surface preparation for unanchored bond-critical CFRP applications. For anchored applications, it is recommended that the concrete surface should be clean, free of any loose material, and smooth (i.e., limited roughness and no protrusions).
ACI 440.2R-08 recommends that all 90 degree corners be rounded to a radius of 0.5-in. to minimize stress concentrations in the CFRP at the corners. In this experimental program, T-beam specimens were cast with chamfered corners. For the I-beam specimens, the corners of the soffit and any sharp edges were smoothed (Figure A-1).
Figure A-1 Bottom corner of I-beam is rounded to prevent a local failure of the CFRP
CFRP anchor hole preparation The proper preparation of a CFRP anchor hole plays a key role in the overall strength of
the CFRP anchor. Improper preparation of the hole can create locations where high stress concentrations can develop within the CFRP anchor.
Drilling the hole into the concrete specimen is the first step (Figure A-2 [a]). Recommended hole dimensions are discussed in Section A2. A standard hammer drill is used to abrasively bore into the concrete specimen. It is recommended that a new drill bit be used when

280
drilling these holes. Old, dull, and worn bits will chip excessive amounts of concrete away from the edge of the anchorage hole, creating locations of high stress in the CFRP anchor.
Abrasively drilling into the concrete specimen produces a large amount of debris. Most of the debris is discharged from the anchorage hole through the flutes of the concrete drill bit; however, a small amount of debris remains in the hole after completing the drilling procedure. This debris can affect the bond strength between the concrete anchor and the surface of the prepared anchor hole and, therefore, must be removed. A vacuum cleaner with an adapted nozzle (designed to fit into the anchorage hole) quickly and effectively removed all debris from the anchorage hole, as shown in Figure A-2 (b).
(a) (b)
Figure A-2: (a) Hole drilled into the concrete specimen; (b) removing debris from the anchorage hole
A drilled anchorage hole that has been cleared of all debris is shown in Figure A-3. This image shows that the edge of the concrete hole is rough. This rough edge can easily produce areas of high stress in the CFRP anchor. Therefore, an abrasive masonry bit was used to round the edge of all anchorage holes to a radius of 0.25-in. to 0.5-in. depending on the particular anchorage detail being studied (see Section A2 for more detail). The anchorage holes need only be rounded to the required radius along the edge that contacts the anchorage fan.

281
Figure A-3 Drilled and cleared anchorage hole
When one-way CFRP anchors were used, the anchorage holes were only rounded along one side of the hole, as shown in Figure A-4. For bidirectional anchors, anchorage holes were rounded all around the hole.
Figure A-4 Completed preparation of CFRP anchorage hole
Wet lay-up procedure A common procedure used to install carbon fiber materials in practice is known as the
wet lay-up procedure. In this procedure, the carbon fiber sheets are first impregnated with a high strength structural epoxy and then adhered to the concrete substrate. This method is popular for small scale applications where the carbon fiber materials can be easily handled by one or two workers.
Specific volumes of the two epoxy components are measured. One component consists of a high strength resin while the other component is a chemical hardener which reacts with the resin, causing the epoxy to set. Vapors from one component can react with the second component, causing portions of the material to begin setting up. This causes the overall strength of the epoxy to decrease. Therefore, it is important to keep the two components separate until they are ready for use.

282
Once the proper proportions of the two components are obtained, they are poured together and mixed thoroughly with an electric mixer, as shown in Figure A-5.
Figure A-5 Mixing the two components of the epoxy together
As the two components are combined, air is churned into the mixture. This causes the initial epoxy mixture to become opaque as many tiny air bubbles are suspended in the solution (Figure A-6). These air bubbles are temporary as they will slowly dissipate to the surface.
Figure A-6 Completed high strength structural epoxy
The next step in the procedure involves placing some of the high strength structural epoxy onto the surface of the concrete specimen. This step is known as wetting the surface. Using a small nap paint roller, a small amount of epoxy is applied to the surface of the concrete (Figure A-7). This allows epoxy to fill holes and other minor surface depressions in the concrete. The surface must first be coated with epoxy where carbon fiber materials are to be installed.

283
Figure A-7 Wetting the surface of the concrete specimen
The inner surface of the prepared anchor holes must be coated as well. This surface is wet with epoxy using a swab made of a small amount of carbon fiber fabric bundled together with a rebar tie (Figure A-8). Lining the hole with a layer of epoxy helps to fill any voids along the surface of the hole created by the abrasive drilling procedure.
Figure A-8 Wetting the drilled anchor hole with epoxy
Once all surfaces that are in contact with the CFRP laminates have been wet, the installation of the carbon fiber sheets can begin. The key distinction between the wet lay-up and dry lay-up procedures exists in the point in the process where the CFRP sheets are impregnated with epoxy. In the wet lay-up procedure, the sheets are impregnated before they are applied to the surface of the beam; whereas in the dry lay-up procedure, the sheets are first applied to the concrete surface and then impregnated with epoxy.
During the wet lay-up procedure, the CFRP sheets are laid on the ground on a clean sheet of heavy duty plastic. Using the same roller that was used to wet the surface of the beam, epoxy is firmly pressed into the carbon fiber sheets (Figure A-9). The sheet is flipped over and epoxy is again forced into the CFRP sheet from the opposite side.

284
Figure A-9 Impregnating the carbon fiber sheets with epoxy
Once impregnated, the sheet is ready to be installed onto the surface of the beam. Handling a large sheet that has been saturated with epoxy may be difficult. Therefore, the sheet is folded in half before handling (Figure A-10). This allows one person to carry a single sheet.
Figure A-10 Folding the impregnated sheets in half for ease of handling
The sheets are then lifted and applied to the surface of the concrete. This step requires at least two people (one on each side of the beam’s web) to install the CFRP laminates. As seen in subsequent figures, CFRP sheets were applied downward on the T-beam specimens because the beams were inverted for testing under load. For the I-beams, the CFRP sheets were applied upward to the soffit of the as would be done in the field.
To align the sheet on the beam efficiently, one end of the carbon fiber sheet is lined up in its correct position; then, the free end of the sheet is laid along the surface, as Figure A-11 shows. Installing the CFRP sheets in this manner allows any air that may be trapped by the sheet to escape, eliminating most of the air bubbles beneath the sheets. Any additional air pockets that remain beneath the CFRP sheets are removed using a simple bondo knife, as Figure A-12 demonstrates. Firm pressure is applied to the sheet with the bondo knife as it is guided along the

285
length of the CFRP strip to force all air and excess epoxy out from beneath the CFRP strip, producing a high quality, flush finish of the CFRP materials to the concrete substrate.
Figure A-11 Placing the CFRP sheet onto the surface of the beam and aligning the free end of
the installed CFRP strip
Figure A-12 Removing excess epoxy from the installed CFRP strip
When the CFRP strip has been installed on the surface of the concrete beam, it should completely cover the previously prepared anchor hole. In order to provide easy access to the anchor hole, the individual fibers of the carbon fiber fabric should be separated to provide space for the insertion of the CFRP anchor without snagging on the CFRP strip itself. This can be done easily by inserting a wire tapered rod or screwdriver through the saturated carbon fiber sheets into the anchor hole and circling it along the edge of the hole to produce the condition shown in Figure A-13.

286
Figure A-13 Creating an opening for the CFRP anchor
The previously mentioned steps can be repeated to install multiple CFRP strips or sheets. A completed installation of two CFRP strips is shown in Figure A-14. The wetted surface for the third strip and the anchor hole can be seen on the right. Depending on the layout of the carbon fiber materials, multiple layers of CFRP strips or sheets may be used. In these cases, the second layer can be installed in the same manner as described previously; however, there is no need to wet the surface that the second layer will adhere to because the previously installed first layer is an appropriate surface on which the additional layer can be installed.
Figure A-14 Completed installation of a CFRP strip
Care must be taken to work within the workability time limits specified by the manufacturer of the epoxy resin. Epoxy should be mixed in small batches as it is needed, to ensure that partially set epoxy is not used in the installation.

287
Dry lay-up procedure Another common procedure used to install carbon fiber materials in practice is known as
the dry lay-up procedure. In this procedure, the carbon fiber sheets are impregnated with a high strength structural epoxy while on the surface of the beam. This method is popular for large scale applications where the carbon fiber materials cannot be easily handled by one or two workers. This allows workers to handle dry sheets of CFRP fabrics which are lighter and easier to work with than the large, saturated sheets associated with the wet lay-up procedure.
Many of the installation procedures associated with the dry lay-up procedure are identical to those of the wet lay-up procedure; however, a couple of major differences exist between the two procedures: the need to apply a concrete surface primer and the method used to impregnate the carbon fiber sheets.
The concrete surface primer consists of a two part chemical saturate. It is applied to the surface of the concrete specimen with an ordinary 3/8-in. nap paint roller, as Figure A-15 shows. According to the manufacturer’s website, this primer has been proven to increase the bond strength between the CFRP laminates and the concrete substrate. All surfaces onto which CFRP laminates are to be installed must be primed, including the inner surface of the CFRP anchor holes.
Figure A-15 Application of the concrete surface primer
Once all surfaces have been primed, a two part structural epoxy is mixed and used to wet the surface of the beam; in a manner identical to the procedure described in 3.1.3 of the accompanying report. Just as with the wet lay-up procedure, the anchor holes are wet with epoxy using a small swab of CFRP material (Figure A-16). In order to provide enough epoxy to impregnate the carbon fiber laminates while on the surface of the beam, a generous amount of structural epoxy is used to wet the surface of the concrete beam.

288
Figure A-16 Wetting the surface of the CFRP anchor holes
The second major difference exists between the wet lay-up and dry lay-up procedures in how the CFRP strips are impregnated with the epoxy. First, a dry strip of carbon fiber fabric is laid on the freshly wet surface. Then, a serrated roller is vigorously rolled over the installed CFRP strip (Figure A-17). This special tool forces epoxy to the exposed surface of the CFRP strip or sheet. This effectively impregnates the carbon fiber material with the epoxy. Because the sharp edges of the serrated roller are run in the direction of the carbon fibers, the vigorous procedure does not damage the system or reduce the strength of the carbon fiber laminates.
Figure A-17 Impregnating the CFRP strip while on the surface of the beam with a serrated roller

289
After the fibers have been impregnated, another application of the high strength structural epoxy is rolled over the CFRP strips (Figure A-18). This effectively seals the system and allows the epoxy to fully saturate the carbon fiber materials. A completed installation of a CFRP system using the dry lay-up procedure is shown in Figure A-19.
Figure A-18 Sealing the CFRP laminates with epoxy
Figure A-19 Completed installation using the dry lay-up procedure
CFRP anchor installation CFRP anchors are constructed in a series of steps. It is noted that in each of these steps,
workmanship in construction is of utmost importance. Poor execution of the required steps can, at times, reduce the capacity of the CFRP anchors by up to 50% (Ozbakkaloglu & Saatcioglu, 2009).
Once the hole has been drilled and the edge rounded (as described previously), construction of the actual anchor can begin. The materials needed to create the CFRP anchor are displayed in Figure A-20. These include a strip of CFRP fabric, a rebar tie, and a pair of needle

290
nose pliers. The width of this strip to be used in the anchor is determined by the amount of CFRP material the CFRP anchor is to develop (see Section A2 for more details). The length of the strip used to create the CFRP anchor is determined by the embedment depth of the anchor and the length of the bonded portion of the anchors (also known as the anchor fan); see Section A2 for more details. To make installation of the CFRP anchor easier, this strip of CFRP fabric is folded in half (Figure A-21) and, therefore, the required length of the anchor must be doubled while the required width of the CFRP strip used to create the anchor only needs to be half the required width.
Figure A-20 Materials required to construct a CFRP anchor – a strip of CFRP, a rebar tie and a
pair of needle nose pliers
Figure A-21 CFRP strip folded in half and clasped with a rebar tie
A rebar tie is used to clasp the strip at its midpoint (Figure A-22). The rebar tie serves as an installation tool offering the installer leverage in inserting the anchor into the drilled hole. Once folded in half, the ends of the anchor are frayed (Figure A-23), which allows the CFRP materials located within the portion of the anchorage fan to be spread out.
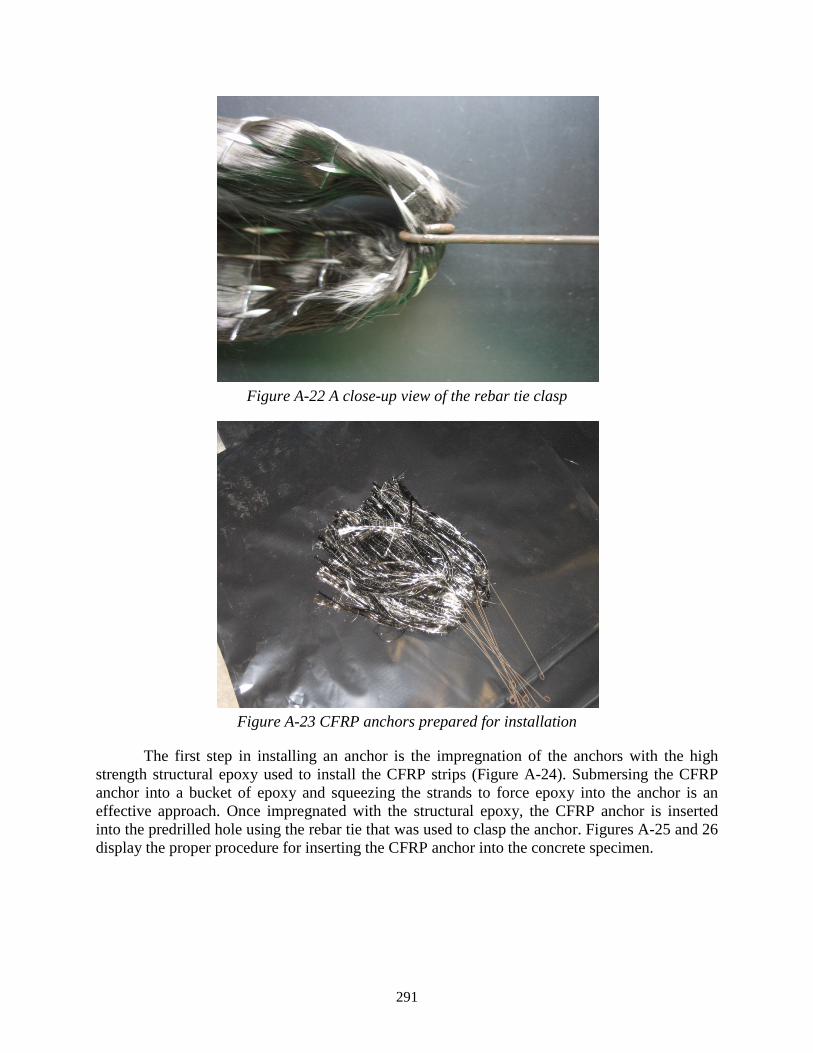
291
Figure A-22 A close-up view of the rebar tie clasp
Figure A-23 CFRP anchors prepared for installation
The first step in installing an anchor is the impregnation of the anchors with the high strength structural epoxy used to install the CFRP strips (Figure A-24). Submersing the CFRP anchor into a bucket of epoxy and squeezing the strands to force epoxy into the anchor is an effective approach. Once impregnated with the structural epoxy, the CFRP anchor is inserted into the predrilled hole using the rebar tie that was used to clasp the anchor. Figures A-25 and 26 display the proper procedure for inserting the CFRP anchor into the concrete specimen.

292
Figure A-24 Impregnation of the CFRP anchor with high strength structural epoxy
Figure A-25 Insertion of the CFRP anchor
Figure A-26 Using a rebar tie to properly insert the CFRP anchor into a predrilled hole.
When the CFRP anchor is fully inserted into the hole, the anchor fan can be spread out by hand (Figure A-27). When discrete strips of CFRP fabric are installed on the concrete surface, the anchorage fan should extend past the edges of the CFRP strip by approximately 0.5-in. to

293
ensure that all carbon fiber strands of the anchor intersect fibers from the CFRP strip. A completed installation of the CFRP anchors is shown in Figure A-28.
Figure A-27 Construction of CFRP anchorage fan
Figure A-28 Completed installation of CFRP anchors

294
A2. Specifications for Fabrication and Installation of CFRP Anchors The following parameters are most influential to the strength of CFRP anchor
installations: 1) anchor layout, 2) anchor inclination, 3) depth of anchor hole, 4) anchor hole chamfer radius, 5) area of anchor hole, 6) amount of CFRP material in anchors, 7) anchor fan length, 8) anchor fan angle, and 9) anchor reinforcement. Figures A-29 and 30 illustrate typical CFRP anchor and strip details used in this project.
Figure A-29 Recommended detail of CFRP anchors
Figure A-30 Isometric view of U-wrap with CFRP anchorage system
As mentioned previously, it was not within the scope of this project to optimize anchor design and details. A conservative anchor design was therefore used in the study. The anchor

295
design was improved during testing as the original design did not perform as well as anticipated. The improved anchor design is presented next.
1. Anchor layout In general, it is better to increase the number of anchors and the number of strips across
the critical section to provide more redundancy and reduce stress concentrations. However, increasing the number of anchors increases installation time. A balance between adding redundancy and reducing construction time should be achieved.
One CFRP anchor per width of CFRP strip is recommended. However, if the width of a CFRP strip exceeds df /4, multiple anchors should be considered to reduce stress concentrations at the anchor fan and key; (df = effective CFRP length = distance from anchor to tension chord of beam). For a continuous sheet, the number of CFRP anchors is determined by the width of CFRP to be covered by each anchor. It is recommended that this width not exceed df /4.
Anchors should be placed such that the effective CFRP length (df) is maximized (i.e., as close to the top of a beam as possible). Anchors should always be placed within the concrete core; i.e., within the volume of concrete enclosed by transverse reinforcement.
CAUTION: recommended anchor details are provided for use with single-layer CFRP applications. These details did not provide acceptable performance in the limited work done using multi-layer CFRP applications.
2. Anchor hole inclination from axis perpendicular to surface In this study, anchor holes were investigated with up to 10 degrees of inclination from the
perpendicular to the concrete surface. Inclinations of that amount did not show any adverse effects on anchor performance. It is recommended to provide anchor holes that are perpendicular to the concrete surface or bisecting the angle created by concrete surfaces at re-entrant corners (e.g., at the intersection of the flange and web in an I-Girder). A deviation of less than 10 degrees from that preferred angle direction did not affect the performance of anchors.
It is recommended to perform non-destructive testing to locate steel bars in concrete members prior to drilling so as to minimize drilling into bars. If, however, a steel bar is intersected while drilling, the anchor hole can be kept at the same location and inclined 10 degrees to either side of the bar without any adverse effect on its performance.
3. Depth of anchor hole A 6 in. hole depth was used in all specimens and is recommended to ensure that the
anchor engages the concrete core.
4. Area of anchor hole An anchor hole area that is 1.4 times the area of the CFRP anchor is recommended.
Hole diameter should be determined from that area and rounded up to the nearest 1/16th of an inch. Holes that are either smaller or larger can reduce anchor performance. A small hole makes it difficult to insert the anchor and a large hole requires more epoxy to fill the space.
5. Anchor hole chamfer radius An anchor hole chamfer radius of 0.5 in. was found to perform well and is
recommended. This chamfer can be achieved by using a grinder to grind the edge of the hole at
296
the beam surface to the desired radius, or a drill bit with a diameter larger than the hole can serve as a “countersink” bit.displ
6. Amount of CFRP material in anchors It is recommended to use an area of CFRP material in anchors that is at least twice as
large as the material area in the CFRP strips that are developed.
7. Anchor fan length It is recommended to use an anchor fan length of at least 6 in. in all applications. Longer
lengths may be needed to ensure a minimum of a ½ in. overhang of the fan on either side of the strip being developed (see Figure A-29 for illustration).
8. Anchor fan angle A fan angle of 60 degrees is recommended in all applications.
9. Anchor reinforcement Two additional patches in perpendicular directions should be attached over the CFRP
anchors (Figure A-30). Patches should be square with sides equal to the strip width.
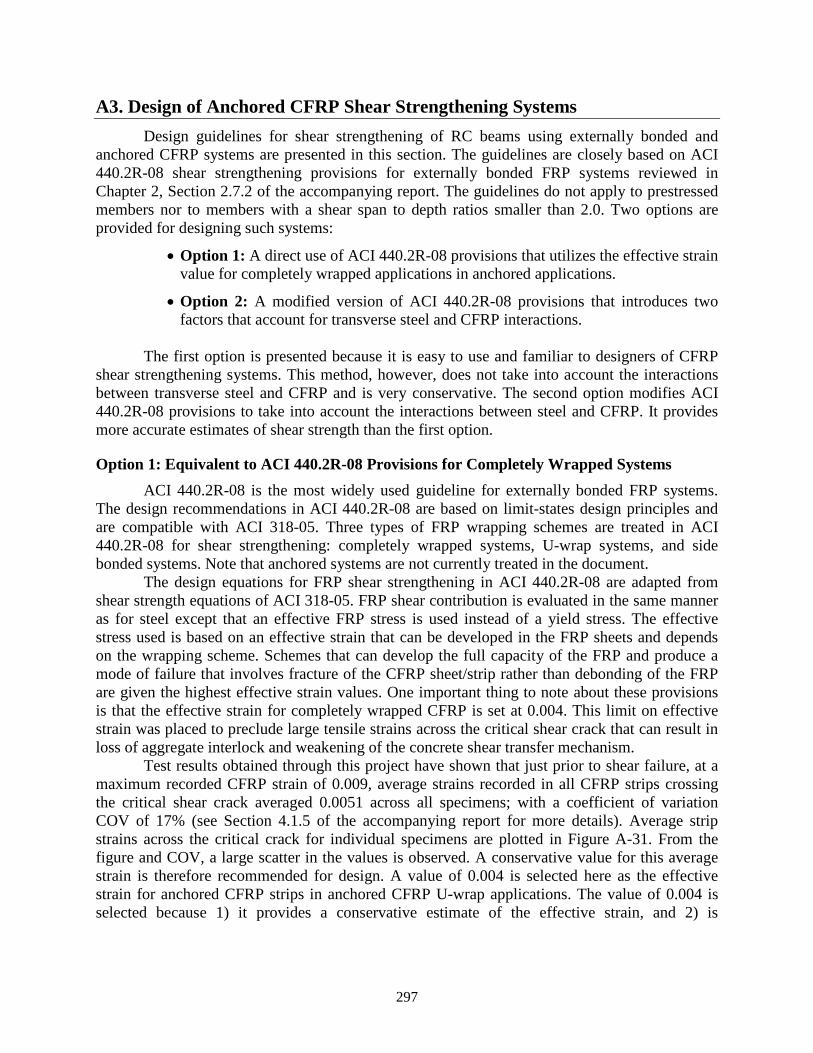
297
A3. Design of Anchored CFRP Shear Strengthening Systems Design guidelines for shear strengthening of RC beams using externally bonded and
anchored CFRP systems are presented in this section. The guidelines are closely based on ACI 440.2R-08 shear strengthening provisions for externally bonded FRP systems reviewed in Chapter 2, Section 2.7.2 of the accompanying report. The guidelines do not apply to prestressed members nor to members with a shear span to depth ratios smaller than 2.0. Two options are provided for designing such systems:
• Option 1: A direct use of ACI 440.2R-08 provisions that utilizes the effective strain value for completely wrapped applications in anchored applications.
• Option 2: A modified version of ACI 440.2R-08 provisions that introduces two factors that account for transverse steel and CFRP interactions.
The first option is presented because it is easy to use and familiar to designers of CFRP
shear strengthening systems. This method, however, does not take into account the interactions between transverse steel and CFRP and is very conservative. The second option modifies ACI 440.2R-08 provisions to take into account the interactions between steel and CFRP. It provides more accurate estimates of shear strength than the first option.
Option 1: Equivalent to ACI 440.2R-08 Provisions for Completely Wrapped Systems ACI 440.2R-08 is the most widely used guideline for externally bonded FRP systems.
The design recommendations in ACI 440.2R-08 are based on limit-states design principles and are compatible with ACI 318-05. Three types of FRP wrapping schemes are treated in ACI 440.2R-08 for shear strengthening: completely wrapped systems, U-wrap systems, and side bonded systems. Note that anchored systems are not currently treated in the document.
The design equations for FRP shear strengthening in ACI 440.2R-08 are adapted from shear strength equations of ACI 318-05. FRP shear contribution is evaluated in the same manner as for steel except that an effective FRP stress is used instead of a yield stress. The effective stress used is based on an effective strain that can be developed in the FRP sheets and depends on the wrapping scheme. Schemes that can develop the full capacity of the FRP and produce a mode of failure that involves fracture of the CFRP sheet/strip rather than debonding of the FRP are given the highest effective strain values. One important thing to note about these provisions is that the effective strain for completely wrapped CFRP is set at 0.004. This limit on effective strain was placed to preclude large tensile strains across the critical shear crack that can result in loss of aggregate interlock and weakening of the concrete shear transfer mechanism.
Test results obtained through this project have shown that just prior to shear failure, at a maximum recorded CFRP strain of 0.009, average strains recorded in all CFRP strips crossing the critical shear crack averaged 0.0051 across all specimens; with a coefficient of variation COV of 17% (see Section 4.1.5 of the accompanying report for more details). Average strip strains across the critical crack for individual specimens are plotted in Figure A-31. From the figure and COV, a large scatter in the values is observed. A conservative value for this average strain is therefore recommended for design. A value of 0.004 is selected here as the effective strain for anchored CFRP strips in anchored CFRP U-wrap applications. The value of 0.004 is selected because 1) it provides a conservative estimate of the effective strain, and 2) is
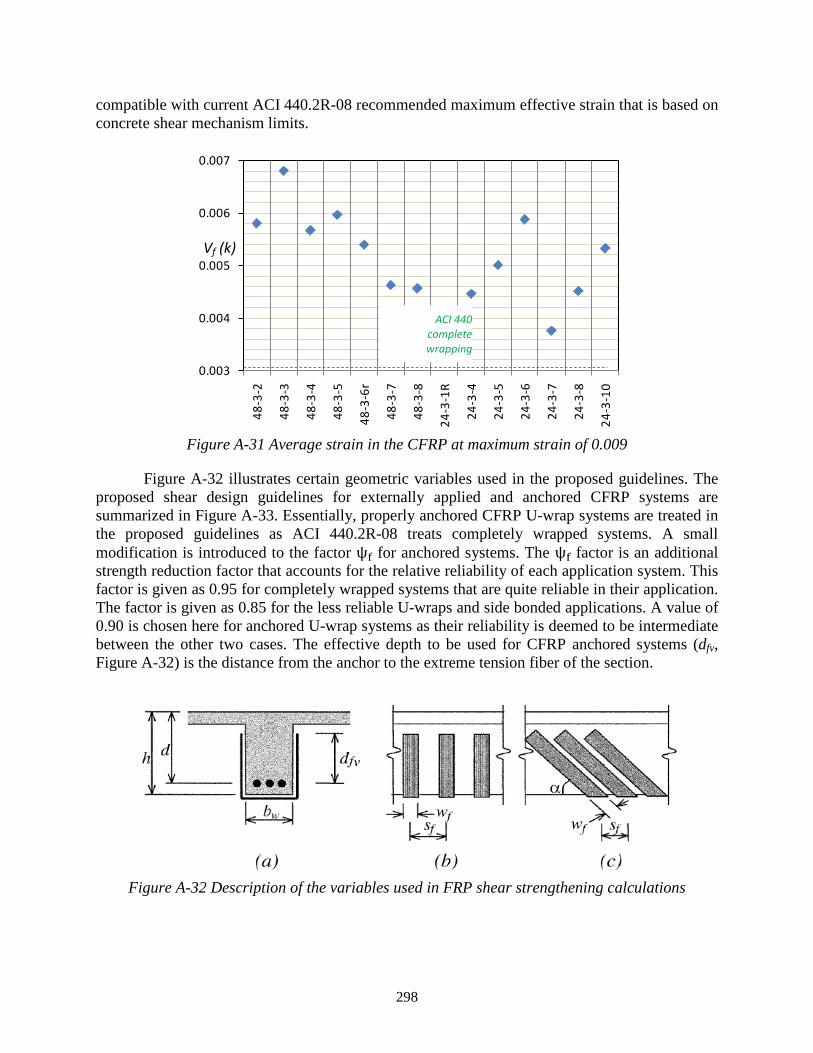
298
compatible with current ACI 440.2R-08 recommended maximum effective strain that is based on concrete shear mechanism limits.
Figure A-31 Average strain in the CFRP at maximum strain of 0.009
Figure A-32 illustrates certain geometric variables used in the proposed guidelines. The proposed shear design guidelines for externally applied and anchored CFRP systems are summarized in Figure A-33. Essentially, properly anchored CFRP U-wrap systems are treated in the proposed guidelines as ACI 440.2R-08 treats completely wrapped systems. A small modification is introduced to the factor ψf for anchored systems. The ψf factor is an additional strength reduction factor that accounts for the relative reliability of each application system. This factor is given as 0.95 for completely wrapped systems that are quite reliable in their application. The factor is given as 0.85 for the less reliable U-wraps and side bonded applications. A value of 0.90 is chosen here for anchored U-wrap systems as their reliability is deemed to be intermediate between the other two cases. The effective depth to be used for CFRP anchored systems (dfv, Figure A-32) is the distance from the anchor to the extreme tension fiber of the section.
Figure A-32 Description of the variables used in FRP shear strengthening calculations
0.003
0.004
0.005
0.006
0.007
48-3
-2
48-3
-3
48-3
-4
48-3
-5
48-3
-6r
48-3
-7
48-3
-8
24-3
-1R
24-3
-4
24-3
-5
24-3
-6
24-3
-7
24-3
-8
24-3
-10
ACI 440 complete wrapping
Vf (k)
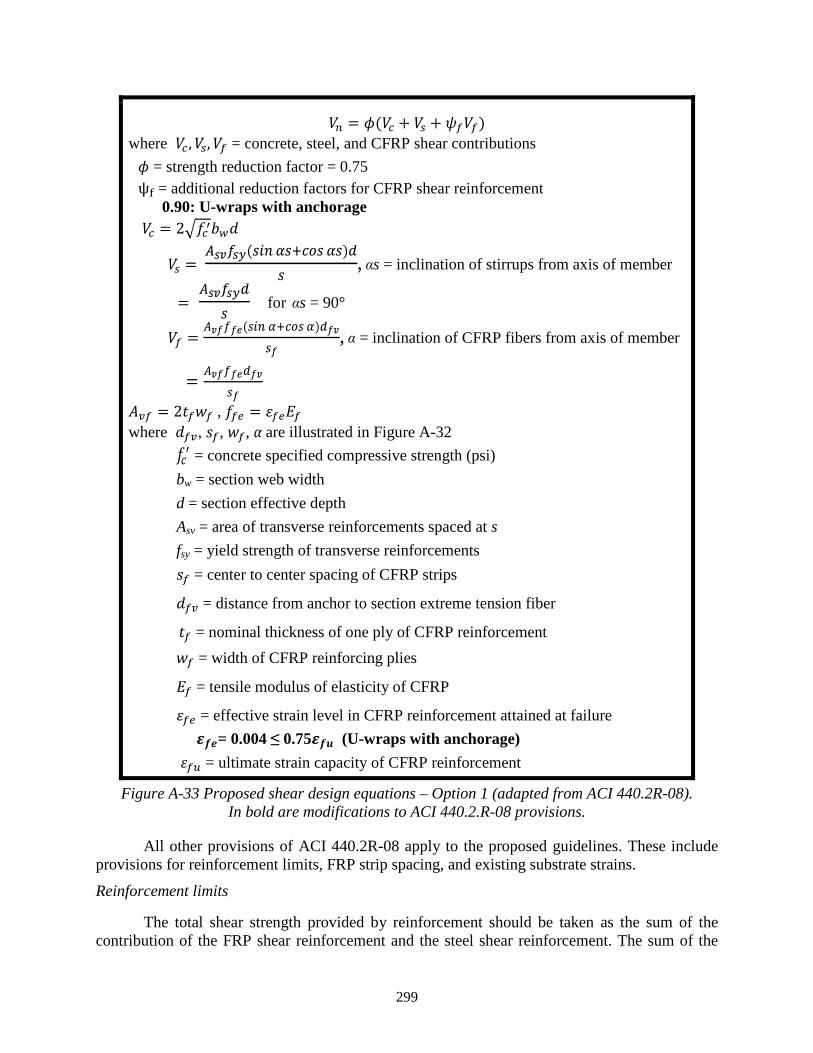
299
𝑉𝑛 = 𝜙(𝑉𝑐 + 𝑉𝑠 + 𝜓𝑓𝑉𝑓) where 𝑉𝑐,𝑉𝑠,𝑉𝑓 = concrete, steel, and CFRP shear contributions 𝜙 = strength reduction factor = 0.75 ψf = additional reduction factors for CFRP shear reinforcement 0.90: U-wraps with anchorage 𝑉𝑐 = 2�𝑓𝑐′𝑏𝑤𝑑
𝑉𝑠 = 𝐴𝑠𝑣𝑓𝑠𝑦(𝑠𝑖𝑛 𝛼𝑠+𝑐𝑜𝑠 𝛼𝑠)𝑑
𝑠, αs = inclination of stirrups from axis of member
= 𝐴𝑠𝑣𝑓𝑠𝑦𝑑𝑠
for αs = 90°
𝑉𝑓 = 𝐴𝑣𝑓𝑓𝑓𝑒(𝑠𝑖𝑛 𝛼+𝑐𝑜𝑠 𝛼)𝑑𝑓𝑣𝑠𝑓
, α = inclination of CFRP fibers from axis of member
= 𝐴𝑣𝑓𝑓𝑓𝑒𝑑𝑓𝑣𝑠𝑓
𝐴𝑣𝑓 = 2𝑡𝑓𝑤𝑓 , 𝑓𝑓𝑒 = 𝜀𝑓𝑒𝐸𝑓 where 𝑑𝑓𝑣, 𝑡𝑓, 𝑤𝑓, 𝛼 are illustrated in Figure A-32
𝑓𝑐′ = concrete specified compressive strength (psi) bw = section web width d = section effective depth Asv = area of transverse reinforcements spaced at s fsy = yield strength of transverse reinforcements 𝑡𝑓 = center to center spacing of CFRP strips
𝑑𝑓𝑣 = distance from anchor to section extreme tension fiber
𝑡𝑓 = nominal thickness of one ply of CFRP reinforcement 𝑤𝑓 = width of CFRP reinforcing plies 𝐸𝑓 = tensile modulus of elasticity of CFRP
𝜀𝑓𝑒 = effective strain level in CFRP reinforcement attained at failure 𝜺𝒇𝒆= 0.004 ≤ 0.75𝜺𝒇𝒖 (U-wraps with anchorage) 𝜀𝑓𝑢 = ultimate strain capacity of CFRP reinforcement
Figure A-33 Proposed shear design equations – Option 1 (adapted from ACI 440.2R-08). In bold are modifications to ACI 440.2.R-08 provisions.
All other provisions of ACI 440.2R-08 apply to the proposed guidelines. These include provisions for reinforcement limits, FRP strip spacing, and existing substrate strains.
Reinforcement limits
The total shear strength provided by reinforcement should be taken as the sum of the contribution of the FRP shear reinforcement and the steel shear reinforcement. The sum of the
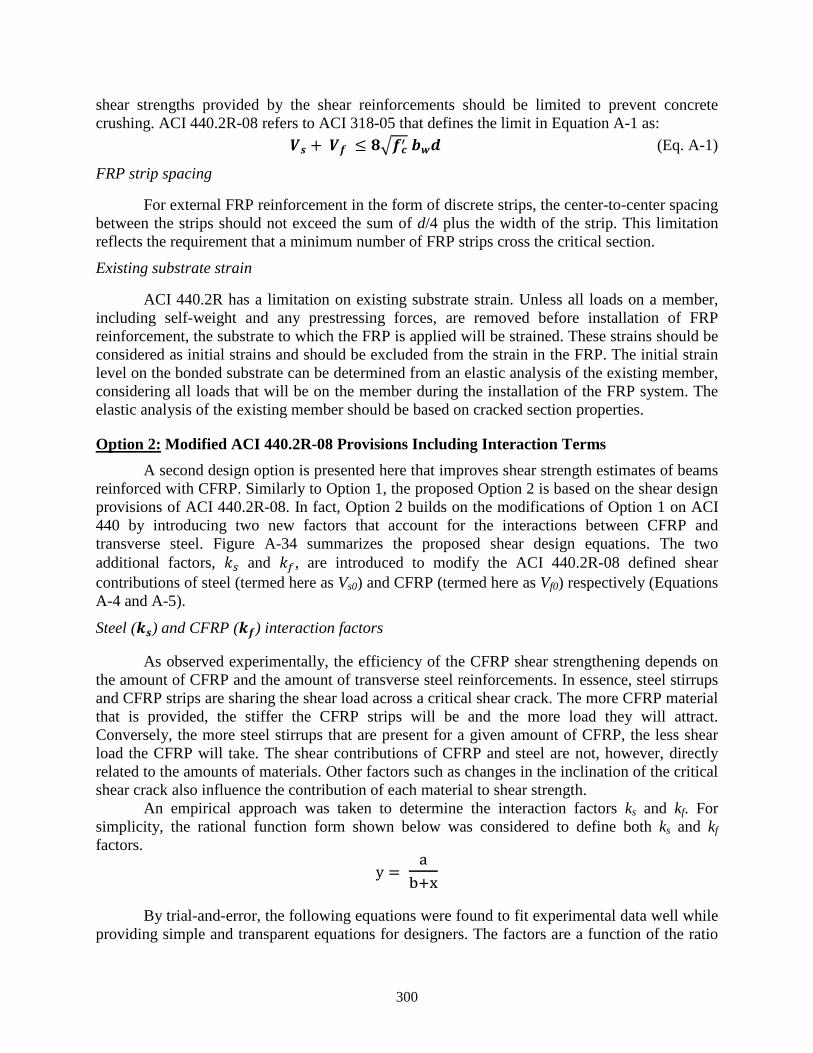
300
shear strengths provided by the shear reinforcements should be limited to prevent concrete crushing. ACI 440.2R-08 refers to ACI 318-05 that defines the limit in Equation A-1 as:
𝑽𝒔 + 𝑽𝒇 ≤ 𝟖�𝒇𝒄′ 𝒃𝒘𝒅 (Eq. A-1)
FRP strip spacing
For external FRP reinforcement in the form of discrete strips, the center-to-center spacing between the strips should not exceed the sum of d/4 plus the width of the strip. This limitation reflects the requirement that a minimum number of FRP strips cross the critical section.
Existing substrate strain
ACI 440.2R has a limitation on existing substrate strain. Unless all loads on a member, including self-weight and any prestressing forces, are removed before installation of FRP reinforcement, the substrate to which the FRP is applied will be strained. These strains should be considered as initial strains and should be excluded from the strain in the FRP. The initial strain level on the bonded substrate can be determined from an elastic analysis of the existing member, considering all loads that will be on the member during the installation of the FRP system. The elastic analysis of the existing member should be based on cracked section properties.
Option 2: Modified ACI 440.2R-08 Provisions Including Interaction Terms A second design option is presented here that improves shear strength estimates of beams
reinforced with CFRP. Similarly to Option 1, the proposed Option 2 is based on the shear design provisions of ACI 440.2R-08. In fact, Option 2 builds on the modifications of Option 1 on ACI 440 by introducing two new factors that account for the interactions between CFRP and transverse steel. Figure A-34 summarizes the proposed shear design equations. The two additional factors, 𝑘𝑠 and 𝑘𝑓, are introduced to modify the ACI 440.2R-08 defined shear contributions of steel (termed here as Vs0) and CFRP (termed here as Vf0) respectively (Equations A-4 and A-5).
Steel (𝒌𝒔) and CFRP (𝒌𝒇) interaction factors
As observed experimentally, the efficiency of the CFRP shear strengthening depends on the amount of CFRP and the amount of transverse steel reinforcements. In essence, steel stirrups and CFRP strips are sharing the shear load across a critical shear crack. The more CFRP material that is provided, the stiffer the CFRP strips will be and the more load they will attract. Conversely, the more steel stirrups that are present for a given amount of CFRP, the less shear load the CFRP will take. The shear contributions of CFRP and steel are not, however, directly related to the amounts of materials. Other factors such as changes in the inclination of the critical shear crack also influence the contribution of each material to shear strength.
An empirical approach was taken to determine the interaction factors ks and kf. For simplicity, the rational function form shown below was considered to define both ks and kf factors.
y = ab+x
By trial-and-error, the following equations were found to fit experimental data well while providing simple and transparent equations for designers. The factors are a function of the ratio
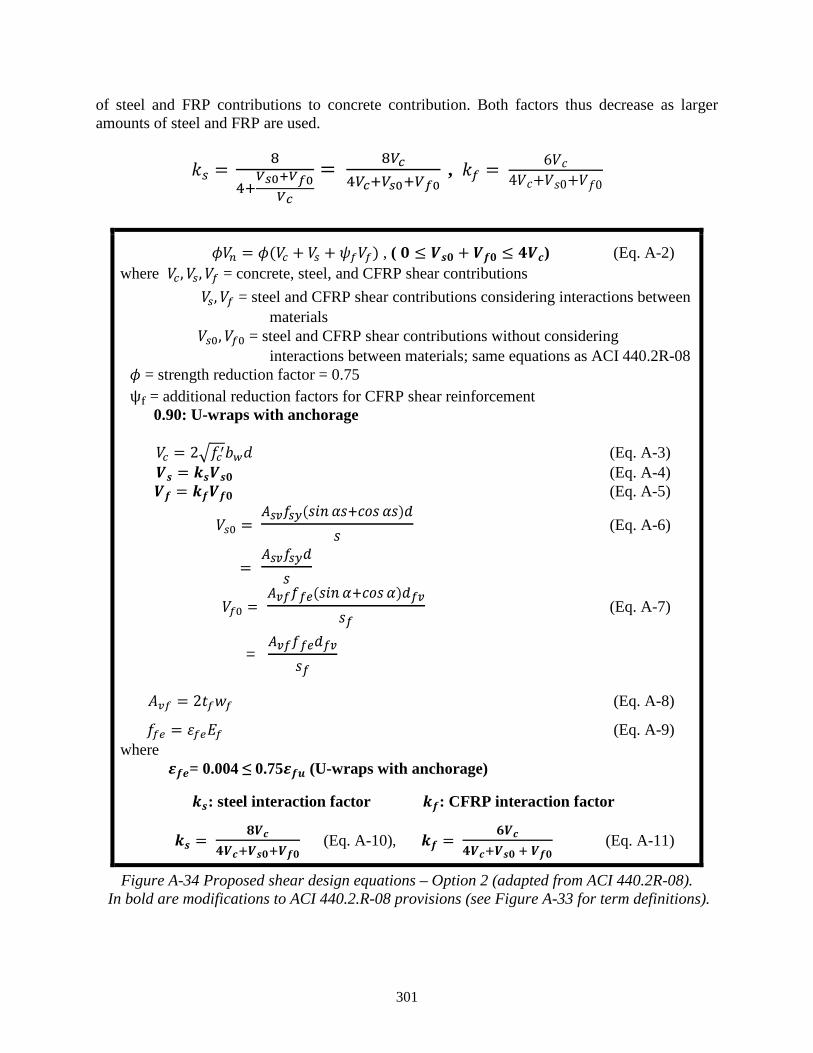
301
of steel and FRP contributions to concrete contribution. Both factors thus decrease as larger amounts of steel and FRP are used.
𝑘𝑠 = 8
4+𝑉𝑠0+𝑉𝑓0
𝑉𝑐
= 8𝑉𝑐4𝑉𝑐+𝑉𝑠0+𝑉𝑓0
, 𝑘𝑓 = 6𝑉𝑐4𝑉𝑐+𝑉𝑡0+𝑉𝑓0
𝜙𝑉𝑛 = 𝜙(𝑉𝑐 + 𝑉𝑠 + 𝜓𝑓𝑉𝑓) , ( 𝟎 ≤ 𝑽𝒔𝟎 + 𝑽𝒇𝟎 ≤ 𝟒𝑽𝒄) (Eq. A-2)
where 𝑉𝑐,𝑉𝑠,𝑉𝑓 = concrete, steel, and CFRP shear contributions 𝑉𝑠,𝑉𝑓 = steel and CFRP shear contributions considering interactions between
materials 𝑉𝑠0,𝑉𝑓0 = steel and CFRP shear contributions without considering
interactions between materials; same equations as ACI 440.2R-08 𝜙 = strength reduction factor = 0.75 ψf = additional reduction factors for CFRP shear reinforcement 0.90: U-wraps with anchorage
𝑉𝑐 = 2�𝑓𝑐′𝑏𝑤𝑑 (Eq. A-3) 𝑽𝒔 = 𝒌𝒔𝑽𝒔𝟎 (Eq. A-4) 𝑽𝒇 = 𝒌𝒇𝑽𝒇𝟎 (Eq. A-5)
𝑉𝑠0 = 𝐴𝑠𝑣𝑓𝑠𝑦(𝑠𝑖𝑛 𝛼𝑠+𝑐𝑜𝑠 𝛼𝑠)𝑑
𝑠 (Eq. A-6)
= 𝐴𝑠𝑣𝑓𝑠𝑦𝑑𝑠
𝑉𝑓0 = 𝐴𝑣𝑓𝑓𝑓𝑒(𝑠𝑖𝑛 𝛼+𝑐𝑜𝑠 𝛼)𝑑𝑓𝑣𝑠𝑓
(Eq. A-7)
= 𝐴𝑣𝑓𝑓𝑓𝑒𝑑𝑓𝑣
𝑠𝑓
𝐴𝑣𝑓 = 2𝑡𝑓𝑤𝑓 (Eq. A-8)
𝑓𝑓𝑒 = 𝜀𝑓𝑒𝐸𝑓 (Eq. A-9) where
𝜺𝒇𝒆= 0.004 ≤ 0.75𝜺𝒇𝒖 (U-wraps with anchorage)
𝒌𝒔: steel interaction factor 𝒌𝒇: CFRP interaction factor
𝒌𝒔 = 𝟖𝑽𝒄𝟒𝑽𝒄+𝑽𝒔𝟎+𝑽𝒇𝟎
(Eq. A-10), 𝒌𝒇 = 𝟔𝑽𝒄𝟒𝑽𝒄+𝑽𝒔𝟎 + 𝑽𝒇𝟎
(Eq. A-11)
Figure A-34 Proposed shear design equations – Option 2 (adapted from ACI 440.2R-08). In bold are modifications to ACI 440.2.R-08 provisions (see Figure A-33 for term definitions).


