Embed Size (px)
Citation preview

35 June 2013
U.S. Travel and Tourism Satellite Accounts for 2009–2012 By Steven L. Zemanek
T HE TRAVEL and tourism industry—as measured by the real output of goods and services sold di
rectly to visitors—increased 2.8 percent in 2012 after increasing 6.2 percent in 2011, according to the most recent statistics from the travel and tourism satellite accounts of the Bureau of Economic Analysis (BEA). In comparison, the broader economy—as measured by real gross domestic product—increased 2.2 percent in 2012 after increasing 1.8 percent in 2011.1 Direct tourism employment increased 2.7 percent in 2012 after increasing 3.0 percent in 2011.
Highlights from the travel and tourism satellite accounts include the following:
● Nineteen of twenty-four commodities contributed to the growth in real tourism output in 2012, including traveler accommodations, food and beverage services, and gasoline.
● Inbound tourism increased 7.6 percent in 2012, and outbound tourism increased 5.0 percent. As a result, travel and tourism net exports increased to $46.3 billion in 2012 from $40.3 billion in 2011.
● Prices for tourism goods and services increased 2.5 percent in 2012 after increasing 5.0 percent in 2011.
1. All measures of travel and tourism activity not expressly identified as being in “real” terms are in current dollars.
Gasoline was the largest contributor to the price growth, followed by food and beverage services and domestic passenger air transportation. This update of the travel and tourism accounts re
vises previously published statistics. These revised statistics primarily reflect the incorporation of detailed data from BEA’s annual revision of the industry accounts for 2009–2011 and summary statistics from the national income and product accounts (NIPAs) through 2012. The travel and tourism accounts are available on the BEA Web site at www.bea.gov; see the box “Data Availability.”
The remainder of this article discusses trends in travel and tourism output and prices, the composition of tourism demand, and tourism value added and employment. The core tables for travel and tourism accounts follow the article.
Trends in Output and Prices
Real output Real direct travel and tourism output decelerated in 2012, increasing 2.8 percent after increasing 6.2 percent in 2011 (table A). The main contributors to the overall deceleration in growth were the deceleration in gasoline and the downturn in domestic passenger air
Table A. Annual Growth in Real Output by Tourism Commodity in 2007–2012 [Percentage change from preceding period]
Commodity 2007 2008 2009 2010 2011 2012
All tourism goods and services .......................................................................................... 1.8 –5.4 –9.7 1.6 6.2 2.8 Traveler accommodations................................................................................................... 3.9 0.9 –6.5 6.1 6.6 5.4 Food and beverage services .............................................................................................. 0.5 –7.3 –13.3 4.5 4.8 3.4 Transportation .................................................................................................................... 2.3 –5.8 –6.2 0.5 7.1 2.0
Passenger air transportation .......................................................................................... 2.1 –3.5 –6.5 1.5 2.9 –2.2 Domestic passenger air transportation services........................................................ 0.3 –5.6 –8.5 –4.3 2.8 –5.0 International passenger air transportation services ................................................... 5.0 –0.2 –3.3 9.9 2.9 1.2
All other transportation-related commodities ................................................................. 2.4 –7.3 –5.8 –0.2 9.9 4.8 Passenger rail transpor tation services ....................................................................... 10.0 –1.5 –1.7 –4.8 –2.4 2.9 Passenger water transportation services ................................................................... 4.8 1.6 0.4 6.9 8.0 15.5 Intercity bus services ................................................................................................. –0.3 1.4 –19.3 –17.7 0.5 10.1 Intercity charter bus services ..................................................................................... –10.5 5.5 –20.5 1.6 –3.5 3.1 Local bus and other transportation services .............................................................. 0.4 –9.8 –17.1 –8.0 2.0 1.4 Taxicab services......................................................................................................... –1.3 –9.5 –12.4 –5.6 –5.1 3.1 Scenic and sightseeing transportation services......................................................... 7.4 0.3 –12.4 9.0 6.3 2.8 Automotive rental and leasing .................................................................................... 2.9 –5.6 –15.4 1.7 10.5 8.6 Other vehicle rental and leasing................................................................................. 2.7 –4.0 –10.0 0.4 1.8 5.0 Automotive repair services......................................................................................... –6.0 –17.5 16.2 –16.2 –9.5 –0.3 Parking ....................................................................................................................... 0.6 –10.9 –8.3 3.5 2.4 1.7 Highway tolls .............................................................................................................. –4.8 –9.1 4.0 –0.4 –7.9 7.5 Travel arrangement and reservation services ............................................................ 8.7 1.8 –12.6 8.0 5.7 2.9 Gasoline ..................................................................................................................... 0.7 –12.3 2.6 –2.6 17.5 4.0
Recreation, entertainment, and shopping .......................................................................... 0.5 –8.0 –15.0 –2.1 5.5 1.8 Recreation and entertainment........................................................................................ 1.3 –7.8 –11.2 –1.5 3.1 1.2
Motion pictures and performing arts .......................................................................... 0.4 –10.1 –7.8 –1.1 5.4 –4.6 Spectator sports......................................................................................................... 2.0 –12.7 –18.4 0.7 5.0 –0.9 Participant sports ....................................................................................................... 2.0 –11.1 –16.2 –4.1 5.6 6.0 Gambling .................................................................................................................... 1.6 –5.1 –9.3 –1.6 0.2 –0.4 All other recreation and entertainment....................................................................... 0.4 –7.2 –11.9 –1.2 5.4 7.4
Nondurable PCE commodities other than gasoline ....................................................... –0.1 –8.1 –17.9 –2.5 7.6 2.2
PCE Personal consumption expenditures

36
U.S. Travel and Tourism Satellite Accounts June 2013
transportation services. The increase in real output in 2012 was concen
trated in a few commodities. The biggest contributors were traveler accommodations, food and beverage services, and gasoline. Traveler accommodations, which grew 5.4 percent, contributed 1.06 percentage points. Five commodities subtracted from growth, including domestic passenger air transportation services, which subtracted 0.46 percentage point (tables B, C, and chart 1).
Table B. Contributions to Growth in Real Tourism Output by Tourism Commodity in 2007–2012
[Percentage points]
Data Availability The detailed annual statistics on travel and tourism activity for 2011 are presented in eight tables at the end of this article. The complete set of detailed annual statistics for 1998–2011, statistics on output and employment for 2012, and quarterly statistics on output and employment for 1998–2012, are available on BEA’s Web site at www.bea.gov under “Industry” and “Satellite Accounts.”
Table C. Real Output by Tourism Commodity in 2007–2012 [Millions of chained (2005) dollars]
Commodity 2007 2008 2009 2010 2011 2012
All tourism goods and services ............................................. 1.79 –5.37 –9.73 1.57 6.24 2.83 Traveler accommodations ...................................................... 0.72 0.17 –1.29 1.17 1.32 1.06 Food and beverage services ................................................. 0.08 –1.17 –2.18 0.68 0.77 0.52 Transportation........................................................................ 0.86 –2.25 –2.26 0.22 2.85 0.84
Passenger air transportation ............................................. 0.32 –0.55 –1.03 0.25 0.47 –0.36 Domestic passenger air transportation services ........... 0.03 –0.53 –0.82 –0.40 0.26 –0.46 International passenger air transpor tation services ...... 0.29 –0.02 –0.21 0.65 0.21 0.10
All other transportation-related commodities ..................... 0.54 –1.70 –1.23 –0.04 2.38 1.20 Passenger rail transportation services .......................... 0.02 0.00 0.00 –0.01 0.00 0.01 Passenger water transportation services ...................... 0.05 0.02 0.00 0.08 0.09 0.17 Intercity bus services..................................................... 0.00 0.00 –0.05 –0.04 0.00 0.02 Intercity charter bus services ........................................ –0.03 0.01 –0.05 0.00 –0.01 0.01 Local bus and other transpor tation services ................. 0.00 –0.05 –0.08 –0.04 0.01 0.01 Taxicab services ............................................................ –0.01 –0.05 –0.07 –0.03 –0.03 0.01 Scenic and sightseeing transpor tation services ............ 0.03 0.00 –0.06 0.04 0.03 0.01 Automotive rental and leasing ....................................... 0.11 –0.23 –0.68 0.07 0.42 0.34 Other vehicle rental and leasing .................................... 0.00 0.00 –0.01 0.00 0.00 0.00 Automotive repair services ............................................ –0.09 –0.25 0.21 –0.27 –0.13 0.00 Parking .......................................................................... 0.00 –0.03 –0.02 0.01 0.01 0.00 Highway tolls ................................................................. 0.00 –0.01 0.00 0.00 –0.01 0.01 Travel arrangement and reservation services................ 0.39 0.09 –0.64 0.37 0.28 0.14 Gasoline ........................................................................ 0.06 –1.20 0.22 –0.22 1.71 0.48
Recreation, entertainment, and shopping ............................. 0.13 –2.12 –4.00 –0.50 1.31 0.40 Recreation and entertainment ........................................... 0.15 –0.92 –1.33 –0.17 0.34 0.12
Motion pictures and performing arts.............................. 0.01 –0.19 –0.15 –0.02 0.10 –0.08 Spectator sports ............................................................ 0.02 –0.14 –0.19 0.01 0.05 –0.01 Participant sports .......................................................... 0.03 –0.17 –0.24 –0.05 0.07 0.07 Gambling ....................................................................... 0.08 –0.25 –0.47 –0.08 0.01 –0.02 All other recreation and entertainment .......................... 0.01 –0.17 –0.28 –0.03 0.12 0.15
Nondurable PCE commodities other than gasoline ........... –0.02 –1.20 –2.67 –0.33 0.97 0.28
Commodity 2007 2008 2009 2010 2011 2012
All tourism goods and services ............................ 742,520 702,673 634,307 644,251 684,464 703,825 Traveler accommodations ..................................... 141,085 142,396 133,176 141,279 150,549 158,652 Food and beverage services................................. 120,243 111,481 96,677 100,980 105,812 109,365 Transportation ....................................................... 276,251 260,131 244,114 245,424 262,737 268,038
Passenger air transportation............................. Domestic passenger air transportation
112,097 108,175 101,173 102,687 105,620 103,264
services .................................................... International passenger air transpor tation
67,878 64,044 58,577 56,041 57,618 54,731
services .................................................... 44,228 44,124 42,681 46,926 48,272 48,858 All other transportation-related commodities .... 164,083 152,035 143,223 142,994 157,217 164,765
Passenger rail transportation services ......... 1,325 1,305 1,282 1,221 1,192 1,227 Passenger water transportation services...... 8,909 9,049 9,090 9,714 10,489 12,119 Intercity bus services .................................... 1,697 1,722 1,389 1,143 1,149 1,265 Intercity charter bus services ........................ 1,735 1,831 1,456 1,479 1,428 1,473 Local bus and other transportation services 3,807 3,434 2,847 2,620 2,671 2,709 Taxicab services ........................................... Scenic and sightseeing transportation
4,320 3,908 3,425 3,232 3,067 3,162
services .................................................... 3,163 3,173 2,779 3,028 3,220 3,311 Automotive rental and leasing....................... 29,255 27,623 23,370 23,773 26,276 28,524 Other vehicle rental and leasing ................... 774 743 668 671 683 717 Automotive repair services ........................... 10,724 8,846 10,281 8,613 7,793 7,769 Parking.......................................................... 1,943 1,732 1,589 1,644 1,683 1,711 Highway tolls ................................................. 551 501 521 519 478 513 Travel arrangement and reservation services 36,170 36,834 32,202 34,771 36,743 37,818 Gasoline........................................................ 59,851 52,505 53,874 52,451 61,645 64,139
Recreation, entertainment, and shopping............. 205,040 188,709 160,429 157,087 165,770 168,685 Recreation and entertainment .......................... 89,708 82,735 73,447 72,315 74,558 75,438
Motion pictures and performing arts ............. 14,472 13,015 12,000 11,868 12,511 11,939 Spectator sports ........................................... 7,906 6,903 5,632 5,671 5,957 5,904 Par ticipant sports .......................................... 12,171 10,818 9,068 8,699 9,182 9,734 Gambling ...................................................... 37,531 35,620 32,320 31,799 31,865 31,751 All other recreation and entertainment .........
Nondurable PCE commodities other than 17,624 16,361 14,409 14,231 14,997 16,109
gasoline ........................................................ 115,318 105,959 86,944 84,733 91,182 93,209
PCE Personal consumption expenditures
Chart 1. Contributions to Annual Growth in Real Tourism Output in 2009–2012
Percent
U.S. Bureau of Economic Analysis
Overall annual growth –9.7 % in 2009 1.6 % in 2010 6.2 % in 2011 2.8 % in 2012
4
3
2
1
0
–1
–2
–3
–4
–5 2009 2010 2011 2012
Traveler accommodations Food and beverage services Transportation Recreation, entertainment, and shopping
PCE Personal consumption expenditures
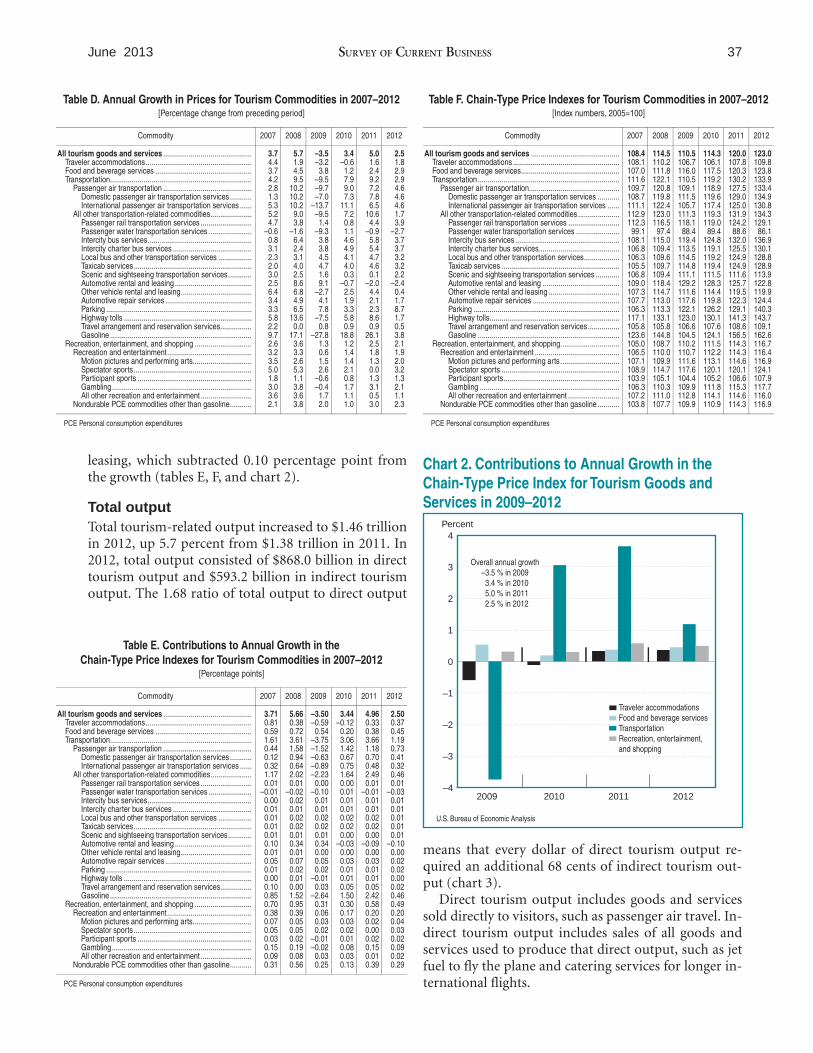
Prices Travel and tourism price growth decelerated in 2012, increasing 2.5 percent after increasing 5.0 percent in 2011 (table D). Gasoline was the primary contributor to the deceleration, contributing 0.46 percentage point in 2012 after contributing 2.42 percentage points in 2011.
The price growth was distributed among several travel and tourism commodities. The largest contributors to the increase were gasoline, food and beverage services, and domestic passenger air transportation services. Gasoline prices, the leading contributor to price growth for 3 consecutive years, increased 3.8 percent. Food and beverage services grew 2.9 percent and contributed 0.45 percentage point, and domestic passenger air transportation services grew 4.6 percent and contributed 0.41 percentage point. These positive contributions were partly offset by automotive rental and
37
June 2013 SURVEY OF CURRENT BUSINESS
Table D. Annual Growth in Prices for Tourism Commodities in 2007–2012 Table F. Chain-Type Price Indexes for Tourism Commodities in 2007–2012 [Percentage change from preceding period] [Index numbers, 2005=100]
Commodity 2007 2008 2009 2010 2011 2012
All tourism goods and services ............................................. 3.7 5.7 –3.5 3.4 5.0 2.5 Traveler accommodations...................................................... 4.4 1.9 –3.2 –0.6 1.6 1.8 Food and beverage services ................................................. 3.7 4.5 3.8 1.2 2.4 2.9 Transportation........................................................................ 4.2 9.5 –9.5 7.9 9.2 2.9
Passenger air transportation ............................................. 2.8 10.2 –9.7 9.0 7.2 4.6 Domestic passenger air transportation services ........... 1.3 10.2 –7.0 7.3 7.8 4.6 International passenger air transportation services ...... 5.3 10.2 –13.7 11.1 6.5 4.6
All other transportation-related commodities..................... 5.2 9.0 –9.5 7.2 10.6 1.7 Passenger rail transportation services .......................... 4.7 3.8 1.4 0.8 4.4 3.9 Passenger water transportation services ...................... –0.6 –1.6 –9.3 1.1 –0.9 –2.7 Intercity bus services..................................................... 0.8 6.4 3.8 4.6 5.8 3.7 Intercity charter bus services ........................................ 3.1 2.4 3.8 4.9 5.4 3.7 Local bus and other transportation services ................. 2.3 3.1 4.5 4.1 4.7 3.2 Taxicab services ............................................................ 2.0 4.0 4.7 4.0 4.6 3.2 Scenic and sightseeing transportation services ............ 3.0 2.5 1.6 0.3 0.1 2.2 Automotive rental and leasing ....................................... 2.5 8.6 9.1 –0.7 –2.0 –2.4 Other vehicle rental and leasing.................................... 6.4 6.8 –2.7 2.5 4.4 0.4 Automotive repair services ............................................ 3.4 4.9 4.1 1.9 2.1 1.7 Parking .......................................................................... 3.3 6.5 7.8 3.3 2.3 8.7 Highway tolls ................................................................. 5.8 13.6 –7.5 5.8 8.6 1.7 Travel arrangement and reservation services................ 2.2 0.0 0.8 0.9 0.9 0.5 Gasoline ........................................................................ 9.7 17.1 –27.8 18.8 26.1 3.8
Recreation, entertainment, and shopping ............................. 2.6 3.6 1.3 1.2 2.5 2.1 Recreation and enter tainment ........................................... 3.2 3.3 0.6 1.4 1.8 1.9
Motion pictures and performing arts.............................. 3.5 2.6 1.5 1.4 1.3 2.0 Spectator sports ............................................................ 5.0 5.3 2.6 2.1 0.0 3.2 Participant sports .......................................................... 1.8 1.1 –0.6 0.8 1.3 1.3 Gambling ....................................................................... 3.0 3.8 –0.4 1.7 3.1 2.1 All other recreation and entertainment .......................... 3.6 3.6 1.7 1.1 0.5 1.1
Nondurable PCE commodities other than gasoline........... 2.1 3.8 2.0 1.0 3.0 2.3
Commodity 2007 2008 2009 2010 2011 2012
All tourism goods and services ............................................. 108.4 114.5 110.5 114.3 120.0 123.0 Traveler accommodations ...................................................... 108.1 110.2 106.7 106.1 107.8 109.8 Food and beverage services.................................................. 107.0 111.8 116.0 117.5 120.3 123.8 Transportation ........................................................................ 111.6 122.1 110.5 119.2 130.2 133.9
Passenger air transportation.............................................. 109.7 120.8 109.1 118.9 127.5 133.4 Domestic passenger air transportation services ........... 108.7 119.8 111.5 119.6 129.0 134.9 International passenger air transportation services ...... 111.1 122.4 105.7 117.4 125.0 130.8
All other transportation-related commodities ..................... 112.9 123.0 111.3 119.3 131.9 134.3 Passenger rail transportation services .......................... 112.3 116.5 118.1 119.0 124.2 129.1 Passenger water transportation services ...................... 99.1 97.4 88.4 89.4 88.6 86.1 Intercity bus services ..................................................... 108.1 115.0 119.4 124.8 132.0 136.9 Intercity charter bus services......................................... 106.8 109.4 113.5 119.1 125.5 130.1 Local bus and other transpor tation services.................. 106.3 109.6 114.5 119.2 124.9 128.8 Taxicab services ............................................................ 105.5 109.7 114.8 119.4 124.9 128.9 Scenic and sightseeing transportation services ............ 106.8 109.4 111.1 111.5 111.6 113.9 Automotive rental and leasing ....................................... 109.0 118.4 129.2 128.3 125.7 122.8 Other vehicle rental and leasing .................................... 107.3 114.7 111.6 114.4 119.5 119.9 Automotive repair services ............................................ 107.7 113.0 117.6 119.8 122.3 124.4 Parking .......................................................................... 106.3 113.3 122.1 126.2 129.1 140.3 Highway tolls.................................................................. 117.1 133.1 123.0 130.1 141.3 143.7 Travel arrangement and reservation services ................ 105.8 105.8 106.6 107.6 108.6 109.1 Gasoline ........................................................................ 123.6 144.8 104.5 124.1 156.5 162.6
Recreation, entertainment, and shopping.............................. 105.0 108.7 110.2 111.5 114.3 116.7 Recreation and entertainment ........................................... 106.5 110.0 110.7 112.2 114.3 116.4
Motion pictures and performing arts .............................. 107.1 109.9 111.6 113.1 114.6 116.9 Spectator sports ............................................................ 108.9 114.7 117.6 120.1 120.1 124.1 Participant spor ts........................................................... 103.9 105.1 104.4 105.2 106.6 107.9 Gambling ....................................................................... 106.3 110.3 109.9 111.8 115.3 117.7 All other recreation and enter tainment .......................... 107.2 111.0 112.8 114.1 114.6 116.0
Nondurable PCE commodities other than gasoline ........... 103.8 107.7 109.9 110.9 114.3 116.9
PCE Personal consumption expenditures
leasing, which subtracted 0.10 percentage point from the growth (tables E, F, and chart 2).
Total output Total tourism-related output increased to $1.46 trillion in 2012, up 5.7 percent from $1.38 trillion in 2011. In 2012, total output consisted of $868.0 billion in direct tourism output and $593.2 billion in indirect tourism output. The 1.68 ratio of total output to direct output
Table E. Contributions to Annual Growth in the Chain-Type Price Indexes for Tourism Commodities in 2007–2012
[Percentage points]
Commodity 2007 2008 2009 2010 2011 2012
All tourism goods and services ............................................. 3.71 5.66 –3.50 3.44 4.96 2.50 Traveler accommodations...................................................... 0.81 0.38 –0.59 –0.12 0.33 0.37 Food and beverage services ................................................. 0.59 0.72 0.54 0.20 0.38 0.45 Transportation........................................................................ 1.61 3.61 –3.75 3.06 3.66 1.19
Passenger air transportation ............................................. 0.44 1.58 –1.52 1.42 1.18 0.73 Domestic passenger air transportation services ........... 0.12 0.94 –0.63 0.67 0.70 0.41 International passenger air transportation services ...... 0.32 0.64 –0.89 0.75 0.48 0.32
All other transpor tation-related commodities..................... 1.17 2.02 –2.23 1.64 2.49 0.46 Passenger rail transportation services .......................... 0.01 0.01 0.00 0.00 0.01 0.01 Passenger water transpor tation services ...................... –0.01 –0.02 –0.10 0.01 –0.01 –0.03 Intercity bus services..................................................... 0.00 0.02 0.01 0.01 0.01 0.01 Intercity charter bus services ........................................ 0.01 0.01 0.01 0.01 0.01 0.01 Local bus and other transpor tation services ................. 0.01 0.02 0.02 0.02 0.02 0.01 Taxicab services ............................................................ 0.01 0.02 0.02 0.02 0.02 0.01 Scenic and sightseeing transportation services ............ 0.01 0.01 0.01 0.00 0.00 0.01 Automotive rental and leasing ....................................... 0.10 0.34 0.34 –0.03 –0.09 –0.10 Other vehicle rental and leasing.................................... 0.01 0.01 0.00 0.00 0.00 0.00 Automotive repair services ............................................ 0.05 0.07 0.05 0.03 0.03 0.02 Parking .......................................................................... 0.01 0.02 0.02 0.01 0.01 0.02 Highway tolls ................................................................. 0.00 0.01 –0.01 0.01 0.01 0.00 Travel arrangement and reservation services................ 0.10 0.00 0.03 0.05 0.05 0.02 Gasoline ........................................................................ 0.85 1.52 –2.64 1.50 2.42 0.46
Recreation, entertainment, and shopping ............................. 0.70 0.95 0.31 0.30 0.58 0.49 Recreation and entertainment ........................................... 0.38 0.39 0.06 0.17 0.20 0.20
Motion pictures and performing arts.............................. 0.07 0.05 0.03 0.03 0.02 0.04 Spectator sports ............................................................ 0.05 0.05 0.02 0.02 0.00 0.03 Participant sports .......................................................... 0.03 0.02 –0.01 0.01 0.02 0.02 Gambling ....................................................................... 0.15 0.19 –0.02 0.08 0.15 0.09 All other recreation and entertainment .......................... 0.09 0.08 0.03 0.03 0.01 0.02
Nondurable PCE commodities other than gasoline........... 0.31 0.56 0.25 0.13 0.39 0.29
PCE Personal consumption expenditures
PCE Personal consumption expenditures
Chart 2. Contributions to Annual Growth in the Chain-Type Price Index for Tourism Goods and Services in 2009–2012
Percent
U.S. Bureau of Economic Analysis
Overall annual growth –3.5 % in 2009 3.4 % in 2010 5.0 % in 2011 2.5 % in 2012
4
3
2
1
0
–1
–2
–3
–4 2009 2010 2011 2012
Traveler accommodations Food and beverage services Transportation Recreation, entertainment, and shopping
means that every dollar of direct tourism output required an additional 68 cents of indirect tourism output (chart 3).
Direct tourism output includes goods and services sold directly to visitors, such as passenger air travel. Indirect tourism output includes sales of all goods and services used to produce that direct output, such as jet fuel to fly the plane and catering services for longer international flights.

8
9
9
10
10
38
U.S. Travel and Tourism Satellite Accounts June 2013
Chart 3. Total Tourism-Related Output in 2009–2012 Chart 4. U.S. Trade in Tourism in 2007–2012 Billions of dollars Billions of dollars
U.S. Bureau of Economic Analysis
1,600
1,400
1,200
1,000
800
600
400
200
0
Direct Indirect Total
Billions of current dollars
2009 2010 2011 2012
The Composition of Tourism Demand The travel and tourism accounts include estimates of the composition of tourism demand by type of visitor. They distinguish expenditures of U.S. residents traveling abroad from those of U.S. residents and nonresidents traveling within the United States for leisure, business, or government purposes. Net exports of tourism trade is derived by subtracting expenditures on foreign travel by U.S. residents (an import of goods and services to outbound travelers) from expenditures on U.S. travel by nonresidents (an export of goods and services to inbound travelers).
International travel and tourism Current-dollar international travel (the sum of inbound and outbound travel) increased 6.5 percent in 2012 after increasing 10.5 percent in 2011. The increase in inbound activity was larger than the increase in outbound activity, which resulted in a robust increase in travel and tourism net exports ($46.3 billion, table G).
Table G. U.S. International Travel and Tourism in 2007–2012 [Billions of dollars]
2007 2008 2009 2010 2011 2012
Total international travel and tourism ................... 226.3 252.9 220.0 237.7 262.7 279.8 Inbound travel and tourism ....................................... 121.4 140.2 119.4 133.5 151.5 163.0 Outbound travel and tourism..................................... 104.8 112.7 100.6 104.2 111.2 116.7 Net exports of travel and tourism .............................. 16.6 27.5 18.8 29.3 40.3 46.3
Inbound travel and tourism. This consists of travel-related expenditures and international transportation purchases from U.S. providers by nonresidents traveling in the United States. In 2012, inbound tourism grew 7.6 percent to $163.0 billion after increasing 13.5 percent in 2011 (chart 4). The growth reflected
200
180
160
140
120
100
80
60
40
20
0
U.S. Bureau of Economic Analysis
Inbound (left axis) Outbound (left axis) Net exports (right axis)
2007 2008 2009 2010 2011 2012
50
45
40
35
30
25
20
15
10
5
0
the improvement of the global economy as visitors from countries with relatively stronger currencies continued to increase.2
Outbound travel and tourism. This consists of travel-related expenditures and international transportation purchases from foreign providers by U.S. residents traveling abroad. In 2012, outbound activity increased 5.0 percent to $116.7 billion.
Internal travel and tourism. This consists of travel and tourism within the borders of the United States—the sum of domestic activity and inbound activity.3 Inbound travel and tourism’s share of internal tourism in 2011 (the most recent year for which data are available) accounted for 15.0 percent of total internal tourism (table H and chart 5).
National tourism. This consists of travel and tourism by U.S. residents, both within the United States and abroad—the sum of domestic tourism and outbound tourism. The calculation of outbound tourism
2. See Sarah P. Scott, “U.S. International Transactions,” SURVEY OF CURRENT
BUSINESS 93 (April 2013): 28–37. 3. As a component of internal tourism, the calculation of inbound tour
ism is modified to exclude all expenditures on international transportation, whether purchased from foreign or U.S. providers, so that expenditures by U.S. residents traveling within the United States (domestic tourism) can be compared with expenditures by nonresidents traveling within the United States (inbound tourism).
Table H. Internal Travel and Tourism in the United States by Residents and Nonresidents in 2005–2011
Year
Millions of dollars Share
Residents Nonresidents (inbound) Total Residents Nonresidents
(inbound)
2005 ...................................... 2006 ...................................... 2007 ...................................... 2008 ...................................... 2009 ...................................... 2010 ...................................... 2011 ......................................
593,195 646,023 673,897 655,426 572,407 588,440 657,650
81,843 85,815 96,922
110,387 94,181
103,443 116,035
675,038 731,838 770,819 765,813 666,588 691,883 773,685
87.9 88.3 87.4 85.6 85.9 85.0 85.0
12.1 11.7 12.6 14.4 14.1 15.0 15.0

8
9
9
10
10
39
June 2013 SURVEY OF CURRENT BUSINESS
includes all expenditures on international transportation, whether purchased from foreign or U.S. provid-
Chart 5. Inbound Tourism’s Share of Internal Travel and Tourism in 2007–2011
Percent
U.S. Bureau of Economic Analysis
15.5
15.0
14.5
14.0
13.5
13.0
12.5
12.0 2007 2008 2009 2010 2011
ers so that expenditures by U.S. residents traveling within the United States (domestic tourism) are consistent with expenditures by U.S. residents traveling abroad (outbound tourism). Outbound tourism’s share of national tourism was 18.0 percent in 2011 (the most recent year for which data are available), which is down from the peak of 18.9 percent in 2010 (table I and chart 6).
Table I. National Travel and Tourism in the United States and Abroad in 2005–2011
Year
Millions of dollars Percent
In the United States
Abroad (outbound) Total In the
United States Abroad
(outbound)
2005 ...................................... 2006 ...................................... 2007 ...................................... 2008 ...................................... 2009 ...................................... 2010 ...................................... 2011 ......................................
593,195 646,023 673,897 655,426 572,407 588,440 657,650
121,341 130,639 137,225 144,647 127,623 136,983 144,273
714,536 776,662 811,122 800,073 700,031 725,423 801,923
83.0 83.2 83.1 81.9 81.8 81.1 82.0
17.0 16.8 16.9 18.1 18.2 18.9 18.0
Key Terms The following key terms are used to describe the travel Tourism employment. Total tourism-related employ-and tourism satellite accounts. ment consists of direct tourism employment plus indirect
Domestic tourism. Travel-related expenditures by U.S. tourism employment. Direct tourism employment comresidents traveling within the United States. It comprises prises all jobs where the workers are engaged in the pro-travel by resident households, business travel, and travel duction of direct tourism output (for example, hotel staff by government employees. and airline pilots), and indirect tourism employment
Inbound tourism. Travel-related expenditures by non- comprises all jobs where the workers are engaged in the residents traveling within the United States and expendi- production of indirect tourism output (for example, tures by nonresidents on international transportation workers producing hotel toiletries and delivering fuel to purchased from U.S. providers. 1 These expenditures airlines). exclude expenditures for travel to study in the United Tourism output. Total tourism-related output consists States and for medical reasons. of direct tourism output and indirect tourism output.
Internal tourism. The sum of domestic tourism Direct tourism output comprises all domestically pro-expenditures and inbound tourism expenditures (net of duced goods and services purchased by travelers (for all international transportation expenditures). example, traveler accommodations and passenger air
National tourism. The sum of domestic tourism transportation), and indirect tourism output comprises demand and outbound tourism demand (including all all output required to support the production of direct international transportation expenditures). tourism output (for example, toiletries for hotel guests
Outbound tourism. Travel-related expenditures by and fuel for airplanes). U.S. residents traveling abroad and expenditures by U.S. Usual environment. The area of normal, everyday residents on international transportation purchased from activities within 50–100 miles of home.3
foreign providers. Visitor. A person who travels outside of his or her Tourism commodities. Goods and services that are usual environment for less than a year or who stays over-
typically purchased by visitors, such as airline passenger night in a hotel or motel. The visitor may travel for plea-transportation, hotel accommodations, and meals.2 sure or business (private sector or government). Visitors
exclude travelers who expect to be compensated at the location of their visit (such as migrant workers, persons
visitors are not differentiated by type of visitor, because the data to pre- traveling to new assignments, and diplomatic and milipare these estimates are not available.
1. In the travel and tourism satellite accounts, inbound and outbound
tary personnel traveling to and from their duty stations 2. The classification of tourism commodities in the travel and tourism
and their home countries). satellite accounts is based on a list of primary activities of visitors that was developed from recommendations by the World Tourism Organization, by the Organization for Economic Co-operation and Development, and from various surveys of U.S. visitors. 3. The usual environment depends on the availability of source data.

8
9
9
10
10
8
9
9
10
10
40
U.S. Travel and Tourism Satellite Accounts June 2013
Chart 6. Outbound Tourism’s Share of National Chart 7. Business Travel’s Share of Domestic Travel and Tourism in 2007–2011 Travel and Tourism in 2007–2011
Percent
U.S. Bureau of Economic Analysis
19.0
18.5
18.0
17.5
17.0
16.5 2007 2008 2009 2010 2011
Domestic travel and tourism Domestic tourism includes travel and tourism by U.S. residents within the borders of the United States. Puerto Rico, the U.S. Virgin Islands, and the other U.S. territories are outside of this defined boundary and are classified in “international travel.” The travel and tourism accounts break out all expenditures on domestic travel and tourism by type of visitor: resident households, business, and government. Business’ share of domestic travel and tourism increased to 33.0 percent in 2011 (the most recent year for which data are available). Government expenditures accounted for 4.9 percent of domestic travel and tourism in 2011, a slight decrease from the share in 2010. In general, government travel is more stable than business or leisure travel, and as a result, government’s share tends to increase during downturns in travel and tourism and decrease during upturns. (table J and chart 7).
Tourism Value Added and Employment
Value added A sector’s value added measures its contribution to gross domestic product (GDP). In 2011 (the most recent year for which data are available), the travel and tourism industry’s share of GDP was 2.8 percent (table K). Travel and tourism’s share of GDP remains a larger share of GDP than industries such as broadcasting and telecommunications, utilities, and computer and electronic products manufacturing.
Direct employment Direct tourism employment includes jobs that involve producing goods and services that are sold directly to visitors. Examples include restaurant servers, hotel
Percent
U.S. Bureau of Economic Analysis
35.0
34.5
34.0
33.5
33.0
32.5
32.0
31.5 2007 2008 2009 2010 2011
Table J. Domestic Travel and Tourism by Type of Visitor in 2005–2011
Year
Millions of dollars Percent
Resident households Business Government Total Resident
households Business Government
2005 ........ 375,251 199,380 26,208 600,839 62.5 33.2 4.4 2006 ........ 405,254 220,773 27,807 653,834 62.0 33.8 4.3 2007 ........ 422,036 231,513 28,369 681,918 61.9 34.0 4.2 2008 ........ 405,734 228,482 29,055 663,270 61.2 34.4 4.4 2009 ........ 363,677 185,081 30,782 579,540 62.8 31.9 5.3 2010 ........ 372,005 193,165 30,988 596,158 62.4 32.4 5.2 2011 ........ 413,730 219,853 32,339 665,922 62.1 33.0 4.9
Table K. Travel and Tourism as a Share of Gross Domestic Product in 2005–2011
Year
Billions of dollars Percent
Gross domestic product (GDP) Tourism value added Tourism value added
as a share of GDP
2005 ............................................ 12,623 376 2.98 2006 ............................................ 13,377 402 3.01 2007 ............................................ 14,029 422 3.01 2008 ............................................ 14,292 399 2.79 2009 ............................................ 13,974 367 2.63 2010 ............................................ 14,499 381 2.63 2011 ............................................ 15,076 415 2.75
Acknowledgments David B.Wasshausen and Paul V. Kern of the Industry Sector Division supervised the preparation of the estimates. Steven L. Zemanek prepared the estimates.
Staff members of the Industry Sector Division, the Industry Applications Division, the National Income and Wealth Division, the Government Division, and the Regional Income Division contributed to the development of the estimates.
The Office of Travel and Tourism Industries of the International Trade Administration provided funding for the preparation of the travel and tourism satellite accounts.
41
June 2013 SURVEY OF CURRENT BUSINESS
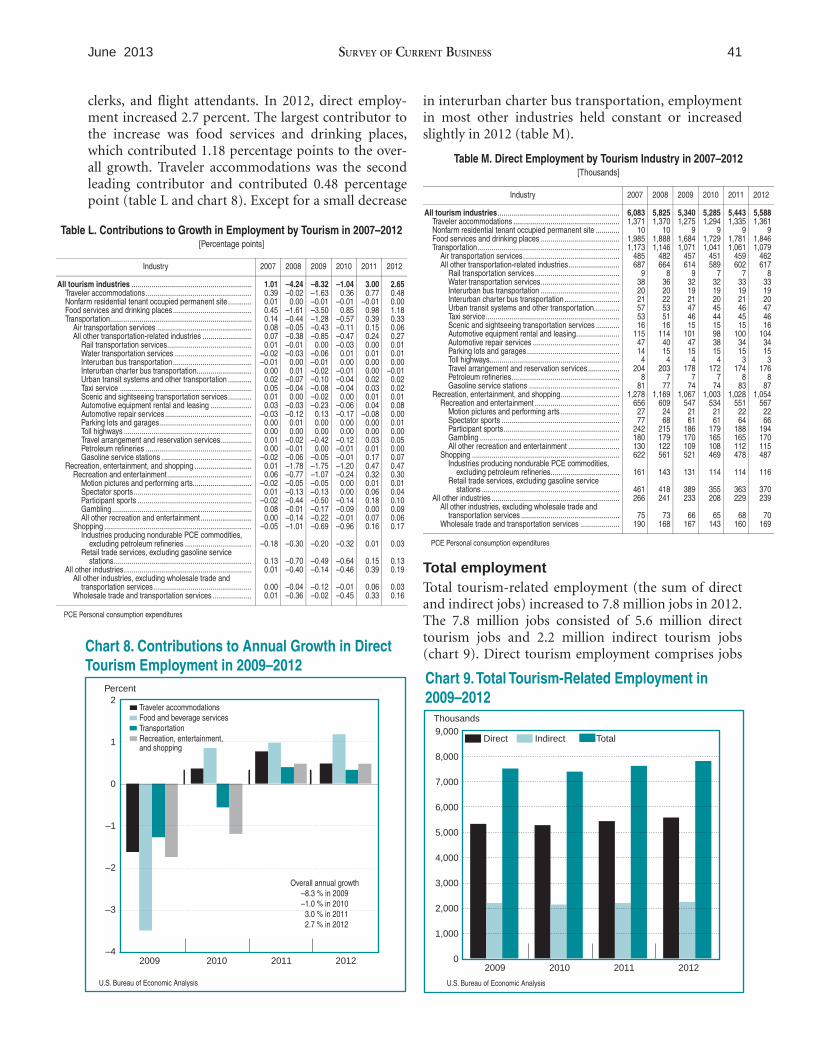
clerks, and flight attendants. In 2012, direct employment increased 2.7 percent. The largest contributor to the increase was food services and drinking places, which contributed 1.18 percentage points to the overall growth. Traveler accommodations was the second leading contributor and contributed 0.48 percentage point (table L and chart 8). Except for a small decrease
Table L. Contributions to Growth in Employment by Tourism in 2007–2012 [Percentage points]
Industry 2007 2008 2009 2010 2011 2012
All tourism industries ............................................................. 1.01 –4.24 –8.32 –1.04 3.00 2.65 Traveler accommodations...................................................... 0.39 –0.02 –1.63 0.36 0.77 0.48 Nonfarm residential tenant occupied permanent site ............ 0.01 0.00 –0.01 –0.01 –0.01 0.00 Food services and drinking places ........................................ 0.45 –1.61 –3.50 0.85 0.98 1.18 Transportation........................................................................ 0.14 –0.44 –1.28 –0.57 0.39 0.33
Air transportation services ................................................ 0.08 –0.05 –0.43 –0.11 0.15 0.06 All other transpor tation-related industries ......................... 0.07 –0.38 –0.85 –0.47 0.24 0.27
Rail transportation services........................................... 0.01 –0.01 0.00 –0.03 0.00 0.01 Water transportation services ....................................... –0.02 –0.03 –0.06 0.01 0.01 0.01 Interurban bus transportation ........................................ –0.01 0.00 –0.01 0.00 0.00 0.00 Interurban charter bus transportation............................ 0.00 0.01 –0.02 –0.01 0.00 –0.01 Urban transit systems and other transpor tation ............ 0.02 –0.07 –0.10 –0.04 0.02 0.02 Taxi service ................................................................... 0.05 –0.04 –0.08 –0.04 0.03 0.02 Scenic and sightseeing transportation services ............ 0.01 0.00 –0.02 0.00 0.01 0.01 Automotive equipment rental and leasing ..................... 0.03 –0.03 –0.23 –0.06 0.04 0.08 Automotive repair services ............................................ –0.03 –0.12 0.13 –0.17 –0.08 0.00 Parking lots and garages............................................... 0.00 0.01 0.00 0.00 0.00 0.01 Toll highways ................................................................. 0.00 0.00 0.00 0.00 0.00 0.00 Travel arrangement and reservation services................ 0.01 –0.02 –0.42 –0.12 0.03 0.05 Petroleum refineries ...................................................... 0.00 –0.01 0.00 –0.01 0.01 0.00 Gasoline service stations .............................................. –0.02 –0.06 –0.05 –0.01 0.17 0.07
Recreation, entertainment, and shopping ............................. 0.01 –1.78 –1.75 –1.20 0.47 0.47 Recreation and entertainment ........................................... 0.06 –0.77 –1.07 –0.24 0.32 0.30
Motion pictures and performing arts.............................. –0.02 –0.05 –0.05 0.00 0.01 0.01 Spectator sports ............................................................ 0.01 –0.13 –0.13 0.00 0.06 0.04 Participant sports .......................................................... –0.02 –0.44 –0.50 –0.14 0.18 0.10 Gambling ....................................................................... 0.08 –0.01 –0.17 –0.09 0.00 0.09 All other recreation and entertainment .......................... 0.00 –0.14 –0.22 –0.01 0.07 0.06
Shopping ........................................................................... –0.05 –1.01 –0.69 –0.96 0.16 0.17 Industries producing nondurable PCE commodities,
excluding petroleum refineries .................................. –0.18 –0.30 –0.20 –0.32 0.01 0.03 Retail trade services, excluding gasoline service
stations ...................................................................... 0.13 –0.70 –0.49 –0.64 0.15 0.13 All other industries................................................................. 0.01 –0.40 –0.14 –0.46 0.39 0.19
All other industries, excluding wholesale trade and transportation services .................................................. 0.00 –0.04 –0.12 –0.01 0.06 0.03
Wholesale trade and transpor tation services .................... 0.01 –0.36 –0.02 –0.45 0.33 0.16
PCE Personal consumption expenditures
Chart 8. Contributions to Annual Growth in Direct Tourism Employment in 2009–2012
Percent
U.S. Bureau of Economic Analysis
Overall annual growth –8.3 % in 2009 –1.0 % in 2010 3.0 % in 2011 2.7 % in 2012
2
1
0
–1
–2
–3
–4 2009 2010 2011 2012
Traveler accommodations Food and beverage services Transportation Recreation, entertainment, and shopping
in interurban charter bus transportation, employment in most other industries held constant or increased slightly in 2012 (table M).
Table M. Direct Employment by Tourism Industry in 2007–2012 [Thousands]
Industry 2007 2008 2009 2010 2011 2012
All tourism industries .............................................................. 6,083 5,825 5,340 5,285 5,443 5,588 Traveler accommodations ...................................................... 1,371 1,370 1,275 1,294 1,335 1,361 Nonfarm residential tenant occupied permanent site ............ 10 10 9 9 9 9 Food services and drinking places ........................................ 1,985 1,888 1,684 1,729 1,781 1,846 Transportation ........................................................................ 1,173 1,146 1,071 1,041 1,061 1,079
Air transportation services ................................................. 485 482 457 451 459 462 All other transportation-related industries.......................... 687 664 614 589 602 617
Rail transportation services ........................................... 9 8 9 7 7 8 Water transportation services........................................ 38 36 32 32 33 33 Interurban bus transportation ........................................ 20 20 19 19 19 19 Interurban charter bus transportation ............................ 21 22 21 20 21 20 Urban transit systems and other transportation............. 57 53 47 45 46 47 Taxi service .................................................................... 53 51 46 44 45 46 Scenic and sightseeing transpor tation services ............ 16 16 15 15 15 16 Automotive equipment rental and leasing...................... 115 114 101 98 100 104 Automotive repair services ............................................ 47 40 47 38 34 34 Parking lots and garages ............................................... 14 15 15 15 15 15 Toll highways.................................................................. 4 4 4 4 3 3 Travel arrangement and reservation services ................ 204 203 178 172 174 176 Petroleum refineries....................................................... 8 7 7 7 8 8 Gasoline service stations .............................................. 81 77 74 74 83 87
Recreation, entertainment, and shopping.............................. 1,278 1,169 1,067 1,003 1,028 1,054 Recreation and entertainment ........................................... 656 609 547 534 551 567
Motion pictures and performing arts .............................. 27 24 21 21 22 22 Spectator sports ............................................................ 77 68 61 61 64 66 Participant spor ts........................................................... 242 215 186 179 188 194 Gambling ....................................................................... 180 179 170 165 165 170 All other recreation and entertainment .......................... 130 122 109 108 112 115
Shopping ........................................................................... Industries producing nondurable PCE commodities,
622 561 521 469 478 487
excluding petroleum refineries................................... Retail trade services, excluding gasoline service
161 143 131 114 114 116
stations ...................................................................... 461 418 389 355 363 370 All other industries .................................................................
All other industries, excluding wholesale trade and 266 241 233 208 229 239
transportation services .................................................. 75 73 66 65 68 70 Wholesale trade and transpor tation services .................... 190 168 167 143 160 169
PCE Personal consumption expenditures
Total employment Total tourism-related employment (the sum of direct and indirect jobs) increased to 7.8 million jobs in 2012. The 7.8 million jobs consisted of 5.6 million direct tourism jobs and 2.2 million indirect tourism jobs (chart 9). Direct tourism employment comprises jobs
Chart 9. Total Tourism-Related Employment in 2009–2012
Thousands
9,000
8,000
7,000
6,000
5,000
4,000
3,000
2,000
1,000
0
Direct Indirect Total
2009 2010 2011 2012
U.S. Bureau of Economic Analysis

42 U.S. Travel and Tourism Satellite Accounts June 2013
that produce direct tourism output, such as airline pilots, and indirect tourism employment comprises jobs that produce indirect tourism output, such as refinery workers producing jet fuel. The most recent data indicate that for every 10 direct tourism jobs generated, an additional four jobs are indirectly generated.
Data Table Guide and Methodology The advance estimates for 2012 are presented in three tables. The first table presents direct and total tourism-related output. The second table presents direct and total tourism-related employment. The third table presents real tourism output. The revised estimates for 2011 are presented in a set of eight core tables: Production of commodities by industry, supply and consumption of commodities, demand for commodities by type of visitor, output and value added by industry, output by commodity, employment and compensation of employees by industry, total tourism-related employment by industry, and real tourism output.
Table 1. Production of Commodities by Industry This table presents 26 industry categories that produce goods and services purchased by visitors and the value of that production. It presents estimates of each industry’s value added and the three value added components: Compensation of employees, “taxes on production and imports, less subsidies,” and gross operating surplus.
The estimates of commodities purchased by visitors and the industries that produce the commodities are from the annual input-output (I-O) accounts. Production data are extracted and arranged into a matrix. This table shows the tourism-related commodities (rows) produced by each tourism-related industry (columns).
Table 2. Supply and Consumption of Commodities This table presents information on the supply of 32 commodities (valued in producers’ prices and purchasers’ prices), and the consumption of these commodities (valued in purchasers’ prices) as intermediate purchases by business and government and as final purchases by resident households, business, government, and foreigners.
The estimates of total supply in purchasers’ prices are derived by summing domestic production by commodity in producers’ prices, imports, wholesale and retail margins, and transportation costs and by adjusting for change in private inventories. Total consumption is the sum of intermediate expenditures (private
and government), personal consumption expenditures, gross private fixed investment, government final expenditures, and exports of goods and services.
Data on imports, changes in private inventories, wholesale trade and transportation costs, and retail trade margins are extracted from the annual I-O accounts and added to the estimates for domestic production found in table 1 to arrive at estimates for total supply, by commodity. Then, using more data from the annual I-O accounts, the estimates for total supply are disaggregated into intermediate private expenditures, intermediate government expenditures, personal consumption expenditures, gross private fixed investment, government final expenditures, and exports.
Table 3. Demand for Commodities by Type of Visitor This table details the portion of total consumption of each commodity consumed by four types of visitors— resident households, businesses, government, and nonresidents. For each commodity, the table also provides a tourism commodity ratio—visitor consumption divided by total consumption. A commodity’s tourism commodity ratio indicates the share of its output that is sold to visitors.
These estimates are based on survey data on visitor spending behavior that are used to break down total consumption estimates from the supply and consumption of commodities table into tourism demand by type of visitor.4 Total tourism demand is the sum of demand by the four types of domestic visitors (resident households, business, government, and nonresidents).
Table 3a. Demand for Commodities by Type of Visitor (Unadjusted for Travel Arrangement Commissions) This table presents the same data as “Table 3. Demand for Commodities by Type of Visitor,” but travel agency commissions have not been moved.
Table 4. Output and Value Added by Industry This table presents estimates of tourism output, intermediate consumption, and value added by industry. It also presents each industry’s total output, total intermediate consumption, and total value added. Each industry’s tourism industry ratio is also provided. This ratio represents the share of each industry’s output,
4. The surveys used to estimate demand for commodities by type of visitor are the Consumer Expenditure Survey of the Bureau of Labor Statistics, the Survey of International Air Travelers (SIAT) of the Department of Commerce’s International Trade Administration, and private surveys done by D.K. Shifflet and Associates.

43 June 2013 SURVEY OF CURRENT BUSINESS
intermediate consumption, and value added that is consumed by visitors.
Tourism industry ratios are calculated from estimates in the production by industry table (table 1) and from the demand for commodities table (table 3). The industry output estimates from the production table are multiplied by the tourism commodity ratios from the demand table in order to obtain tourism industry ratios. The estimates of tourism output, tourism intermediate consumption, and tourism value added are calculated by multiplying industry output, intermediate consumption, and value added by the tourism industry ratios.
Table 5. Output by Tourism Commodity This table presents estimates of direct tourism output and total tourism-related output by commodity. For each commodity, the table also presents domestic production (at purchasers’ prices), the tourism commodity ratio, and the total commodity output multiplier.
For each commodity, direct tourism output is calculated by multiplying the values for total commodity production found in table 1 by the tourism commodity ratios found in table 3. Then, utilizing total commodity output multipliers derived from the annual I-O accounts, each commodity’s total tourism-related output is estimated by multiplying its direct tourism output by its total output multiplier.
Table 6. Employment and Employee Compensation by Industry This table presents estimates of tourism employment, tourism compensation, and average compensation per tourism employee by industry. This table also presents total industry employment, total industry compensation, and tourism industry ratios.
Industry employment and compensation data are extracted from the annual I-O accounts and multiplied by each industry’s tourism output ratio from table 4 to produce estimates for tourism employment and tourism compensation by industry. Average compensation per tourism employee by industry is calculated by dividing tourism compensation by tourism employment for each industry.
Table 7. Total Tourism-Related Employment by Industry This table presents estimates of direct tourism employment, the total industry multiplier, and the total tourism-related employment.
Utilizing total industry employment multipliers supplied by BEA’s Regional Economic Accounts, each industry’s total tourism-related employment is estimated by multiplying its direct tourism employment by its total employment multiplier.
Table 8. Real Tourism Output by Commodity This table presents estimates of direct tourism output in current dollars by commodity, chain-type price indexes for each commodity, and real output for each commodity.
Price data are extracted from the annual I-O accounts to calculate chain-type price indexes for 21 of the 24 tourism commodities. The remaining three tourism commodities—international passenger air transportation, gasoline, and nondurable Personal Consumption Expenditures (PCE) commodities other than gasoline—use price data from the National Income and Product Accounts (NIPAs). The chain-type indexes are used to deflate the estimates for current-dollar direct tourism output presented in table 5, creating estimates of real tourism output.
Tables 1 through 8 follow.