Embed Size (px)
Citation preview
FAST Diagrams: The Foundation for Creating Effective Function Models
Presented to:
General Dynamics Land Systems November 28-‐29, 2011
John Borza President
Value Innovation, LLC
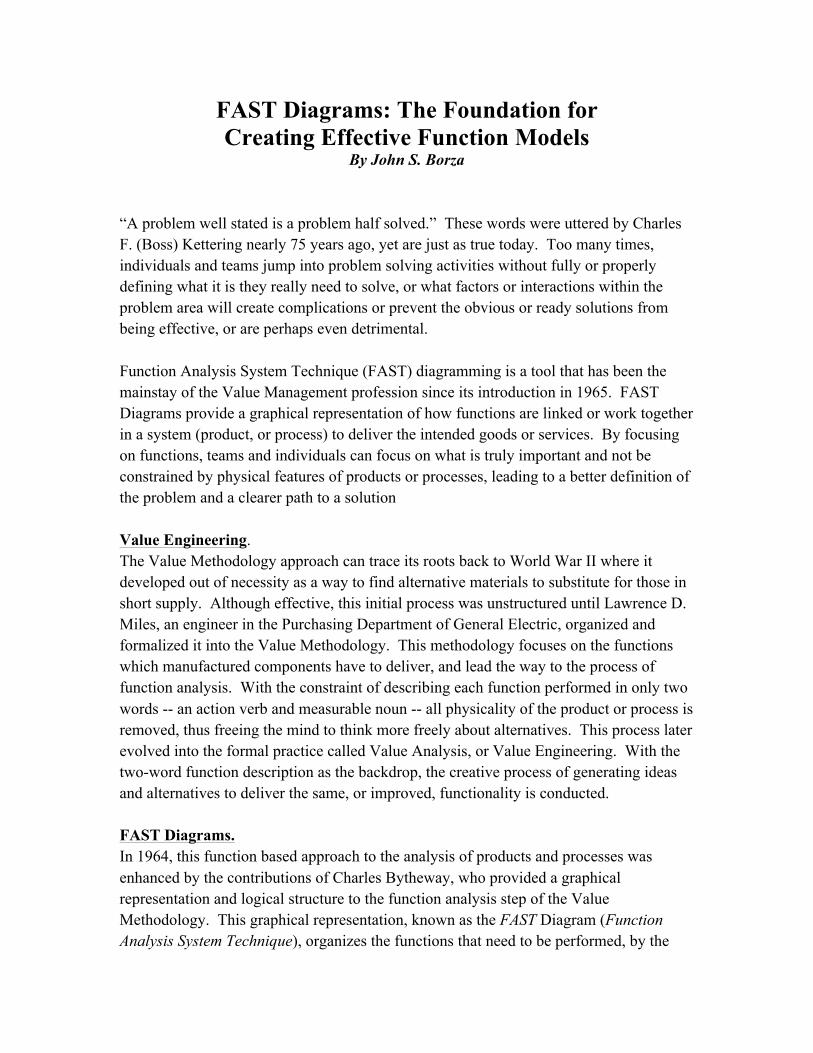
FAST Diagrams: The Foundation for Creating Effective Function Models
By John S. Borza “A problem well stated is a problem half solved.” These words were uttered by Charles F. (Boss) Kettering nearly 75 years ago, yet are just as true today. Too many times, individuals and teams jump into problem solving activities without fully or properly defining what it is they really need to solve, or what factors or interactions within the problem area will create complications or prevent the obvious or ready solutions from being effective, or are perhaps even detrimental. Function Analysis System Technique (FAST) diagramming is a tool that has been the mainstay of the Value Management profession since its introduction in 1965. FAST Diagrams provide a graphical representation of how functions are linked or work together in a system (product, or process) to deliver the intended goods or services. By focusing on functions, teams and individuals can focus on what is truly important and not be constrained by physical features of products or processes, leading to a better definition of the problem and a clearer path to a solution Value Engineering. The Value Methodology approach can trace its roots back to World War II where it developed out of necessity as a way to find alternative materials to substitute for those in short supply. Although effective, this initial process was unstructured until Lawrence D. Miles, an engineer in the Purchasing Department of General Electric, organized and formalized it into the Value Methodology. This methodology focuses on the functions which manufactured components have to deliver, and lead the way to the process of function analysis. With the constraint of describing each function performed in only two words -- an action verb and measurable noun -- all physicality of the product or process is removed, thus freeing the mind to think more freely about alternatives. This process later evolved into the formal practice called Value Analysis, or Value Engineering. With the two-word function description as the backdrop, the creative process of generating ideas and alternatives to deliver the same, or improved, functionality is conducted. FAST Diagrams. In 1964, this function based approach to the analysis of products and processes was enhanced by the contributions of Charles Bytheway, who provided a graphical representation and logical structure to the function analysis step of the Value Methodology. This graphical representation, known as the FAST Diagram (Function Analysis System Technique), organizes the functions that need to be performed, by the
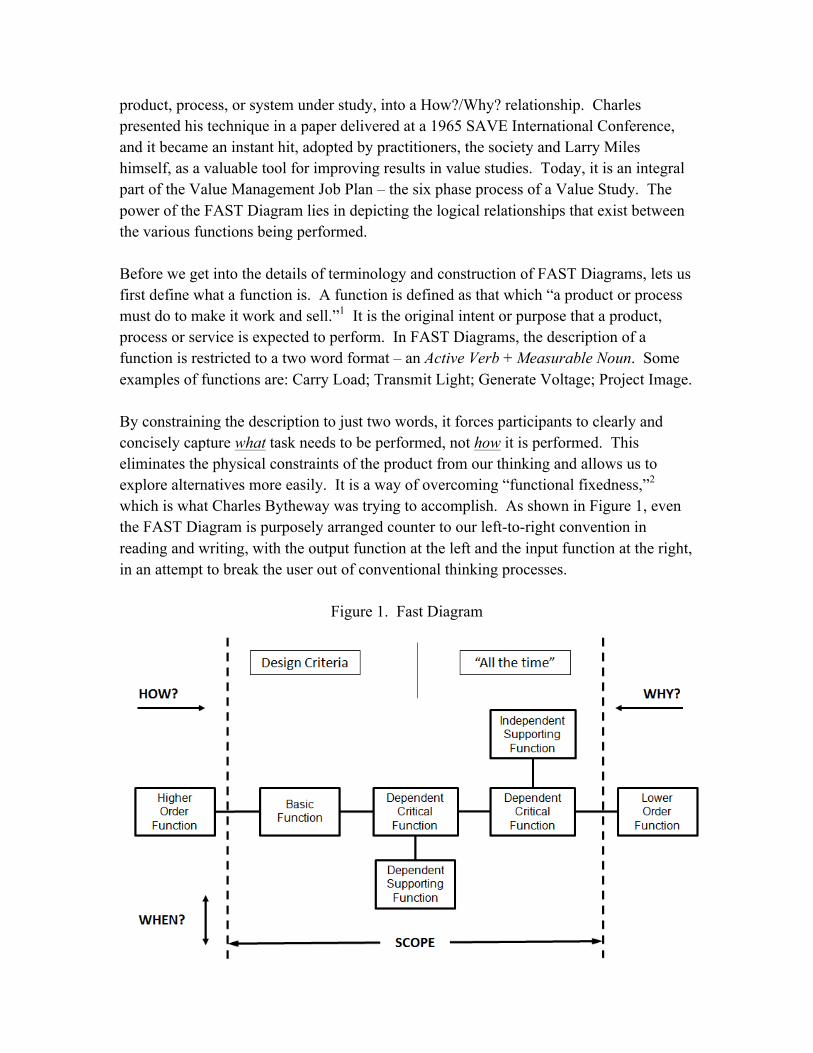
product, process, or system under study, into a How?/Why? relationship. Charles presented his technique in a paper delivered at a 1965 SAVE International Conference, and it became an instant hit, adopted by practitioners, the society and Larry Miles himself, as a valuable tool for improving results in value studies. Today, it is an integral part of the Value Management Job Plan – the six phase process of a Value Study. The power of the FAST Diagram lies in depicting the logical relationships that exist between the various functions being performed. Before we get into the details of terminology and construction of FAST Diagrams, lets us first define what a function is. A function is defined as that which “a product or process must do to make it work and sell.”1 It is the original intent or purpose that a product, process or service is expected to perform. In FAST Diagrams, the description of a function is restricted to a two word format – an Active Verb + Measurable Noun. Some examples of functions are: Carry Load; Transmit Light; Generate Voltage; Project Image. By constraining the description to just two words, it forces participants to clearly and concisely capture what task needs to be performed, not how it is performed. This eliminates the physical constraints of the product from our thinking and allows us to explore alternatives more easily. It is a way of overcoming “functional fixedness,”2 which is what Charles Bytheway was trying to accomplish. As shown in Figure 1, even the FAST Diagram is purposely arranged counter to our left-to-right convention in reading and writing, with the output function at the left and the input function at the right, in an attempt to break the user out of conventional thinking processes.
Figure 1. Fast Diagram
You will note in the figure that there are several different classifications of functions. The two major categories are Basic, and Secondary.
Basic Functions describe the characteristic or task, which, from the user’s point of view, is the primary reason for the existence of an item. It is what the product or process was designed to do. Secondary Functions are those designed-in functions which are required to cause or allow the Basic Function to occur. It is any function that directly contributes to accomplishing the Basic Function.
Secondary Functions can be further sub-divided into several other categories:
Dependent Critical Functions – functions which must occur for the Basic Function to occur or be delivered. Independent (Supporting) Functions are those which help the Basic Function to be delivered better, faster, longer, etc. Design Criteria are performance requirements applicable to the overall subject system. These are typically related directly to the Basic Function. All-the-time Functions are broad requirements applied within the subject scope, and are not usually directly related to the Basic Function. These would be items assumed in the market place as being delivered by the product or process, such as a minimum level of quality and reliability, corrosion resistance, etc.
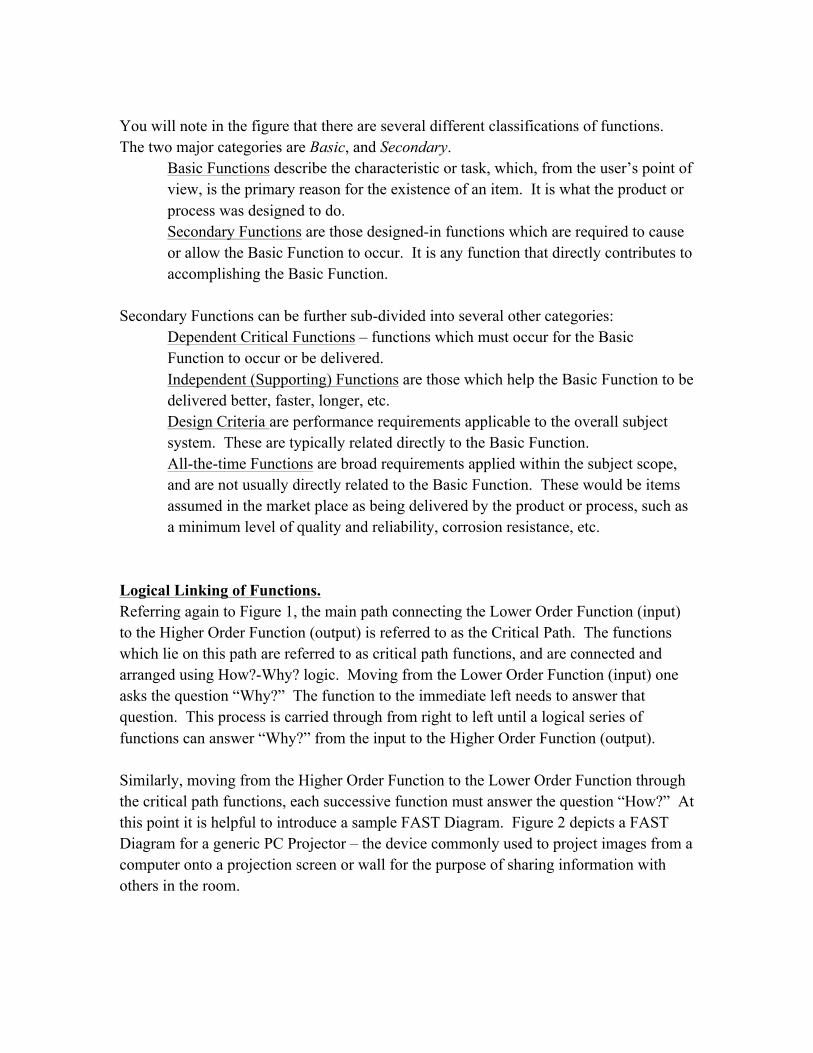
Logical Linking of Functions. Referring again to Figure 1, the main path connecting the Lower Order Function (input) to the Higher Order Function (output) is referred to as the Critical Path. The functions which lie on this path are referred to as critical path functions, and are connected and arranged using How?-Why? logic. Moving from the Lower Order Function (input) one asks the question “Why?” The function to the immediate left needs to answer that question. This process is carried through from right to left until a logical series of functions can answer “Why?” from the input to the Higher Order Function (output). Similarly, moving from the Higher Order Function to the Lower Order Function through the critical path functions, each successive function must answer the question “How?” At this point it is helpful to introduce a sample FAST Diagram. Figure 2 depicts a FAST Diagram for a generic PC Projector – the device commonly used to project images from a computer onto a projection screen or wall for the purpose of sharing information with others in the room.
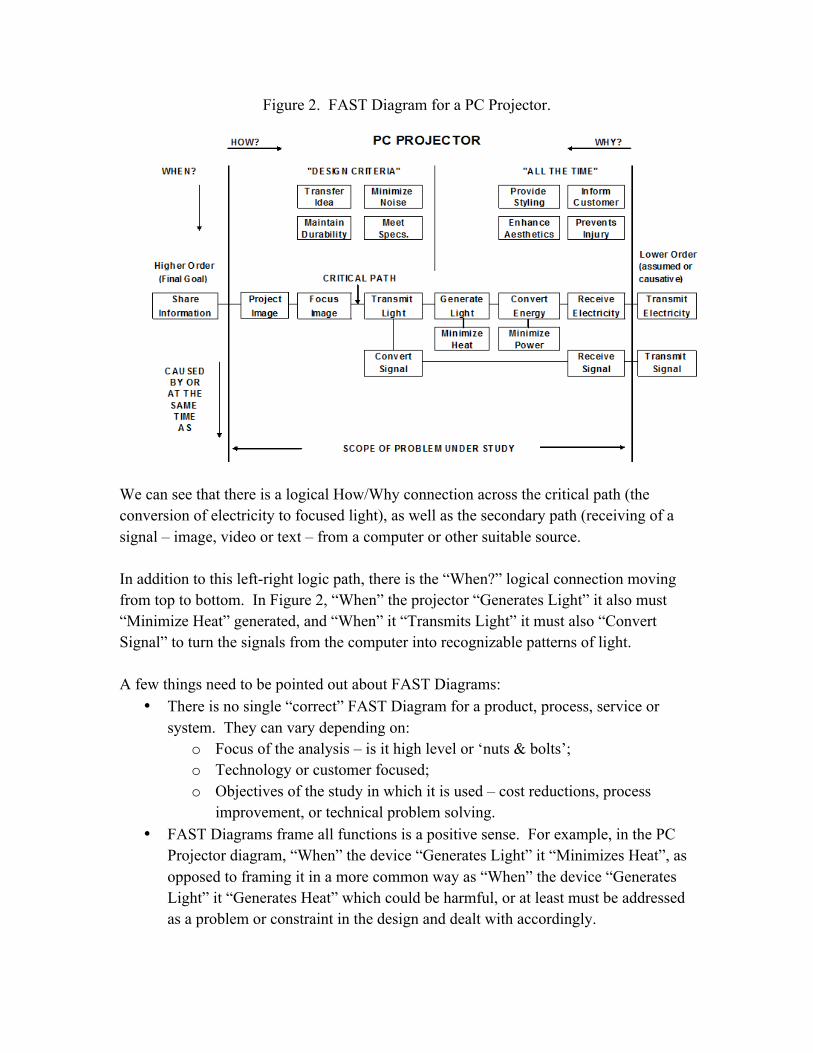
Figure 2. FAST Diagram for a PC Projector.
We can see that there is a logical How/Why connection across the critical path (the conversion of electricity to focused light), as well as the secondary path (receiving of a signal – image, video or text – from a computer or other suitable source. In addition to this left-right logic path, there is the “When?” logical connection moving from top to bottom. In Figure 2, “When” the projector “Generates Light” it also must “Minimize Heat” generated, and “When” it “Transmits Light” it must also “Convert Signal” to turn the signals from the computer into recognizable patterns of light. A few things need to be pointed out about FAST Diagrams:
• There is no single “correct” FAST Diagram for a product, process, service or system. They can vary depending on:
o Focus of the analysis – is it high level or ‘nuts & bolts’; o Technology or customer focused; o Objectives of the study in which it is used – cost reductions, process
improvement, or technical problem solving. • FAST Diagrams frame all functions is a positive sense. For example, in the PC
Projector diagram, “When” the device “Generates Light” it “Minimizes Heat”, as opposed to framing it in a more common way as “When” the device “Generates Light” it “Generates Heat” which could be harmful, or at least must be addressed as a problem or constraint in the design and dealt with accordingly.
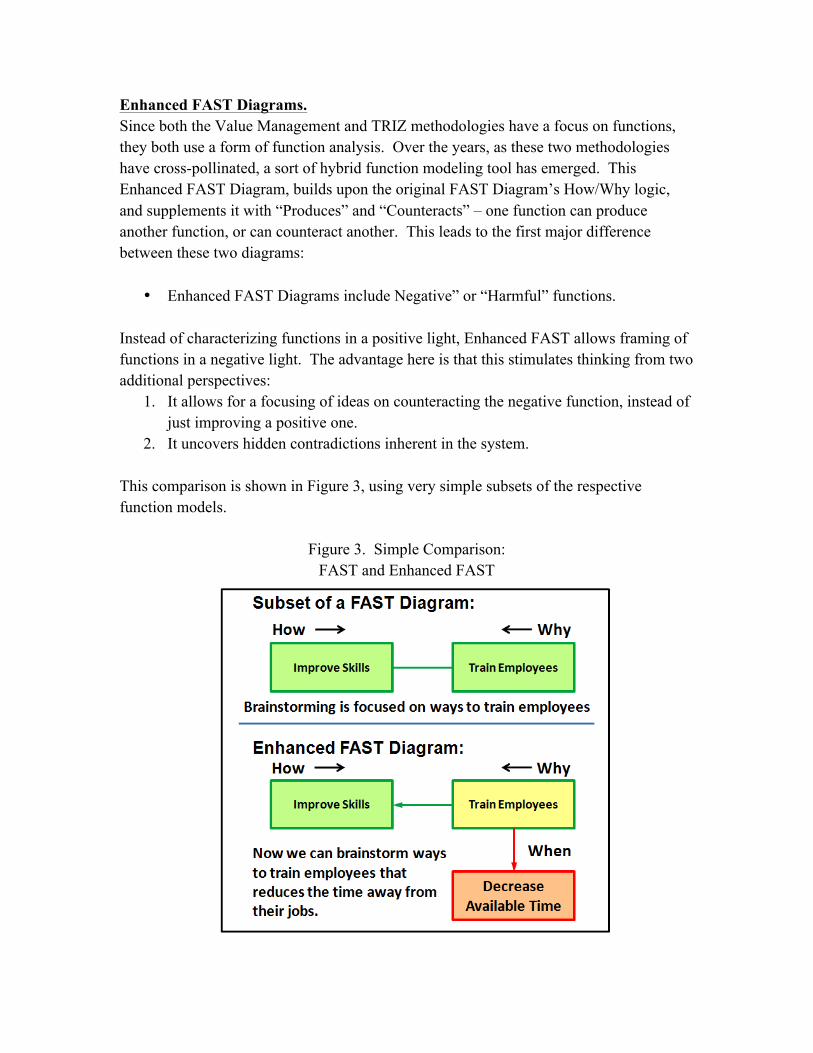
Enhanced FAST Diagrams. Since both the Value Management and TRIZ methodologies have a focus on functions, they both use a form of function analysis. Over the years, as these two methodologies have cross-pollinated, a sort of hybrid function modeling tool has emerged. This Enhanced FAST Diagram, builds upon the original FAST Diagram’s How/Why logic, and supplements it with “Produces” and “Counteracts” – one function can produce another function, or can counteract another. This leads to the first major difference between these two diagrams:
• Enhanced FAST Diagrams include Negative” or “Harmful” functions. Instead of characterizing functions in a positive light, Enhanced FAST allows framing of functions in a negative light. The advantage here is that this stimulates thinking from two additional perspectives:
1. It allows for a focusing of ideas on counteracting the negative function, instead of just improving a positive one.
2. It uncovers hidden contradictions inherent in the system. This comparison is shown in Figure 3, using very simple subsets of the respective function models.
Figure 3. Simple Comparison: FAST and Enhanced FAST
The second, and perhaps most noticeable difference is that the Enhanced FAST allows for a more flexible description of functions. The rigid Action Verb – Measurable Noun two-word format required in FAST is relaxed to accommodate ‘Object-Action-Context” descriptions of functions as well as short descriptions of conditions or events. A third difference is that the FAST diagram does not have directional flow arrows between functions. Directional arrows are necessary in Enhanced FAST Diagrams in order to clarify which function produces or counteracts which other function. This, again, increases the flexibility of the Enhanced FAST function model, as it no longer needs to conform strictly to the left-right “How/Why” logic path, and can branch out in other directions if needed. Building Function Models. There are a number of ways to build function models. Selection of which approach to take is based more on personal preference than situational correctness. If we heed the advice of Steven Covey and “Begin with the end in mind.” we would begin with identifying the primary useful function. From there, build a primary logic path with functions that describe “What” needs to be done, and logically link these through the How/Why logic until the linkage of useful functions from to the input, or triggering event, to the output is complete. Next, add in the Secondary “When” functions, considering all the known problems with the product (or how it is used), or the process under study. A second method to build function models is the Component-Function Mapping approach. In this method, the functions of each physical component in the assembly, process, service or system is identified and relevant functions are mapped into the model. A third approach is Random Function Generation. Here, system functions are identified without regard to “cause and effect” relationships, until the builder has enumerated all the functions they can think of, then, build the model using the logic tests for connecting the listed functions. The step of arranging the listed functions into the logic paths invariably will uncover missed or extraneous functions. A fourth approach is the Eliminate Harm method. This is similar to the first method, but instead of identifying the primary useful function, you start by identify the harmful function or negative effect that you want to eliminate, then proceed as in the first method.
Finally, there is the Critical Function approach, where you begin with the main or critical function being performed in the system, and branch out from there until you have identified the functions of interest and how they interrelate across the scope of the problem under study. Just as with FAST Diagrams, there is no one single “correct” Enhanced FAST Diagram. There are, however, guidelines to ensure that the models are constructed correctly (logic paths and such). Things to avoid when building function models:
• Building models that are too large/have too many functions. Keep models to less than 15 - 20 functions. Not only are large models difficult to follow visually (with crossed paths and branches), but it is often difficult for the mind to capture and process. For complex systems, or when making a highly detailed analysis, it is suggested to break the model up into several, logically separated sections. Large models can be subdivided by creating a high level function model, and then drill- down into the functions of interest, expanding one or two functions into stand alone detailed models.
• Losing focus – keep the primary useful function in mind. The larger and more complex the model, the easier it is to lose site of the objective. Keeping focused will prevent construction of models that are unnecessarily detailed, especially in areas of the system which have no bearing on solving the problem at hand.
• Modeling uncontrollable elements. How can one improve, reduce or eliminate something that is uncontrollable? Don’t include them in the model. The best one can hope for is to make the system resistant to uncontrollable factors.
• Unrelated detail. This unnecessarily complicates the model and therefore dilutes the problem solving efforts. This closely parallels losing focus.
• Modeling “OR” functions. Do not model two scenarios in one model – break it up into two or more individual models.
• Modeling solutions. This is a common error people commit when they first start creating function models. Models should be “implementation free”, meaning that the model should not specify or dictate physical elements. To do so, would constrain the creativity necessary for the problem solving process to be successful.
• Building a Process Flow Diagram instead of a function model. By far this is the most common error in building function models. This may be due to the fact that process models have a time phased sequence that links each step, are easy to understand and follow, and parallels the sequential, linear thinking process that is most often taught in schools. Function models focus on logically linked functions that are delivered, not the step by step process of delivering them.
Conclusions. FAST Diagrams represent a very powerful tool in analyzing complex systems, and boiling down the descriptions of the functions performed into the essence of the tasks that must be delivered. The requirement that functions be described in a two-word Verb-Noun format is a double-edged sword:
• it promotes creative thinking in alternate ways to deliver a function; and • limits it by constraining the perspective to looking at only positively framed
functions. The How/Why logical connection between functions serves as an excellent way to verify the validity of FAST Diagrams and Enhanced FAST models, and the focus on functions removes the physicality from the system (product, process or service), opening the creative vista and removing physical and mental constraints in the process. Function modeling helps make complex systems more understandable to a wider audience – one doesn’t need to be an expert in the system to understand what the system does or is supposed to do. The inclusion of harmful or negative functions in Enhanced FAST diagrams uncovers inherent contradictions in the systems it characterizes and opens two new perspectives of thought and creativity – counteraction and contradiction resolution. Footnotes: 1 – Value Methodology Pocket Guide, 2008 Goal /CPQ, pg. 39 2 – Noted Gestalt Psychologist, Karl Dunker (1903 – 1940), defined “functional
fixedness” as a "mental block against using an object in a new way that is required to solve a problem."
References: Value Methodology Pocket Guide, 2008 Goal /CPQ, ISBN 978-1-57681-105-4 Hanik & Borza, 2010, Enhanced Brainstorming Using TRIZ Hanik, 2009, The Power of “When”. Borza, TRIZCON2010, TRIZ Applied to Value Management. Hanik & Kaufman, 2005, VE-TRIZ: A Technology Partnership
Abstract
Function Analysis System Technique (FAST) Diagrams have been around since 1965. They are a very useful tool to provide a graphical representation of how the various functions within a complex systems interact and interrelate to perform their primary function, and have been a mainstay in the Value Engineering community for over 40 years. This is a powerful tool that helps analyze the logical linkages between critical functions to promote a common understanding of how these complex systems work. As powerful as it is for the Value Management community, it is just the foundation for the building of useful and effective function models for the TRIZ community. This paper will provide instruction on how to build FAST Diagrams and integrate various enhancements to make them truly helpful in uncovering innovation opportunities.
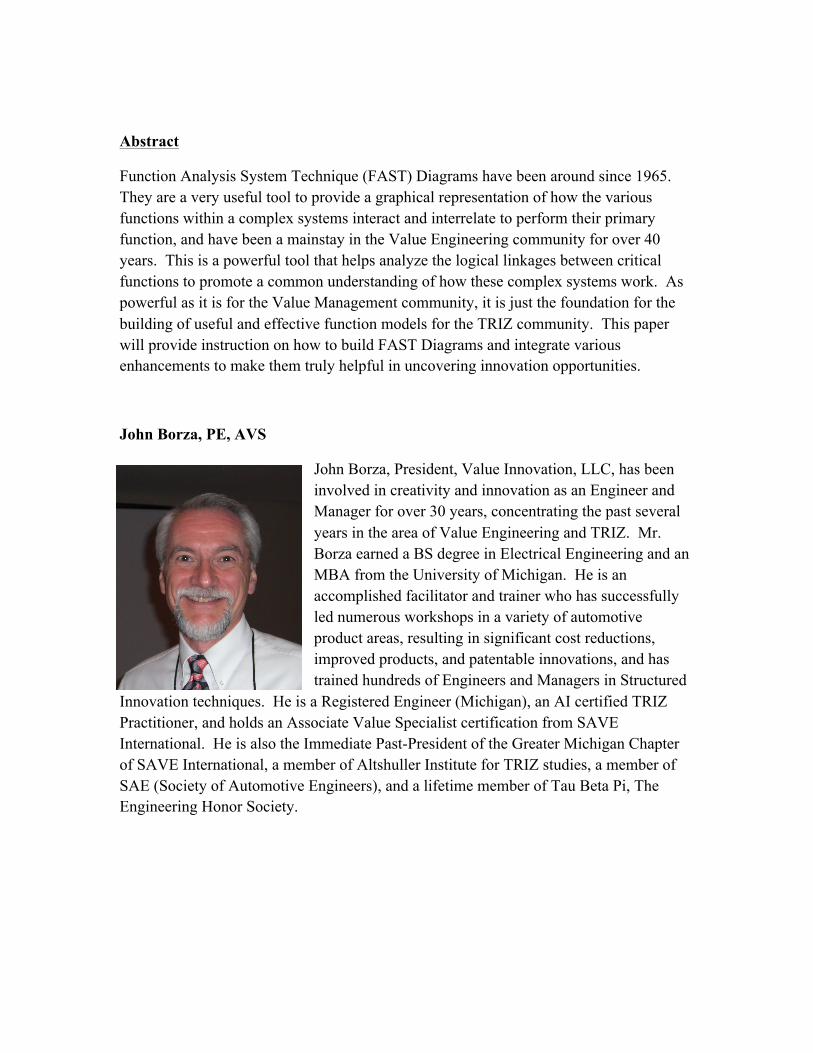
John Borza, PE, AVS
John Borza, President, Value Innovation, LLC, has been involved in creativity and innovation as an Engineer and Manager for over 30 years, concentrating the past several years in the area of Value Engineering and TRIZ. Mr. Borza earned a BS degree in Electrical Engineering and an MBA from the University of Michigan. He is an accomplished facilitator and trainer who has successfully led numerous workshops in a variety of automotive product areas, resulting in significant cost reductions, improved products, and patentable innovations, and has trained hundreds of Engineers and Managers in Structured
Innovation techniques. He is a Registered Engineer (Michigan), an AI certified TRIZ Practitioner, and holds an Associate Value Specialist certification from SAVE International. He is also the Immediate Past-President of the Greater Michigan Chapter of SAVE International, a member of Altshuller Institute for TRIZ studies, a member of SAE (Society of Automotive Engineers), and a lifetime member of Tau Beta Pi, The Engineering Honor Society.