Embed Size (px)
Citation preview
8/13/2019 05 RN20025EN20GLA0 (E)GPRS Network Optimization
http://slidepdf.com/reader/full/05-rn20025en20gla0-egprs-network-optimization 1/18RN20025EN20GLA0
(E)GPRS Network Optimization
1
1 © Nokia Siemens Networks RN20025EN20GLA0
EGPRS Explain
(E) GPRS Network optimization

8/13/2019 05 RN20025EN20GLA0 (E)GPRS Network Optimization
http://slidepdf.com/reader/full/05-rn20025en20gla0-egprs-network-optimization 2/18RN20025EN20GLA0
(E)GPRS Network Optimization
2
2 © Nokia Sie me ns Network s R N 2 0 02 5E N 2 0 GL A 0
Leg al Notice
Intellectual Property Rights
Al l co py ri gh ts an d in te ll ec tu al pr op er ty rig ht s fo r No ki a Si e me ns Ne tw or ks tra in in g do cu me nt at io n, pr od uc t do cu me nt at io n an dslide presentation material , al l of which are forthwith known as Nokia Siemens Networks training material , are the exclusiveproperty of Nokia Siemens Net works . Nokia Siemens Networks owns the rights to copying, modification, translation, adaptationor derivatives including any improvements or dev elopments. Nokia Siemens Networks has the sole right to copy, distribute,amend, modify, develop, l icense, sublicense, sell , t ransfer and assign the Nokia Siemens Networks training material.
Individuals can use the Nokia Siemens Networks training material for their own personal self-development only, those sameindividuals cannot subsequently pass on that same Intellectual Property to others without the prior written agreement of NokiaSiemens Networks .
The Nokia Sie mens Networks training material cannot be used outside of an agreed Nokia Siemens Networks training sessionfor development of groups without the prior writ ten agreement of Nokia Siemens Networks.
8/13/2019 05 RN20025EN20GLA0 (E)GPRS Network Optimization
http://slidepdf.com/reader/full/05-rn20025en20gla0-egprs-network-optimization 3/18RN20025EN20GLA0
(E)GPRS Network Optimization
3
3 © Nokia Siemens Networks RN20025EN20GLA0
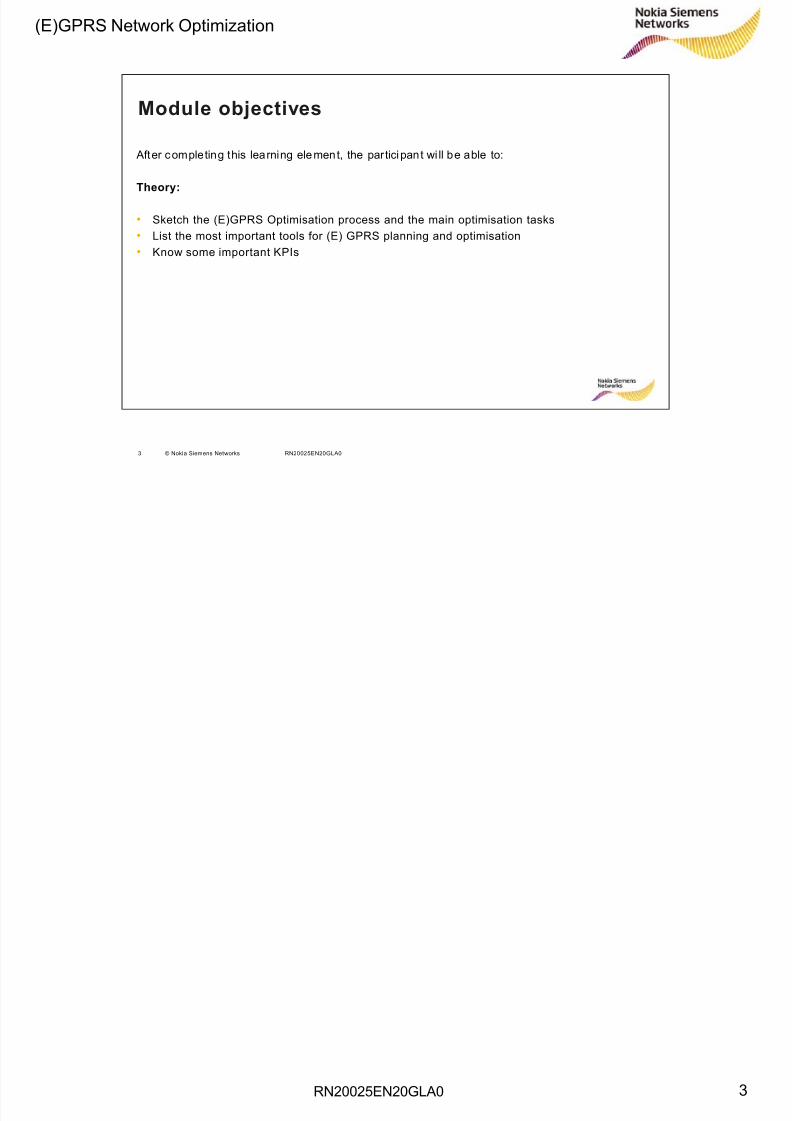
Module objectives
After c ompleting this lea rning ele ment, the partici pan t wi ll be able to:
Theory:
• Sketch the (E)GPRS Optimisation process and the main optimisation tasks• List the most important tools for (E) GPRS planning and optimisation• Know some important KPIs
8/13/2019 05 RN20025EN20GLA0 (E)GPRS Network Optimization
http://slidepdf.com/reader/full/05-rn20025en20gla0-egprs-network-optimization 4/18RN20025EN20GLA0
(E)GPRS Network Optimization
4
4 © Nokia Siemens Networks RN20025EN20GLA0
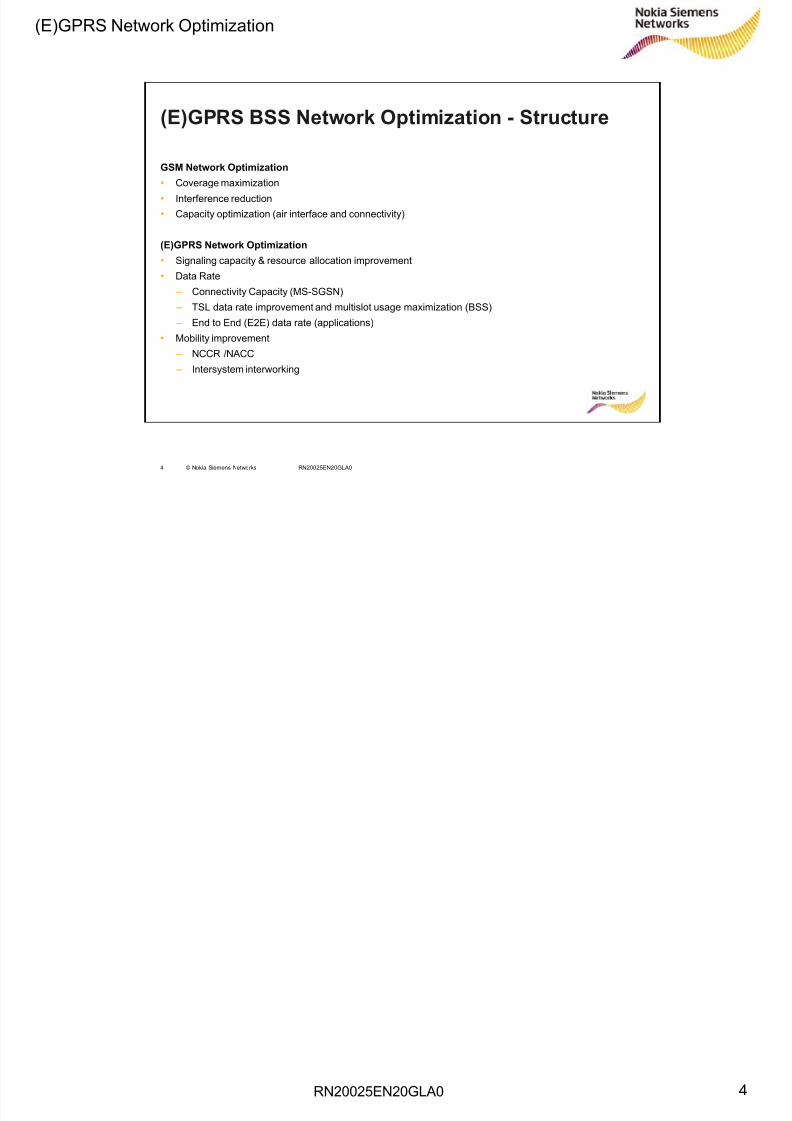
(E)GPRS BSS Network Optimization - Structure
GSM Network Optimization
• Coverage maximization
• Interference reduction• Capacity optimization (air interface and connectivity)
(E)GPRS Network Optimization
• Signaling capacity & resource allocation improvement
• Data Rate
– Connectivity Capacity (MS-SGSN)
– TSL data rate improvement and multislot usage maximization (BSS)
– End to End (E2E) data rate (applications)
• Mobility improvement
– NCCR /NACC
– Intersystem interworking
8/13/2019 05 RN20025EN20GLA0 (E)GPRS Network Optimization
http://slidepdf.com/reader/full/05-rn20025en20gla0-egprs-network-optimization 5/18RN20025EN20GLA0
(E)GPRS Network Optimization
5
5 © Nokia Siemens Networks RN20025EN20GLA0
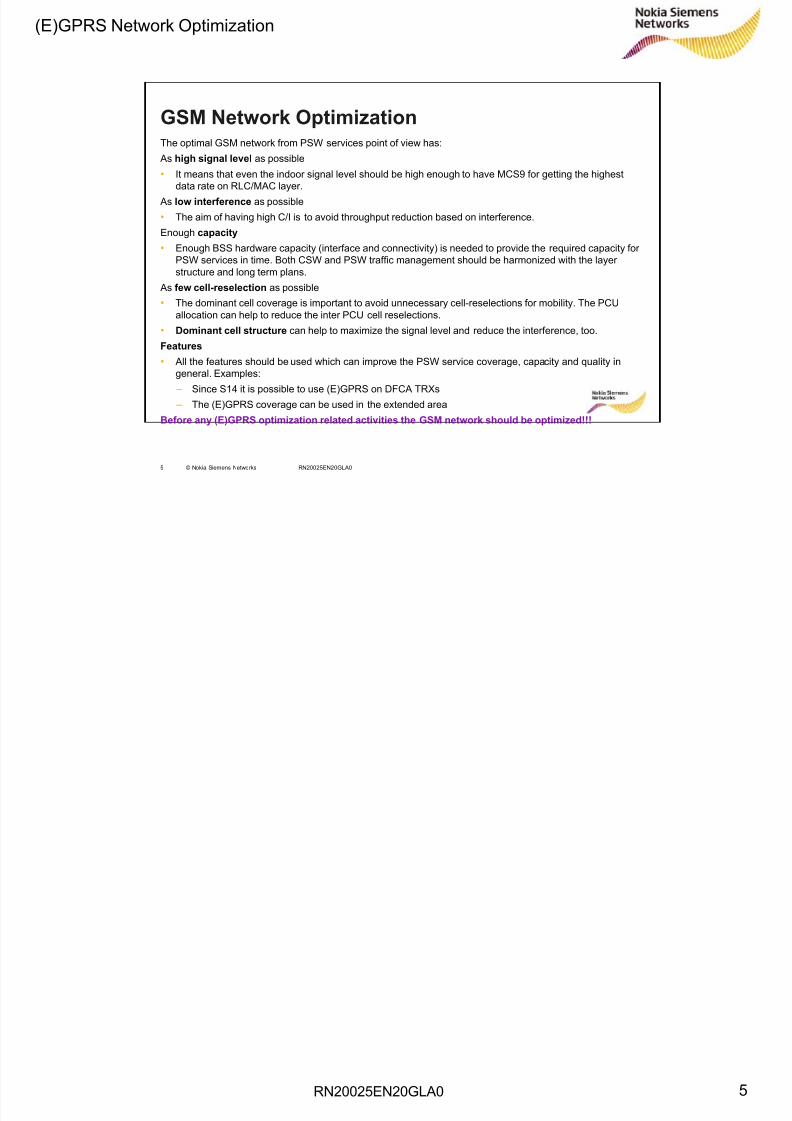
GSM Network OptimizationThe optimal GSM network from PSW services point of view has:
As high signal level as possible
• It means that even the indoor signal level should be high enough to have MCS9 for getting the highestdata rate on RLC/MAC layer.
As low interference as possible
• The aim of having high C/I is to avoid throughput reduction based on interference.
Enough capacity
• Enough BSS hardware capacity (interface and connectivity) is needed to provide the required capacity forPSW services in time. Both CSW and PSW traffic management should be harmonized with the layerstructure and long term plans.
As few cell-reselection as possible
• The dominant cell coverage is important to avoid unnecessary cell-reselections for mobility. The PCUallocation can help to reduce the inter PCU cell reselections.
• Dominant cell structure can help to maximize the signal level and reduce the interference, too.
Features
• All the features should be used which can improve the PSW service coverage, capacity and quality ingeneral. Examples:
– Since S14 it is possible to use (E)GPRS on DFCA TRXs – The (E)GPRS coverage can be used in the extended area
Before any (E)GPRS optimization related activities the GSM network should be optimized!!!
8/13/2019 05 RN20025EN20GLA0 (E)GPRS Network Optimization
http://slidepdf.com/reader/full/05-rn20025en20gla0-egprs-network-optimization 6/18RN20025EN20GLA0
(E)GPRS Network Optimization
6
6 © Nokia Siemens Networks RN20025EN20GLA0
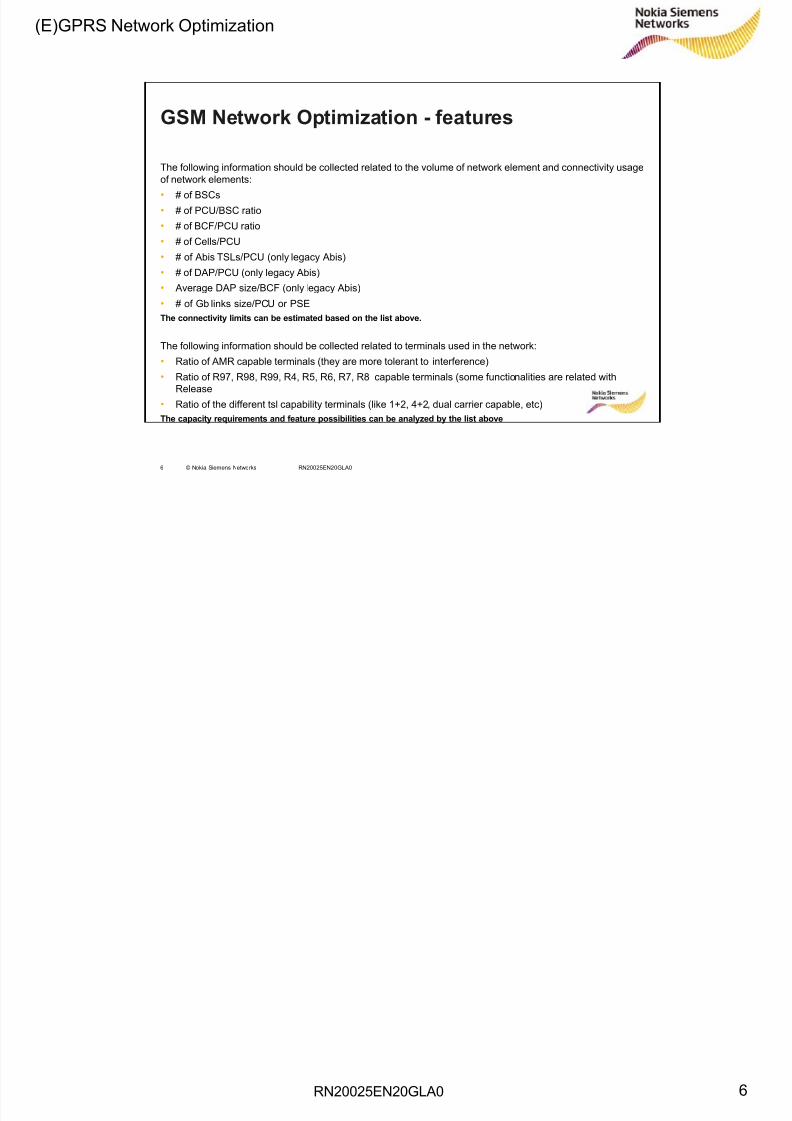
GSM Network Optimization - features
The following information should be collected related to the volume of network element and connectivity usageof network elements:
• # of BSCs• # of PCU/BSC ratio
• # of BCF/PCU ratio
• # of Cells/PCU
• # of Abis TSLs/PCU (only legacy Abis)
• # of DAP/PCU (only legacy Abis)
• Average DAP size/BCF (only legacy Abis)
• # of Gb links size/PCU or PSEThe connectivity limits can be estimated based on the list above.
The following information should be collected related to terminals used in the network:
• Ratio of AMR capable terminals (they are more tolerant to interference)
• Ratio of R97, R98, R99, R4, R5, R6, R7, R8 capable terminals (some functionalities are related with
Release• Ratio of the different tsl capability terminals (like 1+2, 4+2, dual carrier capable, etc)The capacity requirements and feature possibilities can be analyzed by the list above
8/13/2019 05 RN20025EN20GLA0 (E)GPRS Network Optimization
http://slidepdf.com/reader/full/05-rn20025en20gla0-egprs-network-optimization 7/18
8/13/2019 05 RN20025EN20GLA0 (E)GPRS Network Optimization
http://slidepdf.com/reader/full/05-rn20025en20gla0-egprs-network-optimization 8/18RN20025EN20GLA0
(E)GPRS Network Optimization
8
8 © Nokia Siemens Networks RN20025EN20GLA0
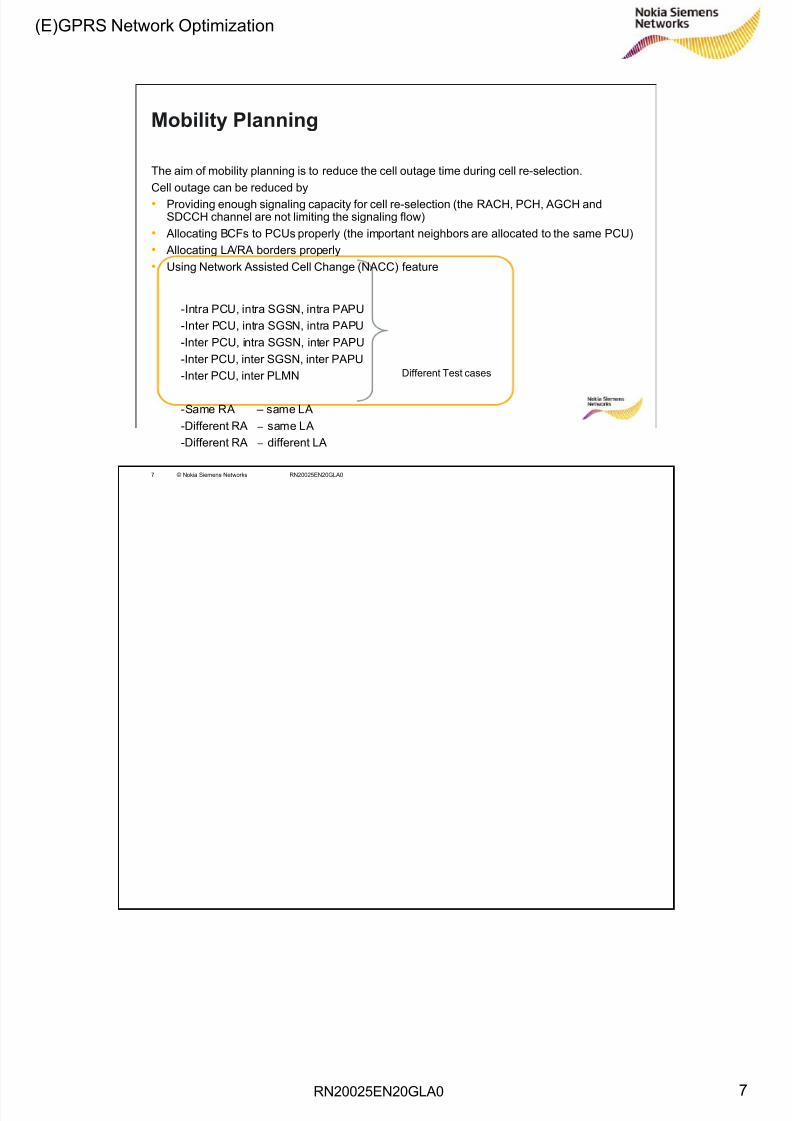
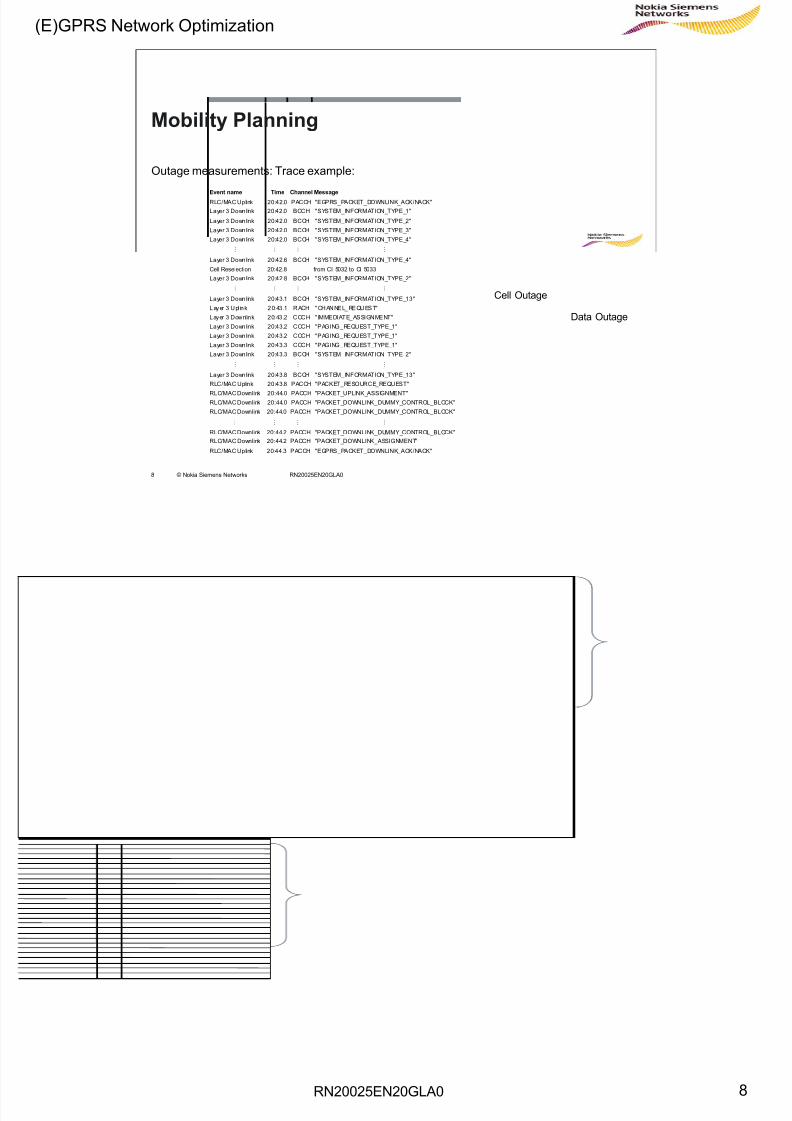
Mobility Planning
Outage measurements: Trace example:
Event name Time Channel Message
RLC/MAC Uplink 20:42.0 PACCH "EGPRS_PACKET_DOWNLINK_ACK/NACK"Layer 3 Downlink 20:42.0 BCCH "SYSTEM_INFORMATION_TYPE_1"
Layer 3 Downlink 20:42.0 BCCH "SYSTEM_INFORMATION_TYPE_2"
Layer 3 Downlink 20:42.0 BCCH "SYSTEM_INFORMATION_TYPE_3"
Layer 3 Downlink 20:42.0 BCCH "SYSTEM_INFORMATION_TYPE_4"
… … … …
Layer 3 Downlink 20:42.6 BCCH "SYSTEM_INFORMATION_TYPE_4"
Cell Reselection 20:42.8 from CI 5032 to CI 5033
Layer 3 Downlink 20:42.8 BCCH "SYSTEM_INFORMATION_TYPE_2"
… … … …
Layer 3 Downlink 20:43.1 BCCH "SYSTEM_INFORMATION_TYPE_13"
L ayer 3 Upl ink 2 0:43 .1 R ACH "CH ANNE L_REQU ES T"
Layer 3 Downlink 20:43.2 CCCH "IMMEDIATE_ASSIGNMENT"
Layer 3 Downlink 20:43.2 CCCH "PAGING_REQUEST_TYPE_1"
Layer 3 Downlink 20:43.2 CCCH "PAGING_REQUEST_TYPE_1"
Layer 3 Downlink 20:43.3 CCCH "PAGING_REQUEST_TYPE_1"
Layer 3 Downlink 20:43.3 BCCH "SYSTEM_INFORMATION_TYPE_2"
… … … …
Layer 3 Downlink 20:43.8 BCCH "SYSTEM_INFORMATION_TYPE_13"
RLC/MAC Uplink 20:43.8 PACCH "PACKET_RESOURCE_REQUEST"
RLC/MAC Downlink 20:44.0 PACCH "PACKET_UPLINK_ASSIGNMENT"RLC/MAC Downlink 20:44.0 PACCH "PACKET_DOWNLINK_DUMMY_CONTROL_BLOCK"
RLC/MAC Downlink 20:44.0 PACCH "PACKET_DOWNLINK_DUMMY_CONTROL_BLOCK"
… … … …
RLC/MAC Downlink 20:44.2 PACCH "PACKET_DOWNLINK_DUMMY_CONTROL_BLOCK"RLC/MAC Downlink 20:44.2 PACCH "PACKET_DOWNLINK_ASSIGNMENT"
RLC/MAC Uplink 20:44.3 PACCH "EGPRS_PACKET_DOWNLINK_ACK/NACK"
Cell Outage
Data Outage
8/13/2019 05 RN20025EN20GLA0 (E)GPRS Network Optimization
http://slidepdf.com/reader/full/05-rn20025en20gla0-egprs-network-optimization 9/18RN20025EN20GLA0
(E)GPRS Network Optimization
9
9 © Nokia Siemens Networks RN20025EN20GLA0
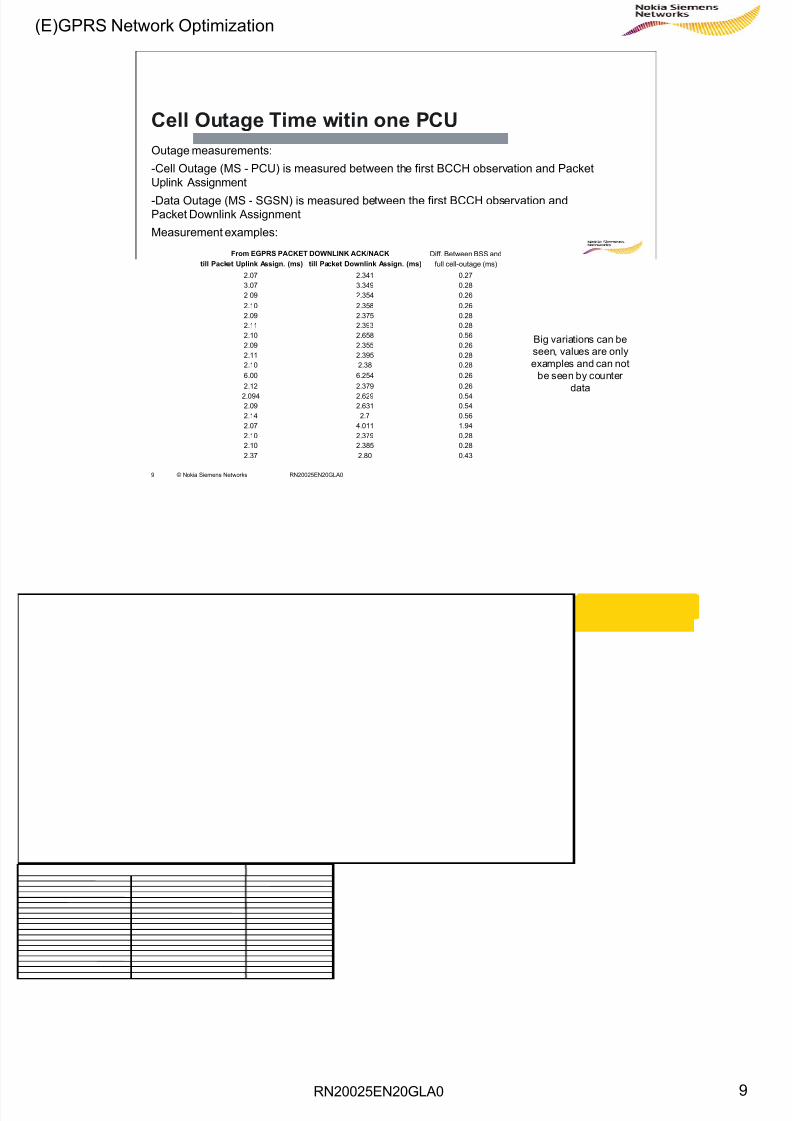
Diff. Between BSS andtill Packet Uplink Assign. (ms) till Packet Downlink Assign. (ms) full cell-outage (ms)
2.07 2.341 0.273.07 3.349 0.282.09 2.354 0.262.10 2.358 0.262.09 2.375 0.282.11 2.393 0.282.10 2.658 0.562.09 2.355 0.262.11 2.395 0.282.10 2.38 0.286.00 6.254 0.262.12 2.379 0.26
2.094 2.629 0.542.09 2.631 0.542.14 2.7 0.562.07 4.011 1.942.10 2.379 0.282.10 2.385 0.282.37 2.80 0.43
From EGPRS PACKET DOWNLINK ACK/NACK
Cell Outage Time witin one PCUOutage measurements:
-Cell Outage (MS - PCU) is measured between the first BCCH observation and PacketUplink Assignment
-Data Outage (MS - SGSN) is measured between the first BCCH observation andPacket Downlink Assignment
Measurement examples:
Big variations can beseen, values are onlyexamples and can not
be seen by counter
data
8/13/2019 05 RN20025EN20GLA0 (E)GPRS Network Optimization
http://slidepdf.com/reader/full/05-rn20025en20gla0-egprs-network-optimization 10/18RN20025EN20GLA0
(E)GPRS Network Optimization
10
10 © Nokia Siemens Networks RN20025EN20GLA0
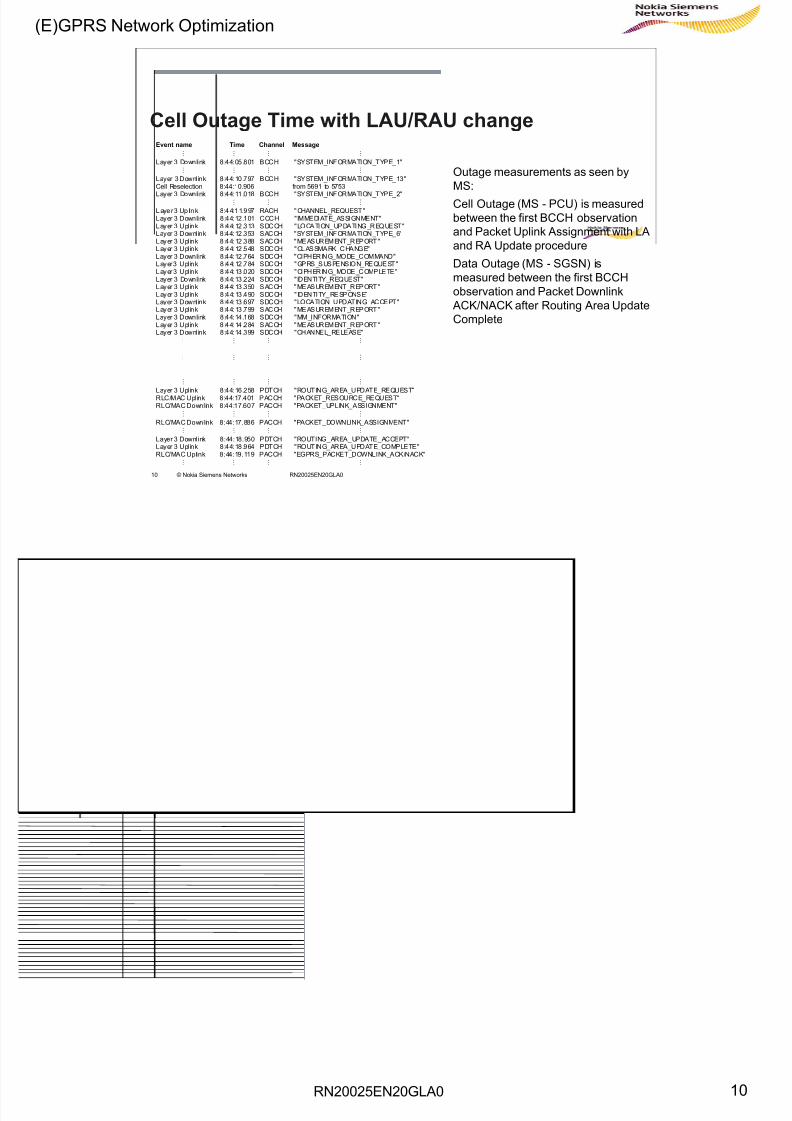
Cell Outage Time with LAU/RAU change
Outage measurements as seen byMS:
Cell Outage (MS - PCU) is measuredbetween the first BCCH observationand Packet Uplink Assignment with LAand RA Update procedure
Data Outage (MS - SGSN) ismeasured between the first BCCHobservation and Packet Downlink
ACK/NACK after Routing Area UpdateComplete
… … … …
Layer 3 Downlink 8:44:05.801 BCCH "SYSTEM_INFORMATION_TYPE_1"… … … …
Layer 3 Downlink 8:44:10.797 BCCH "SYSTEM_INFORMATION_TYPE_13"Cell Reselection 8:44:10.906 from 5691 to 5753
Layer 3 Downlink 8:44:11.018 BCCH "SYSTEM_INFORMATION_TYPE_2"… … … …
L aye r 3 Up lin k 8:4 4:11.9 97 RACH " CHANNEL _REQUEST "Layer 3 Downlink 8:44:12.101 CCCH "IMMEDIATE_ASSIGNMENT"Layer 3 Upl ink 8:44:12 .313 SDCCH "LOCATION_UPDATING_REQUEST"Layer 3 Downlink 8:44:12.353 SACCH "SYSTEM_INFORMATION_TYPE_6"Layer 3 Upl ink 8:44:12 .388 SACCH "MEASUREMENT_REPORT"Layer 3 Upl ink 8:44:12 .548 SDCCH "CLASSMARK_CHANGE"Layer 3 Downlink 8:44:12.764 SDCCH "CIPHERING_MODE_COMMAND"Layer 3 Upl ink 8:44:12 .784 SDCCH "GPRS_SUSPENSION_REQUEST"Layer 3 Upl ink 8:44:13 .020 SDCCH "CIPHERING_MODE_COMPLETE"Layer 3 Downlink 8:44:13.224 SDCCH "IDENTITY_REQUEST"Layer 3 Upl ink 8:44:13 .350 SACCH "MEASUREMENT_REPORT"Layer 3 Upl ink 8:44:13 .490 SDCCH "IDENTITY_RESPONSE"Layer 3 Downlink 8:44:13.697 SDCCH "LOCATION_UPDATING_ACCEPT"Layer 3 Upl ink 8:44:13 .799 SACCH "MEASUREMENT_REPORT"Layer 3 Downlink 8:44:14.168 SDCCH "MM_INFORMATION"Layer 3 Upl ink 8:44:14 .284 SACCH "MEASUREMENT_REPORT"Layer 3 Downlink 8:44:14.399 SDCCH "CHANNEL_RELEASE"
… … … …
… … … …
… … … …
Layer 3 Uplink 8:44:16.258 PDTCH "ROUTING_AREA_UPDATE_REQUEST"RLC/MAC Uplink 8:44:17.401 PACCH "PACKET_RESOURCE_REQUEST"RLC/MAC Downlink 8:44:17.607 PACCH "PACKET_UPLINK_ASSIGNMENT"
… … … …
RLC/MAC Downlink 8:44:17.886 PACCH "PACKET_DOWNLINK_ASSIGNMENT"… … … …
Layer 3 Downlink 8:44:18.950 PDTCH "ROUTING_AREA_UPDATE_ACCEPT"Layer 3 Uplink 8:44:18.964 PDTCH "ROUTING_AREA_UPDATE_COMPLETE"RLC/MAC Uplink 8:44:19.119 PACCH "EGPRS_PACKET_DOWNLINK_ACK/NACK"
… … … …
Event name Time Channel Message
8/13/2019 05 RN20025EN20GLA0 (E)GPRS Network Optimization
http://slidepdf.com/reader/full/05-rn20025en20gla0-egprs-network-optimization 11/18RN20025EN20GLA0
(E)GPRS Network Optimization
11
11 © Nokia Siemens Networks RN20025EN20GLA0
PCU Allocation Plan
The proper allocation of the cells among PCUs can help to maximize the number of intra PCUcell re-selections, which is the most stable cell re-selection event.
• RLC/MAC layer: The intra PCU cell re-selection takes less time compared with inter PCU cellreselection• LLC layer: In case of intra PCU cell re-selection the un-transferred data is moved to new cell
(BVCI) and the transfer can be continued on new cell without packet loss on higher layer,while in case of inter PCU cell re-selection the un-transferred data is not moved to new cell(BVCI).
The following rules can be followed:• The cells of one BCF should be connected to the same PCU• The neighbor relations with high re-selection traffic should be connected to the same PCU• The neighbor relations in very bad signal and quality environment should be connected to the
same PCU
NACC* and NCCR can be used to enhance the performance of cell reselections, becauseoffsets can be defined avoiding too many inter PCU cell reselections for example(* NACC basically is working inside BSCs only, can be enhanced to work between BSCs)
8/13/2019 05 RN20025EN20GLA0 (E)GPRS Network Optimization
http://slidepdf.com/reader/full/05-rn20025en20gla0-egprs-network-optimization 12/18RN20025EN20GLA0
(E)GPRS Network Optimization
12
12 © Nokia Siemens Networks RN20025EN20GLA0
LA/RA Design – Radio Aspects
Radio Aspect of LA/RA Design• too big LA/RA will increase the paging, while too small LA/RA will increase the amount of
LA/RA Updates. So the balance should be found between too big and too small LA/RAs.• a bad LA/RA border design can significantly increase the amount of signaling what can lead
to an increase of the cell-reselection outage on the LA/RA border.• The LA/RA border should be moved from those areas where the normal CSW and PSW
traffic is very high.• The combined RAU (NMO I with Gs) is shorter compared to NMO II
• A class B MS (and class A MS without DTM support) has to suspend GPRS services while indedicated mode. Once the dedicated connection is finished, GPRS services have to beresumed. This can be done by an RA update. Since S11.5 the Resumption is provided by theBSC without need for RA update.
8/13/2019 05 RN20025EN20GLA0 (E)GPRS Network Optimization
http://slidepdf.com/reader/full/05-rn20025en20gla0-egprs-network-optimization 13/18RN20025EN20GLA0
(E)GPRS Network Optimization
13
13 © Nokia Siemens Networks RN20025EN20GLA0
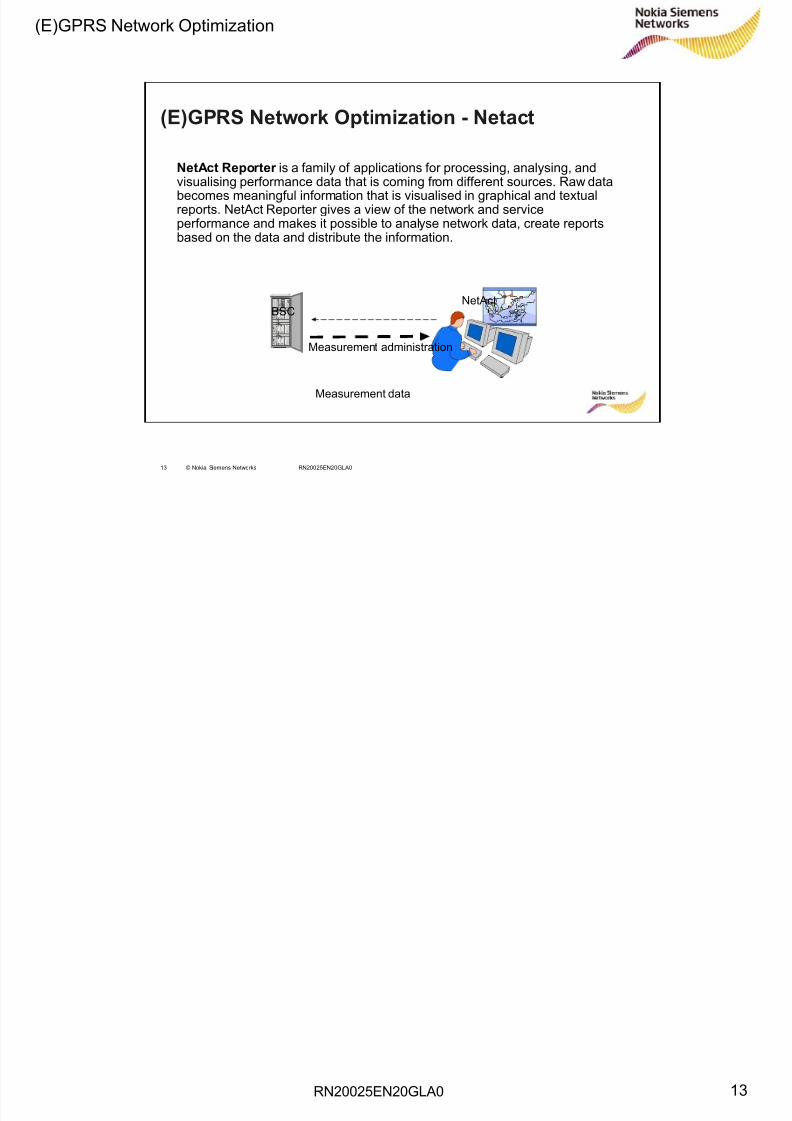
(E)GPRS Network Optimization - Netact
BSCNetAct
Measurement data
Measurement administration
NetAct Reporter is a family of applications for processing, analysing, andvisualising performance data that is coming from different sources. Raw data
becomes meaningful information that is visualised in graphical and textualreports. NetAct Reporter gives a view of the network and serviceperformance and makes it possible to analyse network data, create reportsbased on the data and distribute the information.
8/13/2019 05 RN20025EN20GLA0 (E)GPRS Network Optimization
http://slidepdf.com/reader/full/05-rn20025en20gla0-egprs-network-optimization 14/18RN20025EN20GLA0
(E)GPRS Network Optimization
14
14 © Nokia Siemens Networks RN20025EN20GLA0
(E)GPRS Network Optimization - KPI
NetAct reporter counter and KPI analysis gives exact picture about network performance.
The analysis of KPIs can be based on the following list:
Signaling related KPIsCCCH usage and congestion
TRXSIG congestion
BCSU load
Data rate and Territory related KPIs
Network usage (RLC Payload, Packet Erlangs, etc)
Data rate (CS - MCS selection, retransmission, UL BLER, throughput, etc.)
Blocking (timeslot sharing, soft blocking, hard blocking, EDAP congestion, PCU congestion,Gb congestion, etc)
Mobility related KPIs
TBF release due to flush
Features like NCCR and NACC will not only increase the performance of thenetwork in general, additionally better statistics will get available, helping again toincrease the performance of the system!
8/13/2019 05 RN20025EN20GLA0 (E)GPRS Network Optimization
http://slidepdf.com/reader/full/05-rn20025en20gla0-egprs-network-optimization 15/18RN20025EN20GLA0
(E)GPRS Network Optimization
15
15 © Nokia Siemens Networks RN20025EN20GLA0
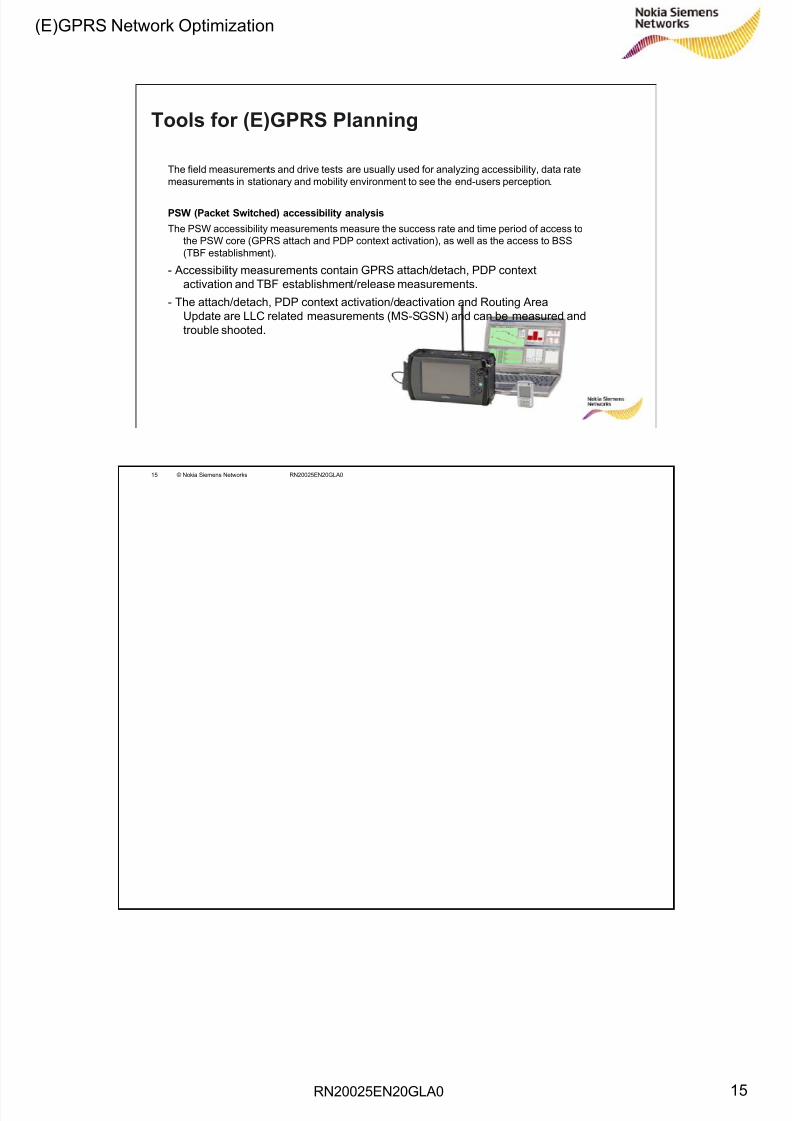
Tools for (E)GPRS Planning
The field measurements and drive tests are usually used for analyzing accessibility, data ratemeasurements in stationary and mobility environment to see the end-users perception.
PSW (Packet Switched) accessibility analysis
The PSW accessibility measurements measure the success rate and time period of access tothe PSW core (GPRS attach and PDP context activation), as well as the access to BSS(TBF establishment).
- Accessibility measurements contain GPRS attach/detach, PDP contextactivation and TBF establishment/release measurements.
- The attach/detach, PDP context activation/deactivation and Routing AreaUpdate are LLC related measurements (MS-SGSN) and can be measured andtrouble shooted.
8/13/2019 05 RN20025EN20GLA0 (E)GPRS Network Optimization
http://slidepdf.com/reader/full/05-rn20025en20gla0-egprs-network-optimization 16/18RN20025EN20GLA0
(E)GPRS Network Optimization
16
16 © Nokia Siemens Networks RN20025EN20GLA0
TCP/IP measurementsUseful commands in IP networks to estimate end to end performance:
1. Ping: The command Ping can be used to check the network Round Trip Time to one orseveral remote hosts. The command runs an application which generates an ICMP (Internet
Control Message Protocol) Echo Request data packet (this is an IP packet with Protocol = 1,Type field = 8) which is sent to the host. An Echo Reply is expected from the host (this is anIP packet with Protocol = 1, Type field = 0
Example: Ping 0.0.0.0 – 1000 where 0.0.0.0 is an IP address and 1000 the size ofthe ping package in Bytes
2. Tracert: The Tracert (trace route) tool checks the route to a destination by sending ICMP(Internet Control Message Protocol) Echo Request data packets with different TTL (time tolive) values starting with TTL=1 for the first packet, then TTL=2 for the next packet,…
Example: tracert 0.0.0.0 where 0.0.0.0 is an IP address
3. PathPing: The tool PathPing extends the features of the Ping and Tracert commands andoffers more information than those commands do.
During a certain time, data packets are sent to each node contained in the path to a certaindestination. Statistics are calculated based on the data packets which are sent back from
these nodes. Since the PathPing command shows losses of packets for each of the nodesand each connection, this command can be used to localize those nodes and/or connectionsmaking problems.
Example: pathping 0.0.0.0 where 0.0.0.0 is IP address
8/13/2019 05 RN20025EN20GLA0 (E)GPRS Network Optimization
http://slidepdf.com/reader/full/05-rn20025en20gla0-egprs-network-optimization 17/18RN20025EN20GLA0
(E)GPRS Network Optimization
17
17 © Nokia Siemens Networks RN20025EN20GLA0
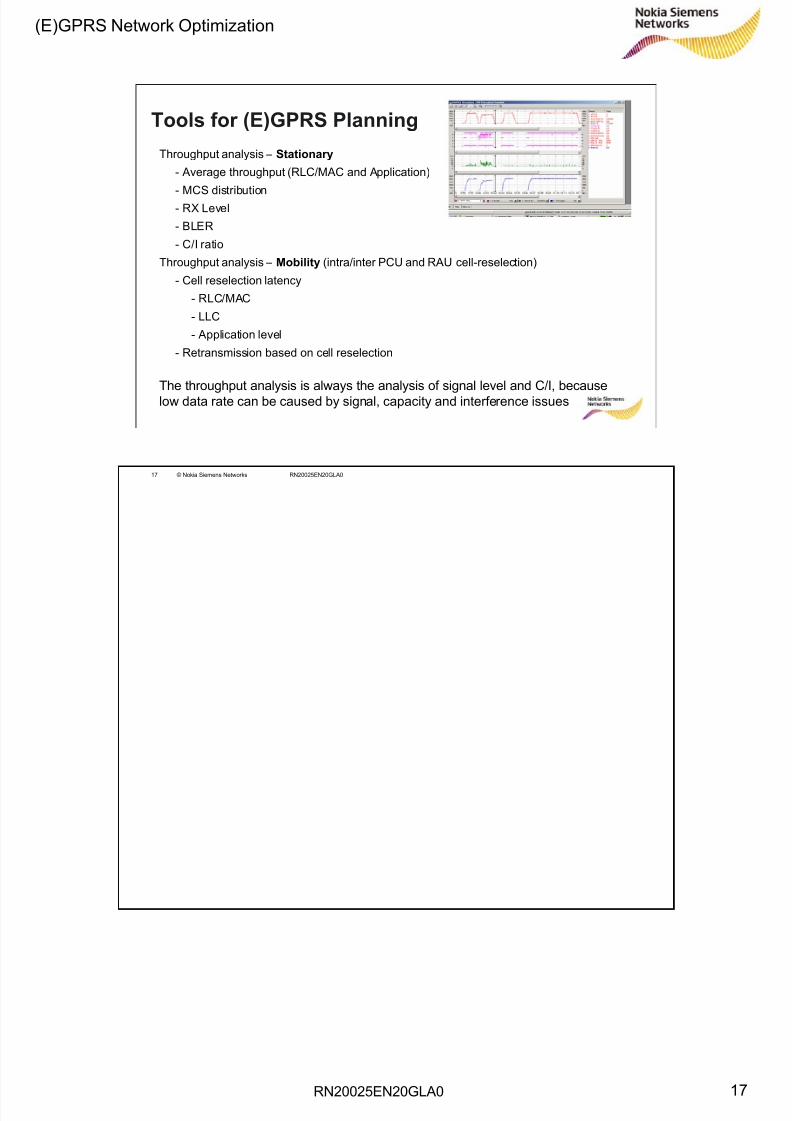
Throughput analysis – Stationary
- Average throughput (RLC/MAC and Application)
- MCS distribution- RX Level
- BLER
- C/I ratio
Throughput analysis – Mobility (intra/inter PCU and RAU cell-reselection)
- Cell reselection latency
- RLC/MAC
- LLC
- Application level
- Retransmission based on cell reselection
The throughput analysis is always the analysis of signal level and C/I, becauselow data rate can be caused by signal, capacity and interference issues
Tools for (E)GPRS Planning
8/13/2019 05 RN20025EN20GLA0 (E)GPRS Network Optimization
http://slidepdf.com/reader/full/05-rn20025en20gla0-egprs-network-optimization 18/18
(E)GPRS Network Optimization
18 © Nokia Siemens Networks RN20025EN20GLA0
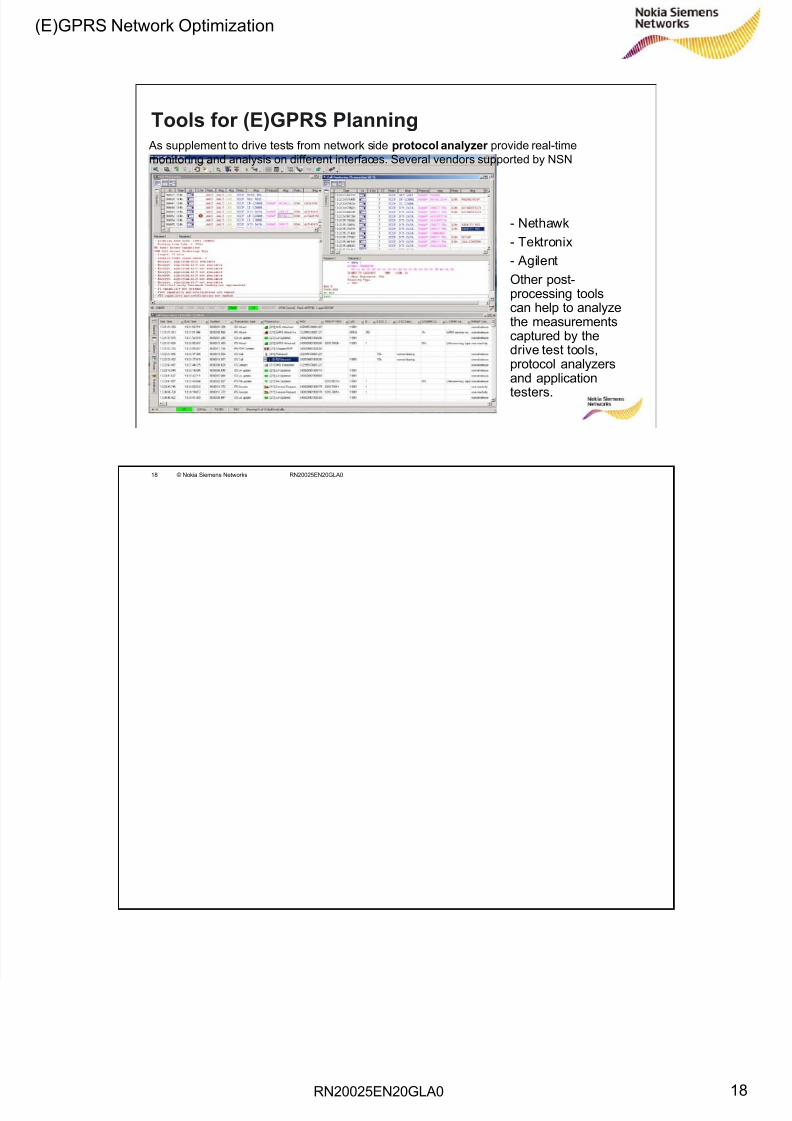
Tools for (E)GPRS Planning As supplement to drive tests from network side protocol analyzer provide real-timemonitoring and analysis on different interfaces. Several vendors supported by NSN
- Nethawk- Tektronix- AgilentOther post-processing toolscan help to analyzethe measurementscaptured by thedrive test tools,protocol analyzersand applicationtesters.