Embed Size (px)
Citation preview
56 Informatica Economică vol. 18, no. 1/2014
DOI: 10.12948/issn14531305/18.1.2014.05
Integrating Click-Through and Eye-Tracking Logs for Decision-Making
Process Mining
Răzvan PETRUŞEL
Business Information Systems Department,
Faculty of Economics and Business Administration.
Babeş-Bolyai University, Cluj-Napoca, Romania
In current software every click of the users is logged, therefore a wealth of click-through
information exists. Besides, recent technologies have made eye-tracking affordable and an
alternative to other human-computer interaction means (e.g. mouse, touchscreens). A big
challenge is to make sense of all this data and convert it into useful information. This paper
introduces a possible solution placed in the context of decision-making processes. We show
how the decision maker’s activity can be traced using two means: mouse tracing (i.e. clicks)
and eye-tracking (i.e. eye fixations). Then, we discuss a mining approach, based on the log,
which extracts a Decision Data Model (DDM). We use the DDM to determine, post-hoc,
which decision strategy was employed. The paper concludes with a validation based on a
controlled experiment.
Keywords: Decision-Making Process Model, Data-Flow Model, Decision Process Mining
Introduction
This paper aims to show how decision-
making process models can be automatically
extracted from human-computer interaction
logs. Since our research is placed in IT, most
of the interaction with a software is
performed my mouse and by looking at a
computer screen. Therefore, the traces left by
the user interacting with the software are
mouse clicks (an additional data like values
typed from the keyboard) as well as screen
objects (e.g. menus, textboxes) at which the
user stared. Aggregating those two data
sources as well as making sense of this new
data is the main focus of this paper.
Modern software stores more and more data
about everything connected to it. For
example, Google sores information about
searches of each user, about pages visited,
about links opened, etc. Also, any web-shop
stores data on products viewed as well as any
click performed during each visit (e.g.
Amazon sends personalized e-mails with
price updates if a user just looked at the
details of certain products, let alone added
anything in the shopping cart and then
discarded it). ERP systems also log the
activities of users, and even go as far as
storing information on changes made to the
tables storing data. Therefore, we think that
there is enough support to claim that click-
through data may be, or is, stored by any
software.
Eye-tracking is a technique used to output the
point of a stimulus where a subject looks at.
For our research, the stimulus is the interface
of software displayed on a computer screen.
Eye-tracking hardware follows the physical
movements of the eye (most common
technique is to film the pupils with video
cameras). Eye-tracking software converts the
physical movements into (computer screen)
coordinates and matches them to object in the
interface. Therefore, a log of objects (e.g.
buttons, menu items, textboxes, etc.) that
capture user’s attention is available. Eye
tracking becomes cheaper and more and
more implementations are available. The
most common example is the use of eye-
tracking in current smartphones. For
example, Samsung Galaxy S4 uses the front
camera and dedicated software to determine
if the user is looking at the bottom of the
page so it will automatically scroll
documents or if the user is looking away
from the screen so it will pause running
videos. Also, eye-tracking systems are
integrated into laptops on the market
1

Informatica Economică vol. 18, no. 1/2014 57
DOI: 10.12948/issn14531305/18.1.2014.05
(Lenovo laptop presented at CeBit 2011) or
soon to be put on the market (Tobii ultrabook
presented at CeBit 2013). Those
implementations seek to replace ‘classical’
interaction methods like mouse, touchpad or
touchscreens with eye-gaze interaction (e.g.
user clicks a button just by looking at it).
Having established there is a wealth of
logged data on the behavior of users
interacting with software, we wish to argue
that it can be mined for building models. This
is the drive behind process mining research
area. Activity logs are mined in order to
extract the control-flow perspective of
business processes. We got inspiration to
apply the same approach to the decision
making research. Basically, we see decision
making as a process composed of distinct
activities. The challenge is that those
activities are mostly mental. Therefore, there
is a need to extract or elicit them. Our
approach assumes that modern decision
making is supported by various systems that
are used by the decision makers to get data,
but also to create new information. By eye-
tracking and by logging clicks and other
interaction data we get a footprint of what the
decision making activities were. The difficult
part is to convert those logs into explicit
models.
The novel thing in this paper is the
integration of click-through logs with eye-
tracking outputs. On this basis, we apply the
Decision Data Models (DDM) framework.
This framework is a complete approach to
modeling, mining and enacting data-centric
business decision making processes. In our
framework, the user is a decision maker who
interacts with a decision support system in
order to make a decision. Meanwhile, we log
his mouse clicks and his eye movements.
Then, we integrate the two logs and feed
them into our decision-process mining tool.
This outputs a DDM that explicitly and
graphically depicts the data processing
performed by the decision maker. This is an
executable model that mirrors the mental
activities performed by the decision maker in
his quest to choose one of the available
alternatives.
This paper is organized as follows. In the
next section, Then, we introduce the DDM
framework and stress on the two data sources
that are the goal of this paper. The fourth
section formalizes the researched problem
and its solution. The fifth section seeks to
support our claims by a controlled
experiment. The paper is closed with a
discussion and our concluding remarks.
2 Related Work
This section discusses similar approaches to
the problem tacked and, while doing so, we
point out open research questions that might
be solved by employing our results. We first
give a brief review of decision making
research, which is the context of our
research. Then, we review some research in
two fields that approached similar problems:
process mining and decision-making process
tracing techniques.
The common property of decision strategies
is that there is a decomposition of the
decision into sub-tasks. The decision process
means that sub-tasks are solved first and their
results will be aggregated in order to make
the final decision. However, a person’s
decomposition ability varies greatly with
decision complexity as well as knowledge
and experience about the given decision [1].
Our decision making-process model
emphasizes exactly on this aspect. Since
better knowledge leads to better decisions
through decomposition, we aim to
graphically depict the decomposition steps.
Also, expertise allows the decision maker to
better define his strategy and better or
quicker identify the relevant factors for the
decision [Browne et al., 2007]. In this case,
we argue that the decision making-process
model needs to focus first on showing those
factors as discrete elements.
There are a lot of strategies that can be
employed by a decision maker during his
decision-making process. Sometimes just one
strategy is employed, but it could also be that
strategies are swapped during the process [2],
[3]. A short walk-through the most important
decision-making strategies and a concise
comparison is available in [4].

58 Informatica Economică vol. 18, no. 1/2014
DOI: 10.12948/issn14531305/18.1.2014.05
A lot of research effort focused on the issue
of determining which decision strategy
is/was used by some decision maker. The
basic idea is that, given some process-tracing
data, it is possible to identify which decision
strategy was actually employed by the
decision maker.
In [5] there is an algorithm that relies on four
metrics in order to identify a decision trace as
one of the decision strategies. The process
data used as input is extracted using choice
matrixes (one of the techniques in the
information display boards category - see the
next section). The algorithm is implemented
as the Decision Tracer tool.
Metrics used for identifying decision
strategies:
a) Search index is the ratio of within
alternative transitions divided to the
between alternative transitions was
introduced by Payne in the 70’s [6].
b) Ratio of time spent reviewing different
attributes [5]
c) Statistic approach [7]. This is
demonstrated to work well with eye-
tracking data.
d) Process visualization [8]
There is an area of decision making research,
called dual-process models, dedicated to
identifying whether decisions are intuitive or
deliberate. An intuitive decision making
process is described as unconscious,
automatic, effortless, and fast [9]. A
deliberate decision making process is driven
by conscious awareness therefore is limited
by the decision maker’s mental abilities and
experience, sequential, effortful, rule-
governed, and slow [9]. There is a
classification of decision making based on
the influence of each mode on the decision
process [10], [11]: pre-emptive, parallel-
competitive, default-interventionist and
integrative theories.
In [12] it was investigated if instruction-
induced decisions will result in processes in
which intuition and deliberation are distinct
or integrate. It gave evidence that intuitive
and deliberate decisions are not clearly
distinct. That is, if the decision maker is
given instructions to deliberate he will not
use a completely different rule-based
decision making process. This impacts on our
research because it shows that the mined
instance decision-process model can be
different from the ‘ideal’ process because the
decision maker used a larger part of intuition
in his process mix.
In [13] it was argued that even a more
complex decision-making strategy as WADD
does not necessary require conscious
calculation steps (i.e. calculation of weighted
sums). A decision maker may approximate
by an automatic/intuitive process, in a short
amount of time, the weighted additive
attribute value of the alternatives.
The issue whether intuitive and deliberate
decisions lead to ‘good’ or ‘bad’ decisions
has not been settled [14]. However, the
debate on decision quality is important for us
because we also face the problem whether
following the decision model will eventually
lead to a better decision.
The process tracing techniques used by a
study need to be closely connected with the
tested hypothesis. There are a large number
of decision process-tracing techniques that
have been used and perfected in the last
decades [15], [5]. This section is a quick
review of the available techniques, with a
focus on the ones that best fit our aim of
creating reference decision-process models.
Process tracing techniques were classified in
methods for investigating [15]:
i) Information acquisition
ii) Information integration and evaluation
iii) The cognitive process (psychological,
neurological and other
Given that we are probing the cognitive
process of the decision maker, just the
techniques that can be applied for
information acquisition are reviewed. The
first three methods are of interest to us
because they are most common for tracing
external information acquisitions. Internal
acquisitions (i.e. retrieval of information
from the memory of the decision maker)
cannot be traced by those techniques and
need to be inferred and/or interpreted by the
researcher.
Informatica Economică vol. 18, no. 1/2014 59
DOI: 10.12948/issn14531305/18.1.2014.05
An extensive literature review of process
tracing studies, covering refereed journals in
the period 1970 to 2008, arrived to some
interesting conclusions [15]. First, it shows
that there was a steady increase of interest on
process tracing, proven by the growing
number of published papers on the topic (by
a factor of 5). Secondly, it shows that
reaction time studies took the lion’s share
and that bio-neural studies rocketed in the
last decade. This happened, while only 10%
of the studies in the researched timeframe
focused on information acquisition and
another 10% focused on information
integration. Therefore, we think there is
enough room for our research which is about
decision information acquisition and
integration.
As with any method or technique, there are
drawbacks of the process-tracing methods
[15]. On one side, process-tracing data can be
unreliable due to the nature of the collection
process or tools. On the other side, there are
critical choices that need to be made related
both to recording as well as data analysis.
Third, collecting unambiguous data usually
requires an artificial and static environment
and stimuli.
Relevant results useful for our research:
Looking patterns were used to
differentiate between intuitive and
deliberative thinking. It was proved that
deliberation leads to a higher number of
fixations and to a more complete
information acquisition as a result of
repeated information acquisitions [12].
MouseLab is a technique that provides
researchers with data about: content and
sequence of information acquired by the
decision makers. Our proof-of-concept
tool mimics MouseLab in our search for
the same decision-making process data.
MouseTracker complements our
process-tracing tools
Eye-tracking based study showed that
intuitive and deliberate decision making
share the same process, with some
additional operations in deliberate mode
[12] It was found that deliberation seems
to be associated with a thorough and
extensive information search expressed
as more fixated elements and more
repeated information inspections.
Therefore, we think we could cluster the
decision makers based on the number of
operations performed during the
decision-making process.
In Mouselab-based studies, it was
concluded that the way information is
displayed may have a huge impact on the
information acquisition and integration
and ultimately on the chosen alternative.
For example, people follow the ‘natural’
reading order and will review first the
data elements in the top-left corner of the
screen. To mitigate this, we need to
counterbalance the position/order of data
elements.
Mapping data acquisition to the decision
making process is suggested to have two
properties: occurrence (information not
examined cannot be used by a
hypothesized strategy) and adjacency
(information used in temporal proximity
by a hypothesized strategy should be
acquired in close proximity). A risk is
that adjacency will not hold if data can
be memorized and, therefore, not needed
to be re-acquired. To mitigate this risk,
we use in our experiments values that are
more difficult to remember (e.g. instead
of 1000 we use 1273);
The decision making process was
divided into reading, and choice phases
[8]. In Mouselab experiments, the
reading phase was delimited from the
choice phase by the trace element when
all outcomes/data elements have been
examined once.
Coalescing is the assumption that
branches of a decision model can be
combined by adding their probabilities.
Cancellation is the reverse operation, in
which ranches common to both
alternatives can be removed. Those
operations can be defined on the DDM.
3 Preliminaries
This section introduced the user to the
methods that are applied as a part of our

60 Informatica Economică vol. 18, no. 1/2014
DOI: 10.12948/issn14531305/18.1.2014.05
solution. We give a very brief walk-through
our DDM framework that explicitly depicts
and employs models of decision-making
processes. Then, we look at tools available
for decision process tracing (namely
information boards, Mouse Lab, eye-tracking
and our proof-of-concept implementation).
3.1 The Decision Data Model Framework
We look at business decision making
processes as at a data-centric environment.
Most of the decision making in this
environment evolves on using and
interpreting data and building information
based on that. But, creating information from
data is not a trivial task while it is essential
for the outcome of a business decision.
Therefore, the entire framework aims to
extract and make explicit the activities
related to data and information manipulation.
To gain insights into how a decision maker
manipulated data, the obvious approach is to
perform an interview. This leads to
knowledge representation under different
formalisms (rules, decision trees, influence
diagrams, etc.). If, for various reasons, one
expert is not enough, more interviews need to
be carried out and the output models need to
be updated to show the aggregate view. The
problem with this approach is that is quite
difficult and expensive to perform interviews
with many individuals and troublesome to
update models with extra behavior, so that a
broader and more reliable model is created.
Our approach takes a different path. We
argue that a model, comparable with the one
extracted from several experts, can be created
if we mine the behavior of a large number of
decision makers. We created a framework
(see Fig. 1) that allows us to extract a model
using this assumption. We argue that the
decision behavior is made explicit by the
footmarks left by the users of a decision-
aware software. The main features of such
software are as follows: a) it shows the raw
data for the decision; b) offers the tools to
manipulate it; and c) logs everything the user
does. One can think, for example, to an Excel
Spreadsheet in which the main figures about
a company are shown while the user needs to
make a decision such as contracting a loan.
The software offers the tools to manipulate
data (by formulas or functions) and it can be
enhanced to log what the user does. Logging
can be either low-level (e.g. clicks on cells,
formulas used in cells) or high-level (e.g.
performing eye-tracking of the user). We
look at the logged behavior of a decision
maker as at a trace of the decision process
Fig. 1. DDM framework
Once the decision logs are available, we need
some algorithm to mine the model. In [16]
we showed that current process mining
algorithms do not perform well on such
decision logs. Therefore, in [17] we proposed
a model (DDM – Decision Data Model),
derived from the Product Data Model [16],
that is better suited for such a field. In [16]
we showed how multiple individual DDMs
can be aggregated. A DDM can be easily
Informatica Economică vol. 18, no. 1/2014 61
DOI: 10.12948/issn14531305/18.1.2014.05
read by humans, but it could also be used as
input in a recommendation engine. In [18]
we introduced two approaches to
recommendations: one based on a Greedy
approach and one derived from the A* path-
finding algorithm. In [19] we showed the
third algorithm that uses an aggregated DDM
as input. It is mapped to a Markov Decision
Process and, unlike the other two algorithms
that recommended the local next best action,
provides recommendations for the optimal
decision strategy that may be used.
3.2 Decision Process-tracing
In this sub-section we introduce the
techniques and tools that inspired us in the
decision-making data collection. The
research on process tracing methods looks at
decision making as at a process that can be
observed using different means. The goal of
this research is to open new windows into the
intimate internal processing that drives an
individual towards making a decision. The
techniques reviewed in this sub-section are
‘pure’. In our approach we took advantage of
all of them and used them concurrently. The
measured decision data promoted by
prominent decision process-tracing
techniques, which we implemented up to a
certain degree, are:
a) Active information search This method
aims to remove the need for pre-
structured information. Therefore,
subjects get a basic description of the
decision that needs to be made and need
to acquire further information by various
means (e.g. by asking questions, or by
searching for data on-line). Metrics
associated with this method are type,
sequence, and acquisition time of
information [15].
b) Information display boards This method
investigates what information is acquired
by the decision maker. Research data
relates to the content and sequence of the
information explicitly acquired by the
subject. The method evolved from
envelopes with text (pioneered by Payne
in 1976) to computerized information
retrieval systems (which fall in the next
category). The critiques of this method
argue that there is a need of pre-
structured information which needs to be
formalized as written data.
c) Computer-based process tracing
1) Mouselab is a well-known technique
[4] that builds on the information
display boards principle. Besides
information content and sequence it
allows the researcher to measure the
time needed by the subject to acquire
some piece of information.
2) MouseTrace is a technique that relies
on logging mouse movements. The
software package MouseTracker
(http://mousetracker.com/) allows
experimental designs to be created,
data to be collected and then analyzed
or exported. The key feature of mouse
tracking is the possibility to directly
observe the timeline of key cognitive
processes.
d) Eye-tracking. Eye movements are
obviously directly linked to information
acquisition. Also, at some level, they are
closely connected to the cognitive
processes of the decision makers [20].
There are several metrics that can be
calculated based on eye-tracking, the
most important are linked to saccades
and fixations [21]. Connected to
saccades, decision-making researchers
found of interest: latency, duration, and
amplitude [15]. About fixations are of
interest the duration, frequency and
scanning path [15].
In the remainder of the section, we discuss
the different metrics that can be recorded
using some process-tracing tools. Some of
these metrics are of capital importance to us.
3.2.1. Click-through Data
Click-through is basically a record of the
sequence of mouse clicks. The click-through
data was found to be correlated to decision
making in online searches and information
retrieval by humans [22], [23], [24]. The
metrics that was used in these studies are:
Number of clicks on a link. This is
replaced in our problem by number of
62 Informatica Economică vol. 18, no. 1/2014
DOI: 10.12948/issn14531305/18.1.2014.05
clicks on an interface object (e.g. button,
menu item, textbox);
Total number of clicks in a usage
session;
Distinct clicks in a usage session
indicate what links (i.e. interface objects)
were used by the user. For our problem,
this is a subset of the set of interface
objects.
3.2.2. Eye-tracking Data
Eye-tracking equipment helps to create a
record of the elements the subject’s eyes
fixated upon. Other interesting data extracted
using this method is the fixation sequence
and fixation times of the different elements.
Fixation means that a person’s eyes are
aimed at some object, therefore he
investigates it. Fixation sequence is the order
of the items a person looks at. Fixation time
is the period of time over which the subject’s
eyes are directed at the object. In our eye-
tracking experiment, subjects look at process
models. Therefore, a fixation occurs when
the subject looks at the model node for a
period of time over a certain threshold that
will allow his brain to capture the meaning of
the visual stimulus [25], [26], [27].
The eye-tracking software calculates fixation
time as the length of time the eye velocity
was below both the saccade velocity criterion
and the drift distance criterion. Saccades are
fast rotations of the eyes that occur several
times each second and are commanded
automatically by the brain (without getting
awareness) [27]. Saccades show up when the
subject’s attention shifts from one point on
the screen to another.
4 The Formal Approach
This section introduces a formalization of our
problem and the proposed output of an
integrated click-through and eye fixations
log.
Problem statement: Given a usage session of
a system, output an event log that traces the
user interaction with the software.
Definition 1 (Usage Session): Let S be any
software system. A usage session US is a set
of all the activities performed by the user
within the software from the moment he
logs-in (or launches the program if it is a
desktop-based software) until he logs-out (or
closes the software).
Definition 2 (Usage Trace): A usage trace,
UT = (T, A), is a tuple where:
T is a set of timestamps recorded by the
software such that t0 is the recorded time
of the first activity and tf is the
timestamp of the last activity and any ti
∈ [t0, tf]; A is a set of activities performed by a
user of software towards an individual,
identifiable goal. During a usage session
the user might aim for different goals,
sequentially or concurrently. Therefore,
A ⊆ US.
Definition 3 (Mouse Click-through Trace): A
mouse click-through trace, MT = (TC, OC),
is a tuple where:
TC is a set of timestamps recorded by
the software such that any t ∈ T and tc ∈ [t0, tf];
OC is a set of interface objects that were
clicked.
In other words, the SP is the order in which
the decision maker fixates the elements of the
decision-aware system interface.
Definition 4 (Scan Path): Using eye-tracking
recorded fixation sequences, we define Scan
Path, SP = (TF, OF), as a tuple where:
T is a set of timestamps recorded by the
eye-tracker such that any t ∈ T and tf ∈ [t0, tf];
OF is a set of interface objects that a
subject has fixated (looked at).
In other words, the SP is the order in which
the decision maker fixates the elements of the
decision-aware system interface.
Definition 5 (Integrated log): An integrated
log, IL = (T, O) is a tuple where:
T is a set of timestamps such that T = TC
+ TF;
O is a set of interface objects such that O
= OC + OF.
5 Validation
In order to validate our claims, we conducted
a controlled experiment with 12 master
student at our faculty. The hypothesis that we
Informatica Economică vol. 18, no. 1/2014 63
DOI: 10.12948/issn14531305/18.1.2014.05
aim to support is “an individual decision
making strategy can be identified using an
integrated log”. The prediction based on this
hypothesis is that a tool that mines DDM
from integrated logs will be able to correctly
classify (when it comes to the most common
choice strategies) over 50% of the instances.
The experiment was performed in six steps as
follows:
a) Hardware set-up. For experimenting we
used a eye-tracking system produced by
Mirametrix
(http://mirametrix.com/products/eye-tracker/).
b) Calibration. This is an essential step that
influences data accuracy. Calibration means
mapping eye vectors (left and right) to a
position on the screen. For the experiments,
we calibrated a number of 9 points.
c) Calibration confirmation. This step give
assurance over the calibration quality;
d) Show decision-aware software interface.
Recording eye movements starts when the
log-in window is displayed on screen and
ends when the user clicks the Log-out button.
According to the formal approach introduced
in the previous section, this is an Usage
Session that overlaps with a Usage Trace
because the user solves only one and nothing
else but one decision problem;
e) Record clicks. The decision-aware system
logs all activities of the user. The main
events in the log are clicks on objects and
calculations performed with the dedicated
tool (see for details). Also, the eye-tracking
system records automatically a mouse click
layer. This layer is superimposed on the
screen video capture and indicates the objects
that were clicked by the decision maker;
f) Record eye coordinates. The eye-tracking
system records the coordinates of the eye
gaze at 60Hz. There are two settings that
allow the calculation of fixations: drift
distance and fixation time. Drift is due to the
fact that there is always an intra-ocular blood
pressure that makes each person’s eyes to
twitch and therefore move slightly. This
doesn’t mean that the user is willingly
moving his eyes. We used a threshold of 40
pixels, meaning that a saccade is recorded
(and implicitly the fixation is broken) if two
consecutive coordinates are farther apart than
40 pixels. Fixation time is the minimum
interval for which gaze coordinates should
indicate the user looks at the same point on
the screen in order to classify it as a fixation.
We used 4 microseconds as a threshold.
The participants in the experiment were
required to choose between 3 banks to open
an account with. There were 6 criterions for
this decision: the credit facilities offered by
each bank, the perceived customer
friendliness, the deposit interest rate, the
distance from home, the familiarity with the
bank, and the number of ATMs.
Each participant (decision maker) was asked
to perform the following activities:
Select one choice strategy from:
lexicographic, disjunctive, elimination
by aspects, additive differences,
majority, and equal weights;
Use the decision-aware software to
investigate the available data while
employing the selected choice strategy;
Input the selected alternative (one of the
three banks to open an account with) and
log-out.
After performing the experiment, some data-
preprocessing was needed. The main activity
was to define Regions of Interest (ROI) for
the eye-tracking analysis software. A ROI is
an area of the screen that belongs together
(e.g. the area of a button from the interface).
A ROI was defined for every interface
object. That allowed us to work with
aggregated data rather than raw screen
coordinates. Screen fixations were filtered so
that only the ones on ROIs were kept for
further processing. Another activity was to
filter the click logs. Only clicks on textboxes,
menu items and the ‘=’ button that performs
the calculation were kept. By default the
values for all textboxes are hidden. Therefore
clicks on textboxes are required to reveal the
value of a certain criterion. The value is
shown for 5 seconds then is hidden again,
requiring the user to click the textbox again if
he doesn’t remember the value that was
shown. This is our personalized
implementation of MouseLab.
64 Informatica Economică vol. 18, no. 1/2014
DOI: 10.12948/issn14531305/18.1.2014.05
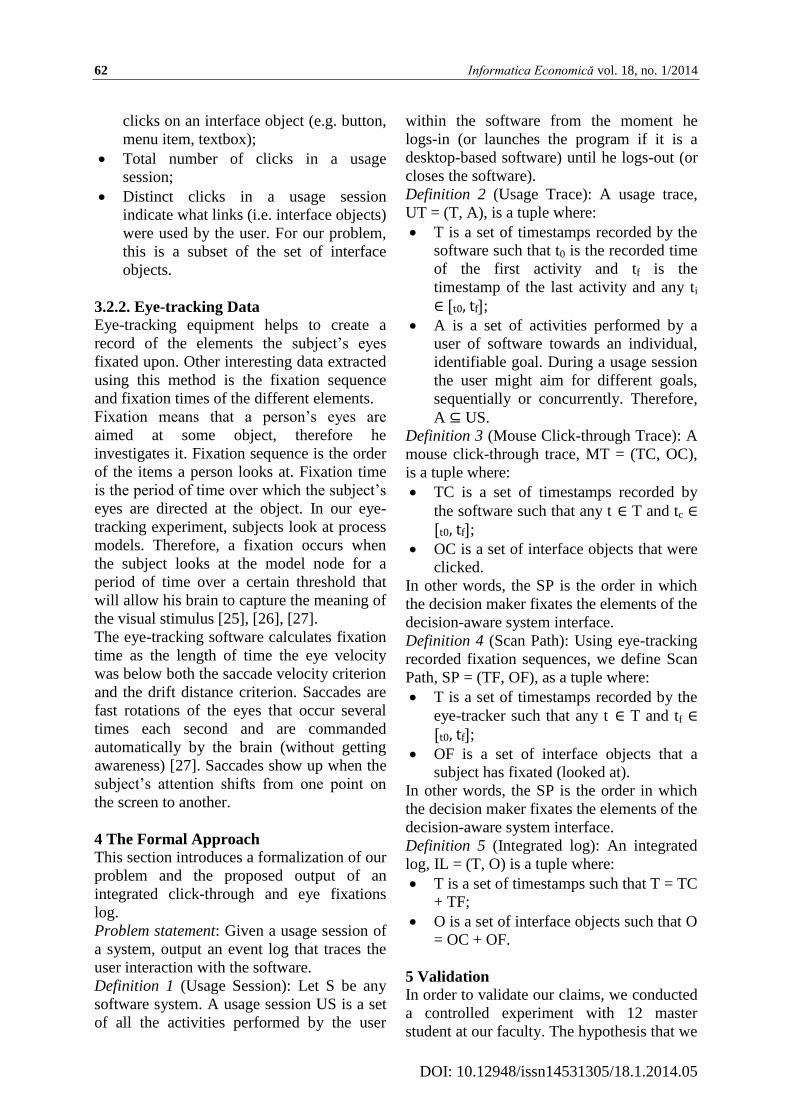
An example of a user trace from the interface point of view is shown in Fig. 2:
Fig. 2. Interface of the decision-aware system for one user
In Fig. 2 one can notice in:
area labeled A the menu elements,
area labeled B the history of calculations
performed by the particular decision
maker,
area C an incomplete calculation
(involving at this point just the value of
credit facility B),
area D the option to create a new data
element. It is used, for example, for
setting thresholds (see the first element
in area B which is the threshold setting
the minimal number or ATMs),
area E one of the data elements in the
scenario. Clicking Add button adds it to
the calculator in area C.
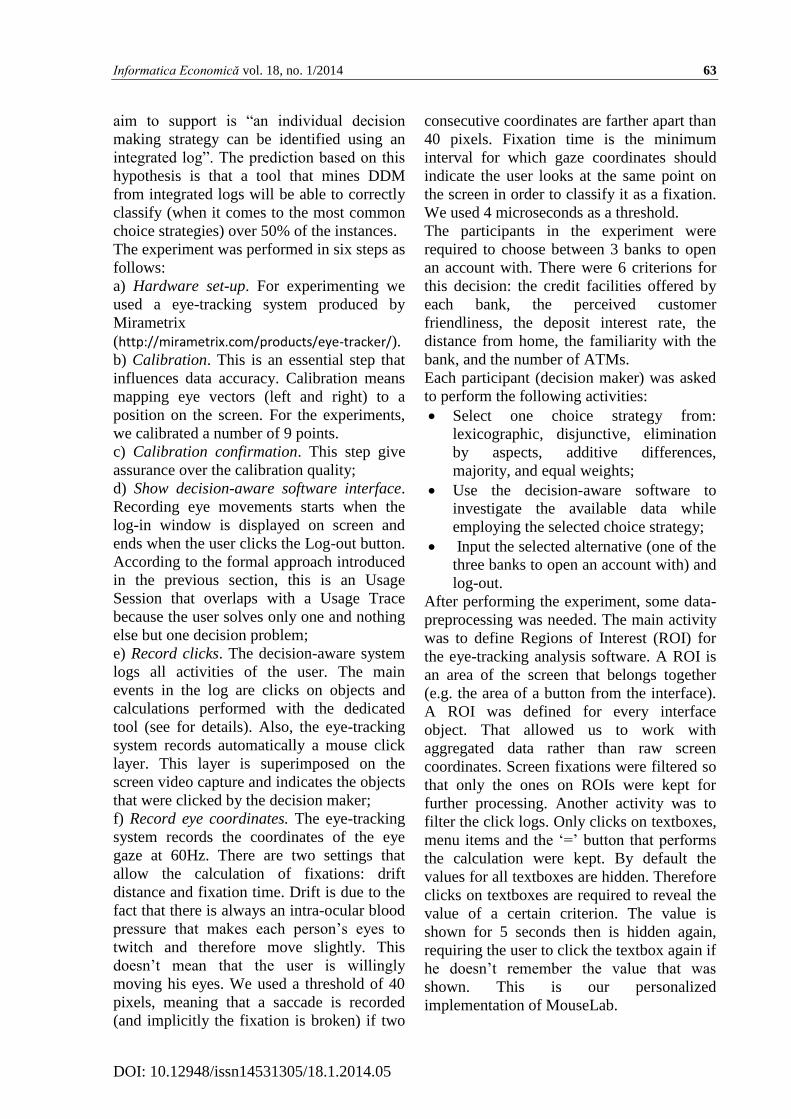
A partial click-through log is introduced in
Fig. 3. It shows the clicks performed by the
decision maker in the activity of comparing
the criterion ‘number of ATMs’ for each
alternative with a threshold set by him.

Informatica Economică vol. 18, no. 1/2014 65
DOI: 10.12948/issn14531305/18.1.2014.05
Fig. 3. Partial click-through log
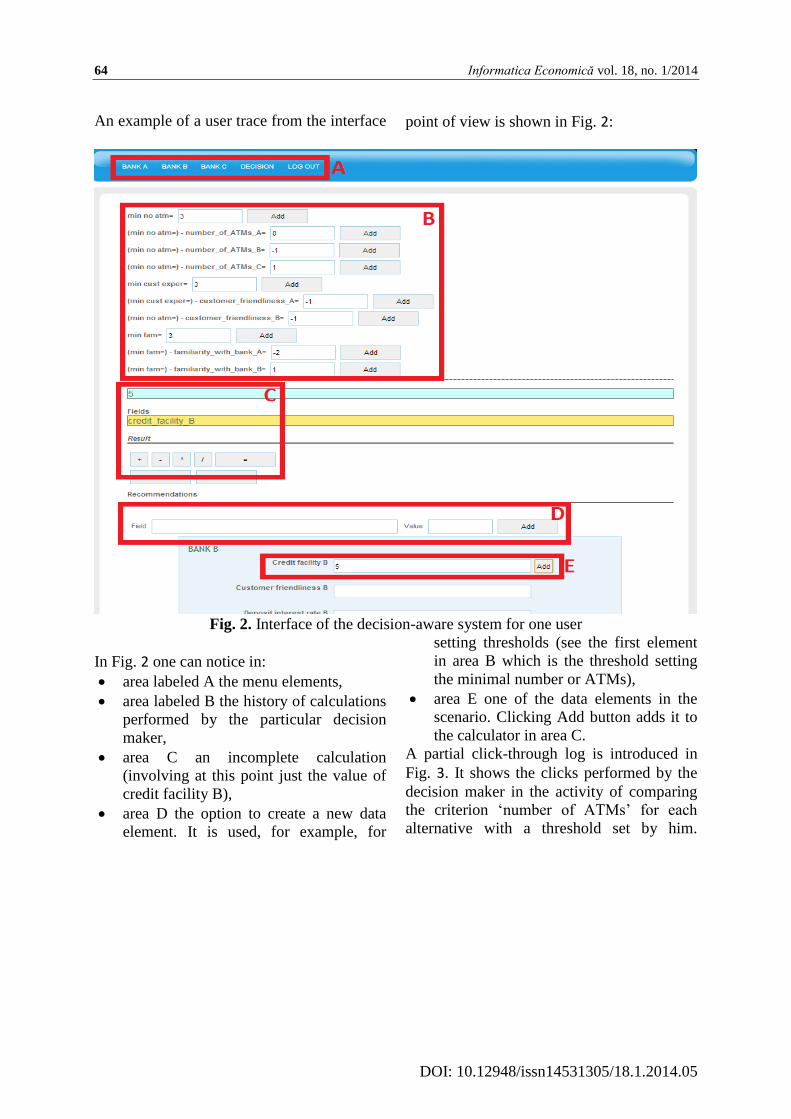
The eye-tracking log shows the fixations of
the decision maker while interacting with the
interface of the decision-aware system in
order to gather information on the decision at
hand. A partial eye-tracking log, of the same
user as in Fig. 3, is shown in Fig. 4. Please
note that setting ROIs is similar to delimiting
areas such the ones depicted in Fig. 2.
Fig. 4. Partial eye-tracking log
One can note that at various timestamps the
eye-tracking system logs the coordinates of
the two eyes (A = left eye and B = right eye)
in columns ALX and ALY. Also, the
software aggregates the times spent in one
ROI once the gaze leaves the delimited area.
Hence, the recording of event with codes 711
in the log (e.g. first record of an event code
711 that shows up in the log said that the user
spent 0.15 sec looking at the interface object
in ROI31).
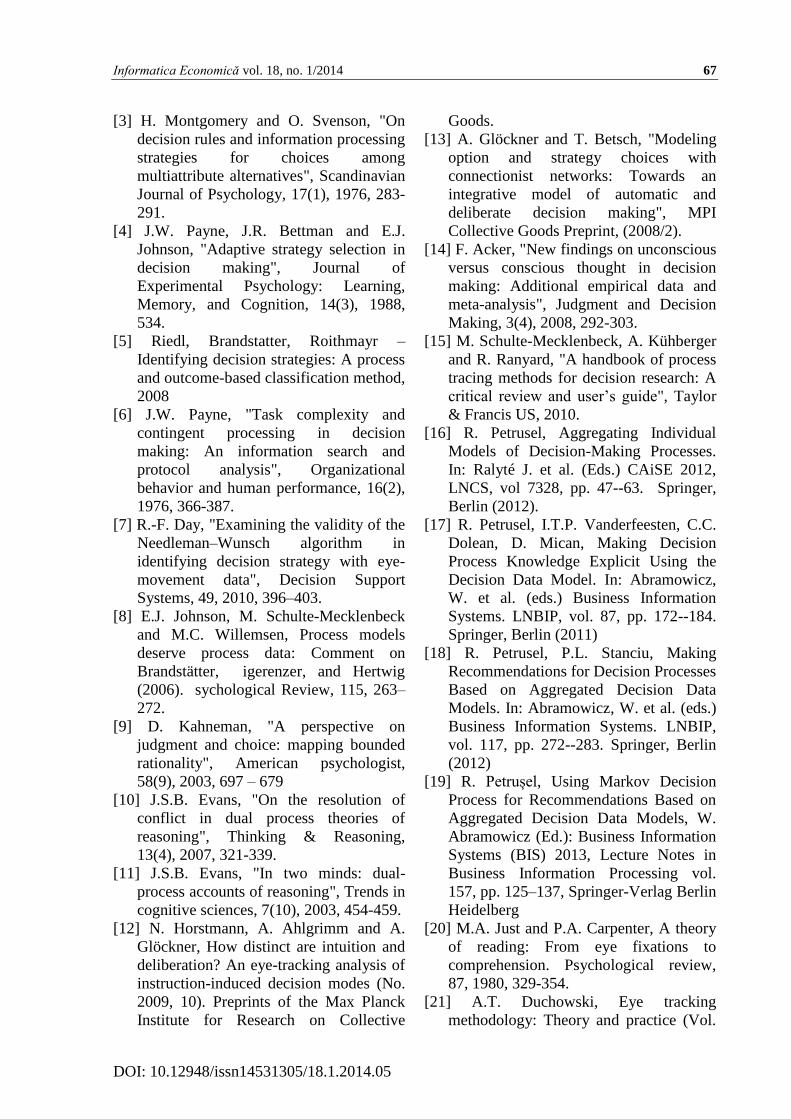
The partial integrated log obtained by
merging the click-through (Fig. 3) and eye-
tracking (Fig. 4) partial logs is introduced in
Fig. 5.
69 complete_decision user 7 21/09/2013 19:25:37:684 4408 click menu item Bank A Bank A
69 complete_decision user 7 21/09/2013 19:25:44:634 4409 click textbox min no atm 3
69 complete_decision user 7 21/09/2013 19:25:46:196 4411 click buton =min no atm 3
69 complete_decision user 7 21/09/2013 19:25:48:193 4412 click menu item Bank A Bank A
69 complete_decision user 7 21/09/2013 19:25:53:97 4415 click textbox number_of_ATMs_A 3
69 complete_decision user 7 21/09/2013 19:25:55:928 4417 click buton =(min no atm=) - number_of_ATMs_A 0
69 complete_decision user 7 21/09/2013 19:25:59:86 4419 click menu item Bank A Bank A
69 complete_decision user 7 21/09/2013 19:26:04:635 4421 click menu item Bank B Bank B
69 complete_decision user 7 21/09/2013 19:26:07:264 4422 click textbox number_of_ATMs_B 4
69 complete_decision user 7 21/09/2013 19:26:11:119 4424 click buton =(min no atm=) - number_of_ATMs_B -1
69 complete_decision user 7 21/09/2013 19:26:15:180 4425 click menu item Bank B Bank B
69 complete_decision user 7 21/09/2013 19:26:19:358 4428 click menu item Bank C Bank C
69 complete_decision user 7 21/09/2013 19:26:21:533 4429 click textbox number_of_ATMs_C 2
69 complete_decision user 7 21/09/2013 19:26:24:137 4431 click buton =(min no atm=) - number_of_ATMs_C 1
69 complete_decision user 7 21/09/2013 19:26:29:863 4432 click menu item Bank C Bank C
69 complete_decision user 7 21/09/2013 19:26:31:176 4433 click menu item Bank A Bank A
6 ATT ADT ALX ALY ARI APW APH AQU AFX BTT BDT BLX BLY BRI
5 TotalTime DeltaTimeX_Gaze Y_Gaze Region PupilWidthPupilHeightQuality Fixation TotalTime DeltaTimeX_Gaze Y_Gaze Region
7 0.000000 EyeA FrameRate 0
7 0.000000 EyeB FrameRate 0
16 0.000000 C:\Documents and Settings\Razvan\Desktop\user7.txt
10 0.0000 0.0000 0.6972 0.7461 31 0.0869 0.0799 1 0.0167 -0.0135 -134.805 0.7267 0.8230 -1
10 0.0167 167.269 0.6967 0.7383 31 0.0922 0.0793 1 0.0167 0.0032 167.178 0.7262 0.8140 -1
10 0.0333 166.179 0.6972 0.7342 31 0.0889 0.0813 1 0.0166 0.0199 166.612 0.7259 0.8090 31
10 0.0503 169.170 0.6976 0.7258 31 0.0907 0.0800 1 0.0169 0.0366 167.092 0.7248 0.8026 31
10 0.0667 164.549 0.6967 0.7240 31 0.0896 0.0792 1 0.0165 0.0533 166.630 0.7239 0.7996 31
10 0.0834 167.197 0.6974 0.7181 -1 0.0899 0.0805 1 0.0167 0.0700 167.020 0.7228 0.7956 31
711 0.0834 A:ROI[31] for 0.150188 sec
10 0.1001 166.300 0.6971 0.7191 -1 0.0863 0.0793 1 0.0166 0.0867 167.019 0.7220 0.7942 31
711 0.1001 A:Drift 97637 ( 0.223, 0.659 ) --> ( 0.697, 0.719 ) = 0.47833 distance for 0.567187 sec
10 0.1168 167.446 0.6963 0.7166 -1 0.0873 0.0823 1 0.0334 0.1033 166.660 0.7212 0.7912 31
711 0.1200 B:Drift 97638 ( 0.244, 0.738 ) --> ( 0.721, 0.791 ) = 0.47996 distance for 0.583872 sec
10 0.1334 166.195 0.6959 0.7167 -1 0.0876 0.0760 1 0.0500 0.1200 166.492 0.7208 0.7906 31
10 0.1502 167.571 0.6959 0.7104 -1 0.0870 0.0755 1 0.0668 0.1367 167.084 0.7204 0.7885 31
10 0.1668 166.248 0.6965 0.6975 25 0.0898 0.0774 1 0.0834 0.1533 166.503 0.7212 0.7825 31
10 0.1835 167.351 0.6961 0.6809 25 0.0878 0.0764 1 0.1001 0.1702 168.064 0.7232 0.7656 31
10 0.2002 166.523 0.6961 0.6701 25 0.0864 0.0778 1 0.1168 0.1867 165.648 0.7249 0.7524 31
711 0.2002 A:Fixation 181569 ( 0.697, 0.719 ) for 0.100133 sec
711 0.2034 B:Fixation 181570 ( 0.721, 0.791 ) for 0.083451 sec
10 0.2169 166.920 0.6970 0.6591 25 0.0900 0.0780 1 0.0167 0.2034 167.211 0.7259 0.7415 31
10 0.2336 166.910 0.6975 0.6536 25 0.0886 0.0763 1 0.0167 0.2201 166.475 0.7264 0.7338 31
10 0.2502 166.582 0.6971 0.6475 25 0.0831 0.0762 1 0.0167 0.2368 167.154 0.7266 0.7259 31
10 0.2669 166.632 0.6982 0.6431 25 0.0891 0.0768 1 0.0167 0.2535 166.616 0.7264 0.7219 31
711 0.2702 B:ROI[31] for 0.250270 sec
10 0.2836 166.985 0.6985 0.6376 25 0.0879 0.0767 1 0.0167 0.2702 167.033 0.7257 0.7145 -1

66 Informatica Economică vol. 18, no. 1/2014
DOI: 10.12948/issn14531305/18.1.2014.05
Fig. 5. Partial integrated log
What one can read in Fig. 5 is what the user
was actually doing in his decision-making
process. What can be roughly read into this
log is that the user started straight away by
evaluating Bank A (probably because it’s the
first menu), then looked at 3 data element
names (time4, time5 and time6), then found
out that the last one (namely No of ATMs)
was worth evaluating and decided to set a
threshold for it with a value of 3 (time7
through time11) then checked the value of
the criterion for the first alternative against
the threshold and found out that they are on
par (time 15 through 17).
6 Conclusions
The research presented in this paper can be
subscribed to the broader area of decision
process-tracing. We employ some of the
methods used in this area, namely mouse
tracing and eye-tracking. Those methods
were commonly used for researching
decision making for a long time. The novelty
that we bring is the integration of the two
data sources into one log. So far, researchers
have used either one of the two or employed
them concurrently for the same study in order
to prove different points. One of the benefits
of our proposal is that this kind of logs is
richer compared to using just one data source
in isolation. The other benefit is that this log
can be used further in automatically
extracting decision-making models, as
presented in our Decision Data Model-based
framework. To the best of our knowledge,
this mining approach is a complete novelty to
the research of decision process research.
Of course, there are limitations to our
proposal. The main criticism is that, at this
moment, eye-tracking is still expensive. This
limits the immediate applicability to
controlled experiments conducted with one
user at a time. Still, eye-tracking becomes
cheaper and more widespread with each
passing year (see eye-tracking feature in
Samsung Galaxy S4 smartphone). And, after
all, researchers should look far into the future
and come up with solutions to problems that
others don’t know they will have.
Acknowledgement
This work was supported by CNCSIS-
UEFISCSU, project number PN II – RU - TE
52/2010 code 292/2010.
References [1] G.J. Browne, M.G. Pitts and J.C.
Wetherbe, "Cognitive stopping rules for
terminating information search in online
tasks", MIS Quarterly, 31(1), 2007, 89-
104.
[2] G. J. Cook, "An empirical investigation
of information search strategies with
implications for decision support system
design". Decision Sciences, 24(3), 1993
683-698.
69 user 7 time 1 eye-tracking ROI[31] MENU Bank A
69 user 7 time 2 click menu item Bank A Bank A
69 user 7 time 3 eye-tracking ROI[31] MENU Bank A
69 user 7 time 4 eye-tracking ROI[1] LABEL Credit facility A
69 user 7 time 5 eye-tracking ROI[5] LABEL Deposit interest rate A
69 user 7 time 6 eye-tracking ROI[13] LABEL Number of ATMs A
69 user 7 time 7 eye-tracking ROI[17] TXT new data element name
69 user 7 time 8 eye-tracking ROI[18] TXT new data element value
69 user 7 time 9 eye-tracking ROI[19] Button
69 user 7 time 10 click textbox min no atm 3
69 user 7 time 11 click buton =min no atm 3
69 user 7 time 12 eye-tracking ROI[31] MENU Bank A
69 user 7 time 13 click menu item Bank A Bank A
69 user 7 time 14 eye-tracking ROI[1] LABEL Credit facility A
69 user 7 time 15 eye-tracking ROI[13] LABEL Number of ATMs A
69 user 7 time 16 click textbox number_of_ATMs_A 3
69 user 7 time 17 click buton =(min no atm=) - number_of_ATMs_A 0
Informatica Economică vol. 18, no. 1/2014 67
DOI: 10.12948/issn14531305/18.1.2014.05
[3] H. Montgomery and O. Svenson, "On
decision rules and information processing
strategies for choices among
multiattribute alternatives", Scandinavian
Journal of Psychology, 17(1), 1976, 283-
291.
[4] J.W. Payne, J.R. Bettman and E.J.
Johnson, "Adaptive strategy selection in
decision making", Journal of
Experimental Psychology: Learning,
Memory, and Cognition, 14(3), 1988,
534.
[5] Riedl, Brandstatter, Roithmayr –
Identifying decision strategies: A process
and outcome-based classification method,
2008
[6] J.W. Payne, "Task complexity and
contingent processing in decision
making: An information search and
protocol analysis", Organizational
behavior and human performance, 16(2),
1976, 366-387.
[7] R.-F. Day, "Examining the validity of the
Needleman–Wunsch algorithm in
identifying decision strategy with eye-
movement data", Decision Support
Systems, 49, 2010, 396–403.
[8] E.J. Johnson, M. Schulte-Mecklenbeck
and M.C. Willemsen, Process models
deserve process data: Comment on
Brandstätter, igerenzer, and Hertwig
(2006). sychological Review, 115, 263–
272.
[9] D. Kahneman, "A perspective on
judgment and choice: mapping bounded
rationality", American psychologist,
58(9), 2003, 697 – 679
[10] J.S.B. Evans, "On the resolution of
conflict in dual process theories of
reasoning", Thinking & Reasoning,
13(4), 2007, 321-339.
[11] J.S.B. Evans, "In two minds: dual-
process accounts of reasoning", Trends in
cognitive sciences, 7(10), 2003, 454-459.
[12] N. Horstmann, A. Ahlgrimm and A.
Glöckner, How distinct are intuition and
deliberation? An eye-tracking analysis of
instruction-induced decision modes (No.
2009, 10). Preprints of the Max Planck
Institute for Research on Collective
Goods.
[13] A. Glöckner and T. Betsch, "Modeling
option and strategy choices with
connectionist networks: Towards an
integrative model of automatic and
deliberate decision making", MPI
Collective Goods Preprint, (2008/2).
[14] F. Acker, "New findings on unconscious
versus conscious thought in decision
making: Additional empirical data and
meta-analysis", Judgment and Decision
Making, 3(4), 2008, 292-303.
[15] M. Schulte-Mecklenbeck, A. Kühberger
and R. Ranyard, "A handbook of process
tracing methods for decision research: A
critical review and user’s guide", Taylor
& Francis US, 2010.
[16] R. Petrusel, Aggregating Individual
Models of Decision-Making Processes.
In: Ralyté J. et al. (Eds.) CAiSE 2012,
LNCS, vol 7328, pp. 47--63. Springer,
Berlin (2012).
[17] R. Petrusel, I.T.P. Vanderfeesten, C.C.
Dolean, D. Mican, Making Decision
Process Knowledge Explicit Using the
Decision Data Model. In: Abramowicz,
W. et al. (eds.) Business Information
Systems. LNBIP, vol. 87, pp. 172--184.
Springer, Berlin (2011)
[18] R. Petrusel, P.L. Stanciu, Making
Recommendations for Decision Processes
Based on Aggregated Decision Data
Models. In: Abramowicz, W. et al. (eds.)
Business Information Systems. LNBIP,
vol. 117, pp. 272--283. Springer, Berlin
(2012)
[19] R. Petrușel, Using Markov Decision
Process for Recommendations Based on
Aggregated Decision Data Models, W.
Abramowicz (Ed.): Business Information
Systems (BIS) 2013, Lecture Notes in
Business Information Processing vol.
157, pp. 125–137, Springer-Verlag Berlin
Heidelberg
[20] M.A. Just and P.A. Carpenter, A theory
of reading: From eye fixations to
comprehension. Psychological review,
87, 1980, 329-354.
[21] A.T. Duchowski, Eye tracking
methodology: Theory and practice (Vol.

68 Informatica Economică vol. 18, no. 1/2014
DOI: 10.12948/issn14531305/18.1.2014.05
373). Springer 2007.
[22] G.R. Xue, H.J. Zeng, Z. Chen, Y. Yu,
W.Y. Ma, W. Xi and W. Fan, Optimizing
web search using web click-through data.
In Proceedings of the thirteenth ACM
international conference on Information
and knowledge management, 2004, (pp.
118-126). ACM.
[23] K. Hofmann, B. Huurnink, M. Bron and
M. de Rijke, Comparing click-through
data to purchase decisions for retrieval
evaluation. In Proceedings of the 33rd
international ACM SIGIR conference on
Research and development in information
retrieval (pp. 761-762). ACM 2010.
[24] T. Joachims, L. Granka, B. Pan, H.
Hembrooke and G. Gay, Accurately
interpreting clickthrough data as implicit
feedback. In Proceedings of the 28th
annual international ACM SIGIR
conference on Research and development
in information retrieval (pp. 154-161).
ACM 2005.
[25] D.D. Salvucci, J.H. Goldberg,
"Identifying fixations and saccades in
eye-tracking protocols", In Proceedings
of the 2000 symposium on Eye tracking
research & applications, pp. 71-78. ACM
(2000)
[26] L.A. Granka, T. Joachims, G. Gay,
"Eye-tracking analysis of user behavior
in WWW search", In Proceedings of the
27th annual international ACM SIGIR
conference on Research and development
in information retrieval, pp. 478--479,
(2004)
[27] K. Holmqvist, M. Nyström, R.
Andersson, R. Dewhurst, H. Jarodzka, J.
Van de Weijer, "Eye tracking: A
comprehensive guide to methods and
measures", OUP Oxford, (2011)
Răzvan PETRUŞEL holds a Ph.D. in Cybernetics, Statistics and Business
Informatics starting 2008. He started in 2003 as a full-time Ph.D. student at
the Business Information Systems Department, Economical Sciences and
Business Administration Faculty, in Babeş-Bolyai University of Cluj-
Napoca. In 2007 he became an assistant professor, in 2009 he became a
lecturer and since 2013 he holds the current position as associate professor.
His research is focused on Decision-making Process Modeling, Mining and
Analysis, Business Process Management; and Process Mining.


![[XLS]kuk.results.tripod.comkuk.results.tripod.com/BTECH1C.xls · Web viewSurender Tinku 05 sdb 352 05 sdb 120 05 sdb 395 05 sdb 433 05 sdb 467 05 sdb 458 05 sdb 359 05 sdb 370 05](https://img.pdfslide.us/doc/110x75/5ae703757f8b9aee078da099/xlskuk-viewsurender-tinku-05-sdb-352-05-sdb-120-05-sdb-395-05-sdb-433-05-sdb.jpg)