Embed Size (px)
Citation preview
Considering industry costs and benefits for Safety Management, can we do better?
Richard Gowland Technical Director EPSC
www.epsc.org
EPSC• EPSC is an Industry funded association of approximately
40 chemical companies• EPSC has cooperative groups on
– IEC 61511– LOPA– Buncefield Learning Experience– Safety Critical Systems– Ageing Facilities– Competence– ‘Atypical’ scenarios
• Cooperates with Competent Authorities in Technical Work Groups
• And was asked to chair the Buncefield PSLG Sub group 3 on Layer of Protection Analysis (June 2008-Dec 2009) to produce guidance on best practice.
Safety Management at the establishment
• Creating a system tailored for the establishment:– Corporate requirements – Technology– Risk– Location– International Standards
• e.g. ISO, IEC,OECD….
– Industry Standards• API, NFPA, , ….
– Local Legal requirements – Eu Directives as determined by national bodies
• Seveso 2, ATEX, CAD, ….
General PrinciplesThe best performing companies’ systems have a
history of managing safety and environment to a high standard
The cost of this is not seen as a cost to conform with Seveso 2
• Seveso 2 Directive is a good framework for Safety management
• For the best performing companies the added cost of Seveso 2 is:
• Preparation of the Safety Report• Enforcement/Inspection (cost difference between now and
pre Seveso 2)• Charges (where applied)
• For the regulators, the ‘cost of Seveso 2’• Is it the overall cost of the ‘regime’? or• The cost difference between now and pre Seveso 2?
Steps• Interpreting the different requirements of each
Member State Competent Authority– Local law– ‘enhancements’
• Gap analysis comparing these detailed requirements with:– establishment practices– the documented system in the establishment (c.w.
the Safety Report format)• Closing the gaps• Demonstration of conformance
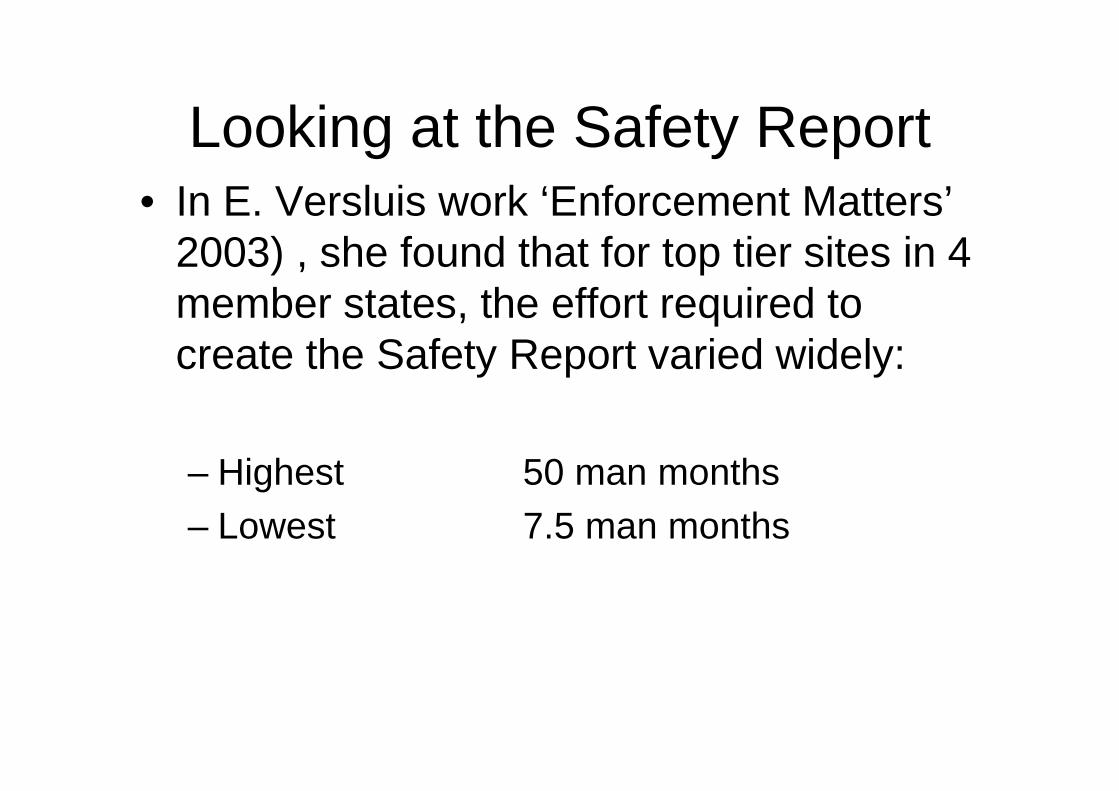
Looking at the Safety Report• In E. Versluis work ‘Enforcement Matters’
2003) , she found that for top tier sites in 4 member states, the effort required to create the Safety Report varied widely:
– Highest 50 man months
– Lowest 7.5 man months
Looking at the Safety Report
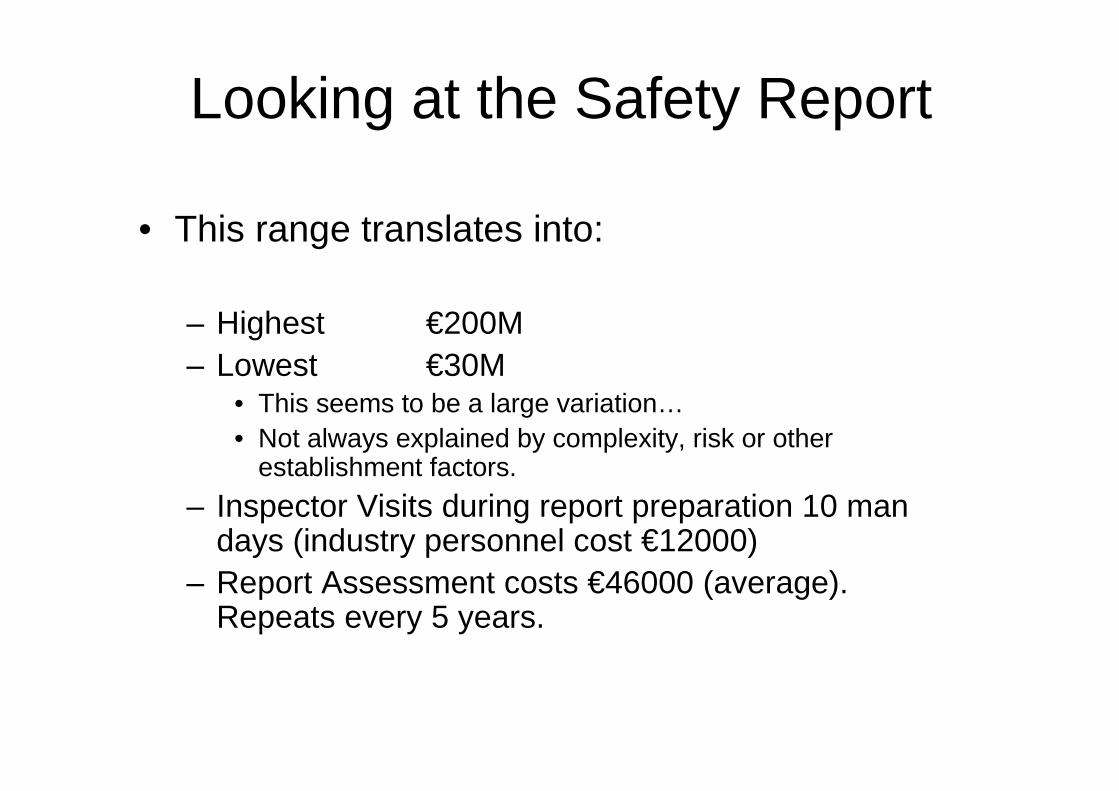
• This range translates into:
– Highest €200M– Lowest €30M
• This seems to be a large variation…• Not always explained by complexity, risk or other
establishment factors.
– Inspector Visits during report preparation 10 man days (industry personnel cost €12000)
– Report Assessment costs €46000 (average). Repeats every 5 years.
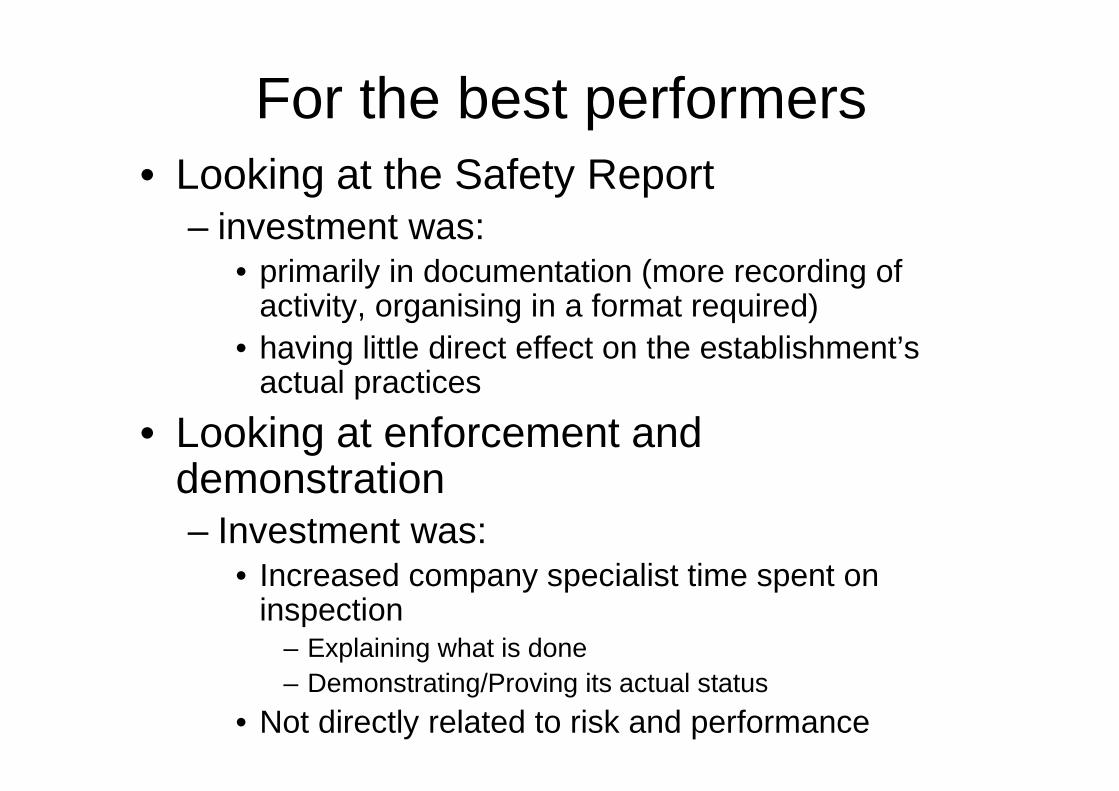
For the best performers• Looking at the Safety Report
– investment was:• primarily in documentation (more recording of
activity, organising in a format required)• having little direct effect on the establishment’s
actual practices
• Looking at enforcement and demonstration– Investment was:
• Increased company specialist time spent on inspection
– Explaining what is done– Demonstrating/Proving its actual status
• Not directly related to risk and performance
Looking at - Demonstration
• Results of Inspection and auditing versus detailed requirements
• Performance
• Both relevant, but there seems to be more emphasis on the first
Demonstration COST ESTIMATE
• Inspection effort 20 man days per year
(Source of data E. Versluis ‘Enforcement Matters’)
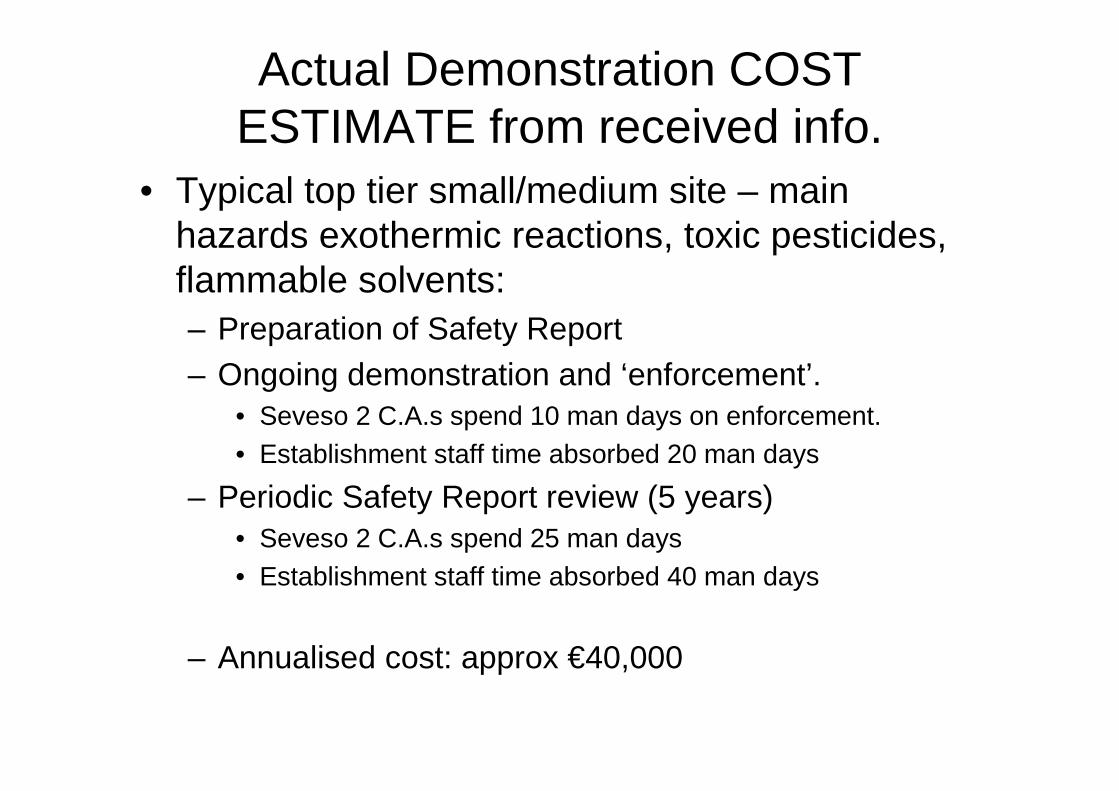
Actual Demonstration COST ESTIMATE from received info.
• Typical top tier small/medium site – main hazards exothermic reactions, toxic pesticides, flammable solvents: – Preparation of Safety Report– Ongoing demonstration and ‘enforcement’.
• Seveso 2 C.A.s spend 10 man days on enforcement. • Establishment staff time absorbed 20 man days
– Periodic Safety Report review (5 years)• Seveso 2 C.A.s spend 25 man days• Establishment staff time absorbed 40 man days
– Annualised cost: approx €40,000
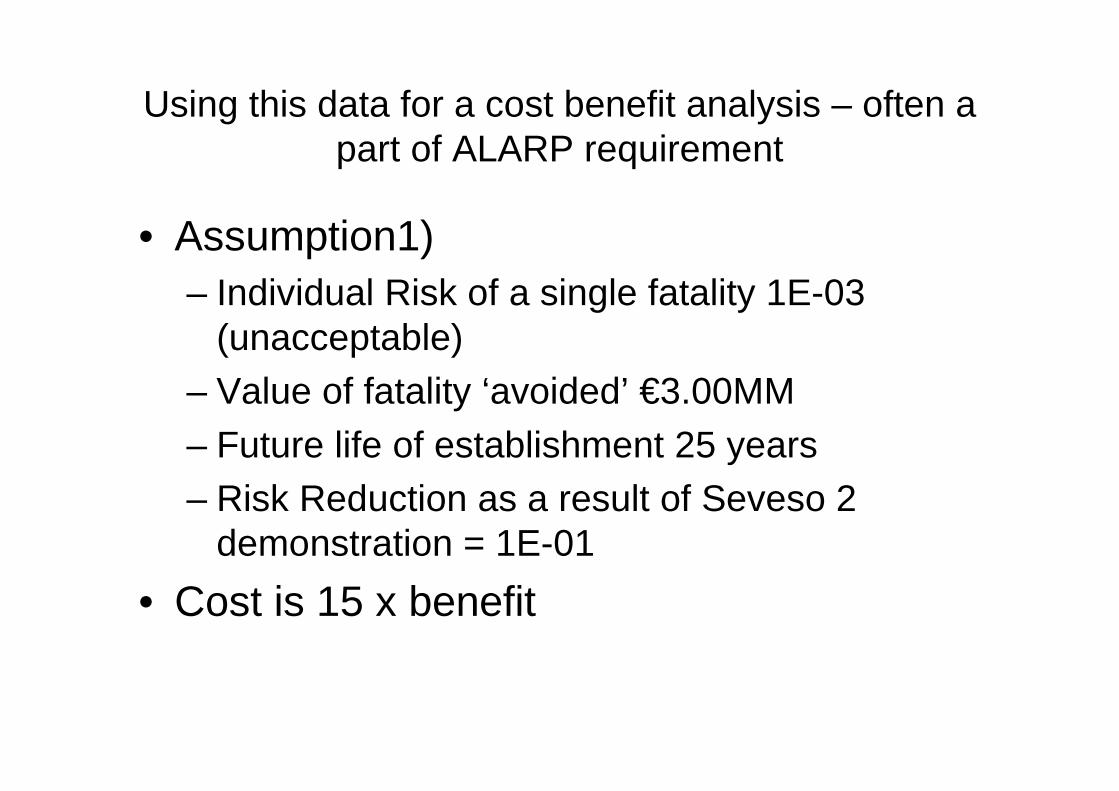
Using this data for a cost benefit analysis – often a part of ALARP requirement
• Assumption1)– Individual Risk of a single fatality 1E-03
(unacceptable)– Value of fatality ‘avoided’ €3.00MM
– Future life of establishment 25 years– Risk Reduction as a result of Seveso 2
demonstration = 1E-01
• Cost is 15 x benefit
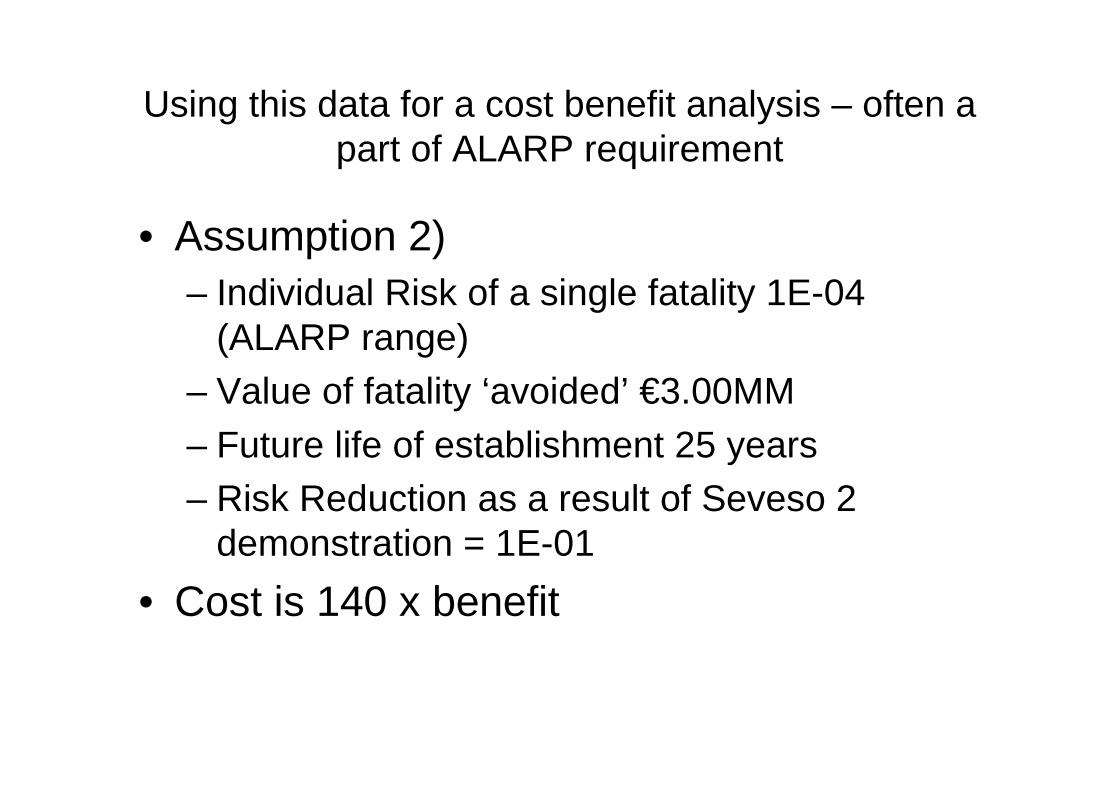
Using this data for a cost benefit analysis – often a part of ALARP requirement
• Assumption 2)– Individual Risk of a single fatality 1E-04
(ALARP range)– Value of fatality ‘avoided’ €3.00MM
– Future life of establishment 25 years– Risk Reduction as a result of Seveso 2
demonstration = 1E-01
• Cost is 140 x benefit
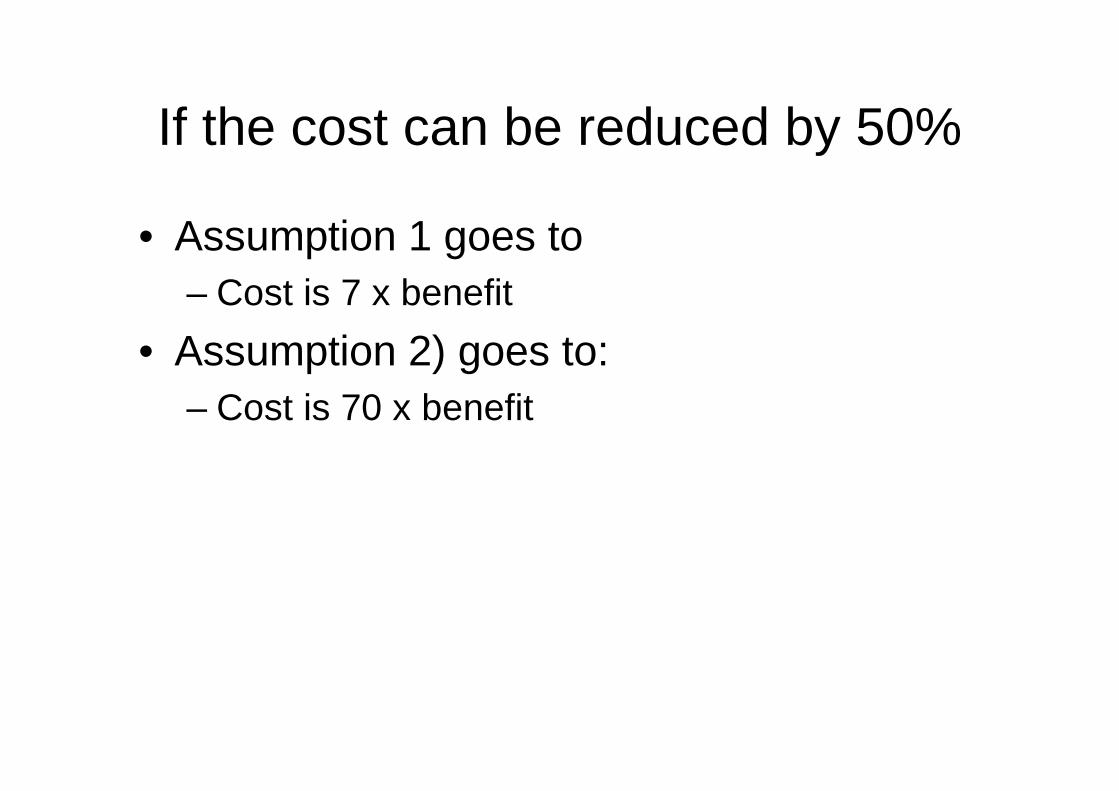
If the cost can be reduced by 50%
• Assumption 1 goes to– Cost is 7 x benefit
• Assumption 2) goes to:– Cost is 70 x benefit
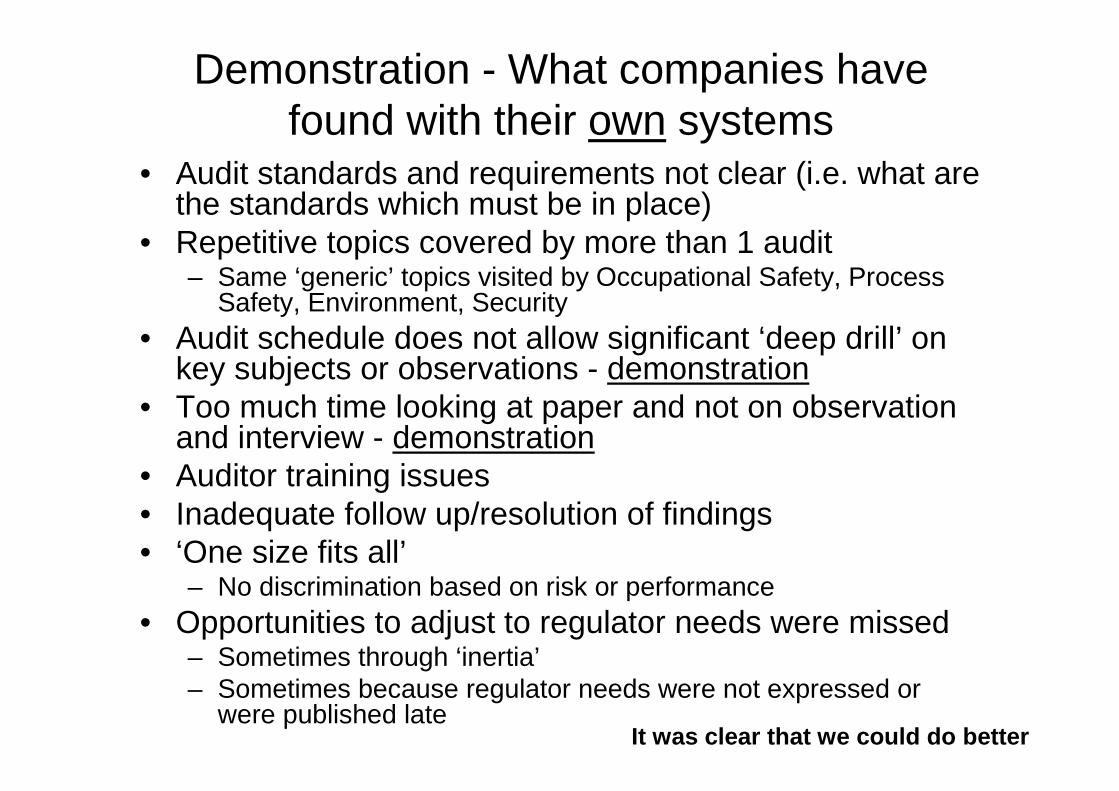
Demonstration - What companies have found with their own systems
• Audit standards and requirements not clear (i.e. what are the standards which must be in place)
• Repetitive topics covered by more than 1 audit– Same ‘generic’ topics visited by Occupational Safety, Process
Safety, Environment, Security• Audit schedule does not allow significant ‘deep drill’ on
key subjects or observations - demonstration• Too much time looking at paper and not on observation
and interview - demonstration• Auditor training issues• Inadequate follow up/resolution of findings• ‘One size fits all’
– No discrimination based on risk or performance • Opportunities to adjust to regulator needs were missed
– Sometimes through ‘inertia’– Sometimes because regulator needs were not expressed or
were published lateIt was clear that we could do better
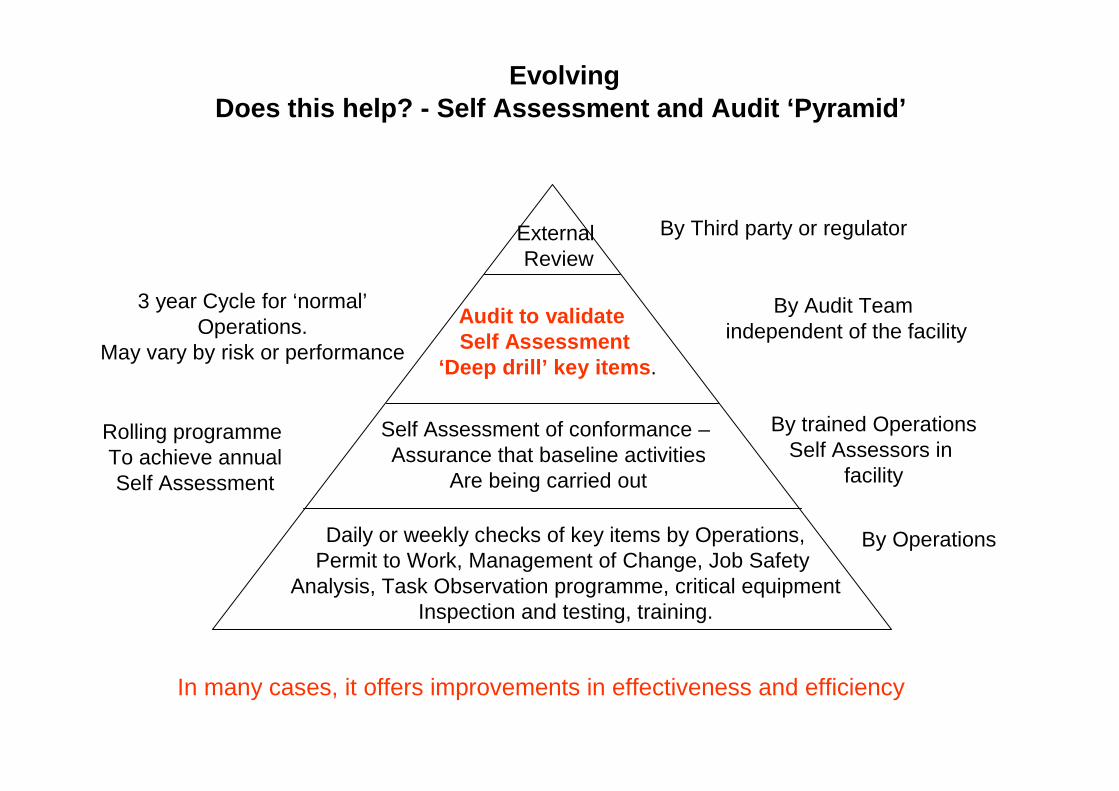
Daily or weekly checks of key items by Operations,Permit to Work, Management of Change, Job Safety
Analysis, Task Observation programme, critical equipmentInspection and testing, training.
Self Assessment of conformance –Assurance that baseline activities
Are being carried out
Audit to validate Self Assessment
‘Deep drill’ key items .
External Review
By Third party or regulator
By Audit Team independent of the facility
By trained OperationsSelf Assessors in
facility
By Operations
Rolling programme To achieve annualSelf Assessment
3 year Cycle for ‘normal’Operations.
May vary by risk or performance
Does this help? - Self Assessment and Audit ‘Pyramid’
In many cases, it offers improvements in effectiveness and efficiency
Evolving
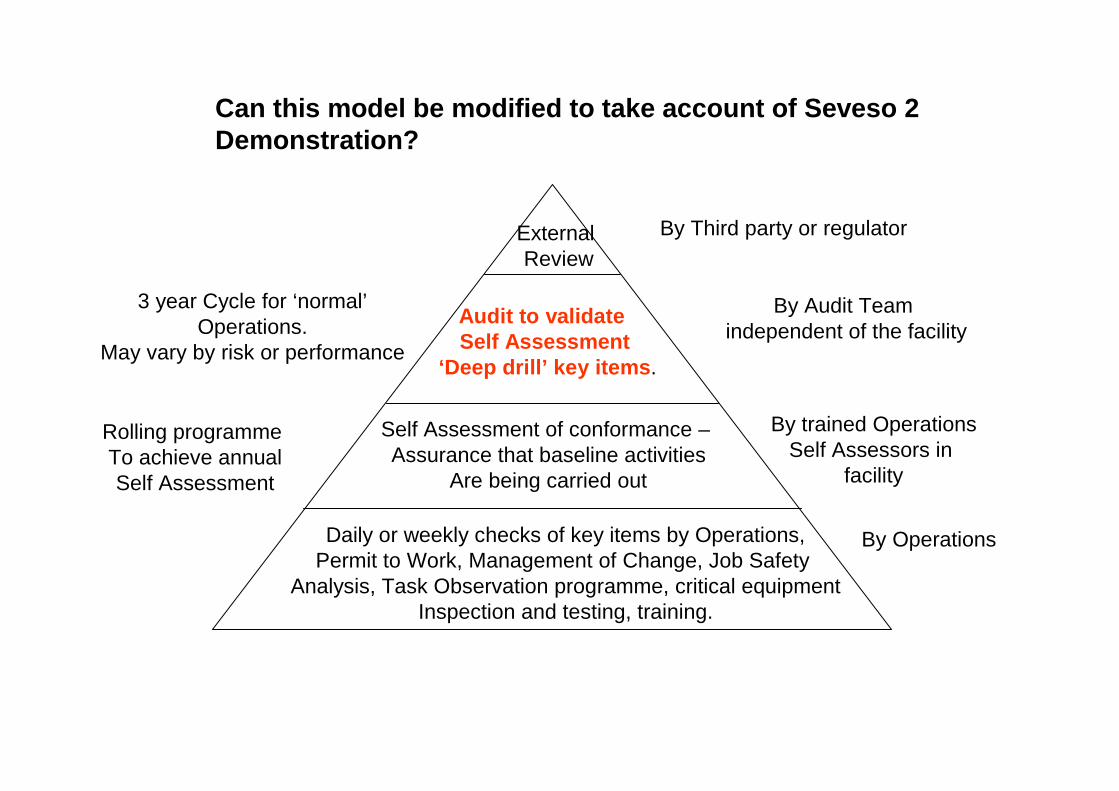
Daily or weekly checks of key items by Operations,Permit to Work, Management of Change, Job Safety
Analysis, Task Observation programme, critical equipmentInspection and testing, training.
Self Assessment of conformance –Assurance that baseline activities
Are being carried out
Audit to validate Self Assessment
‘Deep drill’ key items .
External Review
By Third party or regulator
By Audit Team independent of the facility
By trained OperationsSelf Assessors in
facility
By Operations
Rolling programme To achieve annualSelf Assessment
3 year Cycle for ‘normal’Operations.
May vary by risk or performance
Can this model be modified to take account of Seves o 2 Demonstration?
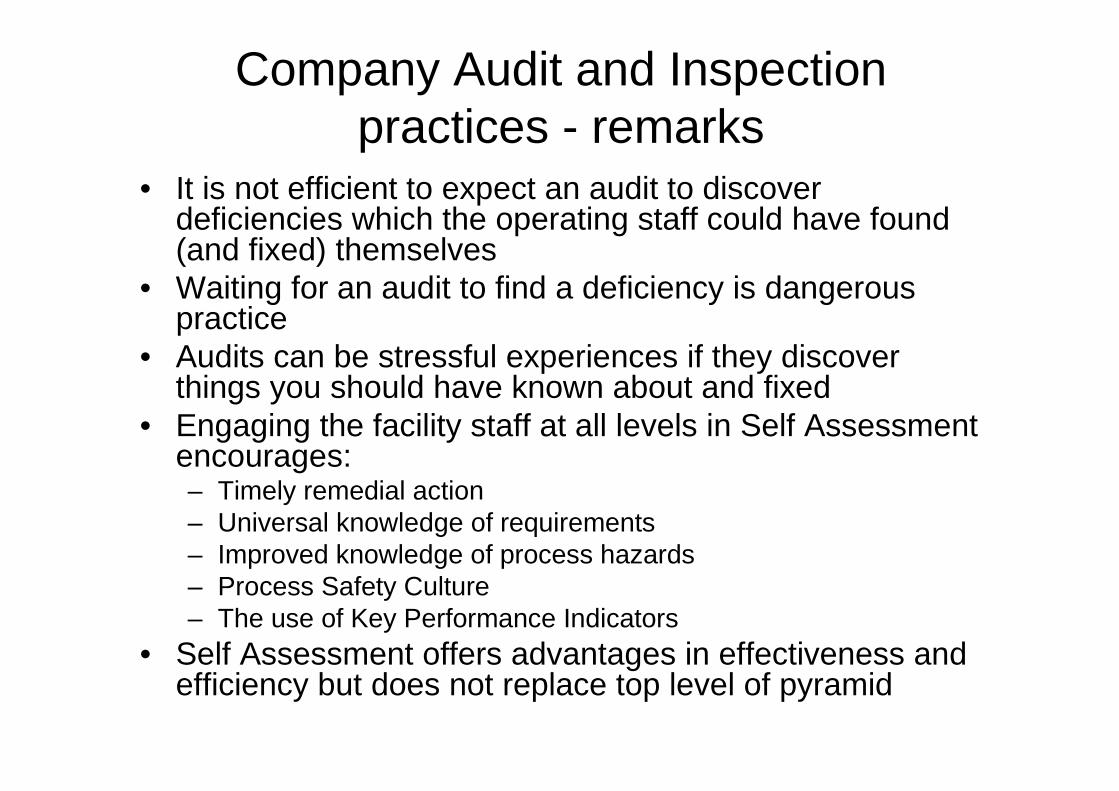
Company Audit and Inspection practices - remarks
• It is not efficient to expect an audit to discover deficiencies which the operating staff could have found (and fixed) themselves
• Waiting for an audit to find a deficiency is dangerous practice
• Audits can be stressful experiences if they discover things you should have known about and fixed
• Engaging the facility staff at all levels in Self Assessment encourages:– Timely remedial action– Universal knowledge of requirements– Improved knowledge of process hazards– Process Safety Culture– The use of Key Performance Indicators
• Self Assessment offers advantages in effectiveness and efficiency but does not replace top level of pyramid
Returning to risk and performance (avoiding ‘one size fits all’)
• Self assessment: can be a ‘rolling’ programme driven by subject matter experts and based on corporate requirements. Risk is understood and is a driver on methods.
• Audit: Risk and performance can be used to determine the frequency of audit.– e.g.
• low risk cycle = 5 years• high risk cycle = 2-3 years
– (primary basis – scale of consequence)• Performance vs API 754 or CEFIC Responsible Care® metrics
– Poor performance merits frequent inspections
• Competent Authority enforcement programme may be able to advise on assist and take account of self assessment practices and adjust their own programmes based on risk and performance.
If self assessment partnerships can be created:
– Competent Authority specifies standards and methods
– Companies adjust their self assessment and audit practices
– Companies need to maintain or improve performance before confidence can be established
• Read ‘What happened at Buncefield’ (HSE publications) to see how big this challenge might be.
It seems logical that:• Companies need to adapt audit protocols and
requirements to meet regulator expectations • Establishments adapt self assessment to include
regulator detail• Establishments need to publish performance
metrics for all aspects of safety (not just occupational safety)
• Process Safety performance metrics systems need to become the ‘norm’ and establish confidence.
• Regulators publish their requirements and expectations and take account of risk and performance
….and the Benefits• A plant manager said to me in 1990.
– “Until you sent me the audit format and the pre-audit questionnaire, I did not know enough detail of the company’s requirements – it made me go and look and check myself!”
• In the Seveso ‘regime’ we have seen the same evolution over time.
• The preparation of the safety report and demonstration of conformance has improved documentation and organisation of EH&S
• Benefits can be quantified and compared with costs in an organised way. – Risk Reduction - Benefits of incidents avoided (injury and asset)
versus Costs over the lifetime of of the establishment
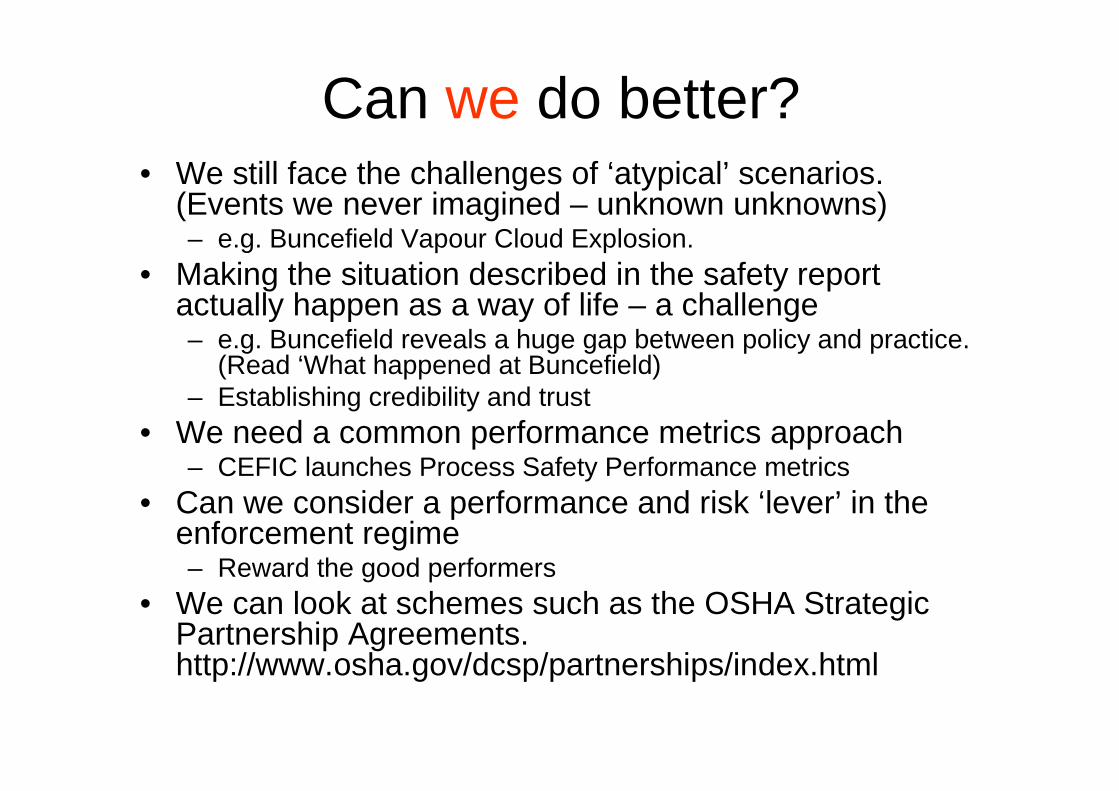
Can we do better?• We still face the challenges of ‘atypical’ scenarios.
(Events we never imagined – unknown unknowns)– e.g. Buncefield Vapour Cloud Explosion.
• Making the situation described in the safety report actually happen as a way of life – a challenge– e.g. Buncefield reveals a huge gap between policy and practice.
(Read ‘What happened at Buncefield) – Establishing credibility and trust
• We need a common performance metrics approach– CEFIC launches Process Safety Performance metrics
• Can we consider a performance and risk ‘lever’ in the enforcement regime – Reward the good performers
• We can look at schemes such as the OSHA Strategic Partnership Agreements. http://www.osha.gov/dcsp/partnerships/index.html
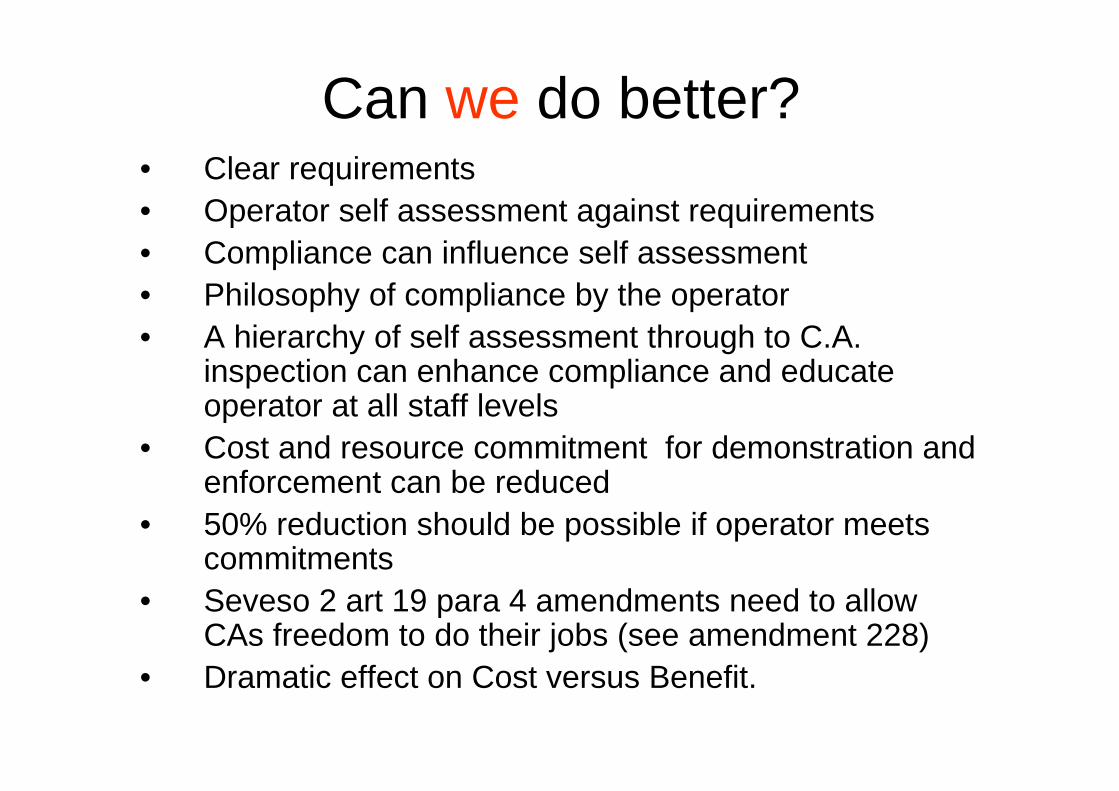
Can we do better?• Clear requirements• Operator self assessment against requirements • Compliance can influence self assessment • Philosophy of compliance by the operator• A hierarchy of self assessment through to C.A.
inspection can enhance compliance and educate operator at all staff levels
• Cost and resource commitment for demonstration and enforcement can be reduced
• 50% reduction should be possible if operator meets commitments
• Seveso 2 art 19 para 4 amendments need to allow CAs freedom to do their jobs (see amendment 228)
• Dramatic effect on Cost versus Benefit.