Embed Size (px)
Citation preview

FINANCIAL DEVELOPMENT AND ECONOMIC
GROWTH IN FIJI
Caroline Waqabaca
Working Paper 2004/03
December 2004
Economics Department
Reserve Bank of Fiji
Suva
Fiji
The views expressed herein are those of the author and do not necessarily reflect those of the Reserve Bank of Fiji.

Abstract
This paper examines the relationship between financial
development and growth in Fiji using time series data from 1970-2000.
Firstly, an analysis of a broad set of financial indicators for Fiji based on a
cross-country study by Beck, Demirguc-Kunt and Levine (1999), provide
support for the evolvement of Fiji’s financial sector over the three decade
review period. Secondly, the paper examines empirically the causal link
between financial development and economic growth in Fiji using unit root
and co-integration techniques within a bi-variate vector auto-regressive
(bVAR) framework. Results reveal a positive relationship between
financial development and economic growth for Fiji with the direction of
causation running predominantly from economic growth to financial
development. This outcome is consistent with results found for countries
which have less sophisticated financial systems.

2
1.0 Introduction
The important link between financial development and economic
growth has been the subject of numerous studies, for many years. More
specifically, these researches have highlighted, at the theoretical as well as
empirical level, the significance of having a developed financial system to
support economic growth. Additionally, recent studies have also addressed
this topic from an open economy perspective, and found that financial
integration with the global economy like financial deepening can bring
about economic benefits.
For Fiji, studying the relationship between financial development
and economic growth is a vital one, considering the continuing progress in
its financial sector. This focus of study provides support for research work,
which have included Fiji in its cross-country empirical evidence.1 This
paper combines an analysis of a set of financial indicators for Fiji, (which
give an indication of the size and activity of the financial sector over a three
decade period) and an empirical investigation into the financial
development–economic growth link.
The paper is divided into 5 sections. The next section discusses a
literature survey on financial development and economic growth. Section 3
covers financial developments in Fiji on the basis of a recently developed
broad set of indicators, section 4 provides an empirical analysis while
section 5 gives some concluding remarks.
1 See Beck, Demirguc-Kunt, and Levine (1999); Odedokun (1996).

3
2.0 Literature Survey
This section reviews various studies on both theoretical and
empirical relationships between financial development and economic
growth.
2.1 Theoretical studies
Studies undertaken to examine the relationship between financial
development and economic growth goes far back to the work of Bagehot
(1873), Schumpeter (1912), and Hicks (1969).
In his study for instance, Schumpeter (1912) discusses the finance-
growth relationship as a supply-leading one, in which the financial sector
leads economic growth by successfully identifying and funding high-
yielding projects. This is based on the view that a financial system that is
functioning well, would encourage technological innovation by selecting
and financing businesses that are expected to be successful.
Bagehot (1873) and Hicks (1969) on the other hand, argued that
financial development was an important channel in the industrialization of
England, by helping the movement of large amounts of funds for
“immense” works.
Later works include that of Greenwood and Jovanovic (1990),
Levine (1991), Bencivenga and Smith (1991) and Saint-Paul (1992), which
involved theoretical models, wherein an efficient financial market raises the
quality of investments, thus leading to economic growth. Specifically,
Greenwood and Jovanovic (1990) built in their model a financial sector
whose main objective it to direct funds to high-yielding investments with

4
the assistance of information. This then would lead to economic growth,
which would in turn enable the implementation of costly financial
structures. In his model, Levine (1991) explains how stock markets
influence growth by improving firm efficiency. Furthermore, Bencivenga
and Smith (1991) explain in their study, that a well-functioning financial
system would improve the level of investment towards non-liquid objects,
which will be beneficial to the economy. Saint-Paul (1992) on the other
hand, explains the role of the financial sector in helping business
enterprises in specialisation by allowing investors to hedge by holding a
diversified portfolio. This in turn would lead to productivity growth.
Supporting this, Atje and Jovanovic (1993) explain how the financial
system can help investors disperse risk and provide funding, thereby
guiding them to the best investments which are profitable to the economy.
More studies include that of Maurice Obstfled (1994) who argued
that financial openness and access to international financial markets bring
benefits to businesses as well as the economy. Bencivenga, Smith and
Starr (1995) argued that industries, which require a longer period to
implement new technologies benefit more relatively, from developments in
the financial market. Rajan and Zingales (1996) concluded that as the
market develops, firms that are less-firmly established and have difficulty
with self-funding projects, would benefit better from external funding
methods, and therefore expand relatively faster.
Balckburn and Hung (1996) found that in a developed financial
system, the task of monitoring projects can be undertaken by financial
intermediaries, lowering transaction costs and channelling greater savings
towards new investments, thus boosting economic growth. Moreover, the

5
authors explain how a country can be trapped in a situation of low
economic growth and low financial development. More recently, Levine
and Zervos (1998) in their study argued that higher returns and improved
risk could encourage a lower savings rate, which would lower economic
growth with more liquid and internationally integrated financial markets.
In line with this, Tsuru (2000) explained how the development of the
financial sector is able to affect the saving rate, thus affecting the rate of
economic growth.
2.2 Empirical Evidence
Empirical analysis on the relationship between financial
development and economic growth goes back to early studies such as that
by Goldsmith (1969) who found that financial development led to faster
economic growth. Later studies, which have used less-simplified economic
and financial indicators, as well as examined the issue of causality, include
Gupta (1984) which examined the money effects on industrial production,
although the latter was regarded as measuring only a portion of overall
output.
Other studies include that by Jung (1986) which used a Vector auto-
regressive (VAR) approach to test the causality between financial
development and economic growth for a sample of 56 countries (both
developed and developing). King and Levine (1993) examined cross-
country evidence from 80 countries, and found a strong positive
relationship between each of the 4 measures of financial development used,
and economic growth. Murende and Eng (1994) in their study found the

6
causality between financial development and economic growth running in
both directions, in the case of Singapore. Demetriades and Hussein (1996)
found evidence of bi-directionality between financial development and
growth using data from 16 developing countries. Levine and Zervos (1996,
1998) found evidence that stock market liquidity and banking development
have a positive relationship with economic growth. Ragan and Zingales
(1998) argued that financial sector development and economic growth can
be affected by the saving rate, also supporting the hypothesis that financial
development causes economic growth.
Rousseau and Wachtel (1998) found one-way causality in the
relationship between financial development and economic growth in the
case of 5 present OECD countries during the period of fast industrialisation
(1871-1929). Kul and Khan (1999) in their study found bi-directional
causality for all countries in the sample. Beck, Levine and Loayza (2000)
found that banks have a strong causal effect on economic growth using
panel data analysis. Using cross-country evidence, studies by the World
Bank (1989) and Demirguc-Kunt and Levine (1996b), showed that the
financial structure differs considerably across countries and changes as
countries develop economically.
3.0 Overview of Financial Developments in Fiji2
While Fiji’s economic performance over the past years has been
2 Data used to construct the indicators are sourced from the IMF’s International Financial Statistics (IFS), Reserve Bank of Fiji, relevant institutions, and generally covers the period from 1970 to 2000.

7
relatively subdued, with GDP growth averaging around 3 percent from
1970-2000, the financial sector has continued to evolve. In the following
sections, we examine financial developments in Fiji during a three decade
review period, from 1970-2000, using indicators of financial development
from a study by Beck, Demirguc-Kunt and Levine (1999).
3.1 The Size and Activity of Financial Intermediaries
This section looks at measures, which compare the size and activity
of the central bank, commercial banks and other financial institutions
relative to each other and relative to GDP.3 The central bank4 is defined as
any institution that carries out the role of monetary authorities. Deposit
money banks5 - consists of all financial institutions that have “liabilities in
the form of deposits transferable by check or otherwise usable in making
payments” (IMF 1984, 29). Other financial institutions (OFI) – comprise
other bank-like institutions and non-bank financial institutions, which serve
as financial intermediaries, but do not incur liabilities usable as a means of
payment. Other bank-like institutions include (i) institutions that accept
deposits, but do not offer transferable deposit services, (ii) institutions that
self-finance through the issue of negotiable bonds, (iii) development banks,
and (iv) offshore units. Non-bank financial institutions comprise insurance
companies, provident and pension funds, trust and custody accounts, real
investment schemes, other pooled investment schemes, and compulsory
3 For a detailed description of the three financial sectors see IMF (1984). 4 Referred to hereafter as “Reserve Bank”. 5 Referred to hereafter as “Commercial Banks”.
8
savings schemes.
3.11 Measurers of Size6 of Financial Intermediaries7
There are two sets of size indicators used in this section; firstly, the
relative size indicators which gauge the size of the financial sector, relative
to each other, and secondly, the absolute size indicators, which determines
how important each financial sector is relative to GDP.
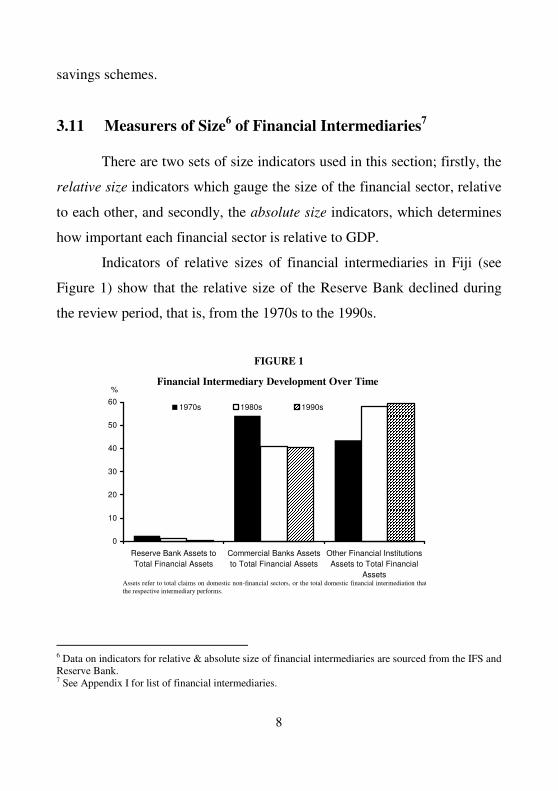
Indicators of relative sizes of financial intermediaries in Fiji (see
Figure 1) show that the relative size of the Reserve Bank declined during
the review period, that is, from the 1970s to the 1990s.
FIGURE 1
Financial Intermediary Development Over Time
0
10
20
30
40
50
60
Reserve Bank Assets toTotal Financial Assets
Commercial Banks Assetsto Total Financial Assets
Other Financial InstitutionsAssets to Total Financial
Assets
%
1970s 1980s 1990s
6 Data on indicators for relative & absolute size of financial intermediaries are sourced from the IFS and Reserve Bank. 7 See Appendix I for list of financial intermediaries.
Assets refer to total claims on domestic non-financial sectors, or the total domestic financial intermediation that the respective intermediary performs.
9
This decline is shown by the declining average ratio of Reserve
Bank assets to total financial assets during the review period, from around 2
½ percent in the 1970s to below one percent in the latter decade. Data on
10-year averages showed that while there was growth in assets of the
Reserve Bank over the 3-decade period, the increase in total financial assets
was relatively higher, hence the reduction in the ratio.
During the review period, the relative size of commercial banks
also declined. Over the 3-decade period, the average ratio of commercial
bank assets to total financial assets fell from 54 percent in the 1970s, to 41
percent in the 1980s, and down to 40 percent in the 1990s. The decline
shows that although commercial banks have represented a significant
portion of total claims by the financial sector, their growth in assets has
been relatively lower than that of other financial sectors over the years,
hence the decline in their average ratio. On the other hand, Figure 1 depicts
as maybe expected in a developing financial system, an increase in relative
importance of OFI8, whose average ratio rose from 44 percent in the 1970s
to 58 percent in the 1980s and up slightly to over 59 percent in the 1990s.
It is clear from the graph that in the 1980s, the relative size ratios of OFI
surpassed that of commercial banks, an indication of the importance that
OFI have played and will continue to play in Fiji’s financial system.
An alternative indicator for the relative size of commercial banks is
the average ratio of commercial bank assets to Reserve Bank assets, which
8 OFI are represented by the insurance sector, the Fiji National Provident Fund, the Fiji Development Bank and Unit Trust of Fiji, which together account for the majority of claims by OFI in Fiji; data limitations prevented inclusion of other OFI data.

10
shows that over the past three decades, the significance of commercial
banks has grown, as shown in Figure 2 below.
FIGURE 2
Financial Intermediary Development Over Time(Alternative Indicator)
94
95
96
97
98
99
100
Commercial Banks vs. Reserve Bank Assets
%
1970s 1980s 1990s
The measures of absolute size provide evidence about the
importance of the financial services performed by each financial
intermediary relative to the size of Fiji’s economy. Figure 3 shows that
over the 3-decade review period, the average ratio of Reserve Bank assets
to GDP, fell, from 1.2 percent in the 1970s to a marginal 0.1 percent in the
1990s, showing the reduction in the size of the Reserve Bank relative to
Fiji’s economy. At the same time, we see a constant rise in the average
ratio of commercial bank assets to GDP, throughout the same time period.
In the case of OFI, there was a sharp increase in their average asset to GDP
ratio from the 1970s to the 1980s, before a further growth in the latter
decade. Moreover, it was noted that during the 1980s, the OFI average
ratio surpassed the average ratio of commercial banks, reflecting the
Assets refer to total claims on domestic non-financial sectors, or the total domestic financial intermediation that the respective intermediary performs.

11
growing importance that OFI have had in Fiji’s economy.
FIGURE 3
Financial Intermediary Development Over Time
010203040506070
Res
erve
Ban
k A
sset
s to
Tot
alG
DP
Com
mer
cial
Ban
ks A
sset
s to
GD
P
Oth
er F
inan
cial
Inst
itutio
nsA
sset
s to
GD
P
Tot
al A
sset
s of
Life
Insu
ranc
eC
ompa
nies
to G
DP
Tot
al A
sset
s of
FN
PF
to G
DP
Tot
al A
sset
s of
UT
OF
to G
DP
Tot
al A
sset
s of
FD
B to
GD
P
Liqu
id L
iabi
litie
s to
GD
P
%
1970s 1980s 1990s
Another indicator for absolute size of financial intermediaries,
separate from the commonly asset-based measures, is the average ratio of
liquid liabilities to GDP, equivalent to the ratio of the sum of currency,
demand and interest-bearing liabilities of commercial banks and OFI to
GDP. The increase in the average ratio of this broad financial indicator
throughout the review period reflects the greater financial depth and
advancement by financial intermediaries in Fiji.
3.12 Measures of Activity9 of Financial Intermediaries
A drawback of the size measures is that they do not differentiate
9 Data on indicators for activity of financial intermediaries are sourced from the IFS and Reserve Bank.
Assets refer to total claims on domestic non-financial sectors, or the total domestic financial intermediation that the respective intermediary performs; Liquid liabilities consists of currency, demand & interest-bearing liabilities of banks.
12
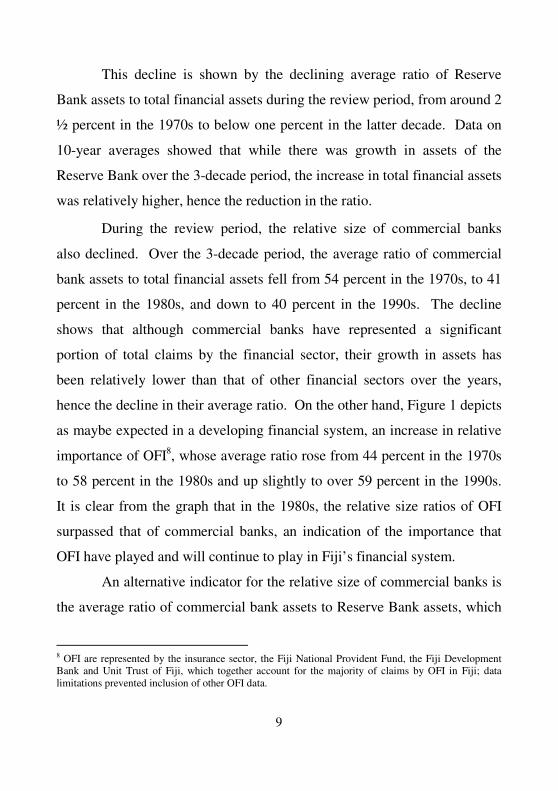
between financial institutions’ claims on the private and public sectors. To
distinguish between these claims, there are two activity measures of
financial intermediaries used in this section; first, the average ratio of
private sector claims by commercial banks to GDP, and secondly, the
average ratio of claims by both the commercial banks and OFI to GDP (see
Figure 4). Both these average ratios increased constantly from the 1970s
through to the 1990s, although during the 1980s, it appears that there was
much higher growth in the private credit by OFI which resulted in a
significant rise in the combined ratio from 23 percent to 40 percent.
FIGURE 4
Financial Intermediary Development Over Time
0
10
20
30
40
50
60
Private Credit by Commercial Banks toGDP
Private Credit by Commercial Banks &Other Financial Institutions to GDP
%
1970s 1980s 1990s
3.2 Efficiency and Market Structure of Commercial Banks10
This section examines developments in the efficiency and market
10 Data on indicators for efficiency & market structure of commercial banks in Fiji are sourced from the Reserve Bank.
Private Credit captures the financial intermediation with the private non-financial sector.
13
structure of commercial banks in Fiji. Due to data limitations, the time
period for this analysis is from 1990-2000 only.
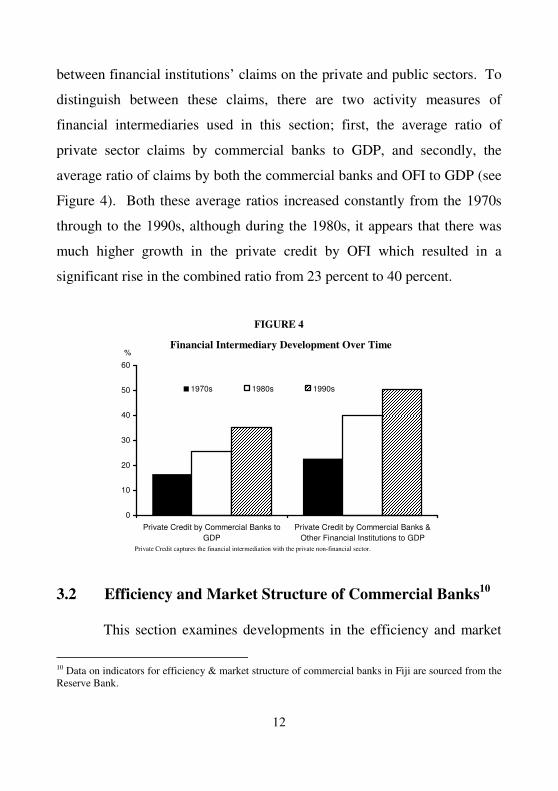
3.21 Measures of Efficiency
There are two indicators used in this section, to measure the
efficiency with which commercial banks perform their intermediary
functions. First, the net interest margin, which is equal to the accounting
value of a bank’s net interest revenue as a share of its total assets, shows a
general rising trend during the 1990s (see Figure 5). This upward trend
suggests an improvement in the efficiency of the banking sector. The other
efficiency indicator, the overhead cost, which equals the accounting value
of a bank’s overhead costs as a share of its total assets, gradually declined
from 1990-95 before steadily rising during the 2nd half of the 1990s.
FIGURE 5
Measurers of Efficiency Over Time
0
1
2
3
4
5
6
1990 1991 1992 1993 1994 1995 1996 1997 1998 1999 2000
% of total assets
Net Interest Margin Overhead Cost

14
3.22 Measures of Market Structure
Measures of market structure include the concentration of
commercial banks, foreign bank penetration and public versus private
ownership of banks.
The measure of concentration is defined as the ratio of the three
largest commercial banks’ assets to total banking sector assets. Over the
1990-2000 decade, there was a gradual decline in the concentration of
commercial banks in Fiji, a positive indication of more competition
amongst banks to attract savings and channel them efficiently to investors
(see Figure 6). The concentration ratio fell from 93 percent in 1990 to 78
percent in 2000.
FIGURE 6
Concentration of Commercial Banks Over Time
70
75
80
85
90
95
1990 1991 1992 1993 1994 1995 1996 1997 1998 1999 2000
%
Two indicators of foreign bank penetration are (1) foreign bank
share (number), which equals the number of foreign banks over the total
number of banks and (2) foreign bank share (assets), which equals the
share of foreign banks’ assets in total commercial bank assets. A bank is
15
defined as foreign if at least 50 percent of its equity is foreign-owned. A
study by Clasessens, Demirguc-Kunt and Huizinga (1997) revealed that an
increase in foreign bank penetration leads to a fall in profitability and
overhead costs for banks. In a separate study, Levine and Min (1998)
explained that an increase in foreign bank penetration enhances economic
growth by improving the efficiency of the domestic banking sector.
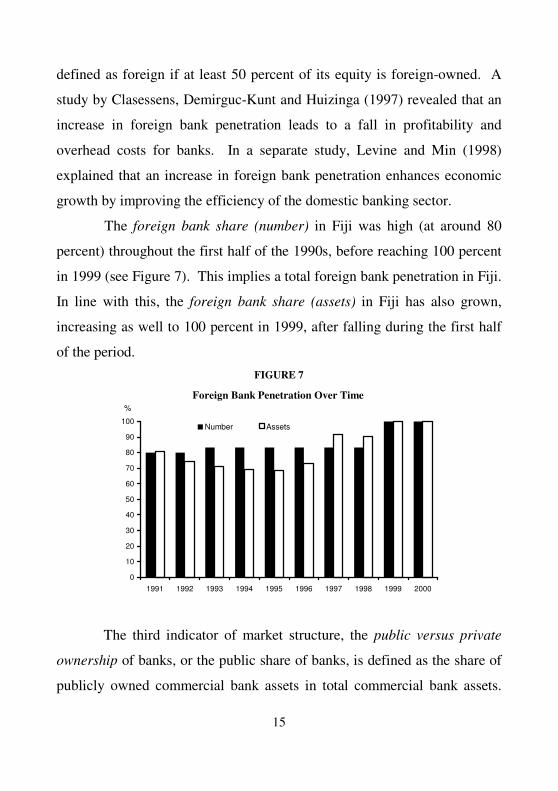
The foreign bank share (number) in Fiji was high (at around 80
percent) throughout the first half of the 1990s, before reaching 100 percent
in 1999 (see Figure 7). This implies a total foreign bank penetration in Fiji.
In line with this, the foreign bank share (assets) in Fiji has also grown,
increasing as well to 100 percent in 1999, after falling during the first half
of the period. FIGURE 7
Foreign Bank Penetration Over Time
0
10
20
30
40
50
60
70
80
90
100
1991 1992 1993 1994 1995 1996 1997 1998 1999 2000
%
Number Assets
The third indicator of market structure, the public versus private
ownership of banks, or the public share of banks, is defined as the share of
publicly owned commercial bank assets in total commercial bank assets.

16
By definition, a bank is public if a minimum 50 percent of its equity is
owned by the government or public institutions.
Public ownership of commercial banks in Fiji existed through
ownership of shares by the government, in the previously named National
Bank of Fiji (NBF). The size of these publicly-owned shares through the
NBF can be seen in the increase in the ratio of NBF assets to total
commercial bank assets from 1991 to 1995 (see Figure 8).
However, the bank suffered financial difficulties during the latter
half of the 1990s, which ultimately saw the privatisation of the bank in
1999, and the shift in majority ownership of assets to foreigners. This
development is reflected in the decline in the ratio during the latter period.
By the definition provided, since 1999, there has been no public bank in
Fiji, hence the zero ratio. Currently, the foreign shareholder-controlled
Colonial National Bank, has only a 49 percent shareholding by the Fiji
Government. FIGURE 8
Public Ownership of Commercial Banks Over Time
0
5
10
15
20
25
30
35
1991 1992 1993 1994 1995 1996 1997 1998 1999 2000
%
17
3.3 Other Financial Institutions11
This section analyses indicators of size and activity of OFI. OFI
are all financial intermediaries excluding the Reserve Bank and commercial
banks, which include Bank-like institutions, insurance companies, private
pension and provident funds, pooled investment schemes and development
banks. Each one of these 5 groups is defined as follows.
(1) Bank-like institutions consist of two groups of institutions; (i)
intermediaries, which take deposits without providing transferable deposits
facilities, and (ii) intermediaries, which raise funds on the financial market
primarily through negotiable bonds. Examples of (i) include savings banks,
cooperative banks, mortgage banks and building societies, and examples of
(ii) are finance companies. No analysis was done on these institutions due
to inconsistency in data and its availability.
(2) Insurance companies are distinguished between life insurance
companies and other insurance companies. Data on the insurance sector is
included in the OFI analysis.
(3) Private pension and provident funds include those that pool
risks and accumulate wealth. While these usually do not include pension
funds that are part of a government social security system, because it is the
only pension-fund in Fiji and a large one in respect of the whole financial
system, data on the Fiji National Provident Fund (FNPF) has been included
in the OFI analysis.
11 See Appendix I for list of OFI in Fiji.

18
(4) Pooled investment schemes include financial institutions, which
invest on behalf of their shareholders in a certain type of asset, as real estate
investment schemes or mutual funds. Available data on the Unit Trust of
Fiji (UTOF) was included in the OFI analysis.
(5) Development banks include those institutions, which obtain
funds largely from the government, OFI and supranational organisations.
The assets of these institutions are usually focussed on specific groups of
borrowers. Moreover, many of these institutions were set up after the
second-world war or following independence in an attempt to promote
economic development. Available data on the Fiji Development Bank
(FDB) is included in the OFI analysis.
3.31 Measures of the Size and Activity of Other Financial
Institutions This subsection examines size and activity indicators of OFI
including additional measures of insurance development.
For each of the five sub-categories of OFI above, measures of their
size relative to GDP are determined by calculating the average ratio of their
total assets to GDP, and measures of activity are examined by taking the
average ratio of their private sector claims to GDP.
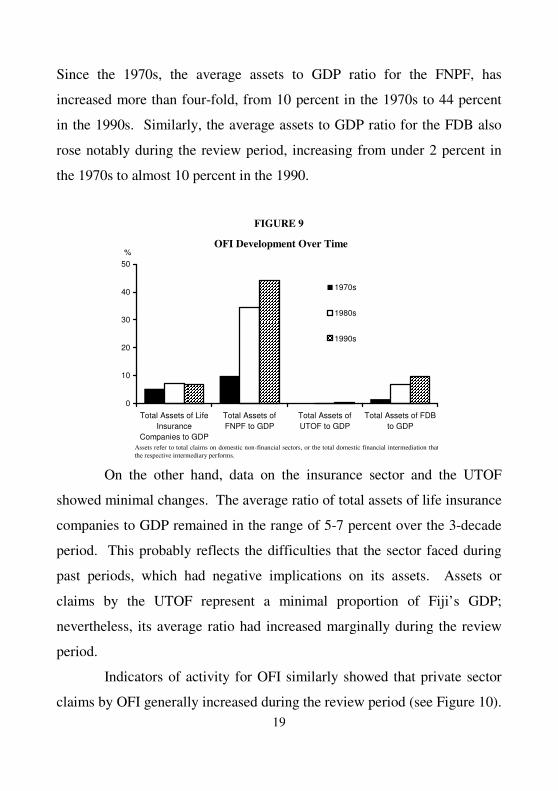
Measures for size of OFI relative to GDP show that generally, there
have been increases in the sizes of selected OFI in Fiji, over the 3-decade
review period (see Figure 9). The average assets to GDP ratios for the
FNPF and the FDB clearly rose during the review period, which is a
positive indication of the expansion that these institutions have undergone.
19
Since the 1970s, the average assets to GDP ratio for the FNPF, has
increased more than four-fold, from 10 percent in the 1970s to 44 percent
in the 1990s. Similarly, the average assets to GDP ratio for the FDB also
rose notably during the review period, increasing from under 2 percent in
the 1970s to almost 10 percent in the 1990.
FIGURE 9
OFI Development Over Time
0
10
20
30
40
50
Total Assets of LifeInsurance
Companies to GDP
Total Assets ofFNPF to GDP
Total Assets ofUTOF to GDP
Total Assets of FDBto GDP
%
1970s
1980s
1990s
On the other hand, data on the insurance sector and the UTOF
showed minimal changes. The average ratio of total assets of life insurance
companies to GDP remained in the range of 5-7 percent over the 3-decade
period. This probably reflects the difficulties that the sector faced during
past periods, which had negative implications on its assets. Assets or
claims by the UTOF represent a minimal proportion of Fiji’s GDP;
nevertheless, its average ratio had increased marginally during the review
period.
Indicators of activity for OFI similarly showed that private sector
claims by OFI generally increased during the review period (see Figure 10).
Assets refer to total claims on domestic non-financial sectors, or the total domestic financial intermediation that the respective intermediary performs.

20
In particular, the average ratio of private credit to GDP for the insurance
sector rose only slightly from around 1 ½ percent in the 1970s up to slightly
over 2 percent in the 1990s. On the other hand, the FNPF, while recording
an increase in its private credit to GDP average ratio from the 1970s to
1980s, recorded an unexpected decline in the ratio in the 1990s.
For the UTOF, there was a marginal increase in its private credit to
GDP average ratio during 1980s to 1990s. Data for the earlier decade was
not available. The FDB recorded a consistent growth in its private credit to
GDP average ratio throughout the 3-decade time period, a reflection of the
importance of FDB as a source of lending to the private sector. From the
1970s to the 1980s, the average ratio for the FDB increased more than 3-
fold before rising further in the 1990s.
FIGURE 10
OFI Development Over Time
0
2
4
6
8
10
Private Credit byInsurance
Companies to GDP
Private Credit byFNPF to GDP
Private Credit byUTOF to GDP
Private Credit byFDB to GDP
%
1970s 1980s 1990s
The additional size measures for the insurance sector showed slight
declines in life insurance penetration equal to the average ratio of life
Private credit captures the financial intermediation with the private non-financial sectors; n.a: not available

21
insurance premiums to GDP (see Figure 11). This ratio fell constantly from
the 1970s to the 1990s. On the other hand, the life insurance density,
measured by the average ratio of life insurance premiums to total
population, grew consistently during the review period.
FIGURE 11
Life Insurance Development Over Time
0
10
20
30
40
50
60
70
Life Insurance Penetration (premiumsvolume to GDP)
Life Insurance Density (premium volumein constant F$ per capita) in 100s of F$
%
1970s 1980s 1990s
The two measures revealed that while the expenditure per capita on
life insurance provision grew over the past three decades, the importance of
the life insurance sector relative to the economy however, has fallen. These
are reflected in growth in insurance premiums which outgrew population
growth but fell below the rate of economic growth.
3.4 Stock and Bond Market Development
This section discusses measures of the size, activity and efficiency
of primary stock and bond markets. Due to data limitations, analysis of
stock market indicators are limited to the period from 1997-2001 while the

22
analysis of the bond market covers the public sector only.
3.41 Indicators of Stock Market Size, Activity and Efficiency12
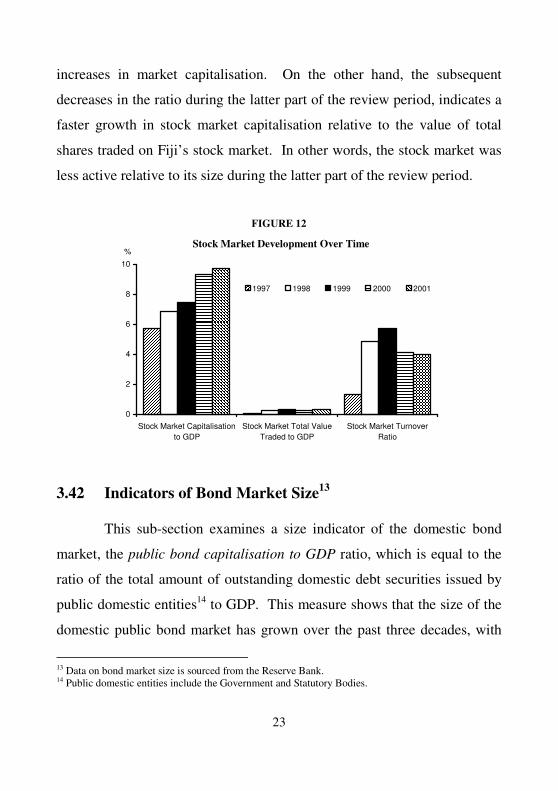
As a measure of the size of the stock market, the ratio of stock
market capitalisation to GDP, which is equal to the total value of listed
shares divided by GDP, grew constantly during the review period,
increasing from around 6 percent in 1997 up to around 10 percent in 2001
(see Figure 12). This increase reflects the increasing size of the stock
market in Fiji.
Measuring the activity or liquidity of the stock market, the stock
market total value traded to GDP ratio, which is equal to the total stock
market shares traded divided by GDP, shows minimal or very little activity
in Fiji’s stock market in respect of the economy. Graph 12 also showed
that during the 1997-2001 period, the ratio of stock market total value
traded to GDP, averaged 0.3 percent of GDP.
As a measure of the efficiency of the stock market, the stock
market turnover ratio, which is equal to the ratio of the value of total shares
traded to market capitalisation, showed mixed trends. From 1997 to 1999,
the stock market ratio rose substantially from just over 1 percent to almost
6 percent respectively. However, since 1999, this ratio has fallen and was
around 4 percent in 2001. The increases in the ratio during the earlier part
of the period show higher growth in stock market activity relative to the
12 Data on stock market size, activity & efficiency are sourced from the Reserve Bank of Fiji and the
Capital Market Development Authority.
23
increases in market capitalisation. On the other hand, the subsequent
decreases in the ratio during the latter part of the review period, indicates a
faster growth in stock market capitalisation relative to the value of total
shares traded on Fiji’s stock market. In other words, the stock market was
less active relative to its size during the latter part of the review period.
FIGURE 12
Stock Market Development Over Time
0
2
4
6
8
10
Stock Market Capitalisationto GDP
Stock Market Total ValueTraded to GDP
Stock Market TurnoverRatio
%
1997 1998 1999 2000 2001
3.42 Indicators of Bond Market Size13
This sub-section examines a size indicator of the domestic bond
market, the public bond capitalisation to GDP ratio, which is equal to the
ratio of the total amount of outstanding domestic debt securities issued by
public domestic entities14 to GDP. This measure shows that the size of the
domestic public bond market has grown over the past three decades, with
13 Data on bond market size is sourced from the Reserve Bank. 14 Public domestic entities include the Government and Statutory Bodies.

24
the public debt ratio increasing from around 22 percent in the 1970s to
around 34 percent in the 1980s and further to 57 percent in the 1990s (see
Figure 13).
FIGURE 13
Bond Market Development Over Time
0
10
20
30
40
50
60
Public bond market capitalization to GDP
%
1970s
1980s
1990s
4.0 Empirical Investigation
This section looks at the causal relationship between financial
development and economic growth in Fiji, using data from 1970-2000. At
the outset, the trend analysis done in section 3.0 above, as depicted by the
charts, suggest the growing importance of the financial sector to Fiji’s
economy over the years.
4.1 Measurement and Data Sources
Studies on financial development and economic growth have
utilised various measures of financial development and economic growth.
In this paper, all the indicators used have been used in prior studies.

25
Financial development is measured using financial institution indicators
including (1) the ratio of financial assets to GDP (FAY), (2) ratio of liquid
liabilities to GDP (LLY) and (3) the ratio of private sector credit to GDP
(PCY).
The economic growth measures used are (1) level of real GDP
(RY) and (2) the level of real GDP per capita (CRY) and (3) the ratio of
investment to GDP (IRY).
All the data used were sourced from the IFS, the Reserve Bank of
Fiji and the Bureau of Statistics.
4.2 Econometric Methodology and Issues
This paper uses a Vector Auto Regression (VAR) to identify the
relationship between financial development and growth. First, the
Augmented Dickey Fuller (ADF) tests and Phillips-Perron (PP) tests are
used to check whether each data series is integrated and has a unit root.
The results of the integration tests are then pursued by co-integration tests
based on a bi-variate VAR (bVAR) approach, to check whether a stable
long run relationship between financial development and growth exists.
Based on the results, Granger causality tests are conducted to determine
whether the current and lagged values of one variable affect another.
4.3 Empirical Results
Unit Root tests
The ADF tests and PP tests were undertaken under the assumption
of the existence of a unit root (H0) and a stationary variable in the

26
alternative hypothesis (Ha). If the calculated statistics is greater than
McKinnon’s critical value, then the H0 or that the variable is not stationary,
is not rejected. Results of the ADF and PP tests in Table (1) below show
that all the series cannot reject the H0 of I(1), that is, that all the variables
are non-stationary. However, first differences of the variables turn out to
be stationary. Based on the integration test results, co-integration tests are
undertaken to verify whether there exists a long-run relationship between
financial development variables and economic growth variables.
Table 1: The order of integration of variables (1970-2000)
Test with a constant Test with a constant and a trend Variables
(ADF) (PP) (ADF) (PP)
RY -0.0922 -0.3852 -1.9327 -2.9355
CRY -0.9324 -1.3056 -1.9145 -2.6026
IRY -1.4935 -1.6097 -2.2486 -1.8646
FAY -0.9576 -1.2013 -1.5796 -1.6782
LLY -1.2630 -1.1992 -3.1388 -2.2777
CRY -1.2857 -1.6228 -1.6810 -1.4762
Critical Value at 5% -2.9665 -2.9627 -3.5731 -3.5670
The variables used here are as they are defined in the text of the paper. The null hypothesis (H0) tested is that the variable is non-stationary (contains a unit root) against the alternative hypothesis (Ha) that the variable is stationary (does not contain a unit root).
Co-integration tests
The tests for co-integration are based on a VAR framework, as
initiated by Johansen (1988). In this paper, we use a bVAR (two-variable
VAR case), where the co-integration test is for the null hypothesis H0 that

27
there is no co-integration between the variables, against the alternative
hypothesis Ha that there is only one co-integrating vector. Results of the
co-integration tests using the Johansen approach are summarised in Table
(2) below. Results show that the H0 of no-co-integration cannot be
rejected, implying no long-run relationship between the different measures
of financial development and economic growth.
Table 2: Johansen co-integration tests (1970-2000)
Trace Statistic )1( ir lnTJ λ−Σ−= Variables Hypothesis (H0) Trace Critical Value at 5%
r = 0 4.337910 15.41 RY and FAY
r <= 1 0.359777 3.76 r = 0 14.31973 15.41 RY and LLY
r <= 1 0.147579 3.76 r = 0 4.596998 14.51 RY and PCY
r <= 1 0.774007 3.76 r = 0 4.897648 15.41 CRY and FAY
r <= 1 0.924287 3.76 r = 0 12.26673 15.41 CRY and LLY
r <= 1 0.038819 3.76 r = 0 4.983819 15.41 CRY and PCY
r <= 1 1.379840 3.76
r = 0 8.967655 15.41 IRY and FAY
r <= 1 1.688599 3.76 r = 0 9.678004 15.41 IRY and LLY
r <= 1 1.012798 3.76 r = 0 13.70970 15.41 IRY and PCY
r <= 1 2.784416 3.76

28
Granger Causality tests15
Since there are no co-integrating relations found, we carry out
causality tests using the Granger approach with first-differenced VARs for
each of the two pairs of the variables. The Granger causality approach
measures the precedence and information provided by a variable (X) in
explaining the current value of another variable (Y). Furthermore, it says
that Y is said to be granger-caused by X if X helps in predicting the value of
Y. In other words, the lagged values of X are statistically significant. The
null hypothesis H0 tested is that X does not granger-cause Y and Y does not
granger-cause X. Outcomes of the granger-causality tests are summarised
in Table 3 below.
15 See Appendix 2 for a summary of the Granger causality approach.

29
Table 3: Granger causality tests within a bVAR framework(a) (1970-2000)
Null Hypothesis (b)
FD �/ Growth Growth �/ FD Variables
F-statistic ( ρ -value) F-statistic ( ρ -value)
FAY and RY 1.47389 (0.24987) 3.09302 (0.06462)*
FAY and CRY 0.90978 (0.41662) 1.33055 (0.28392)
FAY and IRY 2.45188 (0.10833) 4.54822 (0.02166)**
LLY and RY 0.36372 (0.69901) 4.65111 (0.02012)**
LLY and CRY 0.07401 (0.92888) 2.55750 (0.09933)*
LLY and IRY 2.40117 (0.11296) 1.35969 (0.27661)
PCY and RY 0.62124 (0.54605) 7.43979 (0.00322)**
PCY and CRY 0.46910 (0.63142) 4.48865 (0.02260)**
PCY and IRY 2.56619 (0.09863)* 2.28026 (0.12490)
(a) The order of the lag is determined using the Schwartz criterion on the unrestricted bVAR
(b) All estimates are achieved using first differences of integrated variables. An **(*) denotes significance at the 5(10) percent level.
Generally, results show that:
- Each of the 3 measures of economic growth has a short-run
linkage with at least one of the 3 measures of financial
development.
- Causality runs in a single direction only.
- The direction of causality is mainly demand-following, that is,
from economic growth to financial development.
More specifically, results show that:
- Causality in both directions is rejected for Financial assets

30
(FAY) & real GDP per capita (CRY), and for Liquid Liabilities
(LLY) & Investment (IRY).
- The only instance where financial development leads economic
growth is where Credit to the Private Sector (PCY) leads
Investment (IRY). This direction of causality is statistically
significant at the 10 percent level.
- In the cases where economic growth leads financial
development, results show that (1) Real GDP (RY) and
Investment (IRY) both have a leading relationship with
Financial assets (FAY), with the latter displaying a
comparatively stronger linkage, (2) Real GDP (RY) and Real
GDP per capita (CRY) both have a leading relationship with
Liquid Liabilities (LLY), with the former showing a relatively
stronger relationship, and (3) Real GDP (RY) and Real GDP per
capita (CRY) also have a leading relationship with Credit to the
Private Sector (PCY), with the direction of causality statistically
significant at the 5 percent level.
5.0 Concluding Remarks
Various theoretical and empirical studies attest to the important
linkage between financial system progress and economic development.
This paper provides a useful analysis on the evolvement of
financial institutions and markets in Fiji in terms of their relative sizes,
activity and efficiency, and their importance to the economy. Trends in the
indicators reveal that while commercial banks have continued to develop
31
and grow in importance to Fiji’s economy, other financial institutions have
also gathered pace in terms of increases in their relative size and activity.
Overall, Fiji’s financial sector has grown in size and activity over the past
three decades and become more important to the economy.
The paper also examined the causal link between financial
development and economic growth, using selected financial variables that
have been analysed earlier in the paper and available economic growth
indicators. Empirical results reveal a short-run relationship, predominantly
running from economic growth to financial development. However,
evidence of opposite causality was found in only one case where private
sector credit (financial development indicator) caused investment
(economic growth indicator).
Findings in the paper support the view that countries, which have a
less sophisticated financial system tend to experience more of a demand-
following relationship where economic growth induces financial
development. Although Fiji’s financial system has become more
liberalised since the early 1980s, there exists a lack of depth and
sophistication in the market. Thus, advancement of the financial system
should see a diversification of financial instruments and in turn more funds
available to finance economic development in Fiji.
While the paper has provided some useful insights into
developments in Fiji’s financial sector and more how these relate to growth
in the economy, it should be noted that the results have been obtained using
a specific set of financial development and economic growth variables.
Other variables could possibly yield different results.
For the future, the availability of data could allow the extension of

32
the empirical investigation to include stock and bond market indicators.
Moreover, it will also be useful to conduct the same during two time-
periods; a pre-reform and post-reform period.

33
Appendix 1 Classification of Financial Intermediaries
Financial Intermediary Category
Name of Institution
Central Bank Reserve Bank of Fiji
Deposit Money Banks Commercial Banks
Other Financial Institutions Fiji Development Bank Insurance Companies Fiji National Provident Fund Unit Trust of Fiji
Appendix 2 Granger Causality Tests16
In the case of two variables X and Y, the Granger causality
approach is different from the common use of the term since it measures
precedence and information provided by X in explaining current values of
Y. According to this view, Y is said to be granger caused by X if X helps in
the prediction of Y or equivalently lagged values of X are statistically
significant.
The time series representation of a bivariate VAR for two variables
X and Y has the following form:
16 Refer to Boulila G and TRABELSI M (2002)
Yt C1 a1 a1Yt-1 ak ak
Yt-k �1t
Xt C2 a1 a1Xt-1 ak ak
Xt-k �2t
= + +……..+ +
21
11 12
22
11
21
12
22

34
Where t is time subscript, aij are the coffefficients of the matrices
associated to the VAR, the superscripts denote the order of that matrice,
� t = (�1t, �2t)’ is a vector of uncorrelated disturbances and finally c1 and c2
are constants.
With a system of two equations, equation (2) becomes:
� �= =
−− +Χ+Υ+=Υk
i
k
j
ic1 1
1i�111 1 ιιι εαα 12
� �= =
−− +Χ+Υ+=Χk
i
k
i
iiC1 1
222212 ιιι εααι
Testing for Granger causality between X and Y consists to check
the significance of a12 and a22 coefficients. In other words, X does not
Granger-cause Y if the vector (Xt-1, Xt-2…, Xt-k) has no power in
forecasting X. Each equation represented by (4) is estimated separately in
testing for Granger causality 20 and the null hypothesis tested is X does not
Granger-cause Y and Y does not Granger-cause X.

35
References
Aretis, P., and Demetriades, P. (1997). Financial Development and
Economic Growth: Assessing the Evidence, The Economic Journal,
107 (May), 783-799.
Atje, R and B. Jovanovic (1993). Stock Markets and Development,
European Economic Review, 37, 632-640.
Bagehot, Walter (1873), Lombard Street. Homewood, IL: Richard D.
Irwin, 1962 edition.
Beck, T., A. Demirguc-Kunt, and Ross Levine (1999). A New Database on
the Structure and Development of the Financial Sector, World Bank
Economic Review, September, 14(3), 597-605.
Beck, T., Levine, R., and Loyza, N. (2000). Finance and Sources of
Growth, Journal of Financial Economics, October-November, 58(1-
2), 261-300.
Becsi, Z., and Wang, P. (1997). Financial Development and Growth,
Federal Reserve Bank of Atlanta, Economic Review Fourth Quarter
1997.
Becsi, Z., Wang, P., and Wynne, M.A. (1998). Endogenous Market
Structure and Financial Development, Federal Reserve Bank of
Atlanta, Working Paper 98-15.
Ben M’Rad, F. W. (2000). Financial Development and Economic Growth:

36
Time-Series Evidence from South Mediterranean Countries,
Universite Paris IX Dauphine, Working Paper May, pp. 1-11.
Bencivenga, V. and B. Smith (1991). Financial Intermediation and
Endogenous Growth, Review of Economic Studies, 58: 195-209.
Bencivenga, V. R., B. D. Smith, and R. M. Starr (1995). Transactions
Costs, Technological Choice, and Endogenous Growth, Journal of
Economic Theory, 67, 153-77.
Binswanger, M. (1999). Co-Evolution Between the Real and Financial
Sectors: The Optimistic “New Growth Theory View” versus the
Pessimistic “Keynesian View”, Reihe A: Discussion Paper 99-01.
Blackburn, K. and Hung, T. Y. (1996). A theory of Growth, Financial
Development and Trade, Economica (February).
Claessens, S, Demirguc-Kunt and Huizinga, H (1997). The
Internationalisation of Financial Services: Issues and Lessons for
Developing Countries, Boston MA: Kluwer Academic Press.
September 2000.
De Gregorio, J. (1998). Financial Integration, Financial Development and
Economic Growth, Center for Applied Economics Department of
Industrial Engineering, University de Chile WP.
Demetriades, P. O. and Luintel, K. B. (1996). Financial Development,
Economic Growth and Banking Sector Controls: Evidence from India,
37
The Economic Journal, 106 (March), 359-374.
Demetriades, P. O., and Hussein, K. A. (1996). Does Financial
Development cause Economic Growth?, Journal of Development
Economics Vol. 51, 387-411.
Demirguc-Kunt and Levine (1996b). “The Financial System and Public
Enterprise Reform: Concepts and Cases, “Financial Development and
Economic Growth: Theory and Experiences from Developing
Countries Routledge, edited by N. Hermes and R. Lensink, Chapter
11, 247-272.
Diaz-Alejandro C. (1985). Good-Bye Financial Repression, Hello
Financial Crash, Journal of Development Economics, 19:1-24.
Gertler, M. (1988). Financial Structure and Aggregate Economic Activity:
An Overview, National Bureau of Economic Research, Working Paper
No. 2559.
Goldsmith, R. (1969). Financial Structure and Development New Haven:
Yale University Press.
Gupta, K. L. (1984). Finance and Economic Growth in Developing
Countries, Croom Helm, London.
Greenwood, J and B. Jovanovic (1990). Financial Development , Growth,
and the Distribution of Income, Journal of political Economy, 98:
1076-1107.
38
Gregorio, J. D. (1996). Borrowing Constraints, Human Capital
Accumulation, and Growth, Journal of Monetary Economics37, 49-71.
Gross, D. M. (2001). Financial Intermediation: A contributing Factor to
Economic Growth and Employment, International Labour Office,
Working Paper December 2, pp. 1-29.
Hicks, J. (1969). A Theory of Economic History. Oxford: Clarendon
Press.
Jappelli, T. and M. Pagano. (1994). Savings, Growth and Liquidity
Constraints, Quarterly Journal of Economics 109, 83-109.
Jung, Woo S. (1986). Financial Development and Economic Growth:
International Evidence, Economic Development and Cultural Change.
34/2 : 333-346.
Kar, M., and Pentecost E. J. (2000). Financial Development and Growth in
Turkey: Further Evidence on the Causality Issue, Loughborough
University, Economic Research Papper No. 00/27, pp. 1-8.
Khan, A. (2000). The Finance and Growth Nexus, Business Review
January/February.
King, R. G. and Levine, R. (1993). Finance, Entrepreneurship and Growth:
Theory and Evidence, Journal of Monetary Economics, 32, 513-542.
King, R. G. and Levine, R. (1993). Finance and Growth: Schumpeter
39
Might Be Right, The Quarterly Journal of Economics, August.
Kul B. Luintel and Moshahid Khan (1999). A Quantitative Reassessment
of the Finance-Growth Nexus: Evidence from a Multivariate VAR,
Journal of Development Economics.
Lensink, R. (2000). Uncertainty, Financial Development and Economic
Growth: An empirical Analysis, University of Groningen, Research
Paper
Levine, R. (1991). Stock Markets, Growth, and Tax Policy, The Journal of
Finance, 46, 1445-65.
Levine, R. (1997). Financial Development and Economic Growth: Views
and Agenda, Journal of Economic Literature, Vol. XXXV (June), pp.
688-726.
Levine, R. (1997). Law, Finance, and Economic Growth, University of
Virginia, Research Paper July 1997.
Levine, R., Loayza, N., and Beck, T. (2000). Financial Intermediation and
Growth: Causality and Causes, Journal of Monetary Economics 46,
31-77.
Levine, R and Min, H (1998). Opening to Foreign Banks: Issues of
Stability, Efficiency, and Growth, in Proceedings of the Bank of Korea
Conference on the Implications of Globalisation of World Financial
Markets.
40
Levine, R and Zervos, S (1996). Stock Market Development and Long-run
Growth. World Bank Economic Review, 10(2), May, 323-339.
Ma, C. H. and Smith, B. D. (1996). Credit Market Imperfections and
Economic Development: Theory and Evidence, Journal of
Development Economics, Vol. 48, 351-387.
Murinde, V. et F. Eng (1994). Financial Development and Economic
Growth in Singapore: Demand Following or Supply-Leading?,
Applied Financial Economics, 4, 391-404.
Obstfeld, M. (1994). Risk, Diversification, and Growth, The American
Economic Review, Vol. 84 No. 5, (December), 1310-1329.
Odedokun, M. O. (1996). Alternative Econometric Approaches for
Analysing the Role of the Financial Sector in Economic Growth:
Time-Series Evidence from LDCs, Journal of Development
Economics, Vol. 50, 119-146.
Rajan, R. G. and Zingales, L. (1998). Financial Dependence and Growth,
The American Economic Review, Vol. 88 No. 3 (June).
Rousseau, P. and Wachtel, P. ( 1998). Financial Intermediation and
Economic Performance: Historical Evidence from Five Industrialised
Countries, Journal of Money, Credit, and Banking, Vol. 30, No. 4
(November).

41
Saint-Paul, G. (1992). Technological Choice, Financial Markets and
Economic Development, European Economic Review, 36, 763-81.
Schumpeter, Joseph A. (1912). The Theory of Economic Development.
Leipzig: Ducker and Humblot. Translated by Redvers Opie.
Cambridge, MA: Harvard University Press, 1934.
Shaw, E. (1973), Financial Deepening in Economic Development, New
York: Oxford University Press.
Tsuru, K (2000). Finance and Growth: Some Theoretical Considerations,
and A Review of the Empirical Literature, Economics Department
Working Papers, OECD, January, No. 228.
World Bank (1989). World Development Report (1989), New York:
Oxford University Press for the World Bank.