Embed Size (px)
Citation preview
STRUCTU
RES
17
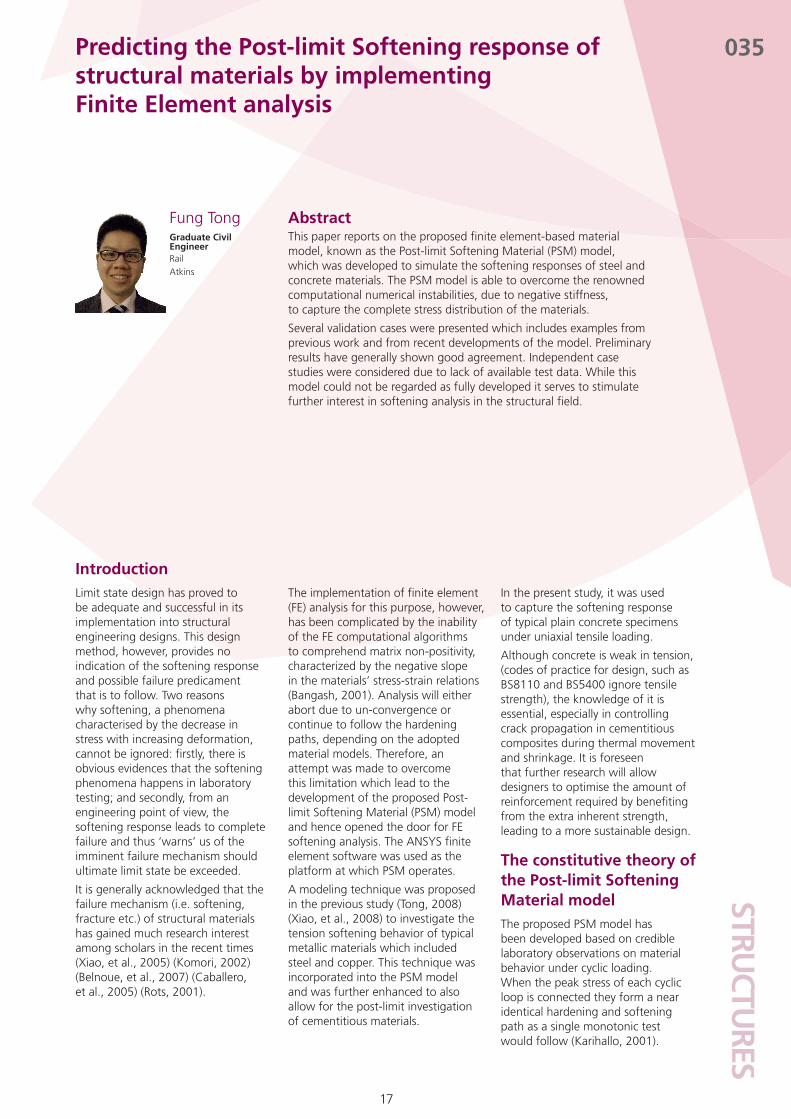
Abstract
RailAtkins
035
Graduate Civil Engineer
Fung Tong
IntroductionLimit state design has proved to be adequate and successful in its implementation into structural engineering designs. This design method, however, provides no indication of the softening response and possible failure predicament that is to follow. Two reasons why softening, a phenomena characterised by the decrease in stress with increasing deformation, cannot be ignored: firstly, there is obvious evidences that the softening phenomena happens in laboratory testing; and secondly, from an engineering point of view, the softening response leads to complete failure and thus ‘warns’ us of the imminent failure mechanism should ultimate limit state be exceeded.
It is generally acknowledged that the failure mechanism (i.e. softening, fracture etc.) of structural materials has gained much research interest among scholars in the recent times (Xiao, et al., 2005) (Komori, 2002) (Belnoue, et al., 2007) (Caballero, et al., 2005) (Rots, 2001).
The implementation of finite element (FE) analysis for this purpose, however, has been complicated by the inability of the FE computational algorithms to comprehend matrix non-positivity, characterized by the negative slope in the materials’ stress-strain relations (Bangash, 2001). Analysis will either abort due to un-convergence or continue to follow the hardening paths, depending on the adopted material models. Therefore, an attempt was made to overcome this limitation which lead to the development of the proposed Post-limit Softening Material (PSM) model and hence opened the door for FE softening analysis. The ANSYS finite element software was used as the platform at which PSM operates.
A modeling technique was proposed in the previous study (Tong, 2008) (Xiao, et al., 2008) to investigate the tension softening behavior of typical metallic materials which included steel and copper. This technique was incorporated into the PSM model and was further enhanced to also allow for the post-limit investigation of cementitious materials.
In the present study, it was used to capture the softening response of typical plain concrete specimens under uniaxial tensile loading.
Although concrete is weak in tension, (codes of practice for design, such as BS8110 and BS5400 ignore tensile strength), the knowledge of it is essential, especially in controlling crack propagation in cementitious composites during thermal movement and shrinkage. It is foreseen that further research will allow designers to optimise the amount of reinforcement required by benefiting from the extra inherent strength, leading to a more sustainable design.
The constitutive theory of the Post-limit Softening Material modelThe proposed PSM model has been developed based on credible laboratory observations on material behavior under cyclic loading. When the peak stress of each cyclic loop is connected they form a near identical hardening and softening path as a single monotonic test would follow (Karihallo, 2001).
Predicting the Post-limit Softening response of structural materials by implementing Finite Element analysis
This paper reports on the proposed finite element-based material model, known as the Post-limit Softening Material (PSM) model, which was developed to simulate the softening responses of steel and concrete materials. The PSM model is able to overcome the renowned computational numerical instabilities, due to negative stiffness, to capture the complete stress distribution of the materials.
Several validation cases were presented which includes examples from previous work and from recent developments of the model. Preliminary results have generally shown good agreement. Independent case studies were considered due to lack of available test data. While this model could not be regarded as fully developed it serves to stimulate further interest in softening analysis in the structural field.
STRU
CTU
RES
18
035
This principle of increasing (and decreasing) stresses with increasing load cycles was adopted in this model, along with a series of material property update procedures to simulate the softening behavior.
The stress - strain relationships of metallic and concrete materials are characterized respectively by a 7-order polynomial function and the double-exponential (double-e) model (Barr, et al., 2003) as follows;
(Equation 1)
(Equation 2)
where, σ - stress (N/mm2); ε - strain (dimensionless); Ci - polynomial constants (dimensionless) and 0 < i < 7; cl, c2 and c3 - double-e constants (dimensionless). See (Tong, 2008) and (Barr, et al., 2003) for the determination of parameters.
When the ultimate tensile strength is attained, the material softens and hence the capacity to withstand load will decrease. Therefore an optimization procedure, employing the bisection method was developed (Tong, 2008) to determine the corresponding reduced load. This procedure utilizes the modified Voce hardening function (Voce, 1955) to update the material properties at each subsequent softening point. This function is given by;
(Equation 3)
where; k ο - elastic limit (N/mm2); R ο - modified constant (N/mm2), (originally the threshold stress in Voce’s relation); ε pl - equivalent plastic strain (dimensionless); R∞ - asymptotic stress (N/mm2); and b - Voce’s parameter (dimensionless).
By employing such approach of updating the material property sets at each subsequent step, the analysis solution could avoid un-convergence due to negative stiffness.
Predicting the Post-limit Softening response of structural materials by implementing
Finite Element analysis
σ = ∑Ciε i
σ = c 1(e -c2ε-e -c3e)
σ = k ο+R οεpl+R∞(1-e -bεpl)
Specimens Circular solid steel; G1X1A Dual phase steel strip; DP800
Tensile Yield Stress, σy 125 MPa 500 MPa
Ultimate Strength, σu 250 MPa 780 MPa
Dimension 35 x ϕ5 mm 40 x 20 x 5 mm
References (Barret, 1999) (Xin, 2005)
Table 1. Specifi cation of steel G1X1A and DP800
Specimens Throated prismatic concrete; 2HB-1 Young concrete; Mix B
Compressive strength, fcu 31.41 MPa 15.77 MPa
Tensile Strength, fct 2.819 MPa 3.21 MPa
Dimensions 100 x 100 x 100 x 210/70 x 70 mm 350 x 100 x 20 mm
References (Guo, et al., 1987) (Jin, et al., 2000)
Table 2 - Specifi cation of prismatic concrete 2HB-1 and young concrete Mix B
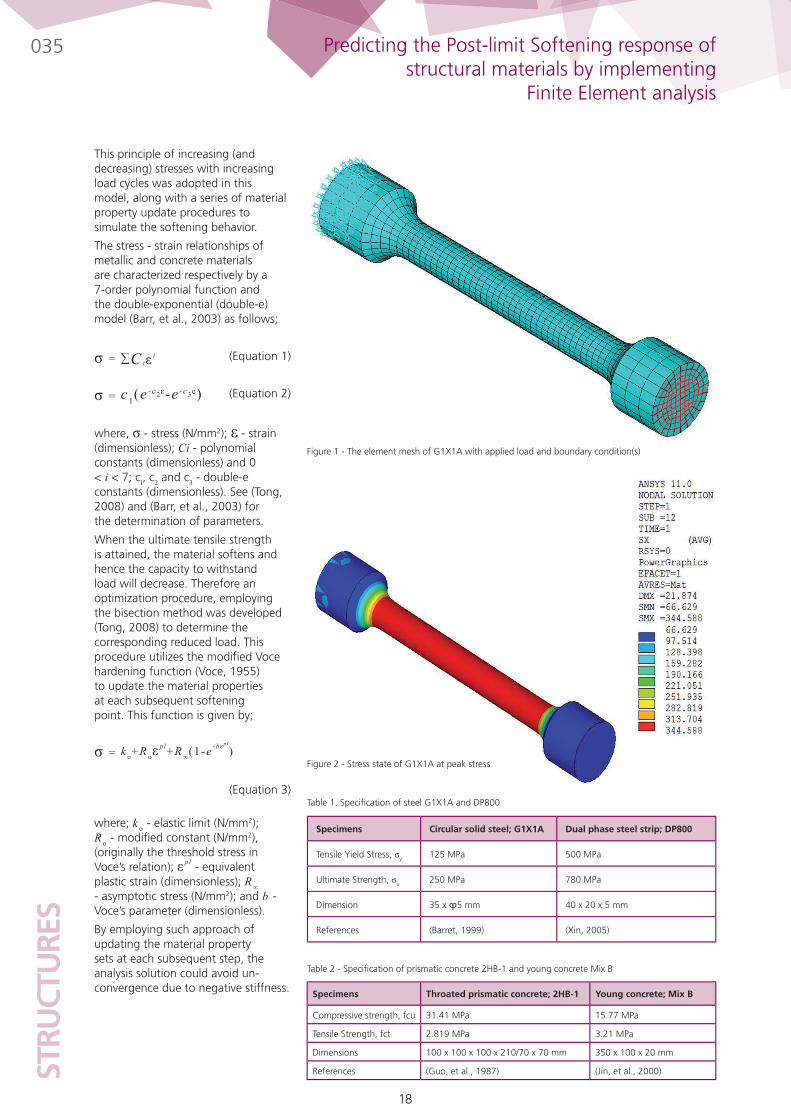
Figure 1 - The element mesh of G1X1A with applied load and boundary condition(s)
Figure 2 - Stress state of G1X1A at peak stress
STRUCTU
RES
19
035
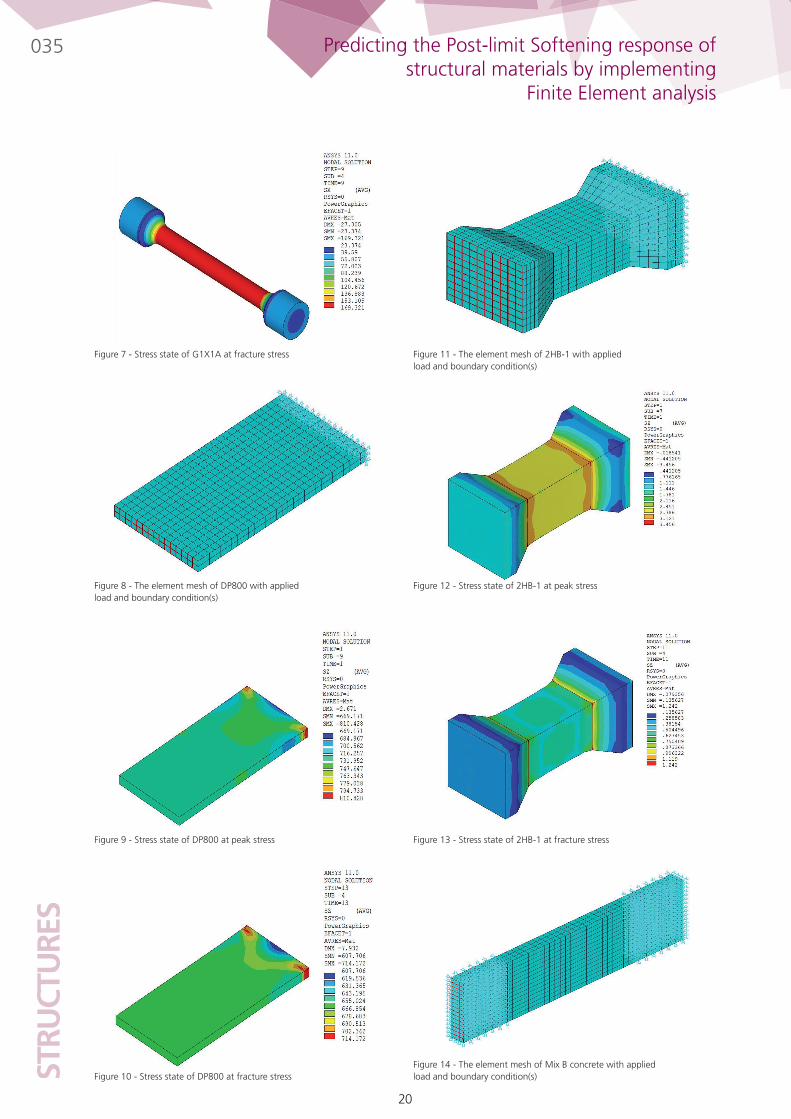
The averaged nodal stress states at peak and fracture were also captured and shown in Figures 2,3,9 and 10. For the reader’s reference, SMN and SMX denote the minimum and maximum stress respectively. DMX is the maximum displacement between the ends of the FE model and does not correspond to the displacement of the measuring gauges. Same applies to Figures 12, 13, 15 and 16.
Table 2 tabulates the specifications of the FE models for the two concrete specimens.
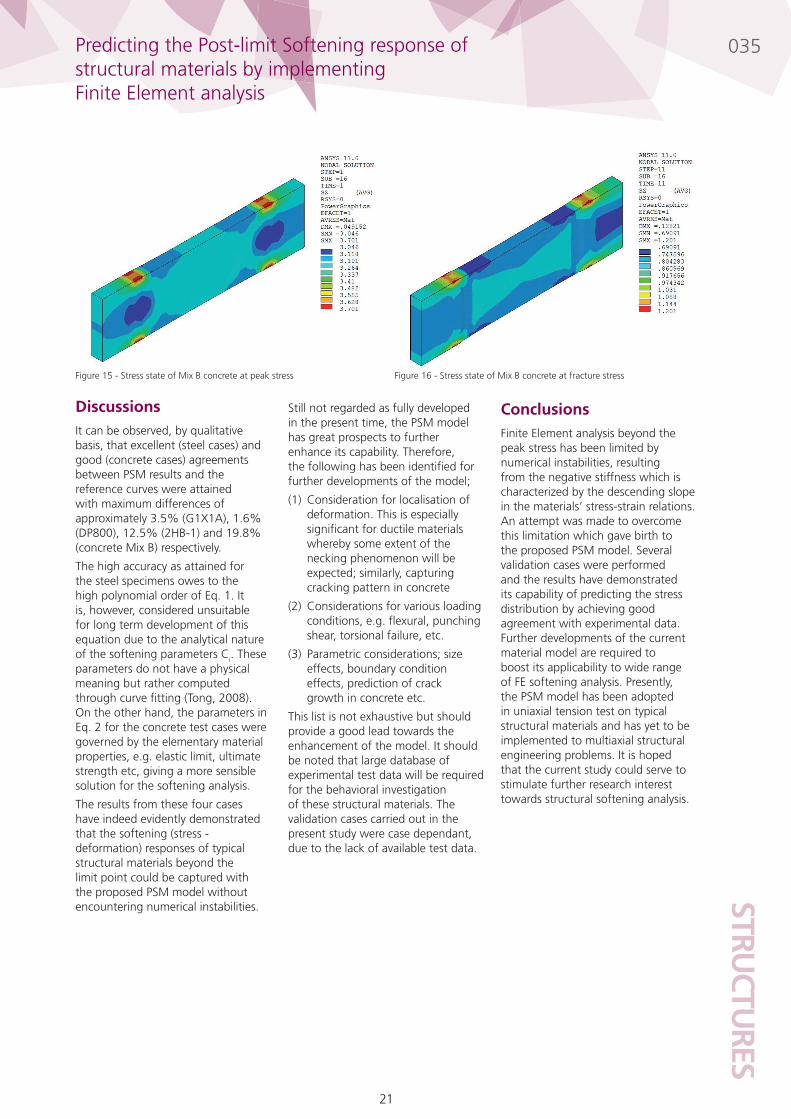
The FE models and the applied boundary conditions for the concrete specimens are shown in Figures 11 and 14. The PSM’s results for the throated prismatic 2HB-1 and young concrete Mix B specimens, and the references curves are shown in Figures 5 and 6. The averaged nodal stress states at peak and fracture were captured, as shown in Figures 12, 13, 15 and 16.
Validation of experimental test casesSeveral validation cases were presented to determine the efficiency of the PSM model and to provide confidence of its capabilities. Two examples on steel, extracted from previous work (Tong, 2008) (Xiao, et al., 2008), and further two examples on concrete from recent work were presented. The deformations (elongations) were measured between nodes corresponding to the location where the gauges were placed during the laboratory tests.
Table 1 tabulates the specifications of the FE models for the steel specimens. The sources from which the reference curves were obtained are also stated.
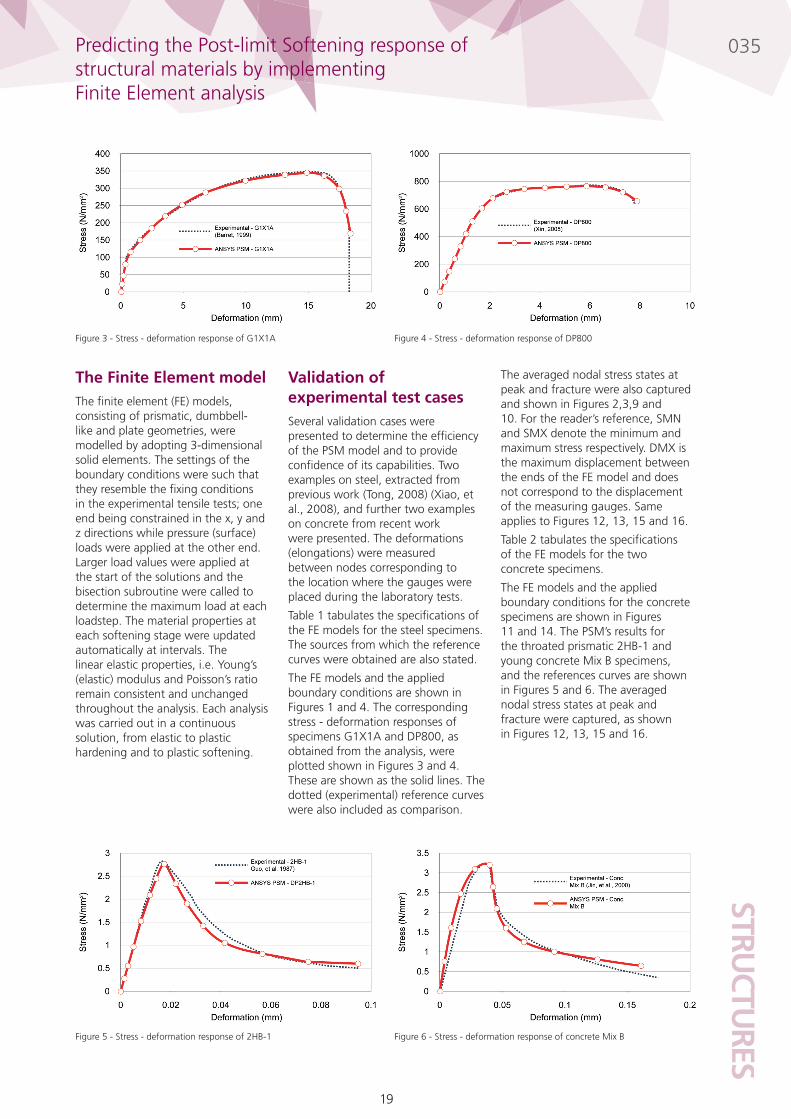
The FE models and the applied boundary conditions are shown in Figures 1 and 4. The corresponding stress - deformation responses of specimens G1X1A and DP800, as obtained from the analysis, were plotted shown in Figures 3 and 4. These are shown as the solid lines. The dotted (experimental) reference curves were also included as comparison.
The Finite Element model The finite element (FE) models, consisting of prismatic, dumbbell-like and plate geometries, were modelled by adopting 3-dimensional solid elements. The settings of the boundary conditions were such that they resemble the fixing conditions in the experimental tensile tests; one end being constrained in the x, y and z directions while pressure (surface) loads were applied at the other end. Larger load values were applied at the start of the solutions and the bisection subroutine were called to determine the maximum load at each loadstep. The material properties at each softening stage were updated automatically at intervals. The linear elastic properties, i.e. Young’s (elastic) modulus and Poisson’s ratio remain consistent and unchanged throughout the analysis. Each analysis was carried out in a continuous solution, from elastic to plastic hardening and to plastic softening.
Predicting the Post-limit Softening response of structural materials by implementing Finite Element analysis
Figure 3 - Stress - deformation response of G1X1A Figure 4 - Stress - deformation response of DP800
Figure 5 - Stress - deformation response of 2HB-1 Figure 6 - Stress - deformation response of concrete Mix B
STRU
CTU
RES
20
Predicting the Post-limit Softening response of structural materials by implementing
Finite Element analysis
Figure 7 - Stress state of G1X1A at fracture stress Figure 11 - The element mesh of 2HB-1 with applied load and boundary condition(s)
Figure 8 - The element mesh of DP800 with applied load and boundary condition(s)
Figure 12 - Stress state of 2HB-1 at peak stress
Figure 9 - Stress state of DP800 at peak stress Figure 13 - Stress state of 2HB-1 at fracture stress
Figure 10 - Stress state of DP800 at fracture stressFigure 14 - The element mesh of Mix B concrete with applied load and boundary condition(s)
035
STRUCTU
RES
21
Predicting the Post-limit Softening response of structural materials by implementing Finite Element analysis
DiscussionsIt can be observed, by qualitative basis, that excellent (steel cases) and good (concrete cases) agreements between PSM results and the reference curves were attained with maximum differences of approximately 3.5% (G1X1A), 1.6% (DP800), 12.5% (2HB-1) and 19.8% (concrete Mix B) respectively.
The high accuracy as attained for the steel specimens owes to the high polynomial order of Eq. 1. It is, however, considered unsuitable for long term development of this equation due to the analytical nature of the softening parameters Ci. These parameters do not have a physical meaning but rather computed through curve fitting (Tong, 2008). On the other hand, the parameters in Eq. 2 for the concrete test cases were governed by the elementary material properties, e.g. elastic limit, ultimate strength etc, giving a more sensible solution for the softening analysis.
The results from these four cases have indeed evidently demonstrated that the softening (stress - deformation) responses of typical structural materials beyond the limit point could be captured with the proposed PSM model without encountering numerical instabilities.
Still not regarded as fully developed in the present time, the PSM model has great prospects to further enhance its capability. Therefore, the following has been identified for further developments of the model;
Consideration for localisation of (1) deformation. This is especially significant for ductile materials whereby some extent of the necking phenomenon will be expected; similarly, capturing cracking pattern in concrete
Considerations for various loading (2) conditions, e.g. flexural, punching shear, torsional failure, etc.
Parametric considerations; size (3) effects, boundary condition effects, prediction of crack growth in concrete etc.
This list is not exhaustive but should provide a good lead towards the enhancement of the model. It should be noted that large database of experimental test data will be required for the behavioral investigation of these structural materials. The validation cases carried out in the present study were case dependant, due to the lack of available test data.
ConclusionsFinite Element analysis beyond the peak stress has been limited by numerical instabilities, resulting from the negative stiffness which is characterized by the descending slope in the materials’ stress-strain relations. An attempt was made to overcome this limitation which gave birth to the proposed PSM model. Several validation cases were performed and the results have demonstrated its capability of predicting the stress distribution by achieving good agreement with experimental data. Further developments of the current material model are required to boost its applicability to wide range of FE softening analysis. Presently, the PSM model has been adopted in uniaxial tension test on typical structural materials and has yet to be implemented to multiaxial structural engineering problems. It is hoped that the current study could serve to stimulate further research interest towards structural softening analysis.
Figure 15 - Stress state of Mix B concrete at peak stress Figure 16 - Stress state of Mix B concrete at fracture stress
035

STRU
CTU
RES
22
Predicting the Post-limit Softening response of structural materials by implementing
Finite Element analysis
References Bangash M. Y.H. Manual of Numerical Methods in Concrete. Book. Thomas Telford Ltd.: London, 2001.1.
Barr B. and Lee M. K. Modelling the strain-softening behaviour of plain concrete using a double-2. exponential model. Magazine of Concrete Research. Thomas Telford Ltd., 2003; 4:55; pp. 343-353.
Barret Z. Uniaxial Tensile Test - Material Testing. Technical Report, University of Wales Swansea, Swansea 1999.3.
Belnoue J. P., Nguyen G. D. and Korsunsky A M. A One-Dimensional Nonlocal Damage-Plasticity Model 4. for Ductile Materials. International Journal of Fracture. Springer Netherlands, 2007; 1:144; pp. 53-60.
Caballero A., Carol I. and Lopez C. M. 3D Meso-Structural Fracture Analysis of Concrete Under Uniaxial 5. Tension and Compression. Anales De Mecanica De La Fractura. Barcelona; 2005; 22; pp. 581-586.
Chun L., Knutzen P. and Shen C. Cyclic Load Testing of Steel Bars. 6. WWW -classes.usc.edu/engr/ce/334/PPT-5.ppt . - 2001.
Guo Zhen-hai and Zhang Xiu-qin Investigation of Complete Stress - Deformation Curves 7. for Concrete in Tension. ACI Materials Journal. Detroit : 1987; 4:84; pp. 278-285.
Jiao H. and Zhao X.L. Material Ductility of Very High Strength (VHS) Circular Steel 8. Tubes in Tension. Thin-Walled Structures; 2001; 11:39; pp. 887-906.
Jin X. and Li Z. Investigation on Mechanical Properties of Young Concrete. 9. Materials and Structures. RILEM, 2000; 10: 33; pp. 627-633.
Karihallo Bhushan L. Fracture Mechanics & Structural Concrete. Book; ed. Kong 10. F. K. and Evans R. H.. - London : Longman Group Ltd., 2001.
Komori K. Simulation of Tensile Test by Node Separation Method. Journal of Material 11. Processing Technology. Japan : Elsevier Science, 2002; 125-126; pp. 608-612.
Neville A. M. Properties of Concrete (4th edition). Book. New York : John Wiley & Sons, Inc., 1963..12.
Rots J. G. Sequentially Linear Continuum Model for Concrete Fracture. Fracture Mechanics of 13. Concrete Structures; ed. Borst R. de [et al.]; Lisse : A.A. Balkema, 2001; pp. 831-839.
Tong F. M. Nonlinear Finite Element Simulation of Non-local Tension Softening for High 14. Strength Steel Materials. M.Phil Thesis. Swansea University, Swansea; 2008.
Voce E. A Practical Strain-Hardening Function. Metallurgica. 1955; Col. 51; pp. 219-220.15.
Xiao R. Y. and Chin C. S. Nonlinear Finite Element Modelling of the Tension Softening of 16. Conventional and Fibrous Cementitious Composites. 13th UK National Conference of the Association of Computational Mechanics in Engineering. Sheffield; 2005; pp. 103-106.
Xiao R. Y., Tong F. M. and Chin C. S. Nonlinear Finite Element Simulation of Non-local Tension 17. Softening for High Strength Steel Material. Symposium of Tubular Structures. Shanghai; 2008.
Xin Y. Optimisation of the Microstructure and Mechanical Properties of DP800 18. Strip Steel. Thesis. University of Wales Swansea, Swansea; 2005.
035