Embed Size (px)
Citation preview
24th International Conference on Electricity Distribution Glasgow, 12-15 June 2017 Paper 0345
CIRED 2017 1/5
INFLUENCE OF HEAT SOURCE LOCATION ON AIR TEMPERATURES IN SEALED MV SWITCHGEAR
Elin FJELD Wilhelm RONDEEL Knut VAAGSAETHER Univ.Coll. of Southeast Norway USN – Norway USN - Norway [email protected] [email protected] [email protected] Elham ATTAR ABB – Norway [email protected]
ABSTRACT The IEC TR 60890 provides an empirically based method for calculating the air temperature inside LV switchgear. One might assume that the method could be applied for estimating the temperature rise of the air inside MV equipment too. However, the IEC method assumes the uniform distribution of the power input, which is not normally the case for MV equipment. This paper explores what happens when the IEC TR 60890 requirement of uniform heat input is violated. The presented experiments and simulations show that changing the height of the heat source significantly affects the cooling conditions of the enclosure and therefore the air temperature distribution. The temperature distribution factor should be adjusted to apply the IEC method if the heat source is located in the upper part of the enclosure. INTRODUCTION Electrical equipment experience a rise in temperature during normal operation due to ohmic losses. Experience has shown that when electric installations and devices, especially those housed in enclosures, shut down or malfunction, the problem often proves to be of thermal origin. The development towards more compact equipment, together with the increased focus on personnel safety (covering of live parts), reduces cooling and may subsequently overheat critical equipment. The IEC TR 60890 [1] technical report provides an empirically based method for calculating the temperature rise of the air inside an enclosure. This method was developed for LV switchgear and controlgear without forced ventilation. The calculation results are accepted as verification of thermal compliance with relevant requirements in cases where measurements on the actual switchboard are unavailable. Due to many similarities between LV and MV equipment, one might assume that the method described in IEC TR 60890 could be a suitable tool for making an initial estimate of the temperature rise of the air inside MV
equipment too. Previously published measurements [2] have shown a discrepancy between the measured temperature rise of the air inside a MV switchgear and the temperature rise and distribution calculated based on IEC TR 60890. It is important to note that the IEC method assumes the uniform distribution of the power input, which is normally close to reality for LV equipment with a number of smaller heat-generating devices distributed within a switchboard. However, this is not the case for MV equipment, in which the heat distribution is non-uniform due to the larger insulating distances required. It is well known that the cooling effect of the enclosure surface depends on the relative location of the heat source [3]. This paper explores what happens when the IEC TR 60890 requirement of uniform heat input is violated. CFD simulations were performed to study temperature distribution as a function of the location of the heat sources inside a sealed compartment with no ventilation. These simulations are compared with experiments performed on a real switchgear enclosure with the main heat sources located at different positions in the enclosure. The focus of this paper is to find typical trends and the impact of changing the heat source location. The knowledge gained from the experiments and simulations may then be used to adapt the IEC TR 60890 method so that it can be more suitable for MV switchgear with a non-uniform power input. This could be useful for designing new switchgear. IEC TR 60890 The IEC TR 60890 technical report assumes linear dependence between height and temperature within an enclosure with an effective cooling surface > 1.25 m2. The air temperature rise near top of the enclosure, ΔT1.0, is given by ∆ . = ∙ ∆ . (1) where ΔT0.5 is the temperature rise of the air in the middle of the enclosure and c is the temperature distribution factor that depends on the dimensions of the switchgear.
24th International Conference on Electricity Distribution Glasgow, 12-15 June 2017 Paper 0345
CIRED 2017 2/5
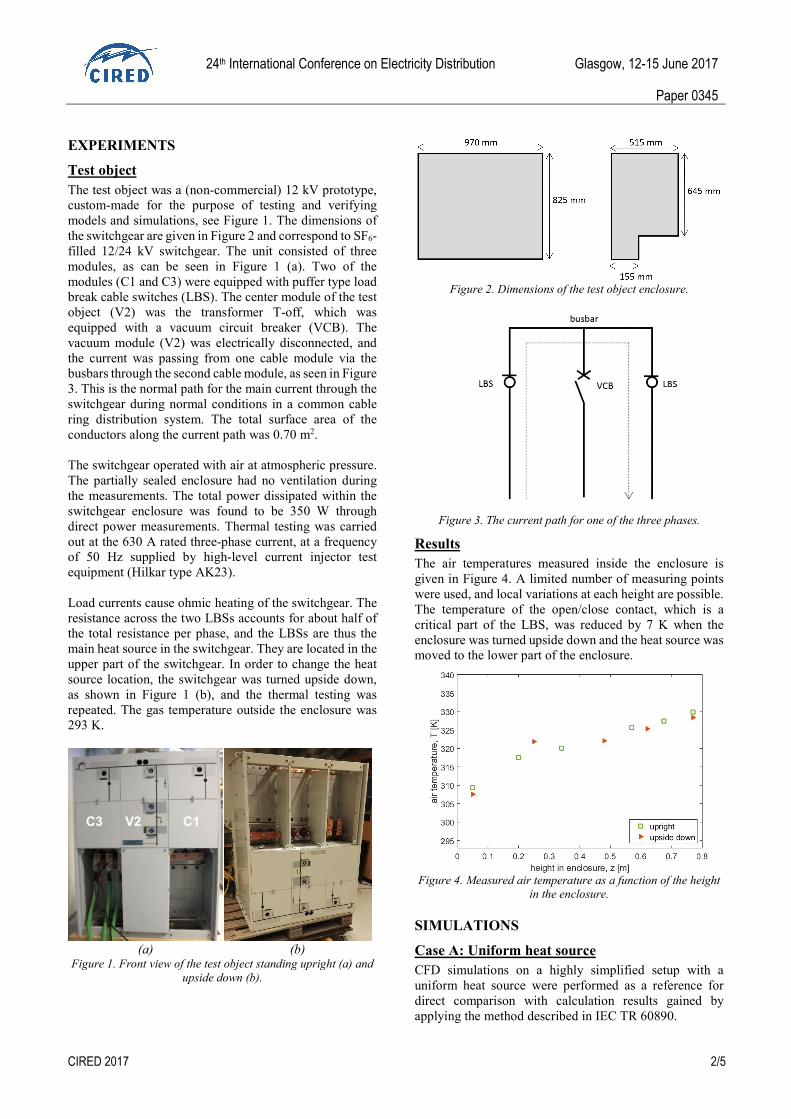
EXPERIMENTS Test object The test object was a (non-commercial) 12 kV prototype, custom-made for the purpose of testing and verifying models and simulations, see Figure 1. The dimensions of the switchgear are given in Figure 2 and correspond to SF6-filled 12/24 kV switchgear. The unit consisted of three modules, as can be seen in Figure 1 (a). Two of the modules (C1 and C3) were equipped with puffer type load break cable switches (LBS). The center module of the test object (V2) was the transformer T-off, which was equipped with a vacuum circuit breaker (VCB). The vacuum module (V2) was electrically disconnected, and the current was passing from one cable module via the busbars through the second cable module, as seen in Figure 3. This is the normal path for the main current through the switchgear during normal conditions in a common cable ring distribution system. The total surface area of the conductors along the current path was 0.70 m2. The switchgear operated with air at atmospheric pressure. The partially sealed enclosure had no ventilation during the measurements. The total power dissipated within the switchgear enclosure was found to be 350 W through direct power measurements. Thermal testing was carried out at the 630 A rated three-phase current, at a frequency of 50 Hz supplied by high-level current injector test equipment (Hilkar type AK23). Load currents cause ohmic heating of the switchgear. The resistance across the two LBSs accounts for about half of the total resistance per phase, and the LBSs are thus the main heat source in the switchgear. They are located in the upper part of the switchgear. In order to change the heat source location, the switchgear was turned upside down, as shown in Figure 1 (b), and the thermal testing was repeated. The gas temperature outside the enclosure was 293 K.
(a) (b) Figure 1. Front view of the test object standing upright (a) and
upside down (b).
Figure 2. Dimensions of the test object enclosure.
Figure 3. The current path for one of the three phases.
Results The air temperatures measured inside the enclosure is given in Figure 4. A limited number of measuring points were used, and local variations at each height are possible. The temperature of the open/close contact, which is a critical part of the LBS, was reduced by 7 K when the enclosure was turned upside down and the heat source was moved to the lower part of the enclosure.
Figure 4. Measured air temperature as a function of the height in the enclosure.
SIMULATIONS Case A: Uniform heat source CFD simulations on a highly simplified setup with a uniform heat source were performed as a reference for direct comparison with calculation results gained by applying the method described in IEC TR 60890.
C3 V2 C1
24th International Conference on Electricity Distribution Glasgow, 12-15 June 2017 Paper 0345
CIRED 2017 3/5
Setup Enclosure was simplified as a cuboid with the dimensions: 970 mm (width) x 515 mm (depth) x 720 mm (height)
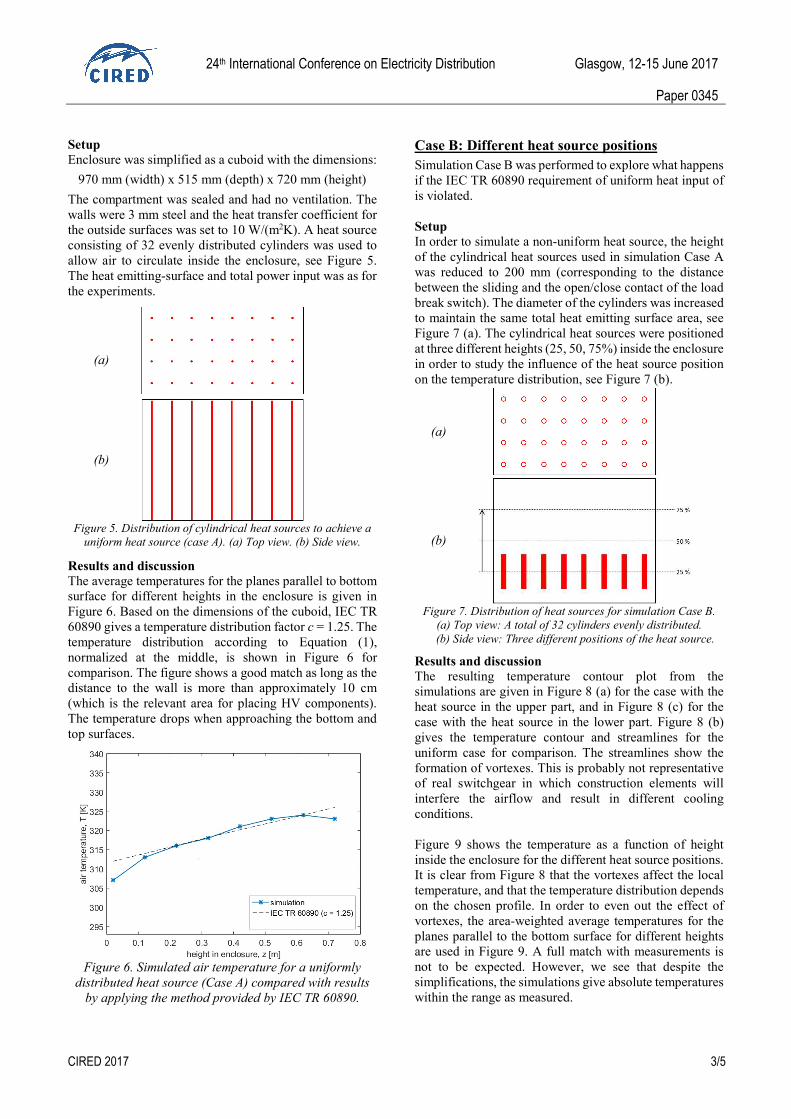
The compartment was sealed and had no ventilation. The walls were 3 mm steel and the heat transfer coefficient for the outside surfaces was set to 10 W/(m2K). A heat source consisting of 32 evenly distributed cylinders was used to allow air to circulate inside the enclosure, see Figure 5. The heat emitting-surface and total power input was as for the experiments.
(a)
(b)
Figure 5. Distribution of cylindrical heat sources to achieve a uniform heat source (case A). (a) Top view. (b) Side view.
Results and discussion The average temperatures for the planes parallel to bottom surface for different heights in the enclosure is given in Figure 6. Based on the dimensions of the cuboid, IEC TR 60890 gives a temperature distribution factor c = 1.25. The temperature distribution according to Equation (1), normalized at the middle, is shown in Figure 6 for comparison. The figure shows a good match as long as the distance to the wall is more than approximately 10 cm (which is the relevant area for placing HV components). The temperature drops when approaching the bottom and top surfaces.
Figure 6. Simulated air temperature for a uniformly distributed heat source (Case A) compared with results
by applying the method provided by IEC TR 60890.
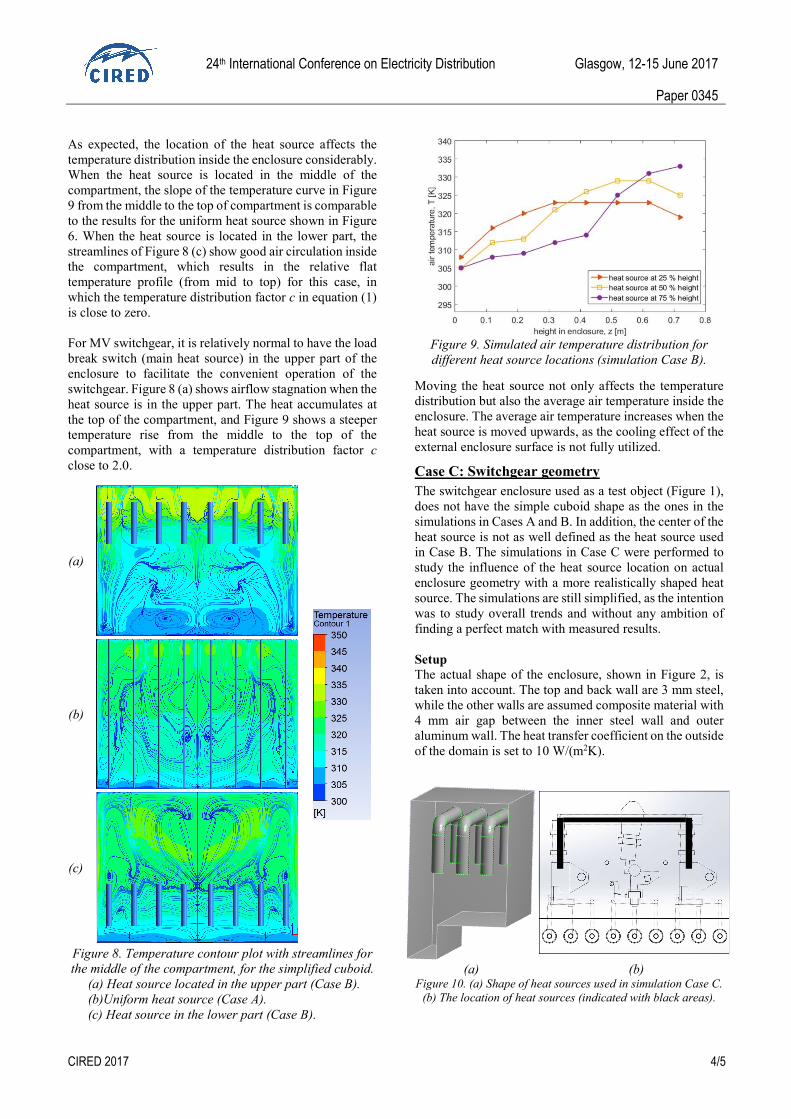
Case B: Different heat source positions Simulation Case B was performed to explore what happens if the IEC TR 60890 requirement of uniform heat input of is violated. Setup In order to simulate a non-uniform heat source, the height of the cylindrical heat sources used in simulation Case A was reduced to 200 mm (corresponding to the distance between the sliding and the open/close contact of the load break switch). The diameter of the cylinders was increased to maintain the same total heat emitting surface area, see Figure 7 (a). The cylindrical heat sources were positioned at three different heights (25, 50, 75%) inside the enclosure in order to study the influence of the heat source position on the temperature distribution, see Figure 7 (b).
(a)
(b)
Figure 7. Distribution of heat sources for simulation Case B. (a) Top view: A total of 32 cylinders evenly distributed.
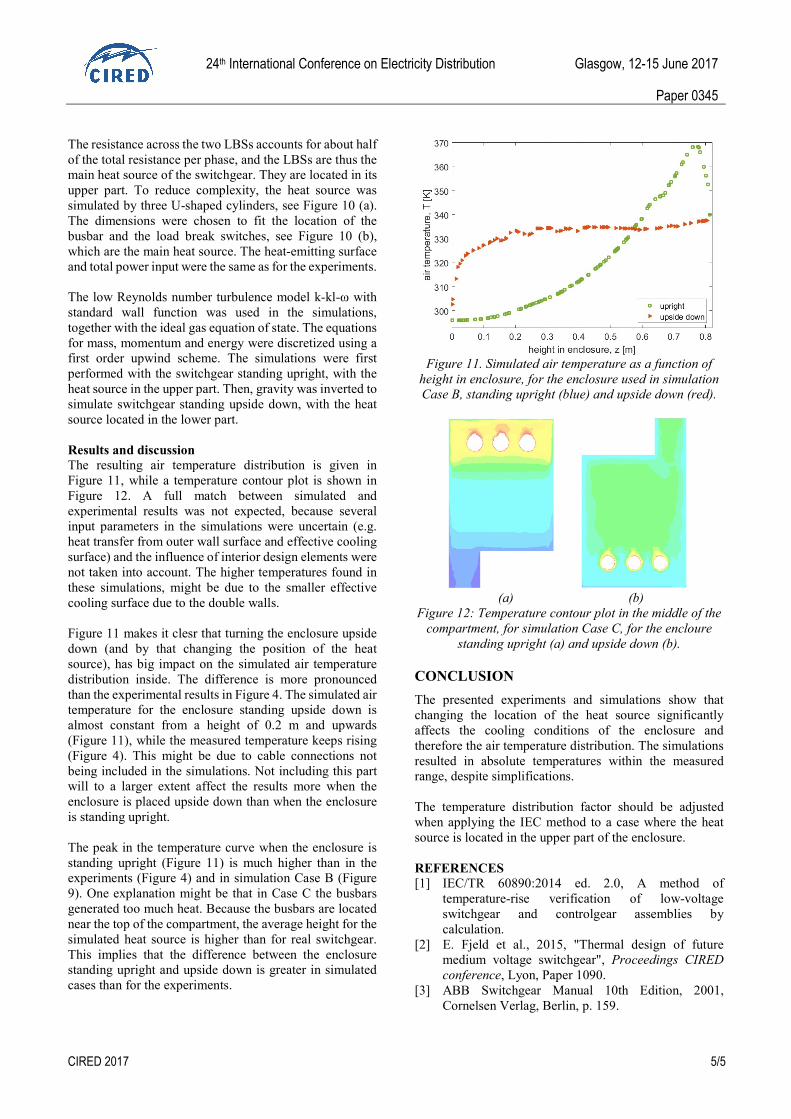
(b) Side view: Three different positions of the heat source. Results and discussion The resulting temperature contour plot from the simulations are given in Figure 8 (a) for the case with the heat source in the upper part, and in Figure 8 (c) for the case with the heat source in the lower part. Figure 8 (b) gives the temperature contour and streamlines for the uniform case for comparison. The streamlines show the formation of vortexes. This is probably not representative of real switchgear in which construction elements will interfere the airflow and result in different cooling conditions. Figure 9 shows the temperature as a function of height inside the enclosure for the different heat source positions. It is clear from Figure 8 that the vortexes affect the local temperature, and that the temperature distribution depends on the chosen profile. In order to even out the effect of vortexes, the area-weighted average temperatures for the planes parallel to the bottom surface for different heights are used in Figure 9. A full match with measurements is not to be expected. However, we see that despite the simplifications, the simulations give absolute temperatures within the range as measured.
24th International Conference on Electricity Distribution Glasgow, 12-15 June 2017 Paper 0345
CIRED 2017 4/5
As expected, the location of the heat source affects the temperature distribution inside the enclosure considerably. When the heat source is located in the middle of the compartment, the slope of the temperature curve in Figure 9 from the middle to the top of compartment is comparable to the results for the uniform heat source shown in Figure 6. When the heat source is located in the lower part, the streamlines of Figure 8 (c) show good air circulation inside the compartment, which results in the relative flat temperature profile (from mid to top) for this case, in which the temperature distribution factor c in equation (1) is close to zero. For MV switchgear, it is relatively normal to have the load break switch (main heat source) in the upper part of the enclosure to facilitate the convenient operation of the switchgear. Figure 8 (a) shows airflow stagnation when the heat source is in the upper part. The heat accumulates at the top of the compartment, and Figure 9 shows a steeper temperature rise from the middle to the top of the compartment, with a temperature distribution factor c close to 2.0.
(a)
(b)
(c)
Figure 8. Temperature contour plot with streamlines for the middle of the compartment, for the simplified cuboid. (a) Heat source located in the upper part (Case B). (b)Uniform heat source (Case A). (c) Heat source in the lower part (Case B).
Figure 9. Simulated air temperature distribution for different heat source locations (simulation Case B).
Moving the heat source not only affects the temperature distribution but also the average air temperature inside the enclosure. The average air temperature increases when the heat source is moved upwards, as the cooling effect of the external enclosure surface is not fully utilized. Case C: Switchgear geometry The switchgear enclosure used as a test object (Figure 1), does not have the simple cuboid shape as the ones in the simulations in Cases A and B. In addition, the center of the heat source is not as well defined as the heat source used in Case B. The simulations in Case C were performed to study the influence of the heat source location on actual enclosure geometry with a more realistically shaped heat source. The simulations are still simplified, as the intention was to study overall trends and without any ambition of finding a perfect match with measured results. Setup The actual shape of the enclosure, shown in Figure 2, is taken into account. The top and back wall are 3 mm steel, while the other walls are assumed composite material with 4 mm air gap between the inner steel wall and outer aluminum wall. The heat transfer coefficient on the outside of the domain is set to 10 W/(m2K).
(a) (b)
Figure 10. (a) Shape of heat sources used in simulation Case C. (b) The location of heat sources (indicated with black areas).
24th International Conference on Electricity Distribution Glasgow, 12-15 June 2017 Paper 0345
CIRED 2017 5/5
The resistance across the two LBSs accounts for about half of the total resistance per phase, and the LBSs are thus the main heat source of the switchgear. They are located in its upper part. To reduce complexity, the heat source was simulated by three U-shaped cylinders, see Figure 10 (a). The dimensions were chosen to fit the location of the busbar and the load break switches, see Figure 10 (b), which are the main heat source. The heat-emitting surface and total power input were the same as for the experiments. The low Reynolds number turbulence model k-kl-ω with standard wall function was used in the simulations, together with the ideal gas equation of state. The equations for mass, momentum and energy were discretized using a first order upwind scheme. The simulations were first performed with the switchgear standing upright, with the heat source in the upper part. Then, gravity was inverted to simulate switchgear standing upside down, with the heat source located in the lower part. Results and discussion The resulting air temperature distribution is given in Figure 11, while a temperature contour plot is shown in Figure 12. A full match between simulated and experimental results was not expected, because several input parameters in the simulations were uncertain (e.g. heat transfer from outer wall surface and effective cooling surface) and the influence of interior design elements were not taken into account. The higher temperatures found in these simulations, might be due to the smaller effective cooling surface due to the double walls. Figure 11 makes it clesr that turning the enclosure upside down (and by that changing the position of the heat source), has big impact on the simulated air temperature distribution inside. The difference is more pronounced than the experimental results in Figure 4. The simulated air temperature for the enclosure standing upside down is almost constant from a height of 0.2 m and upwards (Figure 11), while the measured temperature keeps rising (Figure 4). This might be due to cable connections not being included in the simulations. Not including this part will to a larger extent affect the results more when the enclosure is placed upside down than when the enclosure is standing upright. The peak in the temperature curve when the enclosure is standing upright (Figure 11) is much higher than in the experiments (Figure 4) and in simulation Case B (Figure 9). One explanation might be that in Case C the busbars generated too much heat. Because the busbars are located near the top of the compartment, the average height for the simulated heat source is higher than for real switchgear. This implies that the difference between the enclosure standing upright and upside down is greater in simulated cases than for the experiments.
Figure 11. Simulated air temperature as a function of height in enclosure, for the enclosure used in simulation Case B, standing upright (blue) and upside down (red).
(a) (b) Figure 12: Temperature contour plot in the middle of the
compartment, for simulation Case C, for the encloure standing upright (a) and upside down (b).
CONCLUSION The presented experiments and simulations show that changing the location of the heat source significantly affects the cooling conditions of the enclosure and therefore the air temperature distribution. The simulations resulted in absolute temperatures within the measured range, despite simplifications. The temperature distribution factor should be adjusted when applying the IEC method to a case where the heat source is located in the upper part of the enclosure. REFERENCES [1] IEC/TR 60890:2014 ed. 2.0, A method of
temperature-rise verification of low-voltage switchgear and controlgear assemblies by calculation.
[2] E. Fjeld et al., 2015, "Thermal design of future medium voltage switchgear", Proceedings CIRED conference, Lyon, Paper 1090.
[3] ABB Switchgear Manual 10th Edition, 2001, Cornelsen Verlag, Berlin, p. 159.


![LINE VOLTAGE REGULATOR BASED ON MAGNETIC ...cired.net/publications/cired2017/pdfs/CIRED2017_0207...in the distribution networks [2][3] which leads to a bidirectional power flow between](https://img.pdfslide.us/doc/110x75/5e9c93c66491ac4d4555795b/line-voltage-regulator-based-on-magnetic-cirednetpublicationscired2017pdfscired20170207.jpg)


![LVWULEXWLRQ RI 0XGVNLSSHUV (Gobiidae: Oxudercinae) … · the sonneratia alba and rhizophora mucronata ]rqhv ri 0rule zkhuh wkh vxevwudwhv zhuh vdqg\ pxg 7kh pxgvnlsshuv zhuh irxqg](https://img.pdfslide.us/doc/110x75/5cccdf8c88c993b2538d1c1b/lvwulexwlrq-ri-0xgvnlsshuv-gobiidae-oxudercinae-the-sonneratia-alba-and.jpg)