Embed Size (px)
Citation preview
7/29/2019 0331010 Hind z 110
http://slidepdf.com/reader/full/0331010-hind-z-110 1/7
Equitymaster Agora Research Private LimitedIndependent Investment Research
31 March, 2010
Hindustan Zinc Ltd. Page 1 of 7
-
50
100
150
200
250
Mar-07 Mar-08 Feb-09 Jan-10
Hindustan Zinc: Rs 215BSE Midcap: Rs 126
Market data
Current price Rs 1203 (BSE)
Market cap Rs 508,306 m
NSE symbol HINDZINC
BSE code 500188
No of shares 422.5 m
Free float 5.5%
Face value Rs 10.0
FY09 DPS (Rs) Rs 4.0
52 week H/L Rs 1,384/425
Rs 100 invested is now worth
Stock price performance
Hindu. Zinc Index*
6-Mths 47.7% 9.2%1-Yr 170.7% 129.7%
3-Yr 29.1% 8.0%
Returns over 1 yr are compoundedannual averages * BSE Midcap
Shareholding (Dec-09)
Category (%)
Promoters 64.9
Institutions (Banks,MFs, FIs)
1.6
FIIs 2.0
Indian public 1.9Others 29.6
Total 100.0
Report prepared by
Equitymaster Agora ResearchPrivate Limitedwww.equitymaster.com [email protected]
Hindustan Zinc Ltd. Buy (Target price: Rs 1,730)
Investment Rationale For a commodity business, it does not get any better than this:
We make no bones about the fact that we like companies with astrong competitive advantage, an advantage that acts as a moat andprotects the company from the caustic forces of competition. For it isonly the businesses that possess this kind of an advantage, that cangive its shareholders consistent profitability over the long term.
Our Mid cap select for this fortnight, Hindustan Zinc Ltd. (HZL), is agood example of this very phenomenon. It is one of the lowest costproducers of Zinc-Lead in the world. Its production costs lie in thelowest quartile when compared to the rest of the producers of thesemetals globally. And the source of this advantage comes from one
of its assets, the Rampura Agucha mine, the biggest zinc lead minethat the company has under its wing. This, along with its efficientoperations in its other mines and smelters come together tocontribute towards the company’s low costs of production. And itdoesn’t end here. The company is currently attempting to further reduce its costs of production from US$ 800 per tonne to US$ 600per tonne over the next few years. If achieved, this will serve as afurther strengthening of its low cost advantage. The moat is all set toget wider.
The economic advantage of this moat was evident in financial year 2009, when zinc and lead prices fell drastically from their peak.During the year, average zinc and lead prices on the London Metal
exchange fell 48% and 42% respectively. This was on the back of afall of 17% in prices in the preceding year (FY08) too. Quite a fallfrom FY07 when prices touched their peak.
In light of all this, FY09 was quite a bad year for the metal industry.The continued fall of zinc LME prices in FY09 led to a number of zincmines closures as also a shutdown or reduction of refined zinc metalproduction around the world. In the beginning of FY09, around 0.8million tonnes of zinc mine capacity and more than a million tonnesof refined production capacity was shut down.
But guess what. Hindustan Zinc was not only surviving, but thrivingin this otherwise difficult period for the industry. It operating margins,though lower than the previous years, stood at 48% during FY09.Outstanding by any standards let alone a bad year like FY09.
Capacity expansion to provide further momentum: HZL has beenquick to capitalise on the basic advantage that it has. It has swiftlyincreased its capacity over the last 5 years. It has been able toachieve this increase in capacity through a combination of debottlenecking at its existing smelters and mines, commissioning of new plants, brownfield expansion of its mines and continuous gainsin efficiency. At the end of FY09, the company had a zinc-lead metalproduction capacity of 754,000 TPA (tonnes per annum). It further
7/29/2019 0331010 Hind z 110
http://slidepdf.com/reader/full/0331010-hind-z-110 2/7
31 March, 2010
Hindustan Zinc Ltd. Page 2 of 7
aims to take this up to 1 million TPA by the endof FY10, which is on track as per our interactionwith the company. It aims to scale up itsoperations in silver too, where it currently has a
capacity of 150 tonnes per annum, and plans toscale this up to 500 TPA. Thus, an increase involumes through capacity expansion initiativeswill provide further momentum to the companygoing forward.
Fully integrated operations: HZL is one of themost integrated players in the lead zinc space inthe world. Not only does it have its own captivemines for extracting the metal to feed into itssmelters, it also meets its power requirementsin-house through its captive power plants.Further, it has also acquired a stake in a coal
block which will help it meet a part of its fuelrequirements going forward.
In India, it is the only player for zinc and leadwho has such an integrated scale of operations.The only other zinc producing company in Indiais Binani Zinc, which is a custom smelter. Thismeans that the company outsources itsrequirement of zinc concentrate and onlyprocesses it to produce the final refined metal. Itdoes not have any mines of its own. Its scale of operations is also much small when comparedto HZL.
Thus, it can be said that HZL almost has amonopoly status in the Indian zinc-lead market.
Comfortable resources base: At the end of FY09, the company’s total reserves andresources base stood at 272.0 million tonnescontaining 31.5 million tonnes of zinc-lead metaland 713.3 million ounces of silver. As per thecompany, at its expanded capacity of 10 milliontonnes of ore per year, its current reserves andresources base is sufficient for it to satisfy thecompany’s ore requirements roughly for the next
27 years. Nonetheless, the company continuesto vigorously pursue further exploration activitiesand intends to keep adding more to its resourcebase every year.
Investment Concerns
Significant cash on the company’s books: Atthe end of FY09, 60% of the company’s totalassets were made up of cash and liquidinvestments. The reason for this is that HZL hasover the last few years been paying out just 5%
to 7% of its yearly profits as dividends. This isdespite the fact that the company’s profitablecore operations have produced cash well inexcess of what the company needed in terms of capital expenditure over the last five years. The
low dividend payout in combination with highcash generation have led to a high amount of cash lying on the company’s books. At the endof FY09, the company had Rs 96 bn of cash andcash equivalents on its books. This works out toalmost Rs 228 per share. How profitably thecompany’s management will use this cash goingforward is anyone’s guess at th is point of time.
No control over product prices: As in anycommodity business, the company has nocontrol over the prices it charges for its products.Zinc and lead, the company’s two main
products, are priced with respect to LME(London Metal Exchange) prices. Thus, thecompany’s realizations are a slave tofluctuations in the global prices of thesecommodities. Further, it is extremely difficult topredict how these prices will move over the nextfew years.
Additionally, the company also has an exposureto the currency markets which comes from theUS dollar determined pricing of zinc and lead.Thus, any adverse appreciation of the Indianrupee relative to the US dollar can affect thecompany’s topline and profitability.
Low liquidity: Owning to the company’s smallpublic float, the liquidity of its stock is on thelower side. The stock’s average turnover over the period of the last one year has been Rs 55m. The consequence of this can be high impactcosts, which could lead to high volatility if a bigbuy or sell order is placed in a short span of time.
Background
Hindustan Zinc Ltd. is India's largest and world's
second largest integrated producer of zinc and lead.It is also the largest producer of primary silver andthe largest supplier of sulphuric acid in India. Thecompany is a subsidiary of the Sterlite Industries(India) Limited and part of the Anil Agarwal ownedVedanta group.
HZL has a global market share of approximately 6%in zinc. It is also one of the lowest cost producers inthe world. Its core business comprises of mining andsmelting of zinc and lead along with captive power generation, mainly for its internal needs. It has four
7/29/2019 0331010 Hind z 110
http://slidepdf.com/reader/full/0331010-hind-z-110 3/7
31 March, 2010
Hindustan Zinc Ltd. Page 3 of 7
mines and three smelting operations. The mines aresituated at Rampura Agucha, Sindesar Khurd,Rajpura Dariba and Zawar in the State of Rajasthan,while the smelters are located at Chanderiya andDebari in the State of Rajasthan and Vizag in the
State of Andhra Pradesh.
The Rampura Agucha mine is the largest zincproducing mine in the world and the ChanderiyaSmelting Complex is the largest single-location zincsmelting complex in the world. Both of these rank inthe first quartile with respect to costs.
The company’s current metal production capacity is754,000 tonnes per annum (669,000 tonnes of zincand 85,000 tonnes of lead). Its ore mining capacitystands at 7.4 million tonnes per annum. It also owns314 MW of coal based thermal captive power plantsin Rajasthan to support its metallurgical operations.
It also has a small wind energy operation of 123 MWin Gujarat and Karnataka which is sold to therespective State grids.
Industry Prospects
In terms of the usage of metals, zinc ranks fourthafter iron, aluminium and copper. One of its major uses is for galvanising of steel and other metalswhich serves as one of the best forms of protectionagainst corrosion. It is used for this purposeextensively in building, construction, infrastructure,household appliances, automobiles, steel furnitureetc. Its other major uses include zinc oxide, diecastings, rolled zinc and as alloys with other metals.Rapid growth of emerging economies like China ,India, Brazil and Russia, where the constructionsector has been benefiting from higher governmentspends on infrastructure are propelling the growthfor zinc. Spurred by industrialization, manufacturingand infrastructure demand, India and its other emerging counterparts have the potential to see highgrowth in zinc consumption in the years to come.
As far as lead is concerned, the battery sector is thesingle largest consumer of lead, accounting for around 75% of demand. These batteries are usedfor mobile application like cars, light vehicles etc.(50% of lead demand) as also industrial batteries,which currently consume approximately 25% of alllead produced. Here most of the growth is expectedto come from the automobile battery sector, as alsothe rapid growth in the telecommunication industry.Estimated power shortages over the next few yearswill also serve to boost the need for industrial andinverter batteries in India. The remainder is used inseveral non-battery applications like that of the
chemical industry which uses lead in the form of lead-based pigments and other compounds.
Key management personnel
Mr. Agnivesh Agarwal is the Chairman. He wasappointed to the Board on 15 November 2005. Mr. Agarwal is an industrialist with a strong knowledgeof business operations. He is vastly experienced inmanaging large projects, restructuring business andstrategizing. Over the years, he has developedexcellent commercial knowledge with hands-onexperience. He is also the Director of MALCO,Sterlite Iron and Steel Company Ltd, SterliteInfrastructure Pvt. Ltd, Agarwal Galvanizing Pvt. Ltd,and Sterlite Infrastructure Holdings Pvt. Ltd. Mr. Agarwal graduated from Sydhenam College inMumbai, majoring in commerce.
Mr. Akhilesh Joshi is Chief Operating Officer andWhole Time Director of the Company. He joinedthe company in 1976. Prior to becoming COO of Hindustan Zinc Limited, he was Senior VicePresident (Mines), responsible for the overalloperations at all mining units. Mr. Joshi has a MiningEngineering degree from MBM Engineering College,Jodhpur and a Post Graduate Diploma in EconomicEvaluation of Mining Projects from School of Minesin Paris. He also has a first class Mine Manager'sCertificate for Competency. He is the recipient of theNational Mineral Award (GOI) in 2006 for hisoutstanding contribution in the field of MiningTechnology.
Risk AnalysisNote: See the ‘Risk Matrix’ table on the page 5
Sector: The zinc-lead industry in India is a growingone on account of rapid industrialization and low per capita levels of consumption when compared toglobal average consumption patterns. However, thesector also faces problems related high amount of volatility in prices. Hence, we assign a ‘medium’ riskrating to the stock on this parameter.
Company standing: With HZL being the largestzinc lead producer in India and the second largest inthe world, we assign a ‘strong’ rating to the companyon this parameter.
Sales: HZL generated net revenues to the tune of nearly Rs 56 bn in FY09. Further, the company isexpected to generate average revenues to the tuneof Rs 87 bn over the next three years. We thus
7/29/2019 0331010 Hind z 110
http://slidepdf.com/reader/full/0331010-hind-z-110 4/7
31 March, 2010
Hindustan Zinc Ltd. Page 4 of 7
assign a low risk rating of 10 to the stock on thisparameter.
Operating margins: Operating margin is ameasurement of what proportion of a company's
revenue is left over after paying for variable costs of production such as raw materials, wages, and salesand marketing costs. A healthy operating margin isrequired for a company to be able to pay for its fixedcosts, such as interest on debt. The higher themargin, the better it is for the company as it indicatesits operating efficiency. HZL’s average operatingmargins for the past five years has been 58% andwe expect it to remain in the range of 50% duringthe next three years. As such, we assign a low riskrating of 10 to the stock on this parameter.
Long-term EPS growth: The company has shown
an average annual growth rate of 23% in itsearnings per share over the last 3 years. As such,the rating assigned to the stock on this factor is 5.
Return on invested capital: ROIC is an importanttool to assess a company's potential to be a qualityinvestment by determining how well themanagement is able to allocate capital into itsoperations for future growth. Considering HZL’s lastfive years' average ROIC of 60%, we have assigneda rating of 10 to the stock on this parameter.
Dividend payout: HZL has had an average dividend
payout of 8% over the last 5 years, which we expectto remain nearly stable at around 7% over the nextthree. The rating assigned on this parameter is 2.
Promoter holding: A larger share of promoter holding indicates the confidence of people who runthe company. We believe that a greater than 40%promoter holding indicates safety for retail investors. At the end of December 2009, the promoter holdingin HZL stood at about 65%. We have assigned a riskrating of 10 to the stock.
FII holding: We believe that FII holding of greater than 25% can lead to high volatility in the stockprice. FII holding in the company stood at 2% at theend of December 2009. Therefore, the ratingassigned is 10.
Liquidity: The past 52-week’s average daily volumeof the stock is in the range of 62,000 shares, whichindicates that the stock is average on liquidity. Therating assigned is thus 5.
Current ratio: HZL’s average current ratio duringthe period FY06 to FY09 has been around 2.4 times,indicating the company's ability to pay up short-termobligations. A ratio under 1 suggests that thecompany is unable, at that point, to pay off its
obligations if they came due. We assign a low-riskrating of 10 to the stock.
Debt to equity ratio: A highly leveraged business isthe first to get hit during times of economicdownturn, as companies have to consistently payinterest costs, despite lower profitability. We believethat a debt to equity ratio of greater than 1 is a high-risk proposition. HZL’s debt to equity is zero as it is adebt free company. We have thus assigned it a riskrating of 10.
Interest coverage ratio: This ratio is used to
determine how comfortably a company is placed interms of payment of interest on outstanding debt.The interest coverage ratio is calculated by dividinga company's earnings before interest and taxes(EBIT) by its interest expense for a given period. Thelower the ratio, the greater are the risks. Since HZLis a debt free company, the rating assigned to thestock on this parameter is 10.
P/E Ratio: The P/E ratio (price-to-earnings ratio) of a stock is a measure of the price paid for a sharerelative to per share income or profit earned by thecompany. This is one of the important metrics to
judge the attractiveness of a stock, and thus gets thehighest weightage in our risk matrix. HZL’s P/E on itsearnings of the past four quarters currently stands ataround 15 times. As such, we have assigned amedium risk rating of 5 to the stock on thisparameter.
Considering the above analysis, the total rankingassigned to the company is 97 that, on aweighted basis, stand at 7.6. This makes thestock a low-risk investment from a long-termperspective.
Valuations
We have assigned a price to book multiple of 3times to arrive at the stock’s valuation. Incidentally,over the past five years too, the company has tradedat an average P/B multiple of 3.3 times. This isamply justified by the strength of the company’sbalance sheet and its strong operations. Further, thisalso needs to be seen in light of the company’simmense profitability in the last few years. If economic activity picks up on a global level, and
7/29/2019 0331010 Hind z 110
http://slidepdf.com/reader/full/0331010-hind-z-110 5/7
31 March, 2010
Hindustan Zinc Ltd. Page 5 of 7
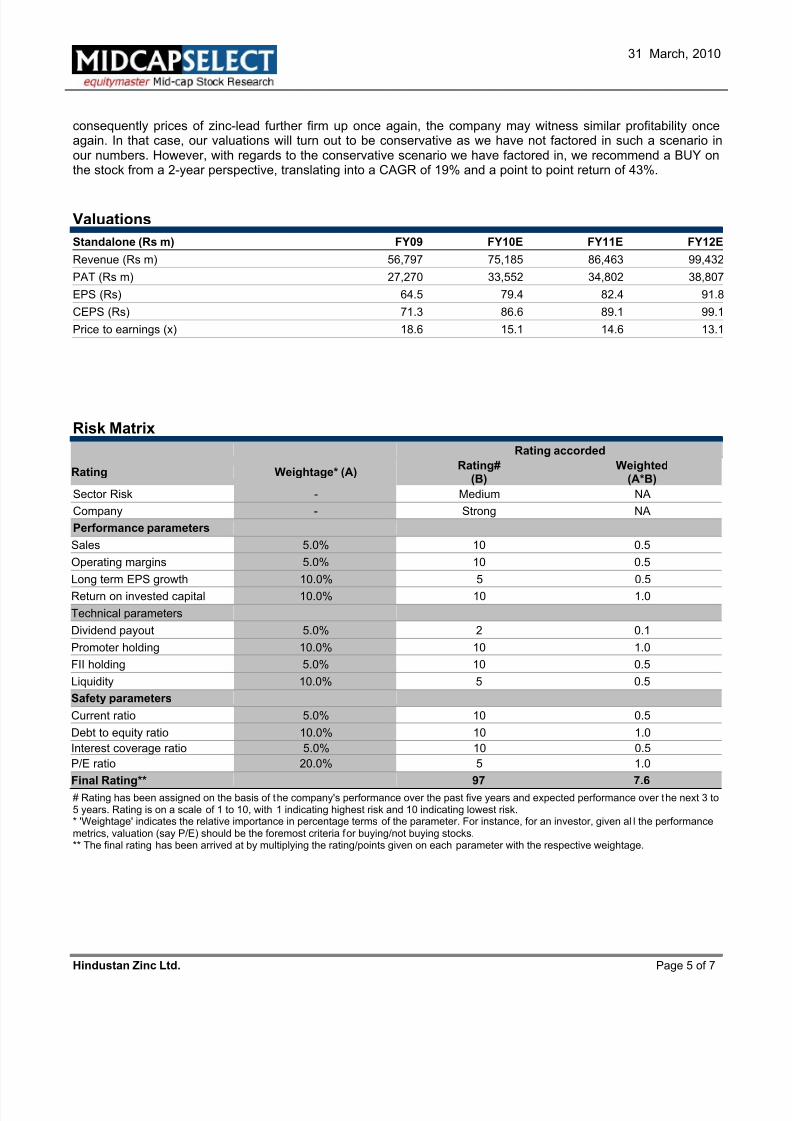
consequently prices of zinc-lead further firm up once again, the company may witness similar profitability onceagain. In that case, our valuations will turn out to be conservative as we have not factored in such a scenario inour numbers. However, with regards to the conservative scenario we have factored in, we recommend a BUY onthe stock from a 2-year perspective, translating into a CAGR of 19% and a point to point return of 43%.
Valuations
Standalone (Rs m) FY09 FY10E FY11E FY12E
Revenue (Rs m) 56,797 75,185 86,463 99,432
PAT (Rs m) 27,270 33,552 34,802 38,807
EPS (Rs) 64.5 79.4 82.4 91.8
CEPS (Rs) 71.3 86.6 89.1 99.1
Price to earnings (x) 18.6 15.1 14.6 13.1
Risk Matrix
Rating accorded
Rating Weightage* (A)Rating#
(B)Weighted
(A*B)
Sector Risk - Medium NA
Company - Strong NA
Performance parameters
Sales 5.0% 10 0.5
Operating margins 5.0% 10 0.5
Long term EPS growth 10.0% 5 0.5
Return on invested capital 10.0% 10 1.0
Technical parameters
Dividend payout 5.0% 2 0.1
Promoter holding 10.0% 10 1.0
FII holding 5.0% 10 0.5
Liquidity 10.0% 5 0.5
Safety parameters
Current ratio 5.0% 10 0.5
Debt to equity ratio 10.0% 10 1.0
Interest coverage ratio 5.0% 10 0.5
P/E ratio 20.0% 5 1.0
Final Rating** 97 7.6# Rating has been assigned on the basis of the company's performance over the past five years and expected performance over the next 3 to5 years. Rating is on a scale of 1 to 10, with 1 indicating highest risk and 10 indicating lowest risk.* 'Weightage' indicates the relative importance in percentage terms of the parameter. For instance, for an investor, given al l the performancemetrics, valuation (say P/E) should be the foremost criteria for buying/not buying stocks.** The final rating has been arrived at by multiplying the rating/points given on each parameter with the respective weightage.
7/29/2019 0331010 Hind z 110
http://slidepdf.com/reader/full/0331010-hind-z-110 6/7
31 March, 2010
Hindustan Zinc Ltd. Page 6 of 7
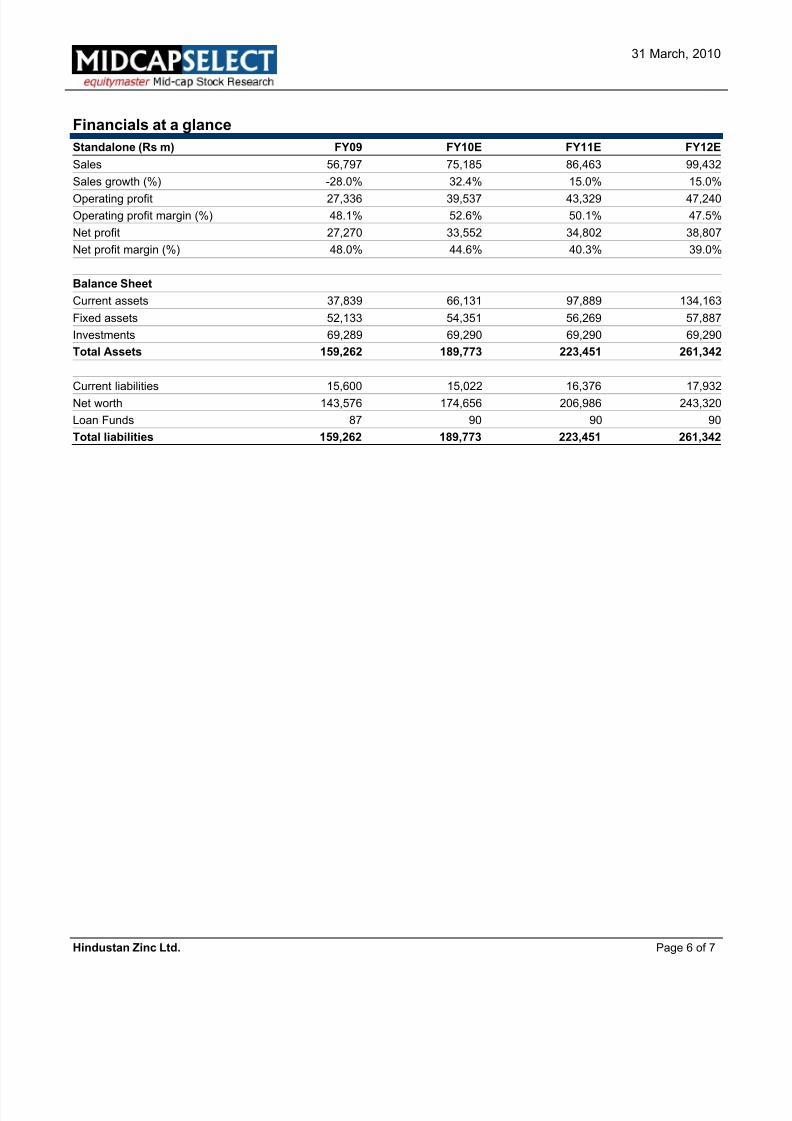
Financials at a glance
Standalone (Rs m) FY09 FY10E FY11E FY12E
Sales 56,797 75,185 86,463 99,432
Sales growth (%) -28.0% 32.4% 15.0% 15.0%
Operating profit 27,336 39,537 43,329 47,240Operating profit margin (%) 48.1% 52.6% 50.1% 47.5%
Net profit 27,270 33,552 34,802 38,807
Net profit margin (%) 48.0% 44.6% 40.3% 39.0%
Balance Sheet
Current assets 37,839 66,131 97,889 134,163
Fixed assets 52,133 54,351 56,269 57,887
Investments 69,289 69,290 69,290 69,290
Total Assets 159,262 189,773 223,451 261,342
Current liabilities 15,600 15,022 16,376 17,932
Net worth 143,576 174,656 206,986 243,320
Loan Funds 87 90 90 90
Total liabilities 159,262 189,773 223,451 261,342
7/29/2019 0331010 Hind z 110
http://slidepdf.com/reader/full/0331010-hind-z-110 7/7
31 March, 2010
Hindustan Zinc Ltd. Page 7 of 7
Important Message from Equitymaster:
We request you to sign up for the following to ensure that you make the most of your Equitymaster Subscription:
RSS feed for MidCap – Get intimated about a new report as soon as it is released
RSS feed for Views on News and Subscriber Features – Do not miss out on any new investment idea/updatethat we have posted on Equitymaster for our subscribers.
© Equitymaster Agora Research Private Limited. All rights reserved.
Disclosure:
Equitymaster Agora Research Private Limited (hereinafter referred as ‘Equitymaster’) is an independent equity researchCompany. Neither Equitymaster nor the Author holds any share in the company/ies discussed in this document.
Disclaimer:
This document is confidential and is supplied to you for information purposes only. It should not (directly or indirectly) bereproduced, further distributed to any person or published, in whole or in part, for any purpose whatsoever, without theconsent of Equitymaster.
This document is not directed to, or intended for display, downloading, printing, reproducing or for distribution to or use by,any person or entity, who is a citizen or resident or located in any locality, state, country or other jurisdiction, where suchdistribution, publication, reproduction, availability or use would be contrary to law or regulation or what would subjectEquitymaster or its affiliates to any registration or licensing requirement within such jurisdiction. If this document is sent or has reached any individual in such country, especially, USA, the same may be ignored.
This document does not constitute a personal recommendation or take into account the particular investment objectives,
financial situations, or needs of individual investors. Before acting on any advice or recommendation in this document,investors should consider whether it is suitable for their particular circumstances and, if necessary, seek professional advice.The price and value of the investments referred to in this material and the income from them may go down as well as up, andinvestors may realize losses on any investments. Past performance is not a guide for future performance, future returns arenot guaranteed and a loss of original capital may occur. Information herein is believed to be reliable but Equitymaster and itsaffiliates do not warrant its completeness or accuracy. The views/opinions expressed are our current opinions as of the dateappearing in the material and may be subject to change from time to time without notice. This document should not beconstrued as an offer to sell or solicitation of an offer to buy any security in any jurisdiction. Equitymaster and its affiliates, itsdirectors, analyst and employees will not be responsible for any loss or liability incurred to any person as a consequence of his or any other person on his behalf taking any investment decisions based on this document.