Embed Size (px)
Citation preview
0.3% THC:
The Most Common Question
© 2016 Oregon CBD A Jack Hempicine LLC Company
0.3% THC: The Most Common Question
Question: The federal THC limit is 0.3% for industrial hemp. I’ve seen other seed companies claiming consistent results below that level. Will your seed produce a field of 0.3% THC plants? Answer: In short, yes—all of our varieties are true type III industrial hemp, which means every seed has its THC production synthase turned “off” through traditional selective breeding, with chemical analysis guiding us in this process. Every farmer who grows our seed will pass final crop compliance testing in Oregon, Colorado, Vermont, Nevada, Kentucky, Hawaii, and West Virginia1. Every Oregon farm growing our varieties in 2016 passed ODA compliance inspection. The more accurate response is complicated and must consider (1) the validity of 0.3% THC in general, (2) total cannabinoid content of plants, (3) population level CBD to THC ratios, and (4) sample timing. We view our ability to answer this question as a small indication of the quality seed we provide in a marketplace stymied by limited scientific literacy and outright swindlers. The Mandate The 0.3% THC mandate is a problematic interpretation and application of early cannabis science. In 1976, Canadian horticulturalists Ernest Small and Arthur Cronquist published an article in Taxon, entitled “A Practical and Natural Taxonomy in Cannabis,” in which they provide the seminal demarcation between “industrial hemp” vs “marijuana”2 that has been adopted by governments around the world. In their words:
It will be noted that we arbitrarily adopt a concentration of 0.3% Delta9-THC (dry weight basis) in young, vigorous leaves of relatively mature plants as a guide to discriminating two classes of plants. This is based on standard-grown material in Ottawa in gardens, greenhouses and growth chambers, and of course on our analytical techniques. Dr. C. E. Turner, who has conducted extensive chemical analysis of Cannabis at the University of Mississippi, has agreed (pers. com.) that this is a reasonable figure to discriminate two classes of plants.
The major scientific problem (besides “we arbitrarily adopt…”) is that the widely implemented 0.3% THC concentration limit is often applied to flowering tops (where cannabinoid production is concentrated) instead of the “young, vigorous leaves of relatively mature plants” identified by Small and Cronquist. The real difference between “industrial hemp” and “marijuana” is derived from two separate genes that are tightly linked (located eight centimorgans apart on the same chromosome) and fight to convert the precursor cannabinoid CBG to either THC or CBD3. When THC production genes are turned “on” and CBD is turned “off,” plants are THC dominant, psychoactive, and are
1When sampled at the appropriate time (i.e. 30 days before harvest), these states use sampling protocols that all of our plant varieties will pass.2 Small and Cronquist. 1976. 3 Weiblen et al. 2015.
considered type I (recreational and medical)4. When both CBD and THC genes are turned “on,” plants are moderately psychoactive (as CBD lessens the psychoactivity of THC) and are considered type II (medical)5. When CBD production genes are turned “on” and THC is “off,” plants are considered type III (industrial hemp)6. Even with the THC genes “off,” type III plants still produce a small amount of THC; the reason for this is unknown and we are working with several research groups to better understand why this occurs. In our high cannabinoid hemp research programs, we have encountered plants that range from .1%-1% THC by dry weight on trimmed flowers. This means the federal limit of 0.3% is socially constructed rather than scientifically accurate, but we must currently abide by this mandate. High cannabinoid hemp farming is still possible (as evidenced by the explosion of this industry), but seed selection is critical for success. Farmers must consider a seed variety’s total cannabinoid content, CBD to THC ratio, and appropriate sample timing in their state to achieve good results, as all three of these variables play critical roles in successfully growing a full-term crop of legal, industrial hemp. Cannabinoid Content “Cannabinoid content” refers to the final, maximum amount of total cannabinoids present in a plant (or population of plants if using an average). This is one of the single most important economic qualities of cannabis lines, one of the most widely manipulated results by unscrupulous breeders, and a key determinant for meeting federal THC compliance levels. High cannabinoid content seed lines separate the “winners” from the “losers” in hemp production; if oil production is your goal, the low cannabinoid, $20 per pound seed will get you nowhere. Finola is a good example of this; many farmers love the low price of this seed, but plants average 1%-2% CBD under the best circumstances, making it cost prohibitive as a supply stock for extractors—tons of this flower material was composted due to its low marketability this year. Knowing the importance of high cannabinoid lines, some breeders claim outrageously high figures for their seed and offer no analytical evidence to back it up; others submit trimmed flower test results from their most stellar progeny and claim it’s representative of the entire population. While we would love to have a field full of 25% CBD plants grown from seed (as some advertise for $14 each!), we know that this is logically impossible—caveat emptor. We strive to provide accurate information on our varieties rather than marketing hype and to do so in a transparent, reproducible fashion. Compared to clones7, farmers growing industrial hemp from seed will be confronted with more variation in total cannabinoid content, but predictably so. Cannabinoid content is a polygenic, but heritable trait; it is derived from the complex interaction of different genes and protein networks, but consistently passed on with equal contributions from both
4 De Meijer et al. 1992. 5 Ibid 4. 6 Ibid 4. 7 Clones (or “cuttings”) are asexually propagated cannabis plants that are genetically identical to their original donor. Growing industrial hemp from clones is feasible at a small scale (< 5 acres), but far too labor intensive for larger fields.
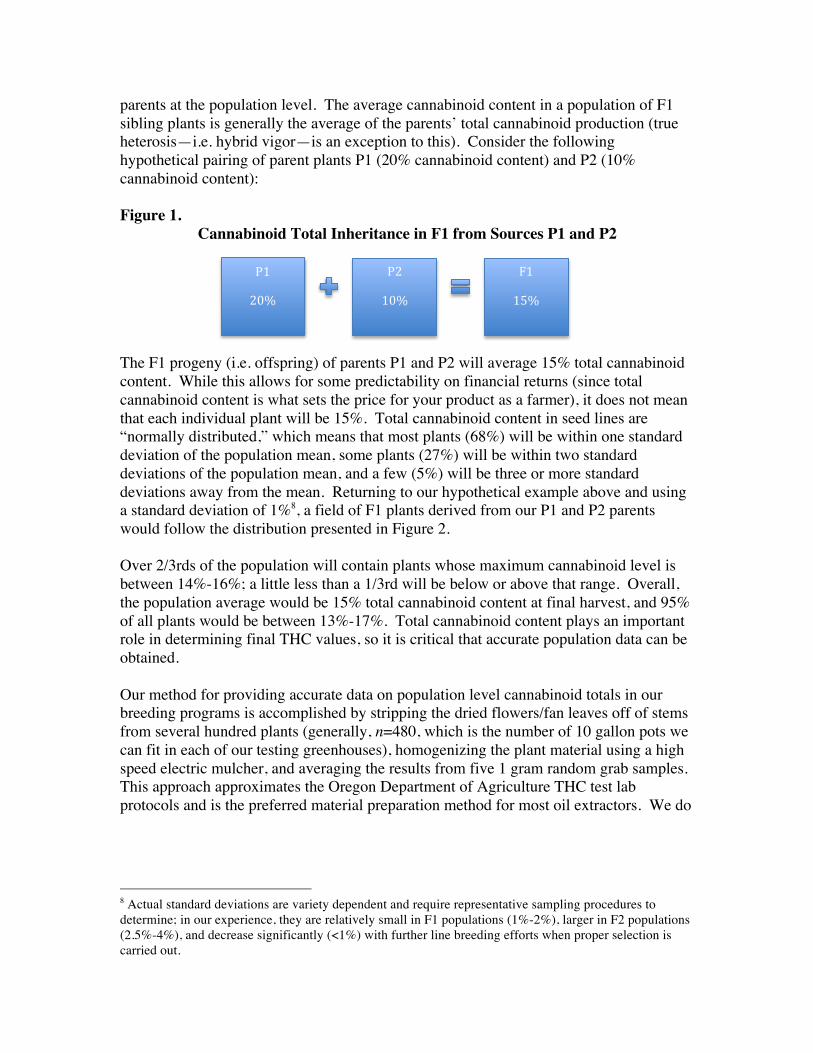
parents at the population level. The average cannabinoid content in a population of F1 sibling plants is generally the average of the parents’ total cannabinoid production (true heterosis—i.e. hybrid vigor—is an exception to this). Consider the following hypothetical pairing of parent plants P1 (20% cannabinoid content) and P2 (10% cannabinoid content): Figure 1.
Cannabinoid Total Inheritance in F1 from Sources P1 and P2 The F1 progeny (i.e. offspring) of parents P1 and P2 will average 15% total cannabinoid content. While this allows for some predictability on financial returns (since total cannabinoid content is what sets the price for your product as a farmer), it does not mean that each individual plant will be 15%. Total cannabinoid content in seed lines are “normally distributed,” which means that most plants (68%) will be within one standard deviation of the population mean, some plants (27%) will be within two standard deviations of the population mean, and a few (5%) will be three or more standard deviations away from the mean. Returning to our hypothetical example above and using a standard deviation of 1%8, a field of F1 plants derived from our P1 and P2 parents would follow the distribution presented in Figure 2. Over 2/3rds of the population will contain plants whose maximum cannabinoid level is between 14%-16%; a little less than a 1/3rd will be below or above that range. Overall, the population average would be 15% total cannabinoid content at final harvest, and 95% of all plants would be between 13%-17%. Total cannabinoid content plays an important role in determining final THC values, so it is critical that accurate population data can be obtained. Our method for providing accurate data on population level cannabinoid totals in our breeding programs is accomplished by stripping the dried flowers/fan leaves off of stems from several hundred plants (generally, n=480, which is the number of 10 gallon pots we can fit in each of our testing greenhouses), homogenizing the plant material using a high speed electric mulcher, and averaging the results from five 1 gram random grab samples. This approach approximates the Oregon Department of Agriculture THC test lab protocols and is the preferred material preparation method for most oil extractors. We do
8 Actual standard deviations are variety dependent and require representative sampling procedures to determine; in our experience, they are relatively small in F1 populations (1%-2%), larger in F2 populations (2.5%-4%), and decrease significantly (<1%) with further line breeding efforts when proper selection is carried out.
P1
20%
P2
10%
F1
15%
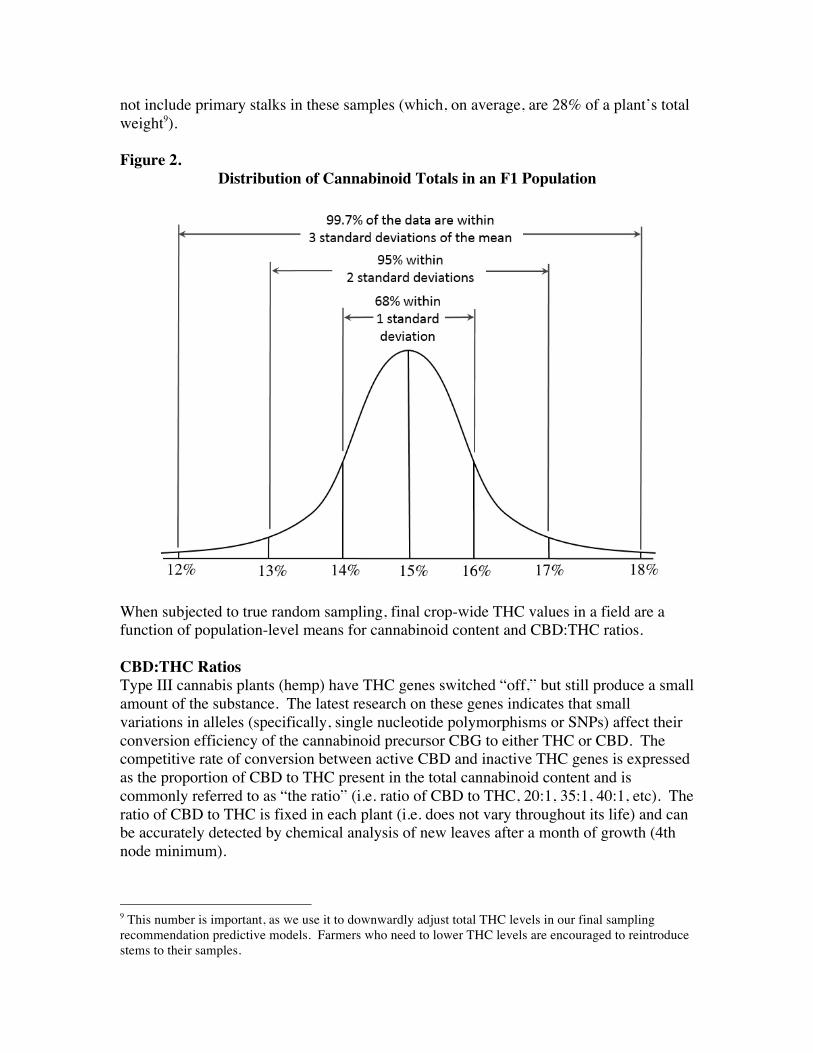
not include primary stalks in these samples (which, on average, are 28% of a plant’s total weight9). Figure 2.
Distribution of Cannabinoid Totals in an F1 Population
When subjected to true random sampling, final crop-wide THC values in a field are a function of population-level means for cannabinoid content and CBD:THC ratios. CBD:THC Ratios Type III cannabis plants (hemp) have THC genes switched “off,” but still produce a small amount of the substance. The latest research on these genes indicates that small variations in alleles (specifically, single nucleotide polymorphisms or SNPs) affect their conversion efficiency of the cannabinoid precursor CBG to either THC or CBD. The competitive rate of conversion between active CBD and inactive THC genes is expressed as the proportion of CBD to THC present in the total cannabinoid content and is commonly referred to as “the ratio” (i.e. ratio of CBD to THC, 20:1, 35:1, 40:1, etc). The ratio of CBD to THC is fixed in each plant (i.e. does not vary throughout its life) and can be accurately detected by chemical analysis of new leaves after a month of growth (4th node minimum).
9 This number is important, as we use it to downwardly adjust total THC levels in our final sampling recommendation predictive models. Farmers who need to lower THC levels are encouraged to reintroduce stems to their samples.
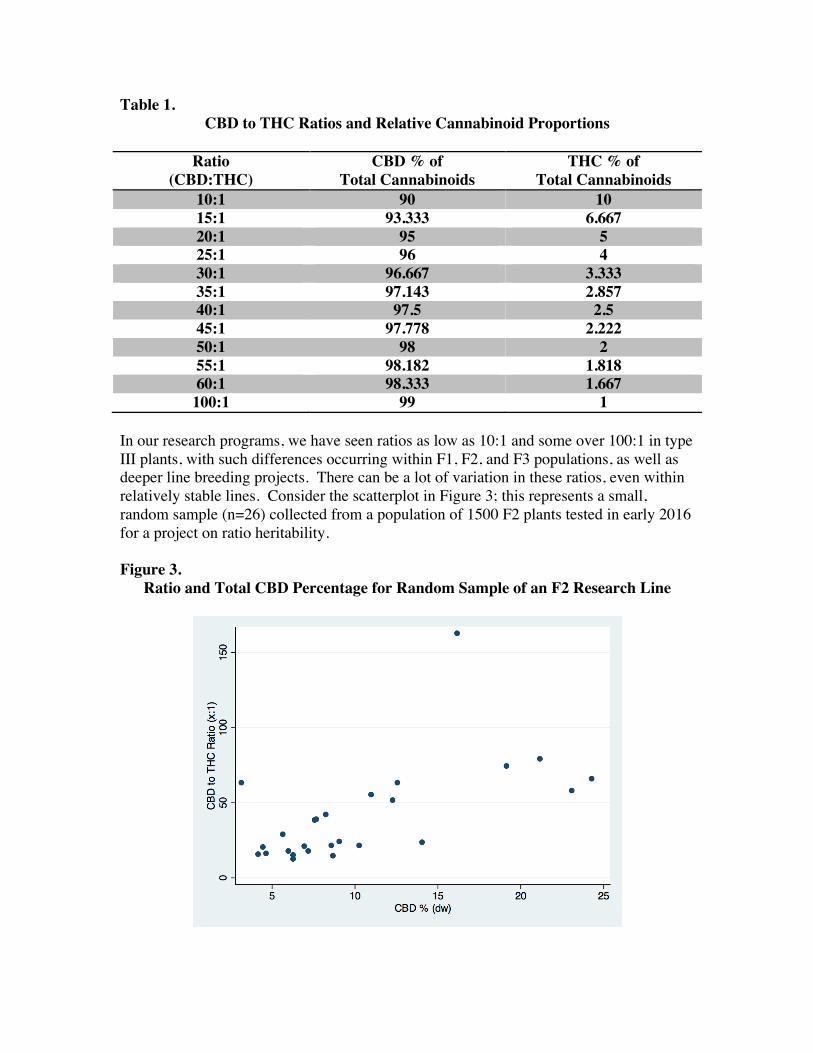
Table 1. CBD to THC Ratios and Relative Cannabinoid Proportions
Ratio
(CBD:THC) CBD % of
Total Cannabinoids THC % of
Total Cannabinoids 10:1 90 10 15:1 93.333 6.667 20:1 95 5 25:1 96 4 30:1 96.667 3.333 35:1 97.143 2.857 40:1 97.5 2.5 45:1 97.778 2.222 50:1 98 2 55:1 98.182 1.818 60:1 98.333 1.667 100:1 99 1
In our research programs, we have seen ratios as low as 10:1 and some over 100:1 in type III plants, with such differences occurring within F1, F2, and F3 populations, as well as deeper line breeding projects. There can be a lot of variation in these ratios, even within relatively stable lines. Consider the scatterplot in Figure 3; this represents a small, random sample (n=26) collected from a population of 1500 F2 plants tested in early 2016 for a project on ratio heritability. Figure 3.
Ratio and Total CBD Percentage for Random Sample of an F2 Research Line
In this example, the mean population ratio is 40:1, but individual plants range from 12:1 to 162:1—the standard deviation is nearly as large as the average (32.5). That’s an awful lot of variation and explains why we haven’t publicly released several of our breeding lines in seed form yet, but also demonstrates why it is necessary for breeders to collect large sample sizes for progeny testing, as providing an accurate population level ratio for any particular seed line requires hundreds of ratio tests (and we test each plant 3x to be sure)—it is not cheap, easy, or a common industry practice. We do it because we understand how important it is for THC compliance testing and for establishing pre-production contracts with clients. Farmers need to know this data and it must be accurate. Final THC level is a function of total cannabinoid content and ratio:
𝐹𝑖𝑛𝑎𝑙 𝐶𝑎𝑛𝑛𝑎𝑏𝑖𝑛𝑜𝑖𝑑 % ∗ 𝑇𝐻𝐶 𝑃𝑟𝑜𝑝𝑜𝑟𝑡𝑖𝑜𝑛𝐶𝐵𝐷 𝑃𝑟𝑜𝑝𝑜𝑟𝑡𝑖𝑜𝑛 = 𝐹𝑖𝑛𝑎𝑙 𝑇𝐻𝐶 %
As an example: a 15% plant with a 25:1 ratio would contain:
15% ∗125 = 0.6% 𝑇𝐻𝐶
Sample Timing Total cannabinoid content varies during the life of a cannabis plant. When vegetatively growing, type III industrial hemp will never test over 0.3% THC; farmers must start being attentive to cannabinoid accumulation once plants begin to form flowers (usually 2.5 weeks into flowering), as concentrations rise very quickly. Figure 4 shows this trend using aggregated data from several hundred plants tested at the same time throughout their lifecycles. It is important to note that CBD content increases dramatically between weeks 3 and 6 of flowering, then slowly continues to accumulate. THC, on the other hand, increases in a more linear fashion. Since ODA allows compliance testing to occur 30 days before harvest, we recommend that farmers have their crops analyzed between weeks 4 and 5 of flowering—doing so essentially guarantees a successful outcome as long as you are growing verified type III industrial hemp seed with a minimum average ratio of 20:1 (the cutoff we use in our breeding programs). For those farmers attempting to grow very high cannabinoid plants (>15%) with average ratios below 40:1, we recommend testing between weeks 3 and 4 of flowering. In 2016, every farmer who grew our varieties successfully passed their ODA compliance test. We believe this is the strongest possible testament to the quality and accuracy of our products. We’re proud to say that no other seed supplier can make this claim.
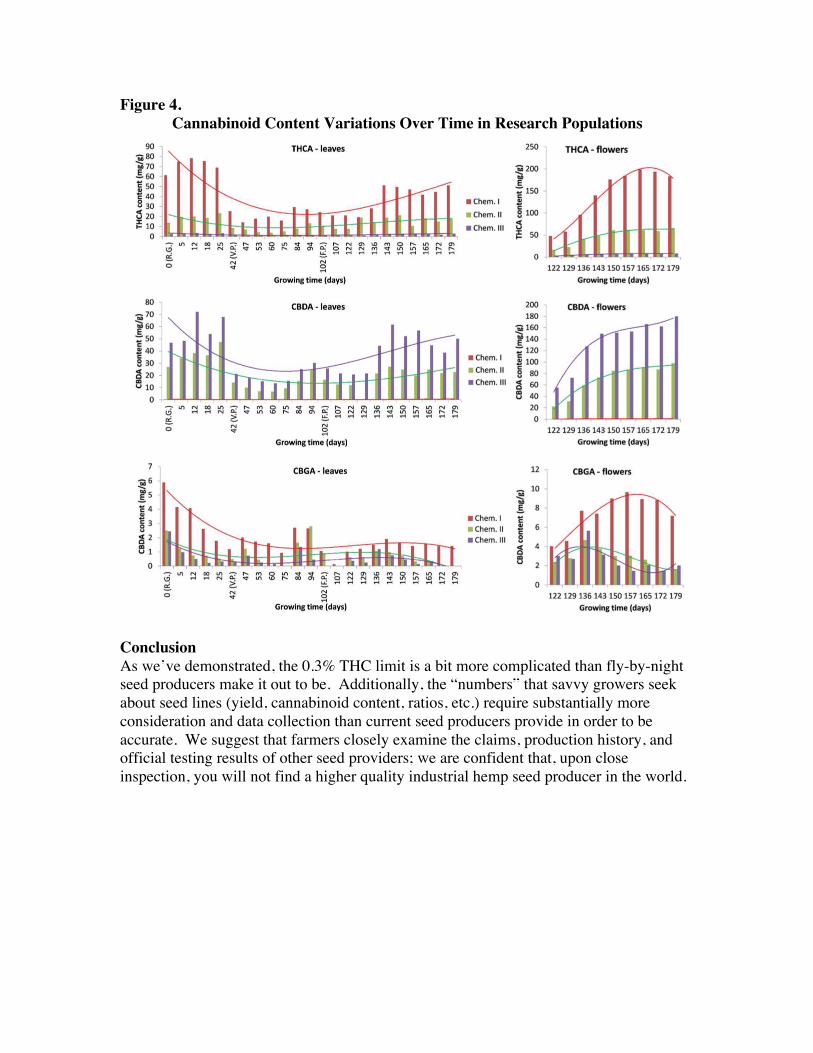
Figure 4. Cannabinoid Content Variations Over Time in Research Populations
Conclusion As we’ve demonstrated, the 0.3% THC limit is a bit more complicated than fly-by-night seed producers make it out to be. Additionally, the “numbers” that savvy growers seek about seed lines (yield, cannabinoid content, ratios, etc.) require substantially more consideration and data collection than current seed producers provide in order to be accurate. We suggest that farmers closely examine the claims, production history, and official testing results of other seed providers; we are confident that, upon close inspection, you will not find a higher quality industrial hemp seed producer in the world.