Embed Size (px)
Citation preview
M U LT I - S C I E N C E P U B L I S H I N G C O . LT D .
5 Wates Way, Brentwood, Essex CM15 9TB, United Kingdom
Reprinted from
INTERNATIONAL JOURNAL OF
SPACE STRUCTURESVolume 27 · Number 4 · 2012
Interactive Vault Design
by
M. Rippmann, L. Lachauer, P. Block
1. INTRODUCTIONIn the last two decades the rise of computer-aideddesign and modelling techniques enabled a newlanguage of doubly curved surfaces in architecture.The relation between architectural design andstructural concepts has changed towards an integratedorganizing principle of form, material and structure[1], which resulted in the emergence of a new designculture right at the border of architecture andengineering [2]. Through new digital fabricationmethods, the realization of complex forms becamefurthermore technically and economically feasible. Inorder to achieve an efficient and elegant design forthese non-standard structures, a close collaboration
Interactive Vault DesignMatthias Rippmann1’*, Lorenz Lachauer2 and Philippe Block3
1Research Assistant, Institute of Technology in Architecture, ETH ZurichWolfgang-Pauli-Str. 15, 8093 Zurich, Switzerland
[email protected] Assistant, Institute of Technology in Architecture, ETH Zurich
Wolfgang-Pauli-Str. 15, 8093 Zurich, [email protected]
3Assistant Professor, Institute of Technology in Architecture, ETH ZurichWolfgang-Pauli-Str. 15, 8093 Zurich, Switzerland
(Submitted on 01/03/2012, Reception of revised paper 31/07/2012, Accepted on 31/08/2012)
ABSTRACT: This paper presents a new computational framework based onThrust Network Analysis (TNA) for the design of funicular structures. Fast androbust solving algorithms enable the interactive exploration of theseconstrained structural systems. By giving explicit, bidirectional control overthe internal force distribution and overall geometry to the designer, freeexploration of these statically highly indeterminate systems is made possible.The equilibrium of funicular compression networks is represented byreciprocal diagrams, which visually express the force dependencies betweendifferent parts of the structure. By modifying these diagrams in real-time, thedesigner is able to explore novel and expressive vaulted geometries that areblurring the difference between shapes associated to typical compression-onlyforms, obtained e.g. with hanging networks, and freeform surface structures.The power of this framework for design is demonstrated by a user-friendlysoftware implementation, which has been used to design and build a freeform,thin-tile masonry vault.
Key Words: Funicular form finding; Thrust Network Analysis; real-timestructural design tools; interactive, bidirectional exploration; compression-only vaults; reciprocal diagrams
International Journal of Space Structures Vol. 27 No. 4 2012 219
between architects and engineers from early designphases, based on new, shared computational tools,gained importance [3]. To enable an intuitive approachto design problems with hard engineering constraintsthough, visual representation [4] and real-timefeedback [5] of structural information is essential.
This paper discusses the problem of curved surfacedesign within the rigorous framework of funicular,compression-only vault design. Historically, particularlyhanging models and graphic statics have been used todesign vaulted structures. In the beginning of the 20th
century, Antoni Gaudí used hanging models in thedesign process of the Crypt of Colònia Güell [6]; FreiOtto and his team used hanging models to find the form
*Corresponding author e-mail: [email protected]
220 International Journal of Space Structures Vol. 27 No. 4 2012
Interactive Vault Design
for the lattice shell in Mannheim [7]; and Swiss engineerHeinz Isler designed his concrete shells based onhanging cloth models [8]. Around the same time asGaudí, the Guastavino Company was designing largethin-tile vaults for important buildings all over theUnited States using graphic statics [9]. Such form-finding techniques, both physical and graphical, allowthe exploration of three-dimensional systems, but thedesign process is time-consuming and tedious,particularly due to a lack of global control, since eachlocal change affects the overall geometry.
In the last 15 years, a few three-dimensionalcomputational methods have been developed for theequilibrium design of vaults. Kilian developed a virtualinteractive hanging string modelling environment, withreal-time exploration made possible through fastmodelling and solving algorithms, adopted from clothmodelling used in the computer graphics industry [4, 10].His approach emphasised the exploration experience, buthad challenges to steer the design in a controlled manner.This was addressed by Andreu et al. [11], but applied onlyin the realm of equilibrium analysis of vaulted masonrystructures, and without the interactive design component.Most recently, several interactive tools allowing for realtime exploration of funicular networks have beendeveloped, such as [12, 13]. Finally, Thrust NetworkAnalysis (TNA), extending graphic statics to the thirddimension for vertical loading, enables the explicitrepresentation and control of all degrees of freedom instatically indeterminate funicular networks, by means ofreciprocal diagrams and linear optimization [14, 15].
This paper describes an interactive, bidirectionaldesign framework for compression-only vaults, basedon the concepts of TNA. The new, underlyingcomputational method that allows real-time feedback, isexplained in detail. The paper is structured as follows:in Section 2, the basic concepts of graphic statics,reciprocal diagrams and TNA are explained; Section 3describes the setup of the interactive design workflow,while Section 4 illustrates the developed solvingmethods in detail; Section 5 discusses questions ofimplementation, and presents an application of thisframework, in the form of a prototypical shell; Section6 focuses on future research; and the conclusions of thisstudy are given in Section 7.
2. THEORETICAL BACKGROUNDThis section describes the underlying concepts thatform the foundation of the new design framework.These concepts, graphic statics and its three-dimensional extension, TNA, have been adapted andextended to enable real-time feedback.
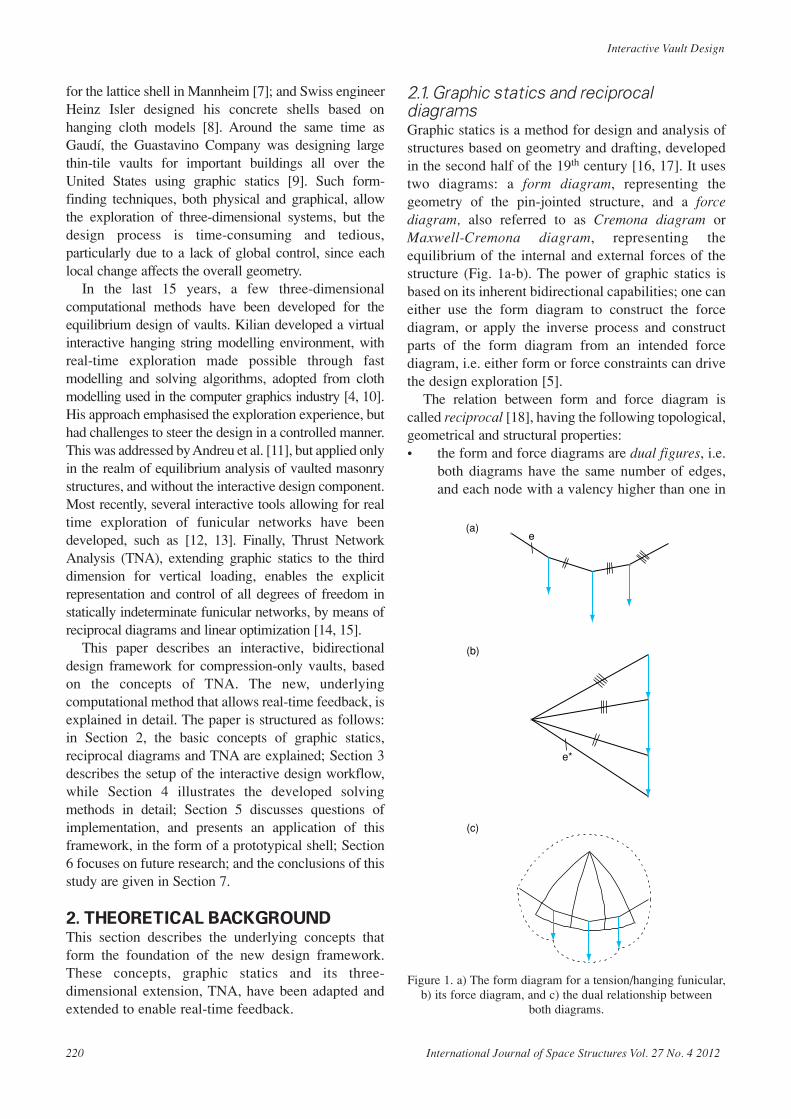
2.1. Graphic statics and reciprocaldiagramsGraphic statics is a method for design and analysis ofstructures based on geometry and drafting, developedin the second half of the 19th century [16, 17]. It usestwo diagrams: a form diagram, representing thegeometry of the pin-jointed structure, and a forcediagram, also referred to as Cremona diagram orMaxwell-Cremona diagram, representing theequilibrium of the internal and external forces of thestructure (Fig. 1a-b). The power of graphic statics isbased on its inherent bidirectional capabilities; one caneither use the form diagram to construct the forcediagram, or apply the inverse process and constructparts of the form diagram from an intended forcediagram, i.e. either form or force constraints can drivethe design exploration [5].
The relation between form and force diagram iscalled reciprocal [18], having the following topological,geometrical and structural properties:• the form and force diagrams are dual figures, i.e.
both diagrams have the same number of edges,and each node with a valency higher than one in
(a)
(b)
(c)
e*
e
Figure 1. a) The form diagram for a tension/hanging funicular,b) its force diagram, and c) the dual relationship between
both diagrams.
Matthias Rippmann, Lorenz Lachauer and Philippe Block
International Journal of Space Structures Vol. 27 No. 4 2012 221
one corresponds to a space, formed by a polygonof edges, in the other, and vice versa (Fig. 1c);
• each edge e in the form diagram (Fig. 1a) has acorresponding edge e*, parallel to edge e, in theforce diagram (Fig. 1b); and
• the length of edge e* in the force diagram is, upto a scale factor, equal to the magnitude of axialforce in edge e in the form diagram.
Note that for edges coming together at “internal”nodes of the form diagram, or in other words, theircorresponding edges in the force diagram form closedpolygons, representing closed vector polygons offorces. These reciprocal properties thus lead to a uniqueforce diagram for a given statically determinatestructure and loading case. If the structure is staticallyindeterminate, more than one reciprocal diagram existsfor the given form diagram.
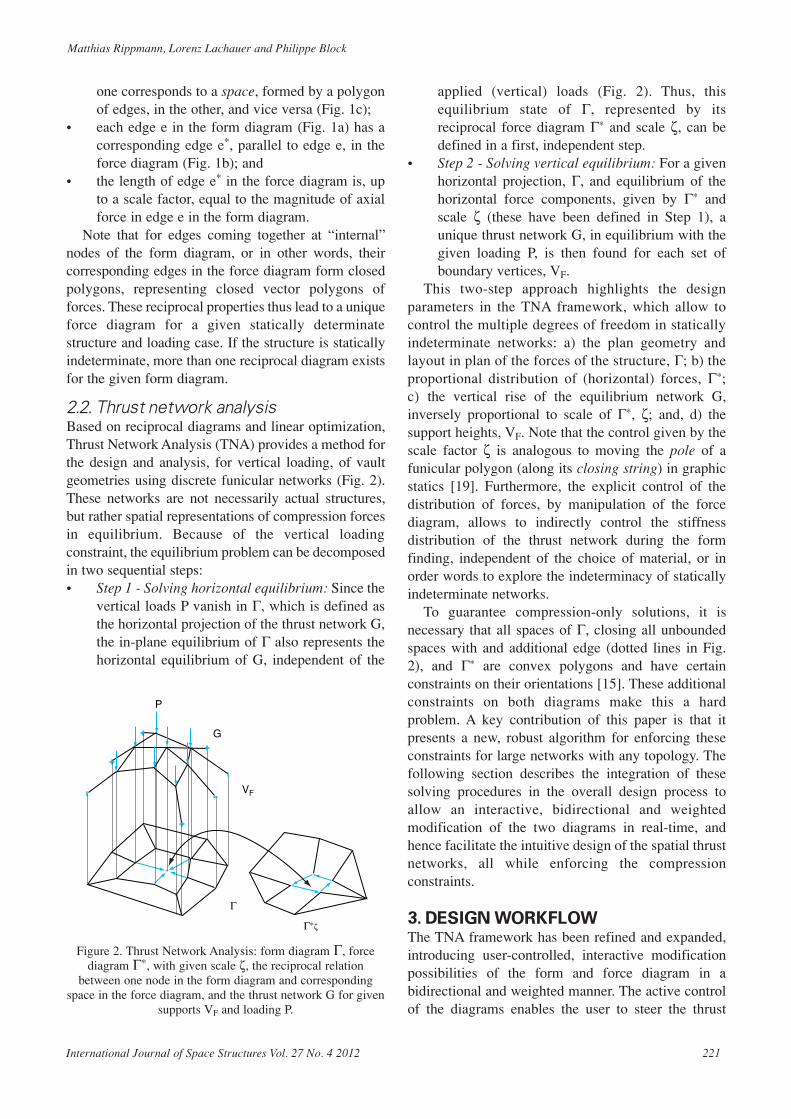
2.2. Thrust network analysisBased on reciprocal diagrams and linear optimization,Thrust Network Analysis (TNA) provides a method forthe design and analysis, for vertical loading, of vaultgeometries using discrete funicular networks (Fig. 2).These networks are not necessarily actual structures,but rather spatial representations of compression forcesin equilibrium. Because of the vertical loadingconstraint, the equilibrium problem can be decomposedin two sequential steps:• Step 1 - Solving horizontal equilibrium: Since the
vertical loads P vanish in Γ, which is defined asthe horizontal projection of the thrust network G,the in-plane equilibrium of Γ also represents thehorizontal equilibrium of G, independent of the
applied (vertical) loads (Fig. 2). Thus, thisequilibrium state of Γ, represented by itsreciprocal force diagram Γ∗ and scale ζ, can bedefined in a first, independent step.
• Step 2 - Solving vertical equilibrium: For a givenhorizontal projection, Γ, and equilibrium of thehorizontal force components, given by Γ∗ andscale ζ (these have been defined in Step 1), aunique thrust network G, in equilibrium with thegiven loading P, is then found for each set ofboundary vertices, VF.
This two-step approach highlights the designparameters in the TNA framework, which allow tocontrol the multiple degrees of freedom in staticallyindeterminate networks: a) the plan geometry andlayout in plan of the forces of the structure, Γ; b) theproportional distribution of (horizontal) forces, Γ∗;c) the vertical rise of the equilibrium network G,inversely proportional to scale of Γ∗, ζ; and, d) thesupport heights, VF. Note that the control given by thescale factor ζ is analogous to moving the pole of afunicular polygon (along its closing string) in graphicstatics [19]. Furthermore, the explicit control of thedistribution of forces, by manipulation of the forcediagram, allows to indirectly control the stiffnessdistribution of the thrust network during the formfinding, independent of the choice of material, or inorder words to explore the indeterminacy of staticallyindeterminate networks.
To guarantee compression-only solutions, it isnecessary that all spaces of Γ, closing all unboundedspaces with and additional edge (dotted lines in Fig.2), and Γ∗ are convex polygons and have certainconstraints on their orientations [15]. These additionalconstraints on both diagrams make this a hardproblem. A key contribution of this paper is that itpresents a new, robust algorithm for enforcing theseconstraints for large networks with any topology. Thefollowing section describes the integration of thesesolving procedures in the overall design process toallow an interactive, bidirectional and weightedmodification of the two diagrams in real-time, andhence facilitate the intuitive design of the spatial thrustnetworks, all while enforcing the compressionconstraints.
3. DESIGN WORKFLOWThe TNA framework has been refined and expanded,introducing user-controlled, interactive modificationpossibilities of the form and force diagram in abidirectional and weighted manner. The active controlof the diagrams enables the user to steer the thrust
P
G
VF
Γ
Γ∗ζ
Figure 2. Thrust Network Analysis: form diagram Γ, forcediagram Γ∗, with given scale ζ, the reciprocal relation
between one node in the form diagram and correspondingspace in the force diagram, and the thrust network G for given
supports VF and loading P.
222 International Journal of Space Structures Vol. 27 No. 4 2012
Interactive Vault Design
networks interactively towards an intended shape.These new adaptations of the framework pave the wayfor a digital, TNA-based structural design tool, whichis accessible and generally comprehendible to botharchitects and engineers.
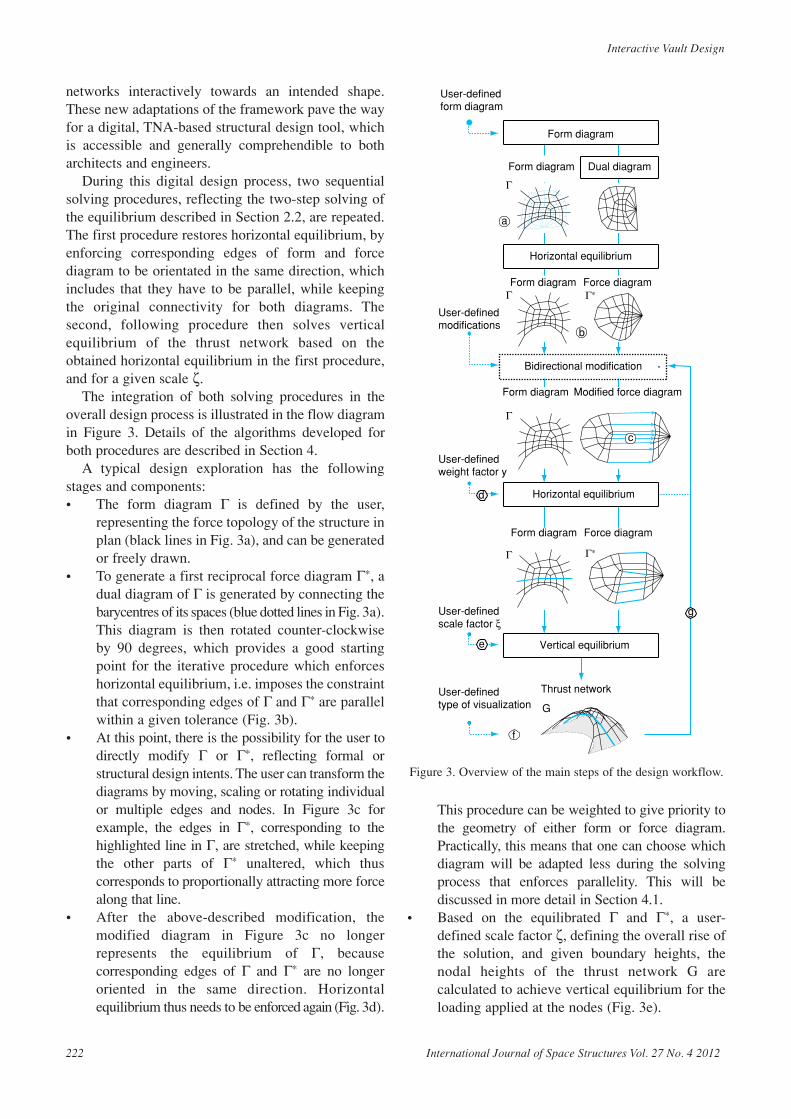
During this digital design process, two sequentialsolving procedures, reflecting the two-step solving ofthe equilibrium described in Section 2.2, are repeated.The first procedure restores horizontal equilibrium, byenforcing corresponding edges of form and forcediagram to be orientated in the same direction, whichincludes that they have to be parallel, while keepingthe original connectivity for both diagrams. Thesecond, following procedure then solves verticalequilibrium of the thrust network based on theobtained horizontal equilibrium in the first procedure,and for a given scale ζ.
The integration of both solving procedures in theoverall design process is illustrated in the flow diagramin Figure 3. Details of the algorithms developed forboth procedures are described in Section 4.
A typical design exploration has the followingstages and components:• The form diagram Γ is defined by the user,
representing the force topology of the structure inplan (black lines in Fig. 3a), and can be generatedor freely drawn.
• To generate a first reciprocal force diagram Γ∗, adual diagram of Γ is generated by connecting thebarycentres of its spaces (blue dotted lines in Fig. 3a).This diagram is then rotated counter-clockwiseby 90 degrees, which provides a good startingpoint for the iterative procedure which enforceshorizontal equilibrium, i.e. imposes the constraintthat corresponding edges of Γ and Γ∗ are parallelwithin a given tolerance (Fig. 3b).
• At this point, there is the possibility for the user todirectly modify Γ or Γ∗, reflecting formal orstructural design intents. The user can transform thediagrams by moving, scaling or rotating individualor multiple edges and nodes. In Figure 3c forexample, the edges in Γ∗, corresponding to thehighlighted line in Γ, are stretched, while keepingthe other parts of Γ∗ unaltered, which thuscorresponds to proportionally attracting more forcealong that line.
• After the above-described modification, themodified diagram in Figure 3c no longerrepresents the equilibrium of Γ, becausecorresponding edges of Γ and Γ∗ are no longeroriented in the same direction. Horizontalequilibrium thus needs to be enforced again (Fig. 3d).
This procedure can be weighted to give priority tothe geometry of either form or force diagram.Practically, this means that one can choose whichdiagram will be adapted less during the solvingprocess that enforces parallelity. This will bediscussed in more detail in Section 4.1.
• Based on the equilibrated Γ and Γ∗, a user-defined scale factor ζ, defining the overall rise ofthe solution, and given boundary heights, thenodal heights of the thrust network G arecalculated to achieve vertical equilibrium for theloading applied at the nodes (Fig. 3e).
User-definedform diagram
User-definedmodifications
Bidirectional modification
User-definedweight factor y
User-definedscale factor ξ
User-definedtype of visualization
Form diagram
Horizontal equilibrium
Horizontal equilibrium
Vertical equilibrium
Form diagram
a
b
c
Form diagram
Form diagram
Form diagram
Thrust network
Force diagram
Modified force diagram
Force diagram
Dual diagram
d
f
g
G
e
Γ∗
Γ∗
Γ
Γ
Γ
Γ
Figure 3. Overview of the main steps of the design workflow.
Matthias Rippmann, Lorenz Lachauer and Philippe Block
International Journal of Space Structures Vol. 27 No. 4 2012 223
• The three-dimensional visualization of the thrustnetwork G allows to check and evaluate thesolution with respect to the design intent (Fig. 3f).Indeed, the manually enforced forceredistribution, by the stretching of edges in theforce diagram, has caused a fold, which canbe understood as a structural rib, along thecorresponding in-line edges in the thrustnetwork. The user-controlled modification of theform and force diagram, followed by the solvingprocedures which in two steps enforce horizontaland vertical equilibrium, is repeated until theshape of the resulting thrust network meets thedesign requirements (Fig. 3g).
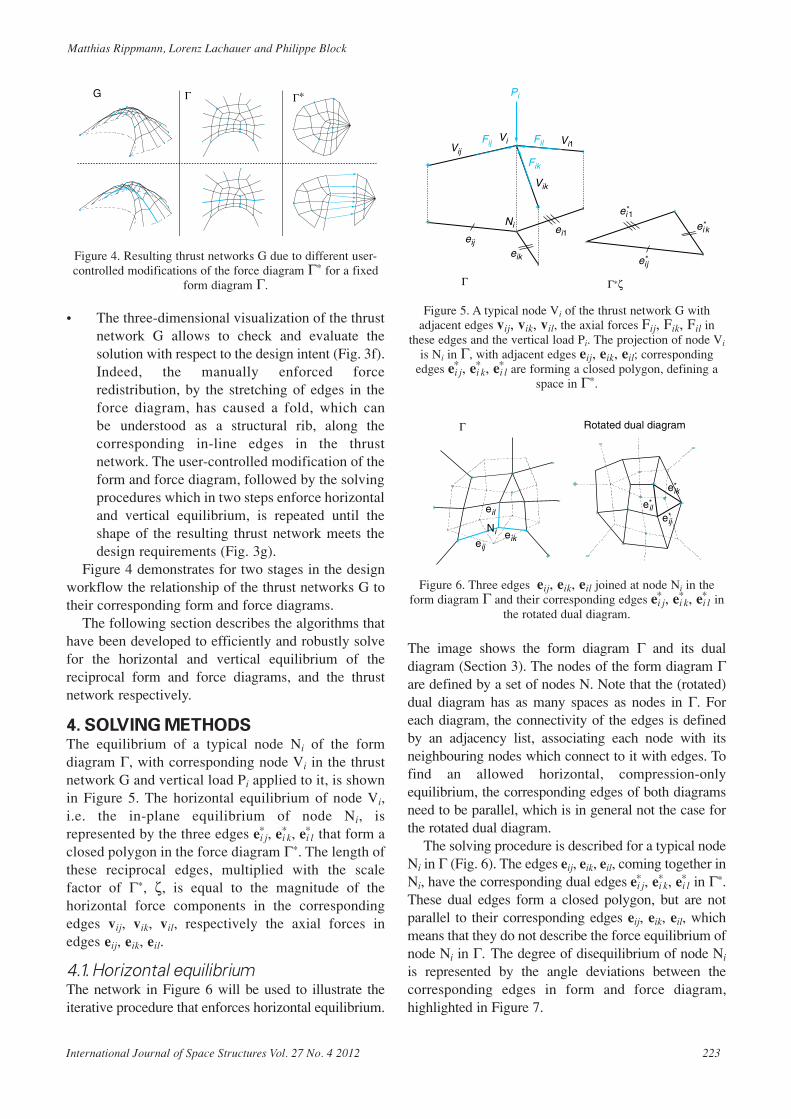
Figure 4 demonstrates for two stages in the designworkflow the relationship of the thrust networks G totheir corresponding form and force diagrams.
The following section describes the algorithms thathave been developed to efficiently and robustly solvefor the horizontal and vertical equilibrium of thereciprocal form and force diagrams, and the thrustnetwork respectively.
4. SOLVING METHODSThe equilibrium of a typical node Ni of the formdiagram Γ, with corresponding node Vi in the thrustnetwork G and vertical load Pi applied to it, is shownin Figure 5. The horizontal equilibrium of node Vi,i.e. the in-plane equilibrium of node Ni, isrepresented by the three edges ei j
* , ei k* , ei l
* that form aclosed polygon in the force diagram Γ∗. The length ofthese reciprocal edges, multiplied with the scalefactor of Γ∗, ζ, is equal to the magnitude of thehorizontal force components in the correspondingedges vij, vik, vil, respectively the axial forces inedges eij, eik, eil.
4.1. Horizontal equilibriumThe network in Figure 6 will be used to illustrate theiterative procedure that enforces horizontal equilibrium.
The image shows the form diagram Γ and its dualdiagram (Section 3). The nodes of the form diagram Γare defined by a set of nodes N. Note that the (rotated)dual diagram has as many spaces as nodes in Γ. Foreach diagram, the connectivity of the edges is definedby an adjacency list, associating each node with itsneighbouring nodes which connect to it with edges. Tofind an allowed horizontal, compression-onlyequilibrium, the corresponding edges of both diagramsneed to be parallel, which is in general not the case forthe rotated dual diagram.
The solving procedure is described for a typical nodeNi in Γ (Fig. 6). The edges eij, eik, eil, coming together inNi, have the corresponding dual edges ei j
* , ei k* , ei l
* in Γ∗.These dual edges form a closed polygon, but are notparallel to their corresponding edges eij, eik, eil, whichmeans that they do not describe the force equilibrium ofnode Ni in Γ. The degree of disequilibrium of node Ni
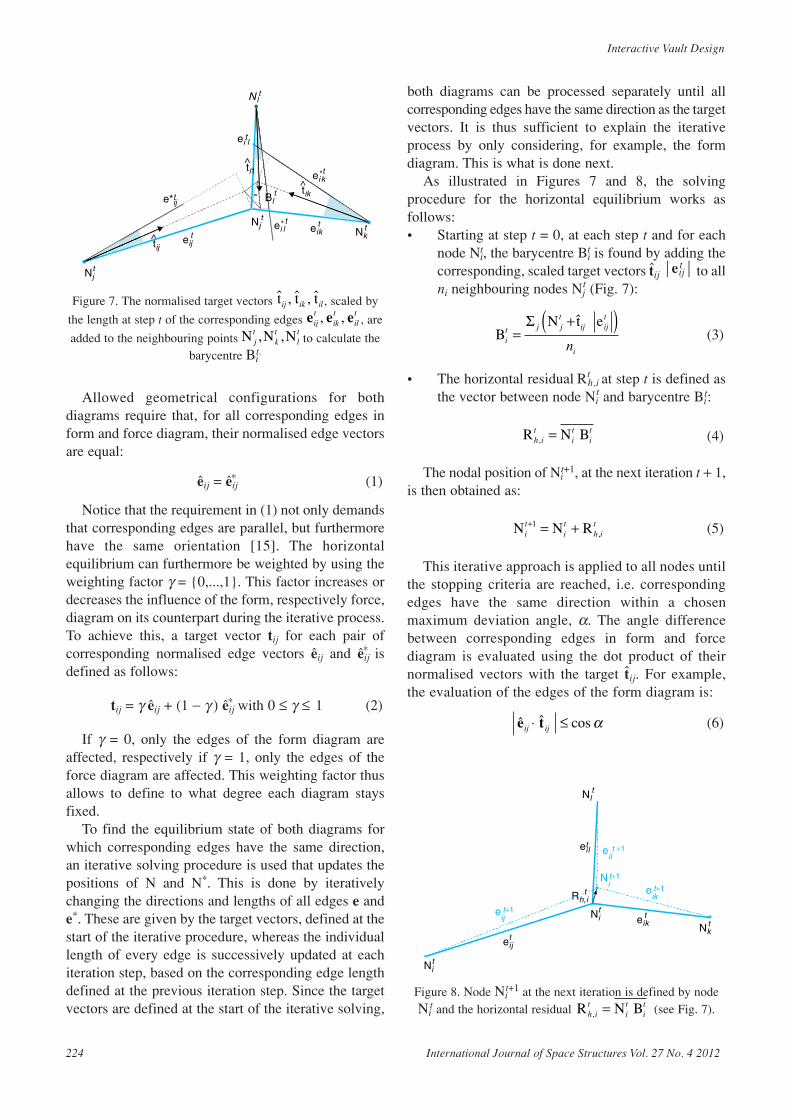
is represented by the angle deviations between thecorresponding edges in form and force diagram,highlighted in Figure 7.
G Γ∗Γ
Figure 4. Resulting thrust networks G due to different user-controlled modifications of the force diagram Γ∗ for a fixed
form diagram Γ.
VijFij Fil
Fik
Pi
Vi Vi1
Vik
Ni
eij
ei*j
eik
ei*kei1
ei*1
Γ∗ζΓ
Figure 5. A typical node Vi of the thrust network G withadjacent edges vij, vik, vil, the axial forces Fij, Fik, Fil in
these edges and the vertical load Pi. The projection of node Vi
is Ni in Γ, with adjacent edges eij, eik, eil; correspondingedges ei j
* , ei k* , ei l
* are forming a closed polygon, defining aspace in Γ∗.
Rotated dual diagram
eij
e*ij
eik
e*ik
eile*
il
Γ
Ni
Figure 6. Three edges eij, eik, eil joined at node Ni in theform diagram Γ and their corresponding edges ei j
* , ei k* , ei l
* inthe rotated dual diagram.
224 International Journal of Space Structures Vol. 27 No. 4 2012
Interactive Vault Design
Allowed geometrical configurations for bothdiagrams require that, for all corresponding edges inform and force diagram, their normalised edge vectorsare equal:
êij = êij* (1)
Notice that the requirement in (1) not only demandsthat corresponding edges are parallel, but furthermorehave the same orientation [15]. The horizontalequilibrium can furthermore be weighted by using theweighting factor γ = {0,...,1}. This factor increases ordecreases the influence of the form, respectively force,diagram on its counterpart during the iterative process.To achieve this, a target vector tij for each pair ofcorresponding normalised edge vectors êij and êij
* isdefined as follows:
tij = γ êij + (1 − γ ) êij* with 0 ≤ γ ≤ 1 (2)
If γ = 0, only the edges of the form diagram areaffected, respectively if γ = 1, only the edges of theforce diagram are affected. This weighting factor thusallows to define to what degree each diagram staysfixed.
To find the equilibrium state of both diagrams forwhich corresponding edges have the same direction,an iterative solving procedure is used that updates thepositions of N and N*. This is done by iterativelychanging the directions and lengths of all edges e ande*. These are given by the target vectors, defined at thestart of the iterative procedure, whereas the individuallength of every edge is successively updated at eachiteration step, based on the corresponding edge lengthdefined at the previous iteration step. Since the targetvectors are defined at the start of the iterative solving,
both diagrams can be processed separately until allcorresponding edges have the same direction as the targetvectors. It is thus sufficient to explain the iterativeprocess by only considering, for example, the formdiagram. This is what is done next.
As illustrated in Figures 7 and 8, the solvingprocedure for the horizontal equilibrium works asfollows:• Starting at step t = 0, at each step t and for each
node Nti, the barycentre Bi
t is found by adding thecorresponding, scaled target vectors t̂ij e t
ij to allni neighbouring nodes Nj
t (Fig. 7):
(3)
• The horizontal residual Rh,it at step t is defined as
the vector between node Nit and barycentre Bi
t:
(4)
The nodal position of Nit+1, at the next iteration t + 1,
is then obtained as:
(5)
This iterative approach is applied to all nodes untilthe stopping criteria are reached, i.e. correspondingedges have the same direction within a chosenmaximum deviation angle, α. The angle differencebetween corresponding edges in form and forcediagram is evaluated using the dot product of theirnormalised vectors with the target t̂ij. For example,the evaluation of the edges of the form diagram is:
(6)ê tij ⋅ ≤ˆ cosij α
N N Rit
it
h it+ = +1
,
R N Bh it
it
it
, =
BN t e
it j j
tijt
in=
+( )Σ ˆij
Njt
Nkt
Njt
Blt
e*tij
ei*lt
eitjt̂ij
ei*kt
eitk
t̂ik
eitl
t̂i1
Nlt
Figure 7. The normalised target vectors , scaled by
the length at step t of the corresponding edges , are
added to the neighbouring points to calculate thebarycentre Bi
t.N N Nj
tkt
lt, ,
e e eijt
ikt
ilt, ,
ˆ , ˆ , ˆt t tij ik il
Nit
Rh,ti
Nkt
Njt
Nlt
eitj
eitk
eitl
eijt+1
eikt+1
eilt +1
Nit+1
Figure 8. Node Nit+1 at the next iteration is defined by node
Nit and the horizontal residual (see Fig. 7).R N Bh i
tit
it
, =
Matthias Rippmann, Lorenz Lachauer and Philippe Block
International Journal of Space Structures Vol. 27 No. 4 2012 225
A maximum deviation angle α can be used to allowa limited angle tolerance between corresponding edges,causing minor inaccuracies in the thrust network butminimizing the number of iterations, respectively thecalculation time (see Section 4.3). If the dot product inthe LHS of (6) renders a negative value though, thenthese edges have flipped, i.e. changed orientation,during the iterative solving. These would correspond tolocal occurrences of tension forces in the structure. Aspointed out in 2.2, indeed diagrams with non-overlapping, convex spaces are a necessary conditionfor compression-only thrust networks. The appearanceof flipping edges during the iterative solving istypically observed when very small edge lengths occurin the diagrams. To prevent this, additionally, the lengthof every edge is constrained to be larger than aminimum length, defined proportionally with respect tothe maximum lengths in the diagram.
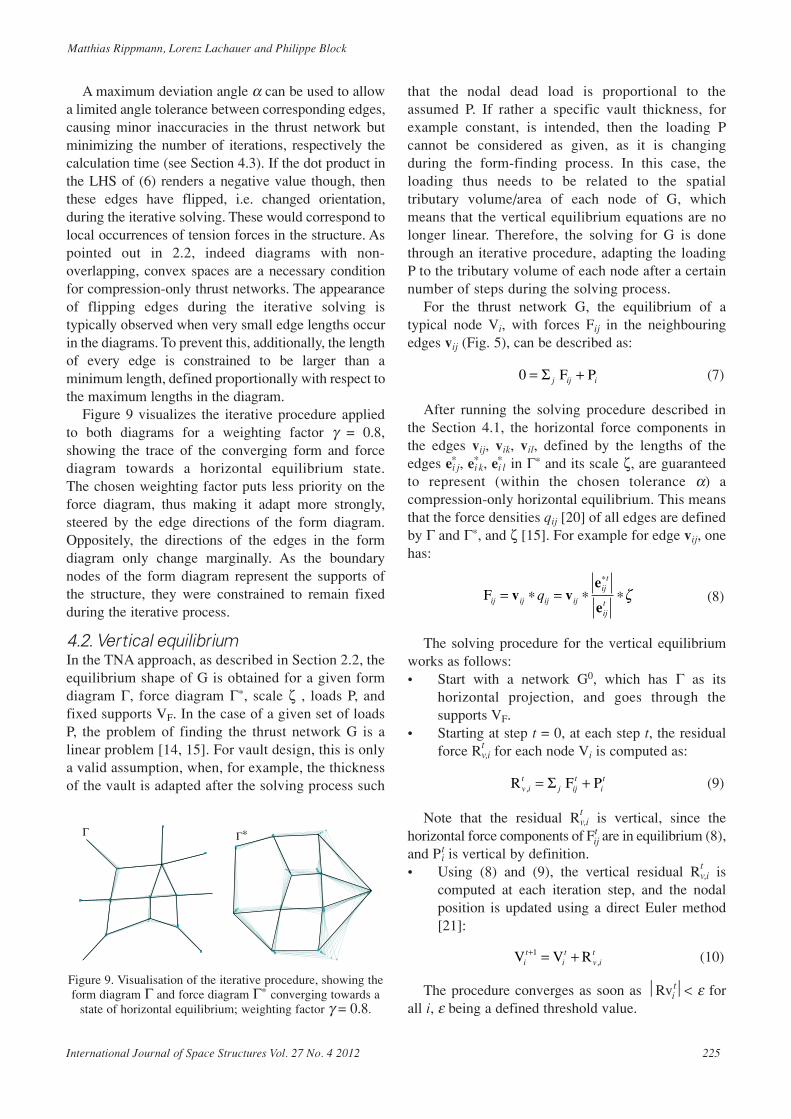
Figure 9 visualizes the iterative procedure appliedto both diagrams for a weighting factor γ = 0.8,showing the trace of the converging form and forcediagram towards a horizontal equilibrium state. The chosen weighting factor puts less priority on theforce diagram, thus making it adapt more strongly,steered by the edge directions of the form diagram.Oppositely, the directions of the edges in the formdiagram only change marginally. As the boundarynodes of the form diagram represent the supports ofthe structure, they were constrained to remain fixedduring the iterative process.
4.2. Vertical equilibriumIn the TNA approach, as described in Section 2.2, theequilibrium shape of G is obtained for a given formdiagram Γ, force diagram Γ∗, scale ζ , loads P, andfixed supports VF. In the case of a given set of loadsP, the problem of finding the thrust network G is alinear problem [14, 15]. For vault design, this is onlya valid assumption, when, for example, the thicknessof the vault is adapted after the solving process such
that the nodal dead load is proportional to theassumed P. If rather a specific vault thickness, forexample constant, is intended, then the loading Pcannot be considered as given, as it is changingduring the form-finding process. In this case, theloading thus needs to be related to the spatialtributary volume/area of each node of G, whichmeans that the vertical equilibrium equations are nolonger linear. Therefore, the solving for G is donethrough an iterative procedure, adapting the loadingP to the tributary volume of each node after a certainnumber of steps during the solving process.
For the thrust network G, the equilibrium of atypical node Vi, with forces Fij in the neighbouringedges vij (Fig. 5), can be described as:
(7)
After running the solving procedure described inthe Section 4.1, the horizontal force components inthe edges vij, vik, vil, defined by the lengths of theedges ei j
* , ei k* , ei l
* in Γ∗ and its scale ζ, are guaranteedto represent (within the chosen tolerance α) acompression-only horizontal equilibrium. This meansthat the force densities qij [20] of all edges are definedby Γ and Γ∗, and ζ [15]. For example for edge vij, onehas:
(8)
The solving procedure for the vertical equilibriumworks as follows:• Start with a network G0, which has Γ as its
horizontal projection, and goes through thesupports VF.
• Starting at step t = 0, at each step t, the residualforce Rt
v,i for each node Vi is computed as:
(9)
Note that the residual Rtv,i is vertical, since the
horizontal force components of Ftij are in equilibrium (8),
and Pti is vertical by definition.
• Using (8) and (9), the vertical residual Rtv,i is
computed at each iteration step, and the nodalposition is updated using a direct Euler method[21]:
(10)
The procedure converges as soon as Rvti< ε for
all i, ε being a defined threshold value.
V V Rit
it
it+ = +1v ,
R F Pv it
j ijt
it
, = +Σ
Fij ij ij ij
ijt
ijt
q= ∗ = ∗ ∗∗
v ve
eζ
0 = +Σ j ij iF P
Γ Γ∗
Figure 9. Visualisation of the iterative procedure, showing theform diagram Γ and force diagram Γ∗ converging towards a
state of horizontal equilibrium; weighting factor γ = 0.8.
226 International Journal of Space Structures Vol. 27 No. 4 2012
Interactive Vault Design
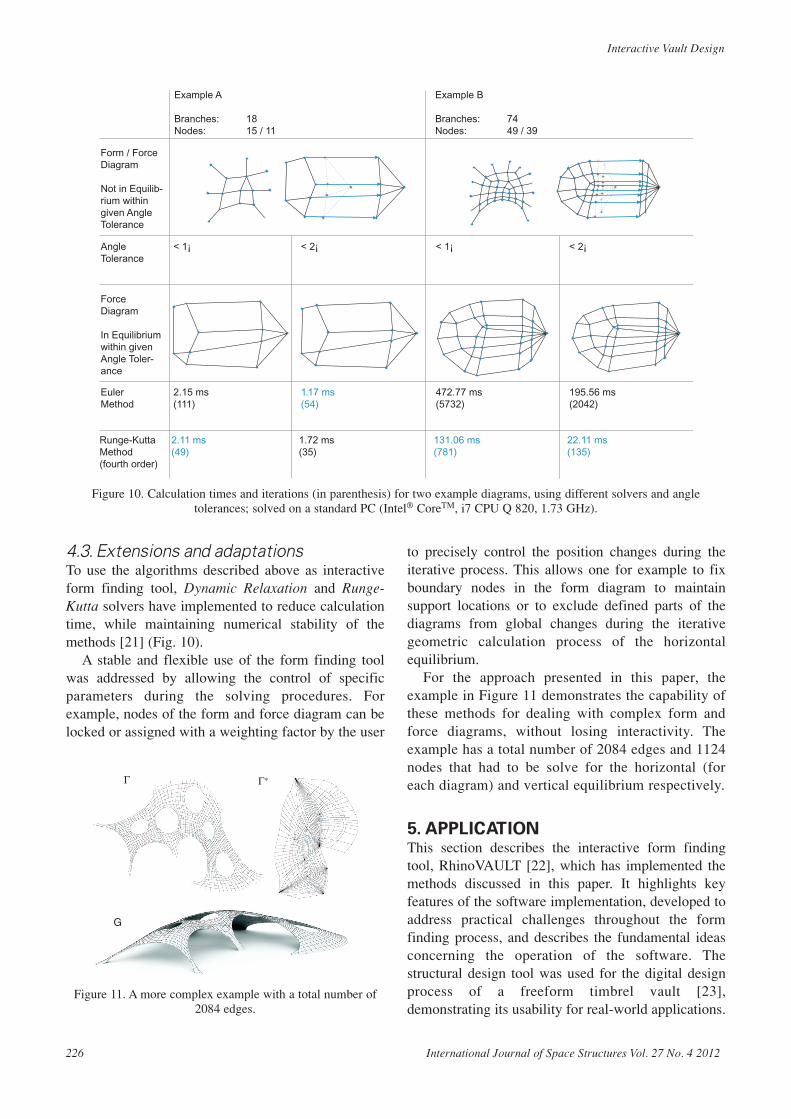
4.3. Extensions and adaptationsTo use the algorithms described above as interactiveform finding tool, Dynamic Relaxation and Runge-Kutta solvers have implemented to reduce calculationtime, while maintaining numerical stability of themethods [21] (Fig. 10).
A stable and flexible use of the form finding toolwas addressed by allowing the control of specificparameters during the solving procedures. Forexample, nodes of the form and force diagram can belocked or assigned with a weighting factor by the user
to precisely control the position changes during theiterative process. This allows one for example to fixboundary nodes in the form diagram to maintainsupport locations or to exclude defined parts of thediagrams from global changes during the iterativegeometric calculation process of the horizontalequilibrium.
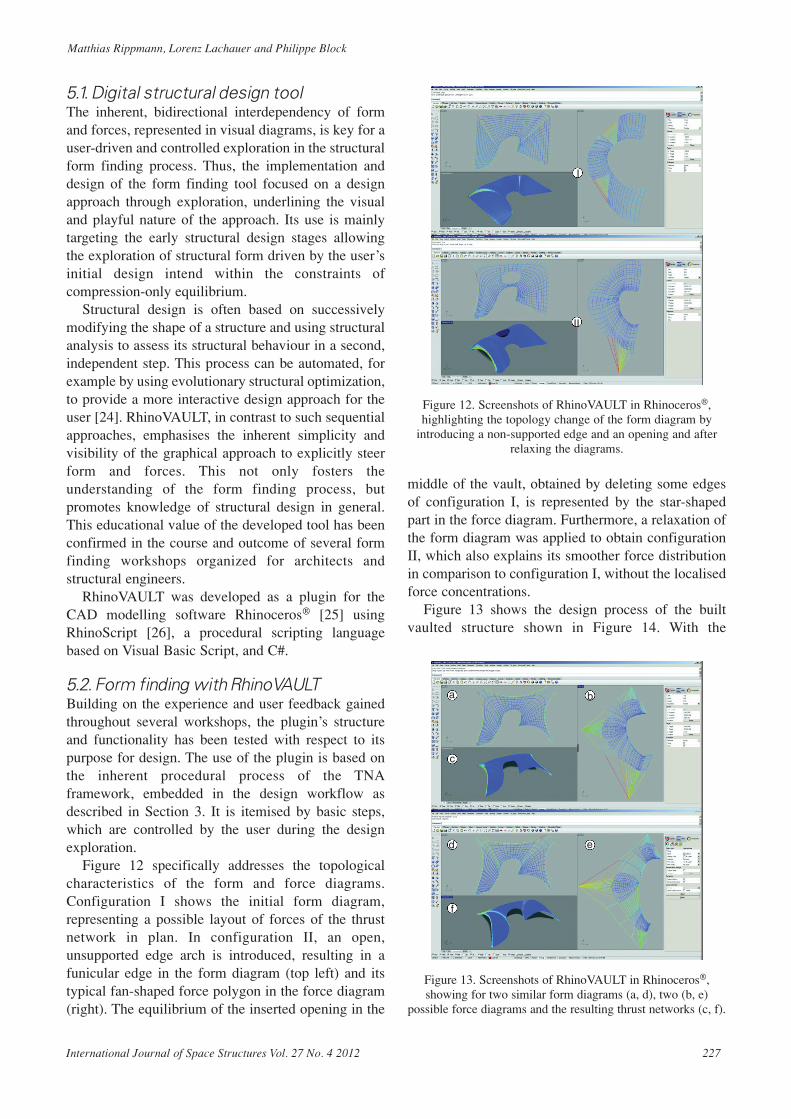
For the approach presented in this paper, theexample in Figure 11 demonstrates the capability ofthese methods for dealing with complex form andforce diagrams, without losing interactivity. Theexample has a total number of 2084 edges and 1124nodes that had to be solve for the horizontal (foreach diagram) and vertical equilibrium respectively.
5. APPLICATIONThis section describes the interactive form findingtool, RhinoVAULT [22], which has implemented themethods discussed in this paper. It highlights keyfeatures of the software implementation, developed toaddress practical challenges throughout the formfinding process, and describes the fundamental ideasconcerning the operation of the software. Thestructural design tool was used for the digital designprocess of a freeform timbrel vault [23],demonstrating its usability for real-world applications.
Example A
Branches: 18 Nodes: 15 / 11
Example B
Branches: 74 Nodes: 49 / 39
Form / ForceDiagram
Not in Equilib-rium within given Angle Tolerance
ForceDiagram
In Equilibrium within givenAngle Toler-ance
Angle Tolerance
Euler Method
¡2 <¡1 <¡2 <¡1 <
2.15 ms (111)
1.17 ms(54)
472.77 ms(5732)
195.56 ms(2042)
Runge-KuttaMethod (fourth order)
2.11 ms (49)
1.72 ms(35)
131.06 ms(781)
22.11 ms(135)
Γ Γ∗
G
Figure 10. Calculation times and iterations (in parenthesis) for two example diagrams, using different solvers and angletolerances; solved on a standard PC (Intel® CoreTM, i7 CPU Q 820, 1.73 GHz).
Figure 11. A more complex example with a total number of2084 edges.
Matthias Rippmann, Lorenz Lachauer and Philippe Block
International Journal of Space Structures Vol. 27 No. 4 2012 227
5.1. Digital structural design toolThe inherent, bidirectional interdependency of formand forces, represented in visual diagrams, is key for auser-driven and controlled exploration in the structuralform finding process. Thus, the implementation anddesign of the form finding tool focused on a designapproach through exploration, underlining the visualand playful nature of the approach. Its use is mainlytargeting the early structural design stages allowingthe exploration of structural form driven by the user’sinitial design intend within the constraints ofcompression-only equilibrium.
Structural design is often based on successivelymodifying the shape of a structure and using structuralanalysis to assess its structural behaviour in a second,independent step. This process can be automated, forexample by using evolutionary structural optimization,to provide a more interactive design approach for theuser [24]. RhinoVAULT, in contrast to such sequentialapproaches, emphasises the inherent simplicity andvisibility of the graphical approach to explicitly steerform and forces. This not only fosters theunderstanding of the form finding process, butpromotes knowledge of structural design in general.This educational value of the developed tool has beenconfirmed in the course and outcome of several formfinding workshops organized for architects andstructural engineers.
RhinoVAULT was developed as a plugin for theCAD modelling software Rhinoceros® [25] usingRhinoScript [26], a procedural scripting languagebased on Visual Basic Script, and C#.
5.2. Form finding with RhinoVAULTBuilding on the experience and user feedback gainedthroughout several workshops, the plugin’s structureand functionality has been tested with respect to itspurpose for design. The use of the plugin is based onthe inherent procedural process of the TNAframework, embedded in the design workflow asdescribed in Section 3. It is itemised by basic steps,which are controlled by the user during the designexploration.
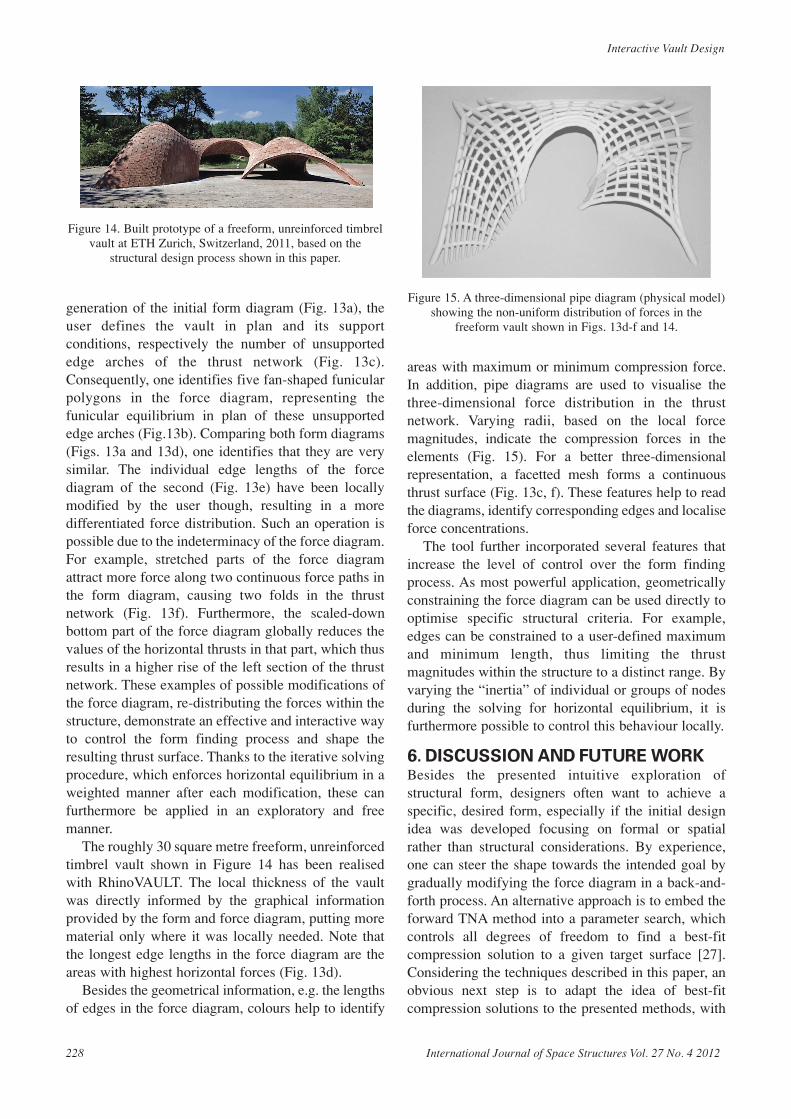
Figure 12 specifically addresses the topologicalcharacteristics of the form and force diagrams.Configuration I shows the initial form diagram,representing a possible layout of forces of the thrustnetwork in plan. In configuration II, an open,unsupported edge arch is introduced, resulting in afunicular edge in the form diagram (top left) and itstypical fan-shaped force polygon in the force diagram(right). The equilibrium of the inserted opening in the
middle of the vault, obtained by deleting some edgesof configuration I, is represented by the star-shapedpart in the force diagram. Furthermore, a relaxation ofthe form diagram was applied to obtain configurationII, which also explains its smoother force distributionin comparison to configuration I, without the localisedforce concentrations.
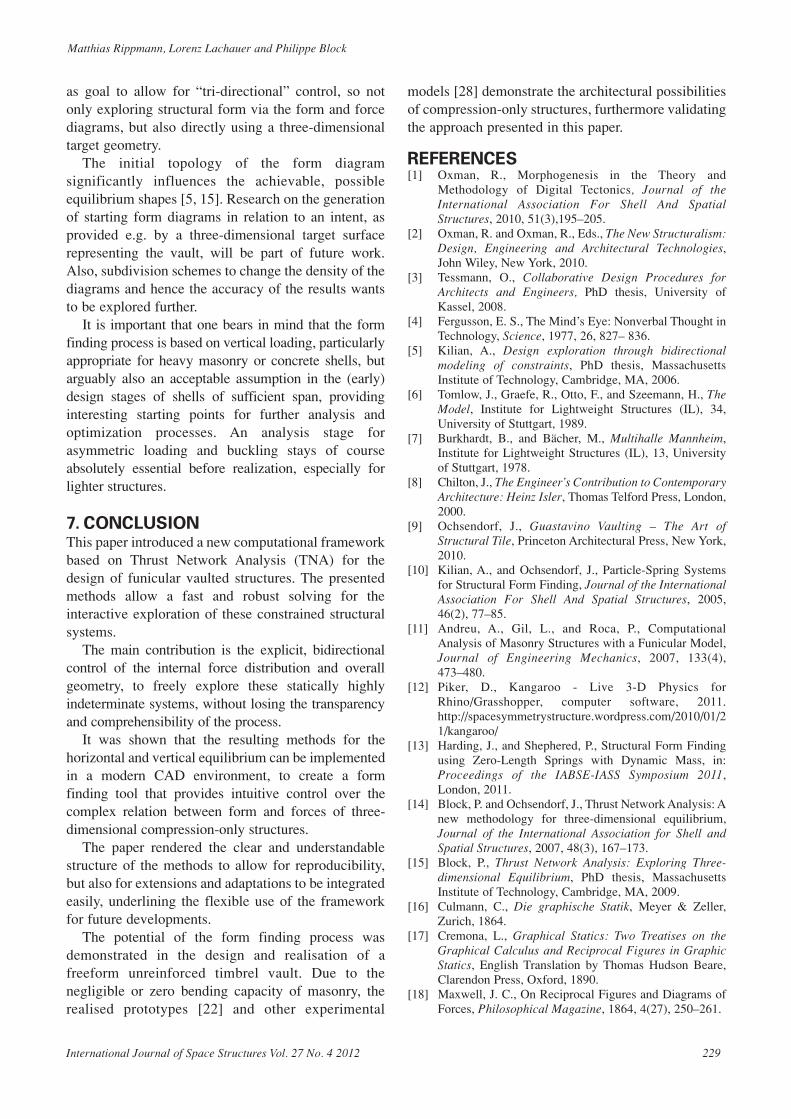
Figure 13 shows the design process of the builtvaulted structure shown in Figure 14. With the
I
II
Figure 12. Screenshots of RhinoVAULT in Rhinoceros®,highlighting the topology change of the form diagram by
introducing a non-supported edge and an opening and afterrelaxing the diagrams.
I
a b
c
d e
f
Figure 13. Screenshots of RhinoVAULT in Rhinoceros®,showing for two similar form diagrams (a, d), two (b, e)
possible force diagrams and the resulting thrust networks (c, f).
228 International Journal of Space Structures Vol. 27 No. 4 2012
Interactive Vault Design
generation of the initial form diagram (Fig. 13a), theuser defines the vault in plan and its supportconditions, respectively the number of unsupportededge arches of the thrust network (Fig. 13c).Consequently, one identifies five fan-shaped funicularpolygons in the force diagram, representing thefunicular equilibrium in plan of these unsupportededge arches (Fig.13b). Comparing both form diagrams(Figs. 13a and 13d), one identifies that they are verysimilar. The individual edge lengths of the forcediagram of the second (Fig. 13e) have been locallymodified by the user though, resulting in a moredifferentiated force distribution. Such an operation ispossible due to the indeterminacy of the force diagram.For example, stretched parts of the force diagramattract more force along two continuous force paths inthe form diagram, causing two folds in the thrustnetwork (Fig. 13f). Furthermore, the scaled-downbottom part of the force diagram globally reduces thevalues of the horizontal thrusts in that part, which thusresults in a higher rise of the left section of the thrustnetwork. These examples of possible modifications ofthe force diagram, re-distributing the forces within thestructure, demonstrate an effective and interactive wayto control the form finding process and shape theresulting thrust surface. Thanks to the iterative solvingprocedure, which enforces horizontal equilibrium in aweighted manner after each modification, these canfurthermore be applied in an exploratory and freemanner.
The roughly 30 square metre freeform, unreinforcedtimbrel vault shown in Figure 14 has been realisedwith RhinoVAULT. The local thickness of the vaultwas directly informed by the graphical informationprovided by the form and force diagram, putting morematerial only where it was locally needed. Note thatthe longest edge lengths in the force diagram are theareas with highest horizontal forces (Fig. 13d).
Besides the geometrical information, e.g. the lengthsof edges in the force diagram, colours help to identify
areas with maximum or minimum compression force.In addition, pipe diagrams are used to visualise thethree-dimensional force distribution in the thrustnetwork. Varying radii, based on the local forcemagnitudes, indicate the compression forces in theelements (Fig. 15). For a better three-dimensionalrepresentation, a facetted mesh forms a continuousthrust surface (Fig. 13c, f). These features help to readthe diagrams, identify corresponding edges and localiseforce concentrations.
The tool further incorporated several features thatincrease the level of control over the form findingprocess. As most powerful application, geometricallyconstraining the force diagram can be used directly tooptimise specific structural criteria. For example,edges can be constrained to a user-defined maximumand minimum length, thus limiting the thrustmagnitudes within the structure to a distinct range. Byvarying the “inertia” of individual or groups of nodesduring the solving for horizontal equilibrium, it isfurthermore possible to control this behaviour locally.
6. DISCUSSION AND FUTURE WORKBesides the presented intuitive exploration ofstructural form, designers often want to achieve aspecific, desired form, especially if the initial designidea was developed focusing on formal or spatialrather than structural considerations. By experience,one can steer the shape towards the intended goal bygradually modifying the force diagram in a back-and-forth process. An alternative approach is to embed theforward TNA method into a parameter search, whichcontrols all degrees of freedom to find a best-fitcompression solution to a given target surface [27].Considering the techniques described in this paper, anobvious next step is to adapt the idea of best-fitcompression solutions to the presented methods, with
Figure 14. Built prototype of a freeform, unreinforced timbrelvault at ETH Zurich, Switzerland, 2011, based on the
structural design process shown in this paper.
Figure 15. A three-dimensional pipe diagram (physical model)showing the non-uniform distribution of forces in the
freeform vault shown in Figs. 13d-f and 14.
Matthias Rippmann, Lorenz Lachauer and Philippe Block
International Journal of Space Structures Vol. 27 No. 4 2012 229
as goal to allow for “tri-directional” control, so notonly exploring structural form via the form and forcediagrams, but also directly using a three-dimensionaltarget geometry.
The initial topology of the form diagramsignificantly influences the achievable, possibleequilibrium shapes [5, 15]. Research on the generationof starting form diagrams in relation to an intent, asprovided e.g. by a three-dimensional target surfacerepresenting the vault, will be part of future work.Also, subdivision schemes to change the density of thediagrams and hence the accuracy of the results wantsto be explored further.
It is important that one bears in mind that the formfinding process is based on vertical loading, particularlyappropriate for heavy masonry or concrete shells, butarguably also an acceptable assumption in the (early)design stages of shells of sufficient span, providinginteresting starting points for further analysis andoptimization processes. An analysis stage forasymmetric loading and buckling stays of courseabsolutely essential before realization, especially forlighter structures.
7. CONCLUSIONThis paper introduced a new computational frameworkbased on Thrust Network Analysis (TNA) for thedesign of funicular vaulted structures. The presentedmethods allow a fast and robust solving for theinteractive exploration of these constrained structuralsystems.
The main contribution is the explicit, bidirectionalcontrol of the internal force distribution and overallgeometry, to freely explore these statically highlyindeterminate systems, without losing the transparencyand comprehensibility of the process.
It was shown that the resulting methods for thehorizontal and vertical equilibrium can be implementedin a modern CAD environment, to create a formfinding tool that provides intuitive control over thecomplex relation between form and forces of three-dimensional compression-only structures.
The paper rendered the clear and understandablestructure of the methods to allow for reproducibility,but also for extensions and adaptations to be integratedeasily, underlining the flexible use of the frameworkfor future developments.
The potential of the form finding process wasdemonstrated in the design and realisation of afreeform unreinforced timbrel vault. Due to thenegligible or zero bending capacity of masonry, therealised prototypes [22] and other experimental
models [28] demonstrate the architectural possibilitiesof compression-only structures, furthermore validatingthe approach presented in this paper.
REFERENCES[1] Oxman, R., Morphogenesis in the Theory and
Methodology of Digital Tectonics, Journal of theInternational Association For Shell And SpatialStructures, 2010, 51(3),195–205.
[2] Oxman, R. and Oxman, R., Eds., The New Structuralism:Design, Engineering and Architectural Technologies,John Wiley, New York, 2010.
[3] Tessmann, O., Collaborative Design Procedures forArchitects and Engineers, PhD thesis, University ofKassel, 2008.
[4] Fergusson, E. S., The Mind’s Eye: Nonverbal Thought inTechnology, Science, 1977, 26, 827– 836.
[5] Kilian, A., Design exploration through bidirectionalmodeling of constraints, PhD thesis, MassachusettsInstitute of Technology, Cambridge, MA, 2006.
[6] Tomlow, J., Graefe, R., Otto, F., and Szeemann, H., TheModel, Institute for Lightweight Structures (IL), 34,University of Stuttgart, 1989.
[7] Burkhardt, B., and Bächer, M., Multihalle Mannheim,Institute for Lightweight Structures (IL), 13, Universityof Stuttgart, 1978.
[8] Chilton, J., The Engineer’s Contribution to ContemporaryArchitecture: Heinz Isler, Thomas Telford Press, London,2000.
[9] Ochsendorf, J., Guastavino Vaulting – The Art ofStructural Tile, Princeton Architectural Press, New York,2010.
[10] Kilian, A., and Ochsendorf, J., Particle-Spring Systemsfor Structural Form Finding, Journal of the InternationalAssociation For Shell And Spatial Structures, 2005,46(2), 77–85.
[11] Andreu, A., Gil, L., and Roca, P., ComputationalAnalysis of Masonry Structures with a Funicular Model,Journal of Engineering Mechanics, 2007, 133(4),473–480.
[12] Piker, D., Kangaroo - Live 3-D Physics forRhino/Grasshopper, computer software, 2011.http://spacesymmetrystructure.wordpress.com/2010/01/21/kangaroo/
[13] Harding, J., and Shephered, P., Structural Form Findingusing Zero-Length Springs with Dynamic Mass, in:Proceedings of the IABSE-IASS Symposium 2011,London, 2011.
[14] Block, P. and Ochsendorf, J., Thrust Network Analysis: Anew methodology for three-dimensional equilibrium,Journal of the International Association for Shell andSpatial Structures, 2007, 48(3), 167–173.
[15] Block, P., Thrust Network Analysis: Exploring Three-dimensional Equilibrium, PhD thesis, MassachusettsInstitute of Technology, Cambridge, MA, 2009.
[16] Culmann, C., Die graphische Statik, Meyer & Zeller,Zurich, 1864.
[17] Cremona, L., Graphical Statics: Two Treatises on theGraphical Calculus and Reciprocal Figures in GraphicStatics, English Translation by Thomas Hudson Beare,Clarendon Press, Oxford, 1890.
[18] Maxwell, J. C., On Reciprocal Figures and Diagrams ofForces, Philosophical Magazine, 1864, 4(27), 250–261.
230 International Journal of Space Structures Vol. 27 No. 4 2012
Interactive Vault Design
[19] Van Mele, T., Rippmann, M., Lachauer L., and Block, P.,Geometry-based Understanding of Structures, Journal ofthe International Association for Shell and SpatialStructures, 2012, in press.
[20] Schek, H.-J., The force density method for form findingand computation of general networks, ComputerMethods in Applied Mechanics and Engineering, 1974,3(1), 115–134.
[21] Veenendaal, D., and Block, P., An overview andcomparison of structural form finding methods forgeneral networks, International Journal of Solids andStructures, 2012, in press.
[22] Rippmann, M., Lachauer., L., and Block, P.,RhinoVAULT - Designing funicular form with Rhino,computer software, 2012. http://block.arch.ethz.ch/tools/rhinovault/
[23] Davis, L., Rippmann, M., Pawlofsky, T., and Block, P.,Innovative Funicular Tile Vaulting: A prototype
in Switzerland, The Structural Engineer, 2012, inpress.
[24] Preisinger, C., Diles, J., and Vierlinger, R., Karamba,Parametric Structural Modeling, computer software,2012. http://twl.uni-ak.ac.at/karamba/
[25] McNeel, R., Rhinoceros: NURBS modeling for Windows, computer software, 2011. http://www.rhino3d.com/
[26] Rutten, D., RhinoScript 101 for Rhinoceros 4.0, RobertMcNeel Associates, 2007.
[27] Block, P., and Lachauer, L., Closest-Fit, Compression-Only Solutions for Free Form Shells, in: Proceedings ofthe IABSE-IASS Symposium 2011, London, 2011.
[28] Block, P., Rippmann, M., and Lachauer, L., ValidatingThrust Network Analysis using 3D-printed, StructuralModels, in: Proceedings of International Association forShell and Spatial Structures Symposium 2010, Shanghai,China, 2010.