Embed Size (px)
Citation preview

61
INTRODUCTION 62
COMPLEXITY OF THE PATIENT POPULATION 64cardiovascular comorbidity · selected comorbidities
PRE-ESRD EPO USE & ANEMIAAT INITIATION 66pre-esrd epo use & hemoglobin at initiation ·geographic variations in pre-esrd epo use &hemoglobin at initiation
BIOCHEMICAL & PHYSICAL CHARACTERISTICS 68blood urea nitrogen · serum creatinine · estimatedglomerular filtration rate · body mass index
ESTIMATED GFRS & OUTCOMES 70gfr by charlson score · event curves for hospitaliza-tion & survival · percent survival
INSURANCE COVERAGEOF INCIDENT PATIENTS 72geographic variations in insurance coverage ·patient distribution by insurance coverage
SUMMARY 74
Chapter threePatient characteristics
...I have a duty to speak the truth as I see it and to
share not just my triumphs, not just the things that
felt good, but the pain, the intense, often unmitigating
pain. It is important to share how I know survival is
survival and not just a walk through the rain.
Audre Lorde, Black Women Writers at Work
3
chap
ter
62
20
03
a
nn
ua
l
da
ta
r
ep
or
t
P A T I E N T C H A R A C T E R I S T I C S
The complexity of the ESRD popu-lation has continued to evolve over the last two decades. In addition to dra-
matic changes in patient distribution by age, gender, and race, comorbid conditions have had an
increasingly profound impact on patient survival after the start of therapy. In 1980 diabetes was the cause of
ESRD in only 13.1 percent of new patients (see Reference Table A.1). Now, however, it is the primary diag-
nosis in 64 percent of Hispanic-Mexican patients, 55 percent of Hispanics of other origins, and 43 percent
of non-Hispanics. � Patient selection for ESRD treatment also began to alter dramatically when in 1982
the payment system for dialysis changed to a prospective system under the “Composite Rate.” In the next
decade the proportion of ESRD patients initiating dialysis with a primary diagnosis of diabetes increased
more than 2.5 times, to 33.7 percent. And in the 1990s this proportion increased by another one-third, to
44.3 percent. � The USRDS has been assessing the broader prevalence of diabetes not only as a primary
contributor to ESRD, but as a complicating condition. In the 2002 ADR, the chapter by the Cardiovascular
SSC evaluated the graded association between cardiovascular mortality and diabetes as a primary cause of
ESRD, diabetes as a secondary complicating condition, and diabetes documented from medical services one
year after the start of ESRD therapy. Understandably, patients with diabetes as a primary diagnosis have the
most widespread organ system disease and the lowest survival. Those with diabetes as a secondary condi-
tion have the next lowest survival, and survival is best in relatively new diabetes patients. This year we have
determined the total burden of diabetes—both primary and secondary—in patients who survive the first
year of ESRD therapy, finding it to be 80 percent in Native Americans, 73 percent in Hispanics, 61 percent
in Asians, 59 percent in blacks, and 58 percent in whites. Overall, 59 percent of new patients enter the pro-
gram with some form of diabetes, making the burden of the disease far greater than previously considered.
� Diabetic and non-diabetic patients carry other comorbid conditions as well, the occurrence of which has
evolved over time. In patients surviving the first year of therapy, for example, the proportion with cardio-
vascular comorbidity increased dramatically in the late 1980s; growth has since slowed, but rates are still
rising. There is also an increased number of patients entering therapy with cancer as a complicating diagno-
sis, most evident in patients with multiple myeloma (see Figure 2.31). These patients clearly add to the
CHAPTER HIGHLIGHTS � Figure 3.3 In 2000, 45 percent of diabetics and 37 percent of non-diabetics who survived one year on dialysis had cardio-
vascular comorbidity, compared to only 25 and 18 percent in 1984. � Figure 3.8 The mean hemoglobin at initiation rose from 9.2 g/dl in May 1995
to 10.0 g/dl in May 2002, a 9 percent increase, while the percent of patients using EPO in the pre-ESRD period grew from 22 to 32. � Figure 3.11 The
percent of patients initiating dialysis with a hemoglobin less than 11 g/dl decreased from 84 in May 1995 to 74 in May of 2002, a 12 percent reduc-
tion. Even more dramatically, the percent initiating with a hemoglobin level less than 10 g/dl fell from 68 to 53, a 22 percent reduction over the
seven-year period.

63
1995 1996 1997 1998 1999 2000 2001 2002
Perc
ent o
f pat
ient
s
40
50
60
70
80
90
All
Native American
White Black
Asian Hispanic
Percent of patients0 20 40 60 80 100
Hispanic-Mexican
Hispanic-other
Non-Hispanic
Diabetes
Hypertension
Glomerulonephritis
Cystic kidney
Other/unknown
3.1 · Primary diagnosis of new ESRD patients at initiation, by Hispanic ethnicityincident ESRD patients, 1998–2002 combined; data from Medical Evidence form.
complexity of the population under ESRD treatment. Information
on the Medical Evidence form allows us to assess some of the care pro-
vided to chronic kidney disease patients prior to ESRD. Only thirty-two
percent of new ESRD patients, for example, receive EPO treatment be-
fore beginning therapy. And while mean hemoglobins at initiation rose
overall from 9.2 g/dl in May 1995 to 10 g/dl in June 2002, these levels
are still well below the minimum target set by the National Kidney
Foundation’s K/DOQI guidelines of 11 g/dl. The lowest hemoglobin
levels continue to occur in children and in blacks. Serum creatinine
levels at initiation are declining, while estimated glomerular filtration
rates (eGFRs) are increasing—indicating, perhaps, that patients are
beginning ESRD therapy earlier in the course of their chronic kidney
disease. We have assessed the association between eGFR and incident
patient comorbidity, and found a direct relationship which suggests
that this earlier initiation of therapy may be due to increased comorbidity, with conditions such as fluid
overload and congestive heart failure amplifying the need for renal replacement therapy. Based on these
findings, eGFR at initiation appears to reflect severity of disease. Because risks of mortality and hospitaliza-
tion are greater for those with high eGFR levels at the start of therapy, these clinical associations complicate
any interpretation of earlier dialysis initiation. Additionally, there are emerging concerns over the accu-
racy of the estimating equation from the Modification of Diet in Renal Disease Trial (MDRD). Severely
malnourished patients with marked loss of muscle mass may appear to have lower serum creatinines and
higher eGFRs, which would in turn be associated with a lower survival. Additional research is needed to
validate this formula in patients with severe renal failure to determine the best method of assessing residual
renal function. Insurance coverage of the incident population may have important implications for the
delivery of care in both the pre-ESRD period and the early months of dialysis. The greatest proportion of
patients with no coverage at the start of therapy occurs among blacks, followed by Hispanics and Asians. At
initiation, almost 60 percent of ESRD patients are covered by Medicare, Medicaid, or a combination of
both. These dual-eligible patients, many of whom live in the southern states, may be particularly vulnerable
to cutbacks in Medicaid payments, particularly for prescription drugs. They may also be disproportionately
affected by shortfalls in the 2003 state budgets. The composition of the incident ESRD population con-
tinues to change, placing increasing demands on the provider care system. This complexity affects not only
the individual patients, but also the insurance coverage needed to pay for their care. In future USRDS stud-
ies we will focus on the degree of insurance coverage and how it influences care and associated outcomes.
3.2 · Incident pts with primary & secondary diabetes, by race/ethnicityincident ESRD patients with a first ESRD service date betweenMay 1995 & June 2002, surviving one year plus 90 days; diabetesdetermined from inpatient claims for diabetes within one year +90 days of first service date, or indicated on the Medical Evidenceform as a primary diagnosis or comorbid condition.

3
chap
ter
64 P A T I E N T C H A R A C T E R I S T I C S
1984 1986 1988 1990 1992 1994 1996 1998 2000
Pe
rce
nt
of
pa
tie
nts
ho
spit
aliz
ed
Pe
rce
nt
of
pa
tie
nts
wit
h c
om
orb
idit
y
0
10
20
30
40
50
1984 1986 1988 1990 1992 1994 1996 1998 2000
Diabetics Non-diabetics
CHF
ISHD
PVD
ISHD
PVD
All CV disease All CV disease
CHF
0
10
20
30
40
50
60
White
Black
Native American
Asian
Hispanic
All
All cardiovascular disease Congestive heart failure
1995 1996 1997 1998 1999 2000 2001 2002 1995 1996 1997 1998 1999 2000 2001 20020
10
20
30
40Ischemic heart disease Peripheral vascular disease
Complexity of thepatient populationBecause comorbid conditions were not included on the Medical
Evidence form until its revision in 1995, it is difficult to assess
long-term trends in the comorbidity of patients beginning ESRD
therapy. We are able, however, to use inpatient hospitalization
records to track cardiovascular complications since 1984. In dia-
betic patients surviving at least one year after the start of ESRD,
the percent of patients hospitalized with cardiovascular disease
increased 25 percent between 1990 and 2000; for congestive
heart failure, ischemic heart disease, and peripheral vascular
disease, growth was approximately 50 percent (Figure 3.3). The
3.3 · Cardiovascular comorbidity in incident patients who survive one year following ESRD initiation; from REBUS inpatient diagnosis codes
3.4 · Cardiovascular comorbidity at initiation, by race/ethnicity; from the Medical Evidence form
20
03
a
nn
ua
l
da
ta
r
ep
or
t
percent of non-diabetics hospitalized with cardiovascular disease
increased 17 percent overall. Between 1996 and 2000, however,
rates for both patient cohorts leveled off.
Since 1995, the proportion of new ESRD patients with a cardio-
vascular comorbidity reported on the Medical Evidence form
increased from 48.6 to 50.6 percent of the population (Figure
3.4). The amount of congestive heart failure was generally steady
across racial and ethnic categories, while that of peripheral vascu-
lar disease decreased in most populations—1.4 percent overall,
and 14.5 percent among Asians. Rates of ischemic heart disease
increased 15.9 percent overall, and nearly 22 percent in blacks.
The greatest changes, however, occurred among Native Ameri-
cans. Between 1995 and 2002 the proportion of these patients
65
0
1
2
3
4
5
6
7
8White
Black
Native American
Asian
Hispanic
All
Cancer Alcohol dependence
Smoking Chronic obstructive pulmonary disease
Pe
rce
nt
of
pa
tie
nts
wit
h c
om
orb
idit
y
0
2
4
6
8
10
1995 1996 1997 1998 1999 2000 2001 20020
1
2
3
4
5
6
1995 1996 1997 1998 1999 2000 2001 20020.0
0.5
1.0
1.5
2.0
2.5Inability to ambulate Inability to transfer
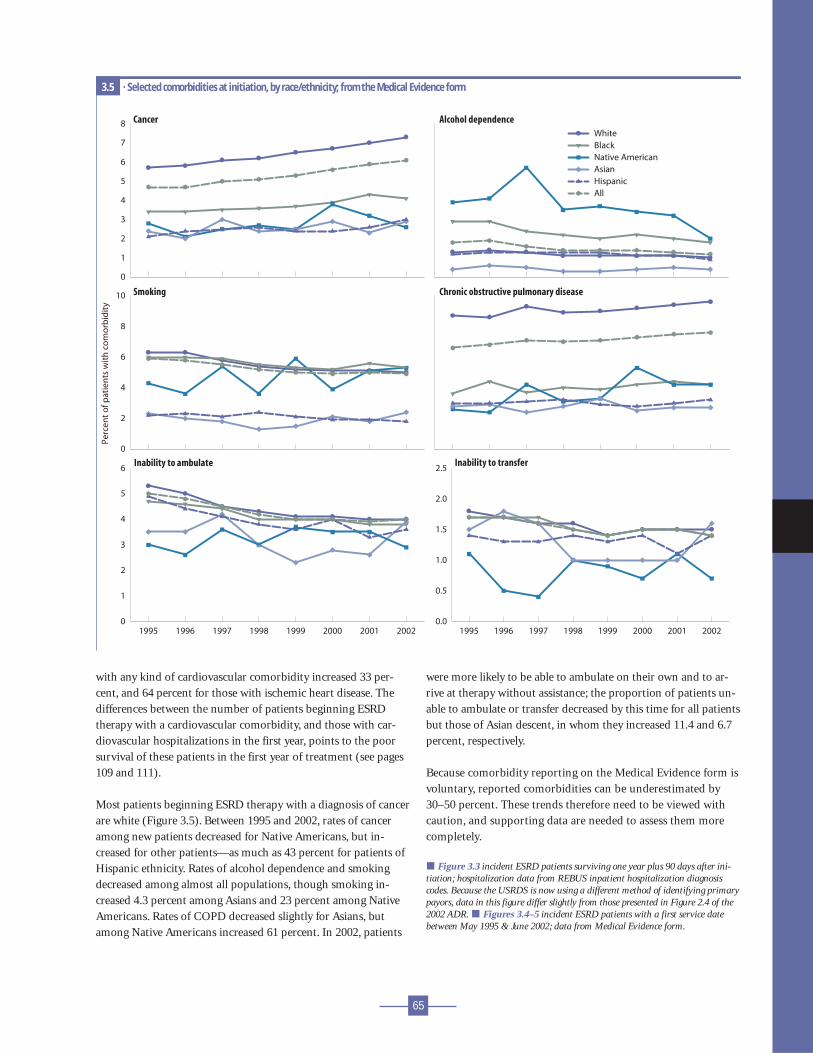
3.5 · Selected comorbidities at initiation, by race/ethnicity; from the Medical Evidence form
with any kind of cardiovascular comorbidity increased 33 per-
cent, and 64 percent for those with ischemic heart disease. The
differences between the number of patients beginning ESRD
therapy with a cardiovascular comorbidity, and those with car-
diovascular hospitalizations in the first year, points to the poor
survival of these patients in the first year of treatment (see pages
109 and 111).
Most patients beginning ESRD therapy with a diagnosis of cancer
are white (Figure 3.5). Between 1995 and 2002, rates of cancer
among new patients decreased for Native Americans, but in-
creased for other patients—as much as 43 percent for patients of
Hispanic ethnicity. Rates of alcohol dependence and smoking
decreased among almost all populations, though smoking in-
creased 4.3 percent among Asians and 23 percent among Native
Americans. Rates of COPD decreased slightly for Asians, but
among Native Americans increased 61 percent. In 2002, patients
were more likely to be able to ambulate on their own and to ar-
rive at therapy without assistance; the proportion of patients un-
able to ambulate or transfer decreased by this time for all patients
but those of Asian descent, in whom they increased 11.4 and 6.7
percent, respectively.
Because comorbidity reporting on the Medical Evidence form is
voluntary, reported comorbidities can be underestimated by
30–50 percent. These trends therefore need to be viewed with
caution, and supporting data are needed to assess them more
completely.
� Figure 3.3 incident ESRD patients surviving one year plus 90 days after ini-tiation; hospitalization data from REBUS inpatient hospitalization diagnosiscodes. Because the USRDS is now using a different method of identifying primarypayors, data in this figure differ slightly from those presented in Figure 2.4 of the2002 ADR. � Figures 3.4–5 incident ESRD patients with a first service datebetween May 1995 & June 2002; data from Medical Evidence form.

3
chap
ter
66
20
03
a
nn
ua
l
da
ta
r
ep
or
t
P A T I E N T C H A R A C T E R I S T I C S
All White Black N Am Asian Hispanic
Pe
rce
nt
of
pa
tie
nts
re
ceiv
ing
EP
O
0
10
20
30
40
50
All White Black N Am Asian Hispanic
Male Female
1996 1997 1998 1999 2000 2001 2002
He
mo
glo
bin
(g
/dl)
9.0
9.2
9.4
9.6
9.8
10.0
10.2
10.4
Pe
rce
nt
rece
ivin
g E
PO
20
22
24
26
28
30
32
34
Hgb:with EPO
Hgb: without EPO Hgb: overall
% receiving EPO
All 0-19 20-44 45-64 65-74 75+
Pe
rce
nt
of
pa
tie
nts
re
ceiv
ing
EP
O
0
10
20
30
40
50
All 0-19 20-44 45-64 65-74 75+
Male Female
36.8 (43.5)31.5 to <36.827.6 to <31.523.9 to <27.6below 23.9 (20.5)
36.8 (43.5)31.5 to <36.827.6 to <31.523.9 to <27.6below 23.9 (21.2)
36.8 (42.3)31.5 to <36.827.6 to <31.523.9 to <27.6below 23.9 (19.8)
1996
2002
1996
2002
1996
2002
1996
2002
3.7 · EPO use prior to initiation, by race/ethnicity & gender
3.8 · Mean hemoglobin at initiation, by EPO treatment
Pre-ESRD EPO use & hemoglobin at initiation
3.6 · EPO use prior to initiation, by age & gender
3.9 · Geographic variations in the percent of patients receiving EPO prior to initiation, by race
Pre-ESRD EPOuse & anemia atinitiationWhile the proportion of patients who
receive EPO prior to ESRD therapy has
increased since 1996, rates of EPO use
remain low (Figures 3.6–7), particularly
in relation to the low hemoglobin levels
seen in patients beginning therapy. By
age, male pediatric patients are the most
likely to receive pre-ESRD EPO, and male
patients age 20–44 the least. Among fe-
males, rates are more consistent across
ages. By race, the lowest rates of EPO
therapy occur among black and Native
American males, while the highest are
seen in females of Asian ancestry.
Since early 1995 the overall mean hemo-
globin at initiation has increased from 9.2
to 10 g/dl (Figure 3.8). Patients treated
with EPO prior to beginning ESRD
therapy have hemoglobin levels 0.4–0.5
g/dl higher than those receiving no EPO.
The percentage of patients receiving EPO
prior to initiation increased from 21.6 to
32.4 between 1995 and 2002.
Between May 1995 and June 2002, the
percent of patients with initial hemoglo-
bins above 11 g/dl—the K/DOQI target—
rose from 15.9 to 26.1, a 64 percent
increase (Figure 3.11). The proportion of
patients with levels of 12 g/dl and above
rose 80 percent.
Patients age 75 and above have the highest
hemoglobin levels at initiation, while lev-
els are lowest in pediatric patients (Figure
All White Non-white

67
10-<11
12+
1996 1997 1998 1999 2000 2001 2002P
erc
en
t o
f p
ati
en
ts
0
10
20
30
40
50
60
70
80
90
100
9-<10
<9
11-<12
All White Black N Am Asian Hispanic All White Black N Am Asian Hispanic8.4
8.8
9.2
9.6
10.0
10.4 Male Female
1996 1997 1998 1999 2000 2001 20029
10
11
12
Hemodialysis
Peritoneal dialysis
Transplant
All
All 0-19 20-44 45-64 65-74 75+ All 0-19 20-44 45-64 65-74 75+
He
mo
glo
bin
(g
/dl)
He
mo
glo
bin
(g
/dl)
He
mo
glo
bin
(g
/dl)
8.4
8.8
9.2
9.6
10.0
10.4Male Female
10.25+ (10.39) 10.11 to <10.25 9.96 to <10.11 9.78 to <9.96 below 9.78 (9.60)
10.25+ (10.40) 10.11 to <10.25 9.96 to <10.11 9.78 to <9.96 below 9.78 (9.66)
10.25+ (10.43) 10.11 to <10.25 9.96 to <10.11 9.78 to <9.96 below 9.78 (9.47)
1996
2002
1996
2002
1996
2002
1996
2002
Mean hemoglobin at initiation
3.11 · Patient distribution, by mean monthly hemoglobin (g/dl) at initiation
3.12 · Mean hemoglobin at initiation, by age & gender
3.13 · Mean hemoglobin at initiation, by race/ethnicity & gender
3.14 · Mean hemoglobin at initiation, by first modality
3.10 · Mean hemoglobin (g/dl) at initiation
All
White
Non-white
3.12). By race, hemoglobin levels are high-
est among white patients (Figure 3.13).
Among males they are lowest in blacks
and Hispanics, and among females the
lowest levels are found in blacks and Na-
tive Americans.
Patients who begin ESRD therapy on he-
modialysis consistently have the lowest
initial hemoglobin levels, while those
starting therapy with a transplant have the
highest (Figure 3.14).
� Figures 3.6–3.8, 3.11–3.14 incident ESRDpatients with a first service date between May 1995& June 2002; data from Medical Evidence form.� Figures 3.9–10 incident ESRD patients, 2000–2001 combined, by HSA, unadjusted; data fromMedical Evidence form.

3
chap
ter
68
20
03
a
nn
ua
l
da
ta
r
ep
or
t
P A T I E N T C H A R A C T E R I S T I C S
95 96 97 98 99 00 01 02
BU
N (
mg
/dl)
80
85
90
95
100 White
Black
N Am
Asian
Hispanic
All
95 96 97 98 99 00 01 0280
85
90
95
100 0-19
20-44
45-64
65-74
75+
All
BU
N (
mg
/dl)
95 96 97 98 99 00 01 02
Se
rum
cre
ati
nin
e (
mg
/dl)
6
8
10
12 White
Black
N Am
Asian
Hispanic
All
95 96 97 98 99 00 01 02
Se
rum
cre
ati
nin
e (
mg
/dl)
5
7
9
11
13
0-19
20-44
45-64
65-74
75+
All
All0-19
20-4445-64
65-7475+
All0-19
20-4445-64
65-7475+
All0-19
20-4445-64
65-7475+
All0-19
20-4445-64
65-7475+
All0-19
20-4445-64
65-7475+
All0-19
20-4445-64
65-7475+
All0-19
20-4445-64
65-7475+
All0-19
20-4445-64
65-7475+
All0-19
20-4445-64
65-7475+
All0-19
20-4445-64
65-7475+
BU
N (
mg
/dl)
60
70
80
90
100
110 White Native AmericanBlack Asian Hispanic
Se
rum
cre
ati
nin
e (
mg
/dl)
5
7
9
11
13White Native AmericanBlack Asian Hispanic
1996
2001
1996
2001
Blood urea nitrogen (BUN) at initiation
3.15 · by race/ethnicity 3.16 · by age
3.17 · by race/ethnicity & age
Serum creatinine at initiation
3.18 · by race/ethnicity 3.19 · by age
3.20 · by race/ethnicity & age
Biochemical& physicalcharacteristicsBetween 1995 and 2002, mean blood urea
nitrogen (BUN) levels among new ESRD
patients decreased 7.7 mg/dl (Figure 3.15).
In black and Asian patients, this decrease
was 8.5 and 8.0 mg/dl, respectively. By age
group, the largest change was seen in pa-
tients age 75 and older, whose mean BUN
levels fell 9.3 percent, from 95.1 to 86.3 mg/
dl (Figure 3.16). Similar patterns are appar-
ent in data on initial serum creatinine lev-
els, which decreased 1.7 mg/dl for blacks
during this period, and 1.4 mg/dl for pa-
tients age 75 and older (Figures 3.18–19).
Patients with low serum creatinine levels
are often assumed to have high levels of
residual renal function. This is not always
the case, however, as many of these pa-
tients may have poor nutrition and low
muscle mass. Caution should therefore be
used in interpreting the data as a reflec-
tion of earlier initiation.
The hypothesis that patients are beginning
therapy at an earlier stage of chronic kid-
ney disease may, however, be supported by
the steady increase in estimated glomeru-
lar filtration rates (eGFRs) at initiation
(Figures 3.21–23). Since 1995 the mean
eGFR at the beginning of ESRD therapy
has increased 2.1 ml/min/1.73 m2 overall,
to 9.6. By race, the lowest increase—1.6
ml/min/1.73 m2—has occurred in Asians,
while the mean eGFR of whites has in-
creased 2.2 ml/min/1.73 m2. Pediatric pa-
tients tend to have the highest eGFRs, and
patients age 20–44 the lowest. The greatest
increase in initial levels since 1995 has
occurred in patients age 75 and older,
from 8.2 to 10.7 ml/min/1.73 m2. Con-
cerns have recently been raised, however,
regarding the methods used to estimate
GFR in patients with advanced renal fail-
ure (particularly diabetic patients, for
whom the formulas have not been vali-
dated), and these should be acknowledged
when considering the data.
Body mass index (BMI) among new
ESRD patients increased an average of 1.8

69
All0-19
20-4445-64
65-7475+
All0-19
20-4445-64
65-7475+
All0-19
20-4445-64
65-7475+
All0-19
20-4445-64
65-7475+
All0-19
20-4445-64
65-7475+
All0-19
20-4445-64
65-7475+
All0-19
20-4445-64
65-7475+
All0-19
20-4445-64
65-7475+
All0-19
20-4445-64
65-7475+
All0-19
20-4445-64
65-7475+
95 96 97 98 99 00 01 02
eG
FR
(m
l/m
in/1
.73
m2)
eG
FR
(m
l/m
in/1
.73
m2)
eG
FR
(m
l/m
in/1
.73
m2)
6
7
8
9
10
11 White
Black
Native American
Asian
Hispanic
All
95 96 97 98 99 00 01 026
7
8
9
10
11
65-74
75+
All
0-19
20-44
45-64
95 96 97 98 99 00 01 02
BM
I (kg
/m2)
22
24
26
28
30White
Black
Native American
Asian
Hispanic
All
95 96 97 98 99 00 01 02
BM
I (kg
/m2)
20
22
24
26
28
30 0-19
20-44
45-64
65-74
75+
All
4
6
8
10
12 White Native AmericanBlack Asian Hispanic
BM
I (kg
/m2)
18
20
22
24
26
28
30White Native AmericanBlack Asian Hispanic
1996
2001
1996
2001
Estimated glomerular filtration rate (eGFR) at initiation
3.21 · by race/ethnicity 3.22 · by age
3.23 · by race/ethnicity & age
Body mass index (BMI) at initiation
3.24 · by race/ethnicity 3.25 · by age
3.26 · by race/ethnicity & age
kg/m2 between 1995 and 2002 (Figure
3.24), a 7 percent increase. Asian and pe-
diatric patients consistently have the low-
est BMIs, and their levels changed the least
over the period. Native American patients
and those age 45–64, in contrast, present
with the highest BMIs, and their indices
have increased 2.5 and 1.9 kg/m2, respec-
tively.
These increasing BMIs in ESRD patients
are a source of concern. Chronic ESRD
patients constitute a biased sample of pa-
tients, as they are healthy enough to have
survived to ESRD. It is not clear, therefore,
how trends in BMIs should be interpreted,
particularly when high indices in the gen-
eral population are associated with an
elevated risk of death, while the reverse is
true in the population with ESRD.
� Figures 3.15–26 incident ESRD patients with afirst service date between May 1995 & June 2002;data from Medical Evidence form.
� Figures 3.22–23 eGFR calculation for ages 0–18from Schwartz et al., & for ages 19 & above fromLevey et al.

3
chap
ter
70
20
03
a
nn
ua
l
da
ta
r
ep
or
t
P A T I E N T C H A R A C T E R I S T I C S
eG
FR
(m
l/m
in/1
.73
m2)
7
8
9
10
11
12
13
65-<70
70-<75
75-<80
80-<85
85+
Age Gender
All 0 1 2 3 4 5 6 7+ All 0 1 2 3 4 5 6 7+7
8
9
10
11
12
13
White
Black
Native American
Asian
Charlson score
Hispanic
Non-Hispanic
Race Ethnicity
All
Male
Female
Estimated glomerularfiltration rates & outcomesOn the previous spread we illustrate recent changes in biochemi-
cal markers at the initiation of ESRD therapy. It is unclear, how-
ever, whether lower BUN and creatinine levels and higher eGFRs
show that patients are beginning dialysis earlier because they
have greater comorbidity, or because they are receiving better
care in the pre-ESRD period. A number of investigators have
attempted to interpret eGFR at initiation as an indication of early
referral for dialysis. This idea may, however, be complicated by
the advanced comorbidity linked in observational studies to
higher eGFR levels. To investigate this question we look here at
eGFR levels in relation to comorbidity, and also at outcomes in
the twelve months following the start of ESRD therapy.
We calculated Charlson scores (a measure of comorbidity) for
patients age 67 or older who had two years of medical services
prior to starting ESRD therapy in 2000. In both males and fe-
3.27 · Differences in eGFR at initiation, by Charlson score, age, gender, race, & ethnicity
males, across age groups, and across most races and ethnicities,
there is an almost linear relationship between higher Charlson
scores and higher eGFR levels (Figure 3.27). This provides strong
evidence that lower BUN and creatinine levels at the initiation of
therapy, along with higher eGFR levels, are related not to im-
proved pre-ESRD care, but rather to increased comorbidity.
This hypothesis that higher eGFRs at the initiation of ESRD
therapy are a surrogate for increased comorbidity and, therefore,
predict increased mortality competes with the hypothesis that
earlier initiation of ESRD therapy leads to improved survival. To
test these theories, we used probability models to determine the
risk of hospitalization and mortality. We obtained Medical Evi-
dence form data on age, gender, race, primary diagnosis, and
ethnicity, and calculated body mass index and eGFR from values
supplied on the form. We then looked at outcomes in a one-year
followup period.
Probabilities of hospitalization and mortality follow similar pat-
terns, increasing with higher eGFR levels (Figures 3.28–30). Pa-
71
Months
1 2 3 4 5 6 7 8 9 10 11 12
Pro
ba
bil
ity
of
rem
ain
ing
wit
ho
ut
a h
osp
ita
liza
tio
n
0.2
0.3
0.4
0.5
0.6
0.7
0.8
0.9
1.0
eGFR <5
eGFR 5-<7
eGFR 7-<10
eGFR 10+
1 2 3 4 5 6 7 8 9 10 11 12
Unadjusted (Kaplan-Meier) hospitalization Adjusted hospitalization
Months
1 2 3 4 5 6 7 8 9 10 11 12
Pro
ba
bil
ity
of
surv
iva
l
0.7
0.8
0.9
1.0
eGFR <5
eGFR 5-<7
eGFR 7-<10
eGFR 10+
1 2 3 4 5 6 7 8 9 10 11 12
Unadjusted (Kaplan-Meier) survival Adjusted survival
Months
1 2 3 4 5 6 7 8 9 10 11 12
Pro
ba
bil
ity
of
surv
iva
l
0.6
0.7
0.8
0.9
1.0
eGFR <5
eGFR 5-<7
eGFR 7-<10
eGFR 10+
All
1 2 3 4 5 6 7 8 9 10 11 12
BlackWhite
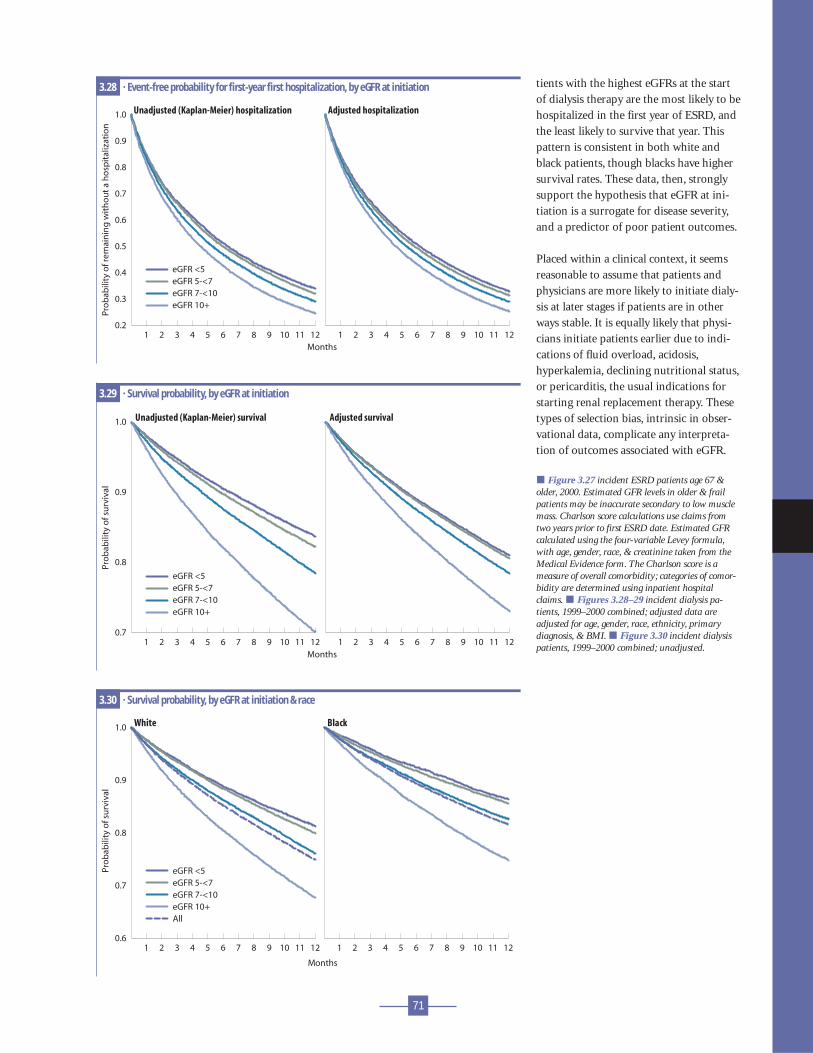
3.28 · Event-free probability for first-year first hospitalization, by eGFR at initiation
3.29 · Survival probability, by eGFR at initiation
3.30 · Survival probability, by eGFR at initiation & race
tients with the highest eGFRs at the start
of dialysis therapy are the most likely to be
hospitalized in the first year of ESRD, and
the least likely to survive that year. This
pattern is consistent in both white and
black patients, though blacks have higher
survival rates. These data, then, strongly
support the hypothesis that eGFR at ini-
tiation is a surrogate for disease severity,
and a predictor of poor patient outcomes.
Placed within a clinical context, it seems
reasonable to assume that patients and
physicians are more likely to initiate dialy-
sis at later stages if patients are in other
ways stable. It is equally likely that physi-
cians initiate patients earlier due to indi-
cations of fluid overload, acidosis,
hyperkalemia, declining nutritional status,
or pericarditis, the usual indications for
starting renal replacement therapy. These
types of selection bias, intrinsic in obser-
vational data, complicate any interpreta-
tion of outcomes associated with eGFR.
� Figure 3.27 incident ESRD patients age 67 &older, 2000. Estimated GFR levels in older & frailpatients may be inaccurate secondary to low musclemass. Charlson score calculations use claims fromtwo years prior to first ESRD date. Estimated GFRcalculated using the four-variable Levey formula,with age, gender, race, & creatinine taken from theMedical Evidence form. The Charlson score is ameasure of overall comorbidity; categories of comor-bidity are determined using inpatient hospitalclaims. � Figures 3.28–29 incident dialysis pa-tients, 1999–2000 combined; adjusted data areadjusted for age, gender, race, ethnicity, primarydiagnosis, & BMI. � Figure 3.30 incident dialysispatients, 1999–2000 combined; unadjusted.

3
chap
ter
72
20
03
a
nn
ua
l
da
ta
r
ep
or
t
P A T I E N T C H A R A C T E R I S T I C S
10.44+ (12.51) 8.31 to <10.44 6.62 to <8.31 5.23 to <6.62 below 5.23 (4.42)
17.0+ (20.8) 14.1 to <17.0 11.7 to <14.1 9.5 to <11.7 below 9.5 (8.0)
34.8+ (40.5) 27.6 to <34.8 22.5 to <27.6 17.2 to <22.5 below 17.2 (13.8)
15.3+ (20.4) 11.8 to <15.3 10.2 to <11.8 8.8 to <10.2 below 8.8 (7.6)
9.58+ (14.61) 6.90 to <9.58 5.36 to <6.90 4.08 to <5.36 below 4.08 (3.33)
13.04+ (16.81) 9.86 to <13.04 7.84 to <9.86 6.10 to <7.84 below 6.10 (5.08)
3.31 · Geographic variations in insurance coverage at initiation (percent of patients)
Insurance coverageof incident patientsThe highest proportion of ESRD patients covered solely by Medic-
aid live in California, Arizona, portions of Washington and Oregon,
and areas of the Gulf Coast and Atlantic Seaboard; coverage is al-
most three times higher in these areas than in the lowest quintile
(Figure 3.31). Medicare-only coverage is most common in the
South and along the East Coast, and least common in Upper Mid-
DVA or other EGHP with Medicare as secondary payor
Medicaid only Medicare and Medicaid
Medicare with other secondary payor Medicare only
west and western states; patients here are more likely to have
combined coverage from Medicare and another payor.
Patients whose Medicare coverage is accompanied by EGHP or
other insurance coverage are most likely to be white, while mi-
nority populations are disproportionately represented among
patients with Medicare or Medicare/Medicaid coverage, and
among those with no insurance coverage (Figure 3.32). The dis-
tribution of Hispanic patients by insurance coverage is similar to
that of other minority populations.

73
0
20
40
60
80
100
Insurance type (see table for codes)
None DVA/oth EGHP EGHP + M M/caid M & M M w/oth M/care
Pe
rce
nt
of
pa
tie
nts
0
5
10
15
20
Race
Hispanic ethnicity
95 96 97 98 99 00 01 020
20
40
60
80
100
Pe
rce
nt
of
pa
tie
nts
0
20
40
60
80
100All White Black
Native American Asian Hispanic
95 96 97 98 99 00 01 02 95 96 97 98 99 00 01 02
Unknown
Asian
Native American
Black
White
None
DVA/oth
EGHP
EGHP + M
M/caid
M & M
M w/oth
M/care
3.32 · Patient distribution, by insurance coverage at initiation, race, & ethnicity
3.33 · Trends in insurance coverage at initiation, by race/ethnicity
Insurance groupsNone · No insuranceDVA/oth · DVA or
otherEGHP · Employer
Group HealthPlan only
EGHP + M · EGHPwith Medicaresecondary
M/caid · Medicaidonly
M & M · Medicare &Medicaid
M w/oth · Medicarewith othersecondary
M/care · Medicareonly
Between 1995 and 2002 the proportion of
patients covered solely by Medicaid at the
start of therapy fell 12.3 percent, to 10.8
percent (Figure 3.33). Almost one-fifth of
Native Americans, however, were covered
by Medicaid in 2002, an increase of more
than 50 percent. Similar dramatic increases
occurred in other types of coverage for
Native Americans, as the number with no
insurance dropped from more than a third
to only 7 percent. The number of Asian
patients with no insurance dropped almost
43 percent during the same period.
� Figure 3.31 incident ESRD patients, 2001, byHSA, unadjusted; data from Medical Evidence form.� Figure 3.32 incident ESRD patients, 2001; datafrom Medical Evidence form. � Figure 3.33 incidentESRD patients with a first service date between May1995 & June 2002; data from Medical Evidence form.

3
chap
ter
74
summarychapter
20
03
a
nn
ua
l
da
ta
r
ep
or
t
P A T I E N T C H A R A C T E R I S T I C S
Maps: National means & patient populationsFigure number 3.9 3.9 3.9 3.10 3.10 3.10 3.31 3.31 3.31 3.31 3.31 3.31
All White Non-wh. All White Non-wh. DVA M/EGHP M/caid M & M M w/oth M/care
Overall value for all pts 32.1 33.6 29.5 9.9 10.1 9.7 12.4 7.2 10.8 11.9 21.1 13.8
Total patients 41,881 26,599 15,282 39,183 24,806 14,377 11,728 6,818 10,218 11,213 19,925 13,053
Overall value for pts mapped 33.0 34.2 30.5 10.0 10.1 9.7 11.8 7.7 9.5 12.6 22.3 14.4
Missing HSA/state: pts dropped 8,369 4,356 4,013 7,892 4,076 3,816 1,401 108 1,918 204 383 481
INTRODUCTION Figure 3.1 Diabetes as a primary diagnosis accounts for
64 percent of ESRD cases in Mexican Hispanics, 55 percent in Hispanics of
other origins, and 43 percent in non-Hispanics. Figure 3.2 The total burden
of diabetes, both primary and secondary, in ESRD patients surviving one year
is 80 percent for Native Americans, 73 percent for Hispanics, 61 percent for
Asians, 59 percent for blacks, and 58 percent for whites. COMPLEXITY OF THE
PATIENT POPULATION Figure 3.3 In 2000, 45 percent of diabetics and 37
percent of non-diabetics who survived one year on dialysis had cardiovascu-
lar comorbidity, compared to only 25 and 18 percent in 1984. EPO USE &
ANEMIA TREATMENT Figures 3.6–7 EPO use prior to dialysis is lowest in
those age 20–44, and in blacks and Native Americans. Figure 3.8 The mean hemoglobin at initiation rose from 9.2 g/dl in
May 1995 to 10.0 g/dl in May 2002, a 9 percent increase, while the percent of patients using EPO in the pre-ESRD period
grew from 22 to 32. Figure 3.11 The percent of patients initiating dialysis with a hemoglobin less than 11 g/dl decreased
from 84 in May 1995 to 74 in May of 2002, a 12 percent reduction. Even more dramatically, the percent initiating with a
hemoglobin level less than 10 g/dl fell from 68 to 53, a 22 percent reduction over the seven-year period. Figure 3.12
Female pediatric patients and those age 20–44 continue to have the lowest hemoglobins at the initiation of ESRD treat-
ment—9.1 and 9.4 g/dl, respectively. Figure 3.13 Native American women and black patients of both genders have the
lowest hemoglobin levels at the start of therapy. Figure 3.14 At the beginning of therapy, hemoglobin levels in perito-
neal dialysis patients are more than one-half g/dl higher than those in hemodialysis patients. BIOCHEMICAL & PHYSICAL
CHARACTERISTICS Figures 3.15–20 Since 1995, blood urea nitrogen and serum creatinine levels have fallen by 8.2 and
17.4 percent, respectively. Figures 3.21–23 Estimated glomerular filtration rates have increased 27 percent over the last
eight years, so that individuals are starting therapy on average with 9.6 ml/min/1.73 m2 of residual renal function. Fig-
ures 3.24–26 Overall body mass index has increased 7 percent over the last seven years, from 25.7 to 27.5 kg/m2. ESTI-
MATED GFR & OUTCOMES Figure 3.27 Estimated GFRs and Charlson scores appear to be linearly related within age,
gender, race, and ethnicity. Figures 3.28–30 Survival probability appears to be inversely related to eGFR. INSURANCE
COVERAGE OF INCIDENT PATIENTS Figures 3.31–33 Minority populations are disproportionately covered by Medic-
aid only, Medicare and Medicaid, and Medicare without secondary insurance. Hispanic populations also contain a large
proportion of patients who have no insurance coverage at the initiation of dialysis.

![SW MATM through ZONE - Cisco · %SW_MATM-4-MACFLAP_NOTIF:Host[enet]in[chars][dec]isflappingbetweenport[chars]andport [chars] Recommended Checkthenetworkforpossibleloops. Action %SW_MATM-4-WIRELESS](https://img.pdfslide.us/doc/110x75/5f7c820f9a0d1f3f5c674488/sw-matm-through-zone-cisco-swmatm-4-macflapnotifhostenetincharsdecisflappingbetweenportcharsandport.jpg)