Embed Size (px)
Citation preview

Exploring childlessness and delayed childbearing in South Africa, 2001-2011
Statistics South Africa Pali Lehohla Report 03-06-02(2001-2011) Statistician-General

Statistics South Africa
Exploring childlessness and delayed childbearing in South Africa, 2001-2011
Report 03-06-02
ii
Exploring childlessness and delayed childbearing in South Africa, 2001-2011 / Statistics South Africa Published by Statistics South Africa, Private Bag X44, Pretoria 0001 © Statistics South Africa, 2015 Users may apply or process this data, provided Statistics South Africa (Stats SA) is acknowledged as the original source of the data; that it is specified that the application and/or analysis is the result of the user's independent processing of the data; and that neither the basic data nor any reprocessed version or application thereof may be sold or offered for sale in any form whatsoever without prior permission from Stats SA.
Stats SA Library Cataloguing-in-Publication (CIP) Data Exploring childlessness and delayed childbearing in South Africa, 2001-2011 / Statistics South Africa. Pretoria: Statistics South Africa, 2015 Report no. 03-06-02(2001-2011) 62pp ISBN 978-0-621-44496-4
A complete set of Stats SA publications is available at Stats SA Library and the following libraries:
National Library of South Africa, Pretoria Division National Library of South Africa, Cape Town Division Library of Parliament, Cape Town Bloemfontein Public Library Natal Society Library, Pietermaritzburg Johannesburg Public Library Eastern Cape Library Services, King William’s Town Central Regional Library, Polokwane Central Reference Library, Nelspruit Central Reference Collection, Kimberley Central Reference Library, Mmabatho
This report is available on the Stats SA website: www.statssa.gov.za For technical enquiries please contact: Chantal Munthree Lesego Olga Masebe Diego Iturralde Email: [email protected] [email protected] [email protected]

Statistics South Africa
Exploring childlessness and delayed childbearing in South Africa, 2002-2011 Report 03-06-02
iii
Contents
List of tables ................................................................................................................................................................ v
List of figures ............................................................................................................................................................. vi
List of abbreviations and acronyms ....................................................................................................................... vii
Chapter 1: Overview ................................................................................................................................................... 1
1.1 Introduction ...................................................................................................................................................... 1
Chapter 2: Methodology ............................................................................................................................................. 6
2.1 Data and scope ................................................................................................................................................ 6
2.2 Analysis ............................................................................................................................................................ 6
2.3 Limitations ........................................................................................................................................................ 6
2.4 Assessment of parity unstated ......................................................................................................................... 6
Chapter 3: Childlessness among women aged 15–49 in South Africa ................................................................. 9
3.1 Introduction ...................................................................................................................................................... 9
3.2 Socio-economic differentials and childlessness among women aged 15–49 ...................................................................................................................................................... 9
3.2.1 Age ................................................................................................................................................................... 9
3.2.2 Population group ............................................................................................................................................ 10
3.2.3 Educational attainment .................................................................................................................................. 11
3.2.4 Marital status .................................................................................................................................................. 12
3.2.5 Geotype .......................................................................................................................................................... 14
3.2.6 Province ......................................................................................................................................................... 16
3.2.7 Employment status ........................................................................................................................................ 17
3.2.8 Occupation ..................................................................................................................................................... 18
3.2.9 Industry .......................................................................................................................................................... 19
3.3 Childlessness and completed fertility rate ..................................................................................................... 20
3.3.1 Introduction .................................................................................................................................................... 20
Chapter 4: Childlessness among qualified and unqualified women aged 20–49 .............................................. 25
4.1 Introduction .................................................................................................................................................... 25
4.2 Distribution of qualified women by age .......................................................................................................... 25
4.3 Childlessness of qualified women by age ...................................................................................................... 27
4.4 Childlessness of women by qualification level and population group ............................................................ 28
4.5 Childlessness of women by qualification level and employment status ........................................................ 29
4.6 Childlessness of women by qualification level and income ........................................................................... 30
4.7 Childlessness of women by qualification level and marital status ................................................................. 31
4.8 Childlessness of women by qualification level and field of study .................................................................. 32
4.9 Childlessness of women by qualification level and industry .......................................................................... 33
4.10 Childlessness of women by qualification level and occupation ..................................................................... 34
4.11 Childlessness of women by qualification level and province ......................................................................... 37
Chapter 5: Socio-economic differentials of qualified women (aged 20–49) by fertility status ......................... 39
5.1 Introduction .................................................................................................................................................... 39

Statistics South Africa
Exploring childlessness and delayed childbearing in South Africa, 2002-2011 Report 03-06-02
iv
5.2 Qualified women by socio-demographic differentials and fertility status ....................................................... 39
5.2.1 Age ................................................................................................................................................................. 39
5.2.2 Marital status .................................................................................................................................................. 39
5.2.3 Population group ............................................................................................................................................ 39
5.2.4 Level of education .......................................................................................................................................... 40
5.2.5 Employment status ........................................................................................................................................ 40
5.2.6 Income ........................................................................................................................................................... 40
5.2.7 Occupation ..................................................................................................................................................... 40
5.2.8 Industry .......................................................................................................................................................... 40
5.2.9 Province ......................................................................................................................................................... 41
Chapter 6: Discussion and conclusion .................................................................................................................. 43
7. References .................................................................................................................................................... 47

Statistics South Africa
Exploring childlessness and delayed childbearing in South Africa, 2002-2011 Report 03-06-02
v
List of tables
Table 1: Distribution of parity by age of women ..................................................................................................... 8
Table 2: Proportion of childlessness by age and province, 2001 and 2011 ........................................................ 16
Table 3: Childlessness of all women aged 15–49 by occupation and age, 2001 and 2011 ................................ 19
Table 4: Childlessness among all women aged 15–49 by industry, 2011 ........................................................... 20
Table 5: Childlessness by selected age categories, Census 2001 and Census 2011 ........................................ 21
Table 6: Percentage of childless women in South Africa by selected age categories over time, Census 2001 and Census 2011 .......................................................................................................................... 22
Table 7: Percentage distribution of women aged 45–49 by number of children ever born and mean CEB by age at first birth, Census 2011 .......................................................................................................... 22
Table 8: Lifetime childlessness and completed fertility rate (CFR) among women aged 45–49, Census 2001 and Census 2011 .......................................................................................................................... 24
Table 9: Age distribution of women age 20–49 by qualification, 2001 and 2011 ................................................. 26
Table 10: Childlessness among women aged 20–49 by qualification and industry of work, Census 2011........... 35
Table 11: Childlessness among women aged 20–49 by age, qualification and occupation, Census 2011 .......... 36
Table 12: Childlessness among women aged 20–49 by qualification and province, Census 2011 ...................... 38
Table 13: Percentage distribution of qualified women by fertility status and socio-economic characteristics ....... 42

Statistics South Africa
Exploring childlessness and delayed childbearing in South Africa, 2002-2011 Report 03-06-02
vi
List of figures
Figure 1: Childlessness among women aged 15–49 by age, Census 2001 and Census 2011 ................................. 10
Figure 2: Childlessness among women aged 15–49 by population group, Census 2001 and 2011 ......................... 11
Figure 3a: Childlessness among women aged 15–49 by level of education, Census 2001 ...................................... 12
Figure 3b: Childlessness among women aged 15–49 by level of education, Census 2011 ...................................... 12
Figure 4: Proportion of childless women aged 15–49 by marital status, Census 2001 and Census 2011 ................ 13
Figure 5: Childlessness among women aged 15–49 by marital status, Census 2001 and 2011 ............................... 14
Figure 6: Childlessness among women aged 15–49 by geotype and age, Census 2001 ......................................... 15
Figure 7: Childlessness among women aged 15–49 by geotype and age, Census 2011 ......................................... 15
Figure 8: Percentage change in childlessness between 2001 and 2011, across provinces ...................................... 17
Figure 9: Childlessness of all women aged 15–49 by employment status, 2001 and 2011....................................... 18
Figure 10: Childlessness among women aged 20–49 by qualification level, 2011 .................................................... 28
Figure 11: Childlessness among women aged 20–49 by qualification level and population group, 2011 ................. 29
Figure 12: Childlessness among women aged 20–49 by qualification and employment status, 2011 ...................... 30
Figure 13: Childlessness among women aged 20–49 by qualification and income, Census 2011 ........................... 31
Figure 14: Childlessness among women aged 20–49 by qualification and marital status, 2011 ............................... 32
Figure 15: Childlessness among qualified women aged 20–49 by field of education, 2011 ...................................... 33

Statistics South Africa
Exploring childlessness and delayed childbearing in South Africa, 2002-2011 Report 03-06-02
vii
List of abbreviations and acronyms
DHS: Demographic and Health Survey
ISCO: International Standard Classification of Occupation
MDGs: Millennium Development Goals
Stats SA: Statistics South Africa
SADHS: South African Demographic and Health Survey
WHO: World Health Organization

Statistics South Africa
Exploring childlessness and delayed childbearing in South Africa, 2002-2011 Report 03-06-02
viii
Acknowledgements
Statistics South Africa would like to thank Chantal Munthree and Lesego Olga Masebe for
developing and compiling the thematic report.
Diego Iturralde, Princelle Dasappa-Venketsamy, Itani Ntsieni, Nyiko Tricia Maluleke and
Mmatlala Ramosebudi are acknowledged for their contribution to the report.
The organisation is grateful to Dr Tshepo Mabela and Dihlolelo Phoshoko for their review of this
publication.

Statistics South Africa
Exploring childlessness and delayed childbearing in South Africa, 2002-2011 Report 03-06-02
ix
Executive summary
National studies related to childlessness and fertility postponement in South Africa in the recent
years have not been available due to lack of data; however, the 2011 national census data
provide a girth of valuable fertility information including childlessness and age at first birth.
Childlessness and fertility postponement describes a pattern of fertility, and is useful to better
understand the family formations and the factors influencing the fertility transition in South
Africa. Post-2001 there has been limited analysis of changes in fertility patterns in South Africa,
particularly childlessness. The purpose of this paper is to determine the level of childlessness in
South Africa over time, using census data.
The results of this study indicate that amongst all women of childbearing age (15-49 years),
childlessness continues to increase over time. The high prevalence of childlessness is more
pronounced among younger women aged 15–24. The analysis points out to the differentials of
childlessness by population group. Across all population groups, childlessness is decreasing;
however, the prevalence of childlessness among the white and Indian/Asian population groups
is higher than among the black African and coloured population groups. Over time, the level of
childlessness is higher among women aged 15–24 with secondary and higher education.
Among women aged 15-49 years, those who have never been married have higher levels of
childlessness than women who are married. In 2001 and 2011, the proportion of women who
are childless in all the age groups is more pronounced in urban areas than in rural areas. There
is a slight decrease in the proportion of women aged 15–24 who are childless in Eastern Cape,
North West and Free State. Over the period, employed women are more likely to be childless
while unemployed women are least likely to be childless. In 2001 and 2011, childlessness is
more apparent among managers and professional women whilst the lowest prevalence of
childlessness in both periods is found among women employed in elementary occupations.
Statistics on the number of women who are childless at the end of the reproductive age group
(45–49) give an indication of lifetime childlessness in the country. Over time, cumulative fertility
rates among women aged 45–49 declined whilst childlessness increased. White women aged
45–49 have the highest level of childlessness and lowest completed fertility rates while
black/African and coloured women have the highest cumulative fertility rates and low levels of
childlessness. Women with secondary and higher education have a lower completed fertility
rate and higher prevalence of childlessness when compared to women with no education or
primary education. Women aged 45-49 who have never been married or reside in urban

Statistics South Africa
Exploring childlessness and delayed childbearing in South Africa, 2002-2011 Report 03-06-02
x
settings appear to have lower completed fertility rate and a higher level of childlessness than
their counterparts.
When comparing childlessness of qualified and unqualified women aged 20–49, it was found
that regardless of population group, qualified women aged 20–49 seem to have the highest
levels of childlessness. Yet unqualified Indian and white women have the highest levels of
childlessness compared to other unqualified women in other population groups. Childlessness
is pronounced among employed qualified women aged 20–49. A high level of childlessness is
distinct among qualified women who are in the field of mechatronics, whilst the lowest
prevalence of childlessness is noticeable among women in the field of education and
development.
Amongst both unqualified and qualified women, childlessness is more prevalent amongst
women who are employed in the financial intermediation, insurance, and business industries.
The lowest childlessness manifested differently across industries and age groups. It is more
common in private households, construction and mining, and quarrying.
The study further explored socio-economic differences among qualified women who had
children and qualified women who never had children. The highest proportion of qualified
women who had children is apparent among women aged 30–34 and 35–39. Conversely, the
proportion of qualified women who are childless is higher at earlier age groups (20–24 and 25–
29). Across marital status, the highest proportion of qualified women with children (64,3%) are
married, while the majority of qualified childless women (63,8%) have never been married.

Statistics South Africa
Exploring childlessness and delayed childbearing in South Africa, 2001-2011
Report 03-06-02
1
Chapter 1: Overview
1.1 Introduction
Fertility in South Africa is one of the lowest in sub-Saharan Africa (Stats SA, 2010). According to
the 1996 Census, the total fertility rate (TFR) in South Africa was estimated between 3,2 and
3,5 children per woman (Udjo, 1998; Sadie, 1998), and 2,8 in 2001 (Moultrie and Dorrington,
2004) and by 2011 it is estimated at 2,7 (Udjo, 2014, Stats SA 2015). Suggestions of a stalled
fertility decline in specific regions in South Africa have been noted (Moultrie et al., 2008).
Fertility postponement and increased childlessness are known contributors to overall fertility
decline (Kohler, Billari and Ortega, 2002: 659-661).
National studies related to childlessness, age at first birth and parity progression in South Africa
in recent years have not been available due to lack of data. The 2011 national census data
provide valuable fertility information, i.e. information on the proportion of women who are
childless and the age at first birth among women by 2011. Childlessness and fertility
postponement describes a pattern of fertility, and is useful in better understanding the family
formations and the factors influencing the fertility transition in South Africa.
Post-2001 there has been limited analysis of changes in fertility patterns in South Africa,
particularly childlessness. The purpose of this paper is to determine the level of childlessness in
South Africa over time, using census data. Voluntary childlessness refers to being without
children, i.e. never having given a live birth due to use of methods of pregnancy prevention,
whilst involuntary childlessness refers to being without children despite efforts to reproduce.
Given the limitations of the data, childlessness in this paper is cumulative of both voluntary and
involuntary childlessness. The objectives of the report are as follows. Firstly, it establishes the
overall levels and trends of childlessness among women aged 15–49 using census 2001 and
2011 data. Secondly, childlessness by socio-demographic factors such as population group,
educational attainment, marital status and geographic location (urban/non-urban) and province
as well as employment status will be analysed. Thirdly, the influence of childlessness on the
overall fertility decline and the determinants thereof will also be investigated. Finally, the paper
will examine trends in childlessness among women with a range of qualifications and the report
will establish the significant differences among qualified childless women and women who ever
had children.

Statistics South Africa
Exploring childlessness and delayed childbearing in South Africa, 2002-2011 Report 03-06-02
2
Literature review
In the context of low fertility, childlessness has become an important area of demographic
research and has drawn the attention of many demographers and other social scientists.
Traditionally, childlessness was mainly involuntary, occurring within a large family system
(Morgan, 1991). Contemporary childlessness is mostly voluntary and is occurring in the context
of a small family system. It therefore warrants attention, as it can be a potential factor to low
levels of fertility in recent decades (Merlo and Rowland, 2000).
Over a woman’s lifetime, her own assessment of whether or not she will have a child and the
age at which she will begin childbearing, will be subject to changes in social and cultural
prescripts and ideals as well as her own experiences. The change in the pattern of
childlessness and postponement is indicative of increasing fertility control via contraceptive use
for limiting and the choice in deciding when to bear children (DoH, 1998). Literature indicates
that key socio-demographic factors such as population group, residence, education and marital
status influence childlessness and fertility postponement and thus fertility levels within a country
(Reinis, 1992; Bongaarts, 1978; Bongaarts, 2010).
Fertility postponement is among the factors that contribute to childlessness. Postponement of
first birth may lead to involuntary childlessness if women underestimate age related declines in
fecundity (Leridon, 2004). As childbearing gets pushed to increasingly later ages, women have
a narrower window of time in which to complete their desired fertility because of biological limits.
From a biological perspective, fecundity begins declining as early as the late 20s for women,
with more dramatic reductions starting around age 35. Postponing fertility until the 30s,
therefore, carries the risk of involuntary childlessness (Dunson et al., 2002).
Amongst the wide array of influences on the trend of childlessness, education and women’s
empowerment are key (Balk, 1994; Dyson and Moore, 1983). Both female educational
attainment and labour force participation are factors that are identified as having a high
correlation with childlessness (Hagestad and Call, 2007).
Since 1994, South Africa became internationally recognised for its relatively good performance
in terms of common measures of gender equality and women empowerment (MDG, 2013). For
example, the female share of enrolment in public higher education between 2010 and 2012 is
over 61% for undergraduates and post-graduates alike (Equal education, 2014). Crimmins et al.
(1991) revealed that younger educated women face a broader spectrum of choices in all

Statistics South Africa
Exploring childlessness and delayed childbearing in South Africa, 2002-2011 Report 03-06-02
3
spheres of life and have different aspirations with regard to marriage and families, work life, self-
sufficiency and life style than their mothers.
The prevalence of childlessness in South Africa has substantially increased in the recent
decades (Stats SA, 2015). The proportion of childless women in the age group 35–39 has
increased from 1.3 per cent in 1982 to 6 per cent in 2003. The increase was from 1.8 per cent to
4.8 per cent for women aged 45–49 years during the same period (United Nations, Department
of Economic and Social Affairs, Population Division, 2013). While there is growing sentiment
that modern lifestyles have led to a universal spread of those wishing to remain childless, it is
also clear that women do not necessarily choose to remain childless (Kemkes-Grottenthaler,
2003). Factors such as infecundity and childbearing postponement can also account for
childlessness (De Jong and Steenhof, 2000). Among most developed countries, only 10 per
cent of women have no children, and in South Africa the percentage of childless women in their
late forties approaches 5 per cent (World Fertility Report, 2009).
South Africa has made successful strides in empowering women through increased access to
education (MDG, 2013). A correlation between education and childlessness is well documented
worldwide (Weinberger, 1987). Fertility in the country has been declining over time, already
reaching below replacement levels for specific sub-populations in South Africa, particularly
among the white and Indian/Asian population groups (Stats SA, 2015). To better understand
fertility over time in South Africa, it is important to study the reproductive behaviour of women
from one generation to the next, identifying the influence of factors such as education and
employment over time.
The extent of childlessness and causes of declining fertility have and are still receiving attention
due to their impact on the demography of the country. Changes in fertility rates have significant
implications for family formation as well as women’s childbearing patterns. Higher education
and income have been consistently linked to childlessness (Abma and Martinez, 2006). The
explanation for high childlessness among highly educated women focuses on difficulty in
reconciling work and family roles (Fokkema et al., 2008; Lind, 2008). The strong career
orientation of female university graduates, the high opportunity cost (Liefbroer, 2005) as well as
the postponement of family formation due to the long time spent in education have also been
considered to be the main causes of childlessness. A stable career increases the likelihood of
remaining childless among women. Köppen et al. (2007) indicated that the lack of a suitable

Statistics South Africa
Exploring childlessness and delayed childbearing in South Africa, 2002-2011 Report 03-06-02
4
partner or a stable relationship is a central cause of childlessness in many countries of Western
and Northern Europe.
Although fertility is steadily declining amongst black African women, there are still disparities in
the fertility levels between the four population groups in South Africa (Udjo, 2014). To date,
findings in childlessness by race are mixed. Studies in the United States found race to have no
influence on the fertility preference of younger women (Kenkel, 1985), whilst Jacobson et al.
(1988) found higher rates of childlessness among black African women than among white
women. Conversely, Bloom and Trussel (1984) revealed that the effect of race is insignificant
after controlling for education and place of residence.
In terms of the effects of geographical location on childlessness, Veevers (1980) found that
childless women are more likely to reside in urban settings than non-urban settings. The study
conducted among the states of India indicated that rural women have a higher percentage of
childlessness when compared with urban women (Aiswarya and Moli, 2012). Spatial differences
in South Africa indicate that fertility is higher among rural provinces than among urban
provinces (Stats SA, 2015).
Makiwane (1998), investigating the pattern of fertility between married and never married
women in Transkei, found that the TFR of married women (3,3) was greater than that of never
married women. Makiwane indicated that unmarried women are more likely to use
contraceptives than married women. Haskey (2013) in his study of cohabitation and partnership
in Britain, demonstrated that the likelihood of women being childless is highest for those who
had no partnerships, followed by those with one cohabitation, and lastly by those who had one
marriage.
Research has also consistently shown that working women in high-status jobs are more likely to
remain childless than women in lower-status jobs (Callan, 1986; Friedman et al., 1994). Ritchey
and Stokes (1974) in their study established that the percentage of employed wives without
children was higher by a factor of five than that of non-employed wives. In each age grouping,
childlessness among employed wives exceeds that of unemployed wives.
It seems that the evidence on the relationship between female earnings and fertility is mixed.
Differences in the empirical findings partially relate to different operational definitions of female
income. Anderson (2000) used data on Swedish women’s annual earnings during the 1980s
and 1990s, and found a strong positive association between earnings and first-birth risks.

Statistics South Africa
Exploring childlessness and delayed childbearing in South Africa, 2002-2011 Report 03-06-02
5
However, using data for Norway and Finland, Rønsen (2004) finds a negative impact of female
wages on fertility in Denmark. First-birth risks increase rapidly when women have reached the
third income quintile, and this provides strong support for the idea that a sufficient female
earning situation is a precondition for forming a family in Denmark.
Some professional occupations may be more compatible with family life than others. Women in
a professional occupation may have greater access to spouses who facilitate family orientation
than others do. Cooney and Uhlenberg (1989) in their study revealed that educated women in
professional careers are more likely to be involved in parenting than women in non-professional
categories of work.
The choice of education and the occupational opportunities thereof exert a considerable
influence on the timing of the transition to motherhood (Ranson, 1998). The choice of field of
education often reflects a woman’s values and preference, which may include her attitude
towards having children and how many (Hoem et al., 2006).

Statistics South Africa
Exploring childlessness and delayed childbearing in South Africa, 2002-2011 Report 03-06-02
6
Chapter 2: Methodology
2.1 Data and scope
To better understand the level of childlessness in South Africa over time and the factors related
to childlessness, fertility data from the 2001 and 2011 censuses were used. The category of
childlessness in this paper captures all women in South Africa aged 15–49 who reported parity
zero at the time of census. The question that yields this population was asked as follows: “Has
the woman ever given birth to a child, even if the child died after birth?”. The proportion
childlessness was determined by dividing the number of women who reported parity zero in
each age group by the total number of women in the same age group.
2.2 Analysis
Univariate analysis was done to determine the levels of childlessness over time. Bivariate
analysis was done to determine the relationship between the level of childlessness among
women and socio-demographic factors such as age, marital status, population group, level of
education, qualification, employment status, income, occupation, industry and province. The
relationship between the women’s level of qualification and childlessness was also investigated
using bivariate tables. Finally, analysis of the relationship between childlessness and delayed
fertility was investigated using bivariate tabulations.
2.3 Limitations
The disadvantages in the study are that one cannot distinguish between involuntary
childlessness (e.g. infertility), intended childlessness (those who do not intend to have children),
voluntary childlessness (the “childfree”), and temporary childlessness related to circumstantial
or delayed childbearing, which is neither voluntary nor involuntary (Graham et al., 2013).
2.4 Assessment of parity unstated
The study used data on parity zero to establish childlessness; thus it is necessary to evaluate
fertility data. Enumerators often do not record zero parity on the questionnaire to indicate that a
woman has never had a child; instead the response is left blank. This is particularly prevalent
among younger women. This results in ambiguous responses in that it will not be known
whether blanks are unspecified or represent a childless woman (El-Badry, 1961). If a noticeably
large proportion of women are classified under parity not stated, the exclusion of these women

Statistics South Africa
Exploring childlessness and delayed childbearing in South Africa, 2002-2011 Report 03-06-02
7
will overestimate average parities. Conversely, if these women are included in the denominator,
the inclusion will underestimate the average parities.
El-Badry’s method was employed to establish whether unknown was in actual fact “true”
unknown or parity zero. The method was applied to all women aged 15–49. The method is
applied when the proportion of "not stated" at each age group is higher than 2%. On the other
side, there should be strong linearity between the unstated parity and parity zero. Table 1
shows that in all age groups, the proportion of women with parity unstated exceeds 2%.
According to Stats SA (2015), the results of the El-Badry correction method show a divergence
in the proportion childlessness Z(i) and the proportion with parity not stated U(i) from the fitted
line; this is suggestive that there is no linear relationship between childlessness and unstated
parity; hence, missing parity is assumed to be parity zero.

Statistics South Africa
Exploring childlessness and delayed childbearing in South Africa, 2001-2011
Report 03-06-02
8
Table 1: Distribution of parity by age of women, Census 2011
Age group
Parity 15–19 20–24 25–29 30–34 35–39 40–44 45–49
0 1 527 716 1 017 578 566 391 290 751 188 325 137 200 118 294
1 291 576 898 301 846 408 492 473 300 345 206 532 170 264
2 34 802 296 807 600 123 588 898 498 577 389 005 313 890
3 6 197 59 514 208 317 312 162 359 106 325 900 287 990
4 1 025 14 840 60 334 121 759 182 705 201 407 198 588
5 0 4 284 15 771 41 096 79 329 105 206 117 067
6 0 1 583 7 044 16 581 37 209 56 220 69 561
7 0 0 3 728 6 289 15 229 27 314 37 390
8 0 0 1 312 3 955 8 321 14 838 21 537
9 0 0 0 2 205 3 998 7 537 10 881
10 0 0 0 898 2 328 4 425 6 667
11 0 0 0 211 1 252 2 314 3 296
12 0 0 0 0 687 1 651 2 416
13 0 0 0 0 127 936 1 428
14 0 0 0 0 0 587 969
15 0 0 0 0 0 195 628
16 0 0 0 0 0 0 422
95 582 689 311 077 166 272 91 585 63 123 49 734 49 657
97 6 553 8 798 6 725 3 407 2 061 1 073 686
Total 2 450 558 2 612 782 2 482 425 1 972 270 1 742 722 1 532 074 1 411 631
% parity unstated 23,78 11,91 6,7 4,64 3,62 3,25 3,52
% childless 62,3 38,9 22,8 14,7 10,8 9 8,4
Source: Stats SA, 2015

Statistics South Africa
Exploring childlessness and delayed childbearing in South Africa, 2002-2011 Report 03-06-02
9
Chapter 3: Childlessness among women aged 15–49 in South Africa
3.1 Introduction
A substantial component of the low national fertility levels is due to childlessness among the
youngest cohorts across countries (Devolder, 2005). Even though the majority of women
continue to become mothers at some point in their lives, increasing proportions of women
choose to remain childless due to reproductive choice, and greater autonomy in ways not
possible for previous generations (Gillespie, 2003).
This chapter seeks to establish socio-demographic differentials of childlessness among all
women aged 15–49 as well as to investigate the relationship between completed fertility rates
and lifetime childlessness.
3.2 Socio-economic differentials and childlessness among women aged 15–49
3.2.1 Age
As women aged 15 years and over age into older cohorts, the level of childlessness is expected
to decline (Figure 1). The level of childlessness is highest among women aged 15–19. On
average, over 80% of women aged 15–19 are childless. Early childbearing may adversely affect
the health of the mother and infant, the economic wellbeing of families and marital stability
(Zabin and Kiragu, 1998; Hobcraft, 1992). Increased childlessness at this age group importantly
points to progress made in reproductive health programmes among the youth over time. In
2011, the level of childlessness among the older cohorts was substantially higher than that of
2001. The level of childlessness among the cohort aged 35–39 almost doubled between 2001
and 2011. This makes apparent the higher levels of childlessness that continue to prevail as
women move towards the end of their reproductive lifespan by 2011 relative to 2001. Among
women aged 45–49, the level of childlessness increased from 7% to 12% between 2001 and
2011.

Statistics South Africa
Exploring childlessness and delayed childbearing in South Africa, 2002-2011 Report 03-06-02
10
Figure 1: Childlessness among women aged 15–49 by age, Census 2001 and Census 2011
3.2.2 Population group
Figure 2 presents childlessness of women aged 15-49 by population group. In both 2001 and
2011 there seems to be a pattern of two fertility regimes, that of the white and Indian/Asian
women who experience higher levels of childlessness across all ages, whilst the black African
and coloured women indicate far lower levels of childlessness across all age cohorts of women
in 2001 and 2011. However, among women aged 15–19, the levels of childlessness among
black African and coloured teen women increased, more so when compared to other population
groups between the years 2001 and 2011.
The widest gap in the level of childlessness between population groups was among women
aged 20–29 years. Black African and coloured women have lower levels of childlessness at
these ages, whilst Indian/Asian and white women have far higher levels of childlessness at
these ages, indicating higher levels of delayed childbearing among Indian/Asian and white
women when compared to black African and coloured women (Figure 2).
There seems to be two apparent fertility regimes in South Africa, that of the black African and
coloured women and that of the white and Indian/Asian women. The difference between the two
fertility regimes among women aged 30 and over was minimal in 2001; however, by 2011 the
difference between the two fertility regimes widens and differs substantially up to the oldest
cohort 45–49. It is clear that over time, two fertility regimes are becoming entrenched in South
Africa, and the gap between the two seems to be widening.
15‐19 20‐24 25‐29 30‐34 35‐39 40‐44 45‐49
2001 84,5 47,8 23,3 12,5 8,5 7,4 7,3
2011 86,1 50,8 29,6 19,3 14,3 12,1 11,9
0
10
20
30
40
50
60
70
80
90
100
%

Statistics South Africa
Exploring childlessness and delayed childbearing in South Africa, 2002-2011 Report 03-06-02
11
Figure 2: Childlessness among women aged 15–49 by population group, Census 2001 and 2011
3.2.3 Educational attainment
In both 2001 and 2011, the pattern of increased childlessness with higher education is evident
in Figure 3. The difference in the level of childlessness by educational attainment is apparent in
younger ages 15–29, indicating that educational programmes implemented in an effort to
improve the status and opportunities for women, will also influence the reproductive behaviour
of women if women are targeted at an early age. The gap of childlessness between 2001 and
2011 is more pronounced for women with higher education aged 20–34. Beyond age 30, the
difference in the level of childlessness by educational attainment is marginal. Given the fact that
the level of childlessness among women reaching the end of their reproductive lifespan is
generally lower, it is not surprising that regardless of educational attainment, most women
would have at least given birth to their first child at this age.
2001 2011 2001 2011 2001 2011 2001 2011 2001 2011 2001 2011 2001 2011
15‐19 20‐24 25‐29 30‐34 35‐39 40‐44 45‐49
Black African 83,4 85,1 44,9 47,8 20,8 26,3 11,2 17,4 7,8 13,2 6,8 11,1 6,7 10,8
Coloured 82,1 86,9 43,1 51,2 20,5 28,4 10,9 17,6 7,6 12,9 7,1 11 7,1 10,8
Indian/ Asian 96,0 96 74,4 79,9 38,0 55,6 16,9 32,5 9,6 20,3 8,6 15,9 9,2 14,6
White 96,6 96,7 80,7 83,7 47,7 60,4 23,0 35,6 13,8 23,2 10,6 19,1 9,9 18,6
0
10
20
30
40
50
60
70
80
90
100
%

Statistics South Africa
Exploring childlessness and delayed childbearing in South Africa, 2002-2011 Report 03-06-02
12
Figure 3a: Childlessness among women aged 15–49 by level of education, Census 2001
Figure 3b: Childlessness among women aged 15–49 by level of education, Census 2011
0
10
20
30
40
50
60
70
80
90
100
0 1 2 3 4 5 6 7
% Child
less
Age
1=15‐19, 2= 20‐24, 3=25‐29, 4=30‐34, 5=35‐39, 6=40‐44, 7=45‐49
None
Primary
Secondary
Higher
0
10
20
30
40
50
60
70
80
90
100
0 1 2 3 4 5 6 7
% child
less
Age
1=15‐19, 2= 20‐24, 3=25‐29, 4=30‐34, 5=35‐39, 6=40‐44, 7=45‐49
None
Primary
Secondary
Higher

Statistics South Africa
Exploring childlessness and delayed childbearing in South Africa, 2002-2011 Report 03-06-02
13
3.2.4 Marital status
According to the Figure 4 below, in both 2001 and 2011 women aged 15–49 who have ever
married have a lower level of childlessness when compared to women who were never married.
Never married women include those women who report living together. The level of
childlessness among women who have never married declined between 2001 and 2011, though
marginally. In contrast, the level of childlessness among women who have ever married
increased by almost 50% between 2001 and 2011.
Figure 4: Proportion of childless women aged 15–49 by marital status, Census 2001 and Census 2011
Figure 5 presents the proportion of childless women by marital status and age categories. In
2001 and 2011 across all categories of age, women who never married have higher levels of
childlessness when compared to women who have ever married. However, within every age
group, childlessness increased for both ever married and never married women over time. Teen
women (15–19) who have never married experience the highest levels of childlessness. Teen
women should ideally still be at school, not working, nor married and would by those
circumstances have the higher level of childlessness. Childlessness among married teens (15–
19) increased from 48,6% in 2001 to 64,6% in 2011, indicating a decline in fertility among
married teens over time. The levels of childlessness amongst married women in specific age
groups have doubled from 2001 to 2011. For example, childlessness amongst married women
aged 30–34 and 35–39 increased from 7,7% in 2001 to 14,6% in 2011, and from 5,4% in 2001
to 11,1% in 2011, respectively. Over time, the inclination to pursue childbearing even within
marriage is being delayed across all ages.
47,5 46,2
7,8
15,4
0
5
10
15
20
25
30
35
40
45
50
2001 2011
Never Married
Ever Married

Statistics South Africa
Exploring childlessness and delayed childbearing in South Africa, 2002-2011 Report 03-06-02
14
Figure 5: Childlessness among women aged 15–49 by marital status, Census 2001 and 2011
3.2.5 Geotype
Figures 6 and 7 illustrate that the level of childlessness is higher among women residing in
urban communities than among those residing in non-urban communities in both 2001 and
2011. Amongst 15–19-year-olds there is no substantial difference in the level of childlessness
between urban and non-urban women in both 2001 and 2011. In 2011, the differential gap in
childlessness among women aged 15–19 in non-urban and urban areas is 4%.
However, childlessness among women in the age group 20–29 varied substantially by geotype.
By age 35 and over, the difference in the level of childlessness between urban and non-urban
women was negligible.
2001 2011 2001 2011 2001 2011 2001 2011 2001 2011 2001 2011 2001 2011
15‐19 20‐24 25‐29 30‐34 35‐39 40‐44 45‐49
Ever married 48,6 64,6 25,8 34,7 14,6 22,8 7,7 14,9 5,4 11,1 4,9 9,7 5,1 10,0
Never married 86,2 87,9 53,7 56,0 30,2 34,8 20,1 25,1 16,1 20,5 15,7 18,2 16,5 17,5
0102030405060708090100
% Child
less

Statistics South Africa
Exploring childlessness and delayed childbearing in South Africa, 2002-2011 Report 03-06-02
15
Figure 6: Childlessness among women aged 15–49 by geotype and age, Census 2001
Figure 7: Childlessness among women aged 15–49 by geotype and age, Census 2011
15‐19 20‐24 25‐29 30‐34 35‐39 40‐44 45‐49
Urban 87,1 53,9 27,0 14,2 9,4 8,1 8,1
Non‐urban 81,9 38,9 17,0 9,4 6,8 6,1 6,0
0
10
20
30
40
50
60
70
80
90
100
% Child
less
15‐19 20‐24 25‐29 30‐34 35‐39 40‐44 45‐49
Urban 88,2 56,0 33,4 21,7 15,9 13,3 13,0
Non‐urban 84,2 42,5 22,0 14,8 11,6 10,0 9,9
0
10
20
30
40
50
60
70
80
90
100
% child
less

Statistics South Africa
Exploring childlessness and delayed childbearing in South Africa, 2002-2011 Report 03-06-02
16
3.2.6 Province
Despite the national increase in childlessness among women aged 15–49 in South Africa,
regional trends of childlessness indicate stark differences in patterns of fertility across provinces
in both 2001 and 2011.
Table 2 present the level of childlessness across provinces, whilst Figure 8 shows the
percentage change in the level of childlessness among women by age between 2001 and 2011.
Among women aged 15–19, the level of childlessness increased more noticeably in KwaZulu-
Natal (4%) when compared to all other provinces, indicating an improvement in preventing
teenage pregnancy within the province. However, the level of childlessness in the provinces of
North West and Eastern Cape declined between 2001 and 2011 among teenagers, indicating a
need for intensifying programmes related to teenage fertility in these provinces. Among women
aged 20–24, the highest increase in childlessness occurred in Limpopo (8%), whilst
childlessness declined in the provinces of North West, Eastern Cape and Free State. For the
age cohort 25–29, childlessness increased across all provinces, especially among the provinces
of Gauteng (8%), Western Cape and KwaZulu-Natal (both at 7%). As shown in Table 2, the
level of childlessness increased significantly in KwaZulu-Natal among age cohorts 30–34 (9%),
35–39 (8%) and 40–44 (6%). Across all other age cohorts, the difference in the level of
childlessness between 2001 and 2011 varied significantly across provinces; however, among
the age cohort 45–49, the increase in childlessness varied from 3% to 6% between 2001 and
2011, across provinces.
Table 2: Proportion of childlessness by age and province, 2001 and 2011
15–19 20–24 25–29 30–34 35–39 40–44 45–49
Province 2001 2011 2001 2011 2001 2011 2001 2011 2001 2011 2001 2011 2001 2011
WC 84,6 88,0 52,2 56,6 27,7 35,1 15,0 22,1 9,2 15,7 8,4 13,2 8,4 12,4
EC 87,5 84,7 52,1 49,2 23,8 28,7 12,0 18,9 7,9 13,9 6,9 11,9 6,7 11,5
NC 83,4 84,3 41,0 41,3 17,4 23,4 9,2 13,2 7,5 11,0 7,7 10,9 7,6 11,3
FS 87,1 87,0 52,1 50,0 24,4 25,4 12,0 16,0 8,3 11,8 7,0 9,5 6,6 10,0
KZN 81,4 85,6 44,7 48,9 23,4 30,2 12,8 20,8 8,8 16,2 7,4 13,3 7,4 12,7
NW 86,7 85,1 48,1 44,9 21,1 22,6 11,0 15,1 8,3 11,5 7,6 10,2 7,0 10,8
GP 87,6 88,6 54,1 57,4 26,9 34,5 14,8 22,6 10,0 16,8 8,4 14,1 8,3 14,2
MP 80,2 83,4 40,5 45,0 19,7 24,8 10,6 16,4 8,1 11,9 7,5 11,0 7,4 10,6
LP 82,8 86,0 36,4 44,4 14,0 19,6 7,5 11,2 5,2 8,8 4,6 7,3 4,7 7,4

Statistics South Africa
Exploring childlessness and delayed childbearing in South Africa, 2002-2011 Report 03-06-02
17
Figure 8: Percentage change in childlessness between 2001 and 2011, across provinces
3.2.7 Employment status
Figure 9 presents the levels of childless women by age and employment status over time. The
level of childlessness among employed women increased between 2001 and 2011 for all ages,
as did the level of childlessness among unemployed women between 2001 and 2011. For all
ages, the level of childlessness is higher among employed women when compared to
unemployed women in 2001 and 2011. As expected, the level of childlessness among
employed and unemployed 15–19-year-olds was the highest, declining with age. Variations in
childlessness were evident in ages 20–34, with employed women in 2011 having the highest
level of childlessness when compared to unemployed and employed women in 2001 as well as
unemployed women in 2011. Among women aged 35 and over there was little variation in the
level of childlessness by employment status.
‐4
‐2
0
2
4
6
8
10
0 1 2 3 4 5 6 7Percentage
chan
ge in
child
lessness
Age
1=15‐19, 2=20‐24, 3=25‐29, 4=30‐34, 5=35‐39, 6=40‐44, 7=45‐49
WC
EC
NC
FS
KZN
NW
GP
MPG
LP

Statistics South Africa
Exploring childlessness and delayed childbearing in South Africa, 2002-2011 Report 03-06-02
18
Figure 9: Childlessness of all women aged 15–49 by employment status, 2001 and 2011
3.2.8 Occupation
Findings from Table 3 indicate that over time and across all the age groups, childlessness was
more apparent among managers and professional women. Between 2001 and 2011, there was
a decline in the proportion of childless women aged 15–24 who were managers, professionals,
technicians and clerks. However, among women aged 25 and over there was a consistent
increase of childlessness over time and across all occupations. Overall, the lowest prevalence
of childlessness in both periods across all age groups were found among women with
elementary occupations, followed by women in skilled agriculture and women who were plant
and machine operators.
15‐19 20‐24 25‐29 30‐34 35‐39 40‐44 45‐49
Employed 2001 72,9 53,7 29,5 14,4 8,8 7,3 7,0
Employed 2011 77,8 55,0 35,8 22,1 15,1 12,1 11,5
Unemployed 2001 63,3 40,7 20,9 11,9 8,8 8,2 7,9
Unemployed 2011 76,5 44,5 23,6 15,3 12,3 10,7 11,1
0
10
20
30
40
50
60
70
80
90
100
%

Statistics South Africa
Exploring childlessness and delayed childbearing in South Africa, 2002-2011 Report 03-06-02
19
Table 3: Childlessness among women aged 15–49 by occupation and age, Census 2001 and 2011
Occupation
15-19 20-24 25-29 30-34 35-39 40-44 45-49
2001 2011 2001 2011 2001 2011 2001 2011 2001 2011 2001 2011 2001 2011
Manager 85,8 84,2 71,0 62,1 43,4 45,0 23,0 27,9 13,3 18,5 9,3 13,5 9,6 14,9
Professional 84,1 83,8 79,1 70,6 53,7 53,4 25,4 30,5 14,2 18,1 11,2 13,7 10,3 12,4
Technician 87,4 77,8 69,3 60,4 38,0 38,4 15,0 23,6 8,8 15,2 6,8 11,7 6,8 11,5
Clerk 85,9 80,1 65,5 61,6 34,1 39,4 15,7 23,5 8,8 15,9 7,0 13,4 7,1 12,5
Sales and services 83,8 80,1 57,8 55,7 28,6 34,2 14,1 21,5 9,1 14,6 7,0 12,6 6,9 10,9
Skilled agriculture 60,3 74,3 32,7 51,7 16,3 32,7 10,3 24,3 7,1 13,9 6,9 12,9 7,1 13,1
Craft and related trade 66,3 76,4 43,7 51,6 20,2 31,8 11,0 20,3 7,5 13,4 6,8 11,8 6,8 11,3
Plant and machine operator 74,0 77,0 42,1 50,1 20,2 33,4 10,1 19,6 6,9 14,0 6,5 10,3 8,2 11,2
Elementary 65,7 74,7 40,2 45,3 20,3 27,9 11,2 18,4 7,7 13,7 6,8 11,2 6,2 10,6
3.2.9 Industry
Table 4 shows the percentage of childlessness for all women aged 15–49 by industry within
which they work. Across all the industries, younger women aged 15–19 were most likely to be
childless in 2011. As expected, prevalence of childlessness is lower for older women across all
the industries. Overall, the levels of childlessness are highest among women working in the
financial intermediation, insurance and business sectors, followed by women across all ages
working in the transport, storage and communication sectors. In 2011, women in the financial
intermediation, insurance and business sectors have 80,5% and 60,6% of childlessness in the
age group 15–19 and 20–24, respectively. The proportions of childlessness, specifically in the
age group 15–34, are lowest among women working in agriculture, hunting, forestry and fishing.
For instance, the proportions of childless women in the age groups 25–29 and 30–34 are 27%
and 17,6%, respectively. Amongst older women aged 45-49, the lowest levels of childlessness
begin to manifest in the electricity, gas and water supply industries.

Statistics South Africa
Exploring childlessness and delayed childbearing in South Africa, 2002-2011 Report 03-06-02
20
Table 4: Childlessness among all women aged 15–49 by industry, 2011
Industry 15–19 20–24 25–29 30–34 35–39 40–44 45–49
Agriculture, hunting, forestry and fishing 66,5 43,1 27,0 17,6 14,4 11,0 11,5
Mining and quarrying 73,9 55,8 33,3 23,0 14,9 10,2 11,1
Manufacturing 79,3 55,1 34,8 21,7 14,7 12,9 11,0
Electricity, gas and water supply 77,7 61,0 39,6 21,1 13,8 14,7 10,3
Construction 79,9 51,6 33,0 21,2 13,0 12,1 11,0
Wholesale and retail trade 79,4 54,2 32,8 20,6 14,4 12,2 11,6
Transport, storage and communication 82,6 62,2 41,8 24,2 16,5 12,6 12,5
Financial intermediation, insurance, real estate and business 80,4 62,6 42,8 26,9 18,2 14,1 13,6
Community, social and personal services 78,1 58,3 39,2 23,1 14,9 11,6 11,2
Private households 75,1 44,8 28,2 18,6 13,8 11,3 10,7
3.3 Childlessness and completed fertility rate
3.3.1 Introduction
Under conditions of universal marriage and no efforts to control fertility, the proportion of women
who are childless at the end of the reproductive period provides a good measure of primary
infertility (Frank, 1983). Existing literature on the influence of primary infertility on childlessness
is well documented. Bongaarts and Potter (1983) estimate primary infertility at three per cent in
the absence of pathological infertility. However, childlessness, as defined in this report, includes
women with no children voluntarily and involuntarily. For the 21 countries of Africa for which
Frank (1983) had data, levels of childlessness averaged 12%, and small areas in central Africa
have displayed incredibly high levels of childlessness, i.e. 30–40% (Mammo and Morgan,
1986).
A rapidly increasing proportion of women remaining childless in their late twenties and early
thirties appears to indicate that lifetime childlessness might be expected to increase sharply in
the majority of industrialised countries (Sobotka, 2005). Postponing fertility until the thirties,
therefore, carries the risk of lifetime childlessness. Thus, temporary childlessness may lead to
involuntary childlessness if women underestimate age related declines in fecundity or
overestimate the success of assisted reproduction therapies (Leridon, 2004; Maheshwari et al.,
2008). Esteve et al. (2016) suggest that more recent childlessness may be related to the
postponement of birth of the first child to a later age and to wait for the optimal family or material
conditions to have child. When the average age at first birth drops to about 30 years of age, the

Statistics South Africa
Exploring childlessness and delayed childbearing in South Africa, 2002-2011 Report 03-06-02
21
effects further delaying motherhood for even another year raises the childlessness level by 2
per cent among women (Esteve et al., 2016). However, the question remaining is how does the
increased level of childlessness affect the overall fertility of a country. The aim of this section is
thus to investigate the relationship between lifetime childlessness and completed fertility rates in
South Africa.
Lifetime childlessness is defined as a woman having no live birth or no living children at the end
of her reproductive lifespan (age 49) (WHO, 1991). This category, often used by demographers
to indicate infertility, includes women who have never been pregnant, those who have suffered
pregnancy losses, and those with no live births. If not clearly indicated otherwise, it may include
women who currently have no living children but may have had one or more live births (Unisa,
1999). In the present analysis, 'lifetime childlessness’ is considered as all ‘zero parity’ women
aged 45–49.
Table 5 indicates the proportion of women childless over time by selected age categories.
Between 2001 and 2011, childlessness increased from 9% in 2001 to 15% in 2011 among
women aged 30 and over. Increased levels of childlessness at younger ages over time indicate
an increase in delayed childbearing in South Africa. From the four categories, the highest
increase is observed in women over 30 years of age. Notwithstanding the ten-year gap between
Census 2001 and Census 2011, as shown in Table 6 there is a significant increase in the level
of childlessness in this period.
Table 5: Childlessness by selected age categories, Census 2001 and Census 2011
Census
Age of woman
over 30 over 35 over 40 over 45
2001 childless % 9,20 7,80 7,34 7,27
2011 childless % 14,96 13,02 12,12 11,95

Statistics South Africa
Exploring childlessness and delayed childbearing in South Africa, 2002-2011 Report 03-06-02
22
Table 6: Percentage of childless women by selected age categories over time, Census 2001 and 2011
Number of women
15–49 childless % Number of women
45–49 childless %
2001 4 196 693 33,23 81 811 7,27
2011 5 160 392 36,33 167 951 11,89
Recent trends of increased childlessness by age over time indicate increasing levels of delayed
childbearing (Table 5). It is postulated that fertility delayed is in fact fertility forgone. The age at
which a woman first gives birth can and often does influence the number of children a woman
will conceive in her lifetime, i.e. completed fertility (Bumpass et al., 1978; Esteve et al., 2016;
Sobotka et al., 2008). The completed fertility rate (CFR) refers to the fertility rate of women in
the age group 45–49. Women who give birth at an early age experience a higher number of
births in their childbearing lifespan than women who have their first birth later in life. Figure 7
indicates that, with an increase in age at first birth there is a decline in the mean number of
children ever born. Women who had first given birth younger than 15 years of age, experienced
a mean children ever born (CEB) of 4,18, whilst women who had first given birth at age 25 and
over experienced a mean CEB of 2,55. Sobotka et al. (2008) state that a further shift toward
later childbearing may lead to a decline in CFR.
Table 7: Percentage distribution of women aged 45–49 by number of children ever born and mean CEB by age at first birth, Census 2011
Parity distribution
Age at first birth 1 2 3 4 5 6 7+ Total % Mean CEB
<15 12,0 15,0 17,1 17,1 13,4 10,2 15,3 100,0 4,18
15–17 9,3 15,4 20,9 19,6 13,7 8,8 12,2 100,0 4,04
18–19 8,3 17,8 24,1 20,1 12,8 7,7 9,2 100,0 3,83
20–21 9,4 22,3 25,8 18,5 10,6 6,3 7,1 100,0 3,55
22–24 11,8 29,3 26,4 15,4 8,0 4,3 4,7 100,0 3,16
25+ 25,3 35,8 19,7 9,4 4,4 2,4 2,9 100,0 2,55
Stats SA, 2015

Statistics South Africa
Exploring childlessness and delayed childbearing in South Africa, 2002-2011 Report 03-06-02
23
Not only does delayed childbearing inversely relate to completed fertility rate (CFR), but Table 8
also suggests that over time, completed fertility rate declined whilst childlessness increased.
Nationally, the level of childlessness increased from 7,3% to 11,9 % between 2001 and 2011,
whilst CFR decreased from 3,31 to 2,95 in the same period. To determine the extent to which
this pattern is influenced by socio-demographic factors, Table 7 displays the relationship
between childlessness at the end of childbearing years and completed fertility rates over time by
socio-demographic characteristics. Across all population groups, there was a decline in CFR
with an increase in childlessness, although there are differential levels in CFR and childlessness
between population groups. Among women aged 45–49, white women have the highest level of
childlessness and lowest completed fertility rate. Conversely, black African women have
recorded completed fertility rates of almost 3,9 in 2001 and 3,2 in 2011, while their level of
childlessness is the lowest (6,7%) in 2001 and 2011 (10,9%). The pattern of increased
childlessness and declining CFR was exhibited across all educational categories; both urban
and non-urban women as well as ever married and never married women. Women with a higher
levels of education experienced the highest levels of childlessness of 9,1% in 2001 and 14,1%
in 2011, whilst their CFR declined from 2,51 in 2001 to 2,17 in 2011. Married women and non-
urban women experience higher CFR and lower childlessness when compared to their
counterparts, i.e. never married and women residing in urban settings. For the various
subgroups, those with higher childlessness indicated lower completed fertility rates. This pattern
indicates a relationship between the level of childlessness and the completed fertility rate of
women in the same cohort. Also, this pattern is influenced by socio-demographic factors such
as population group, marital status, education and residence.

Statistics South Africa
Exploring childlessness and delayed childbearing in South Africa, 2002-2011 Report 03-06-02
24
Table 8: Lifetime childlessness and completed fertility rate (CFR) among women aged 45–49, Census 2001 and 2011
2001 2011
CFR % childless CFR % childless
National 3,31 7,3 2,95 11,9
Black African 3,90 6,70 3,22 10,90
Coloured 3,01 7,07 2,60 10,80
Indian/ Asian 2,52 9,23 2,14 14,66
White 2,20 9,89 1,85 18,63
None 4,29 7,39 3,70 13,66
Primary 3,88 6,85 3,49 10,91
Secondary 2,97 7,18 2,73 11,56
Higher 2,51 9,07 2,17 14,07
Never married 2,80 15,05 2,66 16,84
Ever married 3,79 4,52 3,12 9,28
Urban 2,99 8,06 2,57 12,96
Non-urban 4,45 5,96 3,73 9,91

Statistics South Africa
Exploring childlessness and delayed childbearing in South Africa, 2002-2011 Report 03-06-02
25
Chapter 4: Childlessness among qualified and unqualified women aged 20–49
4.1 Introduction
This chapter focuses on childlessness among qualified and unqualified women aged 20–49.
“Qualified women” in the analysis refers to women who acquired post-matric tertiary education
while “unqualified women” are those with primary, secondary education, or no education. The
age group 20-49 encompasses women, who in terms of South African school enrolment age,
have already passed matric and acquired a tertiary qualification. In South Africa, the appropriate
age for primary education is 7 to 13 years, whilst for secondary education it is 14 to 19 (MDG,
2013).
The previous chapters indicated that in the general population, childlessness increased from
2001 to 2011. Studies have shown that professional women have a higher rate of childlessness
than women in the general population (Yoger and Vierra, 1983). Among professional women,
marriage is delayed, number of children is lower and the rate of childlessness is higher (Astin,
1969). Higher education and labour force participation are also identified to have a high
correlation with childlessness (Hagestad and Call, 2007).
This chapter is organised as follows: Firstly, the chapter identifies the levels of childlessness
among qualified and unqualified women. Secondly, the chapter establishes whether there are
significant differences among qualified women who ever had children and qualified women who
are childless.
4.2 Distribution of qualified women by age
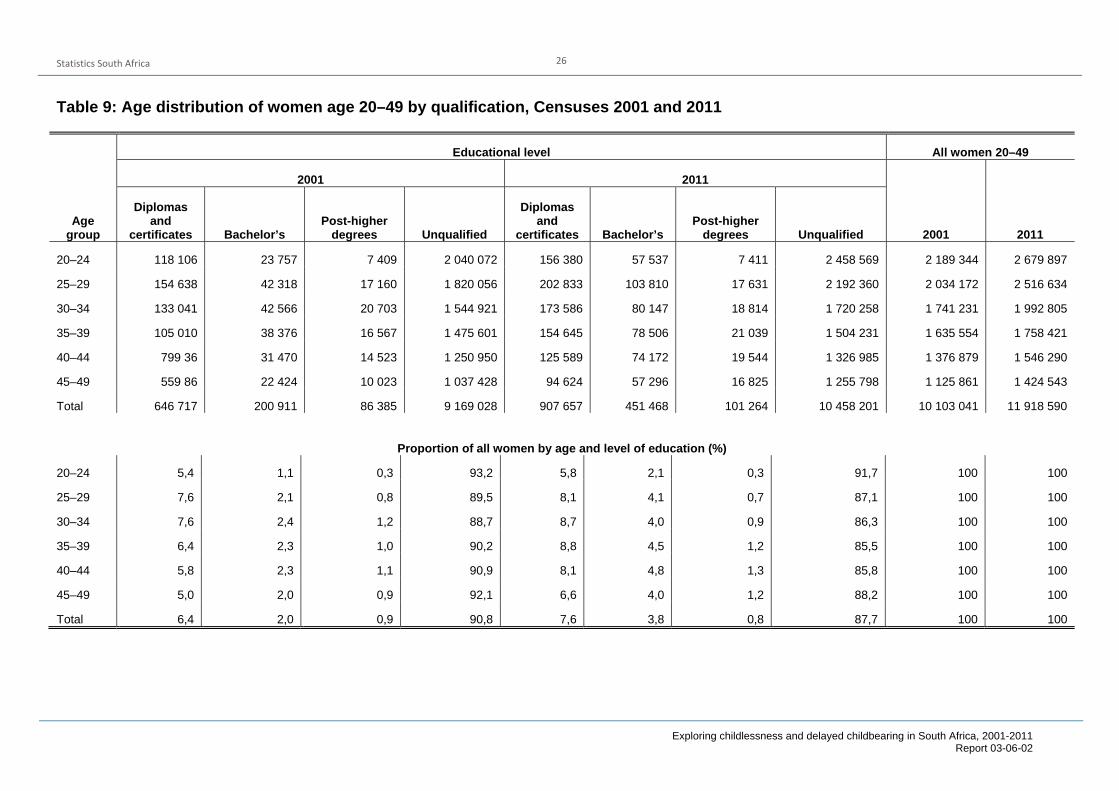
Results in Table 9 indicate that across all qualifications in 2001 and 2011 the majority of
qualified women aged 20–49 had attained diplomas and certificates. There is a slight increase
in the proportion of women with diplomas and a bachelor’s degree between 2001 and 2011
across all age groups. Amongst qualified women aged 25–29, the proportion of women with
certificates and diplomas increased from 7,6% in 2001 to 8,1% in 2011. Similarly, the proportion
of women with a bachelor’s degree within the same age group increased from 2,1% in 2001 to
4,1% in 2011.
With regard to women with post-higher degrees, the table indicates a stable trend over the
same period for all age groups.
Statistics South Africa
Exploring childlessness and delayed childbearing in South Africa, 2001-2011
Report 03-06-02
26
Table 9: Age distribution of women age 20–49 by qualification, Censuses 2001 and 2011
Age group
Educational level All women 20–49
2001 2011
2001 2011
Diplomas and
certificates Bachelor’s Post-higher
degrees Unqualified
Diplomas and
certificates Bachelor’s Post-higher
degrees Unqualified
20–24 118 106 23 757 7 409 2 040 072 156 380 57 537 7 411 2 458 569 2 189 344 2 679 897
25–29 154 638 42 318 17 160 1 820 056 202 833 103 810 17 631 2 192 360 2 034 172 2 516 634
30–34 133 041 42 566 20 703 1 544 921 173 586 80 147 18 814 1 720 258 1 741 231 1 992 805
35–39 105 010 38 376 16 567 1 475 601 154 645 78 506 21 039 1 504 231 1 635 554 1 758 421
40–44 799 36 31 470 14 523 1 250 950 125 589 74 172 19 544 1 326 985 1 376 879 1 546 290
45–49 559 86 22 424 10 023 1 037 428 94 624 57 296 16 825 1 255 798 1 125 861 1 424 543
Total 646 717 200 911 86 385 9 169 028 907 657 451 468 101 264 10 458 201 10 103 041 11 918 590
Proportion of all women by age and level of education (%)
20–24 5,4 1,1 0,3 93,2 5,8 2,1 0,3 91,7 100 100
25–29 7,6 2,1 0,8 89,5 8,1 4,1 0,7 87,1 100 100
30–34 7,6 2,4 1,2 88,7 8,7 4,0 0,9 86,3 100 100
35–39 6,4 2,3 1,0 90,2 8,8 4,5 1,2 85,5 100 100
40–44 5,8 2,3 1,1 90,9 8,1 4,8 1,3 85,8 100 100
45–49 5,0 2,0 0,9 92,1 6,6 4,0 1,2 88,2 100 100
Total 6,4 2,0 0,9 90,8 7,6 3,8 0,8 87,7 100 100

Statistics South Africa
Exploring childlessness and delayed childbearing in South Africa, 2001-2011
Report 03-06-02
27
4.3 Childlessness of qualified women by age
Figure 10 attests to prior discussions regarding the influence of education on childlessness.
Higher education among women is significantly associated with childlessness. As the post-
matric education of women increases, so does the prevalence of childlessness.
The difference in the levels of childlessness between qualified and unqualified women is most
distinct between ages 20–34. The level of childlessness among qualified women was almost
double the level of childlessness of unqualified women in the age groups 20–24 and 25–29. The
variation in childlessness between qualified and unqualified women begins to narrow in the age
group 35–39 and older. The decrease in the proportion of childless women by age is an
indication of fertility postponement among qualified women. However, postponement of first
birth may lead to involuntary childlessness if women underestimate age related declines in
fecundity (Leridon, 2004).

Statistics South Africa
Exploring childlessness and delayed childbearing in South Africa, 2002-2011 Report 03-06-02
28
Figure 10: Childlessness among women aged 20–49 by qualification level, 2011
4.4 Childlessness of women by qualification level and population group
The results in Figure 11 indicate that across all population groups and age groups, the
prevalence of childlessness is higher among qualified women. However, Indian/Asian and white
women have the highest prevalence of childlessness among qualified and unqualified women
compared to black African and coloured women. Notably, in the youngest age group (20–24) of
white and Indian/Asian women, there is a slight difference in childlessness among qualified and
unqualified women, whilst a clear distinction in childlessness between qualified and unqualified
women is apparent among black African and coloured women in the same age group. At age
group 25–34, the variation in childlessness among qualified and unqualified whites and Indian
/Asian women begins to be evident.
20‐24 25‐29 30‐34 35‐39 40‐44 45‐49
Unqualified women 48,3 25,9 17,3 13,3 11,4 11,3
Qualified women 74,4 50,8 29,1 18,7 14,5 13,9
0
10
20
30
40
50
60
70
80

Statistics South Africa
Exploring childlessness and delayed childbearing in South Africa, 2002-2011 Report 03-06-02
29
Figure 11: Childlessness among women aged 20–49 by qualification level and population group, 2011
4.5 Childlessness of women by qualification level and employment status
Figure 12 shows the level of childlessness between qualified and unqualified women by
employment status for the year 2011. The results suggest that the prevalence of childlessness
across all the age groups was higher among qualified women than among unqualified women,
irrespective of their employment status. The wider gaps of childlessness between employed
(qualified and unqualified) and unemployed (qualified and unqualified) women are observed in
young women aged 20–29. For instance, among unemployed women aged 20–24, there is a
marked 30,7% difference in childlessness between qualified and unqualified women. The gap of
childlessness among employed qualified and unqualified women and unemployed qualified and
unqualified women narrowed for women aged 35 and above. This could indicate that the desire
46,1
48,3
77,8
79,8
24,3
25,5
48,0
48,0
16,4
16,1
27,0
29,0
12,7
11,5
17,7
20,2
10,8
9,8
14,6
18,0
10,6
10,1
13,9
17,5
67,1
78,5
90,0
94,0
39,7
55,0
71,4
76,0
22,2
29,0
40,3
42,9
13,9
19,2
23,7
26,8
10,3
15,0
19,4
20,6
9,7
13,4
17,0
19,8
0 10 20 30 40 50 60 70 80 90 100
Black African
Coloured
Indian or Asian
White
Black African
Coloured
Indian or Asian
White
Black African
Coloured
Indian or Asian
White
Black African
Coloured
Indian or Asian
White
Black African
Coloured
Indian or Asian
White
Black African
Coloured
Indian or Asian
White
20‐24
25‐29
30‐34
35‐39
40‐44
45‐49
Qualified women Unqualified women

Statistics South Africa
Exploring childlessness and delayed childbearing in South Africa, 2002-2011 Report 03-06-02
30
to have children amongst qualified women increases as age increases, irrespective of their
employment status.
Figure 12: Childlessness among women aged 20–49 by qualification and employment status, 2011
NB: Official definition of employment was used in the analysis
4.6 Childlessness of women by qualification level and income
Figure 13 indicates that regardless of income, the prevalence of childlessness is higher for
women with a qualification than unqualified women. Across all age groups, qualified women
with an income had a higher childlessness prevalence than those without an income. The wider
gap of childlessness between qualified and unqualified women with an income is more
pronounced in women at younger ages 20–24 (30%). The major difference of childlessness
among qualified women with an income and those with no income of 13,4% was observed in
women aged 25–29. The gap between qualified and unqualified women starts to converge as
women get older. Further, the prevalence of childlessness of unqualified women with an income
and those with no income is almost consistent across all age groups. The pattern suggests that
for older women aged 40 and older, childlessness among qualified women is not influenced by
income.
50,7
42,9
29,6
22,3
19,0
14,8
13,6
11,9
11,3
10,4
10,9
10,9
77,7
73,6
55,4
48,3
31,3
27,8
19,1
18,5
14,6
14,5
13,5
14,3
0 10 20 30 40 50 60 70 80 90 100
Employed
Unemployed
Employed
Unemployed
Employed
Unemployed
Employed
Unemployed
Employed
Unemployed
Employed
Unemployed
20‐24
25‐29
30‐34
35‐39
40‐44
45‐49
Qualified women Unqualified women

Statistics South Africa
Exploring childlessness and delayed childbearing in South Africa, 2002-2011 Report 03-06-02
31
Figure 13: Childlessness among women aged 20–49 by qualification and income, Census 2011
4.7 Childlessness of women by qualification level and marital status
Figure 14 indicates that in 2011, across all marital categories and between all the age groups,
qualified women experienced higher levels of childlessness when compared to unqualified
women. Across all age groups, never married qualified women appear to have higher levels of
childlessness compared to married women. In 2011, childlessness among qualified married
women between the ages 20–24 and 25–29 was almost twice that of married unqualified
women. This indicates that although marriage bears an influence on childbearing (especially
amongst younger women), the qualifications of the women act as a barrier towards early
childbearing.
46,9 47,3
23,127,6
15,018,1
11,9 13,410,3 11,2 10,1 11,1
72,676,7
41,4
54,8
22,7
31,0
16,819,2
14,1 14,6 15,0 13,8
0
10
20
30
40
50
60
70
80
noincome income
noincome income
noincome income
noincome income
noincome income
noincome income
20‐24 25‐29 30‐34 35‐39 40‐44 45‐49
Unqualified women Qualified women

Statistics South Africa
Exploring childlessness and delayed childbearing in South Africa, 2002-2011 Report 03-06-02
32
Figure 14: Childlessness among women aged 20–49 by qualification and marital status, 2011
4.8 Childlessness of women by qualification level and field of study
Figure 15 displays the results of childlessness by field of study for the year 2011. Childlessness
was noticeably high among qualified women who trained in visual or performance arts (49%),
psychology (46%) and mechatronics (45%). Women in the field of civil engineering and building
construction follow with a prevalence of 44%. Women in the field of education and development
experienced the lowest prevalence of childlessness (16,6%). These were followed by childless
women in the field of libraries, museums and safety in society with a prevalence of less than
21%.
31,4
53,2
18,8
30,7
12,9
22,0
10,0
18,4
9,1
16,3
9,8
16,2
60,8
77,6
42,2
58,1
21,9
42,3
13,2
33,1
10,8
27,8
11,3
26,7
0 10 20 30 40 50 60 70 80
Married
Never married
Married
Never married
Married
Never married
Married
Never married
Married
Never married
Married
Never married
20‐24
25‐29
30‐34
35‐39
40‐44
45‐49
Qualified women Unqualified women

Statistics South Africa
Exploring childlessness and delayed childbearing in South Africa, 2002-2011 Report 03-06-02
33
Figure 15: Childlessness among qualified women aged 20–49 by field of education, 2011
4.9 Childlessness of women by qualification level and industry
Table 9 below presents levels of childlessness among women who are qualified and unqualified
by industry within which they work. Results indicate significant differences in childlessness by
type of industry. Overall, the level of childlessness is highest among women working in the
financial intermediation, insurance and business sectors, followed by women working in
transport, storage and communication across all ages. Within the age groups 20–34, qualified
women present the highest level of childlessness when compared with their unqualified
counterparts. There is variation in low childlessness across industries and within age groups of
qualified and unqualified women. Looking at unqualified women in the age group 20–24, the
lowest level of childlessness was evident in women working in agriculture, hunting, forestry and
fishing; similarly, the lowest levels among qualified women is witnessed in women working in
the field of electricity, gas and water supply. Among qualified women aged 25–29, childlessness
32,5
44,3
48,7
35,7
40,2
28,6
16,6
41,9
28,1
28,0
40,8
41,0
41,1
20,9
38,8
30,0
27,4
37,9
40,7
45,9
27,3
32,9
33,0
29,8
39,1
34,5
39,5
24,8
32,8
44,2
41,5
32,7
40,8
42,7
21,8
45,5
15,5
31,1
0 10 20 30 40 50 60 70 80 90 100
Agriculture or Renewable Energy Resources
Architecture or Environment Design
Arts, Visual or Performing
Business, Commerce or Management Sciences
Communication
Computer Science or Data Processing
Education, Training or Development
Engineering or Engineering Technology
Health Care or Health Sciences
Home Economics
Industrial Arts, Trades or Technology
Languages, Linguistics or Literature
Law
Libraries or Museums
Life Sciences or Physical Sciences
Mathematical Sciences
Military Sciences
Philosophy, Religion or Theology
Physical Education or Leisure
Psychology
Public Administration or Social Services
Social Sciences or Social Studies
Other
Management
Marketing
Information Technology and Computer Sciences
Finance, Economics and Accounting
Office Administration
Electrical Infrastructure Construction
Civil Engineering and Building construction
Engineering
Primary Agriculture
Hospitality
Tourism
Safety in Society
Mechatronics
Education and development
Other
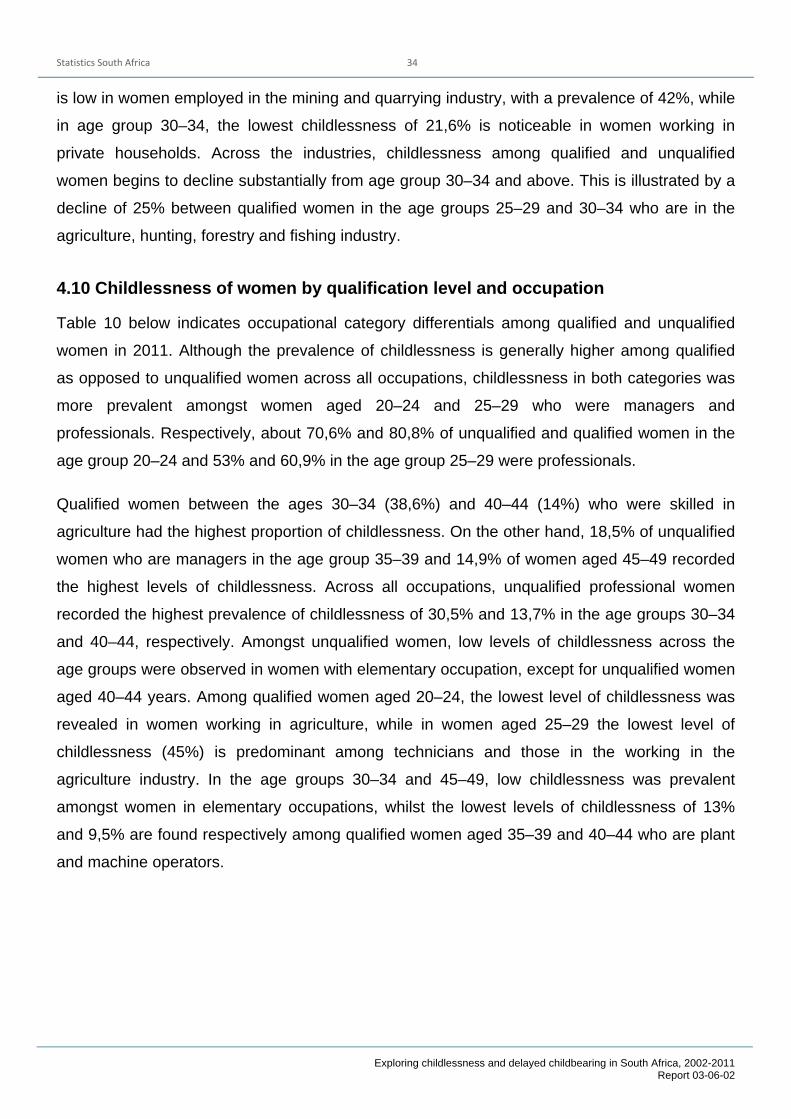
Statistics South Africa
Exploring childlessness and delayed childbearing in South Africa, 2002-2011 Report 03-06-02
34
is low in women employed in the mining and quarrying industry, with a prevalence of 42%, while
in age group 30–34, the lowest childlessness of 21,6% is noticeable in women working in
private households. Across the industries, childlessness among qualified and unqualified
women begins to decline substantially from age group 30–34 and above. This is illustrated by a
decline of 25% between qualified women in the age groups 25–29 and 30–34 who are in the
agriculture, hunting, forestry and fishing industry.
4.10 Childlessness of women by qualification level and occupation
Table 10 below indicates occupational category differentials among qualified and unqualified
women in 2011. Although the prevalence of childlessness is generally higher among qualified
as opposed to unqualified women across all occupations, childlessness in both categories was
more prevalent amongst women aged 20–24 and 25–29 who were managers and
professionals. Respectively, about 70,6% and 80,8% of unqualified and qualified women in the
age group 20–24 and 53% and 60,9% in the age group 25–29 were professionals.
Qualified women between the ages 30–34 (38,6%) and 40–44 (14%) who were skilled in
agriculture had the highest proportion of childlessness. On the other hand, 18,5% of unqualified
women who are managers in the age group 35–39 and 14,9% of women aged 45–49 recorded
the highest levels of childlessness. Across all occupations, unqualified professional women
recorded the highest prevalence of childlessness of 30,5% and 13,7% in the age groups 30–34
and 40–44, respectively. Amongst unqualified women, low levels of childlessness across the
age groups were observed in women with elementary occupation, except for unqualified women
aged 40–44 years. Among qualified women aged 20–24, the lowest level of childlessness was
revealed in women working in agriculture, while in women aged 25–29 the lowest level of
childlessness (45%) is predominant among technicians and those in the working in the
agriculture industry. In the age groups 30–34 and 45–49, low childlessness was prevalent
amongst women in elementary occupations, whilst the lowest levels of childlessness of 13%
and 9,5% are found respectively among qualified women aged 35–39 and 40–44 who are plant
and machine operators.

Statistics South Africa
Exploring childlessness and delayed childbearing in South Africa, 2001-2011
Report 03-06-02
35
Table 10: Childlessness among women aged 20–49 by qualification and industry of work, Census 2011
Industry
20–24 25–29 30–34 35–39 40–44 45–49
Unqualified women
Qualified women
Unqualified women
Qualified women
Unqualified women
Qualified women
Unqualified women
Qualified women
Unqualified women
Qualified women
Unqualified women
Qualified women
Agriculture, hunting, forestry and fishing 43,1 72,5 27,0 50,7 17,6 26,0 14,4 16,2 11,0 12,3 11,5 7,6
Mining and quarrying 55,8 71,5 33,3 41,7 23,0 28,9 14,9 11,4 10,2 11,7 11,1 6,2
Manufacturing 55,1 74,5 34,8 54,5 21,7 28,7 14,7 17,6 12,9 15,7 11,0 11,7
Electricity, gas and water supply 61,0 65,3 39,6 42,7 21,1 24,8 13,8 14,2 14,7 13,3 10,3 10,3
Construction 51,6 72,7 33,0 49,2 21,2 26,8 13,0 13,9 12,1 14,3 11,0 11,2
Wholesale and retail trade 54,2 73,5 32,8 47,7 20,6 27,5 14,4 17,1 12,2 12,9 11,6 13,3
Transport, storage and communication 62,2 73,9 41,8 52,6 24,2 29,2 16,5 18,3 12,6 10,8 12,5 12,4
Financial intermediation, insurance and business 62,6 79,6 42,8 59,8 26,9 33,3 18,2 19,9 14,1 15,1 13,6 14,0
Community, social and personal services 58,3 72,8 39,2 49,9 23,1 26,4 14,9 14,5 11,6 10,4 11,2 9,6
Private households 44,8 68,2 28,2 45,3 18,6 21,6 13,8 16,5 11,3 11,6 10,7 8,4

Statistics South Africa
Exploring childlessness and delayed childbearing in South Africa, 2002-2011 Report 03-06-02
36
Table 11: Childlessness among women aged 20–49 by age, qualification and occupation, Census 2011
Occupation
20–24 25–29 30–34 35–39 40–44 45–49
Unqualified women
Qualified women
Unqualified women
Qualified women
Unqualified women
Qualified women
Unqualified women
Qualified women
Unqualified women
Qualified women
Unqualified women
Qualified women
Manager 62,1 79,5 45,0 60,4 27,9 33,9 18,5 21,1 13,5 13,6 14,9 14,2
Professional 70,6 80,8 53,4 60,9 30,5 32,5 18,1 17,1 13,7 12,1 12,4 10,7
Technician 60,4 69,1 38,4 45,0 23,6 24,7 15,2 14,3 11,7 10,5 11,5 9,6
Clerk 61,6 74,0 39,4 50,7 23,5 27,4 15,9 16,4 13,4 13,2 12,5 11,8
Sales and services 55,7 74,3 34,2 48,6 21,5 27,3 14,6 16,5 12,6 13,4 10,9 10,6
Skilled agriculture 51,7 65,4 32,7 45,0 24,3 38,6 13,9 22,4 12,9 14,0 13,1 9,7
Craft and related trade 51,6 75,4 31,8 46,4 20,3 27,6 13,4 13,6 11,8 10,8 11,3 10,4
Plant and machine operator 50,1 72,4 33,4 46,5 19,6 23,9 14,0 13,0 10,3 9,5 11,2 12,0
Elementary 45,3 68,2 27,9 47,0 18,4 23,1 13,7 14,9 11,2 12,1 10,6 9,4

Statistics South Africa
Exploring childlessness and delayed childbearing in South Africa, 2001-2011
Report 03-06-02
37
4.11 Childlessness of women by qualification level and province
Table 12 shows provincial variation in the location of qualified and unqualified childless women
across South Africa. Provincial analysis indicates that amongst qualified and unqualified
women, the highest proportion of childless women reside in Western Cape and Gauteng.
However, in the age group 35–39, unqualified women in KwaZulu-Natal have the highest
prevalence of childlessness. Across all the provinces, the widest difference in childlessness
between qualified and unqualified women of 33% and 38% is observed among women aged
20–24 and 30–34 respectively in the Western Cape. In contrast, the lowest level of
childlessness among qualified and unqualified women is found in women who reside in
Limpopo, except for unqualified women aged 20–24. The lowest proportion (39,8%) of women
who are childless live in Northern Cape. The spatial pattern of childlessness revealed in this
analysis corroborates with the fertility patterns and behaviour in these provinces.

Statistics South Africa
Exploring childlessness and delayed childbearing in South Africa, 2001-2011
Report 03-06-02
38
Table 12: Childlessness among women aged 20–49 by qualification and province, Census 2011
Province
20–24 25–29 30–34 35–39 40–44 45–49
Unqualified women
Qualified women
Unqualified women
Qualified women
Unqualified women
Qualified women
Unqualified women
Qualified women
Unqualified women
Qualified women
Unqualified women
Qualified women
WC 53,0 85,9 29,3 66,9 18,3 41,5 13,6 24,9 11,5 21,2 11,2 17,9
EC 47,9 67,5 26,2 46,3 17,3 25,5 13,1 16,0 11,5 12,1 11,1 11,1
NC 39,8 74,5 21,0 46,7 11,7 29,5 10,1 12,1 10,1 12,2 10,1 14,0
FS 47,9 74,2 22,5 47,3 14,7 25,8 10,9 16,3 9,0 10,9 9,6 10,7
KZN 47,2 70,8 28,0 47,2 19,7 27,6 15,6 18,7 12,8 14,5 12,1 13,9
NW 43,0 72,6 20,7 41,0 14,2 20,7 11,1 12,7 10,0 8,3 10,6 8,5
GP 53,8 78,3 28,8 54,8 19,9 31,2 15,4 21,2 13,2 16,8 13,4 17,1
MP 43,7 61,5 23,1 35,9 15,5 20,8 11,5 11,4 11,0 10,6 10,5 9,8
LP 43,1 60,4 17,7 31,3 10,5 13,5 8,2 9,5 7,0 6,5 7,0 7,2

Statistics South Africa
Exploring childlessness and delayed childbearing in South Africa, 2001-2011
Report 03-06-02
39
Chapter 5: Socio-economic differentials of qualified women (aged 20–49) by fertility status
5.1 Introduction
One of the objectives of the study was to determine if there are significant differences between
women who reported having children and women who reported having no children. The
differences were established using socio-economic characteristics of qualified women such as
age, marital status, population group, level of education, employment status, income,
occupation, industry and province. Bivariate analysis was performed using data from census
2011 to achieve this.
5.2 Qualified women by socio-demographic differentials and fertility status
5.2.1 Age
Table 13 indicates the proportion of women by fertility status and nine socio-economic
characteristics. The mean age at childbearing in South Africa is 22 (Stats SA, 2015); however,
fertility of qualified women reaches its peak among women who had children between the ages
of 30–34 and 35–39 (20% and 22%, respectively). The proportion of qualified childless women
is the highest with an average of 32% amongst women aged 20–24 and 25–29.
5.2.2 Marital status
Marital status shows a significant difference of fertility amongst qualified women (20–49). The
majority of qualified women who had children are married (64%) compared to 34% of qualified
married women with no children. A noticeable proportion (64%) of qualified women with no
children has never been married. On the other hand, only 33,8% of qualified childless women
are married.
5.2.3 Population group
The majority of qualified women with children are black Africans (66%), followed by whites
(23%). Similarly, the highest proportion of qualified childless women are black Africans (51%),
followed by whites (36%). Interestingly, the proportions of qualified women with and without
children are lowest amongst the coloured and Indian/Asian population groups. Almost 6% and
5% of qualified women who reported children ever born and 6% and 8% of women without
children are coloured and Indian/Asian, respectively.

Statistics South Africa
Exploring childlessness and delayed childbearing in South Africa, 2002-2011 Report 03-06-02
40
5.2.4 Level of education
About 65% of qualified women who ever had children have diplomas and certificates whilst 57%
of qualified childless women have the same qualifications. With regard to a bachelor’s degree,
the proportion (36%) of qualified women who are childless is slightly higher than that of qualified
women who reported children ever born (28%). In addition, 7% of qualified women with children
ever born; and 7 % without children ever born had post-higher degrees (Refer to table 13).
5.2.5 Employment status
There is a slight difference between employed qualified women who ever had children and
employed qualified childless women. About 64% and 69% of qualified women without children
and qualified women who have borne children are employed. This means that 30,9% of women
with children and 35,7% of qualified women without children are unemployed.
5.2.6 Income
As far as income is concerned, 77% of qualified women who have children earn an income
compared to 71,2% of childless women who earn an income. About 23% of qualified women
who have children do not earn an income relative to 28,8% of childless women who do not earn
an income.
5.2.7 Occupation
Across all occupations, there is no substantial difference between the proportion of qualified
women who are childless and qualified women with children. For instance, 22,2% of qualified
women who have children are professionals, whilst 24,1% of qualified women who are childless
are professionals. Similarly, 9,1% of qualified women with children and 11,7% of qualified
women with no children are managers. It is worth noting that the proportions of qualified women
with and without children across all occupations are the lowest in the skilled agricultural
industry, with less than 1% in each category.
5.2.8 Industry
The largest proportion of childless women (42,5%) and women who reported children (49,8%)
are located within the community, social and personal services industry. Variations between
qualified women with children and qualified childless women are evident within the construction,
wholesale and retail trade and financial intermediation, insurance, real estate and business

Statistics South Africa
Exploring childlessness and delayed childbearing in South Africa, 2002-2011 Report 03-06-02
41
industries. Within the financial intermediation, insurance, real estate and business industry, the
proportion of qualified women who reported children ever born is only 1,8%, while the proportion
of qualified women without children are 23,1%. The electricity, gas and water supply industry
seems to have the lowest proportion of women (1%) both with children and without children.
5.2.9 Province
The leading province among qualified women with children and without children is Gauteng with
37,8% and 44,6%, respectively. In addition, it is noticeable that Northern Cape ranks last with
1% amongst qualified women who reported children ever born and those who are childless
Overall, there is a slight difference in the proportion of women with children and without children
across all provinces, except for Gauteng, Western Cape and Limpopo. The largest gap between
qualified women with children and without children is found in Gauteng is 7%, followed by
Western Cape (5%) and Limpopo (4%).

Statistics South Africa
Exploring childlessness and delayed childbearing in South Africa, 2002-2011 Report 03-06-02
42
Table 13: Percentage distribution of qualified women by fertility status and socio-economic characteristics, Census 2011
Characteristics Children ever born
Yes No
Age
20–24 56 260 (6,0) 133 310 (31,6) 25–29 158 489 (16,8) 139 678 (32,2) 30–34 191 990 (20,4) 67 042 (15,9) 35–39 205 461 (21,8) 38 496 (9,1) 40–44 186 084 (19,7) 24 952 (5,9) 45–49 143 914 (15,3) 17 846 (4,2)
Marital status
Married 605 941 (64,3) 142 409 (33,8) Never married 269 310 (28,6) 268 829 (63,8) Widower/widow 20 733 (2,2) 1 696 (0,4) Divorced 46 215 (4,9) 8 391 (2,2)
Population group
Black African 624 182 (66,2) 213 208 (50,6) Coloured 55 775 (5,9) 26 465 (6,3) Indian or Asian 45 169 (4,8) 31 826 (7,6) White 217 073 (23,0) 149 825 (35,6)
Level of education Certificates and Diplomas 612 563 (65,0) 238 215 (56,5) Bachelor’s degrees 266 265 (28,3) 153 110 (36,3) Post-higher degrees 63 371 (6,7) 29 999 (7,1)
Employment status Employed 650 227 (69,1) 270 833 (64,3) Unemployed 291 227 (30,9) 150 051 (35,7)
Income Yes income 725 281 (77,0) 300 137 (71,2) No income 216 918 (23,0) 121 188 (28,8)
Occupation
Professional 157 486 (22,2) 70 392 (24,1) Manager 64 684 (9,1) 34 001 (11,7) Technician 172 846 (24,3) 58 128 (19,9) Clerk 116 879 (16,5) 52 122 (17,9) Sales and services 67 559 (9,5) 29 228 (10,0) Skilled agriculture 2 976 (0,4) 1 357 (0,5) Craft and related trade 32 447 (4,6) 12 597 (4,3) Plant and machine operator 23 815 (3,4) 8 423 (2,9) Elementary 71 343 (10,0) 25 546 (8,8)
Industry
Community, social and personal services 353 682 (49,8) 123 968 (42,5) Mining and quarrying 10 220 (1,4) 3 820 (1,3) Manufacturing 40 966 (5,8) 18 828 (6,5) Electricity, gas and water supply 6 736 (0,9) 2 459 (0,8) Construction 23 221 (11,1) 9 356 (3,2) Wholesale and retail trade 78 984 (4,4) 34 765 (11,9) Transport, storage and communication 31 281 (16,8) 14 900 (5,1) Financial intermediation, insurance, real estate and business 119 427 (1,8) 67 482 (23,1) Agriculture, hunting, forestry and fishing 12 687 (4,6) 4 818 (1,7) Private households 32 511 (4,6) 11 255 (3,9)
Province
Gauteng 355 765 (37,8) 187 964 (44,6)
Western Cape 103 831 (11,0) 70 629 (16,8)
Eastern Cape 89 447 (9,5) 29 372 (7,0)
Northern Cape 11 483 (1,2) 4 294 (1,0)
Free State 38 840 (4,1) 15 817 (3,8)
KwaZulu-Natal 145 414 (15,4) 60 177 (14,3)
North West 44 530 (4,7) 14 010 (3,3)
Mpumalanga 64 184 (6,8) 18 336 (4,4)
Limpopo 88 706 (9,4) 20 725 (4,9)

Statistics South Africa
Exploring childlessness and delayed childbearing in South Africa, 2002-2011 Report 03-06-02
43
Chapter 6: Discussion and conclusion
Despite variations in socio-economic differentials, the results presented provide strong evidence
that childlessness in South Africa increased between 2001 and 2011. As expected, the results
show that childlessness decreased by age of a woman. The most important indicator of
increased childlessness among South African women appears to be the delaying age at first
birth over time (Stats SA, 2015). The increase in childlessness is congruent to the trends in
fertility levels, which have declined steadily from an average of 6 to 7 children per woman in the
1950’s to 2,7 in 2011 (Chimere-Dan,1993 and Stats South Africa 2015). The results of this
study are also consistent with some of the conclusions reached by other investigators, that is,
childlessness is influenced by socio-economic dynamics (Boddington and Didham, 2009).
In South Africa, studies on fertility differentials have been carried out since the late nineteenth
century, mainly at national level with the assumption that, in all societies, differences in socio-
economic status lead to a difference in fertility (Grobbelar 1984; Sadie 1973). Population
differentials indicate that white and Indian/Asian women experience higher levels of
childlessness across all ages. In 2011, the two populations recorded fertility rates of 1,7 and 1,8
children per woman respectively. It should be noted that these rates are below replacement
level. This pattern ties with the higher level of socio-economic development experienced
amongst these populations. Generally, a direct relationship exists between fertility and the level
of socio-economic development (SADHS, 1999).
The link between lower socio-economic development, i.e. illiteracy, unemployment, lower
education and higher fertility has been observed in previous studies (ibid). Fertility remains high
in the poorer rural areas of South Africa.
The results indicate that, as the education of women increases, childlessness also increases.
The study further shows that women with a secondary and tertiary education are more likely to
be childless than women with no education or a primary education. Moultrie & Timaeus (2001)
in their study of the determinants of fertility established that educated women had a lower
number of children compared with those who are not educated. Education, therefore, is
regarded as an important determinant of fertility decisions (Birdsall, 1988; Ben-Porath, 1974).
The results from studies in Asia demonstrated that women‘s empowerment is associated with
contraceptive use (Morgan and Niraula 1995; Woldemicael, 2009), lower fertility (Balk, 1994;
Hindin, 2000), and longer birth intervals (Upadhyay and Hindin, 2005). Some researchers have
suggested that women‘s empowerment is a key pathway through which education influences

Statistics South Africa
Exploring childlessness and delayed childbearing in South Africa, 2002-2011 Report 03-06-02
44
fertility (Jejeebhoy, 1995; Mason, 1987). The ideology is supported by the increasing trend of
childlessness and decreasing fertility among South African qualified women over time.
Generally, South Africa has, since 1994, become known internationally for relatively good
performance in terms of common indicators of gender equality (MDGs, 2013), which ultimately
contribute to lower fertility.
Overall, the level of childlessness is higher among the employed than unemployed. The same
pattern is evident among qualified women with an income and without an income, with women
with an income having higher levels of childlessness. Working women commonly postpone
childbearing as a way to coordinate their work and their domestic work (Van Horn, 1988); thus,
early childbearing is regarded as a stumbling block to women’s prosperity in early career life.
However, for women over thirty, work and family considerations compete for time and
commitment. The majority of qualified women in their thirties are assumed to be in the labour
force, thus childbirth after 30 years of age may reflect their ability or willingness to integrate
childbearing into their work life.
High income of working women also influences fertility of women. As employers make efforts to
keep their most valuable employees better-educated thus, their fertility could be subsequently
delayed. Dex et al. (1996) suggest that working women with high incomes have fewer
incentives for childbearing. Oppenheimer (1988) noted that as women‘s income rise, the
important ascribed characteristics such as family formation become less important than
achieved characteristics such as income.
Numerous studies have shown that rates of childlessness are higher among unmarried women
than among married women (Schoen et al., 1997, 1999; Barber, 2001; Kemkes-Grottenthaler,
2003; Parr, 2005). The same observation is evident in this study. The findings therefore affirm
existing knowledge that childlessness is more prevalent among women who have no
partnerships, or women who find themselves in less stable relationships (Haskey, 2013).
Nevertheless, the link between marriage and childbearing has weakened. The findings in the
report indicate that childlessness has increased between 2001 and 2011 not only for women
never married, but also for married women. In South Africa, marriage rates are substantially
lower among black African women when compared to white women; however, black African
women are less likely to be childless when compared to white women.
Findings from the study indicate that the majority of women who were childless were in the field
of psychology, mechatronics and visual or performance arts. It is found that patterns of

Statistics South Africa
Exploring childlessness and delayed childbearing in South Africa, 2002-2011 Report 03-06-02
45
childlessness by field of study in South Africa have a lot in common with those found in other
countries. The finding that childlessness is higher in women who are educated in the field of
visual and performance arts concur with the studies conducted in Sweden and Australia.
Swedish and Norwegian women educated in arts and humanities or religious occupations have
unusually high percentages of childlessness (Lappegård and Rønsen 2005). Surkyn et al.
(2008) in their study indicated that Australian women trained in social science, art, theology and
humanities have very high percentages of childlessness.
Women trained in education appear to have a lower prevalence of childlessness than women
trained in other fields. A young woman with strong family preferences may pursue education
and even a career, but she is most likely to find herself in the field of study and an occupation
that better accommodate motherhood (Esping-Andersen et al., 2007). Hoem et al. (2006) found
Swedish women trained in teaching and health care have much lower permanent childlessness
rates at each educational level than any other field of study.
Childlessness is high amongst professionals and managers and low among qualified women in
elementary occupations. It is argued that female-dominated jobs offer better opportunities to
combine work and family. Such areas therefore attract women who want to or who have
children. Recently there has been growth in women’s representation in the labour force,
including professional occupations, and in their pursuit of a higher education in South Africa.
These changes have significant implications for family-building experiences, including women’s
childbearing patterns.
When comparing qualified women and unqualified women aged 20–49, results show a
significant difference in the level of childlessness between the two categories. In some age
groups, childlessness of qualified women is almost double the childlessness of unqualified
women, predominantly at young age groups. These findings attest to the hypothesis that, as the
education of women increases, childlessness also increases. The second key finding is that the
difference in the level of childlessness begins to converge for women aged 35 and above. What
can be deduced from this pattern of childlessness is that highly educated women do not remain
childless throughout their reproductive span, but they postpone childbearing to elderly ages.
The pattern of converging levels of childlessness was observed across all socio-economic
characteristics.
In addition, the findings suggest that the proportion of women with children is higher among
women between the ages 30–34 and 35–39. The findings attest to other studies on fertility

Statistics South Africa
Exploring childlessness and delayed childbearing in South Africa, 2002-2011 Report 03-06-02
46
postponement among qualified women. Martin (2000) examines the growing trend of delaying
fertility beyond the age of 30, and finds that the women underlying this trend are more educated
women. He argues that fertility delay is a consequence of career building demands and the high
costs of quality childcare.
An inherent consequence of the continued postponement of the first childbirth not only affects
the number of women that remain childless but also the number of children a women may have
in her reproductive lifetime. As childbearing is postponed to later ages, women have a narrower
window of time in which to complete their desired fertility due to biological limits thereby
depressing period fertility rates (Bongaarts, 2002). Findings in the report indicate that there is a
relationship between the level of childlessness in a cohort and the completed fertility rate of that
cohort. Also, this pattern is influenced socio demographic factors such as Population group,
marital status, education and residence.
On a national scale childlessness in South Africa is increasing significantly over time and there
has been a recent development of a child preference of 2. Despite this, the country is unlikely to
experience consequences of below replacement fertility or the dire consequence of excessive
levels of old age dependency (though this is on the rise), given the size of the current population
and migration in the country. However specific populations, particularly the white population
may be confronted with lack of family support and care in their older age.

Statistics South Africa
Exploring childlessness and delayed childbearing in South Africa, 2002-2011 Report 03-06-02
47
7. References
Abma, J.C. & Martinez, G.M. (2006). Childlessness among older women in the United States:
Trends and profiles. Journal of Marriage and Family, 68(4), pp 1045-1056.
Aiswarya, P.V. & Moli, G.K. (2012). Childlessness among women in India. Health and
Population, 35(3), pp 114-131.
Anderson, G. (2000). The impact of labour-force participation on childbearing behaviour: pro-
cyclical fertility in Sweden during the 1980s and the 1990s. European Journal of
Population/Revue européenne de démographie, 16(4), pp 293-333.
Astin, H.S 1969. The woman doctorate in Australia. Russell Sage Foundation. New
York
Balk, D. (1994). Individual and community aspects of women's status and fertility in rural
Bangladesh. Population Studies, 48(1), pp 21-45.
Barber, J.S. (2001). Ideational influences on the transition to parenthood: Attitudes toward
childbearing and competing alternatives. Social Psychology Quarterly, 64(2), pp 101-127.
Ben-Porath, Y. (1974). Economic analysis of fertility in Israel. In Economics of the Family:
Marriage, Children, and Human Capital. United States: National Bureau of Economic
Research.
Birdsall, N. (1988). Economic approaches to population growth. Handbook of development
economics, Elsevier Science Publishers B.V.
Bloom, D. & Trussell, J. (1984). What are the determinants of delayed childbearing and
permanent childlessness in the United States? Demography, 21, pp 591-612.
Boddington, B. & Didham, R. (2009). Increases in childlessness in New Zealand. Journal of
Population Research, 26(2), pp 131-151.
Callan, V.J. (1986). The impact of the first birth: Married and single women preferring
childlessness, one child, or two children. Journal of Marriage and the Family, pp 261-269.
Chimere-Dan, (1993). The population policy in S.A. Studies in family planning. 24(1): pp 31-39

Statistics South Africa
Exploring childlessness and delayed childbearing in South Africa, 2002-2011 Report 03-06-02
48
Cooney, T.M. & Uhlenberg, P. (1989). Family-building patterns of professional women: A
comparison of lawyers, physicians, and postsecondary teachers. Journal of Marriage and the
Family, pp 749-758.
Crimmins, E.M., Easterlin, R.A. & Saito, Y. (1991). Preference changes among American youth:
Family, work, and goods aspirations, 1976-86. The Population and Development Review, pp
115-133.
De Jong, A. & Steenhof, L. (2000) Infecundity: a result of postponed childbearing? A paper
presented BSPS-NVD-URU conference; 31 August -1 September 2000. Netherlands
Dex, S., Joshi, H., Macran, S. & McCulloch, A. (1996). Women's employment transitions around
childbearing. Working Paper No. 1408. London: Centre for Economic Policy Research.
Dunson, D.B., Colombo, B. & Baird, D.D. (2002). "Changes with age in the level and duration of
fertility in the menstrual cycle." Human Reproduction. 17, pp 1399-1403.
Dyson, T. & Moore, M. (1983). On kinship structure, female autonomy, and demographic
behavior in India. Population and development review, 9(1), pp 35-60.
El-Badry, M.A. (1961). Failure of enumerators to make entries of zero: errors in recording
childless cases in population censuses. Journal of the American Statistical
Association, 56(296), pp 909-924.
Esping-Andersen, G. (Ed.) (2007). Family formation and family dilemmas in contemporary
Europe. Madrid: Fundación BBVA.
Fokkema, T., Valk, H.D., Beer, J.D. & Duin, C.V. (2008). The Netherlands: Childbearing within
the context of a "Poldermodel" society. Demographic Research, 19(21), pp 743–794.
Friedman, D., Hechter, M. & Kanazawa, S. (1994). A theory of the value of children.
Demography, 31(3), pp 375-401.
Gillespie, R. (2003). Childfree and feminine: understanding the gender identity of voluntary
childless women. Gender and Society. 17(1), pp 122-136.
Grobbelar, J.A. (1984). Projections and analysis of the South Africa population for the period
1980-2015. Stellenbosch

Statistics South Africa
Exploring childlessness and delayed childbearing in South Africa, 2002-2011 Report 03-06-02
49
Graham, M., Hill, E., Shelly, J. & Taket, A. (2013). Why are childless women childless? Findings
from an exploratory study in Victoria, Australia. Journal of Social Inclusion, 4(1), pp 70–89.
Hagestad, G.O. & Call, V.R.A. (2007). Pathways to Childlessness A Life Course Perspective.
Journal of Family Issues, 28, pp 1338-1361.
Haskey, J.C. (2013). Childlessness, cohabitation and partnership history in Great Britain.
Department of Social Policy and Intervention, University of Oxford,UK.
Hindin, M.J. (2000). Women's autonomy, women's status and fertility-related behaviour in
Zimbabwe. Population Research and Policy Review, 19(3), pp 255-282.
Hoem, J., Neyer, G. & Andersson, G. (2006). Education and childlessness. The relationship
between educational field, educational level, and childlessness among Swedish women born
in 1955-59. Demographic Research, 14(15), pp 331-380.
Available: http://www.demographicresearch.org/Volumes/Vol14/15/14-15.pdf .
Jacobson, C.K., Heaton, T.B. & Taylor, K.M. (1988). Childlessness among American
women. Social Biology, 35(4), pp 186-197.
Jejeebhoy, S.J. (1995). Women's education, autonomy, and reproductive behaviour: Experience
from developing countries. Oxford, England: Clarendon Press.
Kemkes-Grottenthaler, A. (2003). Postponing or rejecting parenthood? Results of a survey
among female academic professionals. Journal of biosocial science, 35(02), pp 213-226.
Kenkel, W.F. (1985). The desire for voluntary childlessness among low-income youth. Journal
of Marriage and the Family, pp 509-512.
Köppen, K., Mazuy, M. & Toulemon, L. (2007). Kinderlosigkeit in Frankreich. In D. Konietzka
and M. Kreyenfeld (Eds.), Ein Leben ohne Kinder. Kinderlosigkeit in Deutschland.
Wiesbaden: VS. pp 83-105.
Lappegård, T. (2002). Education attainment and fertility pattern among Norwegian women.
Statistisk Sentralbyrå.
Lappegård, T. & Rønsen, M. (2005). The multifaceted impact of education on entry into
motherhood. European Journal of Population/Revue européenne de Démographie, 21(1), pp
31-49.

Statistics South Africa
Exploring childlessness and delayed childbearing in South Africa, 2002-2011 Report 03-06-02
50
Leridon, H. (2004). Can assisted reproduction technology compensate for the natural decline in
fertility with age? A model assessment. Human Reproduction, 19(7), pp 1548-1553.
Liefbroer, A.C. (2005). The impact of perceived costs and rewards of childbearing on entry into
parenthood: Evidence from a panel study. European Journal of Population/Revue
Européenne de Démographie, 21(4), pp 367-391.
Lind, I. (2008). Balancing Career and Family in Higher Education—New Trends and Results.
In Gender equality programmes in higher education. VS Verlag für Sozialwissenschaften. pp
193-208.
Makiwane, M.B. (1998). Adolescent pregnancy and reproductive health in Transkei (rural South
Africa). African Journal of Reproductive Health, 2(1), pp 41-48.
Mammo, A. & Morgan, S.P. (1986). Childlessness in rural Ethiopia. Population and
Development Review, pp 533-546.
Martin, S. P. (2000). “Diverging Fertility Among U.S. Women Who Delay Childbearing Past Age
30.” Demography 37(4), pp. 523-33.
Merlo, R. & Rowland, D. (2000).The Prevalence of Childlessness in Australia, People and
Place, 8(2), pp 21- 32.
Millennium Development Goals (MDGs). (2013). Promote gender equality and empower
women. Pretoria: Statistics South Africa.
Morgan, S.P. (1991). Late nineteenth-and early twentieth-century childlessness. American
Journal of Sociology, pp 779-807.
Morgan, S.P. & Niraula, B.B. (1995). Gender inequality and fertility in two Nepali
villages. Population and Development Review, 21(3), pp 541-561.
Moultrie, T.A & Timaeus, I.M. (2001). Fertility and living arrangements in South Africa. Journal
of southern African studies, 27 (2), pp. 207-223.
Oppenheimer, V.K. (1988). A theory of marriage timing. American Journal of Sociology, pp 563-
591.

Statistics South Africa
Exploring childlessness and delayed childbearing in South Africa, 2002-2011 Report 03-06-02
51
Parr, N.J. (2005). Family background, schooling and childlessness in Australia. Journal of
biosocial science, 37(02), pp 229-243.
Ranson, G. (1998). Education, work and family decision making: Finding the" right time" to have
a baby. Canadian Review of Sociology and Anthropology, 35, pp 517-534.
Ritchey, P.N. & Stokes, C.S. (1974). Correlates of childlessness and expectations to remain
childless: US 1967. Social Forces, 52(3), pp 349-356.
Sadie J. (1973). Projections of the South Africa population1970-2020. Johannesburg
Schoen, R., Astone, N.M., Kim, Y.J., Nathanson, C.A. & Fields, J.M. (1999). Do fertility
intentions affect fertility behavior?. Journal of Marriage and the Family, 61(3), pp 790-799.
Schoen, R., Kim, Y.J., Nathanson, C.A., Fields, J. & Astone, N.M. (1997). Why do Americans
want children?. Population and development review, 23(2), pp 333-358.
Sobotka, T. (2005). Childless societies? Trends and projections of childlessness in Europe
and the United States. Vienna Institute of Demography. Australia
Sobotka et al. (2008). The contribution to assisted reproduction and completed fertility: an
analysis of Danish Data. Population and Development Review. Vol. 34 no 11 pp 79-101
South African Demographic Health Survey (SADHS) Project Team. (1999). South Africa in
transition: selected findings from the South African Demographic Health Survey, 1998.
Pretoria: Government Printers.
Statistics South Africa. (2015). Census 2011: Fertility in South Africa, 2011, Report-03-01-63.
Pretoria: South Africa.
Surkyn, J., Deboosere, P., Van Bavel, J. & Lesthaeghe, R.J. (2008). Demographic challenges
for the 21st century: a state of the art in demography: conference organized as a tribute to
the continuing endeavours of Prof. Dr. Em. Ron Lesthaeghe in the field of demography.
Brussels, VUB Press.
Udjo, E.O. (2014). Estimating demographic parameters from the 2011 South Africa population
census. African Population Studies, 28 (1), pp 564-578.

Statistics South Africa
Exploring childlessness and delayed childbearing in South Africa, 2002-2011 Report 03-06-02
52
United Nations, Department of Economic and Social Affairs, Population Division. (2013). United
Nations publication.
Upadhyay, U.D. & Hindin, M.J. (2005). Do higher status and more autonomous women have
longer birth intervals?: Results from Cebu, Philippines. Social science & medicine, 60(11), pp
2641-2655.
Van Horn, S.H. (1988). Women, Work, and Fertility, 1900-1986. New York: NYU Press.
Veevers, J.E. (1980). Childless by choice. Toronto: Butterworths.
Weinberger, M.B. (1987) The relationship between education and fertility: selected findings from
the world fertility surveys. International family planning perspectives. Vol 13 no 2 pp 33-46
Woldemicael, G. (2009). Women’s autonomy and reproductive preferences in Eritrea. Journal of
Biosocial Science, 41(02), pp 161-181.
World fertility report. (2009). UN population division and OECD family database, 2011, Paris.
Accessed on http://www.un.org/esa/population/publications/WFR2009Web/Main.html
Yoger, S; Vierra A. (1983). The state of motherhood among professional women. Sex
Role. Vol 9. (3)