Embed Size (px)
Citation preview
–8–
The Role of Maps in Virtual Research Methods
Martin Dodge
the map is a help provided to the imagination through the eyes.Henri Abraham Chatelain, Atlas Historique (1705)
Mapping provides a uniquely powerful means to classify, represent and communi-cate information about places that are too large and too complex to be seendirectly. Importantly, the places that maps are able to represent need not be limitedto physical, geographical spaces like cities, rivers, mountain ranges and such like:maps can be used to represent online spaces of computer-mediated communica-tion or (Dodge and Kitchin 2001a, 2001b). This chapter makes the case for the useof maps as an addition to existing methods in virtual research.
Maps have long been useful in research into social phenomena. They provide akey technique in human geography of course, but they are also used in other dis-ciplines such as archaeology, history and epidemiology, to store spatial informa-tion, to analyse data and generate ideas, to test hypotheses, and to present resultsin a compelling, visual form (Monmonier 1993). Mapping as a method of inquiryand knowledge creation also plays a role in the natural sciences, in disciplines suchas astronomy and particle physics, and in the life sciences, as exemplified by themetaphoric and literal mapping of DNA by the Human Genome Project (StephenS. Hall 1992).
The ability to create and use maps is one of the most basic means of humancommunication, at least as old as the invention of language and, arguably, as sig-nificant as the discovery of mathematics. The recorded history of cartographyclearly demonstrates the practical utility of maps in all aspects of Western society,being most important for organising spatial knowledges, facilitating navigationand controlling territory (Thrower 1996). Some have gone further, to argue thatmapping processes are culturally universal, evident across all human societies (forexample, Blaut et al. 2003), although the visual forms of the resulting map arte-facts are very diverse. At the same time maps are also rhetorically powerfulgraphic images that frame our understanding of the human and physical world,
113
02 Virtual methods 20/12/04 9:16 am Page 113
shaping our mental image of places, constructing our sense of spatiality. So in avery real sense maps make our world.
I begin by defining the nature of the map, discussing the theoretical basis ofmapping processes and visualization. This is followed by a consideration ofmapping in the context of research into the operation and structures of CMC bysocial scientists, where I advance reasons why mapping online space is useful butalso challenging. I then set out a classification of contemporary mapping, showinghow maps are used, before examining in some detail four exemplars. I concludethis chapter with a brief discussion of the limitations of mapping as a researchmethodology in terms of practical problems, ethics and ideology.
Maps and Visualization
Conventionally, maps are material artefacts that visually represent a geograph-ical landscape using the cartographic norms of a planar view (that is, lookingstraight down from above) and a uniform reduction in scale. However, it isimpossible neatly to define maps according to the type of phenomena mapped orthe particular mode of presentation, or their medium of dissemination (Dorlingand Fairbairn 1997). Maps have traditionally been used as static storage devicesfor spatial data and usually printed on paper, but now they are much more likelyto be interactive tools displayed on a computer screen. Here I take a very broaddefinition, given by Harley and Woodward, (1987: xvi), ‘maps are graphic rep-resentations that facilitate a spatial understanding of things, concepts, condi-tions, processes, or events in the human world’. We currently live in amap-saturated world, surrounded by both conventional geographic maps andmany other map-like spatial images and models (for example, animated satelliteimages, three-dimensional city models, magnetic resonance imaging (MRI)scans of the brain).
The development and diffusion of information and communication technologies(ICTs) since the early 1980s has profoundly affected the nature of cartographicmapping. Nowadays, the majority of maps are digital and only created ‘on-demand’ for temporary display on screens. The days of the unwieldy folded mapsheet and heavy paper atlases are past, increasingly replaced by geographic infor-mation systems (GIS) and spatial databases. The web mapping portalMapQuest.com has already delivered more maps than any other publisher in thehistory of cartography (Peterson 2001). Cheap, powerful computer graphics ondesktop personal computers (PCs) enables much more expressive and interactivedigital cartography, such as animated maps, multimedia atlases and so-called geo-visualization. Geovisualization draws on concepts from statistics for exploratorydata analysis, envisaging highly interactive environments of linked, multiple rep-resentations (maps, two-dimensional charts, three-dimensional plots, tables).
114 • Martin Dodge
02 Virtual methods 20/12/04 9:16 am Page 114
As well as making maps more interactive, ICTs are also helping to give manymore people access to cartography as map-makers themselves, be it via the ‘mapcharting’ options in spreadsheets to produce simple thematic maps, creatingcustom maps from an online mapping service, or desktop GIS such as ArcView orMapInfo. As more and more people bypass professional cartographers to maketheir own maps as and when required, it is likely that the diversity of map formsand usage will expand. Of course, the availability of ‘point and click’ mappingsoftware is no guarantee that the maps produced will be appropriate and effective.Map-making still takes skill and thought, requiring considerable effort to makegood maps.
The production of cartographic map artefacts and map-like visual imagesinvolves a whole series of mapping processes, from the initial selection of what tomeasure to the choice of the most appropriate scale of representation and projec-tion, and the best visual symbology to use. The concept of ‘map as process’ isuseful as a research methodology because it encourages particular ways of organ-ized thinking to do with how to generalize reality, how to distil out inherent, mean-ingful spatial structure from the data, and how to show significant relationshipsbetween things in a legible fashion. Mapping provides a means to organize largeamounts of, often multidimensional, information about a place in such a fashionas to facilitate human exploration and understanding. Yet, mapping is not just a setof techniques for information ‘management’, it also encompasses important socialprocesses of knowledge construction. As scholars have come to realize, maps andculture are intimately entwined and inseparable (Harley 1989; Wood 1992).Mapping not only represents reality, but also has an active role in the social con-struction of that reality. Yet most people are not conscious of this when they usemaps. Sparke (1998: 466) calls this the recursive proleptic effect of mapping, ‘theway maps contribute to the construction of spaces that later they seem only to rep-resent’. The power of maps comes from the fact that they are both a practical formof information processing and also a compelling form of rhetorical communica-tion.
Mapping works, essentially, by helping people to see the unseen. This isachieved through the act of visualization, premised on the simple notion thathumans can reason and learn more effectively in a visual environment than whenusing textual or numerical description. Maps provide graphical ideation whichrenders a place, a phenomenon or a process visible, enabling our most powerfulinformation-processing abilities, those of the human eye–brain vision system, tobe brought to bear. Visualization is thus a cognitive process of learning through theinteraction with visual signs that make up the map and it differs from passiveobservation in that its purpose is to discover unknowns, rather than to see what isalready known. Effective visualization in a research context reveals novel insightsthat are not apparent with other methods.
The Role of Maps in Virtual Research Methods • 115
02 Virtual methods 20/12/04 9:16 am Page 115
The power of mapping as visualization to elucidate meaningful patterns incomplex data is well illustrated by some of the ‘classics’ of the pre-digital era likeJohn Snow’s ‘cholera map’ of 1854, Charles Joseph Minard’s ‘Napoleon map’ of1869 and Harry Beck’s ‘Tube diagram’ of 1933 (see Tufte 1983; Garland 1994;Brody et al. 2000; Hadlaw 2003). Even though these examples are non-interactive,that is, they are static, two-dimensional images, hand-drawn on paper, they arenonetheless still powerful. They show the potential of visualization to provide newunderstanding and compelling means of communicating to a wide audience.Through their aesthetic visual form they also demonstrate the extent to whichmapping can be a creative process in and of itself. The best visualizations gobeyond merely representing to become a kind of cognitive shorthand for the actualplaces and processes themselves, illustrated well by the way in which Beck’s cel-ebrated diagrammatic design of the Underground provides such a powerful spatialtemplate for the ‘real’ layout of London in the minds of many visitors and resi-dents. The problem is that although Beck’s map works well for underground move-ment, it can be confusing for surface navigation because it famously sacrificesgeographic accuracy for topological clarity.
Conventional cartographic mapping is just one type of visualization and manyother visualization techniques have been developed for handling large, complexdatasets without gross simplification or unfathomable statistical models (forexample, volumetric visualization in exploration geology, three-dimensional bodyimaging in medical diagnostics). Of course, there is a long history of visualizationprior to computers and interactive graphics (for useful reviews, see Tufte 1983;Orford, Dorling and Harris 1998; Friendly and Denis 2003), but newer computer-based visualization techniques are particularly useful to researchers confrontingpoorly structured problems in information-rich environments – like a good deal ofquantitative social science research on CMC.
Developments in the field of information visualization since the early 1990shave proved particularly fertile in creating navigable maps of information spaces(Card, Mackinlay and Schneiderman 1999). These maps are non-geographic,instead focusing on visualizing information structure using abstract projections,but interestingly they make explicit use of spatial metaphors (Couclelis 1998). Theproduction of these novel types of maps of information has been termed spatial-ization (Skupin and Fabrikant 2003) and it often ‘borrows’ proven design conceptsfrom cartography, for example the use of hill shading and contouring from terrainmapping to represent large text archives (Wise 1999).
Mapping the Spaces of Computer-mediated Communications
It may seem surprising, in the first place, that a worthwhile case can be made touse maps in social science research on CMC. This surprise is based on two false
116 • Martin Dodge
02 Virtual methods 20/12/04 9:16 am Page 116
assumptions: first, that CMC has no meaningful spatial structures, is somehowdivorced from geographic reality, and is thus ‘unmappable’; and second, that mapscan represent geographic phenomena only in relation to the surface of the earth.Both these assumptions are incorrect; maps are not just geographic and CMC hasmeaningful structures to be mapped (such as semantic similarity between content,affinity ties of differing strengths in online social networks, temporal usage pat-terns). The self-evident answer is that it is possible to map CMC – as manyresearcher have indeed done (see Dodge and Kitchin 2001b) – and several of thebest examples are discussed later.
Given that it is possible, why might one actually want to invest time and effortto produce maps of CMC? Mapping is particularly useful for virtual research sinceso much of the ‘terrain’ of study, the social phenomena and the online places inwhich they occur, are composed of immaterial software (in essence they are justlines of code and database records) and are to a large degree invisible.Consequently, this ‘terrain’ can be hard to comprehend, and maps are an obvioustool to help make the virtual tangible. The processes of mapping can help make thevirtual understandable to the researcher.
The extent and usage of CMC has grown very rapidly since the early 1990s.With so many distinct spaces and users online, cyberspace has become an enor-mous and often confusing entity that can be difficult to monitor and navigatethrough. Maps can help users, service providers and analysts comprehend thevarious spaces of online interaction and information, providing understanding andaiding navigation. Depending on their scale, some of the maps provide a powerful‘big picture’ view, giving people a unique sense of a space difficult to understandfrom navigating alone.
Beyond the online spaces themselves, the adoption of CMC is having significanteffects on social, cultural, political and economic aspects of everyday life (Dodgeand Kitchin 2001a). Maps can help in understanding the implications by revealingthe extent and interrelations of the changes occurring. Geographical mapping ofthe Internet is significant, as it can provide insights into who owns and controls thesupporting infrastructure, and how and from where cyberspace is being produced(Dodge and Kitchin 2004). In addition, geographical maps are especially usefulfor public communications because they use a familiar template of countries andcontinents.
However, mapping CMC is a challenge. This is particularly the case becauseCMC is new and rapidly evolving, it is fluid, and it is diverse. It is not a single,homogenous and continuous phenomenon, but a myriad of rapidly evolving digitalspaces, channels and media, each providing a distinct form of virtual interactionand communication. Many of the spaces of CMC are overlapping and intercon-nected, but often in ad hoc and unplanned ways, giving rise to complex rhizomaticstructures that cannot easily be surveyed and mapped (Dodge and Kitchin 2001a).
The Role of Maps in Virtual Research Methods • 117
02 Virtual methods 20/12/04 9:16 am Page 117
Cyberspace offers places that at first often seem contiguous with geographic space,yet on further inspection it becomes clear that the space-time laws of physics havelittle meaning online. This is because the spaces of CMC are purely relational.They are not natural, but are solely the productions of their designers and, in manycases, users. They adopt the formal qualities of geographic (Euclidean) space onlyif explicitly programmed to do so, and indeed many media such as email haveseverely limited spatial qualities. The inherent spaces that do exist are often purelyvisual (objects have no weight or mass) and their spatial fixity is uncertain (spacescan appear and disappear in a moment, leaving no trace of their existence).Additionally, many online spaces violate two principal assumptions of modern(Western) cartography making them tough to map using conventional techniques.The first of these is that space is continuous, ordered and reciprocal. There are nosudden gaps or holes in the landscape, everything is somewhere, and the Euclideannotion of distance holds true, that is, the distance from A to B will be the same asfrom B to A. The second assumption is that the map is not the territory but a rep-resentation of it, that is, the territory has a separate, ongoing existence andmeaning beyond the map. Yet parts of cyberspace are discontinuous, lacking linearorganization and in some cases the map and the territory are conflated and cannotbe separated (Dodge and Kitchin 2001a).
What are maps of CMC like? The diverse range of maps so far produced makesit hard to generalize. Just as there is not one true geographic map of a given place,so there are no definitive maps of CMC. Devising effective map representations forthe structures of CMC when no obvious framework or intuitive metaphor exist hasled to considerable creativity, with many visual forms, projection methods andmodels of interaction tried out. Many of the resulting maps, while novel and inter-esting, are not workable (that is, they are not effective visualizations). The widerange of CMC mapping is undertaken by a wide range of different map-makers,including designers, sociologists, artists, physicists, information scientists, librar-ians and interface engineers. Interestingly, almost none have been made by car-tographers or geographers (although see the notable contributions discussed bySkupin and Fabrikant 2003).
Map Use in Virtual Research
One way to classify the nature of contemporary mapping is to focus on how mapsare actually used to do work, for example in the different stages of an academicresearch project. MacEachren (1995) provides a useful conceptual device, the ‘car-tography cube’, to do this (Figure 8.1), employing three axes to encapsulate thedistinctive characteristics of contemporary map use. The first axis covers the scopeof the user audience for the map (running from private maps, used only by theirmaker, through to published, widely distributed maps for public use); next is the
118 • Martin Dodge
02 Virtual methods 20/12/04 9:16 am Page 118
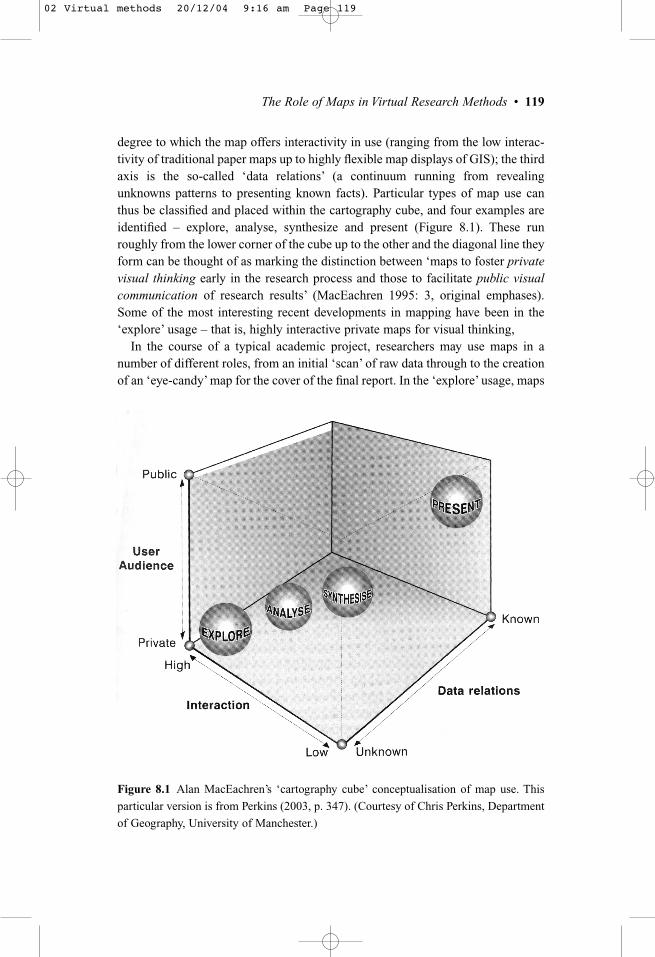
degree to which the map offers interactivity in use (ranging from the low interac-tivity of traditional paper maps up to highly flexible map displays of GIS); the thirdaxis is the so-called ‘data relations’ (a continuum running from revealingunknowns patterns to presenting known facts). Particular types of map use canthus be classified and placed within the cartography cube, and four examples areidentified – explore, analyse, synthesize and present (Figure 8.1). These runroughly from the lower corner of the cube up to the other and the diagonal line theyform can be thought of as marking the distinction between ‘maps to foster privatevisual thinking early in the research process and those to facilitate public visualcommunication of research results’ (MacEachren 1995: 3, original emphases).Some of the most interesting recent developments in mapping have been in the‘explore’ usage – that is, highly interactive private maps for visual thinking,
In the course of a typical academic project, researchers may use maps in anumber of different roles, from an initial ‘scan’ of raw data through to the creationof an ‘eye-candy’ map for the cover of the final report. In the ‘explore’ usage, maps
Figure 8.1 Alan MacEachren’s ‘cartography cube’ conceptualisation of map use. This
particular version is from Perkins (2003, p. 347). (Courtesy of Chris Perkins, Department
of Geography, University of Manchester.)
The Role of Maps in Virtual Research Methods • 119
02 Virtual methods 20/12/04 9:16 am Page 119
can answer basic ‘what is happening here?’ type questions, by giving a visualinventory that can be quickly reviewed for interesting trends and anomalies (seeingthe ‘holes’ in a map can be the best way to spot errors in data collection). The‘analysis’ phase of research would use interactive maps to process and classifycomplex data, breaking it down in the hopes of revealing previously unknown pat-terns that could not be discerned from looking through the raw data. For example,scrolling through page after page of a web site user log would tell you little,whereas overlaying the pathways of individual user sessions onto a map of thehyperlink structure of content (so-called ‘clickstream’ visualization) might quicklyshow consistent patterns of site navigation. The ‘synthesis’ stage of research oftenrequires evidence to be assembled to support particular hypotheses. Maps areuseful tools here for marshalling together diverse data into a single visual expla-nation. Maps can facilitate visual explanation of observed patterns, for examplethrough testing for the existence of spatial processes such as hierarchical clus-tering, small world networks, and distance decay functions. John Snow’s ‘choleramap’ is often put forward as a prime example of maps as synthesizing tools (Brodyet al. 2000). Towards the end of a research project, it is usually necessary to presentresults to external audiences and well-designed maps are an exemplary means ofpublic communication. In a compact visual image, a good map can convey a hugeamount of data in a legible, aesthetic and comprehensible fashion. Maps arerhetorically powerful ways to dramatize research results (Tufte 1983).
I now consider in detail four examples that illustrate the diversity of map use inresearch on CMC. The first two examples visualize aspects of the geographicstructure of CMC at the level of Internet infrastructure and traffic flows. The lasttwo examples are maps of online activities aimed to help researchers and poten-tially also users to understand the social structures of CMC spaces.
Envisioning Internet GeographiesThe seemingly magical ability to surf around a virtual globe of information,moving from web site to web site at a single click, belies the scale and sophistica-tion of the socio-technical assemblage of protocols, hardware, capital and labourthat makes this possible. Despite the virtualized rhetoric, this assemblage remainsembedded in real places and maps can help to reveal the intersections betweencyberspace and geographic space. In CMC research, I believe that geography isstill important, as knowledge of the physical location of virtual phenomena can tellyou interesting things (such as which territorial jurisdiction it is in) and can alsoenable linkage to a large array of existing secondary data (for example socio-eco-nomic characteristics from censuses).
The ‘where’ and ‘how’ of the physical embeddedness of data networks andinformation flows are also important because of their uneven geographical distri-bution and the consequent socio-spatial implications in terms of access and
120 • Martin Dodge
02 Virtual methods 20/12/04 9:16 am Page 120
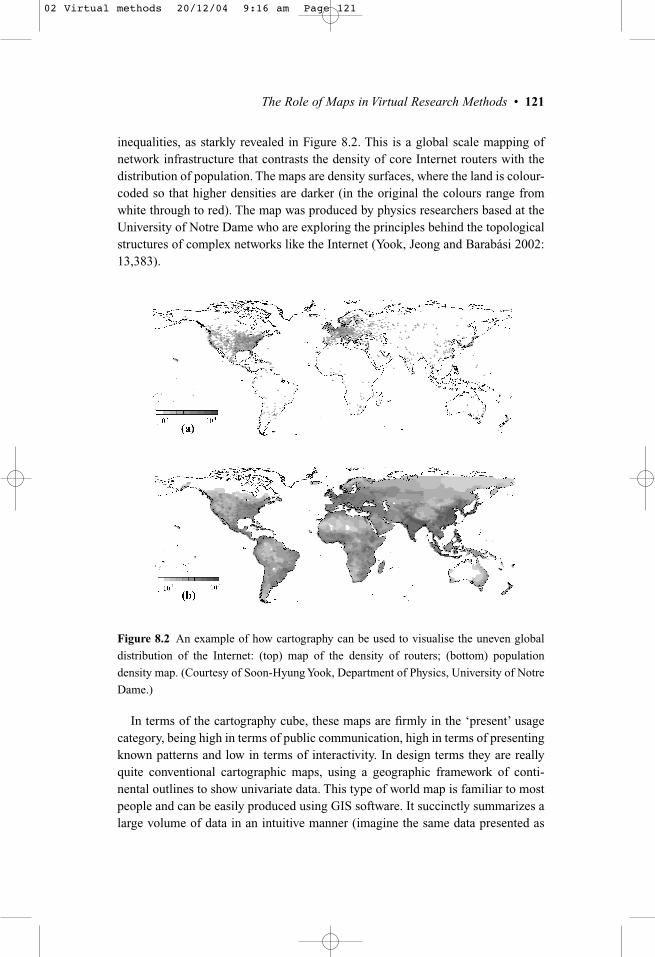
inequalities, as starkly revealed in Figure 8.2. This is a global scale mapping ofnetwork infrastructure that contrasts the density of core Internet routers with thedistribution of population. The maps are density surfaces, where the land is colour-coded so that higher densities are darker (in the original the colours range fromwhite through to red). The map was produced by physics researchers based at theUniversity of Notre Dame who are exploring the principles behind the topologicalstructures of complex networks like the Internet (Yook, Jeong and Barabási 2002:13,383).
In terms of the cartography cube, these maps are firmly in the ‘present’ usagecategory, being high in terms of public communication, high in terms of presentingknown patterns and low in terms of interactivity. In design terms they are reallyquite conventional cartographic maps, using a geographic framework of conti-nental outlines to show univariate data. This type of world map is familiar to mostpeople and can be easily produced using GIS software. It succinctly summarizes alarge volume of data in an intuitive manner (imagine the same data presented as
Figure 8.2 An example of how cartography can be used to visualise the uneven global
distribution of the Internet: (top) map of the density of routers; (bottom) population
density map. (Courtesy of Soon-Hyung Yook, Department of Physics, University of Notre
Dame.)
The Role of Maps in Virtual Research Methods • 121
02 Virtual methods 20/12/04 9:16 am Page 121
numeric values in a spreadsheet) and effectively demonstrates the potential ofmaps in virtual research for communicating complex patterns to a wide audience.
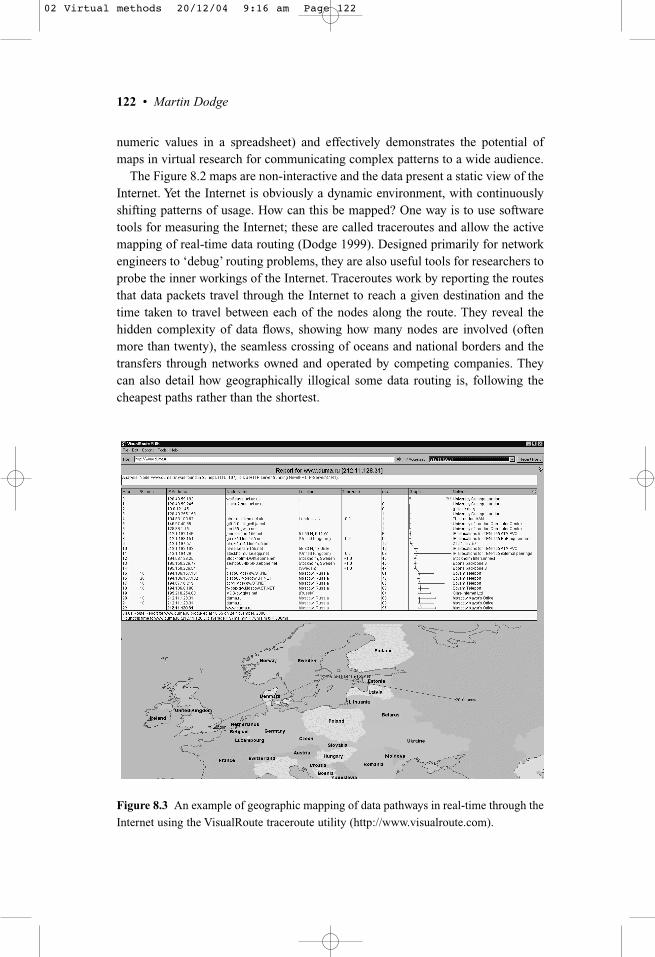
The Figure 8.2 maps are non-interactive and the data present a static view of theInternet. Yet the Internet is obviously a dynamic environment, with continuouslyshifting patterns of usage. How can this be mapped? One way is to use softwaretools for measuring the Internet; these are called traceroutes and allow the activemapping of real-time data routing (Dodge 1999). Designed primarily for networkengineers to ‘debug’ routing problems, they are also useful tools for researchers toprobe the inner workings of the Internet. Traceroutes work by reporting the routesthat data packets travel through the Internet to reach a given destination and thetime taken to travel between each of the nodes along the route. They reveal thehidden complexity of data flows, showing how many nodes are involved (oftenmore than twenty), the seamless crossing of oceans and national borders and thetransfers through networks owned and operated by competing companies. Theycan also detail how geographically illogical some data routing is, following thecheapest paths rather than the shortest.
Figure 8.3 An example of geographic mapping of data pathways in real-time through the
Internet using the VisualRoute traceroute utility (http://www.visualroute.com).
122 • Martin Dodge
02 Virtual methods 20/12/04 9:16 am Page 122
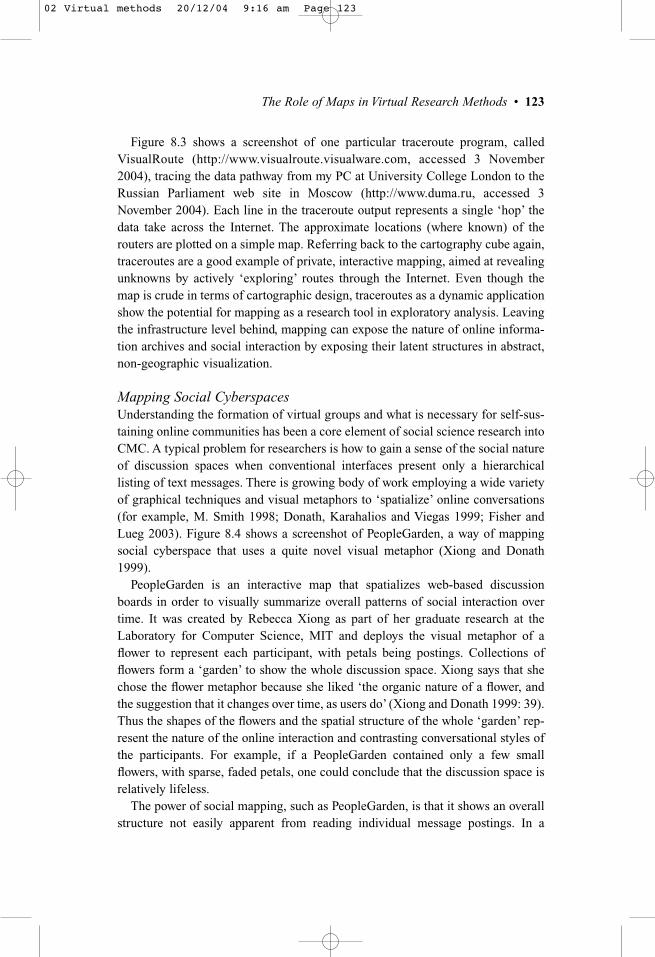
Figure 8.3 shows a screenshot of one particular traceroute program, calledVisualRoute (http://www.visualroute.visualware.com, accessed 3 November2004), tracing the data pathway from my PC at University College London to theRussian Parliament web site in Moscow (http://www.duma.ru, accessed 3November 2004). Each line in the traceroute output represents a single ‘hop’ thedata take across the Internet. The approximate locations (where known) of therouters are plotted on a simple map. Referring back to the cartography cube again,traceroutes are a good example of private, interactive mapping, aimed at revealingunknowns by actively ‘exploring’ routes through the Internet. Even though themap is crude in terms of cartographic design, traceroutes as a dynamic applicationshow the potential for mapping as a research tool in exploratory analysis. Leavingthe infrastructure level behind, mapping can expose the nature of online informa-tion archives and social interaction by exposing their latent structures in abstract,non-geographic visualization.
Mapping Social CyberspacesUnderstanding the formation of virtual groups and what is necessary for self-sus-taining online communities has been a core element of social science research intoCMC. A typical problem for researchers is how to gain a sense of the social natureof discussion spaces when conventional interfaces present only a hierarchicallisting of text messages. There is growing body of work employing a wide varietyof graphical techniques and visual metaphors to ‘spatialize’ online conversations(for example, M. Smith 1998; Donath, Karahalios and Viegas 1999; Fisher andLueg 2003). Figure 8.4 shows a screenshot of PeopleGarden, a way of mappingsocial cyberspace that uses a quite novel visual metaphor (Xiong and Donath1999).
PeopleGarden is an interactive map that spatializes web-based discussionboards in order to visually summarize overall patterns of social interaction overtime. It was created by Rebecca Xiong as part of her graduate research at theLaboratory for Computer Science, MIT and deploys the visual metaphor of aflower to represent each participant, with petals being postings. Collections offlowers form a ‘garden’ to show the whole discussion space. Xiong says that shechose the flower metaphor because she liked ‘the organic nature of a flower, andthe suggestion that it changes over time, as users do’ (Xiong and Donath 1999: 39).Thus the shapes of the flowers and the spatial structure of the whole ‘garden’ rep-resent the nature of the online interaction and contrasting conversational styles ofthe participants. For example, if a PeopleGarden contained only a few smallflowers, with sparse, faded petals, one could conclude that the discussion space isrelatively lifeless.
The power of social mapping, such as PeopleGarden, is that it shows an overallstructure not easily apparent from reading individual message postings. In a
The Role of Maps in Virtual Research Methods • 123
02 Virtual methods 20/12/04 9:16 am Page 123
metaphoric sense these kinds of visualizations provide the missing ‘up button’ onthe browser to allow people to get above the online conversations for a synopticview of the whole. On the cartography cube I would place the use of PeopleGardenand similar examples in the ‘analyse’ sphere as it provides a private map forresearchers with a good degree of interactivity for use in revealing unknown datarelations.
The final example I want to consider is an interactive tool for researchers totrack and examine the activity patterns of users in three-dimensional virtualworlds, being developed by Katy Börner, Shashikant Penumarthy and colleaguesat Indiana University (Börner and Penumarthy 2003). These spaces provide col-laborative environments in which participants are represented as avatars and caninteract with each other in real-time; they are used for games, community building,research and education primarily (see Damer 1998). They are one of the more
Figure 8.4 A screenshot of PeopleGarden, an interactive mapping tool for online discus-
sion boards developed by Rebecca Xiong.
124 • Martin Dodge
02 Virtual methods 20/12/04 9:16 am Page 124
interesting and novel CMC spaces for investigation by social scientists because ofthe navigable nature of their environments, the sense of presence engenderedthrough avatars and the scope for fostering virtual communities (Schroeder 2002;Snowdon, Churchill and Frécon 2003). The administrators of virtual worlds canlog all interaction in the world by users (movement, actions, chatting), providing apotentially panoptic source of multidimensional social data.
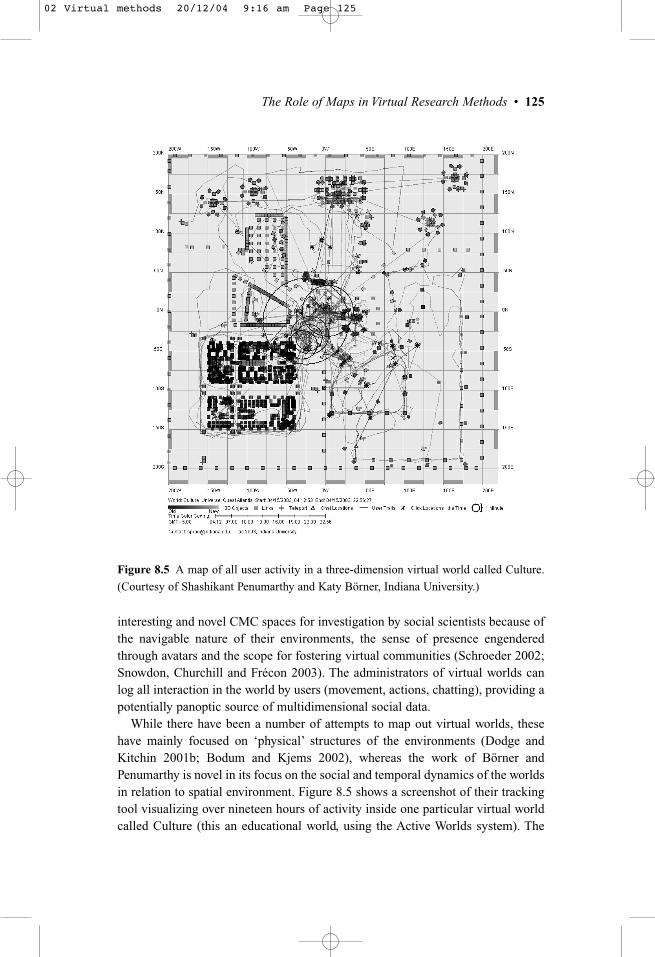
While there have been a number of attempts to map out virtual worlds, thesehave mainly focused on ‘physical’ structures of the environments (Dodge andKitchin 2001b; Bodum and Kjems 2002), whereas the work of Börner andPenumarthy is novel in its focus on the social and temporal dynamics of the worldsin relation to spatial environment. Figure 8.5 shows a screenshot of their trackingtool visualizing over nineteen hours of activity inside one particular virtual worldcalled Culture (this an educational world, using the Active Worlds system). The
Figure 8.5 A map of all user activity in a three-dimension virtual world called Culture.
(Courtesy of Shashikant Penumarthy and Katy Börner, Indiana University.)
The Role of Maps in Virtual Research Methods • 125
02 Virtual methods 20/12/04 9:16 am Page 125
map is dominated by the meandering paths of avatars (like pheromone trails),revealing where users went and when, and where they were talking. This degree oftime-space tracking can be highly revealing when plotted on a map, but also poten-tially very invasive, particularly if the users are not made aware that this is occur-ring.
According to Börner and Penumarthy, the role of their social visualization is toserve three particular groups – end-users gain an overview map to ease navigationand raise awareness of what social activities are occurring, world designers acquirea guide for their work in constructing the environment and researchers can under-stand socio-temporal patterns, particularly in relation to group formation.According to the cartography cube, I would place the use of this tracking visuali-zation in the ‘explore’ category for researchers and world designers as it is aprivate, interactive map revealing unknown patterns. If the tracking map was madeavailable to participants in the virtual world then it would enter the ‘synthesizing’category as it is more public and more about reinforcing existing knowledge.
Maps such as PeopleGarden and the virtual worlds tracker can give researchersuseful new insights into particular social spaces. Another important question ishow far these maps can be used by the participants of the spaces to augment orenhance their CMC experience? Will seeing a social mapping of the communityhelp inform the social life of the community, helping it grow through additionalfeedback? Or might such maps actually be detrimental to community life?
Conclusion
Virtual research is still often about the exploration of online spaces, seeking to dis-cover structures of information and patterns of social interaction. Maps are usefultools for any explorer (terrestrial or virtual), helping them to find their way andalso explaining to others what they found. In essence, maps exploit the mind’sability to see complex relationships more readily in visual images, providing aclearer understanding of phenomena, reducing search time, and showing relation-ships that may otherwise not have been noticed. As a consequence, they form anintegral part of how we understand and explain the world.
Although mapping is a potentially powerful research method for exploration,analysis, synthesis and presentation, it is not without its problems and I want toconclude this chapter by briefly outlining three types of limitations – practical,ethical and political. First, there are many practical issues to be faced and it isimportant to acknowledge the investment of time and effort necessary to makegood maps. Map-making is now much easier to do, but it is not necessarily a quickfix. Like any chosen research technique, the potential of mapping has externalpractical constraints, including data quality and the level of user knowledge.
There are also issues to consider relating to the ethics and responsibility of
126 • Martin Dodge
02 Virtual methods 20/12/04 9:16 am Page 126
researchers producing maps of CMC. The processes of data selection, generaliza-tion and classification and the numerous map design decisions mean that one cannever remove the subjective element in map-making. As Monmonier (1993) notes:
any single map is but one of many cartographic views of a variable or a set of data.Because the statistical map is a rhetorical device as well as an analytical tool, ethicsrequire that a single map not impose a deceptively erroneous or carelessly incompletecartographic view of the data. Scholars must look carefully at their data, experimentwith different representations, weigh both the requirements of the analysis and thelikely perceptions of the reader, and consider presenting complementary views withmultiple maps. (Monmonier 1993: 185)
Further, these new forms of social mapping open up CMC to a new kind of sur-veillance, revealing interactions that were previously hidden in unused log filesand databases. The act of mapping itself may constitute an invasion of privacy. Ifthe appeal of some CMC spaces is their anonymity, then users may object to itbeing placed under wider scrutiny, even if individuals are unidentifiable. Here,public analysis may well represent an infringement of personal rights, especially ifthe individuals were not consulted beforehand. In some senses, these maps maywork to shift the spaces they map from what their users consider semi-privatespaces to public spaces, and thus the maps may actually change the nature of CMCitself. Thus, it is important to consider the ways, and the extent to which, maps ofCMC are ‘responsible artefacts’, that do not destroy what they seek to represent orenhance.
Lastly, it should be recognized that mapping is also cultural process of creating,rather than merely revealing knowledge. All the sophisticated, interactive maps ofnetwork infrastructures and online social structures have politics just the same asany other form of cartographic text, and we must be alert to their ideological mes-sages (Harpold 1999; Dodge and Kitchin 2000). Maps of CMC can prove to bevery valuable, but at the same time they can never be value free.
The Role of Maps in Virtual Research Methods • 127
02 Virtual methods 20/12/04 9:16 am Page 127

02 Virtual methods 20/12/04 9:16 am Page 128