Embed Size (px)
Citation preview

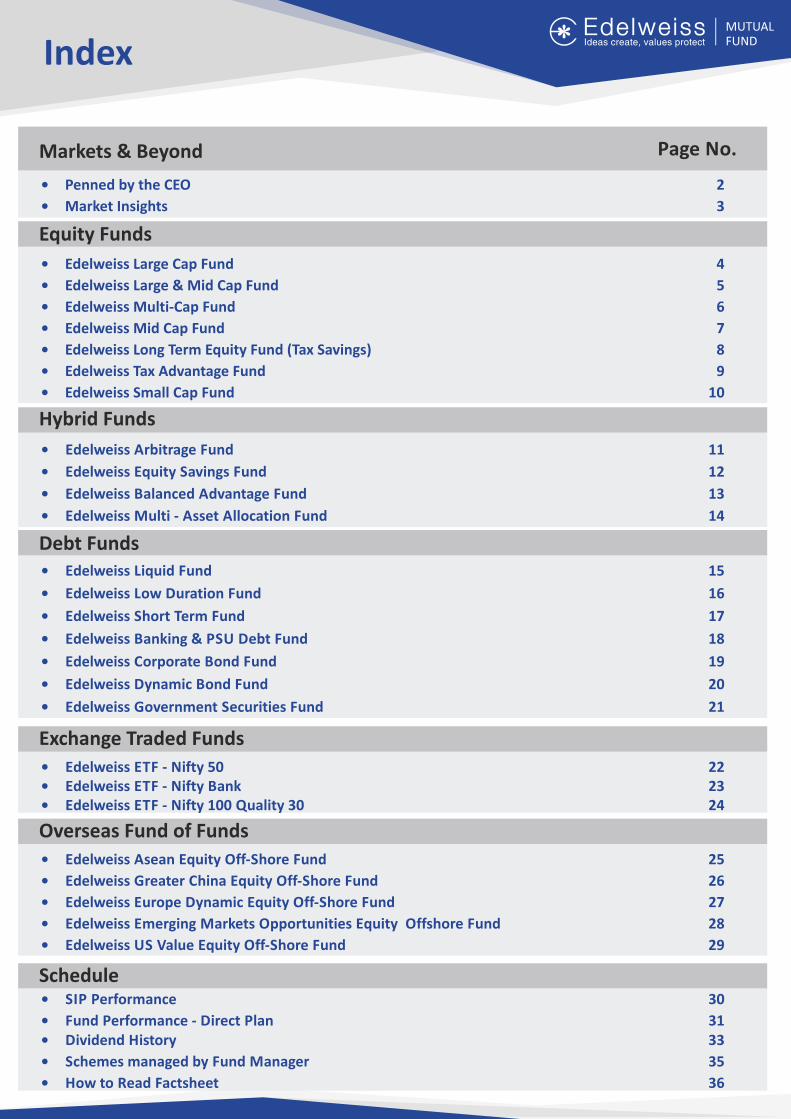
Index
Markets & Beyond
• Penned by the CEO 2
• Market Insights 3
• Edelweiss Arbitrage Fund 11
• Edelweiss Equity Savings Fund 12
• Edelweiss Balanced Advantage Fund 13
• Edelweiss 14Multi - Asset Allocation Fund
Hybrid Funds
Page No.
• Edelweiss Liquid Fund 15
• Edelweiss Low Duration Fund 16
• Edelweiss Short Term Fund 17
• Edelweiss Banking & PSU Debt Fund 18
• Edelweiss Corporate Bond Fund 19
• Edelweiss Dynamic Bond Fund 20
• Edelweiss Government Securities Fund 21
Debt Funds
• Edelweiss ETF - Nifty 50 22• Edelweiss ETF - Nifty Bank 23• Edelweiss ETF - Nifty 100 Quality 30 24
• SIP Performance 30
• Fund Performance - Direct Plan 31• Dividend History 33
• Schemes managed by Fund Manager 35
• How to Read Factsheet 36
Schedule
• Edelweiss Asean Equity Off-Shore Fund 25
• Edelweiss Greater China Equity Off-Shore Fund 26
• Edelweiss Europe Dynamic Equity Off-Shore Fund 27
• Edelweiss Emerging Markets Opportunities Equity Offshore Fund 28
• Edelweiss US Value Equity Off-Shore Fund 29
Overseas Fund of Funds
Equity Funds
• Edelweiss Large Cap Fund 4
• Edelweiss Large & Mid Cap Fund 5
• Edelweiss Multi-Cap Fund 6
• Edelweiss Mid Cap Fund 7
• Edelweiss Long Term Equity Fund (Tax Savings) 8
• Edelweiss Tax Advantage Fund 9
• Edelweiss Small Cap Fund 10
Exchange Traded Funds

Radhika Gupta
CEO, Edelweiss Asset Management Limited
Penned by the CEO
2
What did not work?
Slowing global growth weighed on auto exports as well as metal companies growth. Tight domestic liquidity hurts profits of NBFC and leverage consumption such as auto.
Overall, Q3FY19 was not so easy quarter as profit growth remained subdued. Government spending, INR depreciation and GST rate cuts were the key tailwinds that helped consumer, IT and pharma companies post strong double digit EBITDA growth. However, slowdown in global growth and tightening domestic liquidity were key headwinds for auto, NBFC and metals.
As we enter the next quarter, Street estimates are still optimistic with Q4FY19 EPS asking rate of 40% and FY20 EPS forecast of 26%.
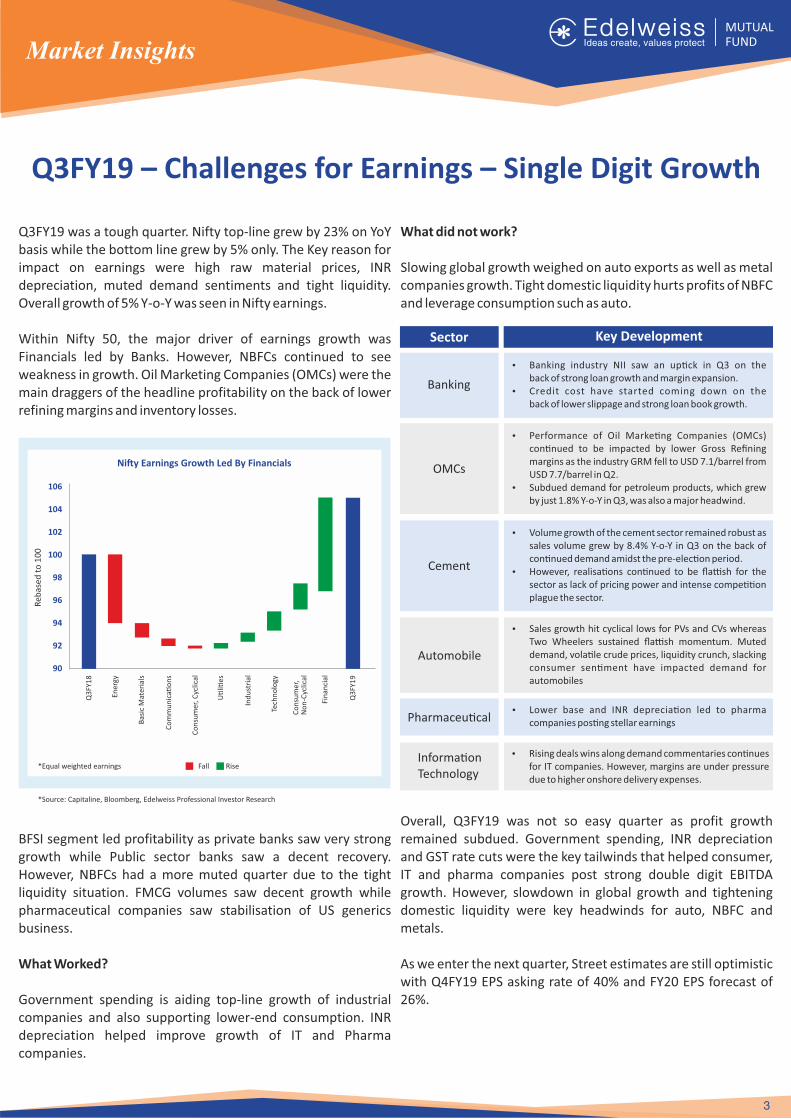
Q3FY19 was a tough quarter. Nifty top-line grew by 23% on YoY basis while the bottom line grew by 5% only. The Key reason for impact on earnings were high raw material prices, INR depreciation, muted demand sentiments and tight liquidity. Overall growth of 5% Y-o-Y was seen in Nifty earnings.
Within Nifty 50, the major driver of earnings growth was Financials led by Banks. However, NBFCs continued to see weakness in growth. Oil Marketing Companies (OMCs) were the main draggers of the headline profitability on the back of lower refining margins and inventory losses.
BFSI segment led profitability as private banks saw very strong growth while Public sector banks saw a decent recovery. However, NBFCs had a more muted quarter due to the tight liquidity situation. FMCG volumes saw decent growth while pharmaceutical companies saw stabilisation of US generics business.
What Worked?
Government spending is aiding top-line growth of industrial companies and also supporting lower-end consumption. INR depreciation helped improve growth of IT and Pharma companies.
Market Insights
Q3FY19 – Challenges for Earnings – Single Digit Growth
106
104
102
100
98
96
94
92
90
Q3
FY1
8
Q3
FY1
9
Ener
gy
Tech
no
logy
Fin
anci
al
Fall Rise
Sector
Banking
OMCs
Automobile
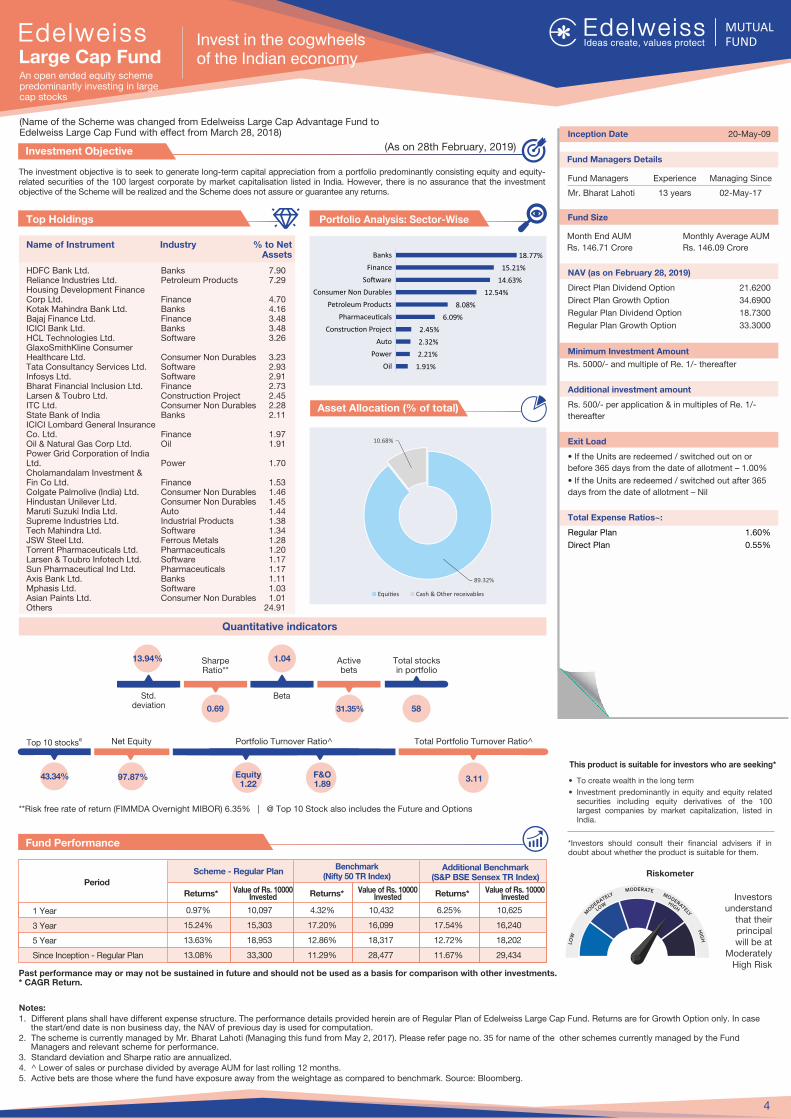
The investment objective is to seek to generate long-term capital appreciation from a portfolio predominantly consisting equity and equity-related securities of the 100 largest corporate by market capitalisation listed in India. However, there is no assurance that the investment objective of the Scheme will be realized and the Scheme does not assure or guarantee any returns.
Investment Objective
Fund Performance
This product is suitable for investors who are seeking*
� To create wealth in the long term
� Investment predominantly in equity and equity related securities including equity derivatives of the 100 largest companies by market capitalization, listed in India.
*Investors should consult their financial advisers if in doubt about whether the product is suitable for them.
Notes:1. Different plans shall have different expense structure. The performance details provided herein are of Regular Plan of Edelweiss Large Cap Fund. Returns are for Growth Option only. In case
the start/end date is non business day, the NAV of previous day is used for computation.2. The scheme is currently managed by Mr. Bharat Lahoti (Managing this fund from May 2, 2017). Please refer page no. 35 for name of the other schemes currently managed by the Fund
Managers and relevant scheme for performance.3. Standard deviation and Sharpe ratio are annualized.4. ^ Lower of sales or purchase divided by average AUM for last rolling 12 months. 5. Active bets are those where the fund have exposure away from the weightage as compared to benchmark. Source: Bloomberg.
Inception Date 20-May-09
NAV (as on February 28, 2019)
Direct Plan Dividend Option 21.6200
Direct Plan Growth Option 34.6900
Regular Plan Dividend Option 18.7300
Regular Plan Growth Option 33.3000
Minimum Investment Amount
Rs. 5000/- and multiple of Re. 1/- thereafter
Additional investment amount
Rs. 500/- per application & in multiples of Re. 1/-
thereafter
Exit Load
� If the Units are redeemed / switched out on or
before 365 days from the date of allotment � 1.00%
� If the Units are redeemed / switched out after 365
days from the date of allotment � Nil
Total Expense Ratios~:
Regular Plan 1.60%
Direct Plan 0.55%
Portfolio Analysis: Sector-Wise
Name of Instrument Industry % to Net Assets
Top Holdings
Scheme - Regular PlanBenchmark
(Nifty 50 TR Index)Additional Benchmark
(S&P BSE Sensex TR Index)Period
1 Year
3 Year
5 Year
Since Inception - Regular Plan
Returns* Returns*Value of Rs. 10000 Invested Returns*Value of Rs. 10000
InvestedValue of Rs. 10000
Invested
0.97% 10,097 4.32% 10,432 6.25% 10,625
15.24% 15,303 17.20% 16,099 17.54% 16,240
13.63% 18,953 12.86% 18,317 12.72% 18,202
13.08% 33,300 11.29% 28,477 11.67% 29,434
Fund Size
Month End AUM
Rs. 146.71 Crore
Monthly Average AUM
Rs. 146.09 Crore
**Risk free rate of return (FIMMDA Overnight MIBOR) 6.35% | @ Top 10 Stock also includes the Future and Options
HDFC Bank Ltd. Banks 7.90 Reliance Industries Ltd. Petroleum Products 7.29 Housing Development Finance Corp Ltd. Finance 4.70 Kotak Mahindra Bank Ltd. Banks 4.16 Bajaj Finance Ltd. Finance 3.48 ICICI Bank Ltd. Banks 3.48 HCL Technologies Ltd. Software 3.26 GlaxoSmithKline Consumer Healthcare Ltd. Consumer Non Durables 3.23 Tata Consultancy Services Ltd. Software 2.93 Infosys Ltd. Software 2.91 Bharat Financial Inclusion Ltd. Finance 2.73 Larsen & Toubro Ltd. Construction Project 2.45 ITC Ltd. Consumer Non Durables 2.28 State Bank of India Banks 2.11 ICICI Lombard General Insurance Co. Ltd. Finance 1.97 Oil & Natural Gas Corp Ltd. Oil 1.91 Power Grid Corporation of India Ltd. Power 1.70 Cholamandalam Investment & Fin Co Ltd. Finance 1.53 Colgate Palmolive (India) Ltd. Consumer Non Durables 1.46 Hindustan Unilever Ltd. Consumer Non Durables 1.45 Maruti Suzuki India Ltd. Auto 1.44 Supreme Industries Ltd. Industrial Products 1.38 Tech Mahindra Ltd. Software 1.34 JSW Steel Ltd. Ferrous Metals 1.28 Torrent Pharmaceuticals Ltd. Pharmaceuticals 1.20 Larsen & Toubro Infotech Ltd. Software 1.17 Sun Pharmaceutical Ind Ltd. Pharmaceuticals 1.17 Axis Bank Ltd. Banks 1.11 Mphasis Ltd. Software 1.03 Asian Paints Ltd. Consumer Non Durables 1.01 Others 24.91
Fund Managers Details
Fund Managers Experience Managing Since
Mr. Bharat Lahoti 13 years 02-May-17
Asset Allocation (% of total)
4
Past performance may or may not be sustained in future and should not be used as a basis for comparison with other investments. * CAGR Return.
Invest in the cogwheels of the Indian economyLarge Cap Fund
An open ended equity scheme predominantly investing in large cap stocks
Riskometer
Investors understand
that their principal will be at
Moderately High Risk
Quantitative indicators
Total Portfolio Turnover Ratio^Portfolio Turnover Ratio^
3.11
Std. deviation
13.94% Sharpe Ratio**
0.69
Beta
1.04 Total stocks in portfolio
58
Active bets
31.35%
@Top 10 stocks
43.34%
Net Equity
97.87% Equity1.22
F&O1.89
(As on 28th February, 2019)
(Name of the Scheme was changed from Edelweiss Large Cap Advantage Fund to Edelweiss Large Cap Fund with effect from March 28, 2018)
Equi�es Cash & Other receivables
1.91%
2.21%
2.32%
2.45%
6.09%
8.08%
12.54%
14.63%
15.21%
18.77%
Oil
Power
Auto
Construc�on Project
Pharmaceu�cals
Petroleum Products
Consumer Non Durables
So�ware
Finance
Banks
89.32%
10.68%
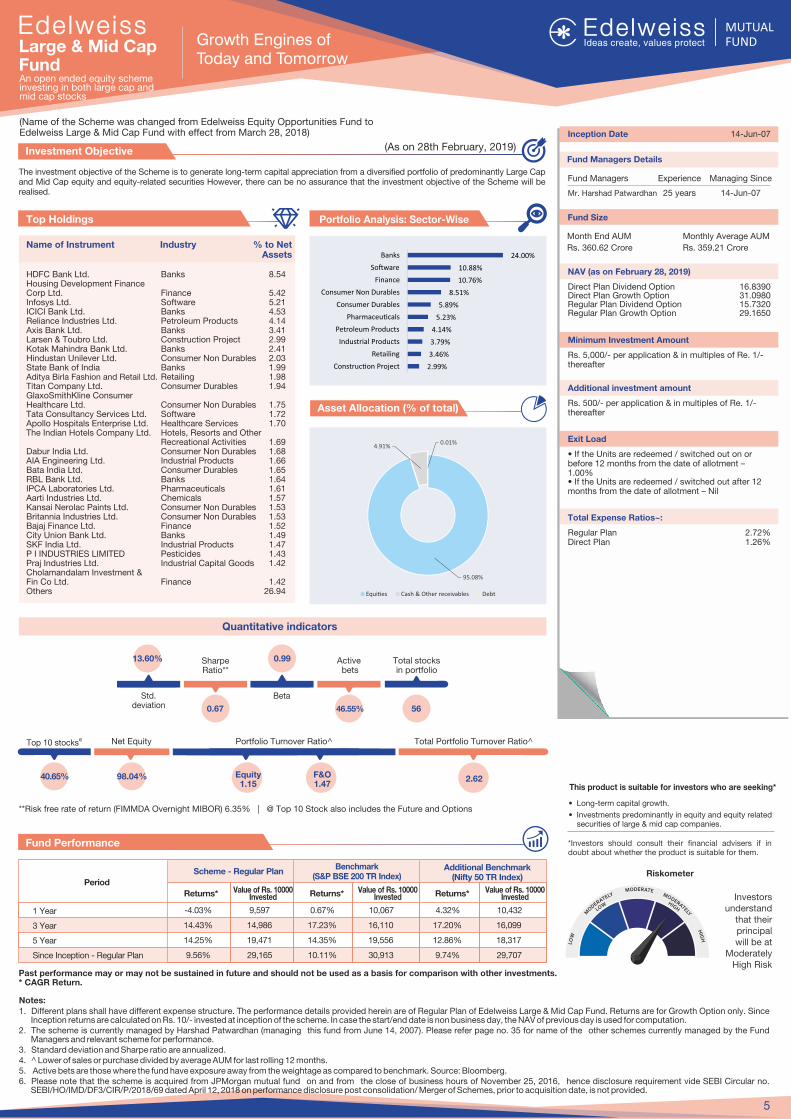
The investment objective of the Scheme is to generate long-term capital appreciation from a diversified portfolio of predominantly Large Cap and Mid Cap equity and equity-related securities However, there can be no assurance that the investment objective of the Scheme will be realised.
Investment Objective
Fund Performance
This product is suitable for investors who are seeking*
� Long-term capital growth.
� Investments predominantly in equity and equity related securities of large & mid cap companies.
*Investors should consult their financial advisers if in doubt about whether the product is suitable for them.
Notes:1. Different plans shall have different expense structure. The performance details provided herein are of Regular Plan of Edelweiss Large & Mid Cap Fund. Returns are for Growth Option only. Since
Inception returns are calculated on Rs. 10/- invested at inception of the scheme. In case the start/end date is non business day, the NAV of previous day is used for computation.2. The scheme is currently managed by Harshad Patwardhan (managing this fund from June 14, 2007). Please refer page no. 35 for name of the other schemes currently managed by the Fund
Managers and relevant scheme for performance.3. Standard deviation and Sharpe ratio are annualized.4. ^ Lower of sales or purchase divided by average AUM for last rolling 12 months. 5. Active bets are those where the fund have exposure away from the weightage as compared to benchmark. Source: Bloomberg. 6. Please note that the scheme is acquired from JPMorgan mutual fund on and from the close of business hours of November 25, 2016, hence disclosure requirement vide SEBI Circular no.
SEBI/HO/IMD/DF3/CIR/P/2018/69 dated April 12, 2018 on performance disclosure post consolidation/ Merger of Schemes, prior to acquisition date, is not provided.
Inception Date 14-Jun-07
NAV (as on February 28, 2019)
Direct Plan Dividend Option 16.8390Direct Plan Growth Option 31.0980Regular Plan Dividend Option 15.7320Regular Plan Growth Option 29.1650
Minimum Investment Amount
Rs. 5,000/- per application & in multiples of Re. 1/- thereafter
Additional investment amount
Rs. 500/- per application & in multiples of Re. 1/- thereafter
Exit Load
� If the Units are redeemed / switched out on or before 12 months from the date of allotment � 1.00%� If the Units are redeemed / switched out after 12 months from the date of allotment � Nil
Total Expense Ratios~:
Regular Plan 2.72%Direct Plan 1.26%
Portfolio Analysis: Sector-Wise
Name of Instrument Industry % to Net Assets
Top Holdings
Scheme - Regular PlanBenchmark
(S&P BSE 200 TR Index)Additional Benchmark
(Nifty 50 TR Index)Period
1 Year
3 Year
5 Year
Since Inception - Regular Plan
Returns* Returns*Value of Rs. 10000 Invested Returns*Value of Rs. 10000
InvestedValue of Rs. 10000
Invested
-4.03% 9,597 0.67% 10,067 4.32% 10,432
14.43% 14,986 17.23% 16,110 17.20% 16,099
14.25% 19,471 14.35% 19,556 12.86% 18,317
9.56% 29,165 10.11% 30,913 9.74% 29,707
Fund Size
**Risk free rate of return (FIMMDA Overnight MIBOR) 6.35% | @ Top 10 Stock also includes the Future and Options
HDFC Bank Ltd. Banks 8.54 Housing Development Finance Corp Ltd. Finance 5.42 Infosys Ltd. Software 5.21 ICICI Bank Ltd. Banks 4.53 Reliance Industries Ltd. Petroleum Products 4.14 Axis Bank Ltd. Banks 3.41 Larsen & Toubro Ltd. Construction Project 2.99 Kotak Mahindra Bank Ltd. Banks 2.41 Hindustan Unilever Ltd. Consumer Non Durables 2.03 State Bank of India Banks 1.99 Aditya Birla Fashion and Retail Ltd. Retailing 1.98 Titan Company Ltd. Consumer Durables 1.94 GlaxoSmithKline Consumer Healthcare Ltd. Consumer Non Durables 1.75 Tata Consultancy Services Ltd. Software 1.72 Apollo Hospitals Enterprise Ltd. Healthcare Services 1.70 The Indian Hotels Company Ltd. Hotels, Resorts and Other Recreational Activities 1.69 Dabur India Ltd. Consumer Non Durables 1.68 AIA Engineering Ltd. Industrial Products 1.66 Bata India Ltd. Consumer Durables 1.65 RBL Bank Ltd. Banks 1.64 IPCA Laboratories Ltd. Pharmaceuticals 1.61 Aarti Industries Ltd. Chemicals 1.57 Kansai Nerolac Paints Ltd. Consumer Non Durables 1.53 Britannia Industries Ltd. Consumer Non Durables 1.53 Bajaj Finance Ltd. Finance 1.52 City Union Bank Ltd. Banks 1.49 SKF India Ltd. Industrial Products 1.47 P I INDUSTRIES LIMITED Pesticides 1.43 Praj Industries Ltd. Industrial Capital Goods 1.42 Cholamandalam Investment & Fin Co Ltd. Finance 1.42 Others 26.94
Fund Managers Details
Fund Managers Experience Managing Since
Mr. Harshad Patwardhan 25 years 14-Jun-07
Asset Allocation (% of total)
5
Past performance may or may not be sustained in future and should not be used as a basis for comparison with other investments. * CAGR Return.
Large & Mid Cap FundAn open ended equity scheme investing in both large cap and mid cap stocks
Riskometer
Investors understand
that their principal will be at
Moderately High Risk
Quantitative indicators
Total Portfolio Turnover Ratio^Portfolio Turnover Ratio^
2.62
Std. deviation
13.60% Sharpe Ratio**
0.67
Beta
0.99 Total stocks in portfolio
56
Active bets
46.55%
@Top 10 stocks
40.65%
Net Equity
98.04% Equity1.15
F&O1.47
(As on 28th February, 2019)
Monthly Average AUM
Rs. 359.21 Crore
(Name of the Scheme was changed from Edelweiss Equity Opportunities Fund to Edelweiss Large & Mid Cap Fund with effect from March 28, 2018)
Growth Engines of Today and Tomorrow
Equi�es Cash & Other receivables Debt
Month End AUM
Rs. 360.62 Crore
95.08%
4.91%0.01%
2.99%
3.46%
3.79%
4.14%
5.23%
5.89%
8.51%
10.76%
10.88%
24.00%
Construc�on Project
Retailing
Industrial Products
Petroleum Products
Pharmaceu�cals
Consumer Durables
Consumer Non Durables
Finance
So�ware
Banks
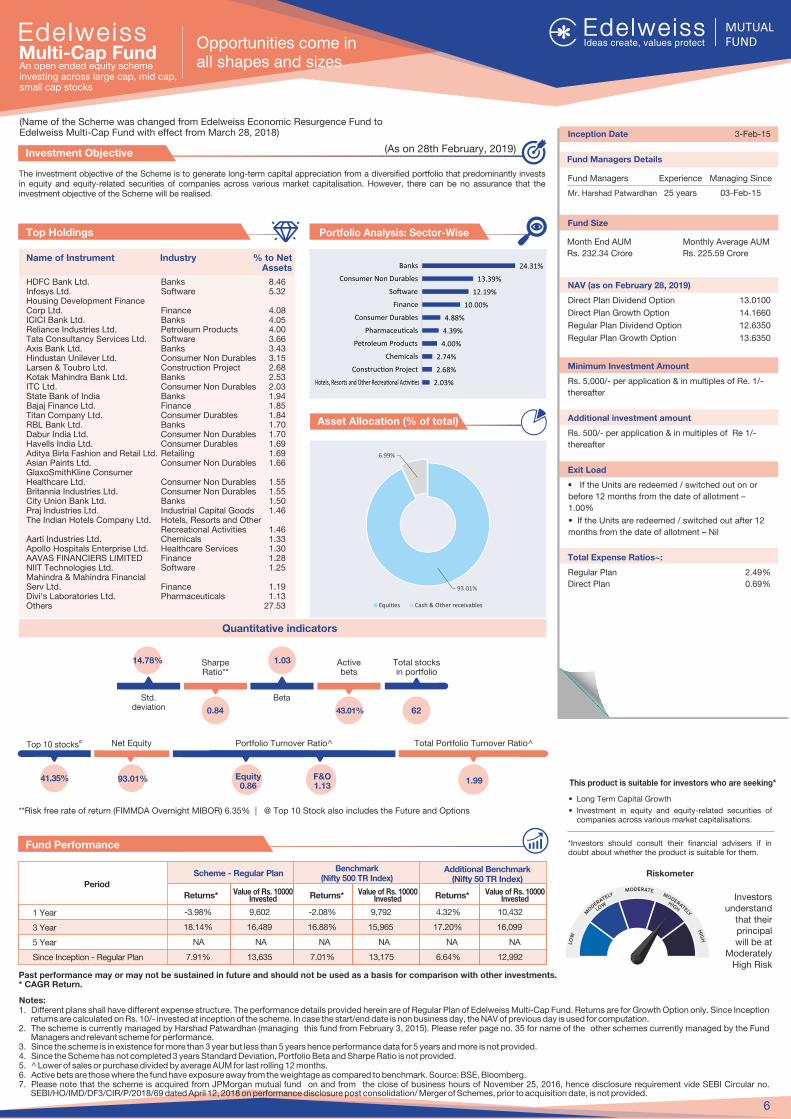
The investment objective of the Scheme is to generate long-term capital appreciation from a diversified portfolio that predominantly invests in equity and equity-related securities of companies across various market capitalisation. However, there can be no assurance that the investment objective of the Scheme will be realised.
Investment Objective
Fund Performance
This product is suitable for investors who are seeking*
� Long Term Capital Growth
� Investment in equity and equity-related securities of companies across various market capitalisations.
*Investors should consult their financial advisers if in doubt about whether the product is suitable for them.
Notes:1. Different plans shall have different expense structure. The performance details provided herein are of Regular Plan of Edelweiss Multi-Cap Fund. Returns are for Growth Option only. Since Inception
returns are calculated on Rs. 10/- invested at inception of the scheme. In case the start/end date is non business day, the NAV of previous day is used for computation.2. The scheme is currently managed by Harshad Patwardhan (managing this fund from February 3, 2015). Please refer page no. 35 for name of the other schemes currently managed by the Fund
Managers and relevant scheme for performance.3. Since the scheme is in existence for more than 3 year but less than 5 years hence performance data for 5 years and more is not provided.4. Since the Scheme has not completed 3 years Standard Deviation, Portfolio Beta and Sharpe Ratio is not provided.5. ^ Lower of sales or purchase divided by average AUM for last rolling 12 months. 6. Active bets are those where the fund have exposure away from the weightage as compared to benchmark. Source: BSE, Bloomberg. 7. Please note that the scheme is acquired from JPMorgan mutual fund on and from the close of business hours of November 25, 2016, hence disclosure requirement vide SEBI Circular no.
SEBI/HO/IMD/DF3/CIR/P/2018/69 dated April 12, 2018 on performance disclosure post consolidation/ Merger of Schemes, prior to acquisition date, is not provided.
Inception Date 3-Feb-15
NAV (as on February 28, 2019)
Direct Plan Dividend Option 13.0100
Direct Plan Growth Option 14.1660
Regular Plan Dividend Option 12.6350
Regular Plan Growth Option 13.6350
Minimum Investment Amount
Rs. 5,000/- per application & in multiples of Re. 1/-
thereafter
Additional investment amount
Rs. 500/- per application & in multiples of Re 1/-
thereafter
Exit Load
� If the Units are redeemed / switched out on or
before 12 months from the date of allotment �
1.00%
� If the Units are redeemed / switched out after 12
months from the date of allotment � Nil
Total Expense Ratios~:
Regular Plan 2.49%
Direct Plan 0.69%
Portfolio Analysis: Sector-Wise
Name of Instrument Industry % to Net Assets
Top Holdings
Scheme - Regular PlanBenchmark
(Nifty 500 TR Index)Additional Benchmark
(Nifty 50 TR Index)Period
1 Year
3 Year
5 Year
Since Inception - Regular Plan
Returns* Returns*Value of Rs. 10000 Invested Returns*Value of Rs. 10000
InvestedValue of Rs. 10000
Invested
-3.98% 9,602 -2.08% 9,792 4.32% 10,432
18.14% 16,489 16.88% 15,965 17.20% 16,099
NA NA NA NA NA NA
7.91% 13,635 7.01% 13,175 6.64% 12,992
Fund Size
Month End AUM
Rs. 232.34 Crore
Monthly Average AUM
Rs. 225.59 Crore
**Risk free rate of return (FIMMDA Overnight MIBOR) 6.35% | @ Top 10 Stock also includes the Future and Options
HDFC Bank Ltd. Banks 8.46 Infosys Ltd. Software 5.32 Housing Development Finance Corp Ltd. Finance 4.08 ICICI Bank Ltd. Banks 4.05 Reliance Industries Ltd. Petroleum Products 4.00 Tata Consultancy Services Ltd. Software 3.66 Axis Bank Ltd. Banks 3.43 Hindustan Unilever Ltd. Consumer Non Durables 3.15 Larsen & Toubro Ltd. Construction Project 2.68 Kotak Mahindra Bank Ltd. Banks 2.53 ITC Ltd. Consumer Non Durables 2.03 State Bank of India Banks 1.94 Bajaj Finance Ltd. Finance 1.85 Titan Company Ltd. Consumer Durables 1.84 RBL Bank Ltd. Banks 1.70 Dabur India Ltd. Consumer Non Durables 1.70 Havells India Ltd. Consumer Durables 1.69 Aditya Birla Fashion and Retail Ltd. Retailing 1.69 Asian Paints Ltd. Consumer Non Durables 1.66 GlaxoSmithKline Consumer Healthcare Ltd. Consumer Non Durables 1.55 Britannia Industries Ltd. Consumer Non Durables 1.55 City Union Bank Ltd. Banks 1.50 Praj Industries Ltd. Industrial Capital Goods 1.46 The Indian Hotels Company Ltd. Hotels, Resorts and Other Recreational Activities 1.46 Aarti Industries Ltd. Chemicals 1.33 Apollo Hospitals Enterprise Ltd. Healthcare Services 1.30 AAVAS FINANCIERS LIMITED Finance 1.28 NIIT Technologies Ltd. Software 1.25 Mahindra & Mahindra Financial Serv Ltd. Finance 1.19 Divi's Laboratories Ltd. Pharmaceuticals 1.13 Others 27.53
Fund Managers Details
Fund Managers Experience Managing Since
Mr. Harshad Patwardhan 25 years 03-Feb-15
Asset Allocation (% of total)
6
Past performance may or may not be sustained in future and should not be used as a basis for comparison with other investments. * CAGR Return.
Multi-Cap Fund An open ended equity scheme investing across large cap, mid cap, small cap stocks
Riskometer
Investors understand
that their principal will be at
ModeratelyHigh Risk
Quantitative indicators
Total Portfolio Turnover Ratio^Portfolio Turnover Ratio^
1.99
Std. deviation
14.78% Sharpe Ratio**
0.84
Beta
1.03 Total stocks in portfolio
62
Active bets
43.01%
@Top 10 stocks
41.35%
Net Equity
93.01% Equity0.86
F&O1.13
(As on 28th February, 2019)
(Name of the Scheme was changed from Edelweiss Economic Resurgence Fund to Edelweiss Multi-Cap Fund with effect from March 28, 2018)
Opportunities come in all shapes and sizes
Equi�es Cash & Other receivables
93.01%
6.99%
2.03%
2.68%
2.74%
4.00%
4.39%
4.88%
10.00%
12.19%
13.39%
24.31%
Hotels, Resorts and Other Recrea�onal Ac�vi�es
Construc�on Project
Chemicals
Petroleum Products
Pharmaceu�cals
Consumer Durables
Finance
So�ware
Consumer Non Durables
Banks
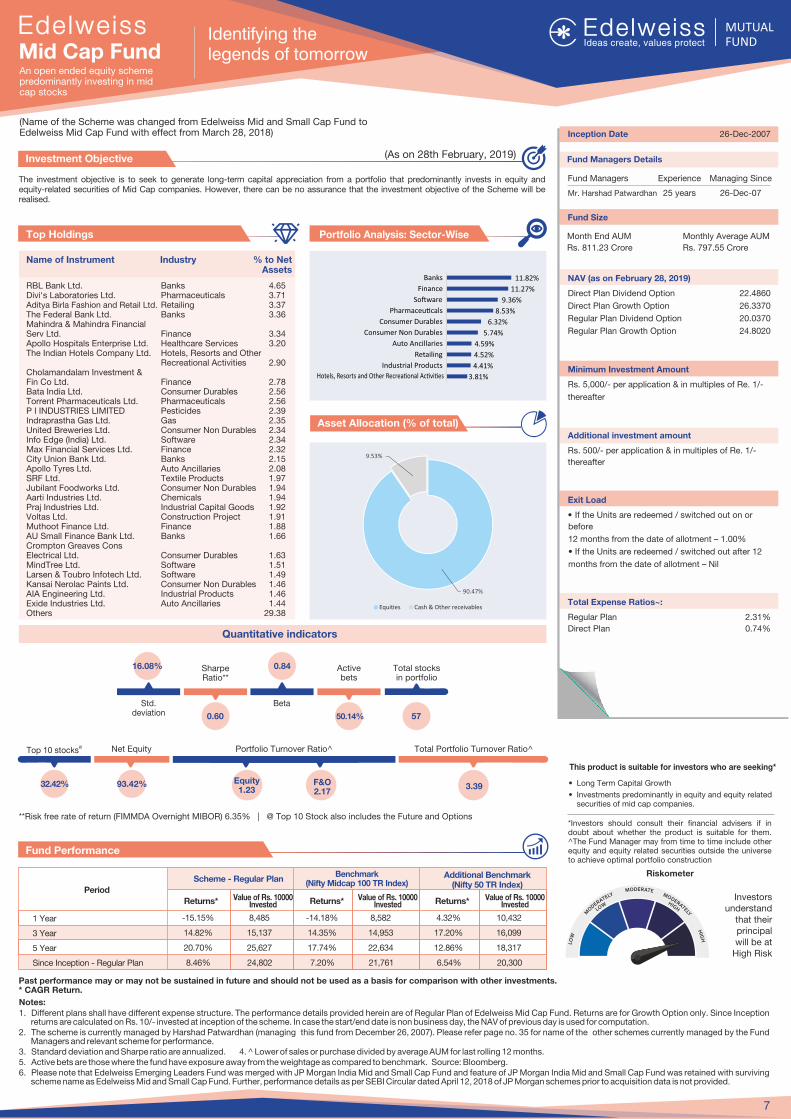
The investment objective is to seek to generate long-term capital appreciation from a portfolio that predominantly invests in equity and equity-related securities of Mid Cap companies. However, there can be no assurance that the investment objective of the Scheme will be realised.
Investment Objective
Fund Performance
This product is suitable for investors who are seeking*
� Long Term Capital Growth
� Investments predominantly in equity and equity related securities of mid cap companies.
*Investors should consult their financial advisers if in doubt about whether the product is suitable for them. ^The Fund Manager may from time to time include other equity and equity related securities outside the universe to achieve optimal portfolio construction
Notes:1. Different plans shall have different expense structure. The performance details provided herein are of Regular Plan of Edelweiss Mid Cap Fund. Returns are for Growth Option only. Since Inception
returns are calculated on Rs. 10/- invested at inception of the scheme. In case the start/end date is non business day, the NAV of previous day is used for computation.2. The scheme is currently managed by Harshad Patwardhan (managing this fund from December 26, 2007). Please refer page no. 35 for name of the other schemes currently managed by the Fund
Managers and relevant scheme for performance.3. Standard deviation and Sharpe ratio are annualized. 4. ̂ Lower of sales or purchase divided by average AUM for last rolling 12 months. 5. Active bets are those where the fund have exposure away from the weightage as compared to benchmark. Source: Bloomberg. 6. Please note that Edelweiss Emerging Leaders Fund was merged with JP Morgan India Mid and Small Cap Fund and feature of JP Morgan India Mid and Small Cap Fund was retained with surviving
scheme name as Edelweiss Mid and Small Cap Fund. Further, performance details as per SEBI Circular dated April 12, 2018 of JP Morgan schemes prior to acquisition data is not provided.
Inception Date 26-Dec-2007
NAV (as on February 28, 2019)
Direct Plan Dividend Option 22.4860
Direct Plan Growth Option 26.3370
Regular Plan Dividend Option 20.0370
Regular Plan Growth Option 24.8020
Minimum Investment Amount
Rs. 5,000/- per application & in multiples of Re. 1/-
thereafter
Additional investment amount
Rs. 500/- per application & in multiples of Re. 1/-
thereafter
Exit Load
� If the Units are redeemed / switched out on or
before
12 months from the date of allotment � 1.00%
� If the Units are redeemed / switched out after 12
months from the date of allotment � Nil
Total Expense Ratios~:
Regular Plan 2.31%
Direct Plan 0.74%
Portfolio Analysis: Sector-Wise
Name of Instrument Industry % to Net Assets
Top Holdings
Scheme - Regular PlanBenchmark Additional Benchmark
(Nifty 50 TR Index)Period
1 Year
3 Year
5 Year
Since Inception - Regular Plan
Returns* Returns*Value of Rs. 10000 Invested Returns*Value of Rs. 10000
InvestedValue of Rs. 10000
Invested
-15.15% 8,485 -14.18% 8,582 4.32% 10,432
14.82% 15,137 14.35% 14,953 17.20% 16,099
20.70% 25,627 17.74% 22,634 12.86% 18,317
8.46% 24,802 7.20% 21,761 6.54% 20,300
Fund Size
Month End AUM
Rs. 811.23 Crore
Monthly Average AUM
Rs. 797.55 Crore
**Risk free rate of return (FIMMDA Overnight MIBOR) 6.35% | @ Top 10 Stock also includes the Future and Options
RBL Bank Ltd. Banks 4.65 Divi's Laboratories Ltd. Pharmaceuticals 3.71 Aditya Birla Fashion and Retail Ltd. Retailing 3.37 The Federal Bank Ltd. Banks 3.36 Mahindra & Mahindra Financial Serv Ltd. Finance 3.34 Apollo Hospitals Enterprise Ltd. Healthcare Services 3.20 The Indian Hotels Company Ltd. Hotels, Resorts and Other Recreational Activities 2.90 Cholamandalam Investment & Fin Co Ltd. Finance 2.78 Bata India Ltd. Consumer Durables 2.56 Torrent Pharmaceuticals Ltd. Pharmaceuticals 2.56 P I INDUSTRIES LIMITED Pesticides 2.39 Indraprastha Gas Ltd. Gas 2.35 United Breweries Ltd. Consumer Non Durables 2.34 Info Edge (India) Ltd. Software 2.34 Max Financial Services Ltd. Finance 2.32 City Union Bank Ltd. Banks 2.15 Apollo Tyres Ltd. Auto Ancillaries 2.08 SRF Ltd. Textile Products 1.97 Jubilant Foodworks Ltd. Consumer Non Durables 1.94 Aarti Industries Ltd. Chemicals 1.94 Praj Industries Ltd. Industrial Capital Goods 1.92 Voltas Ltd. Construction Project 1.91 Muthoot Finance Ltd. Finance 1.88 AU Small Finance Bank Ltd. Banks 1.66 Crompton Greaves Cons Electrical Ltd. Consumer Durables 1.63 MindTree Ltd. Software 1.51 Larsen & Toubro Infotech Ltd. Software 1.49 Kansai Nerolac Paints Ltd. Consumer Non Durables 1.46 AIA Engineering Ltd. Industrial Products 1.46 Exide Industries Ltd. Auto Ancillaries 1.44 Others 29.38
Fund Managers Details
Fund Managers Experience Managing Since
Mr. Harshad Patwardhan 25 years 26-Dec-07
Asset Allocation (% of total)
7
Past performance may or may not be sustained in future and should not be used as a basis for comparison with other investments. * CAGR Return.
Identifying the legends of tomorrowMid Cap Fund
An open ended equity scheme predominantly investing in mid cap stocks
(Nifty Midcap 100 TR Index)Riskometer
Investors understand
that their principal will be at
High Risk
Quantitative indicators
Total Portfolio Turnover Ratio^Portfolio Turnover Ratio^
3.39
Std. deviation
16.08% Sharpe Ratio**
0.60
Beta
0.84 Total stocks in portfolio
57
Active bets
50.14%
@Top 10 stocks
32.42%
Net Equity
93.42% Equity1.23
F&O2.17
(As on 28th February, 2019)
(Name of the Scheme was changed from Edelweiss Mid and Small Cap Fund to Edelweiss Mid Cap Fund with effect from March 28, 2018)
Equi�es Cash & Other receivables
90.47%
9.53%
3.81%
4.41%
4.52%
4.59%
5.74%
6.32%
8.53%
9.36%
11.27%
11.82%
Industrial Products
Retailing
Auto Ancillaries
Consumer Non Durables
Consumer Durables
Pharmaceu�cals
So�ware
Finance
Banks
Hotels, Resorts and Other Recrea�onal Ac�vi�es
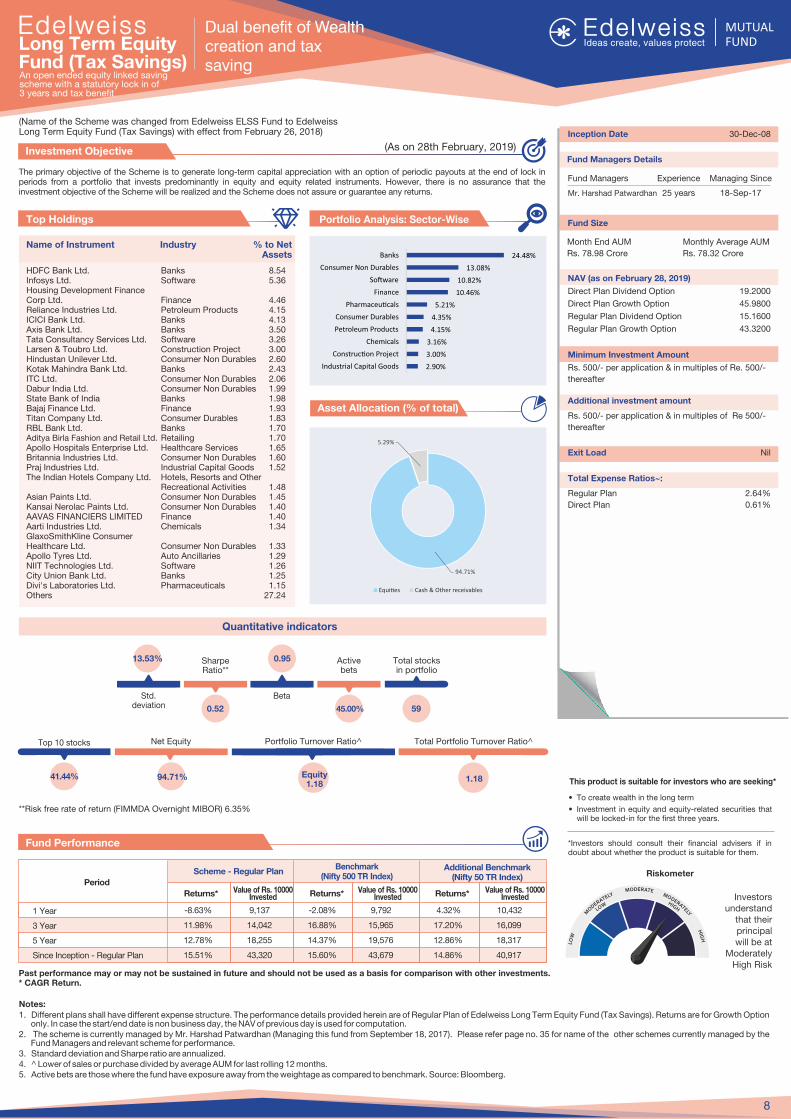
The primary objective of the Scheme is to generate long-term capital appreciation with an option of periodic payouts at the end of lock in periods from a portfolio that invests predominantly in equity and equity related instruments. However, there is no assurance that the investment objective of the Scheme will be realized and the Scheme does not assure or guarantee any returns.
Investment Objective
Fund Performance
This product is suitable for investors who are seeking*
� To create wealth in the long term
� Investment in equity and equity-related securities that will be locked-in for the first three years.
*Investors should consult their financial advisers if in doubt about whether the product is suitable for them.
Notes:1. Different plans shall have different expense structure. The performance details provided herein are of Regular Plan of Edelweiss Long Term Equity Fund (Tax Savings). Returns are for Growth Option
only. In case the start/end date is non business day, the NAV of previous day is used for computation.2. The scheme is currently managed by Mr. Harshad Patwardhan (Managing this fund from September 18, 2017). Please refer page no. 35 for name of the other schemes currently managed by the
Fund Managers and relevant scheme for performance.3. Standard deviation and Sharpe ratio are annualized.4. ^ Lower of sales or purchase divided by average AUM for last rolling 12 months. 5. Active bets are those where the fund have exposure away from the weightage as compared to benchmark. Source: Bloomberg.
Inception Date 30-Dec-08
NAV (as on February 28, 2019)
Direct Plan Dividend Option 19.2000
Direct Plan Growth Option 45.9800
Regular Plan Dividend Option 15.1600
Regular Plan Growth Option 43.3200
Minimum Investment Amount
Rs. Re. 500/- 500/- per application & in multiples of
thereafter
Additional investment amount
Rs. 500/- per application & in multiples of Re 500/-
thereafter
Exit Load Nil
Total Expense Ratios~:
Regular Plan 2.64%
Direct Plan 0.61%
Portfolio Analysis: Sector-Wise
Name of Instrument Industry % to Net Assets
Top Holdings
Scheme - Regular PlanBenchmark
(Nifty 500 TR Index)Additional Benchmark
(Nifty 50 TR Index)Period
1 Year
3 Year
5 Year
Since Inception - Regular Plan
Returns* Returns*Value of Rs. 10000 Invested Returns*Value of Rs. 10000
InvestedValue of Rs. 10000
Invested
-8.63% 9,137 -2.08% 9,792 4.32% 10,432
11.98% 14,042 16.88% 15,965 17.20% 16,099
12.78% 18,255 14.37% 19,576 12.86% 18,317
15.51% 43,320 15.60% 43,679 14.86% 40,917
Fund Size
Month End AUM
Rs. 78.98 Crore
Monthly Average AUM
Rs. 78.32 Crore
**Risk free rate of return (FIMMDA Overnight MIBOR) 6.35%
HDFC Bank Ltd. Banks 8.54 Infosys Ltd. Software 5.36 Housing Development Finance Corp Ltd. Finance 4.46 Reliance Industries Ltd. Petroleum Products 4.15 ICICI Bank Ltd. Banks 4.13 Axis Bank Ltd. Banks 3.50 Tata Consultancy Services Ltd. Software 3.26 Larsen & Toubro Ltd. Construction Project 3.00 Hindustan Unilever Ltd. Consumer Non Durables 2.60 Kotak Mahindra Bank Ltd. Banks 2.43 ITC Ltd. Consumer Non Durables 2.06 Dabur India Ltd. Consumer Non Durables 1.99 State Bank of India Banks 1.98 Bajaj Finance Ltd. Finance 1.93 Titan Company Ltd. Consumer Durables 1.83 RBL Bank Ltd. Banks 1.70 Aditya Birla Fashion and Retail Ltd. Retailing 1.70 Apollo Hospitals Enterprise Ltd. Healthcare Services 1.65 Britannia Industries Ltd. Consumer Non Durables 1.60 Praj Industries Ltd. Industrial Capital Goods 1.52 The Indian Hotels Company Ltd. Hotels, Resorts and Other Recreational Activities 1.48 Asian Paints Ltd. Consumer Non Durables 1.45 Kansai Nerolac Paints Ltd. Consumer Non Durables 1.40 AAVAS FINANCIERS LIMITED Finance 1.40 Aarti Industries Ltd. Chemicals 1.34 GlaxoSmithKline Consumer Healthcare Ltd. Consumer Non Durables 1.33 Apollo Tyres Ltd. Auto Ancillaries 1.29 NIIT Technologies Ltd. Software 1.26 City Union Bank Ltd. Banks 1.25 Divi's Laboratories Ltd. Pharmaceuticals 1.15 Others 27.24
Fund Managers Details
Fund Managers Experience Managing Since
Mr. Harshad Patwardhan 25 years 18-Sep-17
Asset Allocation (% of total)
8
Past performance may or may not be sustained in future and should not be used as a basis for comparison with other investments. * CAGR Return.
Dual benefit of Wealthcreation and tax saving
Long Term Equity Fund (Tax Savings)An open ended equity linked saving scheme with a statutory lock in of 3 years and tax benefit
Riskometer
Investors understand
that their principal will be at
Moderately High Risk
Quantitative indicators
Total Portfolio Turnover Ratio^Portfolio Turnover Ratio^
1.18
Std. deviation
13.53% Sharpe Ratio**
0.52
Beta
0.95 Total stocks in portfolio
59
Active bets
45.00%
Top 10 stocks
41.44%
Net Equity
94.71% Equity1.18
(As on 28th February, 2019)
(Name of the Scheme was changed from Edelweiss ELSS Fund to Edelweiss Long Term Equity Fund (Tax Savings) with effect from February 26, 2018)
Equi�es Cash & Other receivables
94.71%
5.29%
2.90%
3.00%
3.16%
4.15%
4.35%
5.21%
10.46%
10.82%
13.08%
24.48%
Industrial Capital Goods
Construc�on Project
Chemicals
Petroleum Products
Consumer Durables
Pharmaceu�cals
Finance
So�ware
Consumer Non Durables
Banks
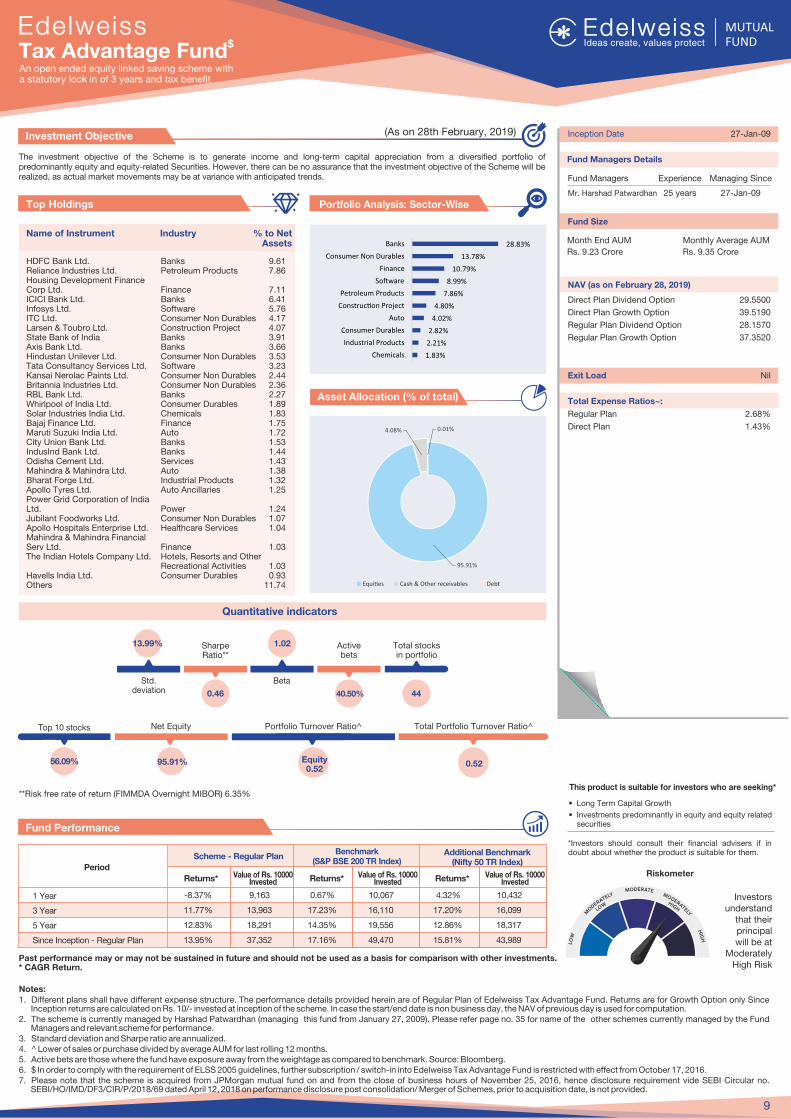
The investment objective of the Scheme is to generate income and long-term capital appreciation from a diversified portfolio of predominantly equity and equity-related Securities. However, there can be no assurance that the investment objective of the Scheme will be realized, as actual market movements may be at variance with anticipated trends.
Investment Objective
Fund Performance
Riskometer
This product is suitable for investors who are seeking*
� Long Term Capital Growth
� Investments predominantly in equity and equity related securities
*Investors should consult their financial advisers if in doubt about whether the product is suitable for them.
Notes:1. Different plans shall have different expense structure. The performance details provided herein are of of Regular Plan Edelweiss Tax Advantage Fund. Returns are for Growth Option only Since
Inception returns are calculated on Rs. 10/- invested at inception of the scheme. In case the start/end date is non business day, the NAV of previous day is used for computation.2. The scheme is currently managed by Harshad Patwardhan January 27 09 . 35 (managing this fund from , 20 ) Please refer page no. for name of the other schemes currently managed by the Fund
Managers and relevant scheme for performance.3. Standard deviation and Sharpe ratio are annualized.4. ^ Lower of sales or purchase divided by average AUM for last rolling 12 months. 5. Active bets are those where the fund have exposure away from the weightage as compared to benchmark. Source: Bloomberg. 6. $ In order to comply with the requirement of ELSS 2005 guidelines, further subscription / switch-in into Edelweiss Tax Advantage Fund is restricted with effect from October 17, 2016.7. Please note that the scheme is acquired from JPMorgan mutual fund on and from the close of business hours of November 25, 2016, hence disclosure requirement vide SEBI Circular no.
SEBI/HO/IMD/DF3/CIR/P/2018/69 dated April 12, 2018 on performance disclosure post consolidation/ Merger of Schemes, prior to acquisition date, is not provided.
Inception Date 27-Jan-09
NAV (as on February 28, 2019)
Direct Plan Dividend Option 29.5500
Direct Plan Growth Option 39.5190
Regular Plan Dividend Option 28.1570
Regular Plan Growth Option 37.3520
Exit Load Nil
Total Expense Ratios~:
Regular Plan 2.68%
Direct Plan 1.43%
Portfolio Analysis: Sector-Wise
Name of Instrument Industry % to Net Assets
Top Holdings
Scheme - Regular PlanBenchmark
(S&P BSE 200 TR Index)Additional Benchmark
(Nifty 50 TR Index)Period
1 Year
3 Year
5 Year
Since Inception - Regular Plan
Returns* Returns*Value of Rs. 10000 Invested Returns*Value of Rs. 10000
InvestedValue of Rs. 10000
Invested
-8.37% 9,163 0.67% 10,067 4.32% 10,432
11.77% 13,963 17.23% 16,110 17.20% 16,099
12.83% 18,291 14.35% 19,556 12.86% 18,317
13.95% 37,352 17.16% 49,470 15.81% 43,989
**Risk free rate of return (FIMMDA Overnight MIBOR) 6.35%
HDFC Bank Ltd. Banks 9.61 Reliance Industries Ltd. Petroleum Products 7.86 Housing Development Finance Corp Ltd. Finance 7.11 ICICI Bank Ltd. Banks 6.41 Infosys Ltd. Software 5.76 ITC Ltd. Consumer Non Durables 4.17 Larsen & Toubro Ltd. Construction Project 4.07 State Bank of India Banks 3.91 Axis Bank Ltd. Banks 3.66 Hindustan Unilever Ltd. Consumer Non Durables 3.53 Tata Consultancy Services Ltd. Software 3.23 Kansai Nerolac Paints Ltd. Consumer Non Durables 2.44 Britannia Industries Ltd. Consumer Non Durables 2.36 RBL Bank Ltd. Banks 2.27 Whirlpool of India Ltd. Consumer Durables 1.89 Solar Industries India Ltd. Chemicals 1.83 Bajaj Finance Ltd. Finance 1.75 Maruti Suzuki India Ltd. Auto 1.72 City Union Bank Ltd. Banks 1.53 IndusInd Bank Ltd. Banks 1.44 Odisha Cement Ltd. Services 1.43 Mahindra & Mahindra Ltd. Auto 1.38 Bharat Forge Ltd. Industrial Products 1.32 Apollo Tyres Ltd. Auto Ancillaries 1.25 Power Grid Corporation of India Ltd. Power 1.24 Jubilant Foodworks Ltd. Consumer Non Durables 1.07 Apollo Hospitals Enterprise Ltd. Healthcare Services 1.04 Mahindra & Mahindra Financial Serv Ltd. Finance 1.03 The Indian Hotels Company Ltd. Hotels, Resorts and Other Recreational Activities 1.03 Havells India Ltd. Consumer Durables 0.93 Others 11.74
Fund Managers Details
Fund Managers Experience Managing Since
Mr. Harshad Patwardhan 25 years 27-Jan-09
Asset Allocation (% of total)
9
Investors understand
that their principal will be at
Moderately High Risk
Past performance may or may not be sustained in future and should not be used as a basis for comparison with other investments. * CAGR Return.
$Tax Advantage FundAn open ended equity linked saving scheme witha statutory lock in of 3 years and tax benefit
Quantitative indicators
Total Portfolio Turnover Ratio^Portfolio Turnover Ratio^
0.52
Std. deviation
13.99% Sharpe Ratio**
0.46
Beta
1.02 Total stocks in portfolio
44
Active bets
40.50%
Top 10 stocks
56.09%
Net Equity
95.91% Equity0.52
(As on 28th February, 2019)
Fund Size
Month End AUM
Rs. 9.23 Crore
Monthly Average AUM
Rs. 9.35 Crore
Equi�es Cash & Other receivables Debt
95.91%
4.08% 0.01%
1.83%
2.21%
2.82%
4.02%
4.80%
7.86%
8.99%
10.79%
13.78%
28.83%
Chemicals
Industrial Products
Consumer Durables
Auto
Construc�on Project
Petroleum Products
So�ware
Finance
Consumer Non Durables
Banks
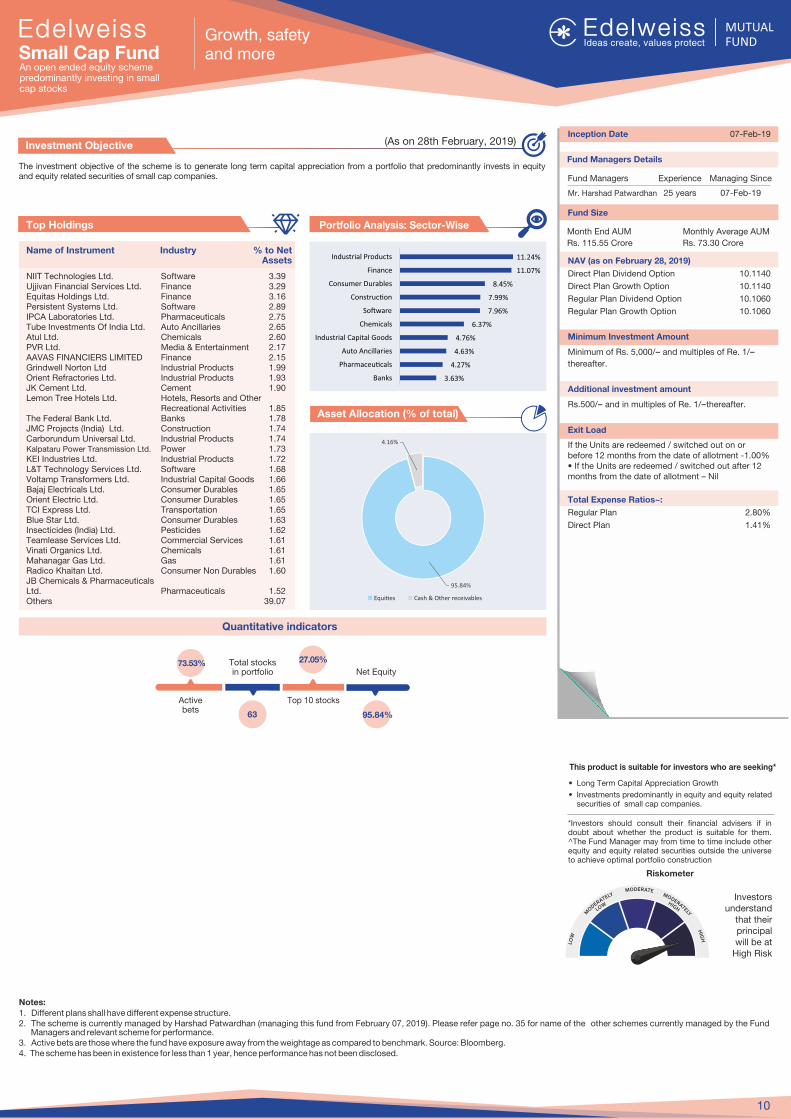
The investment objective of the scheme is to generate long term capital appreciation from a portfolio that predominantly invests in equity and equity related securities of small cap companies.
Investment Objective
Notes:1. Different plans shall have different expense structure. 2. The scheme is currently managed by (managing this fund from February 07, 2019). Please refer page no. 35 for name of the other schemes currently managed by the Fund Harshad Patwardhan
Managers and relevant scheme for performance.3. Active bets are those where the fund have exposure away from the weightage as compared to benchmark. Source: Bloomberg. 4. The scheme has been in existence for less than 1 year, hence performance has not been disclosed.
Inception Date 07-Feb-19
NAV (as on February 28, 2019)
Direct Plan Dividend Option 10.1140
Direct Plan Growth Option 10.1140
Regular Plan Dividend Option 10.1060
Regular Plan Growth Option 10.1060
Minimum Investment Amount
Minimum of Rs. 5,000/‐ and multiples of Re. 1/‐
thereafter.
Additional investment amount
Rs.500/‐ and in multiples of Re. 1/‐thereafter.
Exit Load
If the Units are redeemed / switched out on or before 12 months from the date of allotment -1.00%� If the Units are redeemed / switched out after 12months from the date of allotment � Nil
Total Expense Ratios~:
Regular Plan 2.80%
Direct Plan 1.41%
Portfolio Analysis: Sector-Wise
Name of Instrument Industry % to Net Assets
Top HoldingsFund Size
Month End AUM
Rs. 115.55 Crore
Monthly Average AUM
Rs. 73.30 Crore
NIIT Technologies Ltd. Software 3.39 Ujjivan Financial Services Ltd. Finance 3.29 Equitas Holdings Ltd. Finance 3.16 Persistent Systems Ltd. Software 2.89 IPCA Laboratories Ltd. Pharmaceuticals 2.75 Tube Investments Of India Ltd. Auto Ancillaries 2.65 Atul Ltd. Chemicals 2.60 PVR Ltd. Media & Entertainment 2.17 AAVAS FINANCIERS LIMITED Finance 2.15 Grindwell Norton Ltd Industrial Products 1.99 Orient Refractories Ltd. Industrial Products 1.93 JK Cement Ltd. Cement 1.90 Lemon Tree Hotels Ltd. Hotels, Resorts and Other Recreational Activities 1.85 The Federal Bank Ltd. Banks 1.78 JMC Projects (India) Ltd. Construction 1.74 Carborundum Universal Ltd. Industrial Products 1.74 Kalpataru Power Transmission Ltd. Power 1.73 KEI Industries Ltd. Industrial Products 1.72 L&T Technology Services Ltd. Software 1.68 Voltamp Transformers Ltd. Industrial Capital Goods 1.66 Bajaj Electricals Ltd. Consumer Durables 1.65 Orient Electric Ltd. Consumer Durables 1.65 TCI Express Ltd. Transportation 1.65 Blue Star Ltd. Consumer Durables 1.63 Insecticides (India) Ltd. Pesticides 1.62 Teamlease Services Ltd. Commercial Services 1.61 Vinati Organics Ltd. Chemicals 1.61 Mahanagar Gas Ltd. Gas 1.61 Radico Khaitan Ltd. Consumer Non Durables 1.60 JB Chemicals & Pharmaceuticals Ltd. Pharmaceuticals 1.52 Others 39.07
Fund Managers Details
Asset Allocation (% of total)
10
Small Cap FundAn open ended equity schemepredominantly investing in smallcap stocks
Quantitative indicators
(As on 28th February, 2019)
Growth, safetyand more
Equi�es Cash & Other receivables
95.84%
4.16%
3.63%
4.27%
4.63%
4.76%
6.37%
7.96%
7.99%
8.45%
11.07%
11.24%
Banks
Pharmaceu�cals
Auto Ancillaries
Industrial Capital Goods
Chemicals
So�ware
Construc�on
Consumer Durables
Finance
Industrial Products
Total stocks in portfolio
63
Active bets
73.53%
Top 10 stocks
27.05%
Net Equity
95.84%
Fund Managers Experience Managing Since
Mr. Harshad Patwardhan 25 years 07-Feb-19
This product is suitable for investors who are seeking*
� Long Term Capital Appreciation Growth
� Investments predominantly in equity and equity related securities of small cap companies.
*Investors should consult their financial advisers if in doubt about whether the product is suitable for them. ^The Fund Manager may from time to time include other equity and equity related securities outside the universe to achieve optimal portfolio construction
Riskometer
Investors understand
that their principal will be at
High Risk
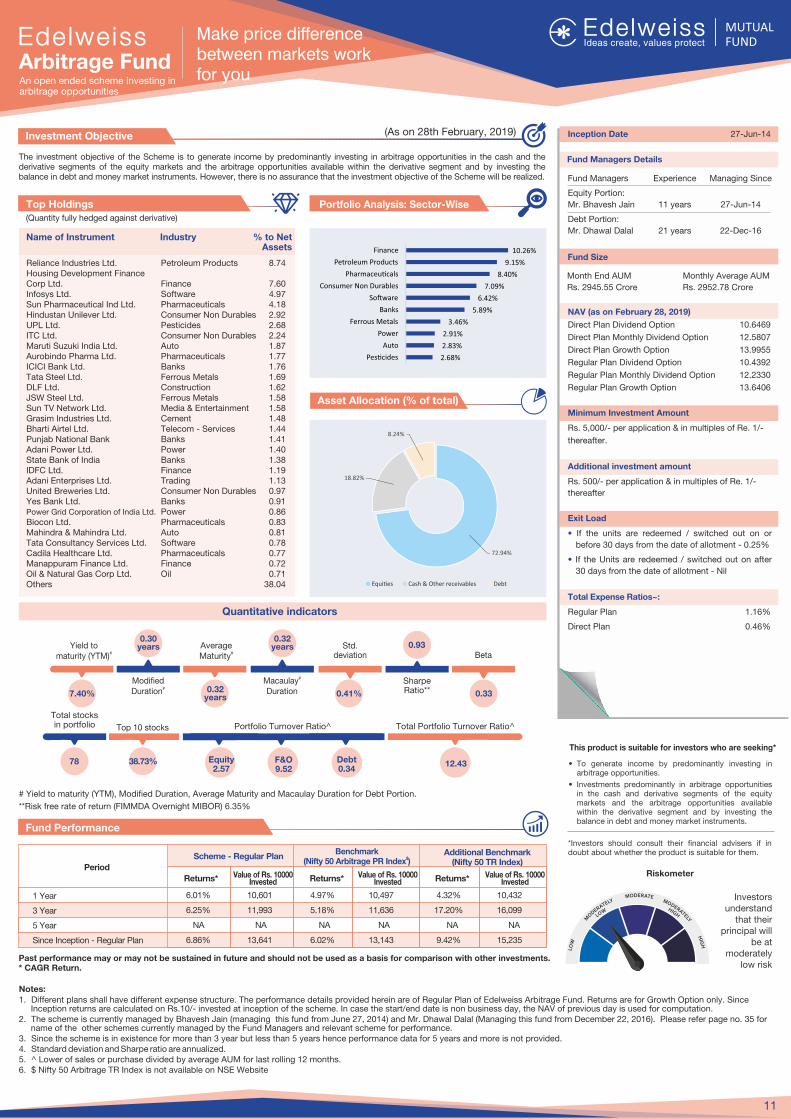
The investment objective of the Scheme is to generate income by predominantly investing in arbitrage opportunities in the cash and the derivative segments of the equity markets and the arbitrage opportunities available within the derivative segment and by investing the balance in debt and money market instruments. However, there is no assurance that the investment objective of the Scheme will be realized.
Investment Objective
Fund Performance
Riskometer
This product is suitable for investors who are seeking*
� To generate income by predominantly investing in arbitrage opportunities.
� Investments predominantly in arbitrage opportunities in the cash and derivative segments of the equity markets and the arbitrage opportunities available within the derivative segment and by investing the balance in debt and money market instruments.
*Investors should consult their financial advisers if in doubt about whether the product is suitable for them.
Notes:1. Different plans shall have different expense structure. The performance details provided herein are of of Returns are for Growth Option only. Since Regular Plan Edelweiss Arbitrage Fund.
Inception returns are calculated on Rs.10/- invested at inception of the scheme In case the start/end date is non business day, the NAV of previous day is used for computation.. 2. The scheme is currently managed by (managing this fund from June 27, 2014) and December 22 6 . Please refer page no. 35 for Bhavesh Jain Mr. Dhawal Dalal (Managing this fund from , 201 )
name of the other schemes currently managed by the Fund Managers and relevant scheme for performance.3. Since the scheme is in existence for more than 3 year but less than 5 years hence performance data for 5 years and more is not provided.4. Standard deviation and Sharpe ratio are annualized.5. ^ Lower of sales or purchase divided by average AUM for last rolling 12 months. 6. $ Nifty 50 Arbitrage TR Index is not available on NSE Website
Inception Date 27-Jun-14
NAV (as on February 28, 2019)
Direct Plan Dividend Option 10.6469
Direct Plan Monthly Dividend Option 12.5807
Direct Plan Growth Option 13.9955
Regular Plan Dividend Option 10.4392
Regular Plan Monthly Dividend Option 12.2330
Regular Plan Growth Option 13.6406
Minimum Investment Amount
Rs. 5,000/- per application & in multiples of Re. 1/-
thereafter.
Additional investment amount
Rs. 500/- per application & in multiples of Re. 1/-
thereafter
Exit Load
� If the units are redeemed / switched out on or
before 30 days from the date of allotment - 0.25%
� If the Units are redeemed / switched out on after
30 days from the date of allotment - Nil
Total Expense Ratios~:
Regular Plan 1.16%
Direct Plan 0.46%
Portfolio Analysis: Sector-Wise
Name of Instrument Industry % to Net Assets
Top Holdings
Scheme - Regular PlanBenchmark
$(Nifty 50 Arbitrage PR Index )Additional Benchmark
(Nifty 50 TR Index)Period
1 Year
3 Year
5 Year
Since Inception - Regular Plan
Returns* Returns*Value of Rs. 10000 Invested Returns*Value of Rs. 10000
InvestedValue of Rs. 10000
Invested
6.01% 10,601 4.97% 10,497 4.32% 10,432
6.25% 11,993 5.18% 11,636 17.20% 16,099
NA NA NA NA NA NA
6.86% 13,641 6.02% 13,143 9.42% 15,235
Fund Size
Month End AUM
Rs. 2945.55 Crore
Monthly Average AUM
Rs. 2952.78 Crore
# Yield to maturity (YTM), Modified Duration, Average Maturity and for Debt Portion.Macaulay Duration
**Risk free rate of return (FIMMDA Overnight MIBOR) 6.35%
Fund Managers Details
Fund Managers Experience Managing Since
Equity Portion:
Mr. Bhavesh Jain 11 years 27-Jun-14
Debt Portion:
Mr. Dhawal Dalal 21 years 22-Dec-16
Asset Allocation (% of total)
11
Investors understand
that their principal will
be at moderately
low riskPast performance may or may not be sustained in future and should not be used as a basis for comparison with other investments. * CAGR Return.
Make price difference between markets work for you
Arbitrage FundAn open ended scheme investing in arbitrage opportunities
Quantitative indicators
Total stocks in portfolio
78
Total Portfolio Turnover Ratio^Portfolio Turnover Ratio^
Equity2.57
F&O9.52
Debt0.34
12.43
Top 10 stocks
38.73%
(Quantity fully hedged against derivative)
(As on 28th February, 2019)
Yield to#maturity (YTM)
7.40%
Modified #Duration
0.30years Average
#Maturity
0.32years
Std. deviation
0.41%
Sharpe Ratio**
0.93Beta
0.33
#MacaulayDuration
0.32years
Reliance Industries Ltd. Petroleum Products 8.74 Housing Development Finance Corp Ltd. Finance 7.60 Infosys Ltd. Software 4.97 Sun Pharmaceutical Ind Ltd. Pharmaceuticals 4.18 Hindustan Unilever Ltd. Consumer Non Durables 2.92 UPL Ltd. Pesticides 2.68 ITC Ltd. Consumer Non Durables 2.24 Maruti Suzuki India Ltd. Auto 1.87 Aurobindo Pharma Ltd. Pharmaceuticals 1.77 ICICI Bank Ltd. Banks 1.76 Tata Steel Ltd. Ferrous Metals 1.69 DLF Ltd. Construction 1.62 JSW Steel Ltd. Ferrous Metals 1.58 Sun TV Network Ltd. Media & Entertainment 1.58 Grasim Industries Ltd. Cement 1.48 Bharti Airtel Ltd. Telecom - Services 1.44 Punjab National Bank Banks 1.41 Adani Power Ltd. Power 1.40 State Bank of India Banks 1.38 IDFC Ltd. Finance 1.19 Adani Enterprises Ltd. Trading 1.13 United Breweries Ltd. Consumer Non Durables 0.97 Yes Bank Ltd. Banks 0.91 Power Grid Corporation of India Ltd. Power 0.86 Biocon Ltd. Pharmaceuticals 0.83 Mahindra & Mahindra Ltd. Auto 0.81 Tata Consultancy Services Ltd. Software 0.78 Cadila Healthcare Ltd. Pharmaceuticals 0.77 Manappuram Finance Ltd. Finance 0.72 Oil & Natural Gas Corp Ltd. Oil 0.71 Others 38.04 Equi�es Cash & Other receivables Debt
72.94%
18.82%
8.24%
2.68%
2.83%
2.91%
3.46%
5.89%
6.42%
7.09%
8.40%
9.15%
10.26%
Pes�cides
Auto
Power
Ferrous Metals
Banks
So�ware
Consumer Non Durables
Pharmaceu�cals
Petroleum Products
Finance
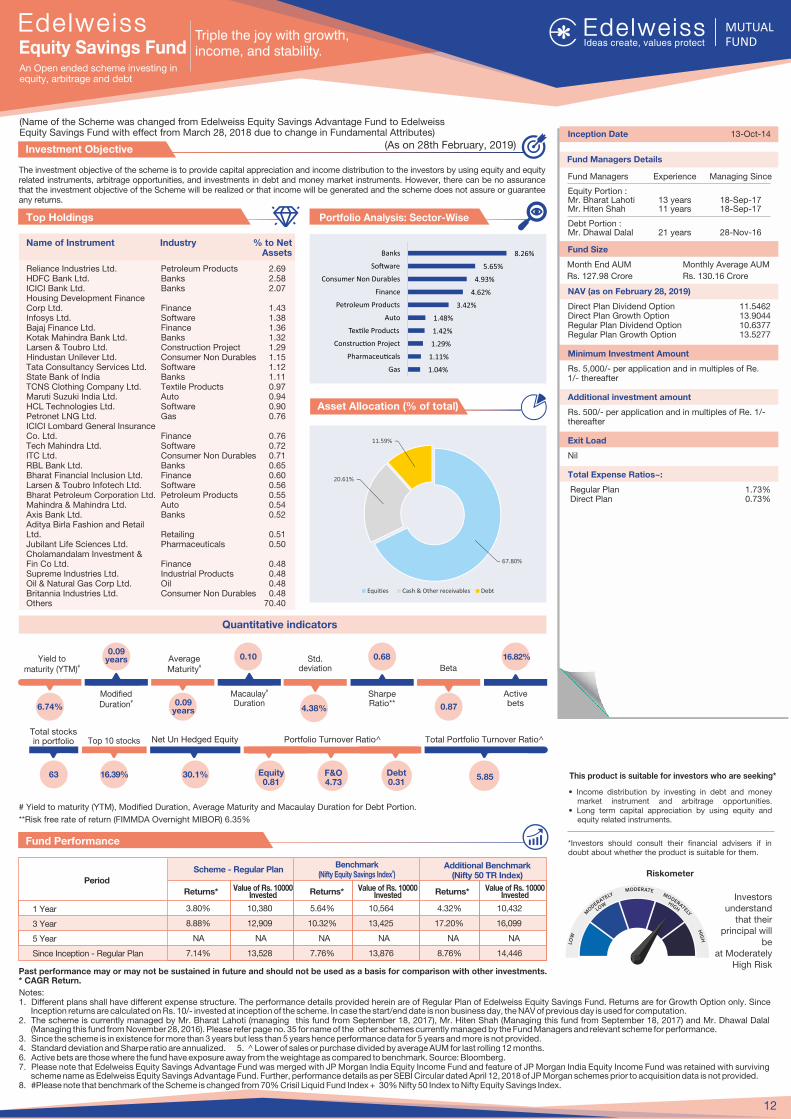
The investment objective of the scheme is to provide capital appreciation and income distribution to the investors by using equity and equity related instruments, arbitrage opportunities, and investments in debt and money market instruments. However, there can be no assurance that the investment objective of the Scheme will be realized or that income will be generated and the scheme does not assure or guarantee any returns.
Investment Objective
Fund Performance
Riskometer
This product is suitable for investors who are seeking*
� Income distribution by investing in debt and money market instrument and arbitrage opportunities.
� Long term capital appreciation by using equity and equity related instruments.
*Investors should consult their financial advisers if in doubt about whether the product is suitable for them.
Notes:1. Different plans shall have different expense structure. The performance details provided herein are of Regular Plan of Edelweiss Equity Savings Fund. Returns are for Growth Option only. Since
Inception returns are calculated on Rs. 10/- invested at inception of the scheme. In case the start/end date is non business day, the NAV of previous day is used for computation.2. The scheme is currently managed by Mr. Bharat Lahoti (managing this fund from September 18, 2017), Mr. Hiten Shah (Managing this fund from September 18, 2017) and Mr. Dhawal Dalal
(Managing this fund from November 28, 2016). Please refer page no. 35 for name of the other schemes currently managed by the Fund Managers and relevant scheme for performance.3. Since the scheme is in existence for more than 3 years but less than 5 years hence performance data for 5 years and more is not provided.4. Standard deviation and Sharpe ratio are annualized. 5. ̂ Lower of sales or purchase divided by average AUM for last rolling 12 months.6. Active bets are those where the fund have exposure away from the weightage as compared to benchmark. Source: Bloomberg. 7. Please note that Edelweiss Equity Savings Advantage Fund was merged with JP Morgan India Equity Income Fund and feature of JP Morgan India Equity Income Fund was retained with surviving
scheme name as Edelweiss Equity Savings Advantage Fund. Further, performance details as per SEBI Circular dated April 12, 2018 of JP Morgan schemes prior to acquisition data is not provided.8. #Please note that benchmark of the Scheme is changed from 70% Crisil Liquid Fund Index + 30% Nifty 50 Index to Nifty Equity Savings Index.
Inception Date 13-Oct-14
NAV (as on February 28, 2019)
Direct Plan Dividend Option 11.5462Direct Plan Growth Option 13.9044Regular Plan Dividend Option 10.6377Regular Plan Growth Option 13.5277
Minimum Investment Amount
Rs. 5,000/- per application and in multiples of Re. 1/- thereafter
Additional investment amount
Rs. 500/- per application and in multiples of Re. 1/- thereafter
Exit Load
Nil
Total Expense Ratios~:
Regular Plan 1.73% Direct Plan 0.73%
Portfolio Analysis: Sector-Wise
Name of Instrument Industry % to Net Assets
Top Holdings
Scheme - Regular PlanBenchmark
#(Nifty Equity Savings Index )
Additional Benchmark(Nifty 50 TR Index)
Period
1 Year
3 Year
5 Year
Since Inception - Regular Plan
Returns* Returns*Value of Rs. 10000 Invested Returns*Value of Rs. 10000
InvestedValue of Rs. 10000
Invested
3.80% 10,380 5.64% 10,564 4.32% 10,432
8.88% 12,909 10.32% 13,425 17.20% 16,099
NA NA NA NA NA NA
7.14% 13,528 7.76% 13,876 8.76% 14,446
Fund Size
Month End AUM
Rs. 127.98 Crore
Monthly Average AUM
Rs. 130.16 Crore
# Yield to maturity (YTM), Modified Duration, Average Maturity and for Debt Portion.Macaulay Duration
**Risk free rate of return (FIMMDA Overnight MIBOR) 6.35%
Reliance Industries Ltd. Petroleum Products 2.69 HDFC Bank Ltd. Banks 2.58 ICICI Bank Ltd. Banks 2.07 Housing Development Finance Corp Ltd. Finance 1.43 Infosys Ltd. Software 1.38 Bajaj Finance Ltd. Finance 1.36 Kotak Mahindra Bank Ltd. Banks 1.32 Larsen & Toubro Ltd. Construction Project 1.29 Hindustan Unilever Ltd. Consumer Non Durables 1.15 Tata Consultancy Services Ltd. Software 1.12 State Bank of India Banks 1.11 TCNS Clothing Company Ltd. Textile Products 0.97 Maruti Suzuki India Ltd. Auto 0.94 HCL Technologies Ltd. Software 0.90 Petronet LNG Ltd. Gas 0.76 ICICI Lombard General Insurance Co. Ltd. Finance 0.76 Tech Mahindra Ltd. Software 0.72 ITC Ltd. Consumer Non Durables 0.71 RBL Bank Ltd. Banks 0.65 Bharat Financial Inclusion Ltd. Finance 0.60 Larsen & Toubro Infotech Ltd. Software 0.56 Bharat Petroleum Corporation Ltd. Petroleum Products 0.55 Mahindra & Mahindra Ltd. Auto 0.54 Axis Bank Ltd. Banks 0.52 Aditya Birla Fashion and Retail Ltd. Retailing 0.51 Jubilant Life Sciences Ltd. Pharmaceuticals 0.50 Cholamandalam Investment & Fin Co Ltd. Finance 0.48 Supreme Industries Ltd. Industrial Products 0.48 Oil & Natural Gas Corp Ltd. Oil 0.48 Britannia Industries Ltd. Consumer Non Durables 0.48 Others 70.40
Fund Managers Details
Fund Managers Experience Managing Since
Equity Portion :Mr. Bharat Lahoti 13 years 18-Sep-17Mr. Hiten Shah 11 years 18-Sep-17
Debt Portion :Mr. Dhawal Dalal 21 years 28-Nov-16
Asset Allocation (% of total)
12
Investors understand
that their principal will
beat Moderately
High RiskPast performance may or may not be sustained in future and should not be used as a basis for comparison with other investments. * CAGR Return.
Triple the joy with growth, income, and stability.Equity Savings Fund
An Open ended scheme investing in equity, arbitrage and debt
Quantitative indicators
Total stocks in portfolio
63
Portfolio Turnover Ratio^
Equity0.81
F&O4.73
Debt0.31
Total Portfolio Turnover Ratio^
5.85
Top 10 stocks
16.39%
Net Un Hedged Equity
30.1%
(As on 28th February, 2019)
(Name of the Scheme was changed from Edelweiss Equity Savings Advantage Fund to Edelweiss Equity Savings Fund with effect from March 28, 2018 due to change in Fundamental Attributes)
Yield to#
maturity (YTM)
6.74%
Modified #
Duration
0.09years Average
#Maturity
0.09years
Std. deviation
4.38%
Sharpe Ratio**
0.68
Beta
0.87
Active bets
16.82%
#MacaulayDuration
0.10
Equi�es Cash & Other receivables Debt
67.80%
20.61%
11.59%
1.04%
1.11%
1.29%
1.42%
1.48%
3.42%
4.62%
4.93%
5.65%
8.26%
Gas
Pharmaceu�cals
Construc�on Project
Tex�le Products
Auto
Petroleum Products
Finance
Consumer Non Durables
So�ware
Banks
The primary objective of the Scheme will be to generate absolute returns with low volatility over a longer tenure of time. The Scheme will accordingly invest in arbitrage opportunities and debt and money market instruments on the one hand and in pure equity investments and equity derivative strategies on the other. However, there is no assurance that the investment objective of the Scheme will be realized.
Investment Objective
Fund Performance
This product is suitable for investors who are seeking*
� To create wealth over long term and prevent capital erosion in medium term
� Investment predominantly in equity and equity related securities including through arbitrage opportunities with balance exposure to debt and money market securities
*Investors should consult their financial advisers if in doubt about whether the product is suitable for them.
Notes:1. Different plans shall have different expense structure. The performance details provided herein are of Regular Plan of Edelweiss Balanced Advantage Fund. Returns are for Growth Option only. Since
Inception returns are calculated on Rs. 10/- invested at inception of the scheme. In case the start/end date is non business day, the NAV of previous day is used for computation.2. The scheme is currently managed by Mr. Bhavesh Jain (Managing this fund from August 7, 2013), Mr. Bharat Lahoti (Managing this fund from September 18, 2017) and Gautam Kaul (managing this
fund from December 11, 2017). Please refer page no. 35 for name of the other schemes currently managed by the Fund Managers and relevant scheme for performance.3. ^ Lower of sales or purchase divided by average AUM for last rolling 12 months. 4. Standard deviation and Sharpe ratio are annualized.5. Active bets are those where the fund have exposure away from the weightage as compared to benchmark. Source: NSE, Bloomberg. 7. Please note that Edelweiss Balanced Advantage Fund was merged with Edelweiss Dynamic Equity Advantage Fund and feature of Edelweiss Dynamic Equity Advantage Fund was retained with
surviving scheme name as Edelweiss Dynamic Equity Advantage Fund.8. #Please note that benchmark of the Scheme is changed from 60% Nifty 50 Index + 40% CRISIL Composite Bond Fund TR Index to CRISIL Hybrid 50+50 - Moderate Index.
Inception Date 20-Aug-09
NAV (as on February 28, 2019)
Direct Plan Monthly Dividend Option 19.4900Direct Plan Quarterly Dividend Option 14.7800Direct Plan Growth Option 23.5600Regular Plan Monthly Dividend Option 18.5300Regular Plan Quarterly Dividend Option 12.5600Regular Plan Growth Option 22.5500
Minimum Investment Amount :
Rs. 5,000/- per application & in multiples of Re. 1/-thereafter
Additional investment amount
Rs. 500/- per application & in multiples of Re.1/- thereafter
Exit Load
10% of the units allotted shall be redeemed without any Exit Load on or before completion of 365 days from the date of allotment of units. Any redemption in excess of such limit within 365 days from the date of allotment shall be subject to the following Exit Load: � If redeemed or switched out on or before completion of 365 days from the date of allotment of units � 1.00% � If redeemed or switched out after completion of 365 days from the date of allotment of units � NIL Redemption of units would be done on First in First out Basis (FIFO).
Total Expense Ratios~:
Regular Plan 2.27% Direct Plan 0.86%
Portfolio Analysis: Sector-Wise
Name of Instrument Industry % to Net Assets
Top Holdings
Scheme - Regular PlanBenchmark Additional Benchmark
(Nifty 50 TR Index)
Period
1 Year
3 Year
5 Year
Since Inception - Regular Plan
Returns* Returns*Value of Rs. 10000 Invested Returns*Value of Rs. 10000
InvestedValue of Rs. 10000
Invested
0.76% 10,076 4.11% 10,411 4.32% 10,432
9.41% 13,095 12.56% 14,260 17.20% 16,099
10.67% 16,605 11.92% 17,566 12.86% 18,317
8.91% 22,550 9.90% 24,600 11.05% 27,161
Fund Size
Month End AUM
Rs. 1298.20 Crore
Monthly Average AUM
Rs. 1296.24 Crore
# Yield to maturity (YTM), Modified Duration, Average Maturity and for Debt Portion.Macaulay Duration
**Risk free rate of return (FIMMDA Overnight MIBOR) 6.35% | @ Top 10 Stock also includes the Future and Options
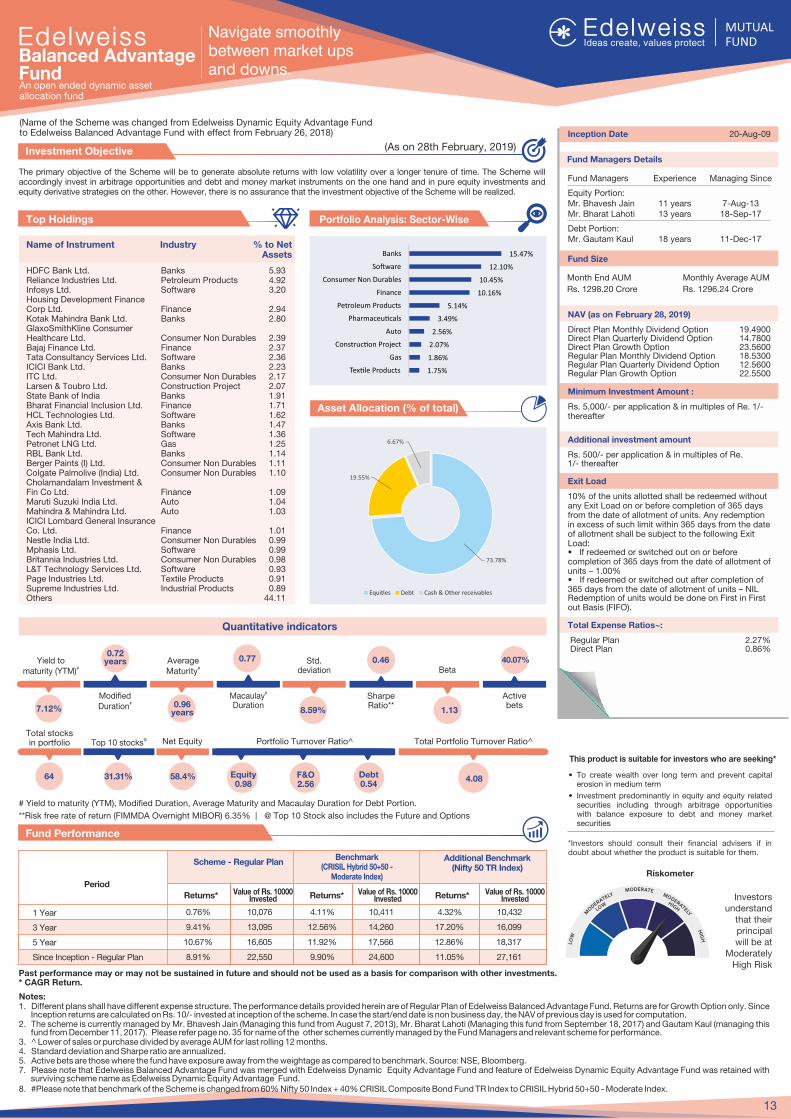
HDFC Bank Ltd. Banks 5.93 Reliance Industries Ltd. Petroleum Products 4.92 Infosys Ltd. Software 3.20 Housing Development FinanceCorp Ltd. Finance 2.94 Kotak Mahindra Bank Ltd. Banks 2.80 GlaxoSmithKline Consumer Healthcare Ltd. Consumer Non Durables 2.39 Bajaj Finance Ltd. Finance 2.37 Tata Consultancy Services Ltd. Software 2.36 ICICI Bank Ltd. Banks 2.23 ITC Ltd. Consumer Non Durables 2.17 Larsen & Toubro Ltd. Construction Project 2.07 State Bank of India Banks 1.91 Bharat Financial Inclusion Ltd. Finance 1.71 HCL Technologies Ltd. Software 1.62 Axis Bank Ltd. Banks 1.47 Tech Mahindra Ltd. Software 1.36 Petronet LNG Ltd. Gas 1.25 RBL Bank Ltd. Banks 1.14 Berger Paints (I) Ltd. Consumer Non Durables 1.11 Colgate Palmolive (India) Ltd. Consumer Non Durables 1.10 Cholamandalam Investment & Fin Co Ltd. Finance 1.09 Maruti Suzuki India Ltd. Auto 1.04 Mahindra & Mahindra Ltd. Auto 1.03 ICICI Lombard General Insurance Co. Ltd. Finance 1.01 Nestle India Ltd. Consumer Non Durables 0.99 Mphasis Ltd. Software 0.99 Britannia Industries Ltd. Consumer Non Durables 0.98 L&T Technology Services Ltd. Software 0.93 Page Industries Ltd. Textile Products 0.91 Supreme Industries Ltd. Industrial Products 0.89 Others 44.11
Fund Managers Details
Asset Allocation (% of total)
13
Past performance may or may not be sustained in future and should not be used as a basis for comparison with other investments. * CAGR Return.
(CRISIL Hybrid 50+50 - Moderate Index) Riskometer
Investors understand
that their principal will be at
Moderately High Risk
Fund Managers Experience Managing Since
Equity Portion:Mr. Bhavesh Jain 11 years 7-Aug-13 Mr. Bharat Lahoti 13 years 18-Sep-17
Debt Portion:Mr. Gautam Kaul 18 years 11-Dec-17
Quantitative indicators
Yield to#maturity (YTM)
Total Portfolio Turnover Ratio^
7.12%
Modified #Duration
0.72years Average
#Maturity
0.96years
Std. deviation
8.59%
Sharpe Ratio**
0.46Beta
1.13
Total stocks in portfolio
64
Portfolio Turnover Ratio^
Equity0.98
F&O2.56
Debt0.54
4.08
Active bets
40.07%
@Top 10 stocks
31.31%
Net Equity
58.4%
(As on 28th February, 2019)
Navigate smoothly between market ups and downs.
Balanced Advantage FundAn open ended dynamic assetallocation fund
(Name of the Scheme was changed from Edelweiss Dynamic Equity Advantage Fund to Edelweiss Balanced Advantage Fund with effect from February 26, 2018)
#Macaulay Duration
0.77
Equi�es Cash & Other receivablesDebt
73.78%
19.55%
6.67%
1.75%
1.86%
2.07%
2.56%
3.49%
5.14%
10.16%
10.45%
12.10%
15.47%
Tex�le Products
Gas
Construc�on Project
Auto
Pharmaceu�cals
Petroleum Products
Finance
Consumer Non Durables
So�ware
Banks
The objective of the Scheme is to generate returns through capital appreciation by investing in diversified portfolio of equity and equity-related securities, fixed income instruments and Gold Exchange Traded Funds. However, there is no assurance that the investment objective of the Scheme will be realized.
Investment Objective
Fund Performance
This product is suitable for investors who are seeking*
� To create wealth in the long term
� Investment in equity and equity-related securities, Debt and Gold
*Investors should consult their financial advisers if in doubt about whether the product is suitable for them.
Notes:1. Different plans shall have different expense structure. The performance details provided herein are of Regular Plan of Edelweiss Multi - Asset Allocation Fund. Returns are for Growth Option only. In
case the start/end date is non business day, the NAV of previous day is used for computation.2. The scheme is currently managed by Bharat Lahoti (managing this fund from October 14, 2015), Hardik Verma (managing this fund from August 1, 2018) and Gautam Kaul (managing this fund from
December 11, 2017). Please refer page no. 35 for name of the other schemes currently managed by the Fund Managers and relevant scheme for performance.3. Standard deviation and Sharpe ratio are annualized.4. ^ Lower of sales or purchase divided by average AUM for last rolling 12 months. 5. Active bets are those where the fund have exposure away from the weightage as compared to benchmark. Source: Bloomberg.
Inception Date 12-Aug-09
NAV (as on February 28, 2019)
Direct Plan Dividend Option 19.2700
Direct Plan Growth Option 25.0100
Regular Plan Dividend Option 18.6100
Regular Plan Growth Option 24.2600
Minimum Investment Amount
Rs. 5,000/- per application & in multiples of Re. 1/-
thereafter
Additional investment amount
Rs. 500/- per application & in multiples of Re. 1/-
thereafter
Exit Load Nil
Total Expense Ratios~:
Regular Plan 2.47%
Direct Plan 1.22%
Portfolio Analysis: Sector-Wise
Name of Instrument Industry % to Net Assets
Top Holdings
Scheme - Regular Plan Additional Benchmark(Nifty 50 TR Index)
Period
1 Year
3 Year
5 Year
Since Inception - Regular Plan
Returns* Returns*Value of Rs. 10000 Invested Returns*Value of Rs. 10000
InvestedValue of Rs. 10000
Invested
0.37% 10,037 6.20% 10,620 4.32% 10,432
11.38% 13,815 12.31% 14,168 17.20% 16,099
12.38% 17,931 10.54% 16,505 12.86% 18,317
9.74% 24,309 9.61% 24,020 11.02% 27,151
Fund Size
Month End AUM
Rs. 5.95 Crore
Monthly Average AUM
Rs. 5.96 Crore
# Yield to maturity (YTM), Modified Duration, Average Maturity and for Debt Portion.Macaulay Duration
**Risk free rate of return (FIMMDA Overnight MIBOR) 6.35% | @ Top 10 Stock also includes the Future and Options
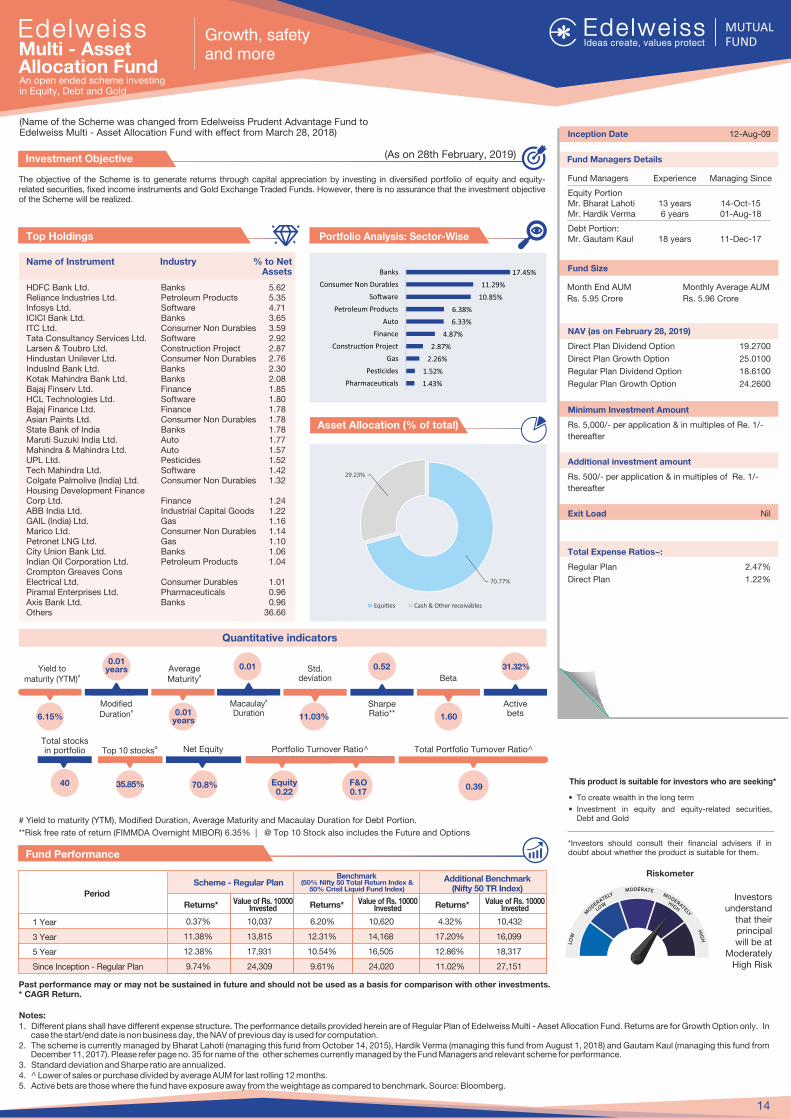
HDFC Bank Ltd. Banks 5.62 Reliance Industries Ltd. Petroleum Products 5.35 Infosys Ltd. Software 4.71 ICICI Bank Ltd. Banks 3.65 ITC Ltd. Consumer Non Durables 3.59 Tata Consultancy Services Ltd. Software 2.92 Larsen & Toubro Ltd. Construction Project 2.87 Hindustan Unilever Ltd. Consumer Non Durables 2.76 IndusInd Bank Ltd. Banks 2.30 Kotak Mahindra Bank Ltd. Banks 2.08 Bajaj Finserv Ltd. Finance 1.85 HCL Technologies Ltd. Software 1.80 Bajaj Finance Ltd. Finance 1.78 Asian Paints Ltd. Consumer Non Durables 1.78 State Bank of India Banks 1.78 Maruti Suzuki India Ltd. Auto 1.77 Mahindra & Mahindra Ltd. Auto 1.57 UPL Ltd. Pesticides 1.52 Tech Mahindra Ltd. Software 1.42 Colgate Palmolive (India) Ltd. Consumer Non Durables 1.32 Housing Development Finance Corp Ltd. Finance 1.24 ABB India Ltd. Industrial Capital Goods 1.22 GAIL (India) Ltd. Gas 1.16 Marico Ltd. Consumer Non Durables 1.14 Petronet LNG Ltd. Gas 1.10 City Union Bank Ltd. Banks 1.06 Indian Oil Corporation Ltd. Petroleum Products 1.04 Crompton Greaves Cons Electrical Ltd. Consumer Durables 1.01 Piramal Enterprises Ltd. Pharmaceuticals 0.96 Axis Bank Ltd. Banks 0.96 Others 36.66
Fund Managers Details
Fund Managers Experience Managing Since
Equity PortionMr. Bharat Lahoti 13 years 14-Oct-15Mr. Hardik Verma 6 years 01-Aug-18
Debt Portion:Mr. Gautam Kaul 18 years 11-Dec-17
Asset Allocation (% of total)
14
Past performance may or may not be sustained in future and should not be used as a basis for comparison with other investments. * CAGR Return.
Multi - Asset Allocation FundAn open ended scheme investing in Equity, Debt and Gold
Riskometer
Investors understand
that their principal will be at
Moderately High Risk
Quantitative indicators
Total Portfolio Turnover Ratio^Total stocks in portfolio
40 0.39
Portfolio Turnover Ratio^@Top 10 stocks
35.85%
Net Equity
70.8% Equity0.22
F&O0.17
(As on 28th February, 2019)
(Name of the Scheme was changed from Edelweiss Prudent Advantage Fund to Edelweiss Multi - Asset Allocation Fund with effect from March 28, 2018)
Benchmark(50% Nifty 50 Total Return Index &
50% Crisil Liquid Fund Index)
Yield to#
maturity (YTM)
6.15%
Modified #
Duration
0.01years Average
#Maturity
0.01years
Std. deviation
11.03%
Sharpe Ratio**
0.52
Beta
1.60
Active bets
31.32%
#Macaulay Duration
0.01
Growth, safetyand more
Equi�es Cash & Other receivables
70.77%
29.23%
1.43%
1.52%
2.26%
2.87%
4.87%
6.33%
6.38%
10.85%
11.29%
17.45%
Pharmaceu�cals
Pes�cides
Gas
Construc�on Project
Finance
Auto
Petroleum Products
So�ware
Consumer Non Durables
Banks
The investment objective of the Scheme is to provide reasonable returns, commensurate with low risk while providing a high level of liquidity, through a portfolio of money market and debt securities. However there can be no assurance that the investment objectives of the Scheme will be realized.
Investment Objective
Fund Performance
Riskometer
This product is suitable for investors who are seeking*
� Income Over Short Term
� Investments in money market and debt securities
*Investors should consult their financial advisers if in doubt about whether the product is suitable for them.
Notes:1. Different plans shall have different expense structure. The performance details provided herein are of Regular Plan of Liquid Fund. Edelweiss Returns are for Growth Option only. Since
Inception returns are calculated on Rs. 1000/- invested at inception of the scheme. In case the start/end date is non business day, the NAV of previous day is used for computation.2. The scheme is currently managed by Gautam Kaul (managing this fund from February 1, 2017) and Rahul Dedhia (managing this fund from December 11, 2017). 35Please refer page no. for
name of the other and relevant scheme for performance. schemes currently managed by the Fund Managers 3. @ Returns are annualized. 4. #Please note that benchmark of the Scheme is changed from Crisil Liquid Fund Index to Nifty Liquid Index5. Please note that Edelweiss Liquid Fund was merged with JP Morgan India Liquid Fund and feature of JP Morgan India Liquid Fund was retained with surviving scheme name as Edelweiss
Liquid Fund. Further, performance details as per SEBI Circular dated April 12, 2018 of JP Morgan schemes prior to acquisition data is not provided.
Inception Date 21-Sep-07
NAV (as on February 28, 2019)
Direct Plan Daily Dividend Option 1002.9603
Direct Plan Monthly Dividend Option 1022.1310
Direct Plan Growth Option 2387.7176
Regular Plan Annual Dividend Option 1641.2565
Regular Plan Monthly Dividend Option 1003.6266
Regular Plan Weekly Dividend Option 1018.1797
Regular Plan Daily Dividend Option 1002.7900
Regular Plan Growth Option 2372.0532
Minimum Investment Amount
Rs. 5,000/- per application & in multiples of Re. 1/-
thereafter.
Additional investment amount
Rs. 500/- per application & in multiples of Re. 1/-
thereafter
Exit Load Nil
Total Expense Ratios~:
Regular Plan 0.19%
Direct Plan 0.09%
Rating Profile
Name of Instrument Rating % to NAV
Top Holdings
Fund Size
Monthly Average AUM
Rs. 4024.41 Crore7.05% INDUSIND BANK FD RED 11-03-2019 FD 4.55
NABHA POWER CP RED 28-03-19 ICRA A1+ 3.28
HT MEDIA LTD CP RED 25-03-2019 CRISIL A1+ 2.95
RELIANCE RETAIL LTD CP RED 08-03-2019 CRISIL A1+ 2.84
NETWORK 18 MEDIA & INV CP RED 14-03-2019 ICRA A1+ 2.84
CENTURY TEXTILE & IND CP RED 19-03-2019 CRISIL A1+ 2.84
RBL BANK LTD CD RED 22-03-2019 ICRA A1+ 2.83
RELIANCE JIO INFO CP RED 04-03-2019 CRISIL A1+ 2.27
INDIAN BANK CD RED 05-03-2019 FITCH A1+ 2.27
ADITYA BIRLA FIN CP RED 08-03-19 ICRA A1+ 2.27
VIJAYA BANK CD RED 11-03-2019 CARE A1+ 2.27
ABU DHABI COMM CD RED 15-03-2019 CRISIL A1+ 2.27
JSW STEEL LTD. CP RED 22-03-2019 ICRA A1+ 2.27
ADITYA BIRLA HSG FIN CP RED 26-03-2019 ICRA A1+ 2.27
VEDANTA CP RED 25-04-2019 CRISIL A1+ 2.25
IDFC FIRST BK CD RED 29-04-2019 ICRA A1+ 2.25
AXIS BANK CD RED 30-04-2019 CRISIL A1+ 2.25
SOUTH INDIAN BK CD RED 03-05-2019 CARE A1+ 2.25
MUTHOOT FINANCE CP RED 02-05-2019 CRISIL A1+ 2.25
AXIS BANK LTD CD RED 10-05-2019 CRISIL A1+ 2.24
IDFC FIRST BK CD RED 14-05-2019 ICRA A1+ 2.24
NTPC LTD CP RED 27-05-2019 ICRA A1+ 2.24
SHRIRAM CITY UNION FIN CP RED 27-05-2019 ICRA A1+ 2.23
CESC LTD. CP RED 06-03-2019 CARE A1+ 2.16
RBL BANK LTD CD RED 11-03-2019 ICRA A1+ 2.16
ADANI PORTS & SEZ CP RED 15-03-2019 ICRA A1+ 2.16
NABARD CP RED 18-03-2019 CRISIL A1+ 2.16
VEDANTA LTD CP RED 07-03-2019 CRISIL A1+ 2.05
BERGER PAINTS CP RED 27-03-2019 CRISIL A1+ 2.04
RELIANCE JIO INFO LTD CP RED 08-03-2019 CRISIL A1+ 1.70
Others 27.36
Fund Managers Details
Fund Managers Experience Managing Since
Mr. Gautam Kaul 18 years 1-Feb-17
Mr. Rahul Dedhia 10 years 11-Dec-17
15
Investors understand
that their principal will
be at low risk
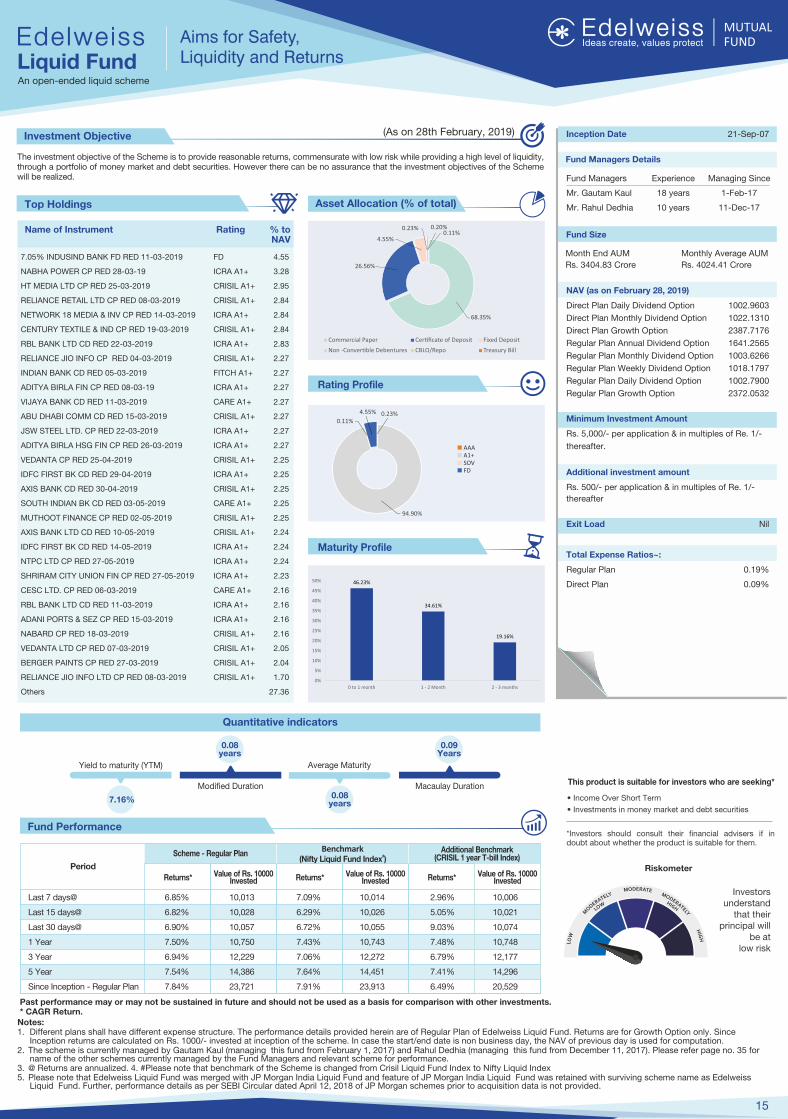
Asset Allocation (% of total)
Maturity Profile
Period
Scheme - Regular PlanBenchmark
#(Nifty Liquid Fund Index )
Returns* Returns*
Additional Benchmark(CRISIL 1 year T-bill Index)
Value of Rs. 10000 Invested
Value of Rs. 10000 InvestedReturns*Value of Rs. 10000
Invested
Last 7 days@
Last 15 days@
Last 30 days@
1 Year
3 Year
5 Year
Since Inception - Regular Plan
6.85% 10,013 7.09% 10,014 2.96% 10,006
6.82% 10,028 6.29% 10,026 5.05% 10,021
6.90% 10,057 6.72% 10,055 9.03% 10,074
7.50% 10,750 7.43% 10,743 7.48% 10,748
6.94% 12,229 7.06% 12,272 6.79% 12,177
7.54% 14,386 7.64% 14,451 7.41% 14,296
7.84% 23,721 7.91% 23,913 6.49% 20,529
Past performance may or may not be sustained in future and should not be used as a basis for comparison with other investments. * CAGR Return.
Aims for Safety, Liquidity and ReturnsLiquid Fund
An open-ended liquid scheme
Quantitative indicators
(As on 28th February, 2019)
Month End AUM
Rs. 3404.83 Crore
Average MaturityYield to maturity (YTM)
7.16%
Modified Duration
0.08years
0.08years
Macaulay Duration
0.09Years
A1+AAA
SOVFD
Commercial Paper Cer�ficate of Deposit Fixed Deposit
Non -Conver�ble Debentures CBLO/Repo Treasury Bill
68.35%
26.56%
4.55%
0.23% 0.20%0.11%
0.23%
94.90%
0.11%
4.55%
46.23%
34.61%
19.16%
0%
5%
10%
15%
20%
25%
30%
35%
40%
45%
50%
0 to 1 month 1 - 2 Month 2 - 3 months
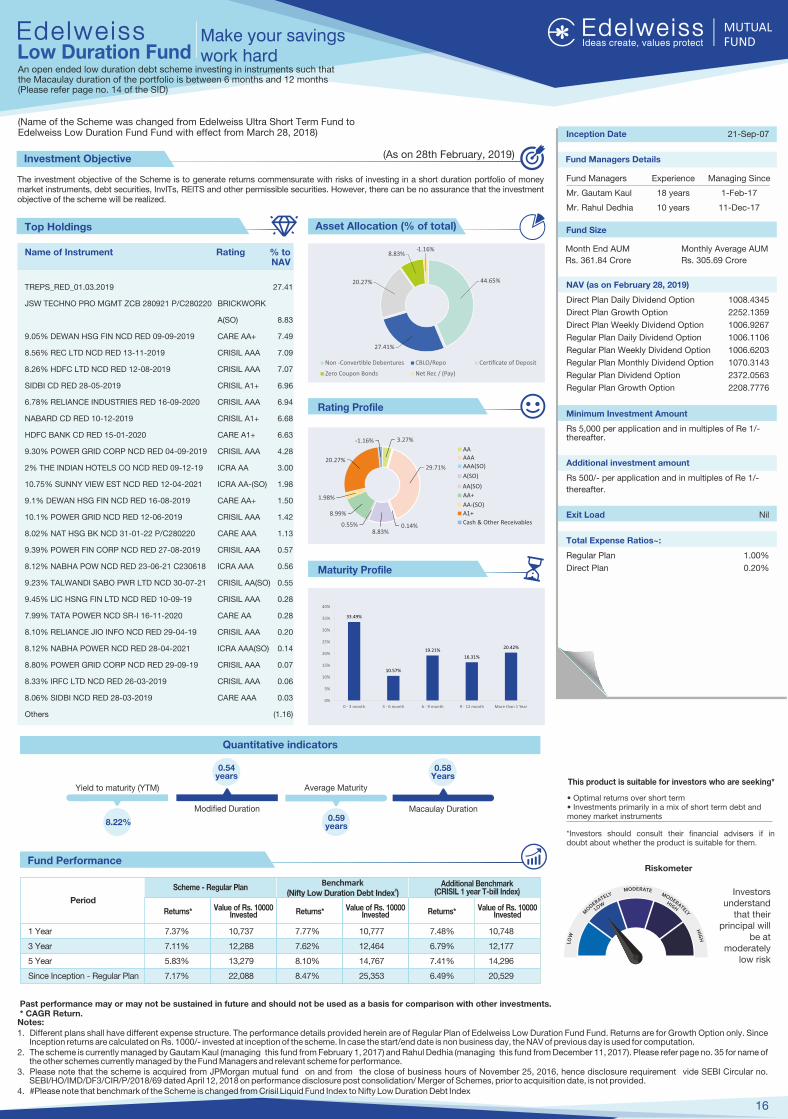
The investment objective of the Scheme is to generate returns commensurate with risks of investing in a short duration portfolio of money market instruments, debt securities, InvITs, REITS and other permissible securities. However, there can be no assurance that the investment objective of the scheme will be realized.
Investment Objective
Fund PerformanceRiskometer
This product is suitable for investors who are seeking*
� Optimal returns over short term� Investments primarily in a mix of short term debt and money market instruments
*Investors should consult their financial advisers if in doubt about whether the product is suitable for them.
Notes:1. Different plans shall have different expense structure. The performance details provided herein are of of Edelweiss Low Duration Fund Fund. Regular Plan Returns are for Growth Option only. Since
Inception returns are calculated on Rs. 1000/- invested at inception of the scheme. In case the start/end date is non business day, the NAV of previous day is used for computation.2. The scheme is currently managed by (managing this fund from 1, 201 ) .Gautam Kaul February 7 and Rahul Dedhia (managing this fund from December 11, 2017) Please refer page no. 35 for name of
the other and relevant scheme for performance. schemes currently managed by the Fund Managers3. Please note that the scheme is acquired from JPMorgan mutual fund on and from the close of business hours of November 25, 2016, hence disclosure requirement vide SEBI Circular no.
SEBI/HO/IMD/DF3/CIR/P/2018/69 dated April 12, 2018 on performance disclosure post consolidation/ Merger of Schemes, prior to acquisition date, is not provided.4. #Please note that benchmark of the Scheme is changed from Crisil Liquid Fund Index to Nifty Low Duration Debt Index
Inception Date 21-Sep-07
NAV (as on February 28, 2019)
Direct Plan Daily Dividend Option 1008.4345
Direct Plan Growth Option 2252.1359
Direct Plan Weekly Dividend Option 1006.9267
Regular Plan Daily Dividend Option 1006.1106
Regular Plan Weekly Dividend Option 1006.6203
Regular Plan Monthly Dividend Option 1070.3143
Regular Plan Dividend Option 2372.0563
Regular Plan Growth Option 2208.7776
Minimum Investment Amount
Rs 5,000 per application and in multiples of Re 1/-thereafter.
Additional investment amount
Rs 500/- per application and in multiples of Re 1/-
thereafter.
Exit Load Nil
Total Expense Ratios~:
Regular Plan 1.00%
Direct Plan 0.20%
Rating Profile
Name of Instrument Rating % to NAV
Top Holdings Fund Size
Monthly Average AUM
Rs. 305.69 Crore
Fund Managers Details
Fund Managers Experience Managing Since
Mr. Gautam Kaul 18 years 1-Feb-17
Mr. Rahul Dedhia 10 years 11-Dec-17
16
Investors understand
that their principal will
be at moderately
low risk
Asset Allocation (% of total)
Maturity Profile
Period
Scheme - Regular PlanBenchmark
#(Nifty Low Duration Debt Index )
Returns* Returns*
Additional Benchmark(CRISIL 1 year T-bill Index)
Value of Rs. 10000 Invested
Value of Rs. 10000 InvestedReturns*Value of Rs. 10000
Invested
1 Year
3 Year
5 Year
Since Inception - Regular Plan
7.37% 10,737 7.77% 10,777 7.48% 10,748
7.11% 12,288 7.62% 12,464 6.79% 12,177
5.83% 13,279 8.10% 14,767 7.41% 14,296
7.17% 22,088 8.47% 25,353 6.49% 20,529
Past performance may or may not be sustained in future and should not be used as a basis for comparison with other investments. * CAGR Return.
Make your savings work hardLow Duration Fund
An open ended low duration debt scheme investing in instruments such that the Macaulay duration of the portfolio is between 6 months and 12 months(Please refer page no. 14 of the SID)
Quantitative indicators
(As on 28th February, 2019)
Month End AUM
Rs. 361.84 Crore
(Name of the Scheme was changed from Edelweiss Ultra Short Term Fund to Edelweiss Low Duration Fund Fund with effect from March 28, 2018)
Average MaturityYield to maturity (YTM)
8.22%
Modified Duration
0.54years
0.59years
Macaulay Duration
0.58Years
TREPS_RED_01.03.2019 27.41
JSW TECHNO PRO MGMT ZCB 280921 P/C280220 BRICKWORK
A(SO) 8.83
9.05% DEWAN HSG FIN NCD RED 09-09-2019 CARE AA+ 7.49
8.56% REC LTD NCD RED 13-11-2019 CRISIL AAA 7.09
8.26% HDFC LTD NCD RED 12-08-2019 CRISIL AAA 7.07
SIDBI CD RED 28-05-2019 CRISIL A1+ 6.96
6.78% RELIANCE INDUSTRIES RED 16-09-2020 CRISIL AAA 6.94
NABARD CD RED 10-12-2019 CRISIL A1+ 6.68
HDFC BANK CD RED 15-01-2020 CARE A1+ 6.63
9.30% POWER GRID CORP NCD RED 04-09-2019 CRISIL AAA 4.28
2% THE INDIAN HOTELS CO NCD RED 09-12-19 ICRA AA 3.00
10.75% SUNNY VIEW EST NCD RED 12-04-2021 ICRA AA-(SO) 1.98
9.1% DEWAN HSG FIN NCD RED 16-08-2019 CARE AA+ 1.50
10.1% POWER GRID NCD RED 12-06-2019 CRISIL AAA 1.42
8.02% NAT HSG BK NCD 31-01-22 P/C280220 CARE AAA 1.13
9.39% POWER FIN CORP NCD RED 27-08-2019 CRISIL AAA 0.57
8.12% NABHA POW NCD RED 23-06-21 C230618 ICRA AAA 0.56
9.23% TALWANDI SABO PWR LTD NCD 30-07-21 CRISIL AA(SO) 0.55
9.45% LIC HSNG FIN LTD NCD RED 10-09-19 CRISIL AAA 0.28
7.99% TATA POWER NCD SR-I 16-11-2020 CARE AA 0.28
8.10% RELIANCE JIO INFO NCD RED 29-04-19 CRISIL AAA 0.20
8.12% NABHA POWER NCD RED 28-04-2021 ICRA AAA(SO) 0.14
8.80% POWER GRID CORP NCD RED 29-09-19 CRISIL AAA 0.07
8.33% IRFC LTD NCD RED 26-03-2019 CRISIL AAA 0.06
8.06% SIDBI NCD RED 28-03-2019 CARE AAA 0.03
Others (1.16)
Non -Conver�ble Debentures CBLO/Repo Cer�ficate of Deposit
Zero Coupon Bonds Net Rec / (Pay)
44.65%
27.41%
20.27%
8.83%-1.16%
3.27%
29.71%
0.14%8.83%
0.55%
8.99%
1.98%
20.27%
-1.16%
AA
AAA
A(SO)
AA(SO)
AA-(SO)
AA+
A1+
Cash & Other Receivables
AAA(SO)
33.49%
10.57%
19.21%
16.31%
20.42%
0%
5%
10%
15%
20%
25%
30%
35%
40%
0 - 3 month 3 - 6 month 6 - 9 month 9 - 12 month More than 1 Year
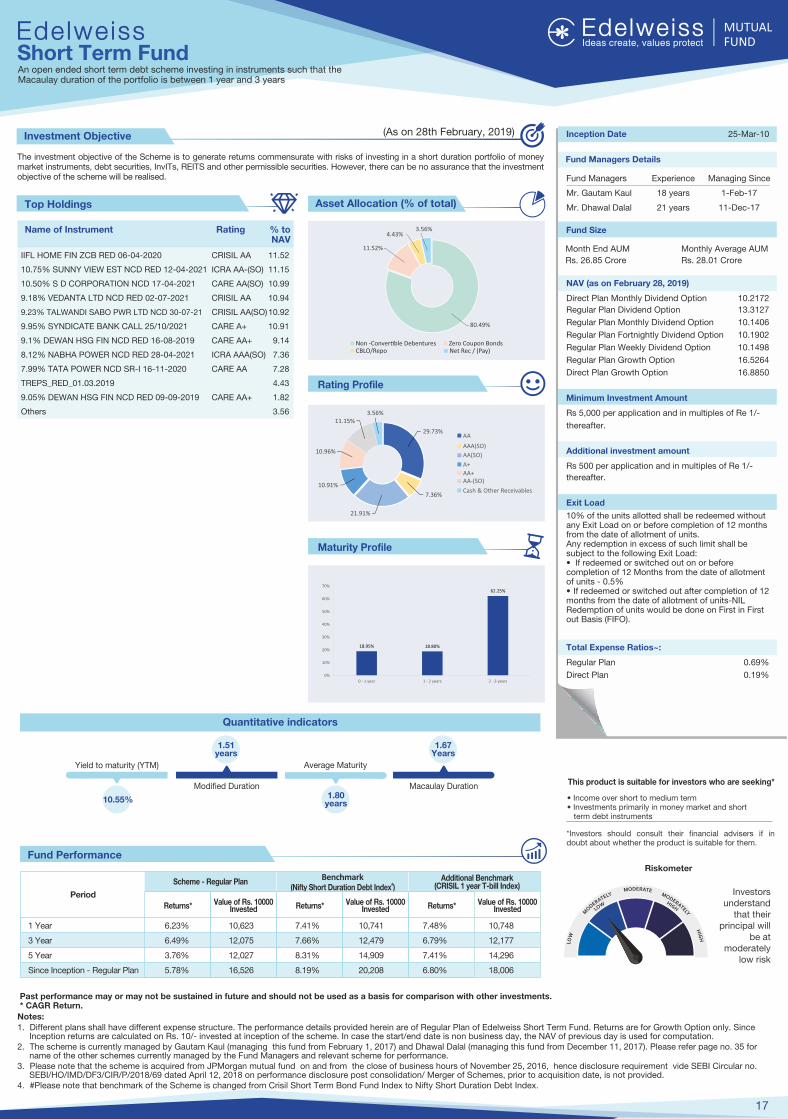
The investment objective of the Scheme is to generate returns commensurate with risks of investing in a short duration portfolio of money market instruments, debt securities, InvITs, REITS and other permissible securities. However, there can be no assurance that the investment objective of the scheme will be realised.
Investment Objective
This product is suitable for investors who are seeking*
� Income over short to medium term� Investments primarily in money market and short term debt instruments
*Investors should consult their financial advisers if in doubt about whether the product is suitable for them.
Notes:1. Different plans shall have different expense structure. The performance details provided herein are of Regular Plan of Edelweiss Short Term Fund. Returns are for Growth Option only. Since
Inception returns are calculated on Rs. 10/- invested at inception of the scheme. In case the start/end date is non business day, the NAV of previous day is used for computation.2. The scheme is currently managed by (managing this fund from 1, 201 ) and Dhawal Dalal (managing this fund from December 11, 2017). 35Gautam Kaul February 7 Please refer page no. for
name of the other and relevant scheme for performance. schemes currently managed by the Fund Managers 3. Please note that the scheme is acquired from JPMorgan mutual fund on and from the close of business hours of November 25, 2016, hence disclosure requirement vide SEBI Circular no.
SEBI/HO/IMD/DF3/CIR/P/2018/69 dated April 12, 2018 on performance disclosure post consolidation/ Merger of Schemes, prior to acquisition date, is not provided.4. #Please note that benchmark of the Scheme is changed from Crisil Short Term Bond Fund Index to Nifty Short Duration Debt Index.
Inception Date 25-Mar-10
NAV (as on February 28, 2019)
Direct Plan Monthly Dividend Option 10.2172
Regular Plan Dividend Option 13.3127
Regular Plan Monthly Dividend Option 10.1406
Regular Plan Fortnightly Dividend Option 10.1902
Regular Plan Weekly Dividend Option 10.1498
Regular Plan Growth Option 16.5264
Direct Plan Growth Option 16.8850
Minimum Investment Amount
Rs 5,000 per application and in multiples of Re 1/-
thereafter.
Additional investment amount
Rs 500 per application and in multiples of Re 1/-
thereafter.
Exit Load
10% of the units allotted shall be redeemed without any Exit Load on or before completion of 12 months from the date of allotment of units. Any redemption in excess of such limit shall be subject to the following Exit Load: � If redeemed or switched out on or before completion of 12 Months from the date of allotment of units - 0.5% � If redeemed or switched out after completion of 12 months from the date of allotment of units-NIL Redemption of units would be done on First in First out Basis (FIFO).
Total Expense Ratios~:
Regular Plan 0.69%
Direct Plan 0.19%
Rating Profile
Name of Instrument Rating % to NAV
Top Holdings
Fund Size
Month End AUM
Rs. 26.85 Crore
Monthly Average AUM
Rs. 28.01 CroreIIFL HOME FIN ZCB RED 06-04-2020 CRISIL AA 11.52
10.75% SUNNY VIEW EST NCD RED 12-04-2021 ICRA AA-(SO) 11.15
10.50% S D CORPORATION NCD 17-04-2021 CARE AA(SO) 10.99
9.18% VEDANTA LTD NCD RED 02-07-2021 CRISIL AA 10.94
9.23% TALWANDI SABO PWR LTD NCD 30-07-21 CRISIL AA(SO) 10.92
9.95% SYNDICATE BANK CALL 25/10/2021 CARE A+ 10.91
9.1% DEWAN HSG FIN NCD RED 16-08-2019 CARE AA+ 9.14
8.12% NABHA POWER NCD RED 28-04-2021 ICRA AAA(SO) 7.36
7.99% TATA POWER NCD SR-I 16-11-2020 CARE AA 7.28
TREPS_RED_01.03.2019 4.43
9.05% DEWAN HSG FIN NCD RED 09-09-2019 CARE AA+ 1.82
Others 3.56
Fund Managers Details
Fund Managers Experience Managing Since
Mr. Gautam Kaul 18 years 1-Feb-17
Mr. Dhawal Dalal 21 years 11-Dec-17
17
Asset Allocation (% of total)
Maturity Profile
Past performance may or may not be sustained in future and should not be used as a basis for comparison with other investments. * CAGR Return.
Short Term FundAn open ended short term debt scheme investing in instruments such that theMacaulay duration of the portfolio is between 1 year and 3 years
Fund Performance
Period
Scheme - Regular PlanBenchmark
#(Nifty Short Duration Debt Index )
Returns* Returns*
Additional Benchmark(CRISIL 1 year T-bill Index)
Value of Rs. 10000 Invested
Value of Rs. 10000 InvestedReturns*Value of Rs. 10000
Invested
1 Year
3 Year
5 Year
Since Inception - Regular Plan
6.23% 10,623 7.41% 10,741 7.48% 10,748
6.49% 12,075 7.66% 12,479 6.79% 12,177
3.76% 12,027 8.31% 14,909 7.41% 14,296
5.78% 16,526 8.19% 20,208 6.80% 18,006
Riskometer
Investors understand
that their principal will
be at moderately
low risk
Quantitative indicators
(As on 28th February, 2019)
Average MaturityYield to maturity (YTM)
10.55%
Modified Duration
1.51years
1.80years
Macaulay Duration
1.67Years
Non -Conver�ble Debentures Zero Coupon BondsCBLO/Repo Net Rec / (Pay)
AA
AA+
AAA(SO)
AA(SO)
A+
AA-(SO)
Cash & Other Receivables
80.49%
11.52%
4.43%3.56%
29.73%
7.36%
21.91%
10.91%
10.96%
11.15%3.56%
18.95% 18.80%
62.25%
0%
10%
20%
30%
40%
50%
60%
70%
0 - 1 year 1 - 2 years 2 -3 years
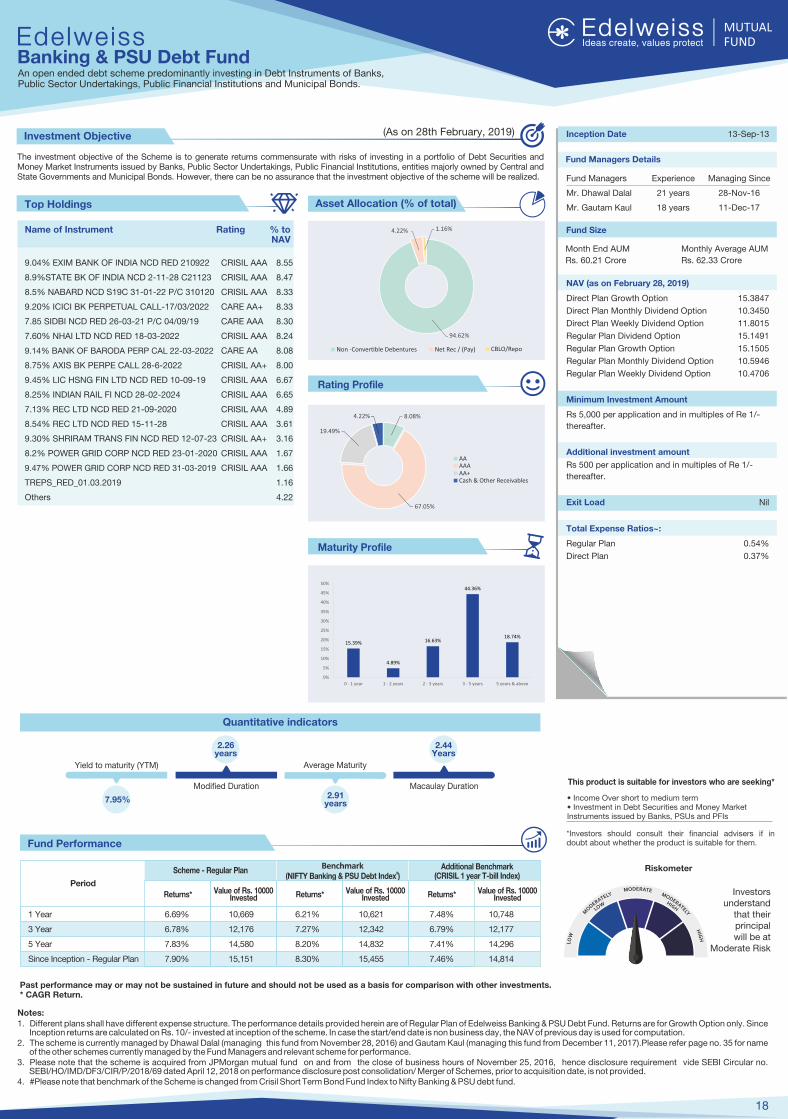
The investment objective of the Scheme is to generate returns commensurate with risks of investing in a portfolio of Debt Securities and Money Market Instruments issued by Banks, Public Sector Undertakings, Public Financial Institutions, entities majorly owned by Central and State Governments and Municipal Bonds. However, there can be no assurance that the investment objective of the scheme will be realized.
Investment Objective
Riskometer
This product is suitable for investors who are seeking*
� Income Over short to medium term� Investment in Debt Securities and Money Market Instruments issued by Banks, PSUs and PFIs
*Investors should consult their financial advisers if in doubt about whether the product is suitable for them.
Notes:1. Different plans shall have different expense structure. The performance details provided herein are of Regular Plan of Edelweiss Banking & PSU Debt Fund. Returns are for Growth Option only. Since
Inception returns are calculated on Rs. 10/- invested at inception of the scheme. In case the start/end date is non business day, the NAV of previous day is used for computation.2. The scheme is currently managed by Dhawal Dalal (managing this fund from November 28, 2016) and Gautam Kaul (managing this fund from December 11, 2017).Please refer page no. 35 for name
of the other schemes currently managed by the Fund Managers and relevant scheme for performance.3. Please note that the scheme is acquired from JPMorgan mutual fund on and from the close of business hours of November 25, 2016, hence disclosure requirement vide SEBI Circular no.
SEBI/HO/IMD/DF3/CIR/P/2018/69 dated April 12, 2018 on performance disclosure post consolidation/ Merger of Schemes, prior to acquisition date, is not provided.4. #Please note that benchmark of the Scheme is changed from Crisil Short Term Bond Fund Index to Nifty Banking & PSU debt fund.
Rating Profile
Name of Instrument Rating % to NAV
Top Holdings
9.04% EXIM BANK OF INDIA NCD RED 210922 CRISIL AAA 8.55
8.9%STATE BK OF INDIA NCD 2-11-28 C21123 CRISIL AAA 8.47
8.5% NABARD NCD S19C 31-01-22 P/C 310120 CRISIL AAA 8.33
9.20% ICICI BK PERPETUAL CALL-17/03/2022 CARE AA+ 8.33
7.85 SIDBI NCD RED 26-03-21 P/C 04/09/19 CARE AAA 8.30
7.60% NHAI LTD NCD RED 18-03-2022 CRISIL AAA 8.24
9.14% BANK OF BARODA PERP CAL 22-03-2022 CARE AA 8.08
8.75% AXIS BK PERPE CALL 28-6-2022 CRISIL AA+ 8.00
9.45% LIC HSNG FIN LTD NCD RED 10-09-19 CRISIL AAA 6.67
8.25% INDIAN RAIL FI NCD 28-02-2024 CRISIL AAA 6.65
7.13% REC LTD NCD RED 21-09-2020 CRISIL AAA 4.89
8.54% REC LTD NCD RED 15-11-28 CRISIL AAA 3.61
9.30% SHRIRAM TRANS FIN NCD RED 12-07-23 CRISIL AA+ 3.16
8.2% POWER GRID CORP NCD RED 23-01-2020 CRISIL AAA 1.67
9.47% POWER GRID CORP NCD RED 31-03-2019 CRISIL AAA 1.66
TREPS_RED_01.03.2019 1.16
Others 4.22
18
Investors understand
that their principal will be at
Moderate Risk
Asset Allocation (% of total)
Maturity Profile
Past performance may or may not be sustained in future and should not be used as a basis for comparison with other investments. * CAGR Return.
Banking & PSU Debt FundAn open ended debt scheme predominantly investing in Debt Instruments of Banks,Public Sector Undertakings, Public Financial Institutions and Municipal Bonds.
Fund Performance
Period
Scheme - Regular PlanBenchmark
#(NIFTY Banking & PSU Debt Index )
Returns* Returns*
Additional Benchmark(CRISIL 1 year T-bill Index)
Value of Rs. 10000 Invested
Value of Rs. 10000 InvestedReturns*Value of Rs. 10000
Invested
1 Year
3 Year
5 Year
Since Inception - Regular Plan
6.69% 10,669 6.21% 10,621 7.48% 10,748
6.78% 12,176 7.27% 12,342 6.79% 12,177
7.83% 14,580 8.20% 14,832 7.41% 14,296
7.90% 15,151 8.30% 15,455 7.46% 14,814
Inception Date 13-Sep-13
NAV (as on February 28, 2019)
Direct Plan Growth Option 15.3847
Direct Plan Monthly Dividend Option 10.3450
Direct Plan Weekly Dividend Option 11.8015
Regular Plan Dividend Option 15.1491
Regular Plan Growth Option 15.1505
Regular Plan Monthly Dividend Option 10.5946
Regular Plan Weekly Dividend Option 10.4706
Minimum Investment Amount
Rs 5,000 per application and in multiples of Re 1/-
thereafter.
Additional investment amount
Rs 500 per application and in multiples of Re 1/-
thereafter.
Exit Load Nil
Total Expense Ratios~:
Regular Plan 0.54%
Direct Plan 0.37%
Fund Size
Month End AUM
Rs. 60.21 Crore
Monthly Average AUM
Rs. 62.33 Crore
Fund Managers Details
Fund Managers Experience Managing Since
Mr. Dhawal Dalal 21 years 28-Nov-16
Mr. Gautam Kaul 18 years 11-Dec-17
AAAAAAA+Cash & Other Receivables
Quantitative indicators
(As on 28th February, 2019)
Average MaturityYield to maturity (YTM)
7.95%
Modified Duration
2.26years
2.91years
Macaulay Duration
2.44Years
Non -Conver�ble Debentures Net Rec / (Pay) CBLO/Repo
94.62%
4.22% 1.16%
8.08%
67.05%
19.49%
4.22%
15.39%
4.89%
16.63%
44.36%
18.74%
0%
5%
10%
15%
20%
25%
30%
35%
40%
45%
50%
0 - 1 year 1 - 2 years 2 - 3 years 3 - 5 years 5 years & above
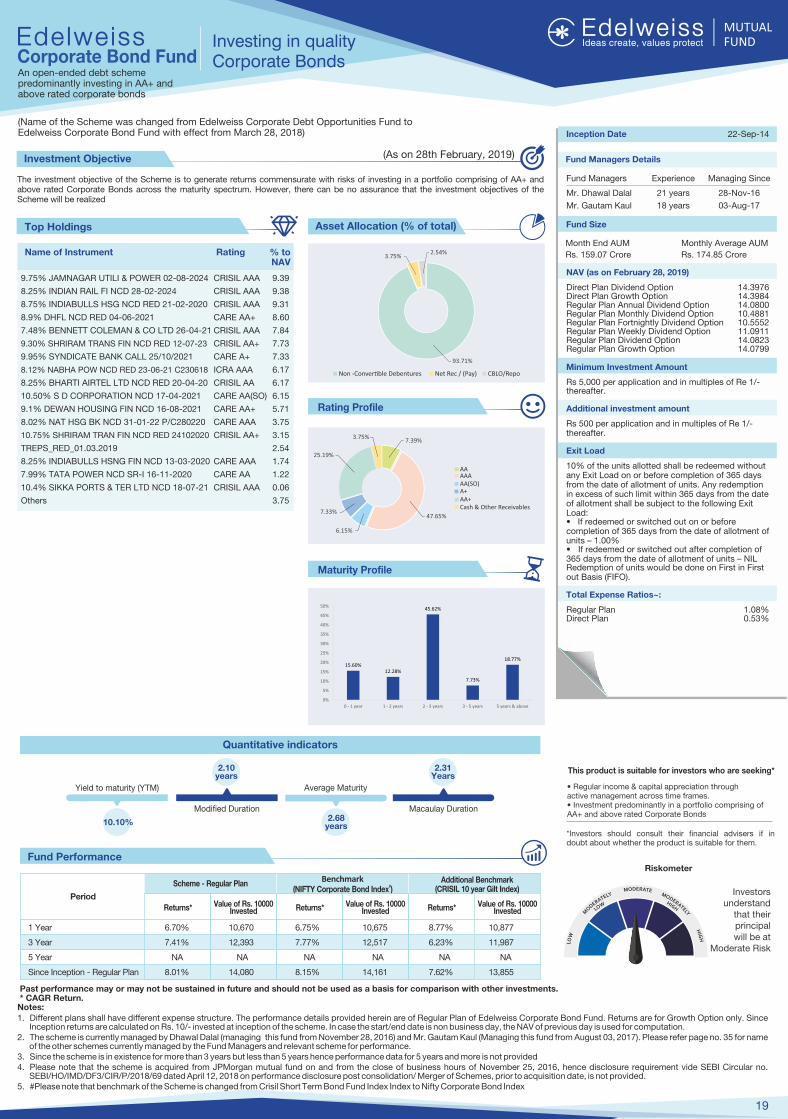
The investment objective of the Scheme is to generate returns commensurate with risks of investing in a portfolio comprising of AA+ and above rated Corporate Bonds across the maturity spectrum. However, there can be no assurance that the investment objectives of the Scheme will be realized
Investment Objective
This product is suitable for investors who are seeking*
� Regular income & capital appreciation through active management across time frames.� Investment predominantly in a portfolio comprising of AA+ and above rated Corporate Bonds
*Investors should consult their financial advisers if in doubt about whether the product is suitable for them.
Notes:1. Different plans shall have different expense structure. The performance details provided herein are of of Regular Plan Edelweiss Corporate Bond Fund. Returns are for Growth Option only. Since
Inception returns are calculated on Rs. 10/- invested at inception of the scheme. In case the start/end date is non business day, the NAV of previous day is used for computation.2. The scheme is currently managed by Dhawal Dalal November 28 6 Mr. Gautam Kaul August 03, 7 Please refer page no. 35 for name (managing this fund from , 201 ) and (Managing this fund from 201 ).
of the other schemes currently managed by the Fund Managers and relevant scheme for performance.3. Since the scheme is in existence for more than 3 years but less than 5 years hence performance data for 5 years and more is not provided4. Please note that the scheme is acquired from JPMorgan mutual fund on and from the close of business hours of November 25, 2016, hence disclosure requirement vide SEBI Circular no.
SEBI/HO/IMD/DF3/CIR/P/2018/69 dated April 12, 2018 on performance disclosure post consolidation/ Merger of Schemes, prior to acquisition date, is not provided.5. #Please note that benchmark of the Scheme is changed from Crisil Short Term Bond Fund Index Index to Nifty Corporate Bond Index
Inception Date 22-Sep-14
NAV (as on February 28, 2019)
Direct Plan Dividend Option 14.3976Direct Plan Growth Option 14.3984Regular Plan Annual Dividend Option 14.0800Regular Plan Monthly Dividend Option 10.4881Regular Plan Fortnightly Dividend Option 10.5552Regular Plan Weekly Dividend Option 11.0911Regular Plan Dividend Option 14.0823Regular Plan Growth Option 14.0799
Minimum Investment Amount
Rs 5,000 per application and in multiples of Re 1/-thereafter.
Additional investment amount
Rs 500 per application and in multiples of Re 1/- thereafter.
Exit Load
10% of the units allotted shall be redeemed without any Exit Load on or before completion of 365 days from the date of allotment of units. Any redemption in excess of such limit within 365 days from the date of allotment shall be subject to the following Exit Load: � If redeemed or switched out on or before completion of 365 days from the date of allotment of units � 1.00% � If redeemed or switched out after completion of 365 days from the date of allotment of units � NIL Redemption of units would be done on First in First out Basis (FIFO).
Total Expense Ratios~:
Regular Plan 1.08%Direct Plan 0.53%
Rating Profile
Name of Instrument Rating % to NAV
Top Holdings Fund Size
Month End AUM
Rs. 159.07 Crore
Monthly Average AUM
Rs. 174.85 Crore
9.75% JAMNAGAR UTILI & POWER 02-08-2024 CRISIL AAA 9.39
8.25% INDIAN RAIL FI NCD 28-02-2024 CRISIL AAA 9.38
8.75% INDIABULLS HSG NCD RED 21-02-2020 CRISIL AAA 9.31
8.9% DHFL NCD RED 04-06-2021 CARE AA+ 8.60
7.48% BENNETT COLEMAN & CO LTD 26-04-21 CRISIL AAA 7.84
9.30% SHRIRAM TRANS FIN NCD RED 12-07-23 CRISIL AA+ 7.73
9.95% SYNDICATE BANK CALL 25/10/2021 CARE A+ 7.33
8.12% NABHA POW NCD RED 23-06-21 C230618 ICRA AAA 6.17
8.25% BHARTI AIRTEL LTD NCD RED 20-04-20 CRISIL AA 6.17
10.50% S D CORPORATION NCD 17-04-2021 CARE AA(SO) 6.15
9.1% DEWAN HOUSING FIN NCD 16-08-2021 CARE AA+ 5.71
8.02% NAT HSG BK NCD 31-01-22 P/C280220 CARE AAA 3.75
10.75% SHRIRAM TRAN FIN NCD RED 24102020 CRISIL AA+ 3.15
TREPS_RED_01.03.2019 2.54
8.25% INDIABULLS HSNG FIN NCD 13-03-2020 CARE AAA 1.74
7.99% TATA POWER NCD SR-I 16-11-2020 CARE AA 1.22
10.4% SIKKA PORTS & TER LTD NCD 18-07-21 CRISIL AAA 0.06
Others 3.75
Fund Managers Details
Fund Managers Experience Managing Since
Mr. Dhawal Dalal 21 years 28-Nov-16
Mr. Gautam Kaul 18 years 03-Aug-17
19
Asset Allocation (% of total)
Maturity Profile
Past performance may or may not be sustained in future and should not be used as a basis for comparison with other investments. * CAGR Return.
Investing in quality Corporate BondsCorporate Bond Fund
An open-ended debt scheme predominantly investing in AA+ and above rated corporate bonds
Fund Performance
Period
Scheme - Regular PlanBenchmark
#(NIFTY Corporate Bond Index )
Returns* Returns*
Additional Benchmark(CRISIL 10 year Gilt Index)
Value of Rs. 10000 Invested
Value of Rs. 10000 InvestedReturns*Value of Rs. 10000
Invested
1 Year
3 Year
5 Year
Since Inception - Regular Plan
6.70% 10,670 6.75% 10,675 8.77% 10,877
7.41% 12,393 7.77% 12,517 6.23% 11,987
NA NA NA NA NA NA
8.01% 14,080 8.15% 14,161 7.62% 13,855
Riskometer
Investors understand
that their principal will be at
Moderate Risk
AAAAAAA(SO)
Cash & Other ReceivablesAA+
Quantitative indicators
(As on 28th February, 2019)
(Name of the Scheme was changed from Edelweiss Corporate Debt Opportunities Fund to Edelweiss Corporate Bond Fund with effect from March 28, 2018)
Average MaturityYield to maturity (YTM)
10.10%
Modified Duration
2.10years
2.68years
Macaulay Duration
2.31Years
A+
Non -Conver�ble Debentures Net Rec / (Pay) CBLO/Repo
93.71%
3.75%2.54%
7.39%
47.65%
6.15%
7.33%
25.19%
3.75%
15.60%12.28%
45.62%
7.73%
18.77%
0%
5%
10%
15%
20%
25%
30%
35%
40%
45%
50%
0 - 1 year 1 - 2 years 2 - 3 years 3 - 5 years 5 years & above
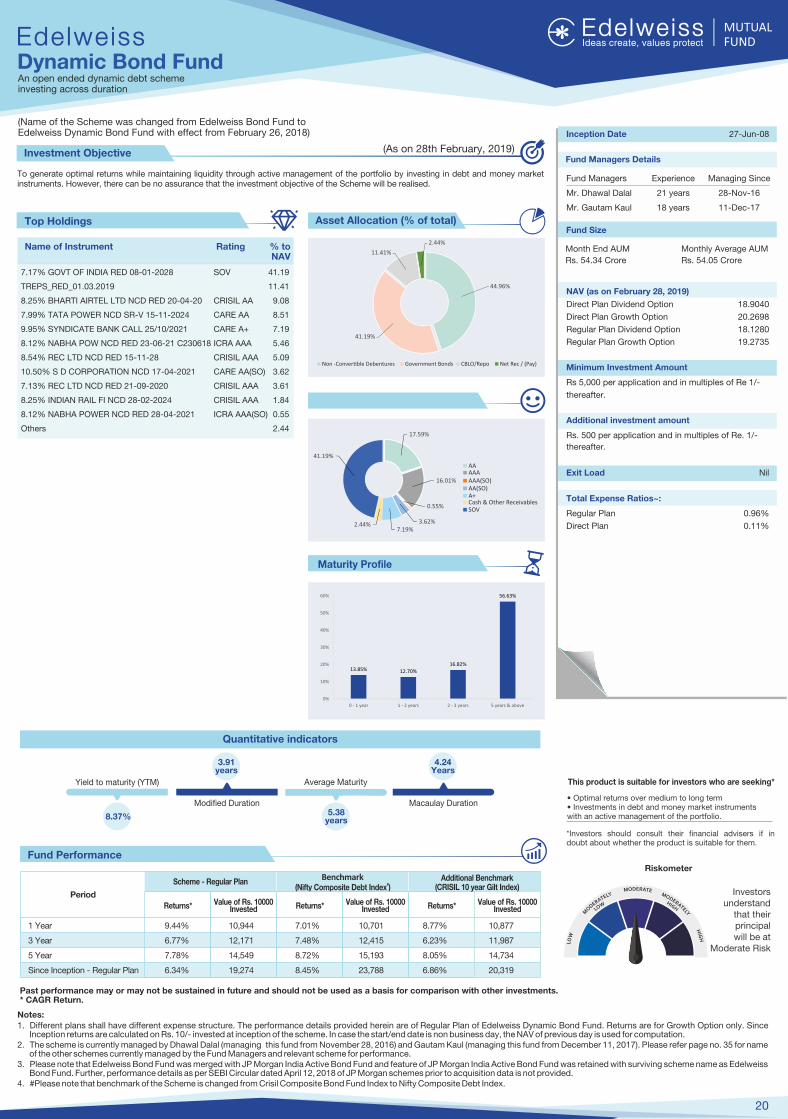
To generate optimal returns while maintaining liquidity through active management of the portfolio by investing in debt and money market instruments. However, there can be no assurance that the investment objective of the Scheme will be realised.
Investment Objective
This product is suitable for investors who are seeking*
� Optimal returns over medium to long term� Investments in debt and money market instruments with an active management of the portfolio.
*Investors should consult their financial advisers if in doubt about whether the product is suitable for them.
Notes:1. Different plans shall have different expense structure. The performance details provided herein are of of Regular Plan Edelweiss Dynamic Bond Fund. Returns are for Growth Option only. Since
Inception returns are calculated on Rs. 10/- invested at inception of the scheme. In case the start/end date is non business day, the NAV of previous day is used for computation.2. The scheme is currently managed by (managing this fund from , 201 ) and Gautam Kaul (managing this fund from December 11, 2017). 35Dhawal Dalal November 28 6 Please refer page no. for name
of the other and relevant scheme for performance. schemes currently managed by the Fund Managers 3. Please note that Edelweiss Bond Fund was merged with JP Morgan India Active Bond Fund and feature of JP Morgan India Active Bond Fund was retained with surviving scheme name as Edelweiss
Bond Fund. Further, performance details as per SEBI Circular dated April 12, 2018 of JP Morgan schemes prior to acquisition data is not provided.4. #Please note that benchmark of the Scheme is changed from Crisil Composite Bond Fund Index to Nifty Composite Debt Index.
Inception Date 27-Jun-08
NAV (as on February 28, 2019)
Direct Plan Dividend Option 18.9040
Direct Plan Growth Option 20.2698
Regular Plan Dividend Option 18.1280
Regular Plan Growth Option 19.2735
Minimum Investment Amount
Rs 5,000 per application and in multiples of Re 1/-
thereafter.
Additional investment amount
Rs. 500 per application and in multiples of Re. 1/-
thereafter.
Exit Load Nil
Total Expense Ratios~:
Regular Plan 0.96%
Direct Plan 0.11%
Name of Instrument Rating % to NAV
Top HoldingsFund Size
Month End AUM
Rs. 54.34 Crore
Monthly Average AUM
Rs. 54.05 Crore
7.17% GOVT OF INDIA RED 08-01-2028 SOV 41.19
TREPS_RED_01.03.2019 11.41
8.25% BHARTI AIRTEL LTD NCD RED 20-04-20 CRISIL AA 9.08
7.99% TATA POWER NCD SR-V 15-11-2024 CARE AA 8.51
9.95% SYNDICATE BANK CALL 25/10/2021 CARE A+ 7.19
8.12% NABHA POW NCD RED 23-06-21 C230618 ICRA AAA 5.46
8.54% REC LTD NCD RED 15-11-28 CRISIL AAA 5.09
10.50% S D CORPORATION NCD 17-04-2021 CARE AA(SO) 3.62
7.13% REC LTD NCD RED 21-09-2020 CRISIL AAA 3.61
8.25% INDIAN RAIL FI NCD 28-02-2024 CRISIL AAA 1.84
8.12% NABHA POWER NCD RED 28-04-2021 ICRA AAA(SO) 0.55
Others 2.44
Fund Managers Details
Fund Managers Experience Managing Since
Mr. Dhawal Dalal 21 years 28-Nov-16
Mr. Gautam Kaul 18 years 11-Dec-17
20
Asset Allocation (% of total)
Maturity Profile
Past performance may or may not be sustained in future and should not be used as a basis for comparison with other investments. * CAGR Return.
Dynamic Bond FundAn open ended dynamic debt scheme investing across duration
Fund Performance
Period
Scheme - Regular PlanBenchmark
#(Nifty Composite Debt Index )
Returns* Returns*
Additional Benchmark(CRISIL 10 year Gilt Index)
Value of Rs. 10000 Invested
Value of Rs. 10000 InvestedReturns*Value of Rs. 10000
Invested
1 Year
3 Year
5 Year
Since Inception - Regular Plan
9.44% 10,944 7.01% 10,701 8.77% 10,877
6.77% 12,171 7.48% 12,415 6.23% 11,987
7.78% 14,549 8.72% 15,193 8.05% 14,734
6.34% 19,274 8.45% 23,788 6.86% 20,319
Riskometer
Investors understand
that their principal will be at
Moderate Risk
Quantitative indicators
(As on 28th February, 2019)
(Name of the Scheme was changed from Edelweiss Bond Fund to Edelweiss Dynamic Bond Fund with effect from February 26, 2018)
AA
Cash & Other ReceivablesSOV
Average MaturityYield to maturity (YTM)
8.37%
Modified Duration
3.91years
5.38years
Macaulay Duration
4.24Years
AAA
Non -Conver�ble Debentures Government Bonds CBLO/Repo Net Rec / (Pay)
AAA(SO)
A+
44.96%
41.19%
11.41%
2.44%
17.59%
16.01%
0.55%
3.62%7.19%
2.44%
41.19%
AA(SO)
13.85% 12.70%
16.82%
56.63%
0%
10%
20%
30%
40%
50%
60%
0 - 1 year 1 - 2 years 2 - 3 years 5 years & above
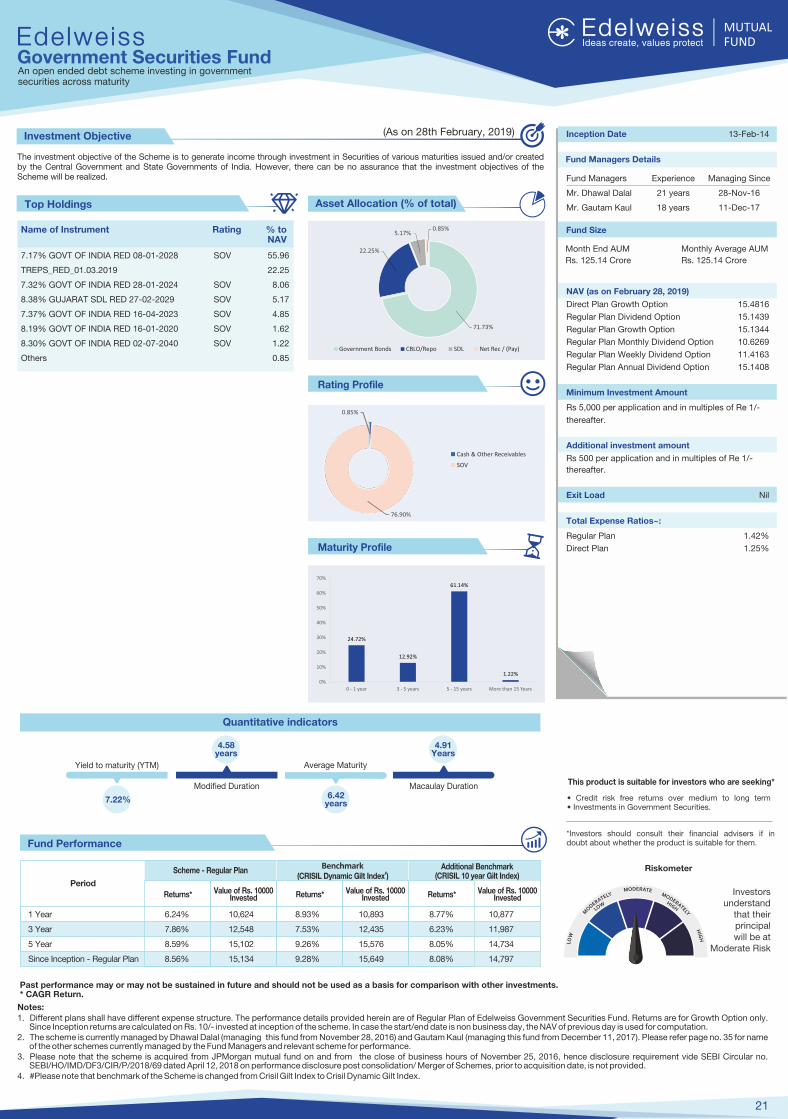
The investment objective of the Scheme is to generate income through investment in Securities of various maturities issued and/or created by the Central Government and State Governments of India. However, there can be no assurance that the investment objectives of the Scheme will be realized.
Investment Objective
This product is suitable for investors who are seeking*
� Credit risk free returns over medium to long term� Investments in Government Securities.
*Investors should consult their financial advisers if in doubt about whether the product is suitable for them.
Notes:1. Different plans shall have different expense structure. The performance details provided herein are of of Regular Plan Edelweiss Government Securities Fund. Returns are for Growth Option only.
Since Inception returns are calculated on Rs. 10/- invested at inception of the scheme. In case the start/end date is non business day, the NAV of previous day is used for computation.2. The scheme is currently managed by (managing this fund from , 201 )Dhawal Dalal November 28 6 and Gautam Kaul (managing this fund from December 11, 2017). Please refer page no. 35 for name
of the other schemes currently managed by the Fund Managers and relevant scheme for performance.3. Please note that the scheme is acquired from JPMorgan mutual fund on and from the close of business hours of November 25, 2016, hence disclosure requirement vide SEBI Circular no.
SEBI/HO/IMD/DF3/CIR/P/2018/69 dated April 12, 2018 on performance disclosure post consolidation/ Merger of Schemes, prior to acquisition date, is not provided.4. #Please note that benchmark of the Scheme is changed from Crisil Gilt Index to Crisil Dynamic Gilt Index.
Inception Date 13-Feb-14
NAV (as on February 28, 2019)
Direct Plan Growth Option 15.4816
Regular Plan Dividend Option 15.1439
Regular Plan Growth Option 15.1344
Regular Plan Monthly Dividend Option 10.6269
Regular Plan Weekly Dividend Option 11.4163
Regular Plan Annual Dividend Option 15.1408
Minimum Investment Amount
Rs 5,000 per application and in multiples of Re 1/-
thereafter.
Additional investment amount
Rs 500 per application and in multiples of Re 1/-
thereafter.
Exit Load Nil
Total Expense Ratios~:
Regular Plan 1.42%
Direct Plan 1.25%
Rating Profile
Name of Instrument Rating % to NAV
Top Holdings
Fund Size
Month End AUM
Rs. 125.14 Crore
Monthly Average AUM
Rs. 125.14 Crore7.17% GOVT OF INDIA RED 08-01-2028 SOV 55.96
TREPS_RED_01.03.2019 22.25
7.32% GOVT OF INDIA RED 28-01-2024 SOV 8.06
8.38% GUJARAT SDL RED 27-02-2029 SOV 5.17
7.37% GOVT OF INDIA RED 16-04-2023 SOV 4.85
8.19% GOVT OF INDIA RED 16-01-2020 SOV 1.62
8.30% GOVT OF INDIA RED 02-07-2040 SOV 1.22
Others 0.85
Fund Managers Details
Fund Managers Experience Managing Since
Mr. Dhawal Dalal 21 years 28-Nov-16
Mr. Gautam Kaul 18 years 11-Dec-17
21
Asset Allocation (% of total)
Maturity Profile
Past performance may or may not be sustained in future and should not be used as a basis for comparison with other investments. * CAGR Return.
Government Securities FundAn open ended debt scheme investing in government securities across maturity
Fund Performance
Period
Scheme - Regular PlanBenchmark
#(CRISIL Dynamic Gilt Index )
Returns* Returns*
Additional Benchmark(CRISIL 10 year Gilt Index)
Value of Rs. 10000 Invested
Value of Rs. 10000 InvestedReturns*Value of Rs. 10000
Invested
1 Year
3 Year
5 Year
Since Inception - Regular Plan
6.24% 10,624 8.93% 10,893 8.77% 10,877
7.86% 12,548 7.53% 12,435 6.23% 11,987
8.59% 15,102 9.26% 15,576 8.05% 14,734
8.56% 15,134 9.28% 15,649 8.08% 14,797
Riskometer
Investors understand
that their principal will be at
Moderate Risk
Cash & Other Receivables
SOV
Quantitative indicators
(As on 28th February, 2019)
Average MaturityYield to maturity (YTM)
7.22%
Modified Duration
4.58years
6.42years
Macaulay Duration
4.91Years
71.73%
22.25%
5.17%0.85%
Government Bonds CBLO/Repo Net Rec / (Pay)SDL
0.85%
76.90%
24.72%
12.92%
61.14%
1.22%
0%
10%
20%
30%
40%
50%
60%
70%
0 - 1 year 3 - 5 years 5 - 15 years More than 15 Years
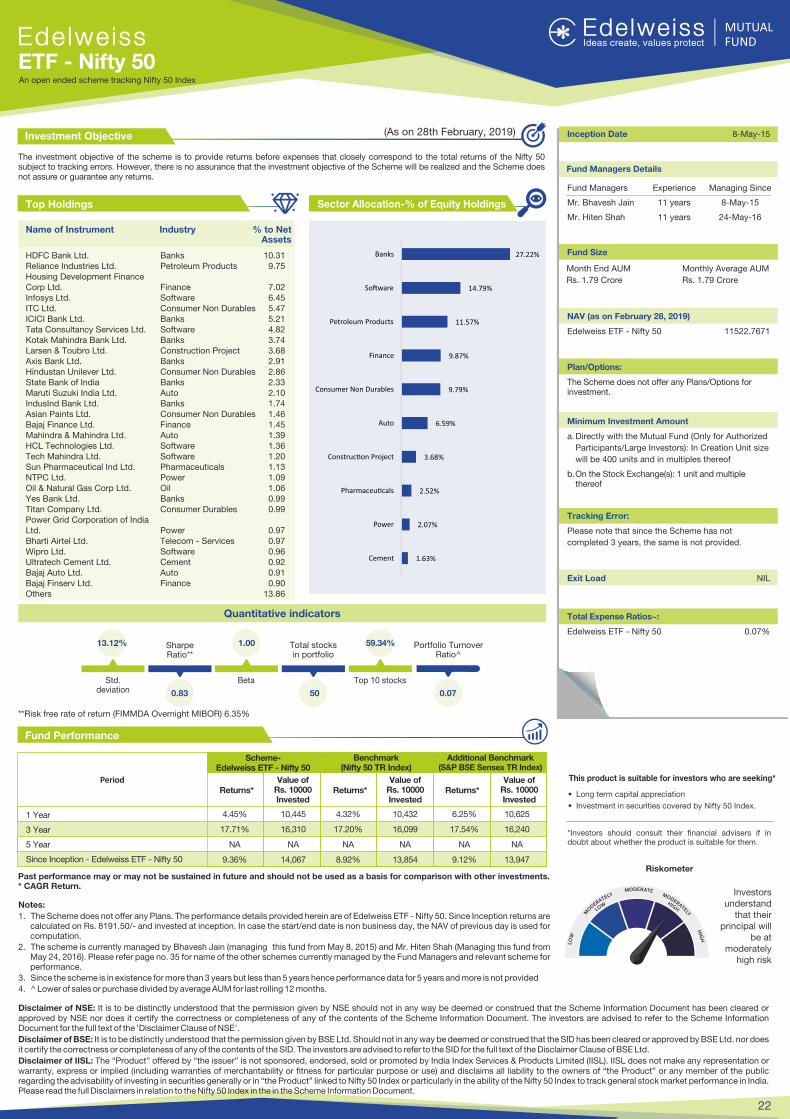
The investment objective of the scheme is to provide returns before expenses that closely correspond to the total returns of the Nifty 50 subject to tracking errors. However, there is no assurance that the investment objective of the Scheme will be realized and the Scheme does not assure or guarantee any returns.
Investment Objective
Riskometer
This product is suitable for investors who are seeking*
� Long term capital appreciation
� Investment in securities covered by Nifty 50 Index.
*Investors should consult their financial advisers if in doubt about whether the product is suitable for them.
Disclaimer of NSE: It is to be distinctly understood that the permission given by NSE should not in any way be deemed or construed that the Scheme Information Document has been cleared or approved by NSE nor does it certify the correctness or completeness of any of the contents of the Scheme Information Document. The investors are advised to refer to the Scheme Information Document for the full text of the 'Disclaimer Clause of NSE'.
Disclaimer of BSE: It is to be distinctly understood that the permission given by BSE Ltd. Should not in any way be deemed or construed that the SID has been cleared or approved by BSE Ltd. nor does it certify the correctness or completeness of any of the contents of the SID. The investors are advised to refer to the SID for the full text of the Disclaimer Clause of BSE Ltd.
Disclaimer of IISL: The �Product� offered by �the issuer� is not sponsored, endorsed, sold or promoted by India Index Services & Products Limited (IISL). IISL does not make any representation or warranty, express or implied (including warranties of merchantability or fitness for particular purpose or use) and disclaims all liability to the owners of �the Product� or any member of the public regarding the advisability of investing in securities generally or in �the Product� linked to Nifty 50 Index or particularly in the ability of the Nifty 50 Index to track general stock market performance in India. Please read the full Disclaimers in relation to the Nifty 50 Index in the in the Scheme Information Document.
Sector Allocation-% of Equity Holdings
Name of Instrument Industry % to Net Assets
Top Holdings
HDFC Bank Ltd. Banks 10.31 Reliance Industries Ltd. Petroleum Products 9.75 Housing Development Finance Corp Ltd. Finance 7.02 Infosys Ltd. Software 6.45 ITC Ltd. Consumer Non Durables 5.47 ICICI Bank Ltd. Banks 5.21 Tata Consultancy Services Ltd. Software 4.82 Kotak Mahindra Bank Ltd. Banks 3.74 Larsen & Toubro Ltd. Construction Project 3.68 Axis Bank Ltd. Banks 2.91 Hindustan Unilever Ltd. Consumer Non Durables 2.86 State Bank of India Banks 2.33 Maruti Suzuki India Ltd. Auto 2.10 IndusInd Bank Ltd. Banks 1.74 Asian Paints Ltd. Consumer Non Durables 1.46 Bajaj Finance Ltd. Finance 1.45 Mahindra & Mahindra Ltd. Auto 1.39 HCL Technologies Ltd. Software 1.36 Tech Mahindra Ltd. Software 1.20 Sun Pharmaceutical Ind Ltd. Pharmaceuticals 1.13 NTPC Ltd. Power 1.09 Oil & Natural Gas Corp Ltd. Oil 1.06 Yes Bank Ltd. Banks 0.99 Titan Company Ltd. Consumer Durables 0.99 Power Grid Corporation of India Ltd. Power 0.97 Bharti Airtel Ltd. Telecom - Services 0.97 Wipro Ltd. Software 0.96 Ultratech Cement Ltd. Cement 0.92 Bajaj Auto Ltd. Auto 0.91 Bajaj Finserv Ltd. Finance 0.90 Others 13.86
Fund Managers Details
22
Investors understand
that their principal will
be at moderately
high risk
Past performance may or may not be sustained in future and should not be used as a basis for comparison with other investments. * CAGR Return.
Fund Performance
Scheme-Edelweiss ETF - Nifty 50
Returns*Period
Additional Benchmark(S&P BSE Sensex TR Index)
Benchmark(Nifty 50 TR Index)
1 Year
3 Year
5 Year
Since Inception - Edelweiss ETF - Nifty 50
Value of Rs. 10000 Invested
Value of Rs. 10000 Invested
Value of Rs. 10000 Invested
Returns*Returns*
Notes:
1. The Scheme does not offer any Plans. The performance details provided herein are of Edelweiss ETF - Nifty 50. Since Inception returns are calculated on Rs. 8191.50/- and invested at inception. In case the start/end date is non business day, the NAV of previous day is used for computation.
2. The scheme is currently managed by Bhavesh Jain (managing this fund from May 8, 2015) and Mr. Hiten Shah (Managing this fund from May 24, 2016). Please refer page no. 35 for name of the other schemes currently managed by the Fund Managers and relevant scheme for performance.
3. Since the scheme is in existence for more than 3 years but less than 5 years hence performance data for 5 years and more is not provided
4. ^ Lower of sales or purchase divided by average AUM for last rolling 12 months.
Inception Date 8-May-15
NAV (as on February 28, 2019)
Edelweiss ETF - Nifty 50 11522.7671
Plan/Options:
The Scheme does not offer any Plans/Options for investment.
Minimum Investment Amount
a. Directly with the Mutual Fund (Only for Authorized
Participants/Large Investors): In Creation Unit size
will be 400 units and in multiples thereof
b. On the Stock Exchange(s): 1 unit and multiple thereof
Tracking Error:
Please note that since the Scheme has not
completed 3 years, the same is not provided.
Exit Load NIL
Total Expense Ratios~:
Edelweiss ETF - Nifty 50 0.07%
ETF - Nifty 50An open ended scheme tracking Nifty 50 Index
Quantitative indicators
4.45% 10,445 4.32% 10,432 6.25% 10,625
17.71% 16,310 17.20% 16,099 17.54% 16,240
NA NA NA NA NA NA
9.36% 14,067 8.92% 13,854 9.12% 13,947
(As on 28th February, 2019)
Fund Size
Month End AUM
Rs. 1.79 Crore
Monthly Average AUM
Rs. 1.79 Crore
Fund Managers Experience Managing Since
Mr. Bhavesh Jain 11 years 8-May-15
Mr. Hiten Shah 11 years 24-May-16
1.63%
2.07%
2.52%
3.68%
6.59%
9.79%
9.87%
11.57%
14.79%
27.22%
Cement
Power
Pharmaceu�cals
Construc�on Project
Auto
Consumer Non Durables
Finance
Petroleum Products
So�ware
Banks
Std. deviation
13.12% Sharpe Ratio**
0.83
Beta
1.00 Total stocks in portfolio
50
Portfolio Turnover Ratio^
0.07
Top 10 stocks
59.34%
**Risk free rate of return (FIMMDA Overnight MIBOR) 6.35%
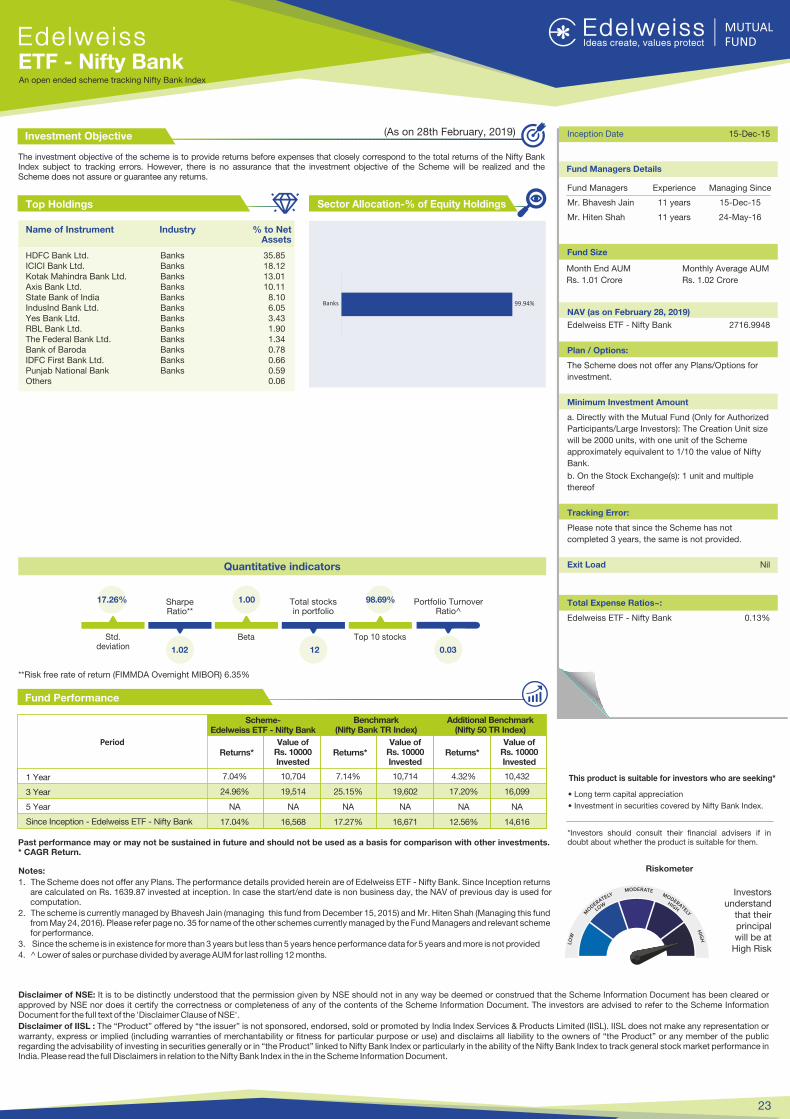
The investment objective of the scheme is to provide returns before expenses that closely correspond to the total returns of the Nifty Bank Index subject to tracking errors. However, there is no assurance that the investment objective of the Scheme will be realized and the Scheme does not assure or guarantee any returns.
Investment Objective
Fund Performance
Riskometer
This product is suitable for investors who are seeking*
� Long term capital appreciation
� Investment in securities covered by Nifty Bank Index.
*Investors should consult their financial advisers if in doubt about whether the product is suitable for them.
Disclaimer of NSE: It is to be distinctly understood that the permission given by NSE should not in any way be deemed or construed that the Scheme Information Document has been cleared or approved by NSE nor does it certify the correctness or completeness of any of the contents of the Scheme Information Document. The investors are advised to refer to the Scheme Information Document for the full text of the 'Disclaimer Clause of NSE'.
Disclaimer of IISL : The �Product� offered by �the issuer� is not sponsored, endorsed, sold or promoted by India Index Services & Products Limited (IISL). IISL does not make any representation or warranty, express or implied (including warranties of merchantability or fitness for particular purpose or use) and disclaims all liability to the owners of �the Product� or any member of the public regarding the advisability of investing in securities generally or in �the Product� linked to Nifty Bank Index or particularly in the ability of the Nifty Bank Index to track general stock market performance in India. Please read the full Disclaimers in relation to the Nifty Bank Index in the in the Scheme Information Document.
Sector Allocation-% of Equity Holdings
Name of Instrument Industry % to Net Assets
Top Holdings
HDFC Bank Ltd. Banks 35.85 ICICI Bank Ltd. Banks 18.12 Kotak Mahindra Bank Ltd. Banks 13.01 Axis Bank Ltd. Banks 10.11 State Bank of India Banks 8.10 IndusInd Bank Ltd. Banks 6.05 Yes Bank Ltd. Banks 3.43 RBL Bank Ltd. Banks 1.90 The Federal Bank Ltd. Banks 1.34 Bank of Baroda Banks 0.78 IDFC First Bank Ltd. Banks 0.66 Punjab National Bank Banks 0.59 Others 0.06
Fund Managers Details
23
Investors understand
that their principal will be at
High Risk
Past performance may or may not be sustained in future and should not be used as a basis for comparison with other investments. * CAGR Return.
Scheme-Edelweiss ETF - Nifty Bank
Returns*Period
Additional Benchmark(Nifty 50 TR Index)
Benchmark(Nifty Bank TR Index)
1 Year
3 Year
5 Year
Since Inception - Edelweiss ETF - Nifty Bank
Value of Rs. 10000 Invested
Value of Rs. 10000 Invested
Value of Rs. 10000 Invested
Returns*Returns*
Notes:
1. The Scheme does not offer any Plans. The performance details provided herein are of Edelweiss ETF - Nifty Bank. Since Inception returns are calculated on Rs. 1639.87 invested at inception. In case the start/end date is non business day, the NAV of previous day is used for computation.
2. The scheme is currently managed by Bhavesh Jain (managing this fund from December 15, 2015) and Mr. Hiten Shah (Managing this fund from May 24, 2016). Please refer page no. 35 for name of the other schemes currently managed by the Fund Managers and relevant scheme for performance.
3. Since the scheme is in existence for more than 3 years but less than 5 years hence performance data for 5 years and more is not provided
4. ^ Lower of sales or purchase divided by average AUM for last rolling 12 months.
Inception Date 15-Dec-15
NAV (as on February 28, 2019)
Edelweiss ETF - Nifty Bank 2716.9948
Plan / Options:
The Scheme does not offer any Plans/Options for
investment.
Minimum Investment Amount
a. Directly with the Mutual Fund (Only for Authorized
Participants/Large Investors): The Creation Unit size
will be 2000 units, with one unit of the Scheme
approximately equivalent to 1/10 the value of Nifty
Bank.
b. On the Stock Exchange(s): 1 unit and multiple
thereof
Tracking Error:
Please note that since the Scheme has not
completed 3 years, the same is not provided.
Exit Load Nil
Total Expense Ratios~:
Edelweiss ETF - Nifty Bank 0.13%
ETF - Nifty BankAn open ended scheme tracking Nifty Bank Index
Fund Managers Experience Managing Since
Mr. Bhavesh Jain 11 years 15-Dec-15
Mr. Hiten Shah 11 years 24-May-16
99.94% Banks
Quantitative indicators
Fund Size
Month End AUM
Rs. 1.01 Crore
Monthly Average AUM
Rs. 1.02 Crore
7.04% 10,704 7.14% 10,714 4.32% 10,432
24.96% 19,514 25.15% 19,602 17.20% 16,099
NA NA NA NA NA NA
17.04% 16,568 17.27% 16,671 12.56% 14,616
(As on 28th February, 2019)
Std. deviation
17.26% Sharpe Ratio**
1.02
Beta
1.00 Total stocks in portfolio
12
Portfolio Turnover Ratio^
0.03
Top 10 stocks
98.69%
**Risk free rate of return (FIMMDA Overnight MIBOR) 6.35%
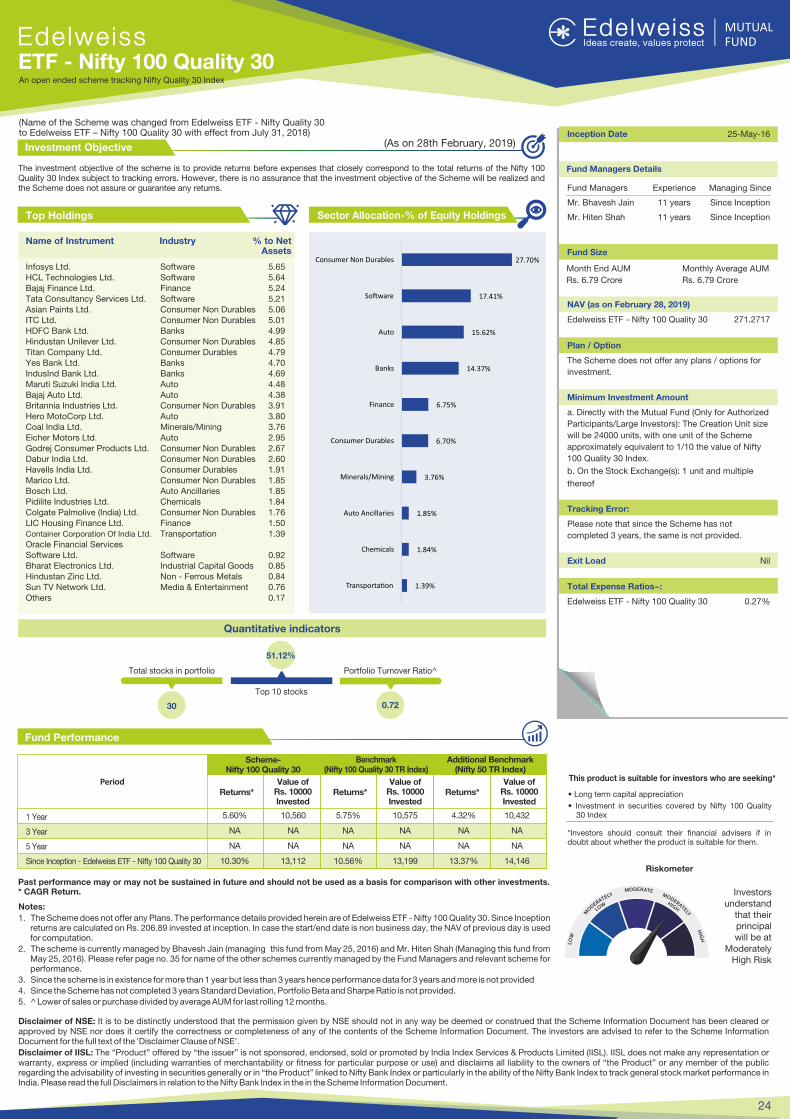
The investment objective of the scheme is to provide returns before expenses that closely correspond to the total returns of the Nifty 100 Quality 30 Index subject to tracking errors. However, there is no assurance that the investment objective of the Scheme will be realized and the Scheme does not assure or guarantee any returns.
Investment Objective
Fund Performance
Riskometer
This product is suitable for investors who are seeking*
� Long term capital appreciation
� Investment in securities covered by Nifty 100 Quality 30 Index
*Investors should consult their financial advisers if in doubt about whether the product is suitable for them.
Disclaimer of NSE: It is to be distinctly understood that the permission given by NSE should not in any way be deemed or construed that the Scheme Information Document has been cleared or approved by NSE nor does it certify the correctness or completeness of any of the contents of the Scheme Information Document. The investors are advised to refer to the Scheme Information Document for the full text of the 'Disclaimer Clause of NSE'.
Disclaimer of IISL: The �Product� offered by �the issuer� is not sponsored, endorsed, sold or promoted by India Index Services & Products Limited (IISL). IISL does not make any representation or warranty, express or implied (including warranties of merchantability or fitness for particular purpose or use) and disclaims all liability to the owners of �the Product� or any member of the public regarding the advisability of investing in securities generally or in �the Product� linked to Nifty Bank Index or particularly in the ability of the Nifty Bank Index to track general stock market performance in India. Please read the full Disclaimers in relation to the Nifty Bank Index in the in the Scheme Information Document.
Sector Allocation-% of Equity Holdings
Name of Instrument Industry % to Net Assets
Top Holdings
Infosys Ltd. Software 5.65 HCL Technologies Ltd. Software 5.64 Bajaj Finance Ltd. Finance 5.24 Tata Consultancy Services Ltd. Software 5.21 Asian Paints Ltd. Consumer Non Durables 5.06 ITC Ltd. Consumer Non Durables 5.01 HDFC Bank Ltd. Banks 4.99 Hindustan Unilever Ltd. Consumer Non Durables 4.85 Titan Company Ltd. Consumer Durables 4.79 Yes Bank Ltd. Banks 4.70 IndusInd Bank Ltd. Banks 4.69 Maruti Suzuki India Ltd. Auto 4.48 Bajaj Auto Ltd. Auto 4.38 Britannia Industries Ltd. Consumer Non Durables 3.91 Hero MotoCorp Ltd. Auto 3.80 Coal India Ltd. Minerals/Mining 3.76 Eicher Motors Ltd. Auto 2.95 Godrej Consumer Products Ltd. Consumer Non Durables 2.67 Dabur India Ltd. Consumer Non Durables 2.60 Havells India Ltd. Consumer Durables 1.91 Marico Ltd. Consumer Non Durables 1.85 Bosch Ltd. Auto Ancillaries 1.85 Pidilite Industries Ltd. Chemicals 1.84 Colgate Palmolive (India) Ltd. Consumer Non Durables 1.76 LIC Housing Finance Ltd. Finance 1.50 Container Corporation Of India Ltd. Transportation 1.39 Oracle Financial Services Software Ltd. Software 0.92 Bharat Electronics Ltd. Industrial Capital Goods 0.85 Hindustan Zinc Ltd. Non - Ferrous Metals 0.84 Sun TV Network Ltd. Media & Entertainment 0.76 Others 0.17
Fund Managers Details
24
Investors understand
that their principal will be at
Moderately High Risk
Past performance may or may not be sustained in future and should not be used as a basis for comparison with other investments. * CAGR Return.
Scheme-Nifty 100 Quality 30
Returns*Period
Additional Benchmark(Nifty 50 TR Index)
Benchmark(Nifty 100 Quality 30 TR Index)
1 Year
3 Year
5 Year
Since Inception - Edelweiss ETF - Nifty 100 Quality 30
Value of Rs. 10000 Invested
Value of Rs. 10000 Invested
Value of Rs. 10000 Invested
Returns*Returns*
Notes:
1. The Scheme does not offer any Plans. The performance details provided herein are of Edelweiss ETF - Nifty 100 Quality 30. Since Inception returns are calculated on Rs. 206.89 invested at inception. In case the start/end date is non business day, the NAV of previous day is used for computation.
2. The scheme is currently managed by Bhavesh Jain (managing this fund from May 25, 2016) and Mr. Hiten Shah (Managing this fund from May 25, 2016). Please refer page no. 35 for name of the other schemes currently managed by the Fund Managers and relevant scheme for performance.
3. Since the scheme is in existence for more than 1 year but less than 3 years hence performance data for 3 years and more is not provided
4. Since the Scheme has not completed 3 years Standard Deviation, Portfolio Beta and Sharpe Ratio is not provided.
5. ^ Lower of sales or purchase divided by average AUM for last rolling 12 months.
Inception Date 25-May-16
NAV (as on February 28, 2019)
Edelweiss ETF - Nifty 100 Quality 30 271.2717
Plan / Option
The Scheme does not offer any plans / options for
investment.
Minimum Investment Amount
a. Directly with the Mutual Fund (Only for Authorized
Participants/Large Investors): The Creation Unit size
will be 24000 units, with one unit of the Scheme
approximately equivalent to 1/10 the value of Nifty
100 Quality 30 Index.
b. On the Stock Exchange(s): 1 unit and multiple
thereof
Tracking Error:
Please note that since the Scheme has not
completed 3 years, the same is not provided.
Exit Load Nil
Total Expense Ratios~:
Edelweiss ETF - Nifty 100 Quality 30 0.27%
ETF - Nifty 100 Quality 30An open ended scheme tracking Nifty Quality 30 Index
Fund Managers Experience Managing Since
Mr. Bhavesh Jain 11 years Since Inception
Mr. Hiten Shah 11 years Since Inception
Quantitative indicators
Portfolio Turnover Ratio^Total stocks in portfolio
30
Top 10 stocks
51.12%
0.72
Fund Size
Month End AUM
Rs. 6.79 Crore
Monthly Average AUM
Rs. 6.79 Crore
5.60% 10,560 5.75% 10,575 4.32% 10,432
NA NA NA NA NA NA
NA NA NA NA NA NA
10.30% 13,112 10.56% 13,199 13.37% 14,146
(As on 28th February, 2019)
(Name of the Scheme was changed from Edelweiss ETF - Nifty Quality 30to Edelweiss ETF � Nifty 100 Quality 30 with effect from July 31, 2018)
1.39%
1.84%
1.85%
3.76%
6.70%
6.75%
14.37%
15.62%
17.41%
27.70%
Transporta�on
Chemicals
Auto Ancillaries
Minerals/Mining
Consumer Durables
Finance
Banks
Auto
So�ware
Consumer Non Durables

The primary investment objective of the Scheme is to provide long term capital growth by investing predominantly in JPMorgan Funds � ASEAN Equity Fund, an equity fund which invests primarily in companies of countries which are members of the Association of South East Asian Nations (ASEAN). However, there can be no assurance that the investment objective of the Scheme will be realized.
Investment Objective
Fund Performance
Riskometer
This product is suitable for investors who are seeking*
� Long term capital growth
� Investments predominantly in JPMorgan Funds - ASEAN Equity Fund, an equity fund which invests primarily in companies of countries which are members of the Association of South East Asian Nations.
*Investors should consult their financial advisers if in doubt about whether the product is suitable for them.
Name of Instrument Exposure
Holdings
JPMorgan Funds - ASEAN Equity Fund 101.14%
CBLO/Repo 0.74%
Net Receivables/(Payables) (1.88%)
Grand Total 100.00%
25
Investors understand
that their principal will
be at high risk
Past performance may or may not be sustained in future and should not be used as a basis for comparison with other investments. * CAGR Return.
Notes:
1. Different plans shall have different expense structure. The performance details provided herein are of of Regular Plan Edelweiss Asean Equity Off-Shore Fund. Returns are for Growth Option only. Since Inception returns are calculated on Rs. 10/- invested at inception of the scheme. In case the start/end date is non business day, the NAV of previous day is used for computation.
2. The scheme is currently managed by Mr. Hiten Shah (Managing this fund from April 9, 2018). Please refer page no. 35 for name of the other schemes currently managed by the Fund Managers and relevant scheme for performance.
3. Please note that the scheme is acquired from JPMorgan mutual fund on and from the close of business hours of November 25, 2016, hence disclosure requirement vide SEBI Circular no. SEBI/HO/IMD/DF3/CIR/P/2018/69 dated April 12, 2018 on performance disclosure post consolidation/ Merger of Schemes, prior to acquisition date, is not provided.
4. #Please note that benchmark of the Scheme is changed from MSCI South East Asia Index to MSCI AC ASEAN Index
Inception Date 1-Jul-11
NAV (as on February 28, 2019)
Direct Plan Growth Option 22.2240
Regular Plan Growth Option 20.8280
Minimum Investment Amount
Rs. 5,000/- per application & in multiples of Re. 1/- thereof
Additional Investment Amount
Rs. 500/- per application & in multiples of Re. 1/-
thereof
Exit Load
� If the Units are redeemed / switched out on or before 12 months from the date of allotment - 1.00%
� If the Units are redeemed / switched out after 12 months from the date of allotment � Nil
Total Expense Ratios~:
Regular Plan 1.69%
Direct Plan 0.95%
Period
Since Inception - Edelweiss Asean Equity Off-Shore Fund
1 Year
3 Year
5 Year
Returns* Returns* Returns*
Additional Benchmark(Nifty 50 TR Index)
Benchmark#(MSCI AC ASEAN Index )
Value of Rs. 10000 Invested
Value of Rs. 10000 Invested
Value of Rs. 10000 Invested
Scheme - Regular Plan
Asean Equity Off-Shore FundAn open ended fund of fund scheme investing in JPMorgan Funds � ASEAN Equity Fund
Fund Size
Month End AUM
Rs. 44.64 Crore
Monthly Average AUM
Rs. 45.20 Crore
-1.26% 9,874 -2.42% 9,758 4.32% 10,432
11.33% 13,798 8.02% 12,604 17.20% 16,099
6.05% 13,417 2.35% 11,230 12.86% 18,317
10.04% 20,828 5.52% 15,097 10.21% 21,074
Fund Managers Details
Fund Managers Experience Managing Since
Mr. Hiten Shah 11 years 09-Apr-2018
(As on 28th February, 2019)

The primary investment objective of the Scheme is to provide long term capital appreciation by investing in JPMorgan Funds - Greater China Fund, an equity fund which invests primarily in a diversified portfolio of companies that are domiciled in, or carrying out the main part of their economic activity in, a country of Greater China region. However, there can be no assurance that the investment objective of the Scheme will berealised.
Investment Objective
Fund Performance
Riskometer
This product is suitable for investors who are seeking*
� Long term capital growth
� Investment in JPMorgan Funds - Greater China Fund, an equity fund which invests primarily in a diversified portfolio of companies that are domiciled in, or carrying out the main part of their economic activity in, a country of Greater China region.
*Investors should consult their financial advisers if in doubt about whether the product is suitable for them.
Name of Instrument Exposure
Holdings
JPMorgan Funds - Greater China Fund 99.23%
CBLO/Repo 0.80%
Net Receivables/(Payables) (0.03%)
Grand Total 100.00%
Fund Managers Details
26
Investors understand
that their principal will
be at high risk
Past performance may or may not be sustained in future and should not be used as a basis for comparison with other investments. * CAGR Return.
Notes:
1. Different plans shall have different expense structure. The performance details provided herein are of of Regular Plan Edelweiss Greater China Equity Off-Shore Fund. Returns are for Growth Option only. Since Inception returns are calculated on Rs. 10/- invested at inception of the scheme. In case the start/end date is non business day, the NAV of previous day is used for computation.
2. The scheme is currently managed by Mr. Hiten Shah (Managing this fund from April 9, 2018). Please refer page no. 35 for name of the other schemes currently managed by the Fund Managers and relevant scheme for performance.
3. Please note that the scheme is acquired from JPMorgan mutual fund on and from the close of business hours of November 25, 2016, hence disclosure requirement vide SEBI Circular no. SEBI/HO/IMD/DF3/CIR/P/2018/69 dated April 12, 2018 on performance disclosure post consolidation/ Merger of Schemes, prior to acquisition date, is not provided.
Inception Date 26-Aug-09
NAV (as on February 28, 2019)
Direct Plan Growth Option 28.6710
Regular Plan Growth Option 27.0120
Minimum Investment Amount
Rs. 5,000/- per application & in multiples of Re.
1/- thereof
Additional investment amount
Rs. 500/- per application & in multiples of
Re. 1/- thereof
Exit load
� If the Units are redeemed / switched out on or
before 12 months from the date of allotment �
1.00%
� If the Units are redeemed / switched out after 12
months from the date of allotment � Nil
Total Expense Ratios~:
Regular Plan 1.65%
Direct Plan 0.76%
Period
Since Inception - Edelweiss Greater China Equity Off-Shore Fund
1 Year
3 Year
5 Year
Returns* Returns* Returns*
Additional Benchmark(Nifty 50 TR Index)
Benchmark(MSCI Golden Dragon Index)
Value of Rs. 10000 Invested
Value of Rs. 10000 Invested
Value of Rs. 10000 Invested
Scheme - Regular Plan
Greater China Equity Off-Shore FundAn open ended fund of fund scheme investing in JPMorgan Funds � Greater China Fund
Fund Managers Experience Managing Since
Mr. Hiten Shah 11 years 09-Apr-2018
Fund Size
Month End AUM
Rs. 65.02 Crore
Monthly Average AUM
Rs. 61.93 Crore
-5.37% 9,463 -2.15% 9,785 4.32% 10,432
17.00% 16,018 16.06% 15,634 17.20% 16,099
9.06% 15,432 8.49% 15,036 12.86% 18,317
11.01% 27,012 8.87% 22,452 10.49% 25,838
(As on 28th February, 2019)

The primary investment objective of the Scheme is to seek to provide long term capital growth by investing predominantly in the JPMorgan Funds - Europe Dynamic Fund, an equity fund which invests primarily in an aggressively managed portfolio of European companies. However, there can be no assurance that the investment objective of the Scheme will be realized.
Investment Objective
Fund Performance
Riskometer
This product is suitable for investors who are seeking*
� Long term capital appreciation
� Investments predominantly in the JPMorgan Funds - Europe Dynamic Fund, an equity fund which invests primarily in an aggressively managed portfolio of European companies.
*Investors should consult their financial advisers if in doubt about whether the product is suitable for them.
Name of Instrument Exposure
Holdings
JP Morgan Funds- Europe Dynamic Fund 98.92%
CBLO/Repo 0.20%
Net Receivables/(Payables) 0.88%
Grand Total 100.00%
27
Investors understand
that their principal will
be at high risk
Past performance may or may not be sustained in future and should not be used as a basis for comparison with other investments. * CAGR Return.
Notes:
1. Different plans shall have different expense structure. The performance details provided herein are of of Regular Plan Edelweiss Europe Dynamic Equity Off-Shore Fund. Returns are for Growth Option only. Since Inception returns are calculated on Rs. 10/- invested at inception of the scheme. In case the start/end date is non business day, the NAV of previous day is used for computation.
2. The scheme is currently managed by Mr. Hiten Shah (Managing this fund from April 9, 2018). Please refer page no. 35 for name of the other schemes currently managed by the Fund Managers and relevant scheme for performance.
3. Please note that the scheme is acquired from JPMorgan mutual fund on and from the close of business hours of November 25, 2016, hence disclosure requirement vide SEBI Circular no. SEBI/HO/IMD/DF3/CIR/P/2018/69 dated April 12, 2018 on performance disclosure post consolidation/ Merger of Schemes, prior to acquisition date, is not provided.
Inception Date 7-Feb-14
NAV (as on February 28, 2019)
Direct Plan Growth Option 11.3844
Regular Plan Growth Option 10.8586
Minimum Investment Amount
Rs. 5,000/- per application & in multiples of Re.
1/- thereafter
Additional investment amount
Rs. 500/- per application & in multiples of
Re. 1/- thereafter
Exit load
� If the Units are redeemed / switched out on or
before 12 months from the date of allotment �
1.00%
� If the Units are redeemed / switched out after 12
months from the date of allotment � Nil
Total Expense Ratios~:
Regular Plan 1.62%
Direct Plan 0.82%
Period
Since Inception - Edelweiss Europe Dynamic Equity Off-Shore Fund
1 Year
3 Year
5 Year
Returns* Returns* Returns*
Additional Benchmark(Nifty 50 TR Index)
Benchmark(MSCI Europe Index)
Value of Rs. 10000 Invested
Value of Rs. 10000 Invested
Value of Rs. 10000 Invested
Scheme - Regular Plan
Europe Dynamic Equity Off-Shore FundAn open ended fund of fund scheme investing in JPMorgan Funds � Europe Dynamic Fund
Fund Managers Details
Fund Managers Experience Managing Since
Mr. Hiten Shah 11 years 09-Apr-2018
Fund Size
Month End AUM
Rs. 35.96 Crore
Monthly Average AUM
Rs. 36.57 Crore
-5.09% 9,491 -0.39% 9,961 4.32% 10,432
4.89% 11,542 6.73% 12,158 17.20% 16,099
0.28% 10,140 0.65% 10,332 12.86% 18,317
1.64% 10,859 1.58% 10,826 13.49% 18,970
(As on 28th February, 2019)

The primary investment objective of the Scheme is to seek to provide long term capital growth by investing predominantly in the JPMorgan Funds - Emerging Markets Opportunities Fund, an equity fund which invests primarily in an aggressively managed portfolio of emerging market companies. However, there can be no assurance that the investment objective of the Scheme will be realised.
Investment Objective
Fund Performance
Riskometer
This product is suitable for investors who are seeking*
� Long term capital growth
� Investments predominantly in JPMorgan Funds - Emerging Markets Opportunities Funds, an equity oriented fund which invests primarily in an aggressively managed portfolio of emerging market companies.
*Investors should consult their financial advisers if in doubt about whether the product is suitable for them.
Name of Instrument Exposure
Holdings
JP Morgan Emerging Mkts Opp Eq Offshore 97.99%
CBLO/Repo 2.49%
Net Receivables/(Payables) (0.48%)
Grand Total 100.00%
28
Investors understand
that their principal will
be at high risk
Past performance may or may not be sustained in future and should not be used as a basis for comparison with other investments. * CAGR Return.
Notes:
1. Different plans shall have different expense structure. The performance details provided herein are of of Regular Plan Edelweiss Emerging Markets Opportunities Equity Offshore Fund. Returns are for Growth Option only. Since Inception returns are calculated on Rs. 10/- invested at inception of the scheme. In case the start/end date is non business day, the NAV of previous day is used for computation.
2. The scheme is currently managed by Mr. Hiten Shah (Managing this fund from April 9, 2018). Please refer page no. 35 for name of the other schemes currently managed by the Fund Managers and relevant scheme for performance.
3. Since the scheme is in existence for more than 3 years but less than 5 years hence performance data for 5 years and more is not provided
4. Please note that the scheme is acquired from JPMorgan mutual fund on and from the close of business hours of November 25, 2016, hence disclosure requirement vide SEBI Circular no. SEBI/HO/IMD/DF3/CIR/P/2018/69 dated April 12, 2018 on performance disclosure post consolidation/ Merger of Schemes, prior to acquisition date, is not provided.
Inception Date 7-Jul-14
NAV (as on February 28, 2019)
Direct Plan Growth Option 13.0807
Regular Plan Growth Option 12.7591
Minimum Investment Amount
Rs. 5,000/- per application & in multiples of Re.
1/- thereafter
Additional investment amount
Rs. 500/- per application & in multiples of
Re. 1/- thereafter
Exit load
� If the Units are redeemed / switched out on or
before 12 months from the date of allotment �
1.00%
� If the Units are redeemed / switched out after 12
months from the date of allotment � Nil
Total Expense Ratios~:
Regular Plan 1.53%
Direct Plan 0.68%
Period
Since Inception - Edelweiss Emerging Markets Opportunities Equity Offshore Fund
1 Year
3 Year
5 Year
Returns* Returns* Returns*
Additional Benchmark(Nifty 50 TR Index)
Benchmark(MSCI Emerging Markets Index)
Value of Rs. 10000 Invested
Value of Rs. 10000 Invested
Value of Rs. 10000 Invested
Scheme - Regular Plan
Emerging Markets Opportunities Equity Offshore FundAn open ended fund of fund scheme investingin JPMorgan Funds � Emerging MarketOpportunities Fund
Fund Managers Details
Fund Managers Experience Managing Since
Mr. Hiten Shah 11 years 09-Apr-2018
Fund Size
Month End AUM
Rs. 6.53 Crore
Monthly Average AUM
Rs. 6.54 Crore
-0.34% 9,966 10.10% 11,010 4.32% 10,432
16.84% 15,948 19.31% 16,983 17.20% 16,099
NA NA NA NA NA NA
5.36% 12,746 6.58% 13,451 8.60% 14,674
(As on 28th February, 2019)
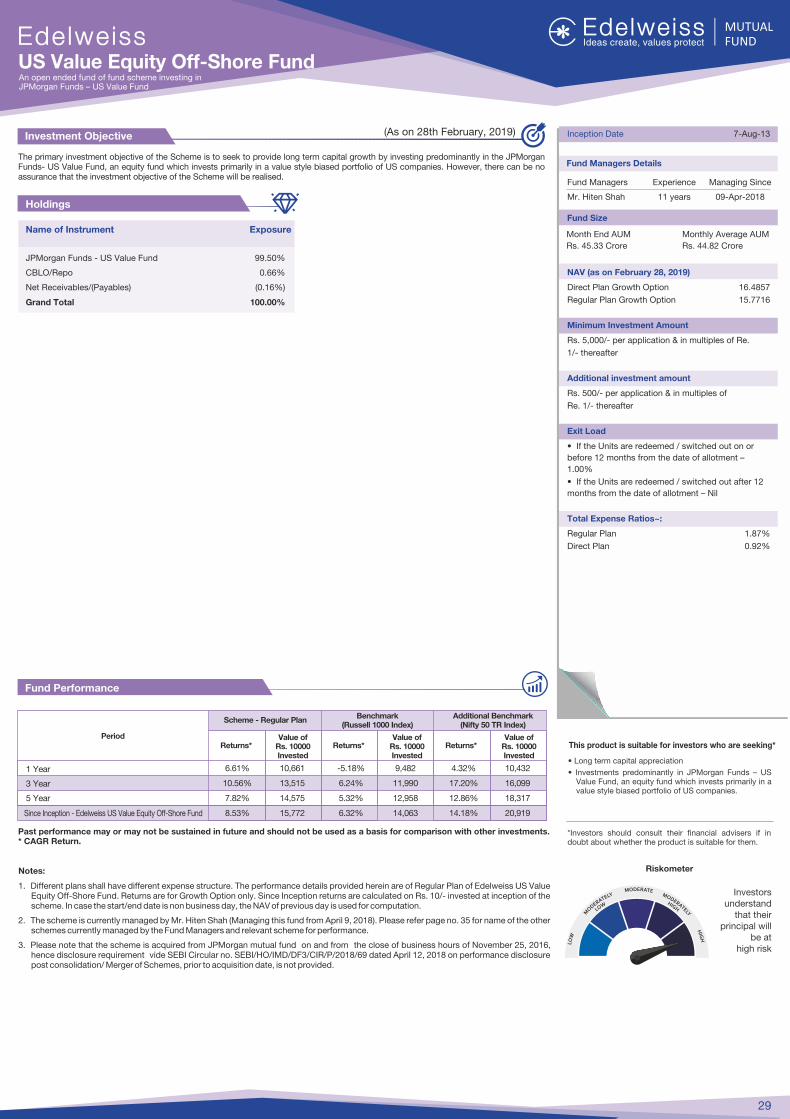
The primary investment objective of the Scheme is to seek to provide long term capital growth by investing predominantly in the JPMorgan Funds- US Value Fund, an equity fund which invests primarily in a value style biased portfolio of US companies. However, there can be no assurance that the investment objective of the Scheme will be realised.
Investment Objective
Fund Performance
Riskometer
This product is suitable for investors who are seeking*
� Long term capital appreciation
� Investments predominantly in JPMorgan Funds � US Value Fund, an equity fund which invests primarily in a value style biased portfolio of US companies.
*Investors should consult their financial advisers if in doubt about whether the product is suitable for them.
Name of Instrument Exposure
Holdings
JPMorgan Funds - US Value Fund 99.50%
CBLO/Repo 0.66%
Net Receivables/(Payables) (0.16%)
Grand Total 100.00%
Fund Managers Details
29
Investors understand
that their principal will
be at high risk
Past performance may or may not be sustained in future and should not be used as a basis for comparison with other investments. * CAGR Return.
Notes:
1. Different plans shall have different expense structure. The performance details provided herein are of Regular Plan of Edelweiss US Value Equity Off-Shore Fund. Returns are for Growth Option only. Since Inception returns are calculated on Rs. 10/- invested at inception of the scheme. In case the start/end date is non business day, the NAV of previous day is used for computation.
2. Please refer page no. 35 for name of the other The scheme is currently managed by Mr. Hiten Shah (Managing this fund from April 9, 2018).schemes currently managed by the Fund Managers and relevant scheme for performance.
3. Please note that the scheme is acquired from JPMorgan mutual fund on and from the close of business hours of November 25, 2016, hence disclosure requirement vide SEBI Circular no. SEBI/HO/IMD/DF3/CIR/P/2018/69 dated April 12, 2018 on performance disclosure post consolidation/ Merger of Schemes, prior to acquisition date, is not provided.
Inception Date 7-Aug-13
NAV (as on February 28, 2019)
Direct Plan Growth Option 16.4857
Regular Plan Growth Option 15.7716
Minimum Investment Amount
Rs. 5,000/- per application & in multiples of Re.
1/- thereafter
Additional investment amount
Rs. 500/- per application & in multiples of
Re. 1/- thereafter
Exit Load
� If the Units are redeemed / switched out on or
before 12 months from the date of allotment �
1.00%
� If the Units are redeemed / switched out after 12
months from the date of allotment � Nil
Total Expense Ratios~:
Regular Plan 1.87%
Direct Plan 0.92%
Period
Since Inception - Edelweiss US Value Equity Off-Shore Fund
1 Year
3 Year
5 Year
Returns* Returns* Returns*
Additional Benchmark(Nifty 50 TR Index)
Benchmark(Russell 1000 Index)
Value of Rs. 10000 Invested
Value of Rs. 10000 Invested
Value of Rs. 10000 Invested
Scheme - Regular Plan
US Value Equity Off-Shore FundAn open ended fund of fund scheme investing inJPMorgan Funds � US Value Fund
Fund Size
Month End AUM
Rs. 45.33 Crore
Monthly Average AUM
Rs. 44.82 Crore
6.61% 10,661 -5.18% 9,482 4.32% 10,432
10.56% 13,515 6.24% 11,990 17.20% 16,099
7.82% 14,575 5.32% 12,958 12.86% 18,317
8.53% 15,772 6.32% 14,063 14.18% 20,919
Fund Managers Experience Managing Since
Mr. Hiten Shah 11 years 09-Apr-2018
(As on 28th February, 2019)
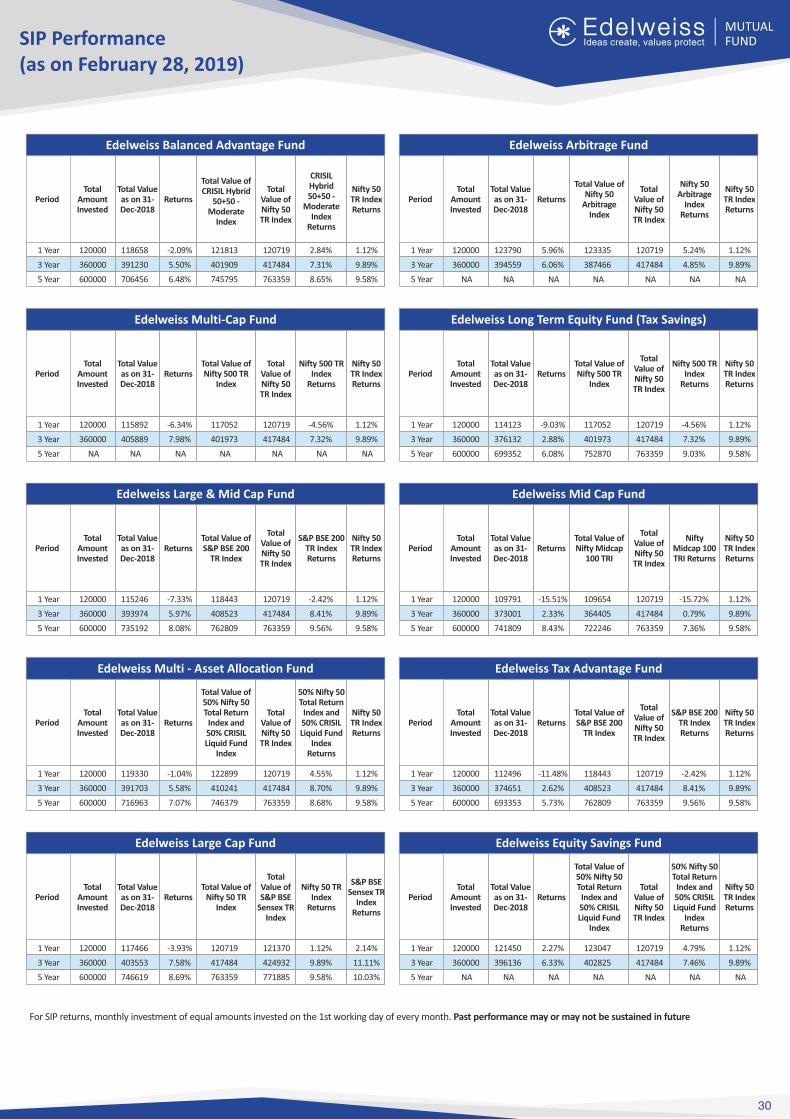
SIP Performance (as on February 28, 2019)
For SIP returns, monthly investment of equal amounts invested on the 1st working day of every month. Past performance may or may not be sustained in future
30
1 Year 120000 118658 -2.09% 121813 120719 2.84% 1.12%
3 Year 360000 391230 5.50% 401909 417484 7.31% 9.89%
5 Year 600000 706456 6.48% 745795 763359 8.65% 9.58%
Total Amount Invested
Total Value as on 31-Dec-2018
Returns
Total Value of CRISIL Hybrid
50+50 - Moderate
Index
PeriodTotal
Value of Nifty 50 TR Index
CRISIL Hybrid 50+50 -
Moderate Index
Returns
Nifty 50 TR Index Returns
Edelweiss Balanced Advantage Fund
1 Year 120000 123790 5.96% 123335 120719 5.24% 1.12%
3 Year 360000 394559 6.06% 387466 417484 4.85% 9.89%
5 Year NA NA NA NA NA NA NA
Total Amount Invested
Total Value as on 31-Dec-2018
Returns
Total Value of Nifty 50
Arbitrage Index
PeriodTotal
Value of Nifty 50 TR Index
Nifty 50 Arbitrage
Index Returns
Nifty 50 TR Index Returns
Edelweiss Arbitrage Fund
1 Year 120000 115892 -6.34% 117052 120719 -4.56% 1.12%
3 Year 360000 405889 7.98% 401973 417484 7.32% 9.89%
5 Year NA NA NA NA NA NA NA
Total Amount Invested
Total Value as on 31-Dec-2018
ReturnsTotal Value of Nifty 500 TR
IndexPeriod
Total Value of Nifty 50 TR Index
Nifty 500 TR Index
Returns
Nifty 50 TR Index Returns
Edelweiss Multi-Cap Fund
1 Year 120000 114123 -9.03% 117052 120719 -4.56% 1.12%
3 Year 360000 376132 2.88% 401973 417484 7.32% 9.89%
5 Year 600000 699352 6.08% 752870 763359 9.03% 9.58%
Total Amount Invested
Total Value as on 31-Dec-2018
ReturnsTotal Value of Nifty 500 TR
IndexPeriod
Total Value of Nifty 50 TR Index
Nifty 500 TR Index
Returns
Nifty 50 TR Index Returns
Edelweiss Long Term Equity Fund (Tax Savings)
1 Year 120000 115246 -7.33% 118443 120719 -2.42% 1.12%
3 Year 360000 393974 5.97% 408523 417484 8.41% 9.89%
5 Year 600000 735192 8.08% 762809 763359 9.56% 9.58%
Total Amount Invested
Total Value as on 31-Dec-2018
ReturnsTotal Value of S&P BSE 200
TR IndexPeriod
Total Value of Nifty 50 TR Index
S&P BSE 200 TR Index Returns
Nifty 50 TR Index Returns
Edelweiss Large & Mid Cap Fund
1 Year 120000 109791 -15.51% 109654 120719 -15.72% 1.12%
3 Year 360000 373001 2.33% 364405 417484 0.79% 9.89%
5 Year 600000 741809 8.43% 722246 763359 7.36% 9.58%
Total Amount Invested
Total Value as on 31-Dec-2018
ReturnsTotal Value of Nifty Midcap
100 TRIPeriod
Total Value of Nifty 50 TR Index
Nifty Midcap 100 TRI Returns
Nifty 50 TR Index Returns
Edelweiss Mid Cap Fund
1 Year 120000 119330 -1.04% 122899 120719 4.55% 1.12%
3 Year 360000 391703 5.58% 410241 417484 8.70% 9.89%
5 Year 600000 716963 7.07% 746379 763359 8.68% 9.58%
Total Amount Invested
Total Value as on 31-Dec-2018
Returns
Total Value of 50% Nifty 50 Total Return
Index and 50% CRISIL Liquid Fund
Index
PeriodTotal
Value of Nifty 50 TR Index
50% Nifty 50 Total Return
Index and 50% CRISIL Liquid Fund
Index Returns
Nifty 50 TR Index Returns
Edelweiss Multi - Asset Allocation Fund
1 Year 120000 112496 -11.48% 118443 120719 -2.42% 1.12%
3 Year 360000 374651 2.62% 408523 417484 8.41% 9.89%
5 Year 600000 693353 5.73% 762809 763359 9.56% 9.58%
Total Amount Invested
Total Value as on 31-Dec-2018
ReturnsTotal Value of S&P BSE 200
TR IndexPeriod
Total Value of Nifty 50 TR Index
S&P BSE 200 TR Index Returns
Nifty 50 TR Index Returns
Edelweiss Tax Advantage Fund
1 Year 120000 117466 -3.93% 120719 121370 1.12% 2.14%
3 Year 360000 403553 7.58% 417484 424932 9.89% 11.11%
5 Year 600000 746619 8.69% 763359 771885 9.58% 10.03%
Total Amount Invested
Total Value as on 31-Dec-2018
ReturnsTotal Value of
Nifty 50 TR Index
Period
Total Value of S&P BSE
Sensex TR Index
Nifty 50 TR Index
Returns
S&P BSE Sensex TR
Index Returns
Edelweiss Large Cap Fund
1 Year 120000 121450 2.27% 123047 120719 4.79% 1.12%
3 Year 360000 396136 6.33% 402825 417484 7.46% 9.89%
5 Year NA NA NA NA NA NA NA
Total Amount Invested
Total Value as on 31-Dec-2018
Returns
Total Value of 50% Nifty 50 Total Return
Index and 50% CRISIL Liquid Fund
Index
PeriodTotal
Value of Nifty 50 TR Index
50% Nifty 50 Total Return
Index and 50% CRISIL Liquid Fund
Index Returns
Nifty 50 TR Index Returns
Edelweiss Equity Savings Fund
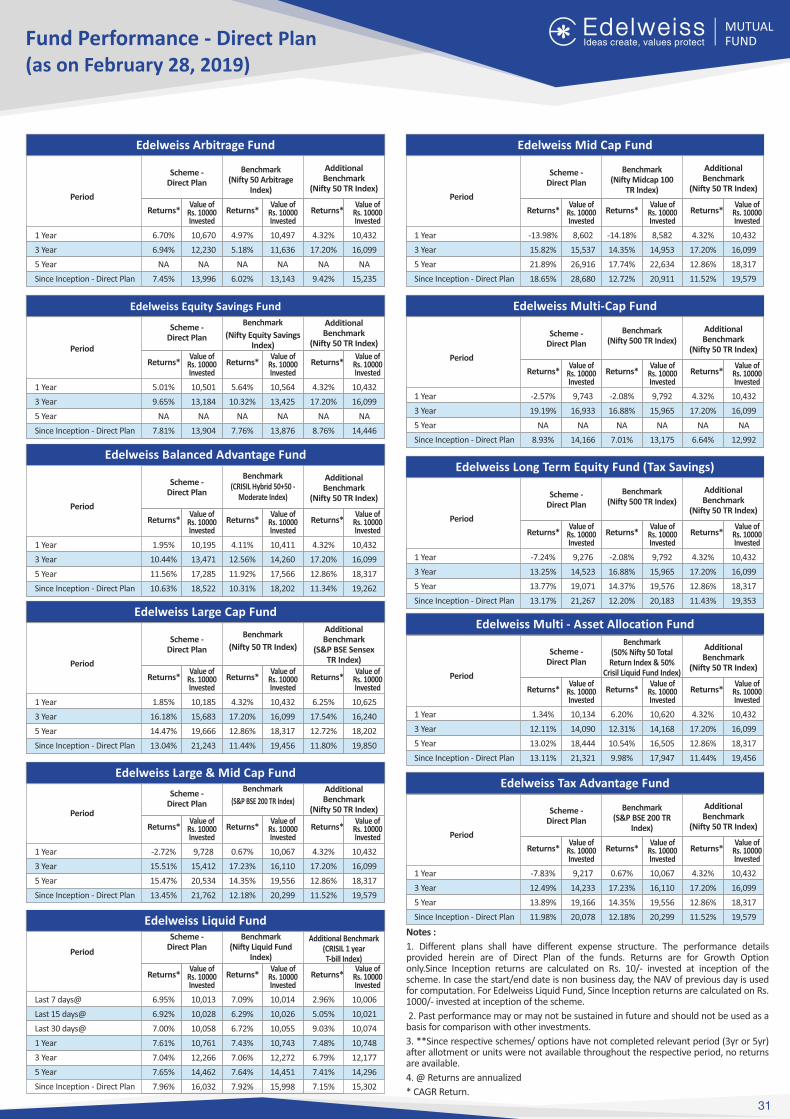
Fund Performance - Direct Plan (as on February 28, 2019)
Edelweiss Arbitrage Fund
Scheme - Direct Plan
Benchmark(Nifty 50 Arbitrage
Index)
Additional Benchmark
(Nifty 50 TR Index)Period
1 Year
3 Year
5 Year
Since Inception - Direct Plan
Returns* Returns*Value of
Rs. 10000 Invested
Value of Rs. 10000 Invested
Returns*Value of
Rs. 10000 Invested
6.70% 10,670 4.97% 10,497 4.32% 10,432
6.94% 12,230 5.18% 11,636 17.20% 16,099
NA NA NA NA NA NA
7.45% 13,996 6.02% 13,143 9.42% 15,235
Edelweiss Mid Cap Fund
Scheme - Direct Plan
Benchmark(Nifty Midcap 100
TR Index)
Additional Benchmark
(Nifty 50 TR Index)Period
1 Year
3 Year
5 Year
Since Inception - Direct Plan
Returns* Returns*Value of
Rs. 10000 Invested
Value of Rs. 10000 Invested
Returns*Value of
Rs. 10000 Invested
-13.98% 8,602 -14.18% 8,582 4.32% 10,432
15.82% 15,537 14.35% 14,953 17.20% 16,099
21.89% 26,916 17.74% 22,634 12.86% 18,317
18.65% 28,680 12.72% 20,911 11.52% 19,579
Edelweiss Equity Savings Fund
Scheme - Direct Plan
Benchmark Additional Benchmark
(Nifty 50 TR Index)Period
1 Year
3 Year
5 Year
Since Inception - Direct Plan
Returns* Returns*Value of
Rs. 10000 Invested
Value of Rs. 10000 Invested
Returns*Value of
Rs. 10000 Invested
(Nifty Equity Savings Index)
Edelweiss Balanced Advantage Fund
Scheme - Direct Plan
Benchmark Additional Benchmark
(Nifty 50 TR Index)Period
1 Year
3 Year
5 Year
Since Inception - Direct Plan
Returns* Returns*Value of
Rs. 10000 Invested
Value of Rs. 10000 Invested
Returns*Value of
Rs. 10000 Invested
(CRISIL Hybrid 50+50 - Moderate Index)
1.95% 10,195 4.11% 10,411 4.32% 10,432
10.44% 13,471 12.56% 14,260 17.20% 16,099
11.56% 17,285 11.92% 17,566 12.86% 18,317
10.63% 18,522 10.31% 18,202 11.34% 19,262
Edelweiss Large Cap Fund
Scheme - Direct Plan
BenchmarkAdditional Benchmark
(S&P BSE Sensex TR Index)Period
1 Year
3 Year
5 Year
Since Inception - Direct Plan
Returns* Returns*Value of
Rs. 10000 Invested
Value of Rs. 10000 Invested
Returns*Value of
Rs. 10000 Invested
(Nifty 50 TR Index)
1.85% 10,185 4.32% 10,432 6.25% 10,625
16.18% 15,683 17.20% 16,099 17.54% 16,240
14.47% 19,666 12.86% 18,317 12.72% 18,202
13.04% 21,243 11.44% 19,456 11.80% 19,850
Edelweiss Large & Mid Cap Fund
Period
1 Year
3 Year
5 Year
Since Inception - Direct Plan
Returns* Returns*Value of
Rs. 10000 Invested
Value of Rs. 10000 Invested
Returns*Value of
Rs. 10000 Invested
Edelweiss Multi-Cap Fund
Scheme - Direct Plan
Benchmark(Nifty 500 TR Index)
Additional Benchmark
(Nifty 50 TR Index)Period
1 Year
3 Year
5 Year
Since Inception - Direct Plan
Returns* Returns*Value of
Rs. 10000 Invested
Value of Rs. 10000 Invested
Returns*Value of
Rs. 10000 Invested
-2.57% 9,743 -2.08% 9,792 4.32% 10,432
19.19% 16,933 16.88% 15,965 17.20% 16,099
NA NA NA NA NA NA
8.93% 14,166 7.01% 13,175 6.64% 12,992
Edelweiss Long Term Equity Fund (Tax Savings)
Scheme - Direct Plan
Benchmark(Nifty 500 TR Index)
Additional Benchmark
(Nifty 50 TR Index)Period
1 Year
3 Year
5 Year
Since Inception - Direct Plan
Returns* Returns*Value of
Rs. 10000 Invested
Value of Rs. 10000 Invested
Returns*Value of
Rs. 10000 Invested
Edelweiss Multi - Asset Allocation Fund
Scheme - Direct Plan
Benchmark(50% Nifty 50 Total Return Index & 50%
Crisil Liquid Fund Index)
Additional Benchmark
(Nifty 50 TR Index)Period
1 Year
3 Year
5 Year
Since Inception - Direct Plan
Returns* Returns*Value of
Rs. 10000 Invested
Value of Rs. 10000 Invested
Returns*Value of
Rs. 10000 Invested
Edelweiss Tax Advantage Fund
Scheme - Direct Plan
Benchmark(S&P BSE 200 TR
Index)
Additional Benchmark
(Nifty 50 TR Index)Period
1 Year
3 Year
5 Year
Since Inception - Direct Plan
Returns* Returns*Value of
Rs. 10000 Invested
Value of Rs. 10000 Invested
Returns*Value of
Rs. 10000 Invested
Scheme - Direct Plan
Benchmark Additional Benchmark
(Nifty 50 TR Index)(S&P BSE 200 TR Index)
Notes :
1. Different plans shall have different expense structure. The performance details provided herein are of Direct Plan of the funds. Returns are for Growth Option only.Since Inception returns are calculated on Rs. 10/- invested at inception of the scheme. In case the start/end date is non business day, the NAV of previous day is used for computation. For Edelweiss Liquid Fund, Since Inception returns are calculated on Rs. 1000/- invested at inception of the scheme.
2. Past performance may or may not be sustained in future and should not be used as a basis for comparison with other investments.
3. **Since respective schemes/ options have not completed relevant period (3yr or 5yr) after allotment or units were not available throughout the respective period, no returns are available.
4. @ Returns are annualized
* CAGR Return.
5.01% 10,501 5.64% 10,564 4.32% 10,432
9.65% 13,184 10.32% 13,425 17.20% 16,099
NA NA NA NA NA NA
7.81% 13,904 7.76% 13,876 8.76% 14,446
-7.24% 9,276 -2.08% 9,792 4.32% 10,432
13.25% 14,523 16.88% 15,965 17.20% 16,099
13.77% 19,071 14.37% 19,576 12.86% 18,317
13.17% 21,267 12.20% 20,183 11.43% 19,353
1.34% 10,134 6.20% 10,620 4.32% 10,432
12.11% 14,090 12.31% 14,168 17.20% 16,099
13.02% 18,444 10.54% 16,505 12.86% 18,317
13.11% 21,321 9.98% 17,947 11.44% 19,456
-2.72% 9,728 0.67% 10,067 4.32% 10,432
15.51% 15,412 17.23% 16,110 17.20% 16,099
15.47% 20,534 14.35% 19,556 12.86% 18,317
13.45% 21,762 12.18% 20,299 11.52% 19,579
-7.83% 9,217 0.67% 10,067 4.32% 10,432
12.49% 14,233 17.23% 16,110 17.20% 16,099
13.89% 19,166 14.35% 19,556 12.86% 18,317
11.98% 20,078 12.18% 20,299 11.52% 19,579Edelweiss Liquid FundScheme -
Direct PlanBenchmark
(Nifty Liquid Fund Index)
Additional Benchmark(CRISIL 1 year T-bill Index)
Period
Returns* Returns*Value of
Rs. 10000 Invested
Value of Rs. 10000 Invested
Returns*Value of
Rs. 10000 Invested
Last 7 days@
Last 15 days@
Last 30 days@
1 Year
3 Year
5 Year
Since Inception - Direct Plan
6.95% 10,013 7.09% 10,014 2.96% 10,006
6.92% 10,028 6.29% 10,026 5.05% 10,021
7.00% 10,058 6.72% 10,055 9.03% 10,074
7.61% 10,761 7.43% 10,743 7.48% 10,748
7.04% 12,266 7.06% 12,272 6.79% 12,177
7.65% 14,462 7.64% 14,451 7.41% 14,296
7.96% 16,032 7.92% 15,998 7.15% 15,302
31
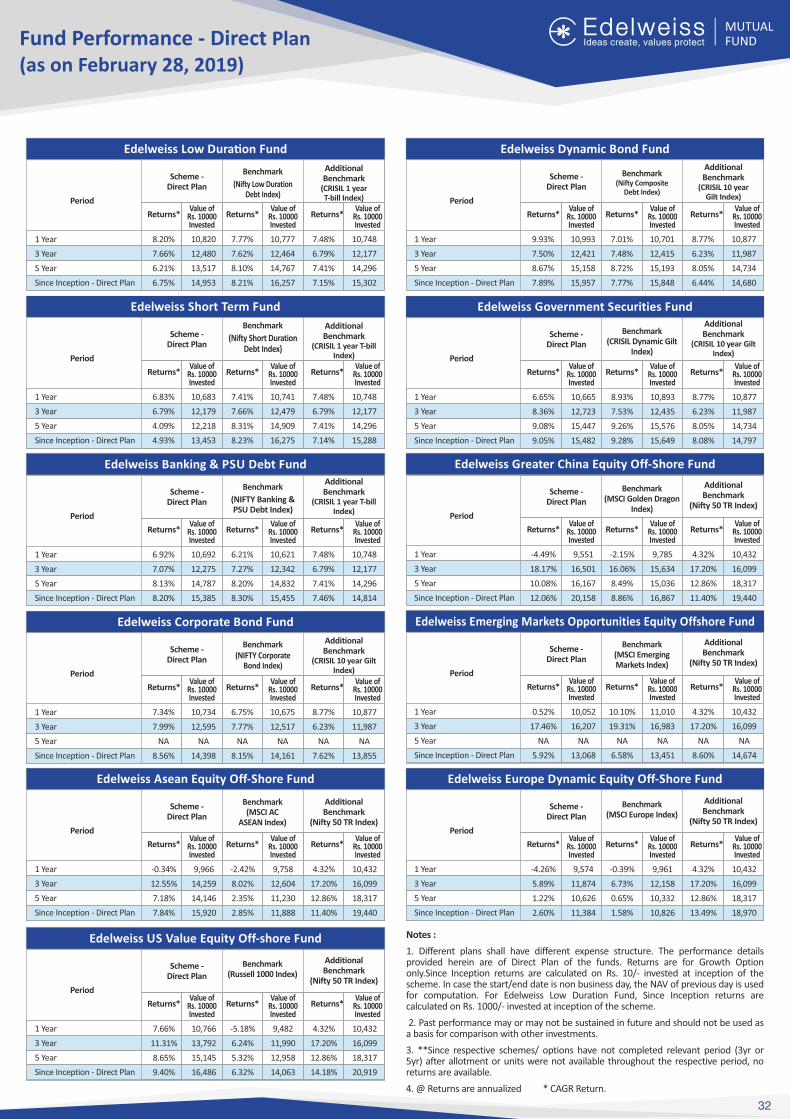
Edelweiss Low Dura�on Fund
Scheme - Direct Plan
Benchmark Additional Benchmark
(CRISIL 1 year T-bill Index)Period
1 Year
3 Year
5 Year
Since Inception - Direct Plan
Returns* Returns*Value of
Rs. 10000 Invested
Value of Rs. 10000 Invested
Returns*Value of
Rs. 10000 Invested
(Nifty Low Duration Debt Index)
8.20% 10,820 7.77% 10,777 7.48% 10,748
7.66% 12,480 7.62% 12,464 6.79% 12,177
6.21% 13,517 8.10% 14,767 7.41% 14,296
6.75% 14,953 8.21% 16,257 7.15% 15,302
Edelweiss Short Term Fund
Scheme - Direct Plan
Benchmark Additional Benchmark
(CRISIL 1 year T-bill Index)Period
1 Year
3 Year
5 Year
Since Inception - Direct Plan
Returns* Returns*Value of
Rs. 10000 Invested
Value of Rs. 10000 Invested
Returns*Value of
Rs. 10000 Invested
(Nifty Short Duration Debt Index)
6.83% 10,683 7.41% 10,741 7.48% 10,748
6.79% 12,179 7.66% 12,479 6.79% 12,177
4.09% 12,218 8.31% 14,909 7.41% 14,296
4.93% 13,453 8.23% 16,275 7.14% 15,288
Edelweiss Banking & PSU Debt Fund
Scheme - Direct Plan
BenchmarkAdditional Benchmark
(CRISIL 1 year T-bill Index)
Period
1 Year
3 Year
5 Year
Since Inception - Direct Plan
Returns* Returns*Value of
Rs. 10000 Invested
Value of Rs. 10000 Invested
Returns*Value of
Rs. 10000 Invested
(NIFTY Banking & PSU Debt Index)
6.92% 10,692 6.21% 10,621 7.48% 10,748
7.07% 12,275 7.27% 12,342 6.79% 12,177
8.13% 14,787 8.20% 14,832 7.41% 14,296
8.20% 15,385 8.30% 15,455 7.46% 14,814
Edelweiss Corporate Bond Fund
Scheme - Direct Plan
Benchmark Additional Benchmark
(CRISIL 10 year Gilt Index)Period
1 Year
3 Year
5 Year
Since Inception - Direct Plan
Returns* Returns*Value of
Rs. 10000 Invested
Value of Rs. 10000 Invested
Returns*Value of
Rs. 10000 Invested
(NIFTY Corporate Bond Index)
7.34% 10,734 6.75% 10,675 8.77% 10,877
7.99% 12,595 7.77% 12,517 6.23% 11,987
NA NA NA NA NA NA
8.56% 14,398 8.15% 14,161 7.62% 13,855
Edelweiss Government Securities Fund
Scheme - Direct Plan
Benchmark(CRISIL Dynamic Gilt
Index)
Additional Benchmark
(CRISIL 10 year Gilt Index)
Period
1 Year
3 Year
5 Year
Since Inception - Direct Plan
Returns* Returns*Value of
Rs. 10000 Invested
Value of Rs. 10000 Invested
Returns*Value of
Rs. 10000 Invested
6.65% 10,665 8.93% 10,893 8.77% 10,877
8.36% 12,723 7.53% 12,435 6.23% 11,987
9.08% 15,447 9.26% 15,576 8.05% 14,734
9.05% 15,482 9.28% 15,649 8.08% 14,797
Fund Performance - Direct Plan (as on February 28, 2019)
Notes :
1. Different plans shall have different expense structure. The performance details provided herein are of Direct Plan of the funds. Returns are for Growth Option only.Since Inception returns are calculated on Rs. 10/- invested at inception of the scheme. In case the start/end date is non business day, the NAV of previous day is used for computation. For Edelweiss Low Duration Fund, Since Inception returns are calculated on Rs. 1000/- invested at inception of the scheme.
2. Past performance may or may not be sustained in future and should not be used as a basis for comparison with other investments.
3. **Since respective schemes/ options have not completed relevant period (3yr or 5yr) after allotment or units were not available throughout the respective period, no returns are available.
4. @ Returns are annualized * CAGR Return.
Edelweiss Dynamic Bond Fund
Scheme - Direct Plan
Benchmark(Nifty Composite
Debt Index)
Additional Benchmark
(CRISIL 10 year Gilt Index)Period
1 Year
3 Year
5 Year
Since Inception - Direct Plan
Returns* Returns*Value of
Rs. 10000 Invested
Value of Rs. 10000 Invested
Returns*Value of
Rs. 10000 Invested
9.93% 10,993 7.01% 10,701 8.77% 10,877
7.50% 12,421 7.48% 12,415 6.23% 11,987
8.67% 15,158 8.72% 15,193 8.05% 14,734
7.89% 15,957 7.77% 15,848 6.44% 14,680
Edelweiss Greater China Equity Off-Shore Fund
Scheme - Direct Plan
Benchmark(MSCI Golden Dragon
Index)
Additional Benchmark
(Nifty 50 TR Index)Period
1 Year
3 Year
5 Year
Since Inception - Direct Plan
Returns* Returns*Value of
Rs. 10000 Invested
Value of Rs. 10000 Invested
Returns*Value of
Rs. 10000 Invested
-4.49% 9,551 -2.15% 9,785 4.32% 10,432
18.17% 16,501 16.06% 15,634 17.20% 16,099
10.08% 16,167 8.49% 15,036 12.86% 18,317
12.06% 20,158 8.86% 16,867 11.40% 19,440
Edelweiss Emerging Markets Opportunities Equity Offshore Fund
Scheme - Direct Plan
Benchmark(MSCI Emerging Markets Index)
Additional Benchmark
(Nifty 50 TR Index)Period
1 Year
3 Year
5 Year
Since Inception - Direct Plan
Returns* Returns*Value of
Rs. 10000 Invested
Value of Rs. 10000 Invested
Returns*Value of
Rs. 10000 Invested
0.52% 10,052 10.10% 11,010 4.32% 10,432
17.46% 16,207 19.31% 16,983 17.20% 16,099
NA NA NA NA NA NA
5.92% 13,068 6.58% 13,451 8.60% 14,674
Edelweiss Europe Dynamic Equity Off-Shore Fund
Scheme - Direct Plan
Benchmark(MSCI Europe Index)
Additional Benchmark
(Nifty 50 TR Index)Period
1 Year
3 Year
5 Year
Since Inception - Direct Plan
Returns* Returns*Value of
Rs. 10000 Invested
Value of Rs. 10000 Invested
Returns*Value of
Rs. 10000 Invested
-4.26% 9,574 -0.39% 9,961 4.32% 10,432
5.89% 11,874 6.73% 12,158 17.20% 16,099
1.22% 10,626 0.65% 10,332 12.86% 18,317
2.60% 11,384 1.58% 10,826 13.49% 18,970
Edelweiss Asean Equity Off-Shore Fund
Scheme - Direct Plan
Benchmark(MSCI AC
ASEAN Index)
Additional Benchmark
(Nifty 50 TR Index)Period
1 Year
3 Year
5 Year
Since Inception - Direct Plan
Returns* Returns*Value of
Rs. 10000 Invested
Value of Rs. 10000 Invested
Returns*Value of
Rs. 10000 Invested
-0.34% 9,966 -2.42% 9,758 4.32% 10,432
12.55% 14,259 8.02% 12,604 17.20% 16,099
7.18% 14,146 2.35% 11,230 12.86% 18,317
7.84% 15,920 2.85% 11,888 11.40% 19,440
32
Edelweiss US Value Equity Off-shore Fund
Scheme - Direct Plan
Benchmark(Russell 1000 Index)
Additional Benchmark
(Nifty 50 TR Index)Period
1 Year
3 Year
5 Year
Since Inception - Direct Plan
Returns* Returns*Value of
Rs. 10000 Invested
Value of Rs. 10000 Invested
Returns*Value of
Rs. 10000 Invested
7.66% 10,766 -5.18% 9,482 4.32% 10,432
11.31% 13,792 6.24% 11,990 17.20% 16,099
8.65% 15,145 5.32% 12,958 12.86% 18,317
9.40% 16,486 6.32% 14,063 14.18% 20,919
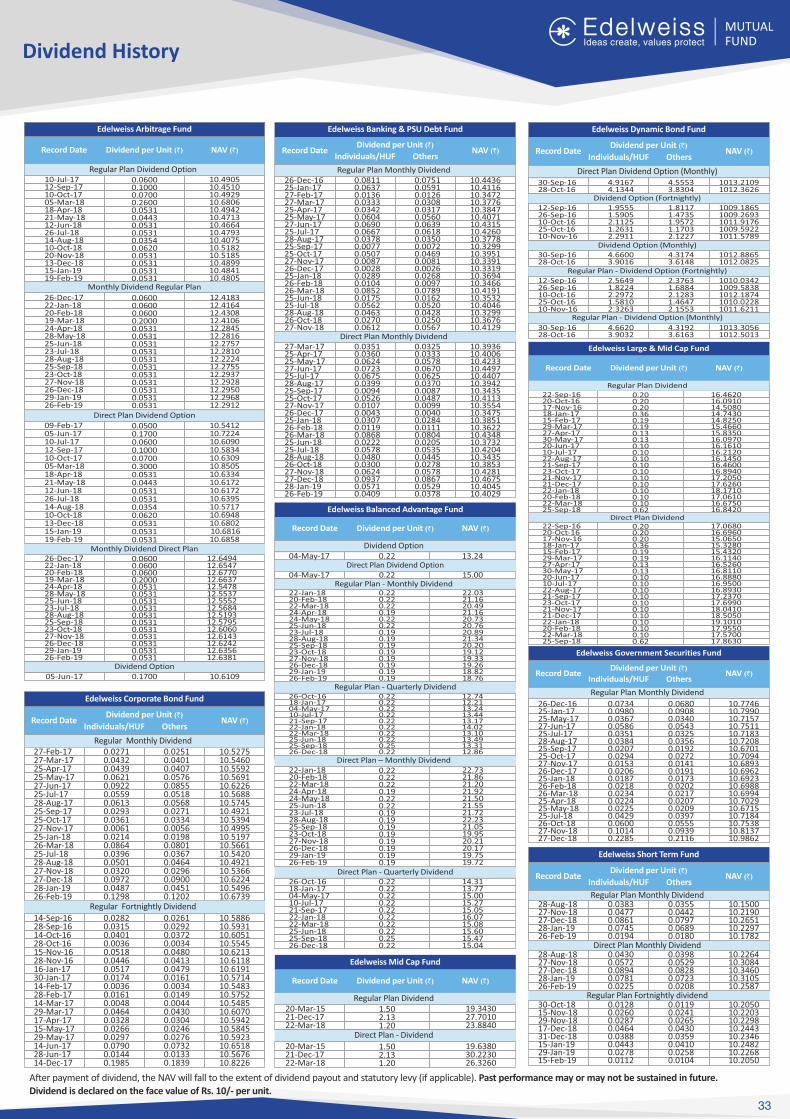
Dividend History
33
After payment of dividend, the NAV will fall to the extent of dividend payout and statutory levy (if applicable). Past performance may or may not be sustained in future.Dividend is declared on the face value of Rs. 10/- per unit.
Direct Plan - Quarterly Dividend 26-Oct-1618-Jan-1704-May-1710-Jul-1721-Sep-1722-Jan-1822-Mar-1825-Jun-1825-Sep-1826-Dec-18
0.220.220.220.220.220.220.220.220.250.22
14.3113.7715.0015.2715.0516.0715.0815.6015.4715.04
Edelweiss Dynamic Bond Fund
Direct Plan Dividend Option (Monthly)
Record Date NAV (`)Dividend per Unit (`)
Individuals/HUF Others
Record Date NAV (`)Dividend per Unit (`)
04-May-17 0.22 15.00Direct Plan Dividend Option
Dividend Option04-May-17 0.22 13.24
Regular Plan - Monthly Dividend
Edelweiss Arbitrage Fund
Regular Plan Dividend Option
Monthly Dividend Regular Plan
Direct Plan Dividend Option
Monthly Dividend Direct Plan
Dividend Option05-Jun-17 10.6109
Edelweiss Balanced Advantage FundDirect Plan Dividend
Regular Plan Dividend
Edelweiss Large & Mid Cap Fund
Record Date NAV (`)Dividend per Unit (`)
0.1700
Edelweiss Banking & PSU Debt Fund
Regular Plan Monthly Dividend
Record Date NAV (`)Dividend per Unit (`)
Individuals/HUF Others
Direct Plan Monthly Dividend
Record Date NAV (`)Dividend per Unit (`)
Edelweiss Government Securities Fund
Regular Plan Monthly Dividend
Record Date NAV (`)Dividend per Unit (`)
Individuals/HUF Others
Dividend Option (Fortnightly)
Dividend Option (Monthly)
Regular Plan - Dividend Option (Fortnightly)
Regular Plan - Dividend Option (Monthly)
Edelweiss Corporate Bond Fund
Regular Monthly Dividend
Record Date NAV (`)Dividend per Unit (`)
Individuals/HUF Others
Regular Fortnightly Dividend
10.393610.400610.423310.449710.440710.394210.343510.411310.355410.347510.385110.362210.434810.373210.420410.343510.385310.428110.4675
10.404510.4029
0.03250.03330.05780.06700.06250.03700.00870.04870.00990.00400.02840.01110.08040.02050.05350.04450.02780.05780.0867
0.0529 0.0378
0.03510.03600.06240.07230.06750.03990.00940.05260.01070.00430.03070.01190.08680.02220.05780.04800.03000.06240.0937
0.0571 0.0409
27-Mar-1725-Apr-1725-May-1727-Jun-1725-Jul-1728-Aug-1725-Sep-1725-Oct-1727-Nov-1726-Dec-1725-Jan-1826-Feb-1826-Mar-1825-Jun-1825-Jul-1828-Aug-1826-Oct-1827-Nov-1827-Dec-1828-Jan-1926-Feb-19
Direct Plan – Monthly Dividend
22-Sep-1620-Oct-1617-Nov-1618-Jan-1715-Feb-1729-Mar-1727-Apr-1730-May-1720-Jun-1710-Jul-1722-Aug-1721-Sep-1723-Oct-1721-Nov-1721-Dec-1722-Jan-1820-Feb-1822-Mar-1825-Sep-18
0.200.200.200.360.190.190.130.130.100.100.100.100.100.100.100.100.100.100.62
16.462016.091014.508014.743014.825015.466015.835016.097016.161016.212016.145016.460016.894017.205017.626018.171017.061016.675016.8420
Regular Plan - Quarterly Dividend
Edelweiss Mid Cap Fund
Direct Plan - Dividend
Regular Plan Dividend
Record Date NAV (`)Dividend per Unit (`)
10.588610.593110.605110.554510.621310.611810.619110.571410.548310.575210.548510.607010.594210.584510.592310.651810.567610.8226
0.02610.02920.03720.00340.04800.04130.04790.01610.00340.01490.00440.04300.03040.02460.02760.07320.01330.1839
0.02820.03150.04010.00360.05180.04460.05170.01740.00360.01610.00480.04640.03280.02660.02970.07900.01440.1985
14-Sep-1628-Sep-1614-Oct-1628-Oct-1615-Nov-1628-Nov-1616-Jan-1730-Jan-1714-Feb-1728-Feb-1714-Mar-1729-Mar-1717-Apr-1715-May-1729-May-1714-Jun-1728-Jun-1714-Dec-17
22-Sep-1620-Oct-1617-Nov-1618-Jan-1715-Feb-1729-Mar-1727-Apr-1730-May-1720-Jun-1710-Jul-1722-Aug-1721-Sep-1723-Oct-1721-Nov-1721-Dec-1722-Jan-1820-Feb-1822-Mar-1825-Sep-18
0.200.200.200.360.190.190.130.130.100.100.100.100.100.100.100.100.100.100.62
17.068016.696015.065015.328015.432016.114016.526016.811016.888016.950016.893017.237017.699018.041018.505019.101017.955017.570017.8630
22-Jan-1820-Feb-1822-Mar-1824-Apr-1824-May-1825-Jun-1823-Jul-1828-Aug-1825-Sep-1823-Oct-1827-Nov-1826-Dec-1829-Jan-1926-Feb-19
0.220.220.220.190.220.220.190.190.190.190.190.190.19 0.19
22.7321.8621.2021.9221.5021.5521.7222.2321.0519.9520.2120.1719.75 19.72
10.774610.799010.715710.751110.718310.720810.670110.709410.689310.696210.692310.698810.699410.702910.671510.718410.753810.813710.9862
0.06800.09080.03400.05430.03250.03560.01920.02720.01410.01910.01730.02020.02170.02070.02090.03970.05550.09390.2116
0.07340.09800.03670.05860.03510.03840.02070.02940.01530.02060.01870.02180.02340.02240.02250.04290.06000.10140.2285
26-Dec-1625-Jan-1725-May-1727-Jun-1725-Jul-1728-Aug-1725-Sep-1725-Oct-1727-Nov-1726-Dec-1725-Jan-1826-Feb-1826-Mar-1825-Apr-1825-May-1825-Jul-1826-Oct-1827-Nov-1827-Dec-18
10-Jul-1712-Sep-1710-Oct-1705-Mar-1818-Apr-1821-May-1812-Jun-1826-Jul-1814-Aug-1810-Oct-1820-Nov-1813-Dec-1815-Jan-1919-Feb-19
0.06000.10000.07000.26000.05310.04430.05310.05310.03540.06200.05310.05310.0531 0.0531
10.490510.451010.492910.680610.494210.471310.466410.479310.407510.518210.518510.4899
10.4841 10.4805
0.05000.17000.06000.10000.07000.30000.05310.04430.05310.05310.03540.06200.05310.0531 0.0531
10.541210.722410.609010.583410.630910.850510.633410.617210.617210.639510.571710.694810.6802 10.6816 10.6858
09-Feb-1705-Jun-1710-Jul-1712-Sep-1710-Oct-1705-Mar-1818-Apr-1821-May-1812-Jun-1826-Jul-1814-Aug-1810-Oct-1813-Dec-1815-Jan-1919-Feb-19
26-Dec-1722-Jan-1820-Feb-1819-Mar-1824-Apr-1828-May-1825-Jun-1823-Jul-1828-Aug-1825-Sep-1823-Oct-1827-Nov-1826-Dec-1829-Jan-1926-Feb-19
0.06000.06000.06000.20000.05310.05310.05310.05310.05310.05310.05310.05310.05310.0531 0.0531
12.418312.416412.430812.410612.284512.281612.275712.281012.222412.275512.293712.292812.2950
12.2968 12.2912
26-Dec-1722-Jan-1820-Feb-1819-Mar-1824-Apr-1828-May-1825-Jun-1823-Jul-1828-Aug-1825-Sep-1823-Oct-1827-Nov-1826-Dec-1829-Jan-1926-Feb-19
0.06000.06000.06000.20000.05310.05310.05310.05310.05310.05310.05310.05310.05310.0531 0.0531
12.649412.654712.677012.663712.547812.553712.555212.568412.519312.579512.606012.614312.624212.6356 12.6381
0.220.220.220.190.220.220.190.190.190.190.190.190.19 0.19
22.0321.1620.4921.1620.7320.7620.8921.3420.2019.1219.3319.26
18.82 18.76
26-Oct-1618-Jan-1704-May-1710-Jul-1721-Sep-1722-Jan-1822-Mar-1825-Jun-1825-Sep-1826-Dec-18
0.220.220.220.220.220.220.220.220.250.22
12.7412.2113.2413.4413.1714.0213.1013.4913.3112.86
10.443610.411610.347210.377610.384710.407110.431510.426010.377810.329910.395110.339110.331910.369410.346610.419110.353210.404610.329910.367610.4129
0.07510.05910.01260.03080.03170.05600.06390.06180.03500.00720.04690.00810.00260.02680.00970.07890.01620.05200.04280.02500.0567
0.08110.06370.01360.03330.03420.06040.06900.06670.03780.00770.05070.00870.00280.02890.01040.08520.01750.05620.04630.02700.0612
26-Dec-1625-Jan-1727-Feb-1727-Mar-1725-Apr-1725-May-1727-Jun-1725-Jul-1728-Aug-1725-Sep-1725-Oct-1727-Nov-1726-Dec-1725-Jan-1826-Feb-1826-Mar-1825-Jun-1825-Jul-1828-Aug-1826-Oct-1827-Nov-18
1009.18651009.26931011.91761009.59221011.5789
1.81171.47351.95721.17032.1227
1.95551.59052.11251.26312.2911
12-Sep-1626-Sep-1610-Oct-1625-Oct-1610-Nov-16
1010.03421009.58381012.18741010.02281011.6211
2.37631.68842.12831.46472.1553
2.56491.82242.29721.58102.3263
12-Sep-1626-Sep-1610-Oct-1625-Oct-1610-Nov-16
Edelweiss Short Term Fund
Regular Plan Monthly Dividend
Record Date NAV (`)Dividend per Unit (`)
Individuals/HUF Others
Direct Plan Monthly Dividend
Regular Plan Fortnightly dividend
10.527510.546010.559210.569110.622610.568810.574510.492110.539410.499510.519710.566110.542010.492110.536610.6224
10.5496 10.6739
0.02510.04010.04070.05760.08550.05180.05680.02710.03340.00560.01980.08010.03670.04640.02960.0900
0.0451 0.1202
0.02710.04320.04390.06210.09220.05590.06130.02930.03610.00610.02140.08640.03960.05010.03200.0972
0.0487 0.1298
27-Feb-1727-Mar-1725-Apr-1725-May-1727-Jun-1725-Jul-1728-Aug-1725-Sep-1725-Oct-1727-Nov-1725-Jan-1826-Mar-1825-Jul-1828-Aug-1827-Nov-1827-Dec-1828-Jan-1926-Feb-19
20-Mar-1521-Dec-17 22-Mar-18
1.502.131.20
19.343027.7010 23.8840
20-Mar-1521-Dec-17 22-Mar-18
1.502.131.20
19.638030.2230 26.3260
22-Jan-1820-Feb-1822-Mar-1824-Apr-1824-May-1825-Jun-1823-Jul-1828-Aug-1825-Sep-1823-Oct-1827-Nov-1826-Dec-1829-Jan-1926-Feb-19
1013.21091012.3626
4.55533.8304
4.91674.1344
30-Sep-1628-Oct-16
4.31743.6148
4.66003.9016
30-Sep-1628-Oct-16
1012.88651012.0825
1013.30561012.5013
4.31923.6163
4.66203.9032
30-Sep-1628-Oct-16
10.205010.220310.229810.244310.2346
10.2482 10.2268
10.2050
30-Oct-1815-Nov-1829-Nov-1817-Dec-1831-Dec-1815-Jan-1929-Jan-1915-Feb-19
0.01190.02410.02650.04300.0359
0.0410 0.0258
0.0104
0.01280.02600.02870.04640.0388
0.0443 0.0278
0.0112
10.150010.219010.2651
10.2297 10.1782
0.03550.04420.0797
0.0689 0.0180
0.03830.04770.0861
0.0745 0.0194
28-Aug-1827-Nov-1827-Dec-1828-Jan-1926-Feb-19
10.226410.308410.3460
10.3105 10.2587
0.03980.05290.0828
0.0723 0.0208
0.04300.05720.0894
0.0781 0.0225
28-Aug-1827-Nov-1827-Dec-1828-Jan-1926-Feb-19
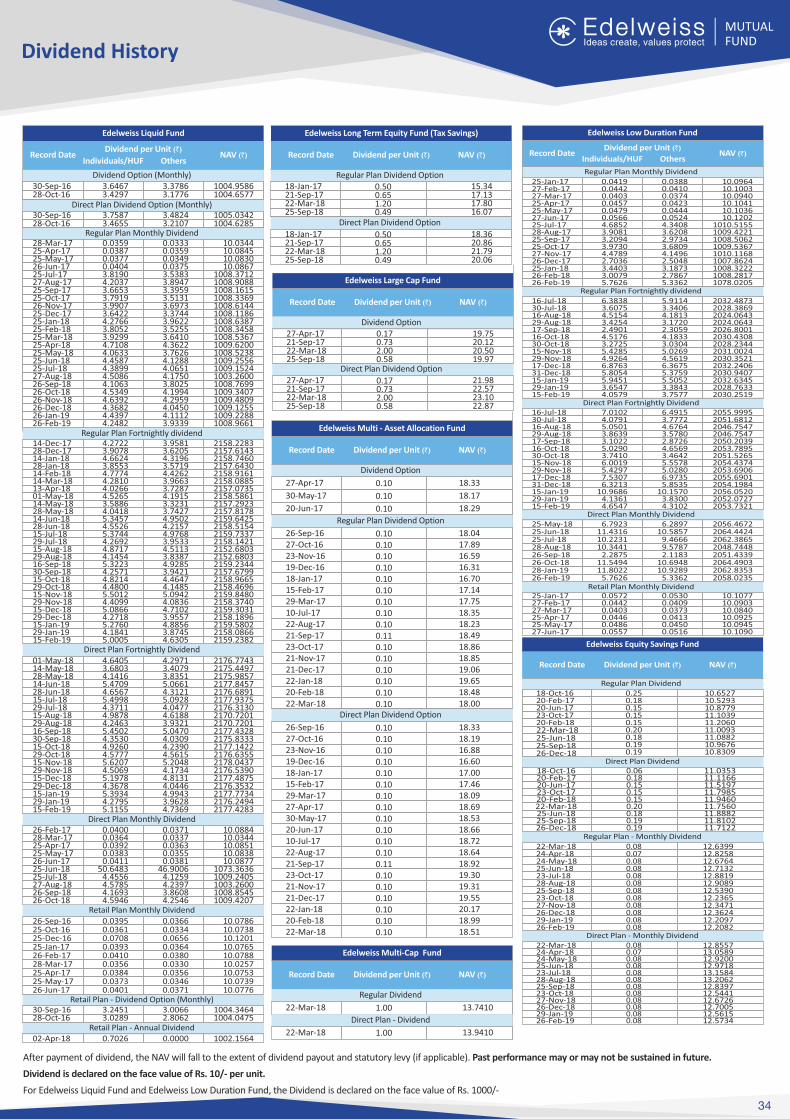
Dividend History
After payment of dividend, the NAV will fall to the extent of dividend payout and statutory levy (if applicable). Past performance may or may not be sustained in future.
Dividend is declared on the face value of Rs. 10/- per unit.
For Edelweiss Liquid Fund and Edelweiss Low Duration Fund, the Dividend is declared on the face value of Rs. 1000/-
34
Retail Plan Monthly Dividend10.107710.090310.084010.092510.094510.1090
0.05300.04090.03730.04130.04500.0516
0.05720.04420.04030.04460.04860.0557
25-Jan-1727-Feb-1727-Mar-1725-Apr-1725-May-1727-Jun-17
Direct Plan Fortnightly Dividend
Direct Plan Monthly Dividend
Edelweiss Long Term Equity Fund (Tax Savings)
Direct Plan Dividend Option
Regular Plan Dividend Option
Record Date NAV (`)Dividend per Unit (`)
Edelweiss Liquid Fund
Record Date NAV (`)Dividend per Unit (`)
Individuals/HUF Others
Regular Plan Fortnightly dividend
Direct Plan Dividend Option (Monthly)
Dividend Option (Monthly)
Direct Plan Monthly Dividend
Retail Plan Monthly Dividend
Retail Plan - Dividend Option (Monthly)
Regular Plan Monthly Dividend
Edelweiss Multi - Asset Allocation Fund
Dividend Option
27-Apr-17
30-May-17
20-Jun-17
0.10
0.10
0.10
18.33
18.17
18.29
Regular Plan Dividend Option
Direct Plan Dividend Option
Record Date NAV (`)Dividend per Unit (`)
Edelweiss Low Duration Fund
Regular Plan Monthly Dividend
Record Date NAV (`)Dividend per Unit (`)
Individuals/HUF Others
Edelweiss Large Cap Fund
Direct Plan Dividend Option
Dividend Option
Record Date NAV (`)Dividend per Unit (`)
Direct Plan Fortnightly Dividend
Regular Plan Fortnightly dividend
Edelweiss Multi-Cap Fund
Regular Dividend
22-Mar-18 1.00 13.7410
Record Date NAV (`)Dividend per Unit (`)
Direct Plan - Dividend
22-Mar-18 1.00 13.9410
2176.77432175.44972175.98572177.84572176.68912177.93752176.31302170.72012170.72012177.43282175.83332177.14222176.63552178.04372176.53902177.48752176.35322177.77342176.24942177.4283
4.29713.40793.83515.06614.31215.09284.04774.61883.93215.04704.03094.23904.56155.20484.17344.81314.0446
4.9943 3.9628
4.7369
4.64053.68034.14165.47094.65675.49984.37114.98784.24635.45024.35304.92604.57775.62074.50695.19784.3678
5.3934 4.2795
5.1155
01-May-1814-May-1828-May-1814-Jun-1828-Jun-1815-Jul-1829-Jul-1815-Aug-1829-Aug-1816-Sep-1830-Sep-1815-Oct-1829-Oct-1815-Nov-1829-Nov-1815-Dec-1829-Dec-1815-Jan-1929-Jan-1915-Feb-19
Retail Plan - Annual Dividend1002.15640.00000.702602-Apr-18
10.088410.034410.085110.083810.0877
1073.36361009.24051003.26001008.85451009.4207
0.03710.03370.03630.03550.0381
46.90064.12594.23973.86084.2546
0.04000.03640.03920.03830.0411
50.64834.45564.57854.16934.5946
26-Feb-1728-Mar-1725-Apr-1725-May-1726-Jun-1725-Jun-1825-Jul-1827-Aug-1826-Sep-1826-Oct-18
Edelweiss Equity Savings Fund
Regular Plan Dividend
Record Date NAV (`)Dividend per Unit (`)
Direct Plan Dividend
Regular Plan - Monthly Dividend
Direct Plan - Monthly Dividend
26-Sep-1627-Oct-1623-Nov-1619-Dec-1618-Jan-1715-Feb-1729-Mar-1727-Apr-1730-May-1720-Jun-1710-Jul-1722-Aug-1721-Sep-1723-Oct-1721-Nov-1721-Dec-1722-Jan-1820-Feb-1822-Mar-18
0.100.100.100.100.100.100.100.100.100.100.100.100.110.100.100.100.100.100.10
18.3318.1916.8816.6017.0017.4618.0918.6918.5318.6618.7218.6418.9219.3019.3119.5520.1718.9918.51
26-Sep-1627-Oct-1623-Nov-1619-Dec-1618-Jan-1715-Feb-1729-Mar-1710-Jul-1722-Aug-1721-Sep-1723-Oct-1721-Nov-1721-Dec-1722-Jan-1820-Feb-1822-Mar-18
0.100.100.100.100.100.100.100.100.100.110.100.100.100.100.100.10
18.0417.8916.5916.3116.7017.1417.7518.3518.2318.4918.8618.8519.0619.6518.4818.00
22-Mar-1824-Apr-1824-May-1825-Jun-1823-Jul-1828-Aug-1825-Sep-1823-Oct-1827-Nov-1826-Dec-1829-Jan-1926-Feb-19
0.080.070.080.080.080.080.080.080.080.080.08 0.08
12.639912.825812.676412.713212.881912.908912.539012.236512.347112.362412.2097 12.2082
10.034410.084510.083010.0867
1008.37121008.90881008.16151008.33691008.61441008.11861008.63871008.34581008.53671009.62001008.52381009.25561009.15241003.26001008.76991009.34071009.48091009.12551009.22881008.9661
0.03330.03590.03490.03753.53833.89473.39593.51313.69733.37443.96223.52553.64104.36223.76264.12884.06514.17503.80254.19944.29594.0450
4.1112 3.9339
0.03590.03870.03770.04043.81904.20373.66533.79193.99073.64224.27663.80523.92994.71084.06334.45874.38994.50864.10634.53494.63924.3682
4.4397 4.2482
28-Mar-1725-Apr-1725-May-1726-Jun-1725-Jul-1727-Aug-1725-Sep-1725-Oct-1726-Nov-1725-Dec-1725-Jan-1825-Feb-1825-Mar-1825-Apr-1825-May-1825-Jun-1825-Jul-1827-Aug-1826-Sep-1826-Oct-1826-Nov-1826-Dec-1826-Jan-1926-Feb-19
2158.22832157.61432158.74602157.64302158.91612158.08852157.07352158.58612157.29232157.81782159.64252158.51542159.73372158.14212152.68032152.68032159.23442157.67992158.96652158.46962159.84802158.37402159.30312158.18962159.58022158.08662159.2382
3.95813.62054.31963.57194.42623.96633.72874.19153.32313.74274.95024.21574.97683.95334.51133.83874.92853.94214.46474.14855.09424.08364.71023.9557
4.8856 3.8745
4.6305
4.27223.90784.66243.85534.77744.28104.02664.52653.58864.04185.34574.55265.37444.26924.87174.14545.32234.25714.82144.48005.50124.40995.08664.2718
5.2760 4.1841
5.0005
14-Dec-1728-Dec-1714-Jan-1828-Jan-1814-Feb-1814-Mar-1813-Apr-1801-May-1814-May-1828-May-1814-Jun-1828-Jun-1815-Jul-1829-Jul-1815-Aug-1829-Aug-1816-Sep-1830-Sep-1815-Oct-1829-Oct-1815-Nov-1829-Nov-1815-Dec-1829-Dec-1815-Jan-1929-Jan-1915-Feb-19
10.096410.100310.094010.104110.103610.1202
1010.51551009.42211008.50621009.53671010.11681007.86241008.32221008.28171078.0205
0.03880.04100.03740.04230.04440.05244.34083.62082.97343.68094.14962.50483.18732.78675.3362
0.04190.04420.04030.04570.04790.05664.68523.90813.20943.97304.47892.70363.44033.00795.7626
25-Jan-1727-Feb-1727-Mar-1725-Apr-1725-May-1727-Jun-1725-Jul-1728-Aug-1725-Sep-1725-Oct-1727-Nov-1726-Dec-1725-Jan-1826-Feb-1826-Feb-19
2032.48732028.38692024.06432024.06432026.80012030.43082028.23442031.00242030.35212032.24062030.94072032.63452028.76332030.2519
5.91143.34064.18133.17202.30594.18333.03045.02694.56196.36755.3759
5.5052 3.3843
3.7577
6.38383.60754.51543.42542.49014.51763.27255.42854.92646.87635.8054
5.9451 3.6547
4.0579
16-Jul-1830-Jul-1816-Aug-1829-Aug-1817-Sep-1816-Oct-1830-Oct-1815-Nov-1829-Nov-1817-Dec-1831-Dec-1815-Jan-1929-Jan-1915-Feb-19
2055.99952051.68122046.75472046.75472050.20392053.78952051.52652054.43742053.69062055.69012054.19842056.05202052.07272053.7321
6.49153.77724.67643.57802.87264.65693.46425.55785.02806.97355.8535
10.1570 3.8300
4.3102
7.01024.07915.05013.86393.10225.02903.74106.00195.42977.53076.3213
10.9686 4.1361
4.6547
16-Jul-1830-Jul-1816-Aug-1829-Aug-1817-Sep-1816-Oct-1830-Oct-1815-Nov-1829-Nov-1817-Dec-1831-Dec-1815-Jan-1929-Jan-1915-Feb-19
2056.46722064.44242062.38652048.74482051.43392064.49032062.83532058.0235
6.289710.5857
9.46669.57872.1183
10.6948 10.9289
5.3362
6.792311.431610.223110.3441
2.287511.5494
11.80225.7626
25-May-1825-Jun-1825-Jul-1828-Aug-1826-Sep-1826-Oct-1828-Jan-1926-Feb-19
22-Mar-1824-Apr-1824-May-1825-Jun-1823-Jul-1828-Aug-1825-Sep-1823-Oct-1827-Nov-1826-Dec-1829-Jan-1926-Feb-19
12.855713.058912.920012.971813.158413.206212.839712.544112.672612.700512.5615 12.5734
0.080.070.080.080.080.080.080.080.080.080.08 0.08
10.078610.073810.120110.076510.078810.025710.075310.073910.0776
0.03660.03340.06560.03640.03800.03300.03560.03460.0371
0.03950.03610.07080.03930.04100.03560.03840.03730.0401
26-Sep-1625-Oct-1625-Dec-1625-Jan-1726-Feb-1728-Mar-1725-Apr-1725-May-1726-Jun-17
0.250.180.150.150.150.200.180.190.19
10.652710.529310.877911.103911.206011.009311.088210.967610.8309
18-Oct-1620-Feb-1720-Jun-1723-Oct-1720-Feb-1822-Mar-1825-Jun-1825-Sep-1826-Dec-18
0.060.180.150.150.150.200.180.190.19
11.035311.116611.519711.798511.946011.756011.888211.810211.7122
18-Oct-1620-Feb-1720-Jun-1723-Oct-1720-Feb-1822-Mar-1825-Jun-1825-Sep-1826-Dec-18
27-Apr-1721-Sep-1722-Mar-1825-Sep-18
0.170.732.000.58
19.7520.1220.5019.97
27-Apr-1721-Sep-1722-Mar-1825-Sep-18
0.170.732.000.58
21.9822.5723.1022.87
1004.95861004.6577
3.37863.1776
3.64673.4297
30-Sep-1628-Oct-16
1005.03421004.6285
3.48243.2107
3.75873.4655
30-Sep-1628-Oct-16
1004.34641004.0475
3.00662.8062
3.24513.0289
30-Sep-1628-Oct-16
18-Jan-1721-Sep-1722-Mar-1825-Sep-18
0.500.651.200.49
15.3417.1317.8016.07
18-Jan-1721-Sep-1722-Mar-1825-Sep-18
0.500.651.200.49
18.3620.8621.7920.06
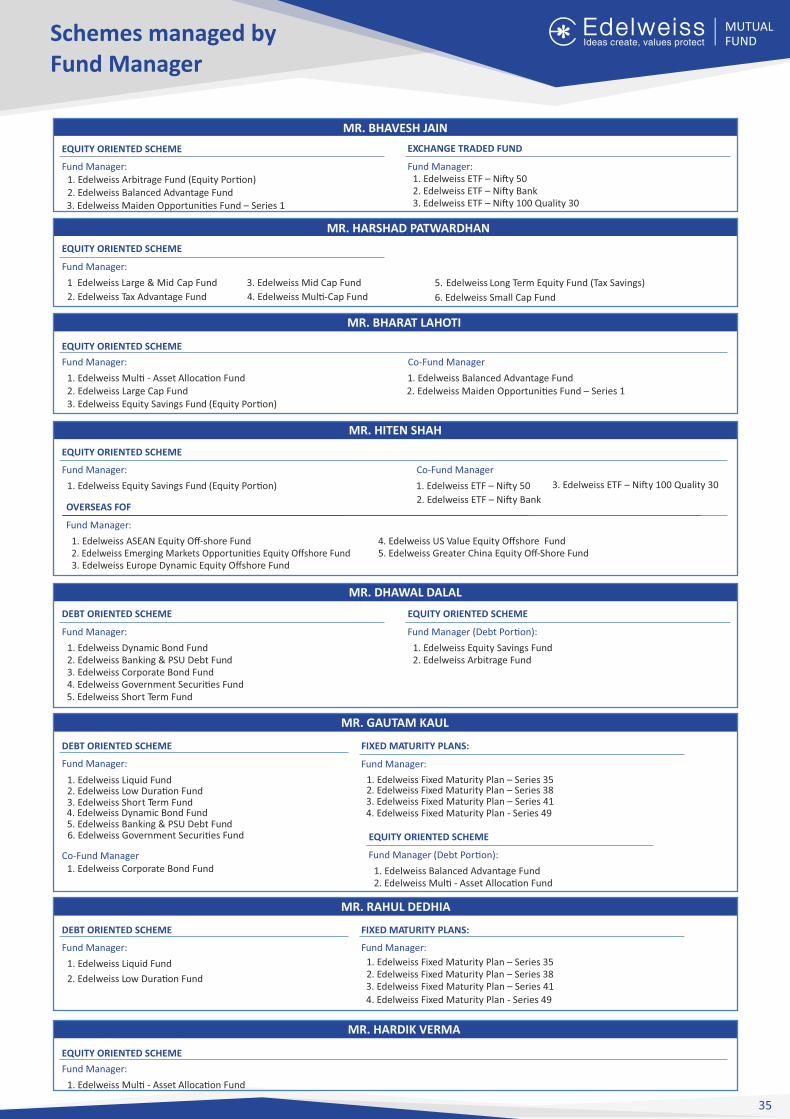
35
MR. BHAVESH JAIN
EQUITY ORIENTED SCHEME
Fund Manager:1. Edelweiss Arbitrage Fund (Equity Por�on)
. E2 delweiss Balanced Advantage Fund3. Edelweiss Maiden Opportuni�es Fund – Series 1
Fund Manager:1. Edelweiss ETF – Ni�y 502. Edelweiss ETF – Ni�y Bank3. Edelweiss ETF – Ni�y 100 Quality 30
EXCHANGE TRADED FUND
Schemes managed by Fund Manager
Fund Manager:
1. Edelweiss Mul� - Asset Alloca�on Fund2. Edelweiss Large Cap Fund3. Edelweiss Equity Savings Fund (Equity Por�on)
MR. BHARAT LAHOTI
EQUITY ORIENTED SCHEME
Co-Fund Manager
1 delweiss Balanced Advantage Fund. E2. Edelweiss Maiden Opportuni�es Fund – Series 1
Fund Manager:
1. Edelweiss Dynamic Bond Fund2. Edelweiss Banking & PSU Debt Fund3. Edelweiss Corporate Bond Fund4. Edelweiss Government Securi�es Fund
Fund Manager (Debt Por�on):
1. Edelweiss Equity Savings Fund2. Edelweiss Arbitrage Fund
DEBT ORIENTED SCHEME
MR. DHAWAL DALAL
EQUITY ORIENTED SCHEME
MR. HITEN SHAH
EQUITY ORIENTED SCHEME
Co-Fund Manager
1. Edelweiss ETF – Ni�y 50
2. Edelweiss ETF – Ni�y Bank
3. Edelweiss ETF – Ni�y 100 Quality 30
Fund Manager:
1. Edelweiss Equity Savings Fund (Equity Por�on)
Fund Manager:
1. Edelweiss Liquid Fund2. Edelweiss Low Dura�on Fund3. Edelweiss Short Term Fund
DEBT ORIENTED SCHEME
MR. GAUTAM KAUL
FIXED MATURITY PLANS:
Fund Manager:
1. Edelweiss Fixed Maturity Plan – Series 352. Edelweiss Fixed Maturity Plan – Series 383. Edelweiss Fixed Maturity Plan – Series 41
Co-Fund Manager1. Edelweiss Corporate Bond Fund
OVERSEAS FOF
Fund Manager:
1. Edelweiss ASEAN Equity Off-shore Fund2. Edelweiss Emerging Markets Opportuni�es Equity Offshore Fund
MR. HARSHAD PATWARDHAN
EQUITY ORIENTED SCHEME
Fund Manager:
1 Edelweiss Large & Mid Cap Fund
2. Edelweiss Tax Advantage Fund
3. Edelweiss Mid Cap Fund
4. Edelweiss Mul�-Cap Fund
5. Edelweiss Long Term Equity Fund (Tax Savings)
6. Edelweiss Small Cap Fund
Fund Manager:
1. Edelweiss Liquid Fund
2. Edelweiss Low Dura�on Fund
DEBT ORIENTED SCHEME
MR. RAHUL DEDHIA
FIXED MATURITY PLANS:
Fund Manager:
1. Edelweiss Fixed Maturity Plan – Series 352. Edelweiss Fixed Maturity Plan – Series 383. Edelweiss Fixed Maturity Plan – Series 41
5. Edelweiss Short Term Fund
4. Edelweiss Dynamic Bond Fund5. Edelweiss Banking & PSU Debt Fund6. Edelweiss Government Securi�es Fund
Fund Manager (Debt Por�on):
1. Edelweiss Balanced Advantage Fund2. Edelweiss Mul� - Asset Alloca�on Fund
EQUITY ORIENTED SCHEME
4. Edelweiss US Value Equity Offshore Fund5. Edelweiss Greater China Equity Off-Shore Fund
3. Edelweiss Europe Dynamic Equity Offshore Fund
4. Edelweiss Fixed Maturity Plan - Series 49
4. Edelweiss Fixed Maturity Plan - Series 49
Fund Manager:
1. Edelweiss Mul� - Asset Alloca�on Fund
MR. HARDIK VERMA
EQUITY ORIENTED SCHEME
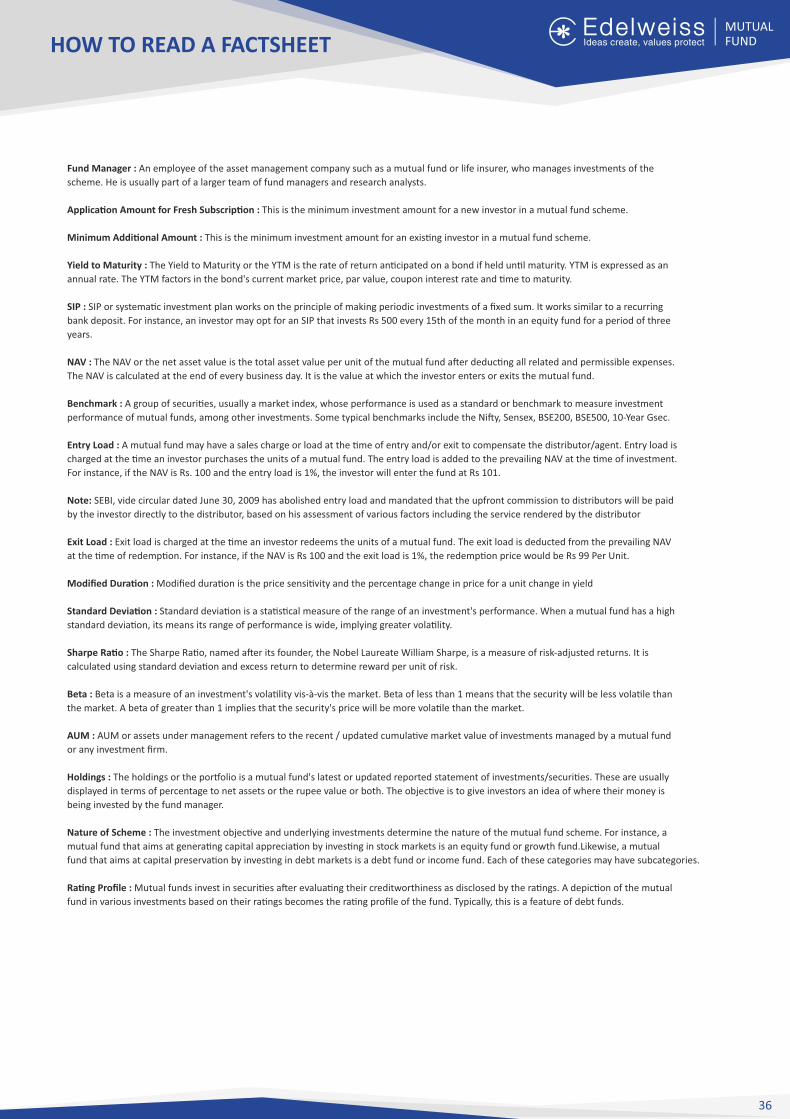
HOW TO READ A FACTSHEET
Fund Manager : An employee of the asset management company such as a mutual fund or life insurer, who manages investments of the
scheme. He is usually part of a larger team of fund managers and research analysts.
Applica�on Amount for Fresh Subscrip�on : This is the minimum investment amount for a new investor in a mutual fund scheme.
Minimum Addi�onal Amount : This is the minimum investment amount for an exis�ng investor in a mutual fund scheme.
Yield to Maturity : The Yield to Maturity or the YTM is the rate of return an�cipated on a bond if held un�l maturity. YTM is expressed as an
annual rate. The YTM factors in the bond's current market price, par value, coupon interest rate and �me to maturity.
SIP : SIP or systema�c investment plan works on the principle of making periodic investments of a fixed sum. It works similar to a recurring
bank deposit. For instance, an investor may opt for an SIP that invests Rs 500 every 15th of the month in an equity fund for a period of three
years.
NAV : The NAV or the net asset value is the total asset value per unit of the mutual fund a�er deduc�ng all related and permissible expenses.
The NAV is calculated at the end of every business day. It is the value at which the investor enters or exits the mutual fund.
Benchmark : A group of securi�es, usually a market index, whose performance is used as a standard or benchmark to measure investment
performance of mutual funds, among other investments. Some typical benchmarks include the Ni�y, Sensex, BSE200, BSE500, 10-Year Gsec.
Entry Load : A mutual fund may have a sales charge or load at the �me of entry and/or exit to compensate the distributor/agent. Entry load is
charged at the �me an investor purchases the units of a mutual fund. The entry load is added to the prevailing NAV at the �me of investment.
For instance, if the NAV is Rs. 100 and the entry load is 1%, the investor will enter the fund at Rs 101.
Note: SEBI, vide circular dated June 30, 2009 has abolished entry load and mandated that the upfront commission to distributors will be paid
by the investor directly to the distributor, based on his assessment of various factors including the service rendered by the distributor
Exit Load : Exit load is charged at the �me an investor redeems the units of a mutual fund. The exit load is deducted from the prevailing NAV
at the �me of redemp�on. For instance, if the NAV is Rs 100 and the exit load is 1%, the redemp�on price would be Rs 99 Per Unit.
Modified Dura�on : Modified dura�on is the price sensi�vity and the percentage change in price for a unit change in yield
Standard Devia�on : Standard devia�on is a sta�s�cal measure of the range of an investment's performance. When a mutual fund has a high
standard devia�on, its means its range of performance is wide, implying greater vola�lity.
Sharpe Ra�o : The Sharpe Ra�o, named a�er its founder, the Nobel Laureate William Sharpe, is a measure of risk-adjusted returns. It is
calculated using standard devia�on and excess return to determine reward per unit of risk.
Beta : Beta is a measure of an investment's vola�lity vis-à-vis the market. Beta of less than 1 means that the security will be less vola�le than
the market. A beta of greater than 1 implies that the security's price will be more vola�le than the market.
AUM : AUM or assets under management refers to the recent / updated cumula�ve market value of investments managed by a mutual fund
or any investment firm.
Holdings : The holdings or the por�olio is a mutual fund's latest or updated reported statement of investments/securi�es. These are usually
displayed in terms of percentage to net assets or the rupee value or both. The objec�ve is to give investors an idea of where their money is
being invested by the fund manager.
Nature of Scheme : The investment objec�ve and underlying investments determine the nature of the mutual fund scheme. For instance, a
mutual fund that aims at genera�ng capital apprecia�on by inves�ng in stock markets is an equity fund or growth fund.Likewise, a mutual
fund that aims at capital preserva�on by inves�ng in debt markets is a debt fund or income fund. Each of these categories may have subcategories.
Ra�ng Profile : Mutual funds invest in securi�es a�er evalua�ng their creditworthiness as disclosed by the ra�ngs. A depic�on of the mutual
fund in various investments based on their ra�ngs becomes the ra�ng profile of the fund. Typically, this is a feature of debt funds.
36

Notes
37
EDELWEISS ASSET MANAGEMENT LIMITED - ISC / OPAAhmedabad : Ground Floor, Madhusudan House, Opp. Shail Building, Near Girish Cold Drink Cross Road, Off CG Road, Navrangpura, Ahmedabad - 380 009. Tel No. : 079 26461040/ 26461070Bengaluru : Unit No. 912, 9th floor, Prestige Meridian-1, No.20 , M.G Road, Bengaluru -560001 Karnataka. Tel No. : 080-69001508Chandigarh : B-106 B, 1st Floor, Elante Offices, Plot 178-178A, Industrial Area 1, Chandigarh - 160002. Tel No.: 0172-4949801 / 0172-4949802Chennai : 2nd floor, Sheriff Towers, G. N. Chetty Road, T. Nagar, Chennai - 600017. Tamil Nadu Tel No.: 044 40164707, 044 40164708Hyderabad : Teetos Business Centre, Shree Prashanti Sai Towers, Plot No. 68, M No. 8-2-248, Room No. 309, Nagarjuna Hills, Road No. 1, Banjara Hills, Hyderabad 500082. Mobile: 8297033388 Landline: 040-66778788/89 Extn: 309Indore : 312-313, D.M. Tower, Third Floor, Race Course Road, Indore, Madhya Pradesh - 452001. Tel No. : 0731 6701522Kolkata : Savitri Tower, 2nd Floor, 3A Upper Wood Street, Kolkata - 700017. Tel No. : 033 - 4421 8800Lucknow : Cabin No. 102, A Small Store Trade Point, Ground Floor, Saran Chamber-1, 5-Park Road, Hazratgunj, Lucknow - 226001. Tel No. : 0522-4070679Mumbai : 801, 802 & 803, 8th Floor, Windsor, Off C.S.T. Road, Kalina, Santacruz (E), Mumbai - 400098, Maharashtra. Tel No. : 022 4093 3400 / 4097 9821New Delhi : 104, 5th Floor, Mercantile House, 15 Kasturba Gandhi Marg, New Delhi - 110 001. Tel No. : 011-43571105Pune : Sunit Capital, 4th Floor, 402, B-50 , Vetalbaba Chowk, Above Mahalaxmi Maruti, Showroom, Senapati Bapat Road, Shivajinagar, Pune - 411016. Ph no. : +91 9028058348
KARVY FINTECH PRIVATE LIMITED - ISC / OPAUNIT : Edelweiss Mutual Fund, Karvy Selenium Tower B, Plot No 31 & 32, Gachibowli, Financial, District, Nanakramguda, Serilingampally , Hyderabad � 500 008 Tel: 040-67161500Agra : 1st Floor, Deepak Wasan Plaza, Behind Holiday Inn, Sanjay Place, Agra - 282002. Tel.: 8899928346 Ahmedabad : 201/202 Shail Complex, Opp. Madhusudan House, B/H Girish Cold Drink, Off C G Road, Navrangpura, Ahmedabad - 380006. Tel.: 079-65445550, 079-26402967 • Ajmer : 302, 3rd Floor, Ajmer Auto Building, Opposite City Power House, Jaipur Road, Ajmer - 305001. Tel.: 0145-5120725 • Aligarh : 1st Floor, Kumar Plaza, Ramghat Road, Aligarh - 202001. Tel.: 8899928347 • Allahabad : Rsa Towers, 2nd Floor, Above Sony Tv Showroom, 57, S P Marg, Civil Lines, Allahabad - 211001. Tel.: 8081127728 • Alwar : 101, Saurabh Tower, Opp. Uit, Near Bhagat Singh Circle, Road No. 2, Alwar 301001. • Ambala : 6349, Nicholson Road, Adjacent Kos Hospitalambala Cant, Ambala - 133001. Tel.: 9541721382 • Amritsar : 72-A, Taylor'S Road, Opp Aga Heritage Club, Amritsar - 143001. Tel.: 0183-5053802 • Anand : B-42 Vaibhav Commercial Center, Nr TVS Down Town Show Room, Grid Char Rasta, Anand - 380001. Tel.: 9662020623 • Ankleshwar : L/2 Keval Shopping Center, Old National Highway, Ankleshwar, Ankleshwar - 393002. Tel.: 02646 645326 • Asansol : 114/71 G T Road, Near Sony Centre, Bhanga Pachil, Asansol - 713303. Tel.: 9332095447 • Aurangabad : Ramkunj Niwas, Railway Station Road, Near Osmanpura Circle, Aurangabad - 431005. Tel.: 0240-2343414 • Balasore : M.S Das Street, Gopalgaon, Balasore, Orissa, Balasore - 756001. Tel.: 06782-260503 • Bangalore : 59, Skanda puttanna Road, Basavanagudi, Bangalore - 560004. Tel.: 080-26602852 • Bareilly : 1st Floor, 165, Civil Lines, opp. Hotel Bareilly Palace, Near Railway Station, Bareilly - 243001. Tel.: 8899928348 • Baroda : 203, Corner point, Jetalpur Road, Gujarat, Baroda - 390007. Tel.: 0265-2353506 • Begusarai : Near Hotel Diamond Surbhi Complex, O.C Township Gate, Kapasiya Chowk, Begusarai - 851117. Tel.: 7857015101 • Belgaum : Cts No. 3939/ A2 A1, Above Raymonds Showroom, Beside Harsha Appliances, Club Road, Belgaum - 590001. Tel.: 0831 2402544 • Berhampur (Or) : Divya Nandan Kalyan Mandap, 3rd Lane Dharam Nagar, Near Lohiya Motor, Berhampur (Or) - 760001. Tel.: 0680-2228106 • Bhagalpur : 2nd Floor, Chandralok Complex, Ghantaghar, Radha Rani Sinha Road, Bhagalpur - 812001. Tel.: 7857015102 • Bharuch : Shop No 147-148, Aditya Complex, Near Kasak Circle, Bharuch - 392001. Tel.: 02642-229022 • Bhavnagar : Krushna Darshan Complex, Parimal Chowk, Office No. 306-307, 3rd Floor, Above Jed Blue Show Room, Bhavnagar - 364002. Tel.: 278-3003149 � Bhilai : Shop No -1, First Floor Plot No -1, Commercial Complex, Nehru Nagar - East, Bhilai - 490020. Tel.: 0788-2295999 / 2295332 � Bhopal : Kay Kay Business Centre, 133, Zone I, MP Nagar, Above City Bank, Bhopal - 462011. Tel.: 0755-4092712,0755-4092715 • Bhubaneswar : A/181 , Back Side of Shivam Honda Show Room, Saheed Nagar, Bhubaneswar - 751007. Tel.: 0674-6534585 • Bokaro : B-1, 1st Floor, City Centre, Sector- 4, Near Sona Chandi Jwellars, Bokaro - 827004. Tel.: 9204061959 • Borivali : Gomati Smuti,Ground Floor, Jambli Gully, Near Railway Station, Borivali, Mumbai - 400 092. Tel - 022- 28916319 • Burdwan : 63 GT Road, Halder Complex 1st Floor, Burdwan - 713101. Tel.: 0342-2665140 • Calicut : First floor, Savithri Building, Opp. Fathima Hospital, Bank road, Calicut - 673001. Tel.: 0495-4022480 • Chandigarh : Sco-2423-2424, Above Mirchi Restaurant, New Aroma Hotel, First Floor, Sector 22-C, Chandigarh - 160022. Tel.: 0172-5101342 • Chennai : F-11, Akshaya Plaza, 1st Floor, 108, Adhithanar Salai, Egmore, Opp to Chief Metropolitan Court, Chennai - 600002. Tel.: 044-42028512 • Cochin : Ali Arcade, 1st Floor, Kizhavana Road, Panampilly Nagar, Near Atlantis Junction, Ernakualm - 682036. Tel.: 0484 3000231 / 32 • Coimbatore : 3rd Floor, Jaya Enclave, 1057 Avinashi Road, Coimbatore - 641018. Tel.: 0422 - 4388011 • Cuttack : Opp. Dargha Bazar Police station, Dargha Bazar, Po - Buxi Bazar, Cuttack - 753001. Tel.: 0-9238102118 (Tata Basephone) • Dehradun : Kaulagarh Road, Near Sirmaur Margabove, Reliance Webworld, Dehradun - 248001. Tel.: 8899928349 / 8899928350 • Dhanbad : 208 New Market, 2nd Floor, Bank More, Dhanbad - 826001. Tel.: 0326-6452027 • Dharwad : 307/9-A 1st Floor, Nagarkar Colony, Elite Business Center, Nagarkar Colony, P B Road, Dharwad - 580001. Tel.: 0836- 2744207 • Durgapur : MWAV-16 Bengal Ambuja, 2nd Floor City Centre, Distt. Burdwan, Durgapur - 713216. Tel.: 0343-6512111 • Erode : No: 4, Veerappan Traders Complex, KMY Salai, Sathy Road, Opp. Erode Bus Stand, Erode - 638003. Tel.: 0424-4021212 • Faridabad : A-2B, 3rd Floor, Neelam Bata Road, Peer ki Mazar, Nehru Groundnit, Faridabad - 121001. Tel.: 8287922816 • Gandhidham : Shop # 12, Shree Ambica Arcade, Plot # 300, Ward 12, Opp. CG High School, Near HDFC Bank, Gandhidham - 370201. Tel.: 02836 651296 • Gaya : 54 Lal Kothi Compound, Shree Krishna Road, 2nd Floor, North Side, Near Royal Surya Hotel, Gaya - 823001. Tel - 0631-2220065 • Ghaziabad : 1st Floor C-7, Lohia Nagar, Ghaziabad - 201001. Tel.: 8287059970 • Gorakhpur : Above V.I.P. House Ajdacent, A.D. Girls College, Bank Road, Gorakhpur - 273001. Tel.: 8081127735 • Guntur : D No 6-10-27, Srinilayam, Arundelpet, 10/1, Guntur - 522002. Tel.: 0863-2339094 • Gurgaon : Shop No. 18, Ground Floor, Sector - 14, Opp. Akd Tower, Near Huda Office, Gurgaon - 122001. Tel.: 8287956344 • Guwahati : 1st Floor, Bajrangbali Building, Near Bora Service Station, GS Road, Guwahati - 781007. Tel.: 8811036746 • Gwalior : 2nd Floor, Rajeev Plaza, Jayendra Ganj, Lashkar, Gwalior - 474009. Tel.: 9907342201 • Haldwani : Above Kapilaz, Sweet House, Opp LIC Building, Pilikothi, Kaladhungi Road, Haldwani - 263139. Tel.: 8899928351 • Hissar : SCO 71, 1st Floor, Red Square Market, Hissar - 125001. Tel.: 9541721383 • Hubli : CTC No.483/A1/A2, Ground Floor, Shri Ram Palza, Behind Kotak Mahindra Bank, Club Road, Hubli - 580029. Tel.: 0836-2252444 • Hyderabad : Karvy House, No:46, 8-2-609/K, Avenue 4, Street No. 1, Banjara Hills, Hyderabad - 500034. Tel.: 040-44857874 / 75/ 76 • Hyderabad (Gachibowli) : Karvy Selenium, Plot No: 31 & 32, Tower B, Survey No. 115/22, 115/24, 115/25, Financial District, Gachibowli, Nanakramguda, Serilimgampally Mandal, Hyderabad - 500032. Tel.: 040-33215122 • Indore : 2nd floor, 203-205 Balaji Corporate House, Above ICICI bank, 19/1 New Palasia, Near Curewell Hospital, Janjeerwala Square Indore, Indore - 452001. Tel.: 0731-4266828/4218902 • Jabalpur : 3rd floor, R.R. Tower, 5, Lajpatkunj, Near Tayabali Petrol Pump, Jabalpur - 482001. Tel.: 0761-4923301 • Jaipur : S16/A IIIrd Floor, Land Mark Building, Opp. Jai Club, Mahaver Marg, C Scheme, Jaipur - 302001. Tel.: 01414167715/17 • Jalandhar : 1st Floor, Shanti Towers, SCO No. 37, PUDA Complex, , Opposite Tehsil Complex, Jalandhar - 144001. Tel.: 0181-5094410 • Jalgaon : 269, Jaee Vishwa, 1st Floor, Baliram Peth, Above United Bank of India, Near Kishor Agencies, Jalgaon - 425001. Tel.: 9421521406 • Jalpaiguri : D B C Road, Opp Nirala Hotel, Opp. Nirala Hotel, Opp. Nirala Hotel, Jalpaiguri - 735101. Tel.: 03561-222136 • Jammu : Gupta's Tower, 2nd Floor, CB-12, Rail Head Complex, Jammu - 180012. Tel.: 0191-2470860 / 2458818 • Jamnagar : 136-137-138 Madhav Palaza, Opp SBI Bank, Nr. Lal Bunglow, Jamnagar - 361001. Tel.: 0288 3065810 • Jamshedpur : 2nd Floor, R. R. Square, SB Shop Area, Near Reliance Foot Print & Hotel- BS Park Plaza, Main Road, Bistupur, Jamshedpur - 831001. Tel.: 0657-6655003/ 6655004/ 6655005/ 6655006/ 6655007 • Jhansi : 371/01, Narayan Plaza, Gwalior Road, Near Jeevan Shah Chauraha, Jhansi - 284001. Tel.: 7851827396 • Jodhpur : 203, Modi Arcade, Chopasni Road, Jodhpur - 342001. Tel.: 0291-6454590 • Kanpur : 15/46, B, Ground Floor, Opp. Muir Mills, Civil Lines, Kanpur - 208001. Tel.: 8081127738 / 8081127740 • Karaikudi : No. 2, Gopi Arcade, 100 Feet Road, Karaikudi - 630001. Tel.: 04565-237192 • Karur : No.6, old No.1304, Thiru-vi-ka Road, Near G.R.Kalyan Maha, Karur - 639001. Tel.: 04324-241755 • Kharagpur : 180 Malancha Road, Beside Axis Bank Ltd, Kharagpur - 721304. Tel.: 03222-253380 • Kolhapur : 605/1/4 E Ward, Shahupuri, 2nd Lane, Laxmi Niwas, Near Sultane Chambers, Kolhapur - 416001. Tel.: 0231 2653656 • Kolkata : Apeejay House (Beside Park Hotel), C Block, 3rd Floor, 15 Park Street, Kolkata - 700016. Tel.: 033 66285900 • Kollam : Sree Vigneswara Bhavan, Shastri Junction, Kadapakada, Kollam � 691001. • Kota : Plot No. 259, 1st Floor, Shopping Centre, Lala Lajpat Rai Circle, Kota 324007. Tel.: 0744-5100964 • Kottayam : 1st Floor Csiascension Square, Railway Station Road, Collectorate P O, Kottayam - 686002. Tel.: 0481-2300868/2302420 • Lucknow : Ist Floor, A. A. Complex, 5 Park Road, Hazratganj, Thaper House, Lucknow - 226001. Tel.: 8081127722 • Ludhiana : Sco - 136 , 1st Floor, Above Airtel Showroom, Feroze Gandhi Market, Ludhiana - 141001. Tel.: 0161-4648747 • Madurai : Rakesh towers, 30-C, Ist floor, Bye pass Road, Opp. Nagappa motors, Madurai - 625010. Tel.: 0452-2605856 • Malda : Sahis Tuli, Under Ward No.6, No.1 Govt Colony, English Bazar Municipality, Malda - 732101. Tel.: 03512-223763 � Mangalore : Mahendra Arcade, Opp. Court Road, Karangal Padi, Mangalore - 575003. Tel.: 0824-2496289 • Margao : 2nd Floor, Dalal Commercial Complex, Pajifond, Margao - 403601. Tel.: 0832-2731823 • Mathura : Ambey Crown, 2nd Floor, In Front Of Bsa College, Gaushala Road, Mathura - 281001. Tel.: 8899928354 • Meerut : 1st Floor, Medi Centre, Opp Icici Bank, Hapur Road, Near Bachha Park, Meerut - 250002. Tel.: 8899928339 • Mehsana : Ul/47 Apollo Enclave, Opp. Simandhar Temple, Modhera Cross Road, Mehsana - 384002. Tel.: 02762-242950 • Moradabad : Om Arcade, Parker Road, Above Syndicate Bank, Chowk Tari Khana, Moradabad - 244001. Tel.: 8899328356 • Mumbai : 24/B, Raja Bahadur Compound, Ambalal Doshi Marg, Behind Bse Bldg, Fort - 400001. Tel.: 022-66235353 • Muzaffarpur : First Floor, Shukla Complex, Near ICICI Bank, Civil Court Branch, Company Bagh, Muzaffarpur - 842001. Tel.: 7857015105 • Mysore : L-350, Silver Tower, Ashoka Road, Opp. Clock Tower, Mysore - 570001. Tel.: 0821-2438006 • Nadiad : 104/105, Near Paras Cinema, City Point Nadiad, Nadiad - 387001. Tel.: 0268-2563245 • Nagercoil : 45, East Car Street, 1st Floor, Nagercoil - 629001. • Nagpur : Plot No 2/1 House No 102/1, Mata Mandir Road, Mangaldeep Appartment Opp Khandelwal Jewelers, Dharampeth, Nagpur - 440010. Tel.: 0712-2533040 • Nasik : F-1, Suyojit Sankul, Sharanpur Road, Near Rajiv Gandhi Bhavan, Nasik - 422002. Tel.: 0253-6611395 � Navsari : 103, 1st Floor, Landmark Mall, Near Sayaji Library, Navsari Gujarat - 396445. • New Delhi : 305 New Delhi House , 27 Barakhamba Road, New Delhi - 110001. Tel.: 011- 43681700 • Noida : 405,4th Floor, Vishal Chamber, Plot No.1, Sector-18, Noida - 201301. Mob - 8287831058. Panipat : JAVA Complex, 1st Floor, Above Vijaya Bank, G T Road, Panipat - 132103. Tel.: 9541721384 �• Panjim : Flat No.1-A, H. No. 13/70, Timotio Bldg, Heliodoro Salgado Road, Next to Navhind Bhavan (Market Area), Panjim - 403001. Tel.: 0832-2426873 • Patiala : Sco 27 D, Chotti Baradari, Near Car Bazaar, Patiala - 147001. Tel.: 0175-5004349 • Patna : 3A, 3rd Floor Anand Tower, Exhibition Road, Opp Icici Bank, Patna - 800001. Tel.: 0612-4323066 • Pondicherry : Building No:7, 1st Floor, Thiayagaraja Street, Pondicherry - 605001. Tel.: 0413 2220640 • Pune : Mozaic Bldg, CTS No.1216/1, Final, Plot No.576/1 TP, Scheme No.1, F C Road, Bhamburda, Shivaji Nagar, Pune - 411004. Tel.: 020-66496700 / 66496701 • Raipur : Shop No-TF-31, 3rd Floor, Millenium Plaza, Near Old Indian Coffee House, G E Road, Raipur - 492001. Tel.: 0771-4052620 • Rajahmundry : D.No.6-1-4, Rangachary Street, T.Nagar, Near Axis Bank Street, Rajahmundry - 533101. Tel.: 0883-2434469 • Rajkot : 302, Metro Plaza, Near Moti Tanki Chowky, Rajkot, Gujarat - 360001. Tel : 0281-6545888 • Ranchi : Room No 307 3rd Floor, Commerce Tower, Beside Mahabir Tower, Ranchi - 834001. Tel.: 0651-2331320 • Rohtak : 1st Floor, Ashoka Plaza, Delhi Road, Rohtak - 124001. Tel.: 9541721385 • Rourkela : 1st Floor, Sandhu Complex, Kachery Road, Uditnagar, Rourekla - 769012. Tel.: 0661-2500005 • Saharanpur : 18 Mission Market, Court Road, Saharanpur - 247001. Tel.: 8899928353 • Salem : NO 3/250, Brindavan Road, 6th Cross, Perumal kovil back side, Fairland's, Salem - 636016. Tel.: 0427-4020300 • Sambalpur : Koshal Builder Complex, Near Goal Bazaar Petrol pump, Sambalpur - 768001. Tel - 0663-2533437 • Secunderabad : Crystal Plaza, 2nd Floor, Manday Lane, Near Sunshine Hospital, P G Road, Secunderabad - 500 003, Tel.: 8985469607 • Shillong : Annex Mani Bhawan, Lower Thana Road, Near R K M Lp School, Shillong - 793001. Tel.: 0364 - 2506106 • Shimla : Triveni Building, By Pas Chowkkhallini, Shimla - 171002. Tel.: 8263860395 • Shimoga : Sri Matra Naika Complex, 1st Floor, Above Shimoga Diagnostic Centre, Llr Road, Durgigudi, Shimoga - 577201. Tel.: 08182-228799 • Silchar : N.N. Dutta Road, Chowchakra Complex, Premtala, Silchar - 788001. Tel.: 3842261714 • Siliguri : Nanak Complex, Sevoke Road, Siliguri - 734001. Tel.: 0353-2522579 • Surat : G-5 Empire State Buliding, Nr Udhna Darwaja, Ring Road, Surat - 395002. Tel.: 0261-2311100 / 2339100 • T Nagar : G1, Ground Floor, No 22, Vijayaraghava Road, Swathi Court, T Nagar, Chennai - 600 017. Tel.: 044 - 28151034 • Thane : Flat No. 201, 2nd Floor, "Matru Chhaya" Bldg., Above Regewal Jewelry Shop, Opp. Bedekar Hospital, Near Gaodevi Ground, Thane (West) - 400602. • Tirunelveli : 55/18, Jeney Building, S N Road, Near Aravind Eye Hospital, Tirunelveli - 627001. Tel.: 0462 2335137 • Tirupur : First floor, 244 A, Above Selvakumar Dept stores, Palladam Road, Opp to Cotton market complex, Tirupur - 641604. Tel.: 0421-2214221 • Trichur : 2nd Floor, Brothers Complex, Naikkanal Junction, Shornur Road, Near Dhanalakshmi Bank H O, Thrissur - 680001. Tel.: 0487- 6999987 • Trichy : 60, Sri Krishna Arcade, Thennur High Road, Trichy - 620017. Tel.: 0431-4020227 • Trivandrum : 2nd Floor, Akshaya Tower, Sasthamangalam, Trivandrum - 695010. Tel.: 0471 - 2725728 • Udaipur : 201-202, Madhav Chambers, Opp G P O , Chetak Circle , Udaipur - 313001. Tel.: 0294 2429370 • Valsad : Shop No 2 , Phiroza Corner, Opp. Next Show Room, Tithal Road, Valsad - 396001. Tel.: 02632-258481 • Vapi : Shop No-12, Ground Floor, Sheetal Appatment, Near K P Tower, Vapi - 396195. Tel.: 9228012909 • Varanasi : D-64/132, 1st Floor, Anant Complex, Sigra, Varanashi - 221010. Tel.: 8081127746 • Vashi : Shop no. 153 B, Ground Floor, Vashi Plaza, Sector-17, Near Apna Bazar, Vashi, Mumbai - 400705. Tel.: 022-27802684 • Vellore : 1, M N R Arcade, Officers Line, Krishna Nagar, Vellore - 632001. Tel - 0416 2215007 • Vijayawada : 39-10-7, Opp : Municipal Water Tank, Labbipet, Vijayawada - 520010. Tel.: 0866-6604032/39/40 • Vile Parle : V P Road, Opp: Railway Station, Above Axis Bank Atm, Vile Parle (west), Mumbai - 400 056. Tel.: 022-26100967 • Visakhapatnam : Door No: 48-8-7, Dwaraka Diamond, Ground Floor, Srinagar, Visakhapatnam - 530016. Tel.: 0891-2714125 • Warangal : 5-6-95, 1st Floor, Opp: B.Ed Collage, Lashkar Bazar, Chandra Complex, Hanmakonda, Warangal - 506001. Tel.: 0870-2501664
www.karvymfs.com - Website of Karvy Fintech Pvt. Ltd. would also be considered as an Official Point of Acceptance ("OPA") for all the Schemes of the AMC. The online transaction portal of MF Utilities India Private Limited ("MFUI") i.e www.mfuonline.com and the POS locations of MFUI will be in addition to the existing OPA of the AMC
Registered Office: Edelweiss House, Off. C.S.T Road, Kalina, Mumbai 400098Corporate Office: 801, 802 & 803, 8th Floor, Windsor, Off C.S.T. Road, Kalina, Santacruz (E), Mumbai 400098, MaharashtraWebsite: www.edelweissmf.com
INVESTOR SERVICE CENTERS (ISC) / OFFICIAL POINT OF ACCEPTANCE (OPA)

SMALL THINGSBIG IMPACT
Edelweiss Small Cap FundAn open ended scheme predominantly investing in small-cap stocks
Edelweiss Small-Cap Fund is suitable for investors who are seeking*:
Ÿ Long-term capital appreciation
Ÿ Investments predominantly in equity and equity related securities of small-cap companies
*Investors should consult their financial advisers if in doubt about whether the product is suitable for them.Investors understand that their
principal will be at high risk
Riskometer


![Edelweiss [1]](https://img.pdfslide.us/doc/110x75/577d29e11a28ab4e1ea8224e/edelweiss-1.jpg)