Embed Size (px)
Citation preview
1/34
Fiscal quarter ended December 2012
– supplementary financial summary –
February 5, 2013Asahi Kasei Corporation
2/34
ContentsConsolidated results for fiscal quarter ended Dec. 2012
Summary of financial results 4
Statements of income 5
Extraordinary income and loss 6
Balance sheets 7
Cash flows 8
Sales and operating income by segment
9–14
Forecast for fiscal year 2012
AppendixStatements of comprehensiveincome
20
Quarterly performance by segment
21–22
Overseas sales by segment 23
Overview of results by segment 24–33
Consolidated operating performance
16
Forecast by segment 17–18
3/34
Consolidated results for fiscal quarter ended Dec. 2012
Apr.–Dec.a b a/b
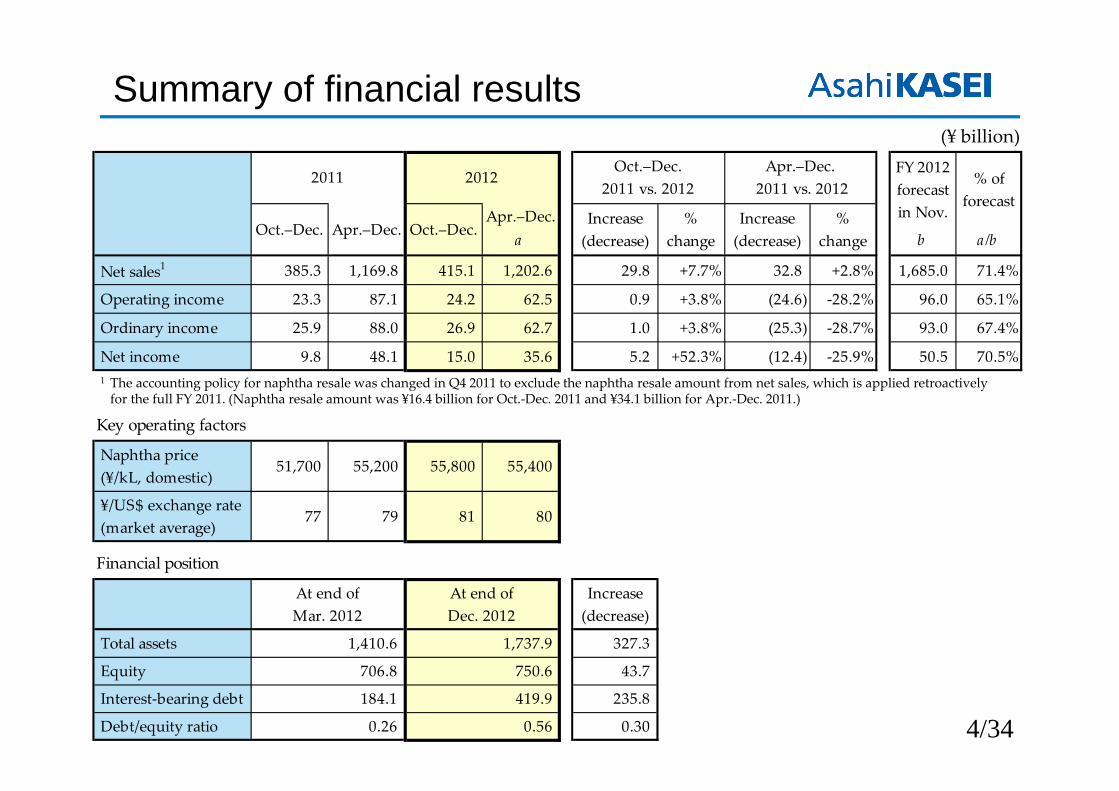
Net sales1 385.3 1,169.8 415.1 1,202.6 29.8 +7.7% 32.8 +2.8% 1,685.0 71.4%
Operating income 23.3 87.1 24.2 62.5 0.9 +3.8% (24.6) ‐28.2% 96.0 65.1%
Ordinary income 25.9 88.0 26.9 62.7 1.0 +3.8% (25.3) ‐28.7% 93.0 67.4%
Net income 9.8 48.1 15.0 35.6 5.2 +52.3% (12.4) ‐25.9% 50.5 70.5%
Key operating factors
Naphtha price (¥/kL, domestic)
51,700 55,200 55,800 55,400
¥/US$ exchange rate (market average)
77 79 81 80
Financial position
Total assets 1,410.6 1,737.9 327.3
Equity 706.8 750.6 43.7
Interest‐bearing debt 184.1 419.9 235.8
Debt/equity ratio 0.26 0.56 0.30
At end ofMar. 2012
At end ofDec. 2012
2011 2012
Oct.–Dec. Apr.–Dec. Oct.–Dec.
% offorecast
Increase(decrease)
Apr.–Dec. 2011 vs. 2012
Oct.–Dec.2011 vs. 2012
Increase(decrease)
%change
Increase(decrease)
FY 2012forecastin Nov.%
change
4/34
Summary of financial results(¥ billion)
1 The accounting policy for naphtha resale was changed in Q4 2011 to exclude the naphtha resale amount from net sales, which is applied retroactively for the full FY 2011. (Naphtha resale amount was ¥16.4 billion for Oct.‐Dec. 2011 and ¥34.1 billion for Apr.‐Dec. 2011.)
5/34
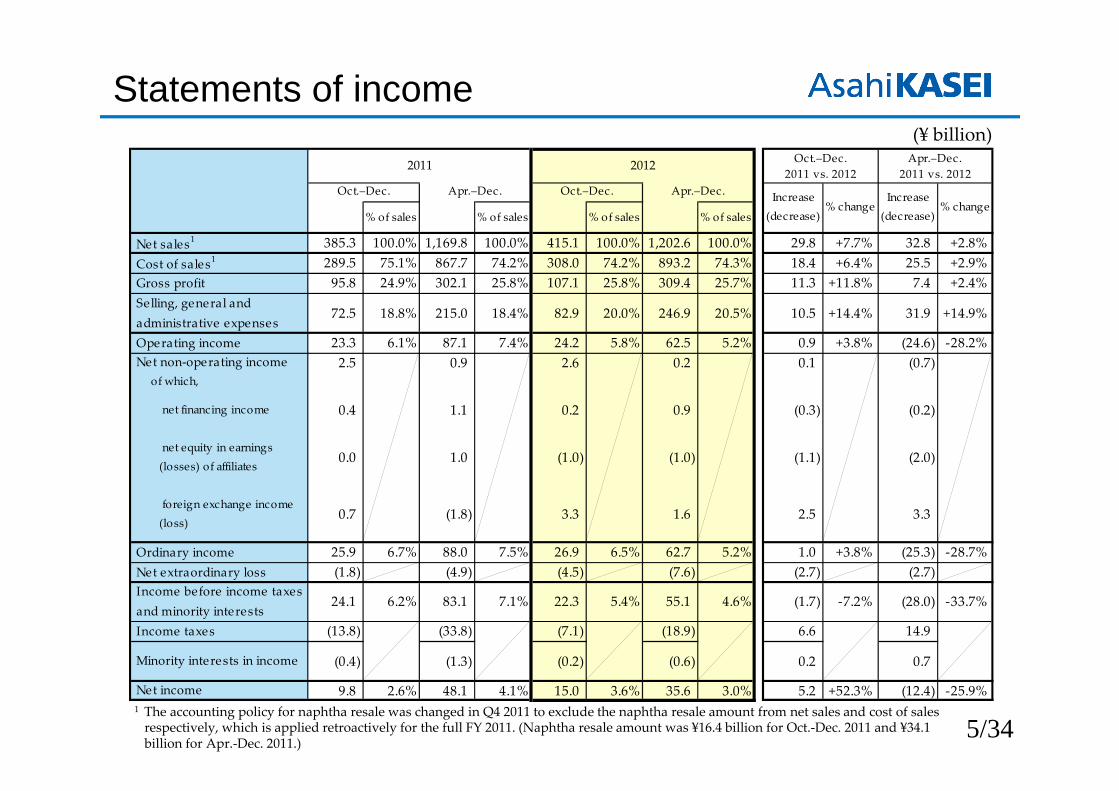
Statements of income(¥ billion)
% of sales % of sales % of sales % of sales
Net sales1 385.3 100.0% 1,169.8 100.0% 415.1 100.0% 1,202.6 100.0% 29.8 +7.7% 32.8 +2.8% Cost of sales1 289.5 75.1% 867.7 74.2% 308.0 74.2% 893.2 74.3% 18.4 +6.4% 25.5 +2.9% Gross profit 95.8 24.9% 302.1 25.8% 107.1 25.8% 309.4 25.7% 11.3 +11.8% 7.4 +2.4%
72.5 18.8% 215.0 18.4% 82.9 20.0% 246.9 20.5% 10.5 +14.4% 31.9 +14.9%
Operating income 23.3 6.1% 87.1 7.4% 24.2 5.8% 62.5 5.2% 0.9 +3.8% (24.6) ‐28.2% Net non‐operating income 2.5 0.9 2.6 0.2 0.1 (0.7)
of which,
net financing income 0.4 1.1 0.2 0.9 (0.3) (0.2)
net equity in earnings(losses) of affiliates
0.0 1.0 (1.0) (1.0) (1.1) (2.0)
foreign exchange income(loss)
0.7 (1.8) 3.3 1.6 2.5 3.3
Ordinary income 25.9 6.7% 88.0 7.5% 26.9 6.5% 62.7 5.2% 1.0 +3.8% (25.3) ‐28.7% Net extraordinary loss (1.8) (4.9) (4.5) (7.6) (2.7) (2.7)
24.1 6.2% 83.1 7.1% 22.3 5.4% 55.1 4.6% (1.7) ‐7.2% (28.0) ‐33.7%
Income taxes (13.8) (33.8) (7.1) (18.9) 6.6 14.9
(0.4) (1.3) (0.2) (0.6) 0.2 0.7
Net income 9.8 2.6% 48.1 4.1% 15.0 3.6% 35.6 3.0% 5.2 +52.3% (12.4) ‐25.9%
2011 20122011 vs. 2012 2011 vs. 2012
Income before income taxes and minority interests
Minority interests in income
Apr.–Dec.Apr.–Dec.
Selling, general and administrative expenses
Oct.–Dec. Oct.–Dec.
Oct.–Dec. Apr.–Dec.
Increase(decrease)
% changeIncrease
(decrease)% change
1 The accounting policy for naphtha resale was changed in Q4 2011 to exclude the naphtha resale amount from net sales and cost of salesrespectively, which is applied retroactively for the full FY 2011. (Naphtha resale amount was ¥16.4 billion for Oct.‐Dec. 2011 and ¥34.1 billion for Apr.‐Dec. 2011.)
6/34
Oct.–Dec. Apr.–Dec.ʹ11 vs. ʹ12 ʹ11 vs. ʹ12Increase(decrease)
Increase(decrease)
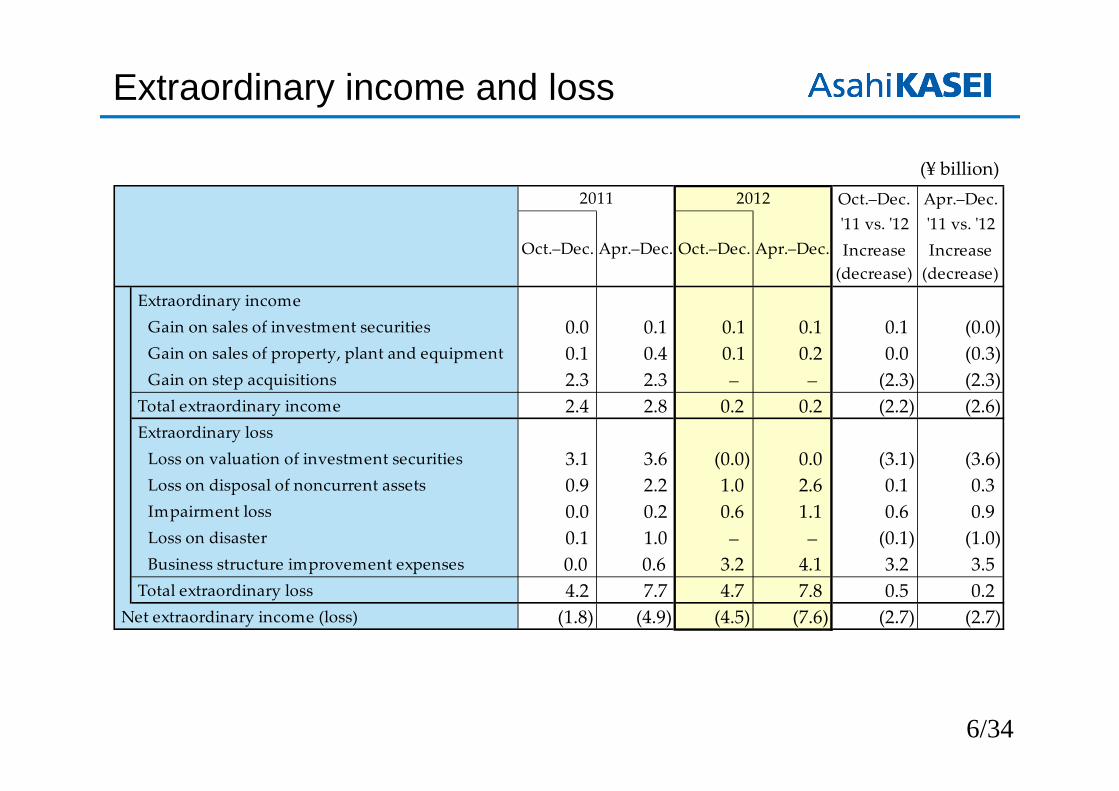
Extraordinary incomeGain on sales of investment securities 0.0 0.1 0.1 0.1 0.1 (0.0)Gain on sales of property, plant and equipment 0.1 0.4 0.1 0.2 0.0 (0.3)Gain on step acquisitions 2.3 2.3 – – (2.3) (2.3)
Total extraordinary income 2.4 2.8 0.2 0.2 (2.2) (2.6)Extraordinary lossLoss on valuation of investment securities 3.1 3.6 (0.0) 0.0 (3.1) (3.6)Loss on disposal of noncurrent assets 0.9 2.2 1.0 2.6 0.1 0.3Impairment loss 0.0 0.2 0.6 1.1 0.6 0.9Loss on disaster 0.1 1.0 – – (0.1) (1.0)Business structure improvement expenses 0.0 0.6 3.2 4.1 3.2 3.5
Total extraordinary loss 4.2 7.7 4.7 7.8 0.5 0.2Net extraordinary income (loss) (1.8) (4.9) (4.5) (7.6) (2.7) (2.7)
Apr.–Dec.
2011 2012
Oct.–Dec. Apr.–Dec. Oct.–Dec.
Extraordinary income and loss
(¥ billion)
7/34
Balance sheets1
(¥ billion)
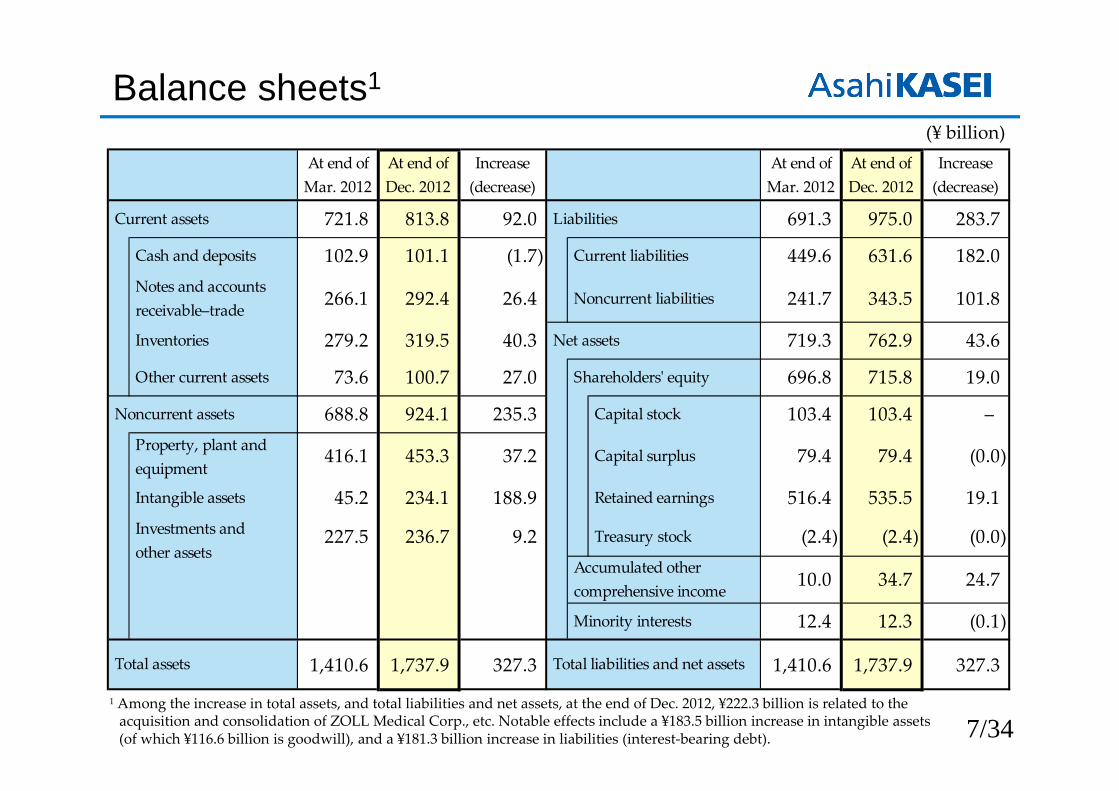
Current assets 721.8 813.8 92.0 Liabilities 691.3 975.0 283.7
Cash and deposits 102.9 101.1 (1.7) Current liabilities 449.6 631.6 182.0 Notes and accounts receivable–trade
266.1 292.4 26.4 Noncurrent liabilities 241.7 343.5 101.8
Inventories 279.2 319.5 40.3 Net assets 719.3 762.9 43.6
Other current assets 73.6 100.7 27.0 Shareholdersʹ equity 696.8 715.8 19.0
Noncurrent assets 688.8 924.1 235.3 Capital stock 103.4 103.4 – Property, plant and equipment
416.1 453.3 37.2 Capital surplus 79.4 79.4 (0.0)
Intangible assets 45.2 234.1 188.9 Retained earnings 516.4 535.5 19.1
227.5 236.7 9.2 Treasury stock (2.4) (2.4) (0.0)
10.0 34.7 24.7
12.4 12.3 (0.1)
1,410.6 1,737.9 327.3 1,410.6 1,737.9 327.3
At end ofDec. 2012
Increase(decrease)
At end ofMar. 2012
Total assets Total liabilities and net assets
At end ofMar. 2012
At end ofDec. 2012
Increase(decrease)
Minority interests
Investments and other assets
Accumulated other comprehensive income
1 Among the increase in total assets, and total liabilities and net assets, at the end of Dec. 2012, ¥222.3 billion is related to the acquisition and consolidation of ZOLL Medical Corp., etc. Notable effects include a ¥183.5 billion increase in intangible assets(of which ¥116.6 billion is goodwill), and a ¥181.3 billion increase in liabilities (interest‐bearing debt).
8/34
Cash flows
Oct.–Dec. Apr.–Dec. Oct.–Dec. Apr.–Dec.
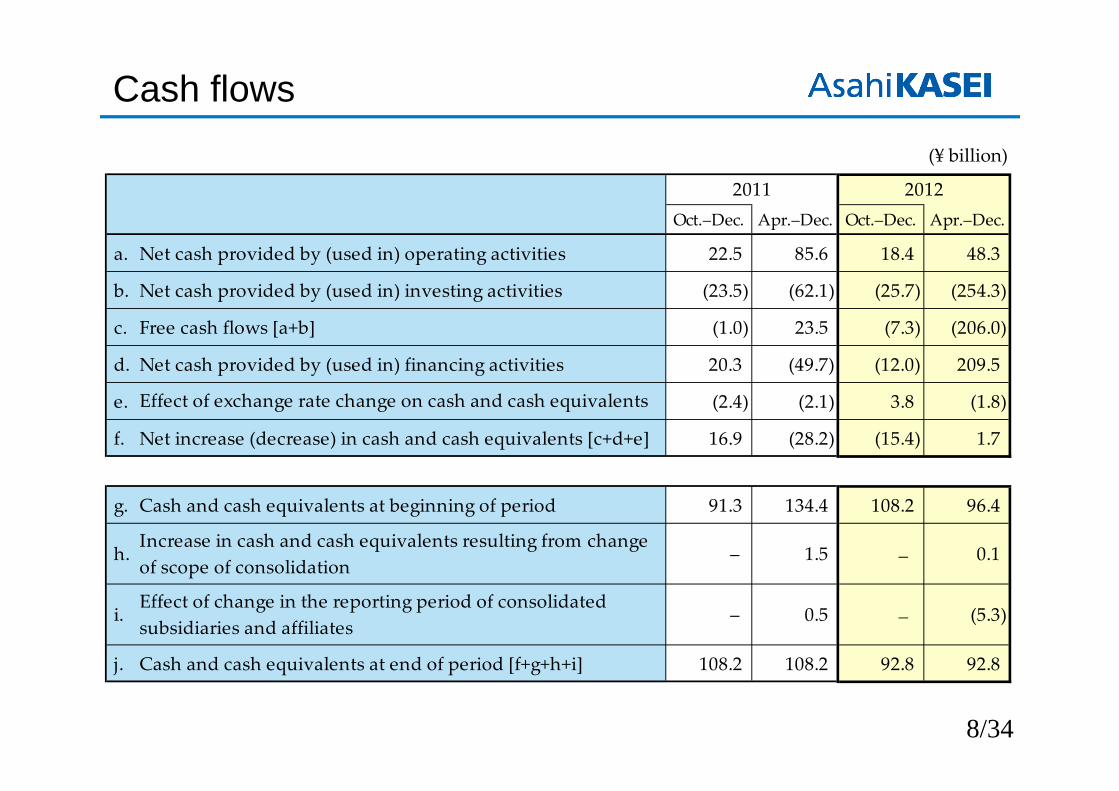
a. Net cash provided by (used in) operating activities 22.5 85.6 18.4 48.3
b. Net cash provided by (used in) investing activities (23.5) (62.1) (25.7) (254.3)
c. Free cash flows [a+b] (1.0) 23.5 (7.3) (206.0)
d. Net cash provided by (used in) financing activities 20.3 (49.7) (12.0) 209.5
e. (2.4) (2.1) 3.8 (1.8)
f. Net increase (decrease) in cash and cash equivalents [c+d+e] 16.9 (28.2) (15.4) 1.7
g. Cash and cash equivalents at beginning of period 91.3 134.4 108.2 96.4
h. – 1.5 – 0.1
i. – 0.5 – (5.3)
j. Cash and cash equivalents at end of period [f+g+h+i] 108.2 108.2 92.8 92.8
20122011
Effect of exchange rate change on cash and cash equivalents
Increase in cash and cash equivalents resulting from changeof scope of consolidation
Effect of change in the reporting period of consolidatedsubsidiaries and affiliates
(¥ billion)
9/34
Oct.–Dec.2011
Oct.–Dec.2012
Increase(decrease)
Oct.–Dec.2011
Oct.–Dec.2012
Increase(decrease)
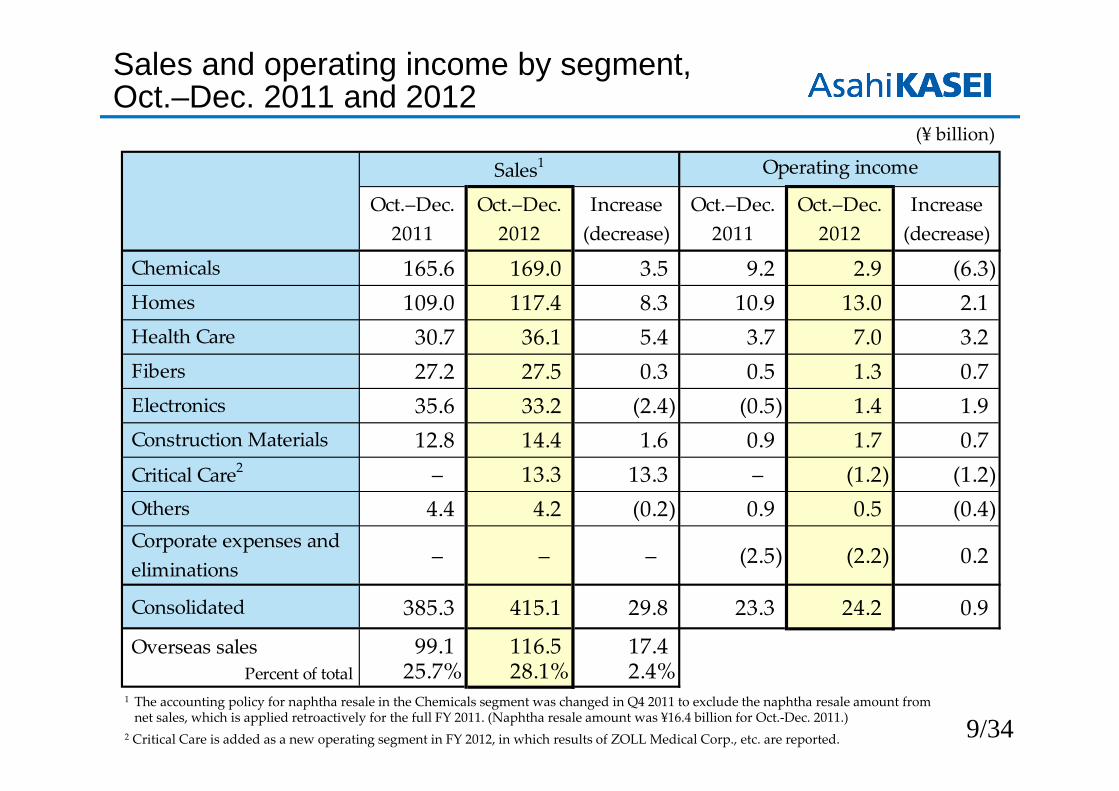
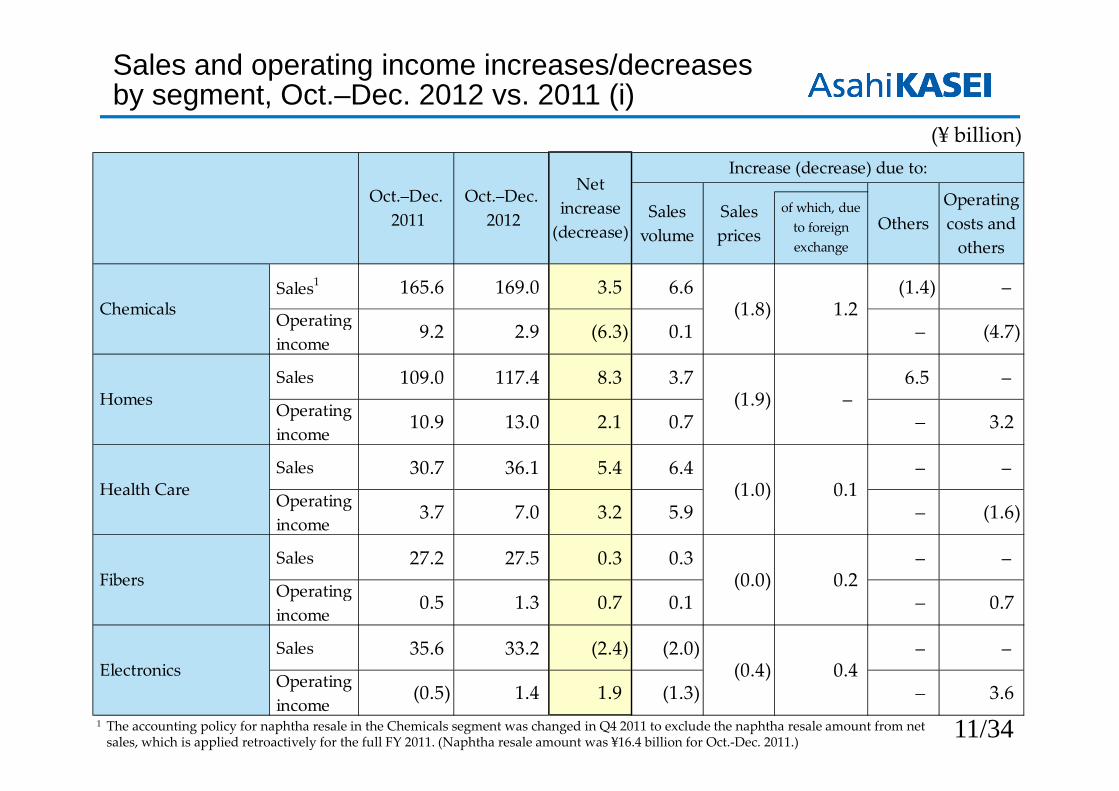
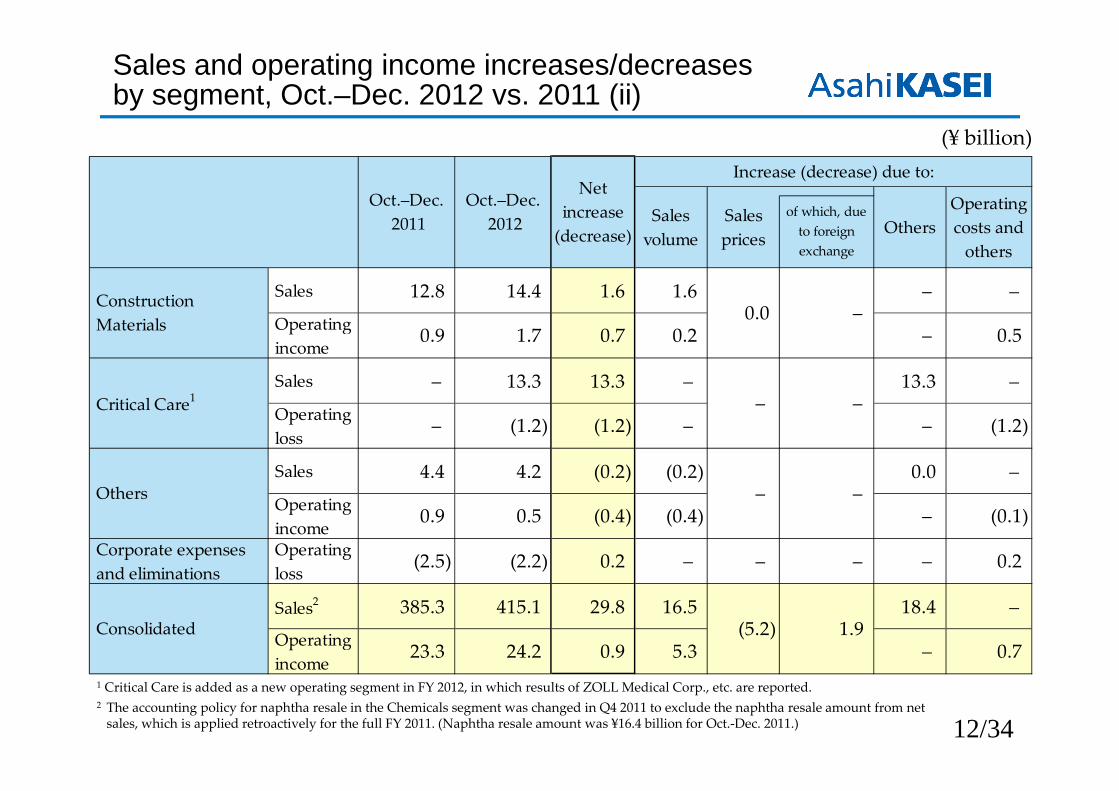
Chemicals 165.6 169.0 3.5 9.2 2.9 (6.3)Homes 109.0 117.4 8.3 10.9 13.0 2.1Health Care 30.7 36.1 5.4 3.7 7.0 3.2Fibers 27.2 27.5 0.3 0.5 1.3 0.7 Electronics 35.6 33.2 (2.4) (0.5) 1.4 1.9Construction Materials 12.8 14.4 1.6 0.9 1.7 0.7 Critical Care2 – 13.3 13.3 – (1.2) (1.2) Others 4.4 4.2 (0.2) 0.9 0.5 (0.4) Corporate expenses and eliminations
– – – (2.5) (2.2) 0.2
Consolidated 385.3 415.1 29.8 23.3 24.2 0.9
Overseas sales 99.1 116.5 17.4Percent of total 25.7% 28.1% 2.4%
Sales1 Operating income
Sales and operating income by segment,Oct.–Dec. 2011 and 2012
(¥ billion)
1 The accounting policy for naphtha resale in the Chemicals segment was changed in Q4 2011 to exclude the naphtha resale amount from net sales, which is applied retroactively for the full FY 2011. (Naphtha resale amount was ¥16.4 billion for Oct.‐Dec. 2011.)
2 Critical Care is added as a new operating segment in FY 2012, in which results of ZOLL Medical Corp., etc. are reported.

10/34
Apr.–Dec.2011
Apr.–Dec.2012
Increase(decrease)
Apr.–Dec.2011
Apr.–Dec.2012
Increase(decrease)
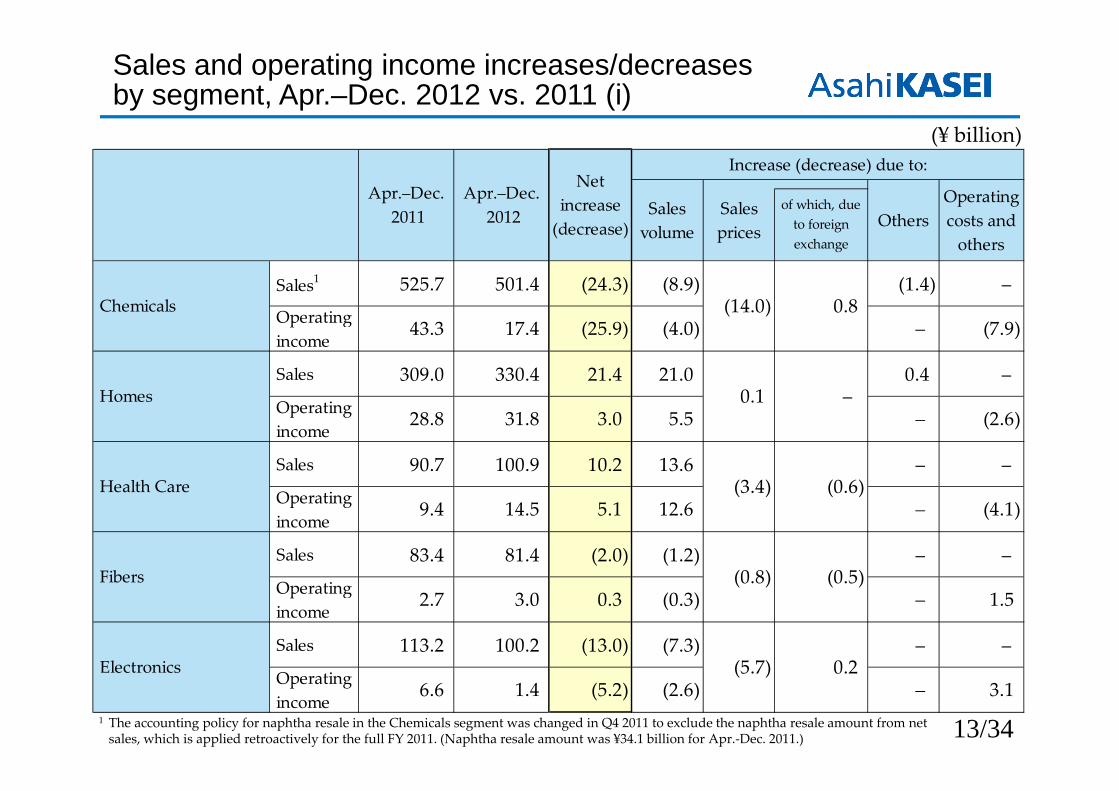
Chemicals 525.7 501.4 (24.3) 43.3 17.4 (25.9)Homes 309.0 330.4 21.4 28.8 31.8 3.0Health Care 90.7 100.9 10.2 9.4 14.5 5.1Fibers 83.4 81.4 (2.0) 2.7 3.0 0.3 Electronics 113.2 100.2 (13.0) 6.6 1.4 (5.2)Construction Materials 35.0 39.2 4.2 1.7 3.3 1.6 Critical Care2 – 36.2 36.2 – (2.3) (2.3) Others 12.9 13.1 0.2 2.1 1.6 (0.5) Corporate expenses and eliminations
– – – (7.4) (8.2) (0.8)
Consolidated 1,169.8 1,202.6 32.8 87.1 62.5 (24.6)Overseas sales 326.9 346.9 20.0
Percent of total 27.9% 28.8% 0.9%
Sales1 Operating income
Sales and operating income by segment,Apr.–Dec. 2011 and 2012
(¥ billion)
1 The accounting policy for naphtha resale in the Chemicals segment was changed in Q4 2011 to exclude the naphtha resale amount fromnet sales, which is applied retroactively for the full FY 2011. (Naphtha resale amount was ¥34.1 billion for Apr.‐Dec. 2011.)
2 Critical Care is added as a new operating segment in FY 2012, in which results of ZOLL Medical Corp., etc. are reported.
11/34
Sales1 165.6 169.0 3.5 6.6 (1.4) –
Operating income
Sales 109.0 117.4 8.3 3.7 6.5 –
Operating income
Sales 30.7 36.1 5.4 6.4 – –
Operating income
Sales 27.2 27.5 0.3 0.3 – –
Operating income
Sales 35.6 33.2 (2.4) (2.0) – –
Operating income
Salesvolume
Salesprices
Netincrease(decrease)
Chemicals9.2 2.9
Oct.–Dec. 2011
Oct.–Dec. 2012
Increase (decrease) due to:
Others
Health Care
Electronics
Homes
1.4(0.5)
2.110.9 13.0
Fibers
3.7 7.0 3.2
1.9
(0.0) 0.20.5 1.3
Operatingcosts andothers
of which, dueto foreignexchange
(4.7)(6.3)
3.2
(1.6)
3.6
0.1
5.9
0.7
(1.3)
–
–
–
(1.9)
(1.8) 1.2
0.1
(0.4) 0.4
–
–
(1.0)
0.7 0.1 – 0.7
Sales and operating income increases/decreases by segment, Oct.–Dec. 2012 vs. 2011 (i)
(¥ billion)
1 The accounting policy for naphtha resale in the Chemicals segment was changed in Q4 2011 to exclude the naphtha resale amount from net sales, which is applied retroactively for the full FY 2011. (Naphtha resale amount was ¥16.4 billion for Oct.‐Dec. 2011.)
12/34
Sales 12.8 14.4 1.6 1.6 – –
Operating income
Sales – 13.3 13.3 – 13.3 –
Operating loss
Sales 4.4 4.2 (0.2) (0.2) 0.0 –
Operating incomeOperating loss
Sales2 385.3 415.1 29.8 16.5 18.4 –
Operating income
Oct.–Dec. 2011
Oct.–Dec. 2012
Others
Consolidated
Critical Care1
(2.5) Corporate expenses and eliminations
Construction Materials 0.9 1.7
0.9
(1.2)
Operatingcosts andothers
24.2
of which, dueto foreignexchange
(0.1)
0.7
0.5
Salesvolume
Salesprices
Others
0.7
0.2 –
(0.4)
Netincrease(decrease)
Increase (decrease) due to:
0.2
– (1.2)
(2.2)
0.9 0.5 (0.4)
23.3
– –
–
0.2
(1.2) –
5.3
–
–
–
– – –
0.0 –
–
(5.2) 1.9
–
(¥ billion)
Sales and operating income increases/decreases by segment, Oct.–Dec. 2012 vs. 2011 (ii)
1 Critical Care is added as a new operating segment in FY 2012, in which results of ZOLL Medical Corp., etc. are reported.2 The accounting policy for naphtha resale in the Chemicals segment was changed in Q4 2011 to exclude the naphtha resale amount from net sales, which is applied retroactively for the full FY 2011. (Naphtha resale amount was ¥16.4 billion for Oct.‐Dec. 2011.)
13/34
Sales1 525.7 501.4 (24.3) (8.9) (1.4) –
Operating income
Sales 309.0 330.4 21.4 21.0 0.4 –
Operating income
Sales 90.7 100.9 10.2 13.6 – –
Operating income
Sales 83.4 81.4 (2.0) (1.2) – –
Operating income
Sales 113.2 100.2 (13.0) (7.3) – –
Operating income
(14.0) 0.8
(0.6)
(5.7) 0.2
–
5.5
(2.6)
–
–
–
0.1 –(2.6)
(4.1)
3.1
– 1.53.0 0.3 (0.3)
(7.9)(4.0)
12.6
1.46.6
3.028.8 31.8
9.4 14.5 5.1
(5.2)
2.7
OthersOperatingcosts andothers
of which, dueto foreignexchange
(25.9)
Health Care
Electronics
Homes
Fibers (0.8) (0.5)
Salesvolume
Salesprices
Netincrease(decrease)
(3.4)
Chemicals43.3 17.4
Apr.–Dec. 2011
Apr.–Dec. 2012
Increase (decrease) due to:
Sales and operating income increases/decreases by segment, Apr.–Dec. 2012 vs. 2011 (i)
(¥ billion)
1 The accounting policy for naphtha resale in the Chemicals segment was changed in Q4 2011 to exclude the naphtha resale amount from net sales, which is applied retroactively for the full FY 2011. (Naphtha resale amount was ¥34.1 billion for Apr.‐Dec. 2011.)

14/34
Sales 35.0 39.2 4.2 3.9 – –
Operating income
Sales – 36.2 36.2 – 36.2 –
Operating loss
Sales 12.9 13.1 0.2 0.1 0.1 –
Operating incomeOperating loss
Sales2 1,169.8 1,202.6 32.8 21.1 35.2 –
Operating income
0.3 –
–
(23.4) (0.0)
–
–
11.4
–
–
–
– – –
– –
–
(0.8)
(2.3) – (2.3)
(8.2)
2.1 1.6 (0.5)
87.1
Others
1.6
(0.8) –
(0.3)
Netincrease(decrease)
Increase (decrease) due to:
0.5
(24.6)
(2.3)
Operatingcosts andothers
62.5
of which, dueto foreignexchange
(0.1)
(12.6)
0.7
Salesvolume
Salesprices
Apr.–Dec. 2011
Apr.–Dec. 2012
Others
Consolidated
(7.4) Corporate expenses and eliminations
Construction Materials 1.7 3.3
Critical Care1
(¥ billion)
Sales and operating income increases/decreases by segment, Apr.–Dec. 2012 vs. 2011 (ii)
1 Critical Care is added as a new operating segment in FY 2012, in which results of ZOLL Medical Corp., etc. are reported.2 The accounting policy for naphtha resale in the Chemicals segment was changed in Q4 2011 to exclude the naphtha resale amount from net sales, which is applied retroactively for the full FY 2011. (Naphtha resale amount was ¥34.1 billion for Apr.‐Dec. 2011.)

15/34
Forecast for fiscal year 2012
H2Oct.–Dec. Jan.–Mar. forecast
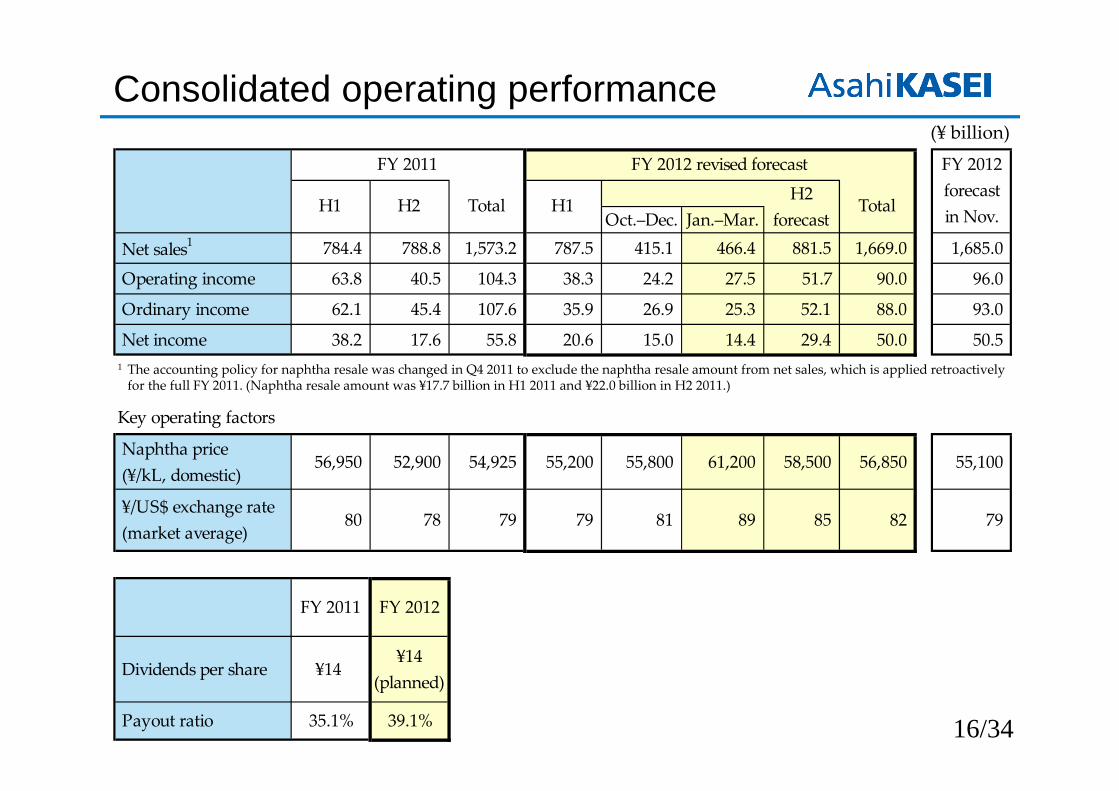
Net sales1 784.4 788.8 1,573.2 787.5 415.1 466.4 881.5 1,669.0 1,685.0
Operating income 63.8 40.5 104.3 38.3 24.2 27.5 51.7 90.0 96.0
Ordinary income 62.1 45.4 107.6 35.9 26.9 25.3 52.1 88.0 93.0
Net income 38.2 17.6 55.8 20.6 15.0 14.4 29.4 50.0 50.5
Key operating factors
Naphtha price (¥/kL, domestic)
56,950 52,900 54,925 55,200 55,800 61,200 58,500 56,850 55,100
¥/US$ exchange rate (market average)
80 78 79 79 81 89 85 82 79
FY 2011 FY 2012
Dividends per share ¥14¥14
(planned)
Payout ratio 35.1% 39.1%
FY 2012 revised forecast
H1
FY 2012forecastin Nov.H1 H2 Total
FY 2011
Total
16/34
Consolidated operating performance(¥ billion)
1 The accounting policy for naphtha resale was changed in Q4 2011 to exclude the naphtha resale amount from net sales, which is applied retroactively for the full FY 2011. (Naphtha resale amount was ¥17.7 billion in H1 2011 and ¥22.0 billion in H2 2011.)
17/34
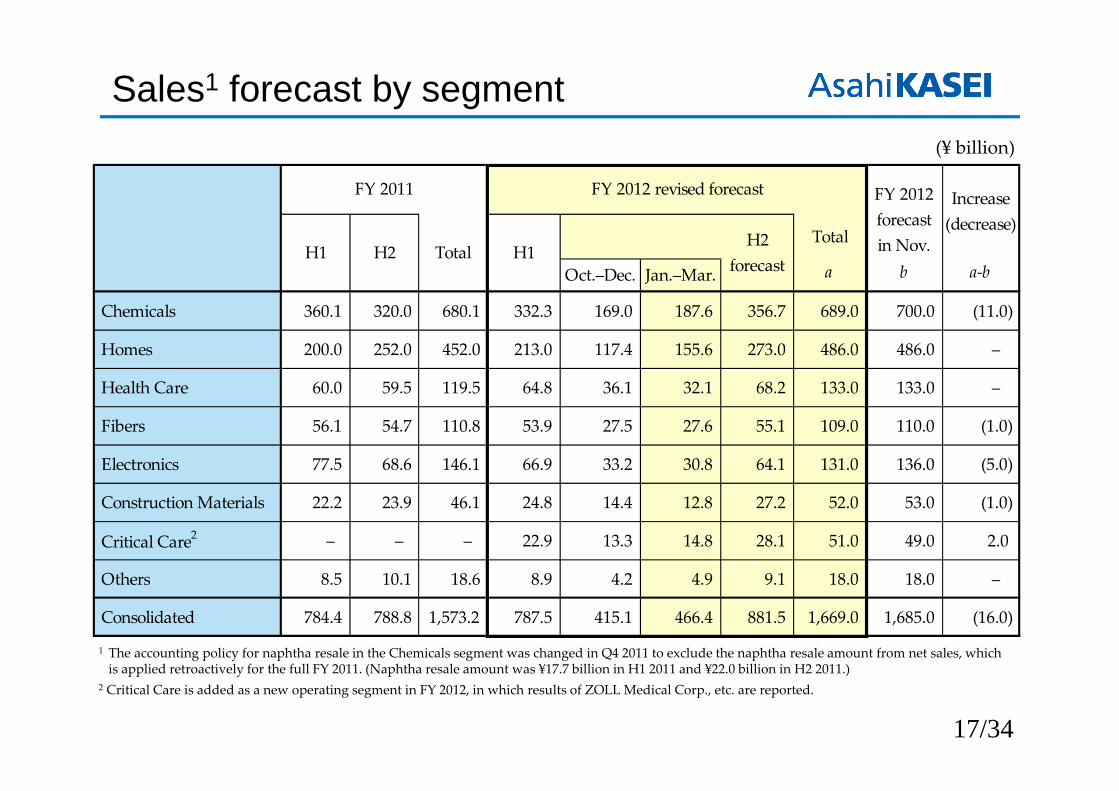
Sales1 forecast by segment(¥ billion)
Total
Oct.–Dec. Jan.–Mar. a b a‐b
Chemicals 360.1 320.0 680.1 332.3 169.0 187.6 356.7 689.0 700.0 (11.0)
Homes 200.0 252.0 452.0 213.0 117.4 155.6 273.0 486.0 486.0 –
Health Care 60.0 59.5 119.5 64.8 36.1 32.1 68.2 133.0 133.0 –
Fibers 56.1 54.7 110.8 53.9 27.5 27.6 55.1 109.0 110.0 (1.0)
Electronics 77.5 68.6 146.1 66.9 33.2 30.8 64.1 131.0 136.0 (5.0)
Construction Materials 22.2 23.9 46.1 24.8 14.4 12.8 27.2 52.0 53.0 (1.0)
Critical Care2 – – – 22.9 13.3 14.8 28.1 51.0 49.0 2.0
Others 8.5 10.1 18.6 8.9 4.2 4.9 9.1 18.0 18.0 –
Consolidated 784.4 788.8 1,573.2 787.5 415.1 466.4 881.5 1,669.0 1,685.0 (16.0)
FY 2012forecastin Nov.H1 H2
Increase(decrease)
Total
FY 2011
H1H2
forecast
FY 2012 revised forecast
1 The accounting policy for naphtha resale in the Chemicals segment was changed in Q4 2011 to exclude the naphtha resale amount from net sales, which is applied retroactively for the full FY 2011. (Naphtha resale amount was ¥17.7 billion in H1 2011 and ¥22.0 billion in H2 2011.)
2 Critical Care is added as a new operating segment in FY 2012, in which results of ZOLL Medical Corp., etc. are reported.
18/34
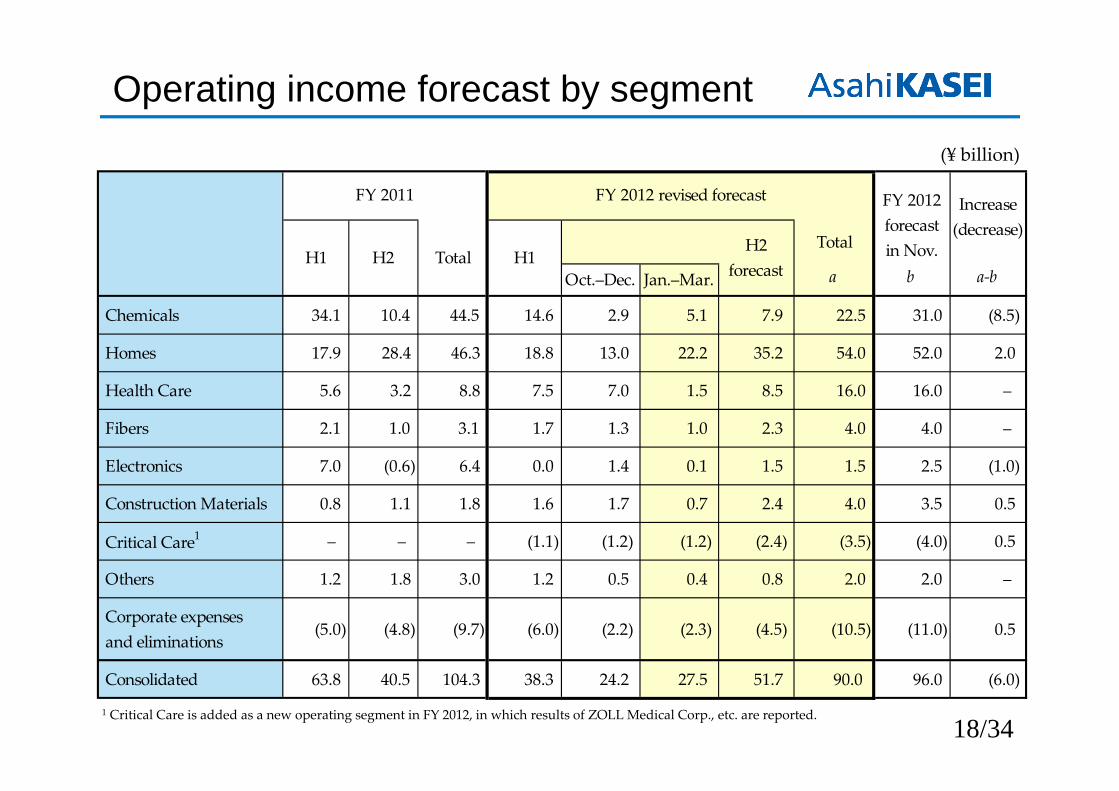
Operating income forecast by segment(¥ billion)
Total
Oct.–Dec. Jan.–Mar. a b a‐b
Chemicals 34.1 10.4 44.5 14.6 2.9 5.1 7.9 22.5 31.0 (8.5)
Homes 17.9 28.4 46.3 18.8 13.0 22.2 35.2 54.0 52.0 2.0
Health Care 5.6 3.2 8.8 7.5 7.0 1.5 8.5 16.0 16.0 –
Fibers 2.1 1.0 3.1 1.7 1.3 1.0 2.3 4.0 4.0 –
Electronics 7.0 (0.6) 6.4 0.0 1.4 0.1 1.5 1.5 2.5 (1.0)
Construction Materials 0.8 1.1 1.8 1.6 1.7 0.7 2.4 4.0 3.5 0.5
Critical Care1 – – – (1.1) (1.2) (1.2) (2.4) (3.5) (4.0) 0.5
Others 1.2 1.8 3.0 1.2 0.5 0.4 0.8 2.0 2.0 –
Corporate expenses and eliminations
(5.0) (4.8) (9.7) (6.0) (2.2) (2.3) (4.5) (10.5) (11.0) 0.5
Consolidated 63.8 40.5 104.3 38.3 24.2 27.5 51.7 90.0 96.0 (6.0)
FY 2012forecastin Nov.H1 H2
Increase(decrease)
Total
FY 2011
H1H2
forecast
FY 2012 revised forecast
1 Critical Care is added as a new operating segment in FY 2012, in which results of ZOLL Medical Corp., etc. are reported.

19/34
Appendix
20/34
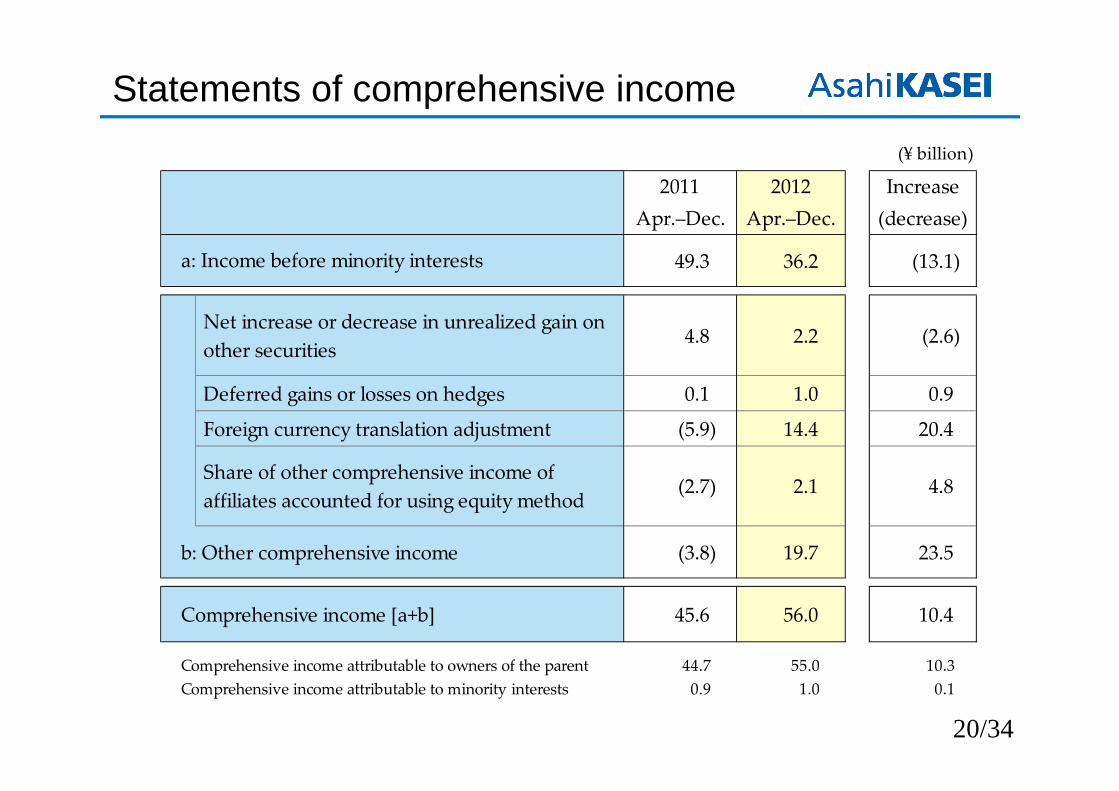
(¥ billion)
49.3 36.2 (13.1)
Net increase or decrease in unrealized gain on other securities
4.8 2.2 (2.6)
Deferred gains or losses on hedges 0.1 1.0 0.9
Foreign currency translation adjustment (5.9) 14.4 20.4
Share of other comprehensive income of affiliates accounted for using equity method
(2.7) 2.1 4.8
b: Other comprehensive income (3.8) 19.7 23.5
Comprehensive income [a+b] 45.6 56.0 10.4
Comprehensive income attributable to owners of the parent 44.7 55.0 10.3Comprehensive income attributable to minority interests 0.9 1.0 0.1
20122011 Increase
a: Income before minority interests
(decrease)Apr.–Dec. Apr.–Dec.
Statements of comprehensive income
21/34
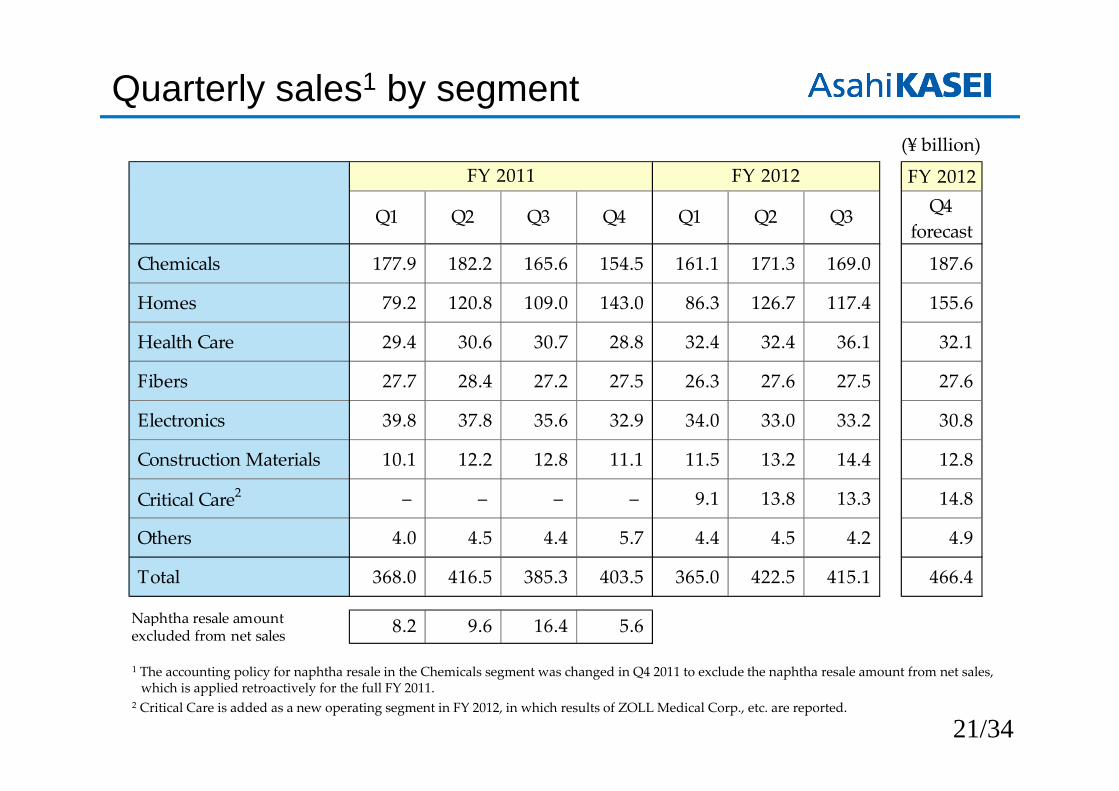
Quarterly sales1 by segment(¥ billion)
FY 2012Q4
forecast
Chemicals 177.9 182.2 165.6 154.5 161.1 171.3 169.0 187.6
Homes 79.2 120.8 109.0 143.0 86.3 126.7 117.4 155.6
Health Care 29.4 30.6 30.7 28.8 32.4 32.4 36.1 32.1
Fibers 27.7 28.4 27.2 27.5 26.3 27.6 27.5 27.6
Electronics 39.8 37.8 35.6 32.9 34.0 33.0 33.2 30.8
Construction Materials 10.1 12.2 12.8 11.1 11.5 13.2 14.4 12.8
Critical Care2 – – – – 9.1 13.8 13.3 14.8
Others 4.0 4.5 4.4 5.7 4.4 4.5 4.2 4.9
Total 368.0 416.5 385.3 403.5 365.0 422.5 415.1 466.4
Naphtha resale amount excluded from net sales 5.616.49.68.2
Q3
FY 2011
Q4 Q2Q1
FY 2012
Q3Q2Q1
1 The accounting policy for naphtha resale in the Chemicals segment was changed in Q4 2011 to exclude the naphtha resale amount from net sales, which is applied retroactively for the full FY 2011.
2 Critical Care is added as a new operating segment in FY 2012, in which results of ZOLL Medical Corp., etc. are reported.
22/34
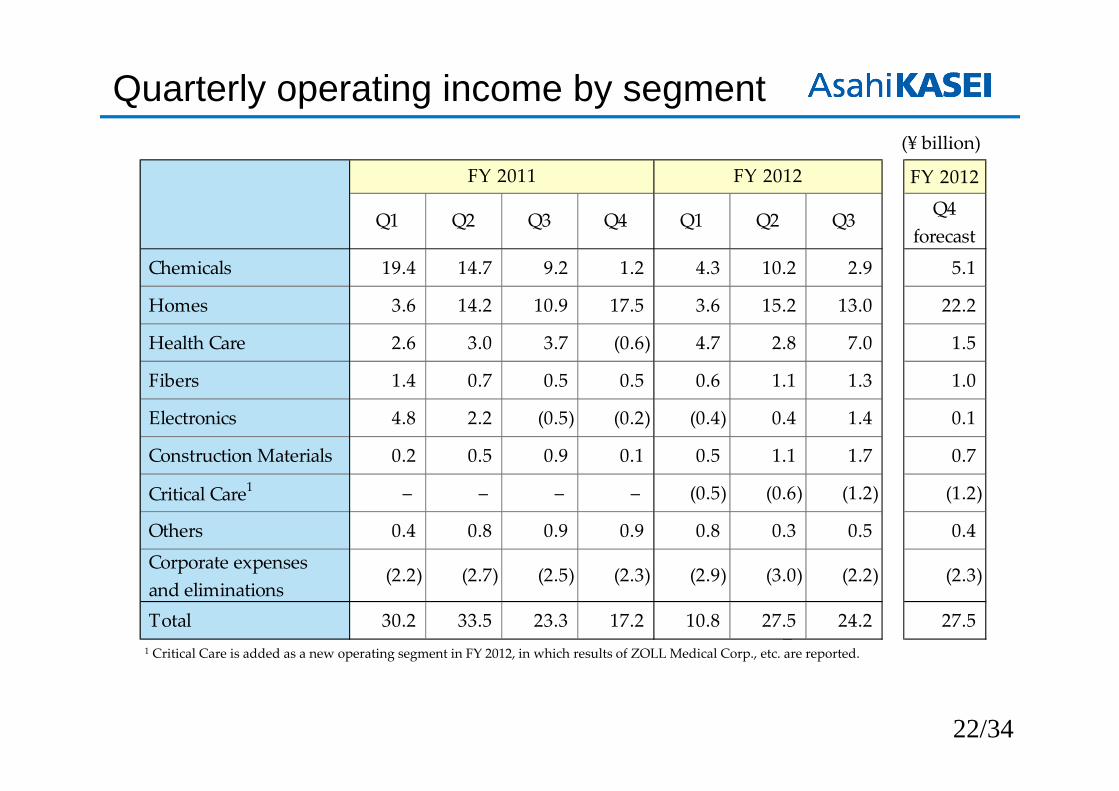
Quarterly operating income by segment(¥ billion)
1 Critical Care is added as a new operating segment in FY 2012, in which results of ZOLL Medical Corp., etc. are reported.
FY 2012
Q4forecast
Chemicals 19.4 14.7 9.2 1.2 4.3 10.2 2.9 5.1
Homes 3.6 14.2 10.9 17.5 3.6 15.2 13.0 22.2
Health Care 2.6 3.0 3.7 (0.6) 4.7 2.8 7.0 1.5
Fibers 1.4 0.7 0.5 0.5 0.6 1.1 1.3 1.0
Electronics 4.8 2.2 (0.5) (0.2) (0.4) 0.4 1.4 0.1
Construction Materials 0.2 0.5 0.9 0.1 0.5 1.1 1.7 0.7
Critical Care1 – – – – (0.5) (0.6) (1.2) (1.2)
Others 0.4 0.8 0.9 0.9 0.8 0.3 0.5 0.4
Corporate expenses and eliminations
(2.2) (2.7) (2.5) (2.3) (2.9) (3.0) (2.2) (2.3)
Total 30.2 33.5 23.3 17.2 10.8 27.5 24.2 27.52
FY 2011 FY 2012
Q3Q2 Q3Q1 Q2Q1Q4
23/34
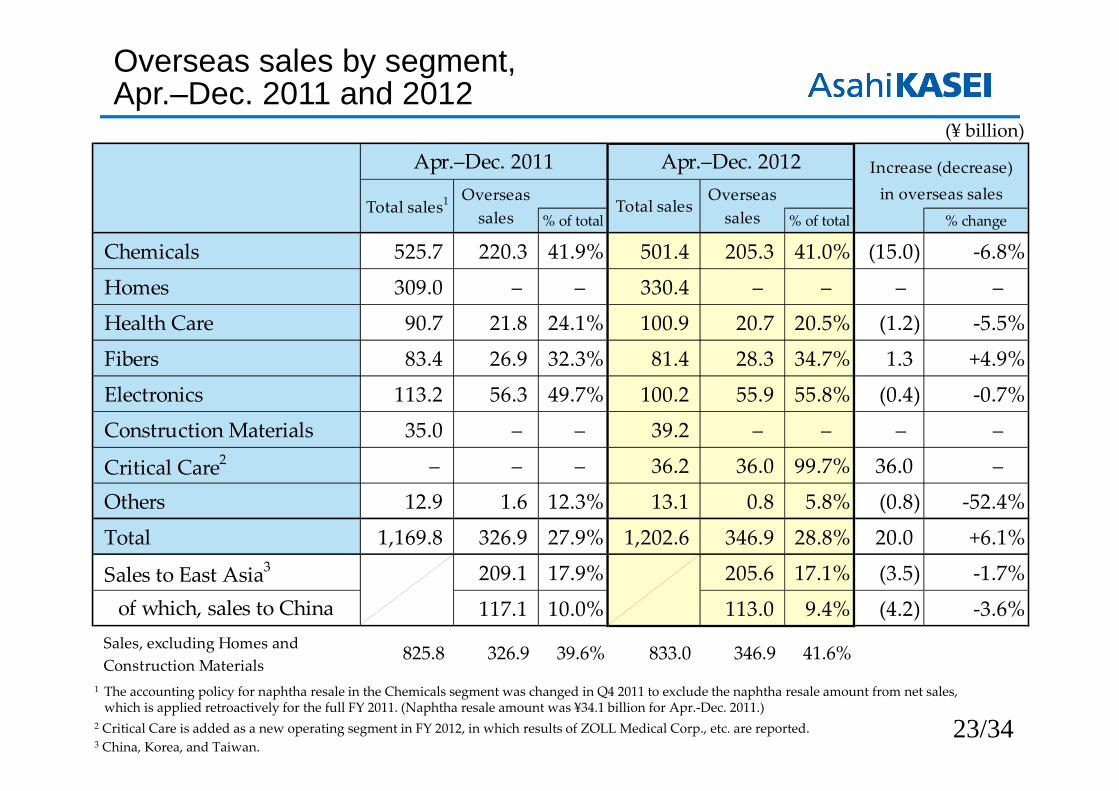
% of total % of total % change
Chemicals 525.7 220.3 41.9% 501.4 205.3 41.0% (15.0) ‐6.8%
Homes 309.0 – – 330.4 – – – –
Health Care 90.7 21.8 24.1% 100.9 20.7 20.5% (1.2) ‐5.5%
Fibers 83.4 26.9 32.3% 81.4 28.3 34.7% 1.3 +4.9%
Electronics 113.2 56.3 49.7% 100.2 55.9 55.8% (0.4) ‐0.7%
Construction Materials 35.0 – – 39.2 – – – –
Critical Care2 – – – 36.2 36.0 99.7% 36.0 –
Others 12.9 1.6 12.3% 13.1 0.8 5.8% (0.8) ‐52.4%
Total 1,169.8 326.9 27.9% 1,202.6 346.9 28.8% 20.0 +6.1%
Sales to East Asia3 209.1 17.9% 205.6 17.1% (3.5) ‐1.7%
117.1 10.0% 113.0 9.4% (4.2) ‐3.6%Sales, excluding Homes andConstruction Materials
825.8 326.9 39.6% 833.0 346.9 41.6%
OverseassalesTotal sales1 Total sales
Overseassales
of which, sales to China
Apr.–Dec. 2011 Apr.–Dec. 2012 Increase (decrease)in overseas sales
(¥ billion)
Overseas sales by segment, Apr.–Dec. 2011 and 2012
1 The accounting policy for naphtha resale in the Chemicals segment was changed in Q4 2011 to exclude the naphtha resale amount from net sales, which is applied retroactively for the full FY 2011. (Naphtha resale amount was ¥34.1 billion for Apr.‐Dec. 2011.)
2 Critical Care is added as a new operating segment in FY 2012, in which results of ZOLL Medical Corp., etc. are reported.3 China, Korea, and Taiwan.
24/34
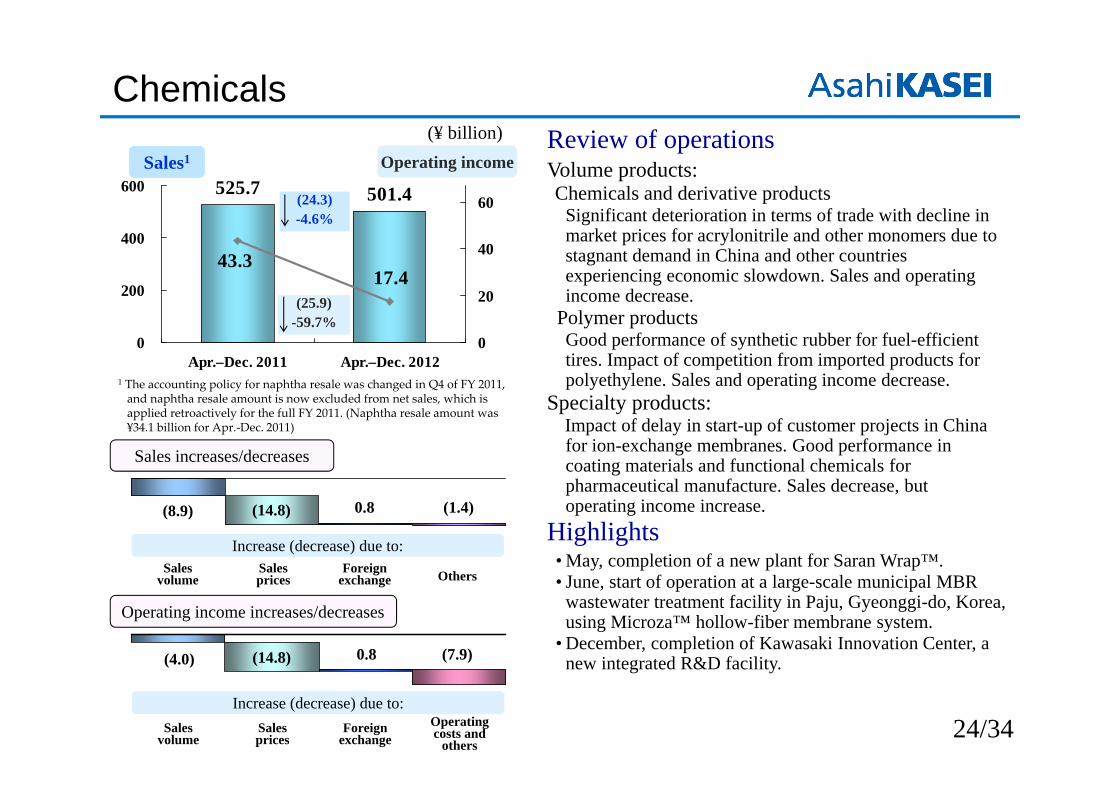
525.7 501.4
17.443.3
0
200
400
600
Apr.–Dec. 2011 Apr.–Dec. 20120
20
40
60
Increase (decrease) due to:
Chemicals(¥ billion)
Sales1
(24.3)-4.6%
(25.9)-59.7%
Sales increases/decreases
Sales volume
Sales prices
Foreign exchange Others
Sales volume
Sales prices
Foreign exchange
Operating costs and
others
Increase (decrease) due to:
Operating income
Operating income increases/decreases
(8.9) (14.8) 0.8 (1.4)
(4.0) (14.8) 0.8 (7.9)
Review of operationsVolume products:Chemicals and derivative products
Significant deterioration in terms of trade with decline in market prices for acrylonitrile and other monomers due to stagnant demand in China and other countries experiencing economic slowdown. Sales and operating income decrease.
Polymer productsGood performance of synthetic rubber for fuel-efficient tires. Impact of competition from imported products for polyethylene. Sales and operating income decrease.
Specialty products:Impact of delay in start-up of customer projects in China for ion-exchange membranes. Good performance in coating materials and functional chemicals for pharmaceutical manufacture. Sales decrease, but operating income increase.
Highlights• May, completion of a new plant for Saran Wrap™.• June, start of operation at a large-scale municipal MBR
wastewater treatment facility in Paju, Gyeonggi-do, Korea, using Microza™ hollow-fiber membrane system.
• December, completion of Kawasaki Innovation Center, a new integrated R&D facility.
1 The accounting policy for naphtha resale was changed in Q4 of FY 2011, and naphtha resale amount is now excluded from net sales, which is applied retroactively for the full FY 2011. (Naphtha resale amount was ¥34.1 billion for Apr.‐Dec. 2011)

Apr.-Dec. 2012
Sales Operating income
Order-built homes, etc.(Asahi Kasei Homes) 244.9 23.8
Real estate–related(Asahi Kasei Fudousan Residence)
50.0 3.0
Remodeling(Asahi Kasei Reform)
33.9 4.3
Other housing-related, etc. 1.6 0.7
Total 330.4 31.8
25/34
330.4309.0
28.8 31.8
0
100
200
300
Apr.–Dec. 2011 Apr.–Dec. 20120
10
20
30
Homes (i)
Sales
(¥ billion)
21.4+6.9%
3.0+10.4%
Operating incomeReview of operations• Increased deliveries of both Hebel Haus™ unit homes
and Hebel Maison™ apartment buildings in order-built homes operations. Increased deliveries of condominiums and firm performance in rental management in real-estate operations. Good performance in solar panel installation and other renovation work in remodeling operations. Sales and operating income increase.
• Development of products matching needs in urban areas. Value of new orders increasing 10.0% year-on-year for Oct. to Dec. and 9.7% year-on-year for Apr. to Dec.
Highlights• April, launch of two-generation Hebel Haus™ homes
with a system for energy sharing between families. • April, launch of homes with enhanced disaster resistance
and independent energy supply system.• July, introduction of V2H system2 and new home energy
management system as options for Hebel Haus™.• August, launch of homes with features for families living
with their parents and a single sibling.• November, launch of Hebel Haus™ Frex “GENB” basalt-
colored three-story houses.
(¥ billion)Apr.-Dec. 2011
Sales Operating income
Order-built homes 228.7
Pre-built homes 15.1
Housing-related, etc. 65.3
Total 309.0 28.81 Product categories are revised from FY 2012. A portion of sales previously included in pre-built homes is now included in order-built homes, etc.
Otherwise, sales in the previous pre-built homes category are now included in real estate–related.2 Vehicle to home system, which enables return of energy from rechargeable battery of electric vehicle to home energy system.
Results by product category1
26/34
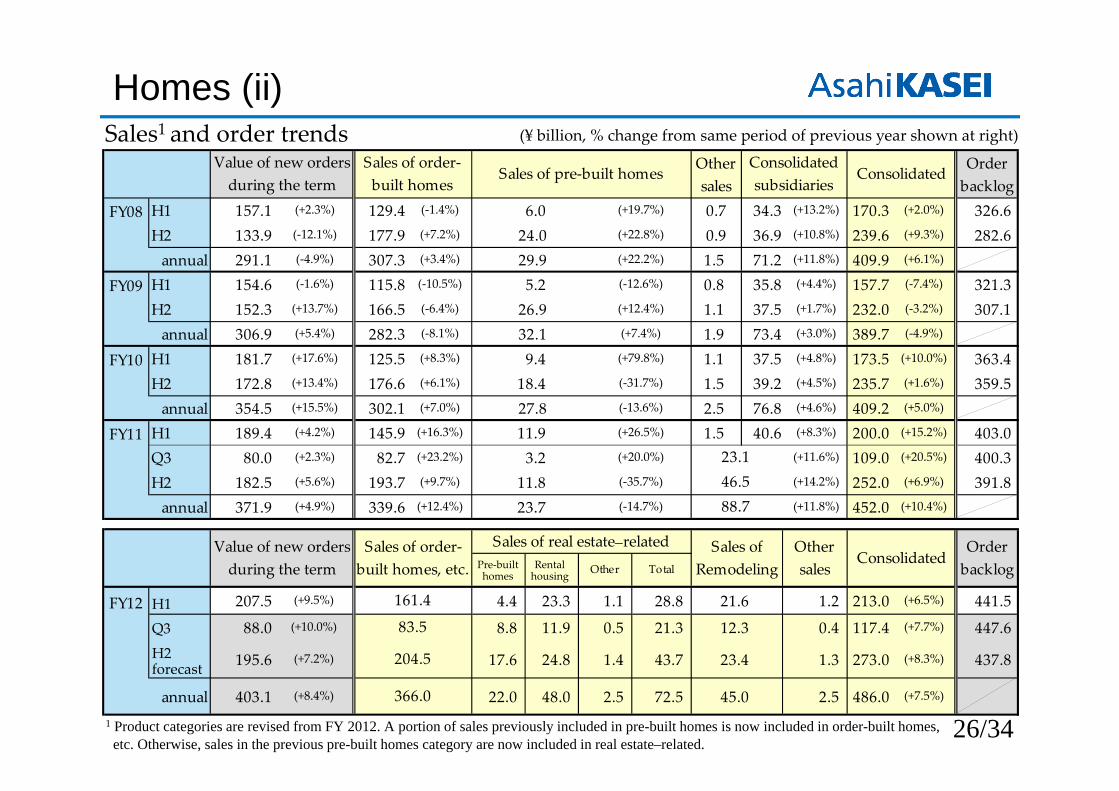
Homes (ii)
Other Total
FY12 207.5 (+9.5%) 4.4 23.3 1.1 28.8 21.6 1.2 213.0 (+6.5%) 441.5
88.0 (+10.0%) 8.8 11.9 0.5 21.3 12.3 0.4 117.4 (+7.7%) 447.6
195.6 (+7.2%) 17.6 24.8 1.4 43.7 23.4 1.3 273.0 (+8.3%) 437.8
annual 403.1 (+8.4%) 22.0 48.0 2.5 72.5 45.0 2.5 486.0 (+7.5%)
Value of new ordersduring the term
Sales of order‐built homes, etc.
161.4
Orderbacklog
366.0
Sales of real estate–related Sales ofRemodeling
Othersales
Consolidated
204.5
83.5
1 Product categories are revised from FY 2012. A portion of sales previously included in pre-built homes is now included in order-built homes, etc. Otherwise, sales in the previous pre-built homes category are now included in real estate–related.
Othersales
Orderbacklog
FY08 H1 157.1 (+2.3%) 129.4 (‐1.4%) 6.0 (+19.7%) 0.7 34.3 (+13.2%) 170.3 (+2.0%) 326.6H2 133.9 (‐12.1%) 177.9 (+7.2%) 24.0 (+22.8%) 0.9 36.9 (+10.8%) 239.6 (+9.3%) 282.6
291.1 (‐4.9%) 307.3 (+3.4%) 29.9 (+22.2%) 1.5 71.2 (+11.8%) 409.9 (+6.1%)
FY09 H1 154.6 (‐1.6%) 115.8 (‐10.5%) 5.2 (‐12.6%) 0.8 35.8 (+4.4%) 157.7 (‐7.4%) 321.3H2 152.3 (+13.7%) 166.5 (‐6.4%) 26.9 (+12.4%) 1.1 37.5 (+1.7%) 232.0 (‐3.2%) 307.1
306.9 (+5.4%) 282.3 (‐8.1%) 32.1 (+7.4%) 1.9 73.4 (+3.0%) 389.7 (‐4.9%)
FY10 H1 181.7 (+17.6%) 125.5 (+8.3%) 9.4 (+79.8%) 1.1 37.5 (+4.8%) 173.5 (+10.0%) 363.4H2 172.8 (+13.4%) 176.6 (+6.1%) 18.4 (‐31.7%) 1.5 39.2 (+4.5%) 235.7 (+1.6%) 359.5
354.5 (+15.5%) 302.1 (+7.0%) 27.8 (‐13.6%) 2.5 76.8 (+4.6%) 409.2 (+5.0%)
FY11 H1 189.4 (+4.2%) 145.9 (+16.3%) 11.9 (+26.5%) 1.5 40.6 (+8.3%) 200.0 (+15.2%) 403.0Q3 80.0 (+2.3%) 82.7 (+23.2%) 3.2 (+20.0%) (+11.6%) 109.0 (+20.5%) 400.3H2 182.5 (+5.6%) 193.7 (+9.7%) 11.8 (‐35.7%) (+14.2%) 252.0 (+6.9%) 391.8annual 371.9 (+4.9%) 339.6 (+12.4%) 23.7 (‐14.7%) (+11.8%) 452.0 (+10.4%)88.7
annual
annual
annual
23.1
Value of new ordersduring the term
ConsolidatedSales of order‐built homes
Sales of pre‐built homesConsolidatedsubsidiaries
46.5
(¥ billion, % change from same period of previous year shown at right)
H1
H2forecast
Pre‐built homes
Rental housing
Sales1 and order trends
Q3
27/34
90.7100.9
14.5
9.4
0
50
100
Apr.–Dec. 2011 Apr.–Dec. 20120
5
10
15
Health Care (i)
Sales
(¥ billion)
10.2+11.3%
5.1+54.6%
Operating income
Increase (decrease) due to:
Increase (decrease) due to:
Sales increases/decreases
Sales volume
Sales prices
Foreign exchange Others
Sales volume
Sales prices
Foreign exchange
Operating costs and
others
Operating income increases/decreases
13.6 (2.8) (0.6) 0.0
12.6 (2.8) (0.6)
(4.1)
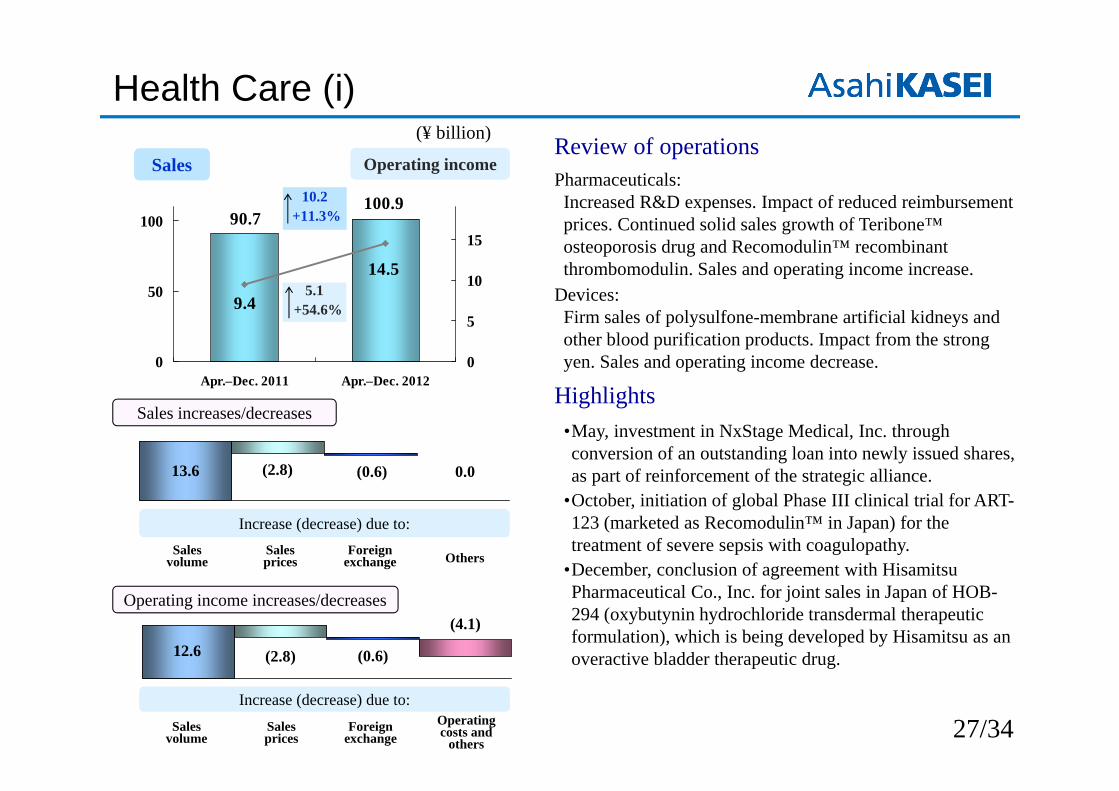
Review of operationsPharmaceuticals: Increased R&D expenses. Impact of reduced reimbursement prices. Continued solid sales growth of Teribone™ osteoporosis drug and Recomodulin™ recombinant thrombomodulin. Sales and operating income increase.
Devices: Firm sales of polysulfone-membrane artificial kidneys and other blood purification products. Impact from the strong yen. Sales and operating income decrease.
Highlights•May, investment in NxStage Medical, Inc. through conversion of an outstanding loan into newly issued shares, as part of reinforcement of the strategic alliance.
•October, initiation of global Phase III clinical trial for ART-123 (marketed as Recomodulin™ in Japan) for the treatment of severe sepsis with coagulopathy.
•December, conclusion of agreement with Hisamitsu Pharmaceutical Co., Inc. for joint sales in Japan of HOB-294 (oxybutynin hydrochloride transdermal therapeutic formulation), which is being developed by Hisamitsu as an overactive bladder therapeutic drug.
28/34
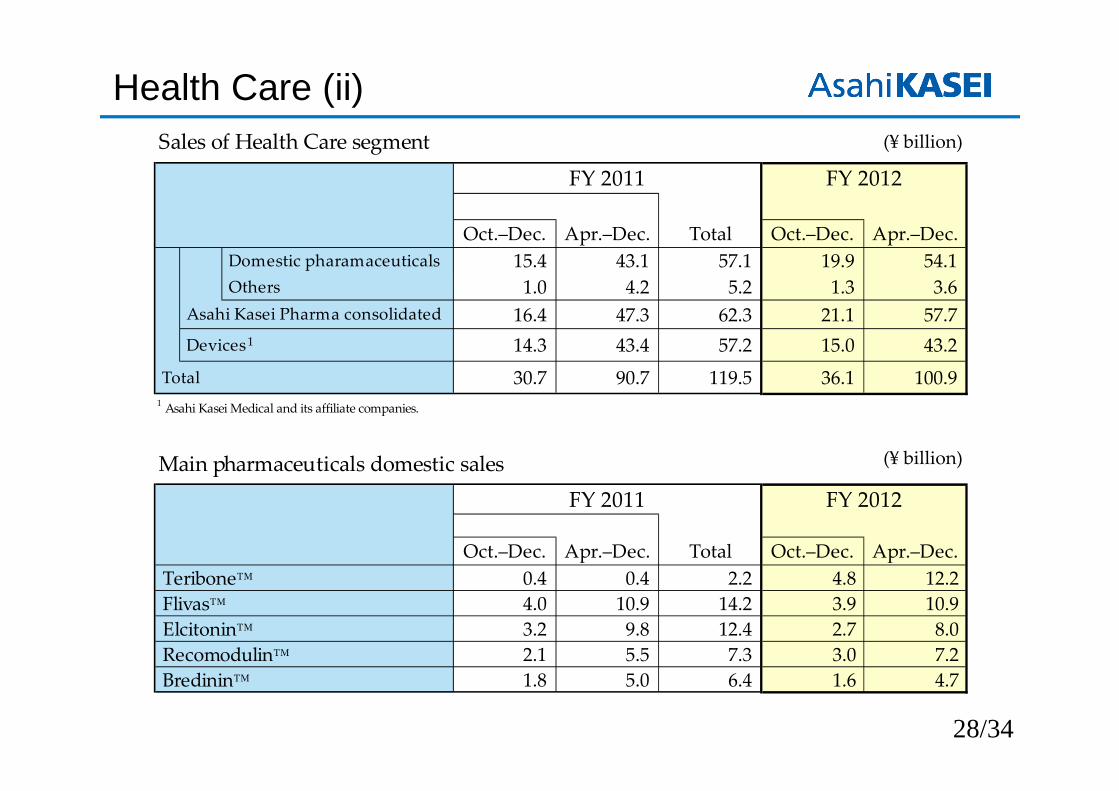
Health Care (ii)Sales of Health Care segment
Oct.–Dec. Apr.–Dec. Total Oct.–Dec. Apr.–Dec.Domestic pharamaceuticals 15.4 43.1 57.1 19.9 54.1Others 1.0 4.2 5.2 1.3 3.6
16.4 47.3 62.3 21.1 57.7 Devices 14.3 43.4 57.2 15.0 43.2Total 30.7 90.7 119.5 36.1 100.9
1 Asahi Kasei Medical and its affiliate companies.
Main pharmaceuticals domestic sales
Oct.–Dec. Apr.–Dec. Total Oct.–Dec. Apr.–Dec. Teribone™ 0.4 0.4 2.2 4.8 12.2 Flivas™ 4.0 10.9 14.2 3.9 10.9 Elcitonin™ 3.2 9.8 12.4 2.7 8.0 Recomodulin™ 2.1 5.5 7.3 3.0 7.2 Bredinin™ 1.8 5.0 6.4 1.6 4.7
Asahi Kasei Pharma consolidated
FY 2012
FY 2012
FY 2011
FY 2011
1
(¥ billion)
(¥ billion)
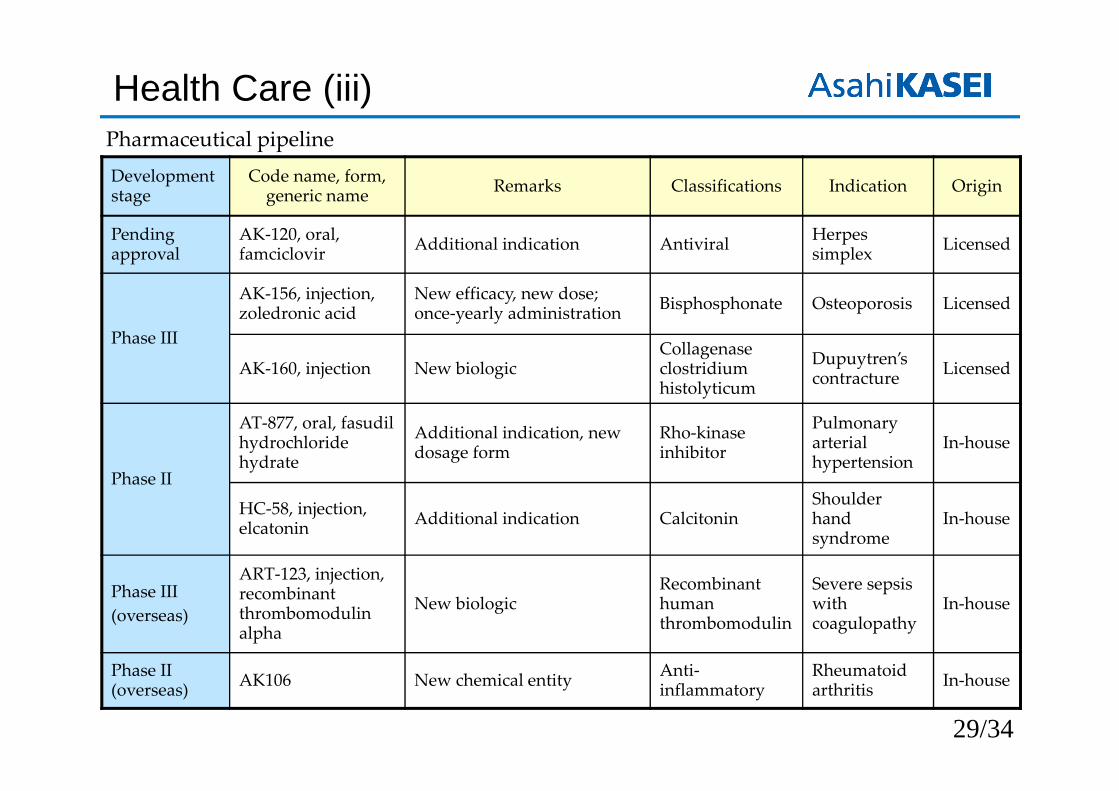
Development stage
Code name, form, generic name Remarks Classifications Indication Origin
Pending approval
AK‐120, oral, famciclovir Additional indication Antiviral Herpes
simplex Licensed
Phase III
AK‐156, injection, zoledronic acid
New efficacy, new dose; once‐yearly administration Bisphosphonate Osteoporosis Licensed
AK‐160, injection New biologicCollagenase clostridium histolyticum
Dupuytren’s contracture Licensed
Phase II
AT‐877, oral, fasudil hydrochloride hydrate
Additional indication, new dosage form
Rho‐kinase inhibitor
Pulmonary arterial hypertension
In‐house
HC‐58, injection, elcatonin Additional indication Calcitonin
Shoulder hand syndrome
In‐house
Phase III(overseas)
ART‐123, injection, recombinant thrombomodulinalpha
New biologicRecombinant human thrombomodulin
Severe sepsis with coagulopathy
In‐house
Phase II (overseas) AK106 New chemical entity Anti‐
inflammatoryRheumatoid arthritis In‐house
29/34
Health Care (iii)Pharmaceutical pipeline
30/34
83.4 81.4
3.02.7
0
40
80
Apr.–Dec. 2011 Apr.–Dec. 20120
2
4
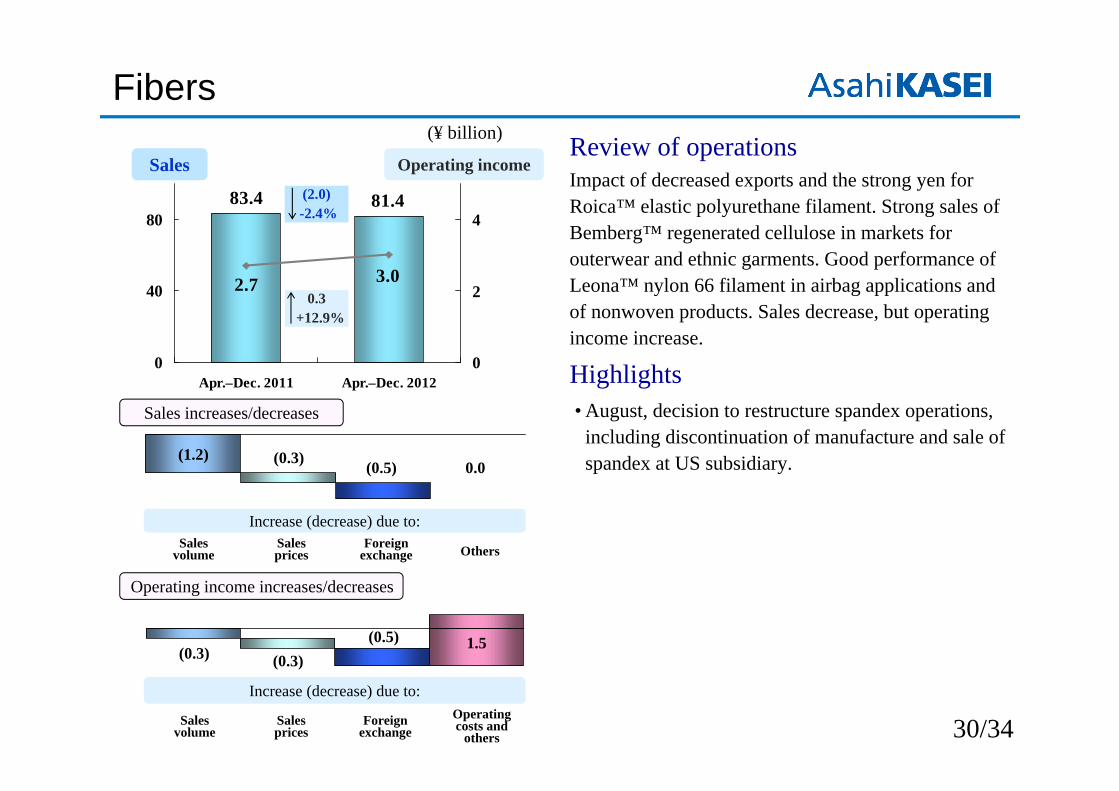
FibersReview of operationsImpact of decreased exports and the strong yen for Roica™ elastic polyurethane filament. Strong sales of Bemberg™ regenerated cellulose in markets for outerwear and ethnic garments. Good performance of Leona™ nylon 66 filament in airbag applications and of nonwoven products. Sales decrease, but operating income increase.
Highlights• August, decision to restructure spandex operations,
including discontinuation of manufacture and sale of spandex at US subsidiary.
Sales
(¥ billion)
(2.0)-2.4%
0.3+12.9%
Operating income
Sales increases/decreases
Increase (decrease) due to:Sales
volumeSales prices
Foreign exchange Others
Increase (decrease) due to:
Sales volume
Sales prices
Foreign exchange
Operating costs and
others
Operating income increases/decreases
(1.2) (0.3) (0.5) 0.0
(0.3) (0.3)(0.5) 1.5
31/34
100.2113.2
6.6
1.4
0
40
80
120
Apr.–Dec. 2011 Apr.–Dec. 20120
5
10
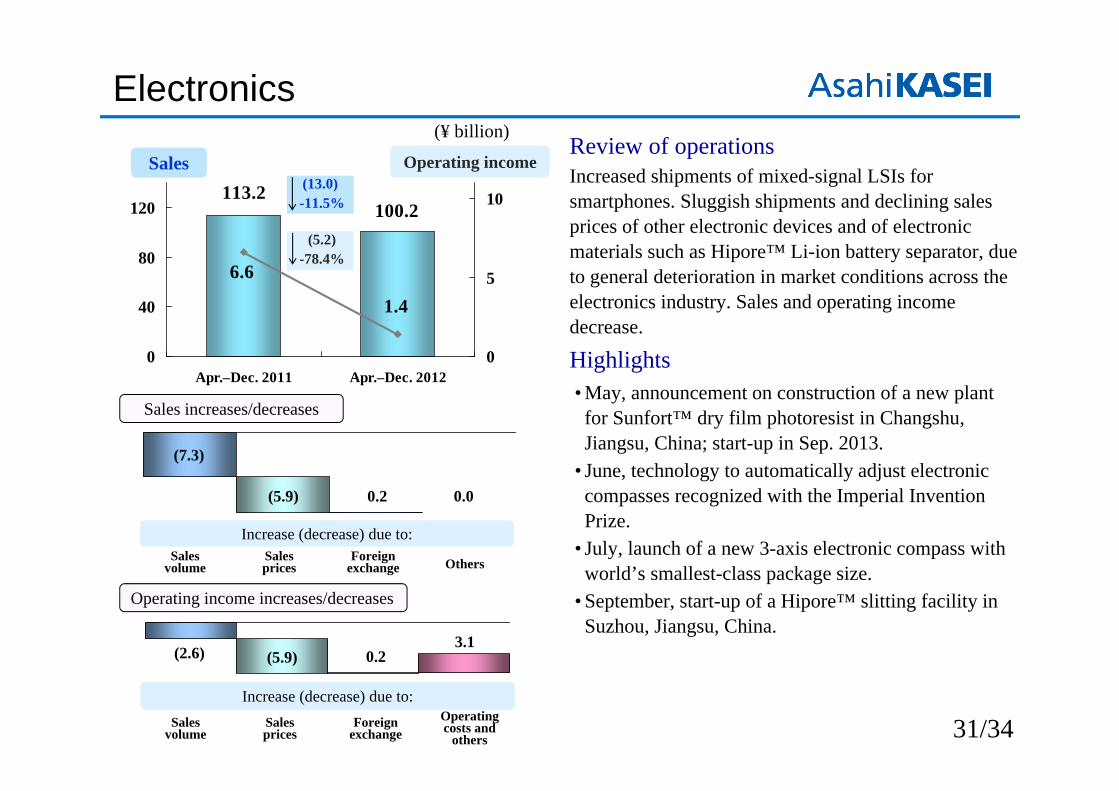
ElectronicsReview of operationsIncreased shipments of mixed-signal LSIs for smartphones. Sluggish shipments and declining sales prices of other electronic devices and of electronic materials such as Hipore™ Li-ion battery separator, due to general deterioration in market conditions across the electronics industry. Sales and operating income decrease.
Highlights• May, announcement on construction of a new plant for Sunfort™ dry film photoresist in Changshu, Jiangsu, China; start-up in Sep. 2013.
• June, technology to automatically adjust electronic compasses recognized with the Imperial Invention Prize.
• July, launch of a new 3-axis electronic compass with world’s smallest-class package size.
• September, start-up of a Hipore™ slitting facility in Suzhou, Jiangsu, China.
(¥ billion)
Sales
(5.2)-78.4%
(13.0)-11.5%
Operating income
Increase (decrease) due to:
Sales increases/decreases
Increase (decrease) due to:Sales
volumeSales prices
Foreign exchange
Operating costs and
others
Sales volume
Sales prices
Foreign exchange Others
Operating income increases/decreases
(7.3)
(5.9) 0.2 0.0
(2.6) (5.9) 0.23.1
32/34
35.039.2
1.7
3.3
0
20
40
Apr.–Dec. 2011 Apr.–Dec. 20120
2
4
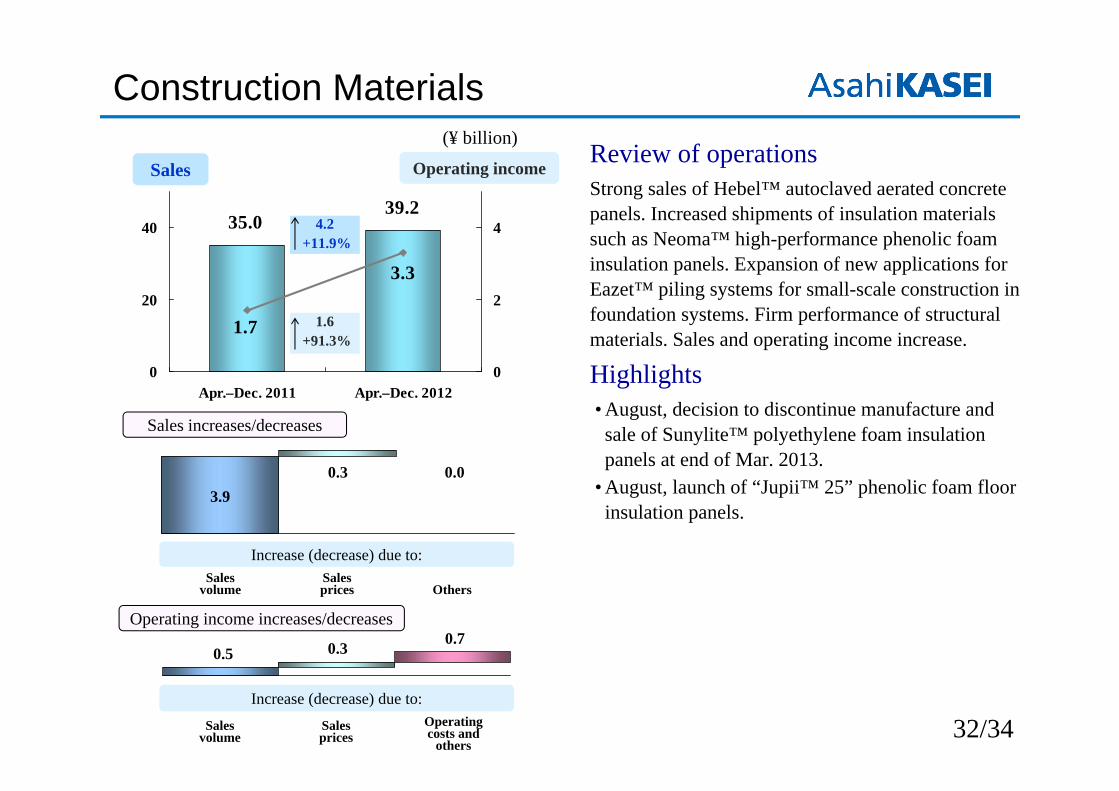
Construction Materials
Review of operationsStrong sales of Hebel™ autoclaved aerated concrete panels. Increased shipments of insulation materials such as Neoma™ high-performance phenolic foam insulation panels. Expansion of new applications for Eazet™ piling systems for small-scale construction in foundation systems. Firm performance of structural materials. Sales and operating income increase.
Highlights• August, decision to discontinue manufacture and sale of Sunylite™ polyethylene foam insulation panels at end of Mar. 2013.
• August, launch of “Jupii™ 25” phenolic foam floor insulation panels.
(¥ billion)
Sales
1.6+91.3%
4.2+11.9%
Operating income
Sales increases/decreases
Increase (decrease) due to:
Increase (decrease) due to:Sales
volumeSales prices Others
Sales volume
Sales prices
Operating costs and
others
Operating income increases/decreases
3.90.3 0.0
0.5 0.3 0.7
36.2
(2.3)
0
20
40
Apr.–Dec. 2011 Apr.–Dec. 2012(3)
(2)
(1)
0
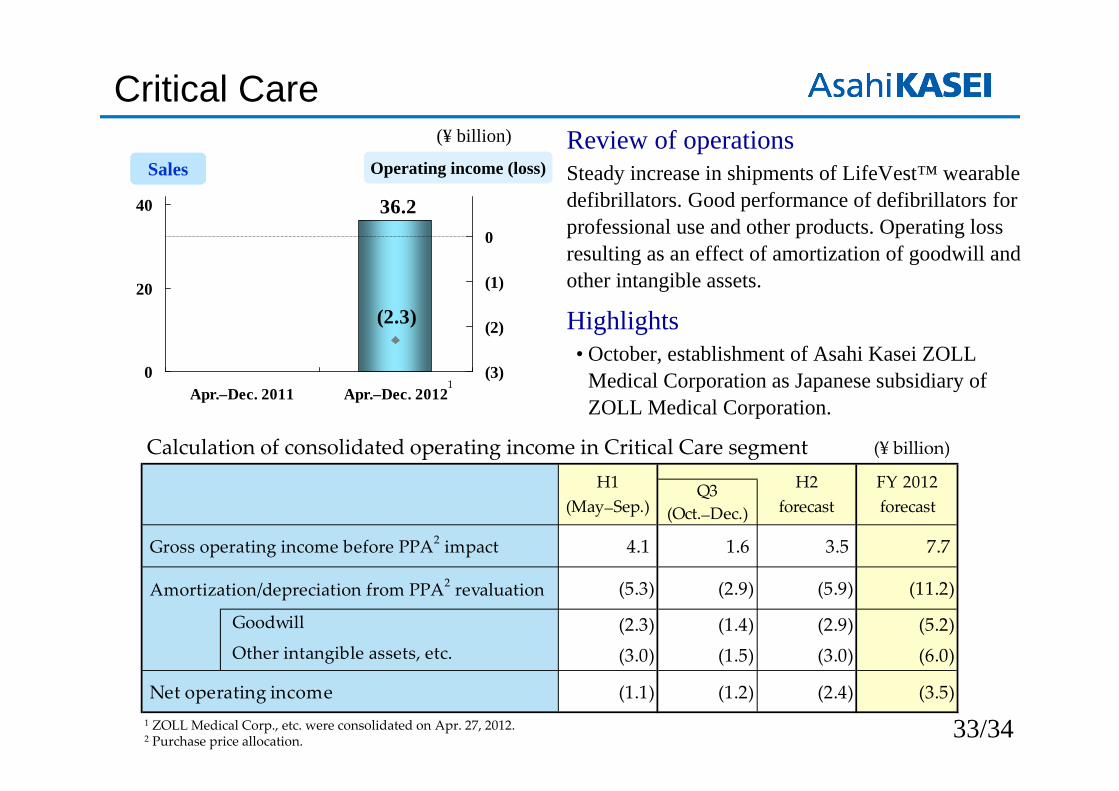
Critical Care
Sales
(¥ billion)
Operating income (loss)Review of operationsSteady increase in shipments of LifeVest™ wearable defibrillators. Good performance of defibrillators for professional use and other products. Operating loss resulting as an effect of amortization of goodwill and other intangible assets.
Highlights• October, establishment of Asahi Kasei ZOLL
Medical Corporation as Japanese subsidiary of ZOLL Medical Corporation.
Q3(Oct.–Dec.)
4.1 1.6 3.5 7.7
Amortization/depreciation from PPA2 revaluation (5.3) (2.9) (5.9) (11.2)
Goodwill (2.3) (1.4) (2.9) (5.2) Other intangible assets, etc. (3.0) (1.5) (3.0) (6.0)
Net operating income (1.1) (1.2) (2.4) (3.5)
H1(May–Sep.)
H2forecast
FY 2012forecast
Gross operating income before PPA2 impact
(¥ billion)
33/34
Calculation of consolidated operating income in Critical Care segment
1
1 ZOLL Medical Corp., etc. were consolidated on Apr. 27, 2012.2 Purchase price allocation.

The forecasts and estimates shown in this document are dependent on a variety of assumptions and economic conditions. Plans and figures depicting the future do not imply a guarantee of actual outcomes.
– Disclaimer –
34/34


![ASAHI KASEI [AK4113] - Mixed Signal,Magnetic Sensors · PDF fileASAHI KASEI [AK4113] MS0349-E-02 2005/08 - 1 - GENERAL DESCRIPTION The AK4113 is a 24-bit stereo digital audio receiver](https://img.pdfslide.us/doc/110x75/5aabe9bb7f8b9a9c2e8c896f/asahi-kasei-ak4113-mixed-signalmagnetic-sensors-kasei-ak4113-ms0349-e-02.jpg)


![AKD4708-A English Manual - AKM - Asahi Kasei Microdevices · ASAHI KASEI [AKD4708-A] 2007/01 - 4 - CONTROL SOFTWARE MANUAL Set-up of evaluation board and control](https://img.pdfslide.us/doc/110x75/5b1526cd7f8b9a467c8de8e6/akd4708-a-english-manual-akm-asahi-kasei-microdevices-asahi-kasei-akd4708-a.jpg)
![ASAHI KASEI [AK4702EQ] - AKM - Asahi Kasei … KASEI [AK4702EQ] MS0424-E-00 2005/09 - 5 - PIN/FUNCTION No. Pin Name I/O Function 1 VCRC O Chrominance Output Pin for VCR 2 VVSS - Video](https://img.pdfslide.us/doc/110x75/5b0475c77f8b9a8c688db33a/asahi-kasei-ak4702eq-akm-asahi-kasei-kasei-ak4702eq-ms0424-e-00-200509.jpg)