Embed Size (px)
Citation preview
Article J. Braz. Chem. Soc., Vol. 32, No. 4, 722-731, 2021Printed in Brazil - ©2021 Sociedade Brasileira de Química
https://dx.doi.org/10.21577/0103-5053.20200224
*e-mail: [email protected]
Validation of an UHPLC-MS/MS Method for the Determination of Malachite Green, Leucomalachite Green, Crystal Violet, and Leucocrystal Violet in Shrimp,
Fish, and Salmon Muscle Using a Modified QuEChERS Approach
Diego G. Rocha,a Leonardo F. de Souza,a Mary Ane G. Lana,a Thaís M. L. da Silvab and Débora C. S. de Assis *,b
aLaboratório Federal de Defesa Agropecuária (LFDA-MG), Av. Rômulo Joviano, s/n, 33600-000 Pedro Leopoldo-MG, Brazil
bEscola de Veterinária, Universidade Federal de Minas Gerais (UFMG), Av. Antônio Carlos, 6627, 31270-901 Belo Horizonte-MG, Brazil
A quantitative and confirmatory method for detecting the presence of triphenylmethane dyes in shrimp muscle using ultra-high performance liquid chromatography tandem mass spectrometry (UHPLC-MS/MS) and a quick, easy, cheap, effective, rugged and safe (QuEChERS) extraction approach was validated. The method exhibited linearity and selectivity and the coefficient of determination (R2) was higher than 0.95 for all studied analytes. Limits of detection (LODs) varied from 0.32 to 0.44 µg kg-1 and the limit of quantification (LOQ) was determined to be 0.5 µg kg-1
for all studied analytes. The trueness, precision, decision limits (CCα), detection capability (CCβ) and uncertainty presented adequate performance. In addition to the validation in shrimp muscle, fish and salmon muscle were also satisfactory validated as an extension of scope. The suitability of the proposed method was also evaluated through an interlaboratory proficiency test, in which satisfactory results were obtained. The fully validated method is thus suitable for the analysis of triphenylmethane dyes in shrimp, fish, and salmon muscle.
Keywords: crystal violet, leucocrystal violet, malachite green, leucomalachite green, QuEChERS
Introduction
The stressful conditions in the intensive production systems used to grow fish and other organisms in aquaculture can render these organisms more susceptible to infectious diseases. Therefore, the use of veterinary drugs is extremely important to ensure the high productivity of the production systems. The main reported diseases in fish farming are caused by opportunistic pathogens and manifest themselves when fish are subjected to chronic stress, such as inadequate handling practices, nutritional deficiencies, low water quality, and high animal density.1
Two triphenylmethane dyes, namely crystal violet (CV) and malachite green (MG) are commonly used to control diseases caused by opportunistic pathogens in fish.2
MG is an N-methylated triphenylmethane dye that is used mostly in the leather, wool, cotton, silk, jute, paper, and other fibers industries.3 In addition, MG, since 1930, has been used
as antifungal and antiprotozoal agent in aquaculture and it has been registered as a veterinary product for the treatment of ornamental fish.4-6 When administered to fishes, MG is absorbed, metabolized, and reduced to leucomalachite green (LMG), a non-polar and colorless compound. Most of the LMG residues are accumulated in the adipose tissues of fish, and therefore, fatty fish tend to present a higher LMG concentrations in their tissues than lean fish.1,3
CV, also known as gentian violet, is a triphenylmethane dye7 that is widely used by women as hair dye. In addition, CV is used in industrial processes during the manufacturing of wood, leather, silk, nylon, paper, and as biological contrast for microscopy. Furthermore, CV has been used as animal, and particularly bird feed additive to inhibiting the growth of fungi since the 1990s.2 Because CV, like MG, is an inexpensive and readily available dye, it is used for fungus and parasite control in fish farms. CV is readily absorbed in fish tissues via exposure to water, and is subsequently metabolized and reduced to leucocrystal violet (LCV), a persistent metabolite.4,5
Validation of an UHPLC-MS/MS Method for the Determination of Malachite Green, Leucomalachite Green, Crystal Violet, and Leucocrystal Violet in Shrimp,
Fish, and Salmon Muscle Using a Modified QuEChERS Approach
Diego G. Rocha,a Leonardo F. de Souza,a Mary Ane G. Lana,a Thaís M. L. da Silvab and Débora C. S. de Assis *,b
Rocha et al. 723Vol. 32, No. 4, 2021
Some researchers have reported the harmful effects of exposure to triphenylmethane dyes and their residues, such as teratogenic changes,8 carcinogenic9,10 and clastogenic effects,11 and reproductive disorders in females.9 In addition, the high persistence of LMG and LCV in animal tissues12-14 led to the ban on the use of CV and MG in aquaculture in some countries.
Regulation 2377/9015 published by the European Council and the Joint Expert Committee on Food Additives of the Food and Agriculture Organization of the United Nations (FAO) and the World Health Organization (WHO) did not establish a safe level for the consumption of MG residues in products of animal origin, and therefore, the use of these substances in animals intended for food production is not allowed.3 To ensure that these dyes are not used in fish farms, an efficient monitoring of the entire food supply chain is needed, which requires the availability of suitable analytical methods.
Several studies on methods of analyzing the CV and MG residues and their metabolites in fish have been published so far.2,4,16-22 However, most of the validated analytical methods consist of many extraction and clean-up steps or require solid-phase extraction (SPE) cartridges,4,17,19,21,22 which complicate the analysis. Furthermore, many researchers have investigated the analytes in catfish fillet4,13,19 and a few in shrimp or salmon.17,18,21
Therefore, the objective of this work was to optimize and validate an ultra-high performance liquid chromatography coupled with tandem mass spectrometry (UHPLC-MS/MS) method using a simple extraction procedure for the determination of CV, LCV, MG and LMG residues in shrimp, fish, and salmon muscle tissue.
Experimental
Chemicals and reagents
Analytical grade CV, LCV, LMG, MG, and malachite green-d5 picrate (MG-d5) standards were obtained from Dr. Ehrenstopher (Augsburg, Germany).
Methanol, formic acid, and ammonium acetate were purchased from J.T. Baker (Center Valley, PA, USA). Acetonitrile (ACN) was acquired from Merck (Darmstadt, Germany); magnesium sulfate anhydrous, ascorbic acid, and glacial acetic acid were acquisitioned from Sigma-Aldrich (St. Louis, MO, USA), and dispersive phase Bondesil (C18, 40 µm) was supplied by Agilent Technologies (Santa Clara, CA, USA). All solvents were of high-performance liquid chromatography (HPLC) or higher grade. Ultrapure water was obtained using a Gehaka Master Sigma 100 (Gehaka, São Paulo, Brazil) water purifier.
Instrumentation
The experiments were performed using an Agilent 1200 SL liquid chromatography system coupled to an API 5000 (AB Sciex, Foster City, CA, USA) triple quadrupole mass spectrometer. A Zorbax Eclipse XDB (Agilent, Santa Clara, CA, USA), C18 column (50 mm × 4.6 mm × 1.8 µm) was used for chromatographic separation. The column temperature was set to 60 °C. Mobile phase A consisted of 0.05 M ammonium acetate buffer (pH 4.5) and ACN (35:65 v/v) and mobile phase B consisted of 0.05 M ammonium acetate buffer (pH 4.5) and ACN (20:80 v/v). The flow rate was set at 1.0 mL min-1. The elution gradient was as follows: 0-1.5 min 95% A, 1.5-2 min 5-100% B, 2.0-4.0 min 100% B, and 4.0-6.5 min 95% A. The total run time for each injection was 6.5 min, and the injection volume was 10 µL.
The mass analysis conditions were optimized via infusion injection at a flow rate of 10 µL min-1. Standard solutions were used to determine the most optimal declustering potential, collision energy, and collision cell exit potential. The concentration of the standard solutions was 100 ng mL-1 and the solutions were prepared using methanol/ultrapure water (50:50 v/v) as solvent.
Flow injection analysis was used to optimize the capillary voltage, curtain, nebulizer gas flow rates, and source temperature. The source block temperature and capillary voltage were set at 650 °C and 5 kV, respectively. Nitrogen gas was used as desolvation agent and nebulizer gas at flow rates of 50 L h-1, and argon was used as collision gas. Detection was performed in selected reaction monitoring (SRM) mode and the instrumental controlling and data analysis were performed using the Analyst 1.5.1 software (AB Sciex, Foster City, CA, USA).
Standard solutions
Individual stock standard solutions (100 µg mL-1) were prepared in methanol and were stored at -20 °C for up to one month. The working mixed standard solution was diluted with methanol to 0.02 µg mL-1 and remained stable for one day when stored at -20 °C.
Extraction procedure
Fish and shrimp samples that did not contain any of the studied analytes were obtained from the Brazilian Federal Inspection Service and were used as blank samples. The samples were stored in a freezer at temperatures lower than -10 °C prior to sample extraction. The analytes were extracted from 2 ± 0.100 g samples that had been weighed
Validation of an UHPLC-MS/MS Method J. Braz. Chem. Soc.724
in 50 mL polypropylene centrifuge tubes. Samples were spiked with internal standard at 1.0 µg kg-1 level via the addition of 100 µL of MG-d5 solution (0.02 µg mL-1) to them. Subsequently, 550 µL of ascorbic acid (3.2 g mL-1) and 8 mL of ACN containing 1% (v/v) formic acid were added to the samples. The tubes holding the samples were vortexed for 30 s, and then, 2 g of magnesium sulfate was added to each tube. Afterward, the tubes were centrifuged (4000 rpm) at 4 °C for 25 min. The supernatants were transferred to 15 mL test tubes and were completely evaporated at 50 °C under nitrogen flow. Thereafter, 1 mL of ACN:water (1:1 v/v) was added to each test tube, and the tubes were vortexed for 20 s. Subsequently, the resuspended volume was transferred to a 1.5 mL centrifuge tube that contained 100 mg of C18 dispersive phase and was vortexed for 20 s followed by centrifugation (14000 rpm) at 4 °C for 20 min. The resulting extract was filtered through a filter unit with a hydrophobic polytetrafluoroethylene membrane (pore size of 22 µm, diameter of 13 mm; Analítica, São Paulo, Brazil) and was transferred to a vial for injection. During sample extraction the use of any ink should be avoided (labeling is performed using pencils), and samples should not be excessively exposed to light (lamps are turned-off inside the exhaust hood).
Validation procedure
The validation of the method was performed in accordance with the stipulations of the European Commission Decision 2002/657/EC.23 The linearity, selectivity, trueness, precision (repeatability and intermediate precision), decision limits (CCα), detection capability (CCβ), and robustness of the method were evaluated. The limits of detection and quantification (LOD and LOQ, respectively)24 and measurement uncertainty25 were also assessed. Because MG and CV crystal are banned in aquaculture and no permitted limits have been established for the studied analytes and their metabolites in muscle samples, a minimum required performance level (MRPL) of 2.0 µg kg-1 was set for all studied analytes.
LinearityMatrix-matched calibration curves were prepared
using blank shrimp muscle samples that were spiked with standard analyte solutions at concentrations of 0.25, 0.375, 0.5, 0.75, 1.0, and 1.25 MRPL. All experiments were performed in triplicate. Subsequently, a plot of the ratio of the analyte peak area to the deuterated internal standard area was obtained and the equations of the curves and coefficients of determination (R2) and correlation (r) were obtained via linear regression. The homoscedasticity of
the calibration curve points was assessed using the F-test and the quality of the fit was determined using the t-test at 95% significance.
SelectivityTo assess the selectivity of the method, 20 blank shrimp
muscle samples were analyzed, verifying the presence of signals, peaks, or ion traces in the region of interest, eluting at the same retention time as the target analytes. In addition, the blank samples were spiked with standard solutions of the studied analytes and other veterinary steroid drugs (stanozolol, α-trenbolone, β-trenbolone, diethylstilbestrol, dienestrol, hexestrol, zeranol, taleranol, α-zearalenol, β-zearalenol, zearalenone, 17β-boldenone, methylboldenone, methenolone, norethandrolone and ethysterone), that could interfere with the detection and quantification of the triphenylmethane dyes. The concentrations of the spiking solutions were 0.25, 0.5, and 1.0 MRPL. Subsequently, the recovery values were calculated and the results were compared using the F- and t-tests at 95% significance.
Trueness The trueness of the method was evaluated using
recovery tests. Blank shrimp muscle samples were spiked with concentrations of 0.25, 0.5, and 1.0 MRPL of standard analyte solutions, and each experiment was performed in sextuplicate. Afterward, the samples were analyzed, and the recovery of each sample was calculated as follows: Recovery (%) = measured content/spiking level × 100. According to the recommendation of the Codex Alimentarius, the recovery values, which were used as reference to assess the acceptability of the results, ranged between 50-120% for the concentrations of 0.25 and 0.5 MRPL and between 60-120% for a concentration of 1.0 MRPL.26
PrecisionThe precision of the method was evaluated by
determining the relative standard deviation (RSD) of the results obtained under repeatability and within laboratory reproducibility conditions. The repeatability of the method was obtained by analyzing blank shrimp muscle samples that were spiked with analytical standards solutions with concentrations of 0.25, 0.5, and 1.0 MRPL. All experiments were performed in triplicate. The tests were carried out in short time intervals and were performed under the same conditions (same equipment and analyst). Testing was performed by one analyst on two days and a different analyst on the third day, to replicate within-laboratory reproducibility conditions. The RSD was evaluated
Rocha et al. 725Vol. 32, No. 4, 2021
according to the criteria for the acceptability of results established by the Codex Alimentarius.26
CCα and CCβ CCα and CCβ were calculated using the calibration
curve procedure utilizing the values obtained via the analysis of three calibration curves obtained during three days. The corresponding concentration at the y intercept plus 2.33 times the standard deviation of the within-laboratory reproducibility of the intercept equaled the decision limit (α = 1%).
LOD and LOQ The LOD and LOQ of each analyte were determined
by taking into account the CCα of the method and by analyzing six blank shrimp muscle samples that were spiked with all the analytes at a concentration of 0.25 MRPL, respectively.23 The experiments were performed on two days, and the accuracy and precision were compared with the criteria established by the Codex Alimentarius.26
Measurement uncertainty The measurement uncertainty was obtained using a
“top-down” methodology, in which the individual uncertainties of the calibration curves and intra-laboratory reproducibility standard deviation were combined.25
RobustnessThe robustness of the method was assessed using the
fractional factorial design proposed by Youden and Steiner.27 Three analytical parameters, were selected taking into account the most-likely conditions that could be allowed to vary during analytical routine (the centrifugation time, evaporation temperature, and C18 dispersive phase manufacturer) and the nominal values used for the method were slightly changed (Table 1). The capital letters (A, B and C) in Table 1 denote the nominal values of the method and the corresponding lower-case letters (a, b and c) denote the alternative values. The parameters and their respective variations were randomly combined in eight assays (Table 2) using blank samples spiked at 1.0 MRPL to determine the effect of each factor on the final results. The
standard deviation of the within-laboratory reproducibility (srepro) was compared with that of the difference of factors (sfactor), and when sfactor was higher than srepro the method was considered not robust.
Extension of scope of the method to include fish and salmon muscle tissues matrices
The extension of scope of the validated method to include two new matrices (fish and salmon muscle tissues) was performed by evaluating the linearity, precision, accuracy, CCα, CCβ, and measurement uncertainty.25 Blank fish and salmon muscle tissue samples were spiked with working mixed standard solutions at concentrations of 0.25, 0.375, 0.5, 0.75, 1.0, and 1.25 MRPL in triplicate. The trueness, precision, CCα, CCβ, and measurement uncertainty were evaluated by analyzing 10 blank samples of each matrix that were spiked with a standard solution with a concentration of 1.0 MRPL. These experiments were performed on two separate occasions. A total of 20 samples of each matrix were analyzed, and the precision and accuracy were evaluated using the criteria established by the Codex Alimentarius for the acceptability of results.26 The values obtained during the evaluation of CCα were adopted as LODs for the method, and the LOQ was experimentally determined by analyzing six blank samples of each matrix (fish and salmon muscle tissue) that were spiked with all the analytes at a concentration of 0.25 MRPL. Subsequently, the accuracy and precision were evaluated and compared with the acceptance criteria established by the Codex Alimentarius.26
Evaluation of the suitability of the method
The suitability of the proposed method was evaluated
Table 1. Nominal (A, B and C) and alternative (a, b and c) values of the critical analytical parameters used for robustness evaluation
ParameterNominal condition
Alternative value
A/a centrifugation time / min 20 15
B/b evaporation temperature / °C 50 52
C/c C18 dispersive phase manufacturer Agela Merck
Table 2. Factorial combinations of the analytical parameters used for robustness evaluation
Analytical parameterFactorial combination / runs
1 2 3 4 5 6 7 8
Centrifugation time A A A A a a a a
Evaporation temperature B B b b B b b B
C18 dispersive phase manufacturer C c C c C C c c
The capital letters (A, B and C) denote the nominal values of the method and the corresponding lower-case letters (a, b and c) denote the alternative values.
Validation of an UHPLC-MS/MS Method J. Braz. Chem. Soc.726
using the Fapas® (Sand Hutton, York, UK) proficiency test. A certified reference material, which consisted of fish muscle matrix and one or more of the studied analytes (CV, LCV, MG, and LMG) underwent testing for the identification and quantification of the analytes, and the z-score for our laboratory was calculated.
Results and Discussion
Optimization of the extraction procedures and spectrometric and chromatographic conditions
Owing to the health risks associated with the illegal use of triphenylmethane dyes, a number of analytical methods have been reported2,4,16-22 for the analysis of MG, LMG, CV, and LCV residues in fish and shrimp tissues. However, most of the available analytical methods are based on a combination of liquid/liquid partitioning and purification of the extracts using strong cation-exchange SPE cartridges. Another typical approach consists of converting LMG and LCV into the more ionizable compounds MG and CV, respectively, prior to analysis. However, this involves a time-consuming oxidation reaction.2,21
Thus, to eliminate the use of SPE cartridges, the method in this study was optimized and validated using a quick, easy, cheap, effective, rugged and safe (QuEChERS) approach based on the methodology described by Schneider and Andersen,5 with modifications.
The original QuEChERS method is based on three steps: extraction, partitioning and clean-up, in which the partitioning salts, such as sodium chloride, sodium acetate or citrate are used together with the drying agent magnesium sulfate. However, during method optimization, the use of sodium chloride together with magnesium sulfate was tested with no significant advantage. In this way, magnesium sulfate was effective both as a drying agent and as a partitioning salt, due to the increase in the ionic strength of the medium.
The method described by Schneider and Andersen5
involved the addition of 500 µL of a hydroxylamine solution (9.5 g L-1) to each sample immediately after they were weighed. For our method, 550 µL of an ascorbic acid solution (3.2 g mL-1) was added during this step. Schneider and Andersen5 also used ascorbic acid in conjunction with ACN (1 mL of ascorbic acid and 100 µL of ACN) to dissolve the extract, but only after the evaporation step. In addition, for our method, 100 mg of dispersive phase (C18) was added after resuspending the samples in a solution of ACN and formic acid.
The instability of the dyes could hinder the extraction and instrumental analysis because dyes readily undergo oxidation-reduction reactions and are prone to ultraviolet
degradation, which results in demethylation. Thus, the ascorbic acid solution used during the extraction step acts as antioxidant and prevents the oxidation of the leuco (LCV and LMG) forms into the corresponding non-leuco (CV and MG, respectively) forms.
Mass spectrometry
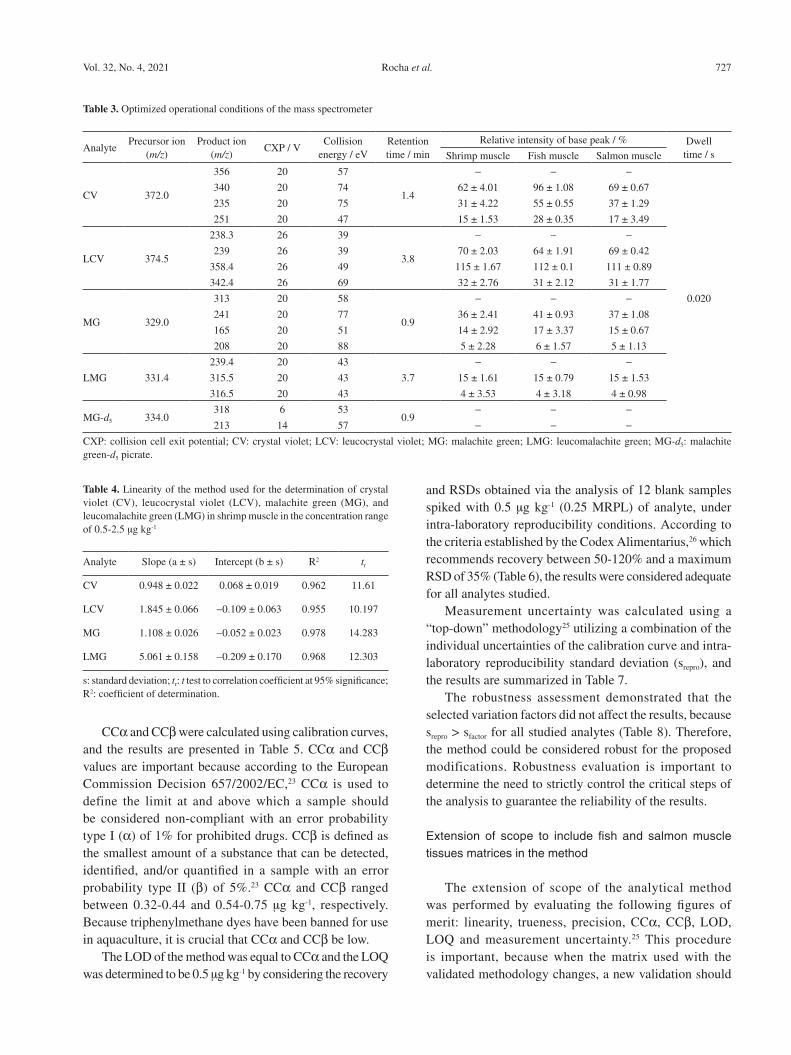
The operational conditions of the mass spectrometer were established via the direct infusion of the standard solutions of the studied analytes. The monitored ion transitions were detected in the electrospray positive mode, with the use of a buffered phase containing ammonium acetate at pH = 5, which proved to be effective to stabilize the detected ions. At least two selected reaction monitoring (SRM) transitions were monitored for each analyte (Table 3). The relative ion intensity was adequate for all studied analytes, according to the criteria established by the European Commission Decision 2002/657/EC.23
Validation study
Shrimp muscleAccording to the linearity evaluation, the working
range was established to be 0.25-1.25 MRPL which was equivalent to 0.50-2.50 µg kg-1. The R2 values were higher than 0.95 for all studied analytes, and the curves were considered linear using the t test to correlation coefficient (tr) at 95% significance, because the tr values were greater than the critical value, t(4; 0.05) = 2.776 (Table 4).
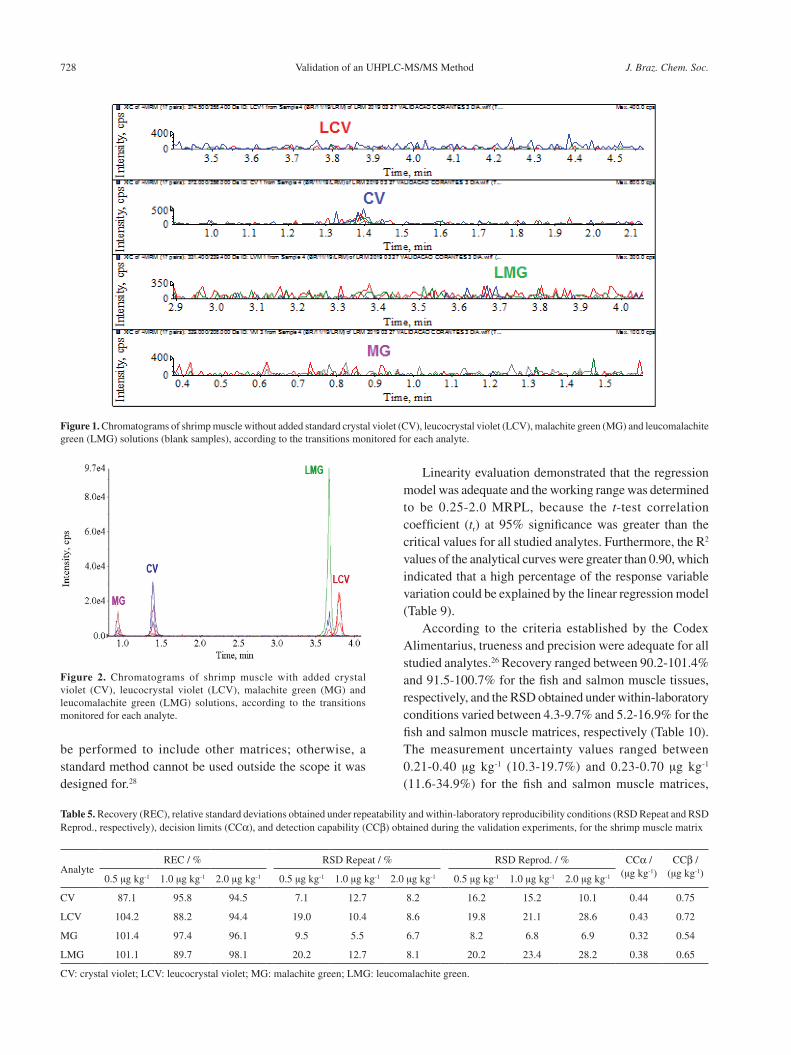
During selectivity evaluation, the method was demonstrated to be selective for the identification and quantification of all studied analytes even in the presence of steroids, because no differences were observed between the recoveries of the analytes determined using the F- and t-tests at 95% significance. Moreover, no interference peaks were detected in the chromatograms of the blank samples (Figure 1) at the same retention time of the analytes of interest, as illustrated in the chromatograms of the spiked samples (Figure 2).
The trueness of the method was adequate for all studied analytes because the recovery varied from 87.1 to 104.2% (Table 5), which was consistent with the reference parameters established by the Codex Alimentarius.26
The precision obtained under repeatability and within-laboratory reproducibility conditions (Table 5) was also satisfactory for all studied analytes in the working range, according to the performance criteria established by the Codex Alimentarius.26 Thus, the method was considered precise for the determination of triphenylmethane dyes in shrimp muscle.
Rocha et al. 727Vol. 32, No. 4, 2021
and RSDs obtained via the analysis of 12 blank samples spiked with 0.5 µg kg-1 (0.25 MRPL) of analyte, under intra-laboratory reproducibility conditions. According to the criteria established by the Codex Alimentarius,26 which recommends recovery between 50-120% and a maximum RSD of 35% (Table 6), the results were considered adequate for all analytes studied.
Measurement uncertainty was calculated using a “top-down” methodology25 utilizing a combination of the individual uncertainties of the calibration curve and intra-laboratory reproducibility standard deviation (srepro), and the results are summarized in Table 7.
The robustness assessment demonstrated that the selected variation factors did not affect the results, because srepro > sfactor for all studied analytes (Table 8). Therefore, the method could be considered robust for the proposed modifications. Robustness evaluation is important to determine the need to strictly control the critical steps of the analysis to guarantee the reliability of the results.
Extension of scope to include fish and salmon muscle tissues matrices in the method
The extension of scope of the analytical method was performed by evaluating the following figures of merit: linearity, trueness, precision, CCα, CCβ, LOD, LOQ and measurement uncertainty.25 This procedure is important, because when the matrix used with the validated methodology changes, a new validation should
Table 3. Optimized operational conditions of the mass spectrometer
AnalytePrecursor ion
(m/z)Product ion
(m/z)CXP / V
Collision energy / eV
Retention time / min
Relative intensity of base peak / % Dwell time / sShrimp muscle Fish muscle Salmon muscle
CV 372.0
356 20 57
1.4
- - -
0.020
340 20 74 62 ± 4.01 96 ± 1.08 69 ± 0.67
235 20 75 31 ± 4.22 55 ± 0.55 37 ± 1.29
251 20 47 15 ± 1.53 28 ± 0.35 17 ± 3.49
LCV 374.5
238.3 26 39
3.8
- - -239 26 39 70 ± 2.03 64 ± 1.91 69 ± 0.42
358.4 26 49 115 ± 1.67 112 ± 0.1 111 ± 0.89
342.4 26 69 32 ± 2.76 31 ± 2.12 31 ± 1.77
MG 329.0
313 20 58
0.9
- - -241 20 77 36 ± 2.41 41 ± 0.93 37 ± 1.08
165 20 51 14 ± 2.92 17 ± 3.37 15 ± 0.67
208 20 88 5 ± 2.28 6 ± 1.57 5 ± 1.13
LMG 331.4
239.4 20 43
3.7
- - -315.5 20 43 15 ± 1.61 15 ± 0.79 15 ± 1.53
316.5 20 43 4 ± 3.53 4 ± 3.18 4 ± 0.98
MG-d5 334.0318 6 53
0.9- - -
213 14 57 - - -CXP: collision cell exit potential; CV: crystal violet; LCV: leucocrystal violet; MG: malachite green; LMG: leucomalachite green; MG-d5: malachite green-d5 picrate.
Table 4. Linearity of the method used for the determination of crystal violet (CV), leucocrystal violet (LCV), malachite green (MG), and leucomalachite green (LMG) in shrimp muscle in the concentration range of 0.5-2.5 µg kg-1
Analyte Slope (a ± s) Intercept (b ± s) R2 tr
CV 0.948 ± 0.022 0.068 ± 0.019 0.962 11.61
LCV 1.845 ± 0.066 -0.109 ± 0.063 0.955 10.197
MG 1.108 ± 0.026 -0.052 ± 0.023 0.978 14.283
LMG 5.061 ± 0.158 -0.209 ± 0.170 0.968 12.303
s: standard deviation; tr: t test to correlation coefficient at 95% significance; R2: coefficient of determination.
CCα and CCβ were calculated using calibration curves, and the results are presented in Table 5. CCα and CCβ values are important because according to the European Commission Decision 657/2002/EC,23 CCα is used to define the limit at and above which a sample should be considered non-compliant with an error probability type I (α) of 1% for prohibited drugs. CCβ is defined as the smallest amount of a substance that can be detected, identified, and/or quantified in a sample with an error probability type II (β) of 5%.23 CCα and CCβ ranged between 0.32-0.44 and 0.54-0.75 µg kg-1, respectively. Because triphenylmethane dyes have been banned for use in aquaculture, it is crucial that CCα and CCβ be low.
The LOD of the method was equal to CCα and the LOQ was determined to be 0.5 µg kg-1 by considering the recovery
Validation of an UHPLC-MS/MS Method J. Braz. Chem. Soc.728
be performed to include other matrices; otherwise, a standard method cannot be used outside the scope it was designed for.28
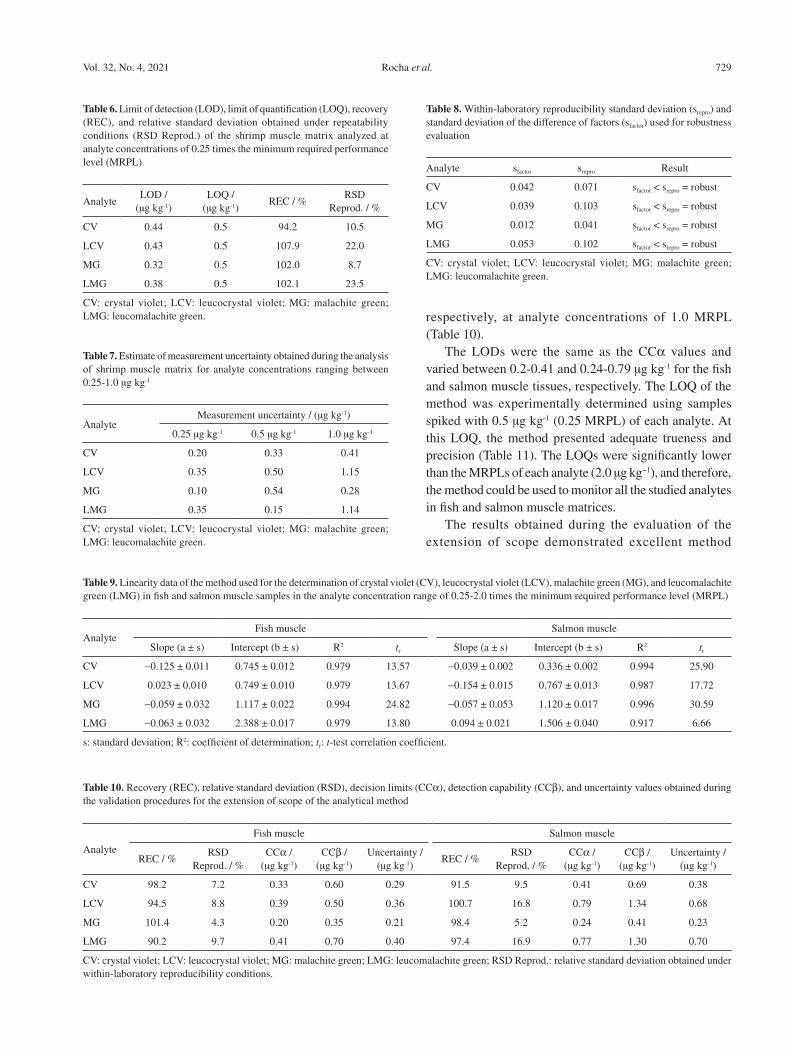
Linearity evaluation demonstrated that the regression model was adequate and the working range was determined to be 0.25-2.0 MRPL, because the t-test correlation coefficient (tr) at 95% significance was greater than the critical values for all studied analytes. Furthermore, the R2 values of the analytical curves were greater than 0.90, which indicated that a high percentage of the response variable variation could be explained by the linear regression model (Table 9).
According to the criteria established by the Codex Alimentarius, trueness and precision were adequate for all studied analytes.26 Recovery ranged between 90.2-101.4% and 91.5-100.7% for the fish and salmon muscle tissues, respectively, and the RSD obtained under within-laboratory conditions varied between 4.3-9.7% and 5.2-16.9% for the fish and salmon muscle matrices, respectively (Table 10). The measurement uncertainty values ranged between 0.21-0.40 µg kg-1 (10.3-19.7%) and 0.23-0.70 µg kg-1 (11.6-34.9%) for the fish and salmon muscle matrices,
Figure 1. Chromatograms of shrimp muscle without added standard crystal violet (CV), leucocrystal violet (LCV), malachite green (MG) and leucomalachite green (LMG) solutions (blank samples), according to the transitions monitored for each analyte.
Figure 2. Chromatograms of shrimp muscle with added crystal violet (CV), leucocrystal violet (LCV), malachite green (MG) and leucomalachite green (LMG) solutions, according to the transitions monitored for each analyte.
Table 5. Recovery (REC), relative standard deviations obtained under repeatability and within-laboratory reproducibility conditions (RSD Repeat and RSD Reprod., respectively), decision limits (CCα), and detection capability (CCβ) obtained during the validation experiments, for the shrimp muscle matrix
AnalyteREC / % RSD Repeat / % RSD Reprod. / % CCα /
(µg kg-1)CCβ /
(µg kg-1)0.5 µg kg-1 1.0 µg kg-1 2.0 µg kg-1 0.5 µg kg-1 1.0 µg kg-1 2.0 µg kg-1 0.5 µg kg-1 1.0 µg kg-1 2.0 µg kg-1
CV 87.1 95.8 94.5 7.1 12.7 8.2 16.2 15.2 10.1 0.44 0.75
LCV 104.2 88.2 94.4 19.0 10.4 8.6 19.8 21.1 28.6 0.43 0.72
MG 101.4 97.4 96.1 9.5 5.5 6.7 8.2 6.8 6.9 0.32 0.54
LMG 101.1 89.7 98.1 20.2 12.7 8.1 20.2 23.4 28.2 0.38 0.65
CV: crystal violet; LCV: leucocrystal violet; MG: malachite green; LMG: leucomalachite green.
Rocha et al. 729Vol. 32, No. 4, 2021
Table 6. Limit of detection (LOD), limit of quantification (LOQ), recovery (REC), and relative standard deviation obtained under repeatability conditions (RSD Reprod.) of the shrimp muscle matrix analyzed at analyte concentrations of 0.25 times the minimum required performance level (MRPL)
AnalyteLOD /
(µg kg-1)LOQ /
(µg kg-1)REC / %
RSD Reprod. / %
CV 0.44 0.5 94.2 10.5
LCV 0.43 0.5 107.9 22.0
MG 0.32 0.5 102.0 8.7
LMG 0.38 0.5 102.1 23.5
CV: crystal violet; LCV: leucocrystal violet; MG: malachite green; LMG: leucomalachite green.
Table 7. Estimate of measurement uncertainty obtained during the analysis of shrimp muscle matrix for analyte concentrations ranging between 0.25-1.0 µg kg-1
AnalyteMeasurement uncertainty / (µg kg-1)
0.25 µg kg-1 0.5 µg kg-1 1.0 µg kg-1
CV 0.20 0.33 0.41
LCV 0.35 0.50 1.15
MG 0.10 0.54 0.28
LMG 0.35 0.15 1.14
CV: crystal violet; LCV: leucocrystal violet; MG: malachite green; LMG: leucomalachite green.
Table 8. Within-laboratory reproducibility standard deviation (srepro) and standard deviation of the difference of factors (sfactor) used for robustness evaluation
Analyte sfactor srepro Result
CV 0.042 0.071 sfactor < srepro = robust
LCV 0.039 0.103 sfactor < srepro = robust
MG 0.012 0.041 sfactor < srepro = robust
LMG 0.053 0.102 sfactor < srepro = robust
CV: crystal violet; LCV: leucocrystal violet; MG: malachite green; LMG: leucomalachite green.
Table 9. Linearity data of the method used for the determination of crystal violet (CV), leucocrystal violet (LCV), malachite green (MG), and leucomalachite green (LMG) in fish and salmon muscle samples in the analyte concentration range of 0.25-2.0 times the minimum required performance level (MRPL)
AnalyteFish muscle Salmon muscle
Slope (a ± s) Intercept (b ± s) R2 tr Slope (a ± s) Intercept (b ± s) R2 tr
CV -0.125 ± 0.011 0.745 ± 0.012 0.979 13.57 -0.039 ± 0.002 0.336 ± 0.002 0.994 25.90
LCV 0.023 ± 0.010 0.749 ± 0.010 0.979 13.67 -0.154 ± 0.015 0.767 ± 0.013 0.987 17.72
MG -0.059 ± 0.032 1.117 ± 0.022 0.994 24.82 -0.057 ± 0.053 1.120 ± 0.017 0.996 30.59
LMG -0.063 ± 0.032 2.388 ± 0.017 0.979 13.80 0.094 ± 0.021 1.506 ± 0.040 0.917 6.66
s: standard deviation; R2: coefficient of determination; tr: t-test correlation coefficient.
Table 10. Recovery (REC), relative standard deviation (RSD), decision limits (CCα), detection capability (CCβ), and uncertainty values obtained during the validation procedures for the extension of scope of the analytical method
Analyte
Fish muscle Salmon muscle
REC / %RSD
Reprod. / %CCα /
(µg kg-1)CCβ /
(µg kg-1)Uncertainty /
(µg kg-1)REC / %
RSD Reprod. / %
CCα / (µg kg-1)
CCβ / (µg kg-1)
Uncertainty / (µg kg-1)
CV 98.2 7.2 0.33 0.60 0.29 91.5 9.5 0.41 0.69 0.38
LCV 94.5 8.8 0.39 0.50 0.36 100.7 16.8 0.79 1.34 0.68
MG 101.4 4.3 0.20 0.35 0.21 98.4 5.2 0.24 0.41 0.23
LMG 90.2 9.7 0.41 0.70 0.40 97.4 16.9 0.77 1.30 0.70
CV: crystal violet; LCV: leucocrystal violet; MG: malachite green; LMG: leucomalachite green; RSD Reprod.: relative standard deviation obtained under within-laboratory reproducibility conditions.
respectively, at analyte concentrations of 1.0 MRPL (Table 10).
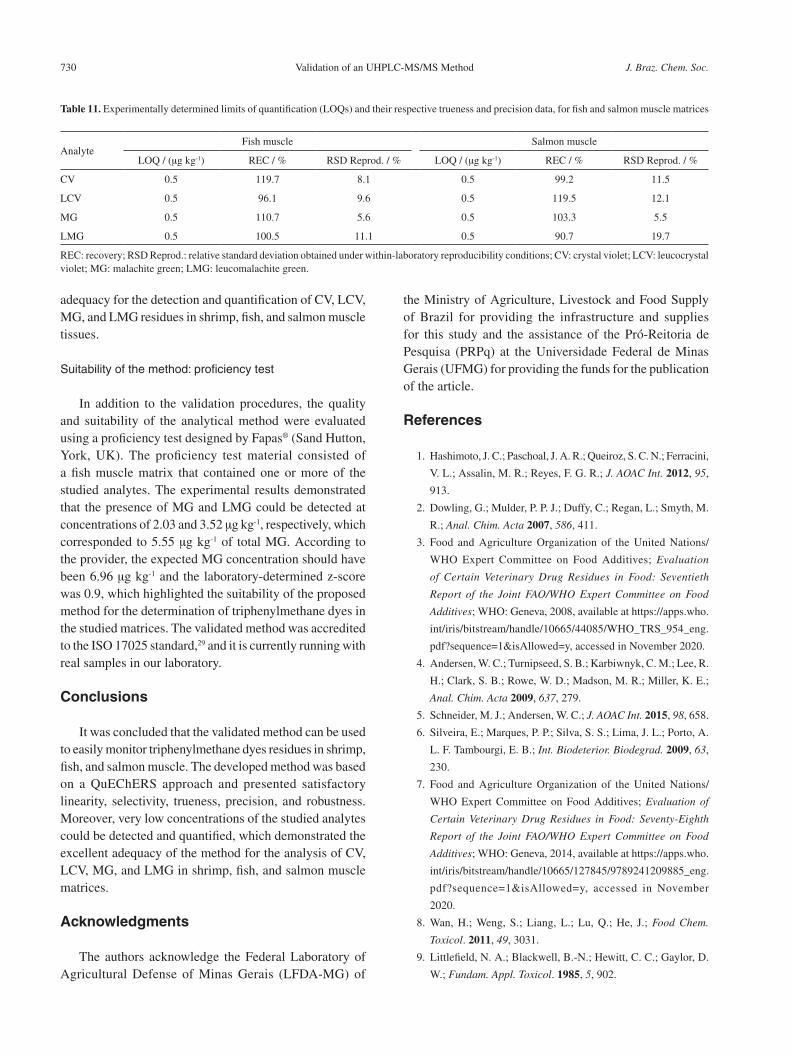
The LODs were the same as the CCα values and varied between 0.2-0.41 and 0.24-0.79 µg kg-1 for the fish and salmon muscle tissues, respectively. The LOQ of the method was experimentally determined using samples spiked with 0.5 µg kg-1 (0.25 MRPL) of each analyte. At this LOQ, the method presented adequate trueness and precision (Table 11). The LOQs were significantly lower than the MRPLs of each analyte (2.0 µg kg−1), and therefore, the method could be used to monitor all the studied analytes in fish and salmon muscle matrices.
The results obtained during the evaluation of the extension of scope demonstrated excellent method
Validation of an UHPLC-MS/MS Method J. Braz. Chem. Soc.730
adequacy for the detection and quantification of CV, LCV, MG, and LMG residues in shrimp, fish, and salmon muscle tissues.
Suitability of the method: proficiency test
In addition to the validation procedures, the quality and suitability of the analytical method were evaluated using a proficiency test designed by Fapas® (Sand Hutton, York, UK). The proficiency test material consisted of a fish muscle matrix that contained one or more of the studied analytes. The experimental results demonstrated that the presence of MG and LMG could be detected at concentrations of 2.03 and 3.52 µg kg-1, respectively, which corresponded to 5.55 µg kg-1 of total MG. According to the provider, the expected MG concentration should have been 6.96 µg kg-1 and the laboratory-determined z-score was 0.9, which highlighted the suitability of the proposed method for the determination of triphenylmethane dyes in the studied matrices. The validated method was accredited to the ISO 17025 standard,29 and it is currently running with real samples in our laboratory.
Conclusions
It was concluded that the validated method can be used to easily monitor triphenylmethane dyes residues in shrimp, fish, and salmon muscle. The developed method was based on a QuEChERS approach and presented satisfactory linearity, selectivity, trueness, precision, and robustness. Moreover, very low concentrations of the studied analytes could be detected and quantified, which demonstrated the excellent adequacy of the method for the analysis of CV, LCV, MG, and LMG in shrimp, fish, and salmon muscle matrices.
Acknowledgments
The authors acknowledge the Federal Laboratory of Agricultural Defense of Minas Gerais (LFDA-MG) of
the Ministry of Agriculture, Livestock and Food Supply of Brazil for providing the infrastructure and supplies for this study and the assistance of the Pró-Reitoria de Pesquisa (PRPq) at the Universidade Federal de Minas Gerais (UFMG) for providing the funds for the publication of the article.
References
1. Hashimoto, J. C.; Paschoal, J. A. R.; Queiroz, S. C. N.; Ferracini,
V. L.; Assalin, M. R.; Reyes, F. G. R.; J. AOAC Int. 2012, 95,
913.
2. Dowling, G.; Mulder, P. P. J.; Duffy, C.; Regan, L.; Smyth, M.
R.; Anal. Chim. Acta 2007, 586, 411.
3. Food and Agriculture Organization of the United Nations/
WHO Expert Committee on Food Additives; Evaluation
of Certain Veterinary Drug Residues in Food: Seventieth
Report of the Joint FAO/WHO Expert Committee on Food
Additives; WHO: Geneva, 2008, available at https://apps.who.
int/iris/bitstream/handle/10665/44085/WHO_TRS_954_eng.
pdf?sequence=1&isAllowed=y, accessed in November 2020.
4. Andersen, W. C.; Turnipseed, S. B.; Karbiwnyk, C. M.; Lee, R.
H.; Clark, S. B.; Rowe, W. D.; Madson, M. R.; Miller, K. E.;
Anal. Chim. Acta 2009, 637, 279.
5. Schneider, M. J.; Andersen, W. C.; J. AOAC Int. 2015, 98, 658.
6. Silveira, E.; Marques, P. P.; Silva, S. S.; Lima, J. L.; Porto, A.
L. F. Tambourgi, E. B.; Int. Biodeterior. Biodegrad. 2009, 63,
230.
7. Food and Agriculture Organization of the United Nations/
WHO Expert Committee on Food Additives; Evaluation of
Certain Veterinary Drug Residues in Food: Seventy-Eighth
Report of the Joint FAO/WHO Expert Committee on Food
Additives; WHO: Geneva, 2014, available at https://apps.who.
int/iris/bitstream/handle/10665/127845/9789241209885_eng.
pdf?sequence=1&isAllowed=y, accessed in November
2020.
8. Wan, H.; Weng, S.; Liang, L.; Lu, Q.; He, J.; Food Chem.
Toxicol. 2011, 49, 3031.
9. Littlefield, N. A.; Blackwell, B.-N.; Hewitt, C. C.; Gaylor, D.
W.; Fundam. Appl. Toxicol. 1985, 5, 902.
Table 11. Experimentally determined limits of quantification (LOQs) and their respective trueness and precision data, for fish and salmon muscle matrices
AnalyteFish muscle Salmon muscle
LOQ / (µg kg-1) REC / % RSD Reprod. / % LOQ / (µg kg-1) REC / % RSD Reprod. / %
CV 0.5 119.7 8.1 0.5 99.2 11.5
LCV 0.5 96.1 9.6 0.5 119.5 12.1
MG 0.5 110.7 5.6 0.5 103.3 5.5
LMG 0.5 100.5 11.1 0.5 90.7 19.7
REC: recovery; RSD Reprod.: relative standard deviation obtained under within-laboratory reproducibility conditions; CV: crystal violet; LCV: leucocrystal violet; MG: malachite green; LMG: leucomalachite green.
Rocha et al. 731Vol. 32, No. 4, 2021
10. Culp, S. J.; Mellick, P. W.; Trotter, R. W.; Greenlees, K. J.;
Kodell, R. L.; Beland, F. A.; Food Chem. Toxicol. 2006, 44,
1204.
11. Au, W.; Pathak, S.; Colie, C. L.; Hsu, T. C.; Mutat. Res. 1978,
58, 269.
12. Culp, S. J.; Beland, F. A.; J. Am. Coll. Toxicol. 1996, 15, 219.
13. Thompson, H. C.; Rushing, L. G.; Gehring, T.; Lochmann, R.;
J. Chromatogr. B: Anal. Technol. Biomed. Life Sci. 1999, 723,
287.
14. Chan, D.; Tarbin, J. A.; Stubbings, G.; Kay, J.; Sharman, M.;
Food Addit. Contam., Part A 2012, 29, 66.
15. European Commission; Council Regulation (EEC) No. 2377/90;
Official Journal of the European Union, 1990, L224, p. 1-8,
available at https://ec.europa.eu/health/sites/health/files/files/
eudralex/vol-5/reg_1990_2377/reg_1990_2377_en.pdf,
accessed in November 2020.
16. Wu, X.; Zhang, G.; Wu, Y.; Hou, X.; Yuan, Z.; J. Chromatogr.
A 2007, 1172, 121.
17. Long, C.; Mai, Z.; Yang, Y.; Zhu, B.; Xu, X.; Lu, L.; Zou, X.;
J. Chromatogr. A 2009, 1216, 2275.
18. Bueno, M. J. M.; Herrera, S.; Uclés, A.; Agüera, A.; Hernando,
M. D.; Shimelis, O.; Rudolfsson, M.; Fernández-Alba, A. R.;
Anal. Chim. Acta 2010, 665, 47.
19. Chen, G.; Miao, S.; J. Agric. Food Chem. 2010, 58, 7109.
20. Shen, Y.-D.; Deng, X.-F.; Xu, Z.-L.; Wang, Y.; Lei, H.-T.; Wang,
H.; Yang, J.-Y.; Xiao, Z.-L.; Sun, Y.-M.; Anal. Chim. Acta 2011,
707, 148.
21. Ascari, J.; Dracz, S.; Santos, F. A.; Lima, J. A.; Diniz, M. H.
G.; Vargas, E. A.; Food Addit. Contam., Part A 2012, 29, 602.
22. Xie, J.; Peng, T.; Chen, D. D.; Zhang, Q. J.; Wang, G. M.; Wang,
X.; Guo, Q.; Jiang, F.; Chen, D.; Deng, J.; J. Chromatogr. B:
Anal. Technol. Biomed. Life Sci. 2013, 914, 123.
23. European Commission; Commission Decision of 12 August
2002 implementing Council Directive 96/23/EC Concerning
the Performance of Analytical Methods and the Interpretation
of Results (2002/657EC); Official Journal of the European
Union, 2002, L221, p. 8-36, available at https://eur-lex.europa.
eu/legal-content/EN/TXT/PDF/?uri=CELEX:32002D0657&fr
om=EN, accessed in November 2020.
24. International Conference on Harmonization (ICH); Validation
of Analytical Procedures: Text and Methodology Q2 (R1); ICH:
Geneva, 2005, available at https://database.ich.org/sites/default/
files/Q2%28R1%29%20Guideline.pdf, accessed in November
2020.
25. Ministério da Agricultura, Pecuária e Abastecimento
(MAPA); Manual de Garantia da Qualidade Analítica:
Áreas de Identidade e Qualidade de Alimentos e de Insumos;
MAPA/ACS: Brasília, 2015, available at https://www.gov.
br/agricultura/pt-br/assuntos/inspecao/produtos-vegetal/
legislacao-1/biblioteca-de-normas-vinhos-e-bebidas/manual-
de-garantia-da-qualidade-analitica_2015.pdf, accessed in
November 2020.
26. Codex Alimentarius; Guidelines for the Design and
Implementation of National Regulatory Food Safety Assurance
Programmes Associated with the Use of Veterinary Drugs in
Food Producing Animals, CAC/GL 71-2009; 2014, available
at http://www.fao.org/input/download/standards/11252/
CXG_071e_2014.pdf, accessed in November 2020.
27. Youden, W. J.; Steiner, E. H.; Statistical Manual of the AOAC;
Association of Official Analytical Chemists: Washington, DC,
1975.
28. EURACHEM; The Fitness for Purpose of Analytical Methods:
A Laboratory Guide to Method Validation and Related Topics,
2nd ed.; Magnusson, B.; Örnemark, U., eds.; 2014, available
at https://www.eurachem.org/images/stories/Guides/pdf/
MV_guide_2nd_ed_EN.pdf, accessed in November 2020.
29. ABNT NBR ISO/IEC 17025: Requisitos Gerais para
Competência de Laboratórios de Ensaio e Calibração; ABNT:
Rio de Janeiro, 2005.
Submitted: July 14, 2020
Published online: November 11, 2020
This is an open-access article distributed under the terms of the Creative Commons Attribution License.