Embed Size (px)
Citation preview
01/02/2009 Moriond 2009
44th Rencontres de Moriond
Very High Energy Phenomena in the Universe
Why the Swift GRB redshift distribution is changing in time
Dr David Coward & Alan Imerito
University of Western Australia
01/02/2009 Moriond 2009
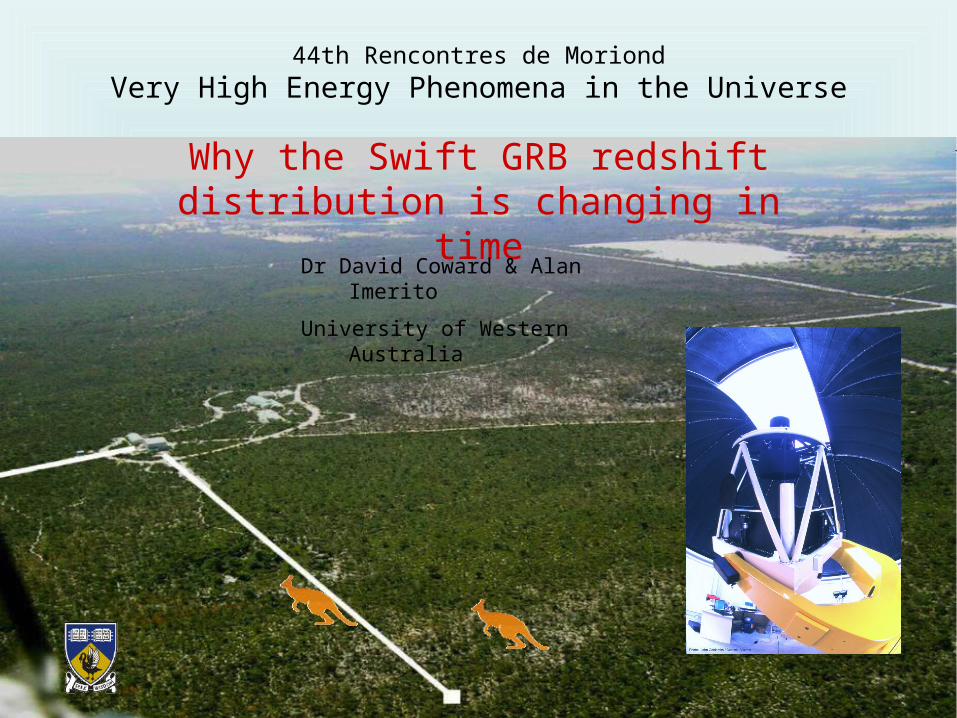
The GRB redshift distribution
• The spatial distribution of GRBs is a powerful probe of GRB rate evolution.• Potentially be used as an independent tracer of massive star formation in the early Universe. • Potentially be used to probe the evolution of GRB environments.
01/02/2009 Moriond 2009
What we observe
• Optical/NIR afterglows have been found for nearly 80% of GRBs
• Only 40–50% of these have measured redshifts (now over 100)
• Optically dark bursts - extinction-
GRB environment, host galaxy type and distance
• Preferentially measure redshifts from optically bright GRBs.
01/02/2009 Moriond 2009
GRB redshift statistics
• Pre-Swift - <z> about 1.4
• Early Swift - <z> about 2.8 (in 2005-2006)
• Swift is more sensitive to higher-z longer duration GRBs
• Recent Swift -<z> about 2 (2008)
• Statistical moments of the redshift distribution should converge to constants given enough statistics
01/02/2009 Moriond 2009
Time series analysis of GRB redshifts
• Search for evolution in statistical moments
• time-dependent selection effects
• 92 long GRB redshifts from 2005-2008
• Motivation - redshifts measured from bright
optical afterglow absorption spectra - expect biases
• This is linked to the efficiency of GRB follow-up telescopes to acquire absorption spectra
01/02/2009 Moriond 2009
Swift triggered redshift time series
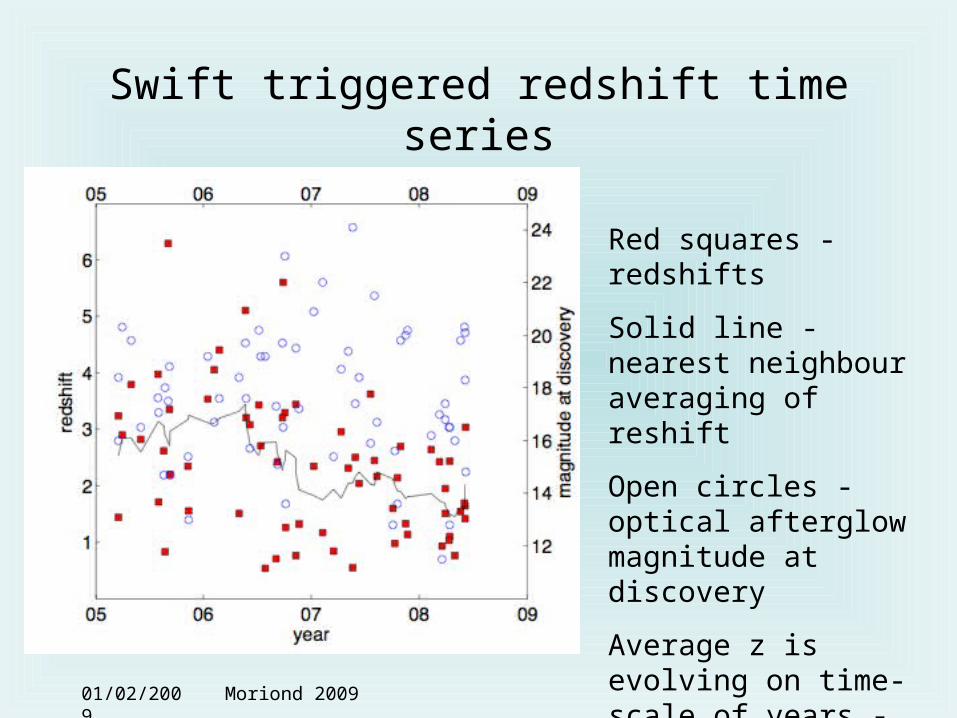
Red squares - redshifts
Solid line - nearest neighbour averaging of reshift
Open circles - optical afterglow magnitude at discovery
Average z is evolving on time-scale of years - must be an observation bias
01/02/2009 Moriond 2009
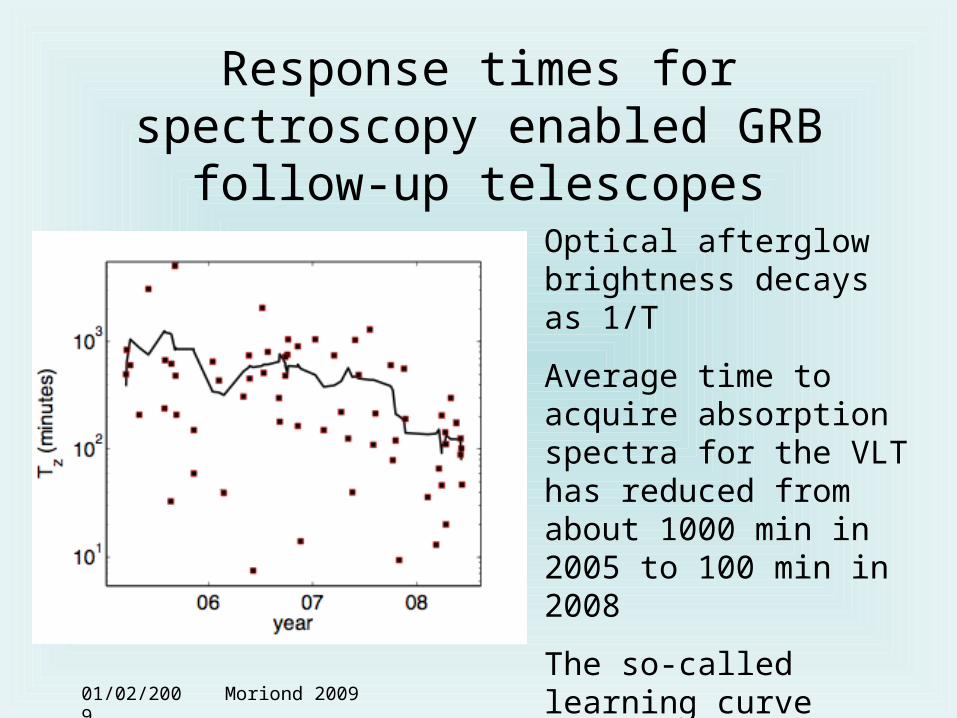
Response times for spectroscopy enabled GRB follow-up telescopes
Optical afterglow brightness decays as 1/T
Average time to acquire absorption spectra for the VLT has reduced from about 1000 min in 2005 to 100 min in 2008
The so-called learning curve effect
01/02/2009 Moriond 2009
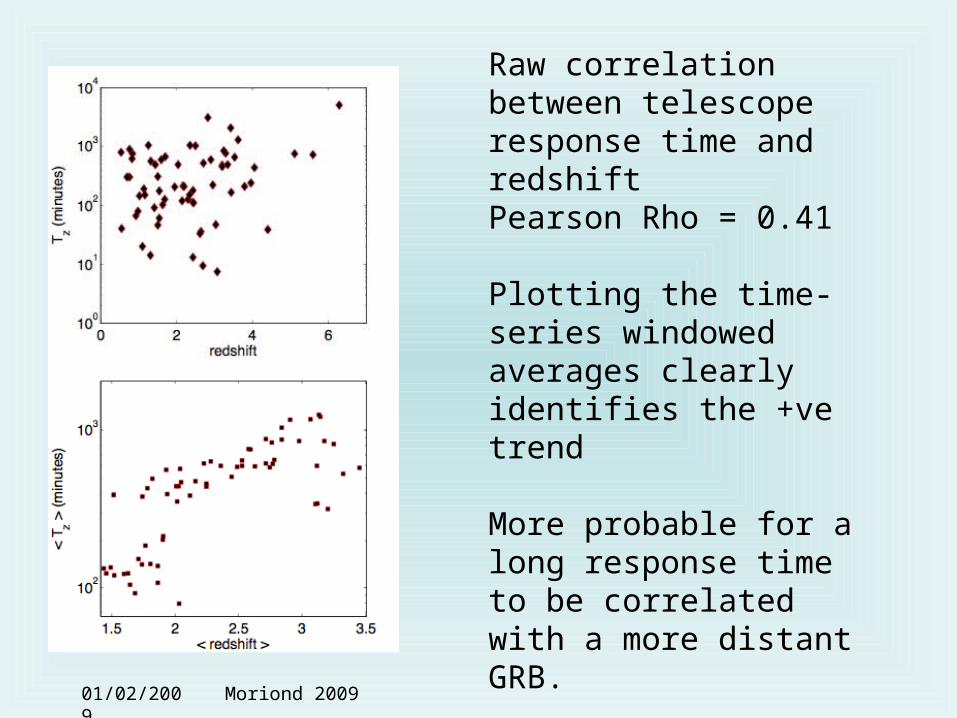
Raw correlation between telescope response time and redshiftPearson Rho = 0.41
Plotting the time-series windowed averages clearly identifies the +ve trend
More probable for a long response time to be correlated with a more distant GRB.
Does this make sense!
01/02/2009 Moriond 2009
Malmquist bias revisited
• Malmquist bias - for flux limited surveys - high-z events originate from the bright end of the GRB optical LF.
• At small-z, can see both faint and bright end of LF.
• Long telescope response times -> fainter OA because of 1/T -> only seen at relatively smaller z
• Short telescope response times -> brighter OA -> seen at relatively higher z
• What we find is the opposite…an “anti-Malmquist” bias!
01/02/2009 Moriond 2009
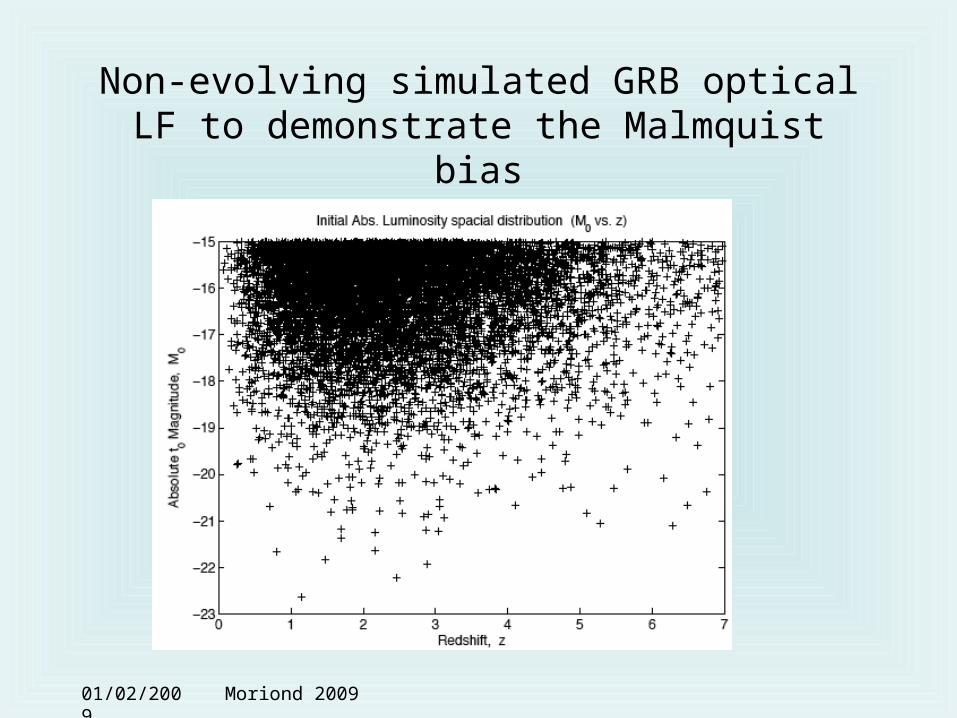
Non-evolving simulated GRB optical LF to demonstrate the Malmquist bias
01/02/2009 Moriond 2009
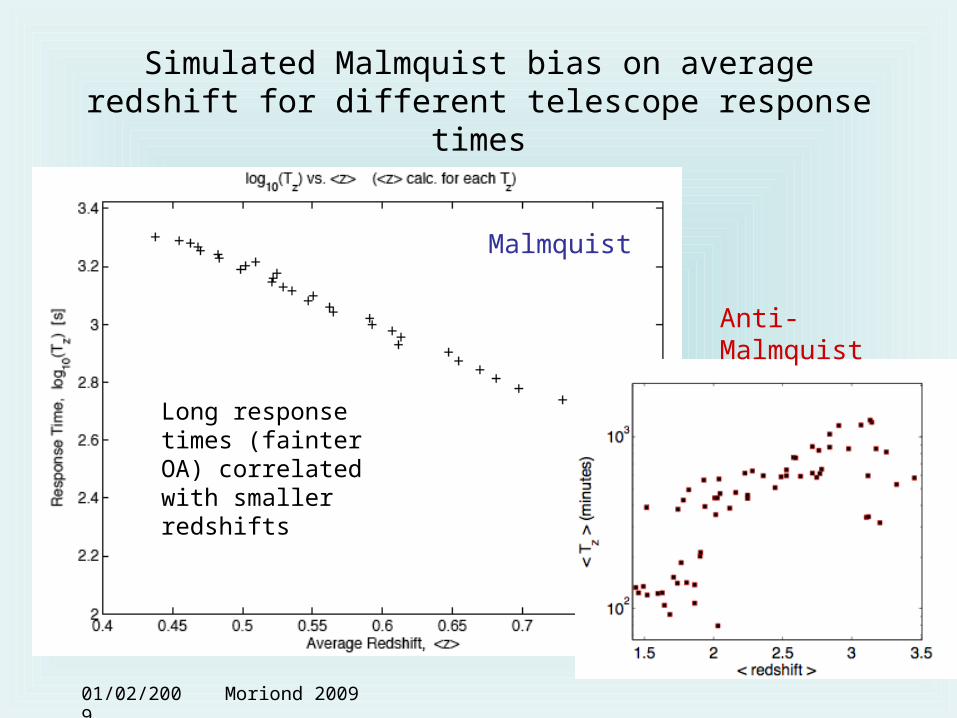
Simulated Malmquist bias on average redshift for different telescope response times
Long response times (fainter OA) correlated with smaller redshifts
Malmquist
Anti-Malmquist
01/02/2009 Moriond 2009
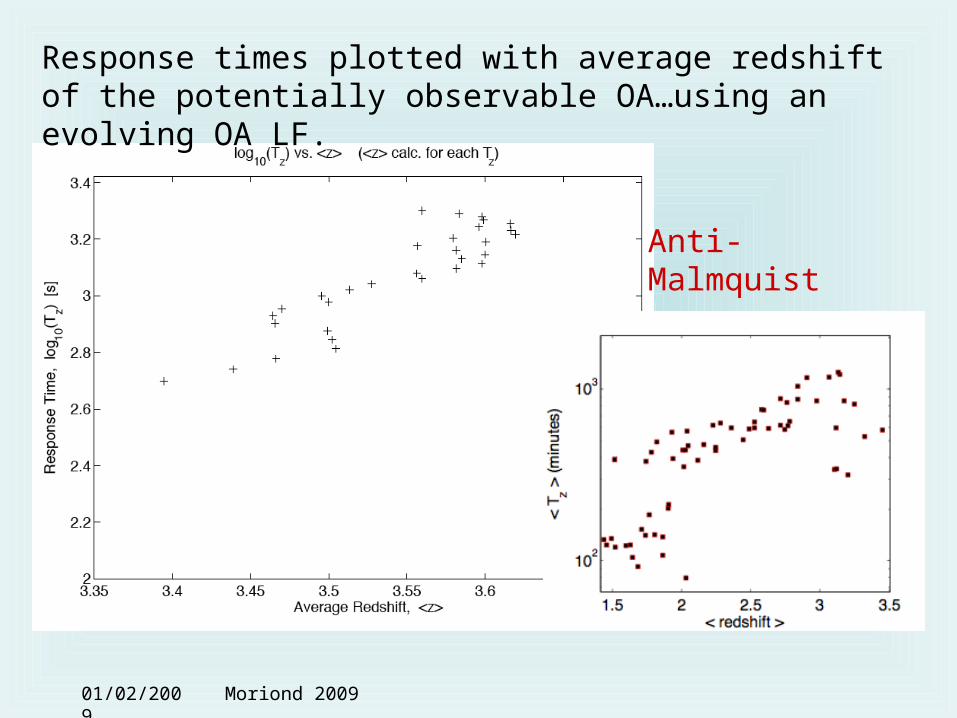
Response times plotted with average redshift of the potentially observable OA…using an evolving OA LF.
Anti-Malmquist
01/02/2009 Moriond 2009
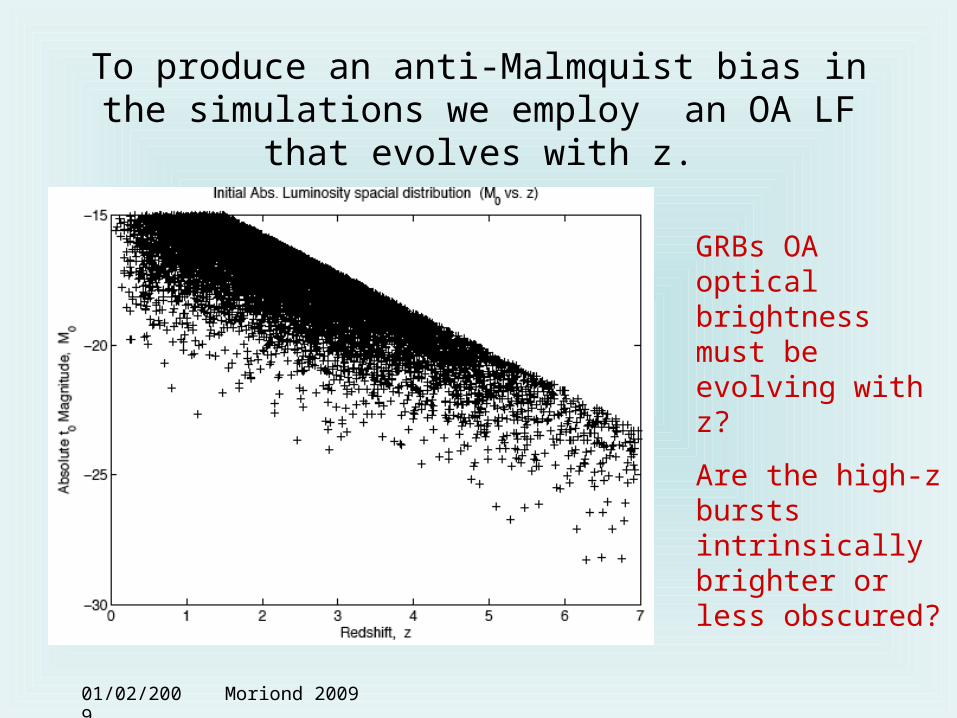
To produce an anti-Malmquist bias in the simulations we employ an OA LF that evolves with z.
GRBs OA optical brightness must be evolving with z?
Are the high-z bursts intrinsically brighter or less obscured?
01/02/2009 Moriond 2009
Summary
• Response times of large telescopes to acquire a redshift are decreasing in 2005-2008 period
• Average GRB redshift is reducing over the same period
• Longer average telescope response times are correlated with larger average redshifts
• An “anti-Malmquist” bias is observed: that is GRBs at high-z are easier to see than expected
• To reconcile this trend, simulations suggest that GRBs at high-z must be relatively brighter than those at small-z
• The analysis implies that GRB optical selection effects are potentially an important tool for probing GRB environments
01/02/2009 Moriond 2009
Future work
• Use OA data to confirm how the OA brightness affects the probability of obtaining a redshift
• Differentiate between dust obscuration and intrinsic GRB brightness
• Is the change of GRB optical obscuration with z linked with the history of massive star evolution?
• Selection effects in astronomy are often considered a problem…in this case they might actually reveal new insight into the origin and evolution of of GRBs
01/02/2009 Moriond 2009
Acknowledgements
• Australian Research Council• UWA• Moriond 09 organisers - Hady schenten and
many others• I have only seen snow twice in my lifetime…
Moriond 09 is the second time