Embed Size (px)
Citation preview
Patent Public Advisory Committee Meeting
Patent Operations
Andy Faile Deputy Commissioner for Patent Operations September 27, 2012
0
25,000
50,000
75,000
100,000
125,000
150,000
175,000
200,000
225,000
250,000
275,000
300,000
325,000
350,000
375,000
400,000
425,000
450,000
475,000
500,000
525,000
550,000
2001 2002 2003 2004 2005 2006 2007 2008 2009 2010 2011 2012(Pres. Budget
(Projected)
2012(Actuals)
Appl
icatio
ns
Fiscal Year
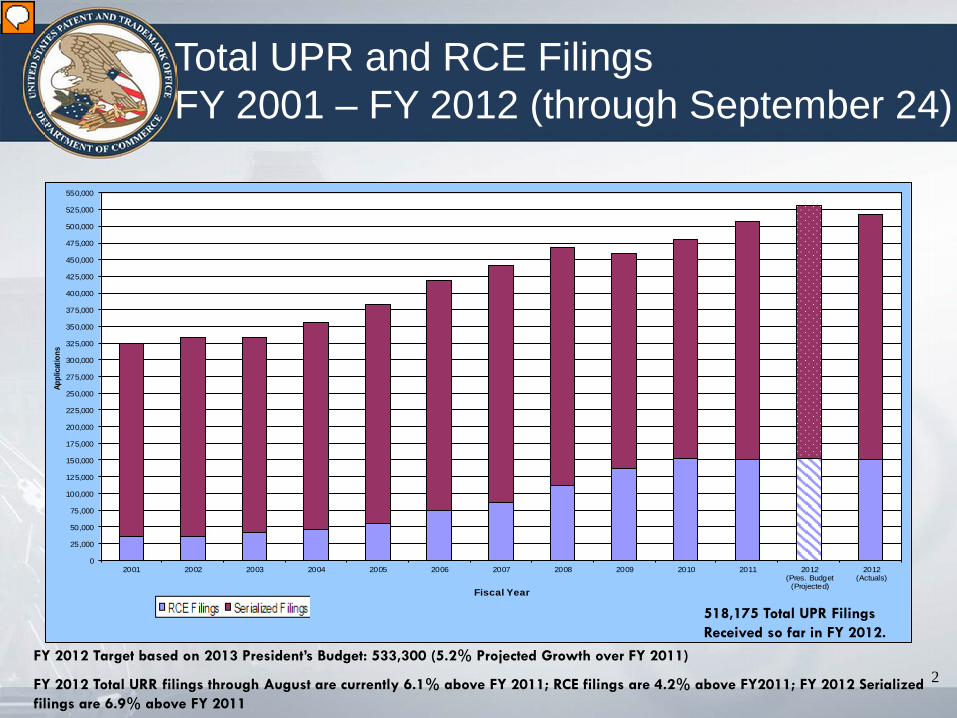
Total UPR and RCE Filings FY 2001 – FY 2012 (through September 24)
FY 2012 Target based on 2013 President’s Budget: 533,300 (5.2% Projected Growth over FY 2011)
FY 2012 Total URR filings through August are currently 6.1% above FY 2011; RCE filings are 4.2% above FY2011; FY 2012 Serialized filings are 6.9% above FY 2011
518,175 Total UPR Filings Received so far in FY 2012.
2
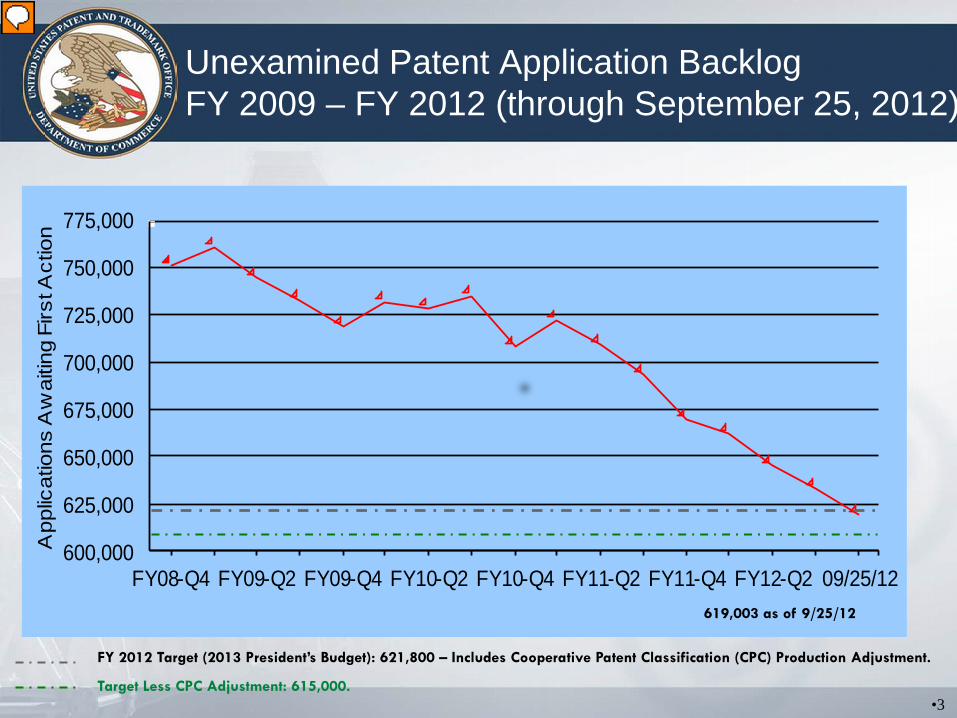
Unexamined Patent Application Backlog FY 2009 – FY 2012 (through September 25, 2012)
•618,600 as of September 12, 2012
FY 2012 Target (2013 President’s Budget): 621,800 – Includes Cooperative Patent Classification (CPC) Production Adjustment.
Target Less CPC Adjustment: 615,000. •3
600,000
625,000
650,000
675,000
700,000
725,000
750,000
775,000
FY08-Q4 FY09-Q2 FY09-Q4 FY10-Q2 FY10-Q4 FY11-Q2 FY11-Q4 FY12-Q2 09/25/12
App
licat
ions
Aw
aitin
g Fi
rst A
ctio
n
619,003 as of 9/25/12
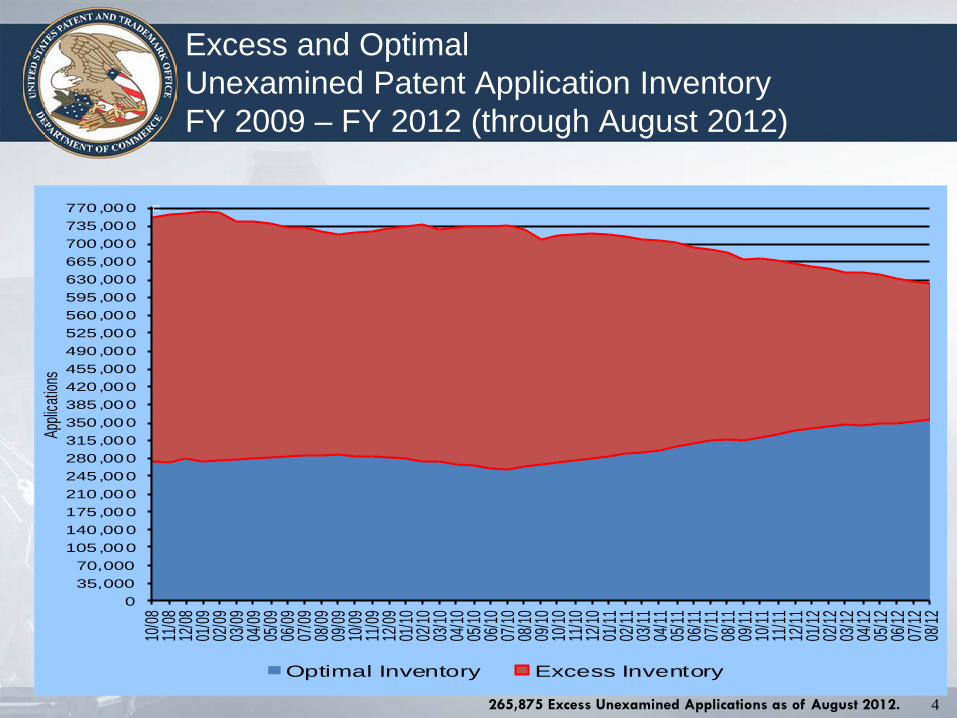
Excess and Optimal Unexamined Patent Application Inventory FY 2009 – FY 2012 (through August 2012)
035,00070,000
105,000140,000175,000210,000245,000280,000315,000350,000385,000420,000455,000490,000525,000560,000595,000630,000665,000700,000735,000770,000
10/08
11/08
12/08
01/09
02/09
03/09
04/09
05/09
06/09
07/09
08/09
09/09
10/09
11/09
12/09
01/10
02/10
03/10
04/10
05/10
06/10
07/10
08/10
09/10
10/10
11/10
12/10
01/11
02/11
03/11
04/11
05/11
06/11
07/11
08/11
09/11
10/11
11/11
12/11
01/12
02/12
03/12
04/12
05/12
06/12
07/12
08/12
Applic
ation
s
Optimal Inventory Excess Inventory
265,875 Excess Unexamined Applications as of August 2012. 4
5
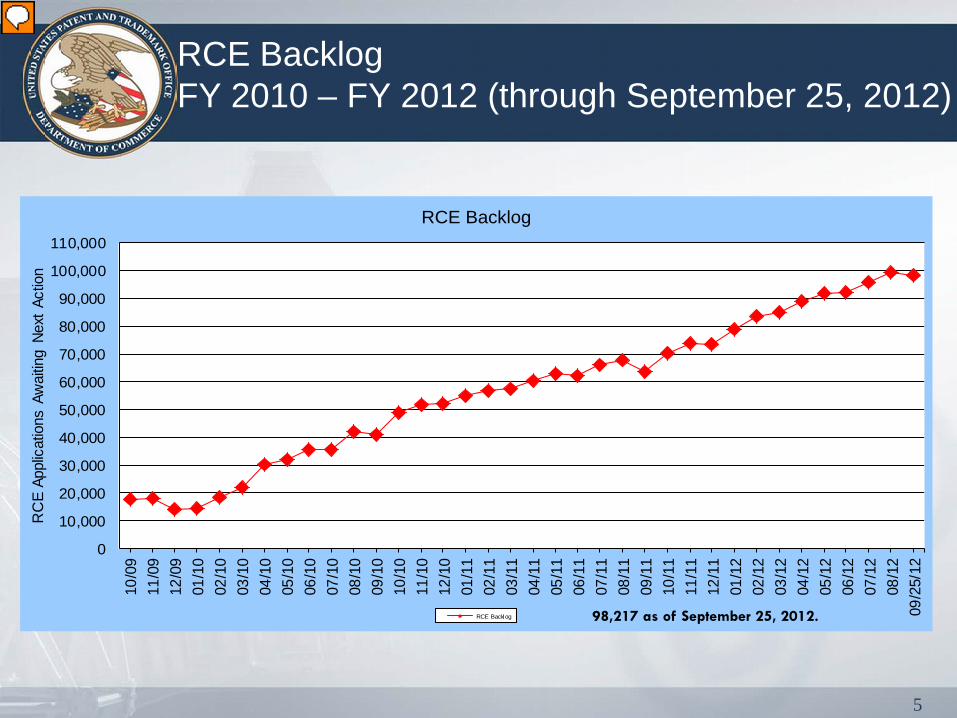
RCE Backlog FY 2010 – FY 2012 (through September 25, 2012)
0
10,000
20,000
30,000
40,000
50,000
60,000
70,000
80,000
90,000
100,000
110,000
10/0
911
/09
12/0
901
/10
02/1
003
/10
04/1
005
/10
06/1
007
/10
08/1
009
/10
10/1
011
/10
12/1
001
/11
02/1
103
/11
04/1
105
/11
06/1
107
/11
08/1
109
/11
10/1
111
/11
12/1
101
/12
02/1
203
/12
04/1
205
/12
06/1
207
/12
08/1
209
/25/
12
RC
E Ap
plic
atio
ns A
wai
ting
Next
Act
ion
RCE Backlog
RCE Backlog 98,217 as of September 25, 2012.
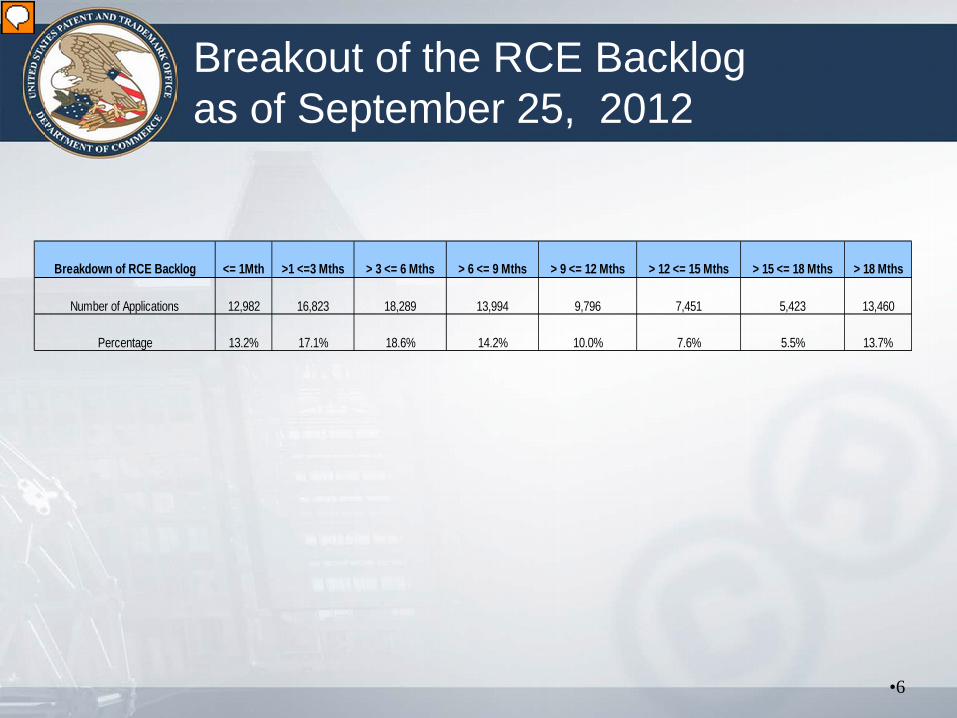
Breakout of the RCE Backlog as of September 25, 2012
•6
Breakdown of RCE Backlog <= 1Mth >1 <=3 Mths > 3 <= 6 Mths > 6 <= 9 Mths > 9 <= 12 Mths > 12 <= 15 Mths > 15 <= 18 Mths > 18 Mths
Number of Applications 12,982 16,823 18,289 13,994 9,796 7,451 5,423 13,460
Percentage 13.2% 17.1% 18.6% 14.2% 10.0% 7.6% 5.5% 13.7%
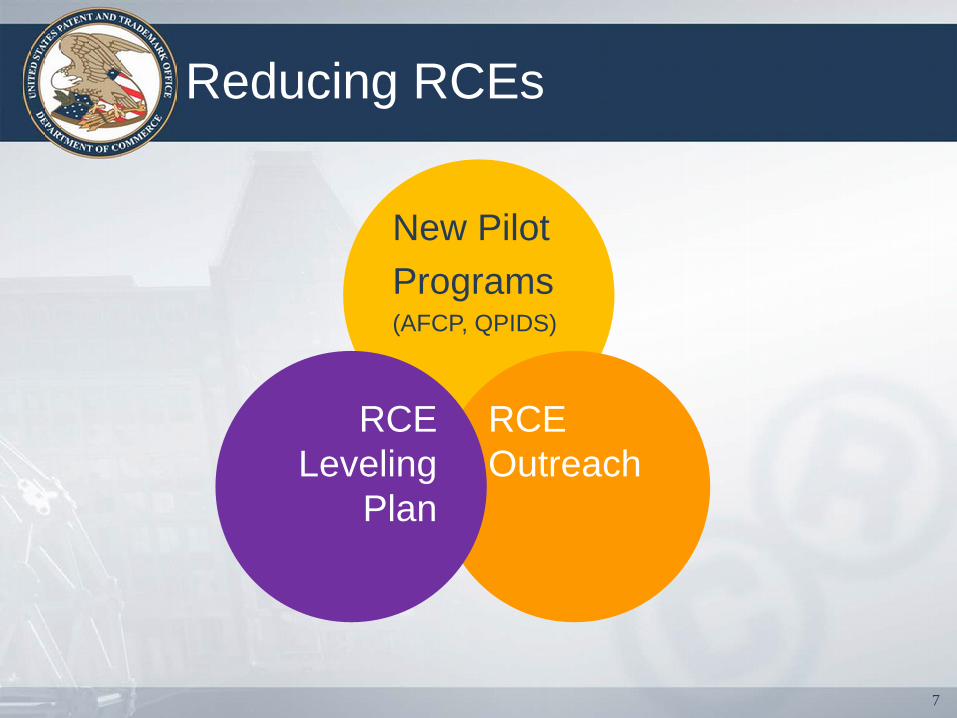
Reducing RCEs
7
New Pilot Programs (AFCP, QPIDS)
RCE Outreach
RCE Leveling
Plan
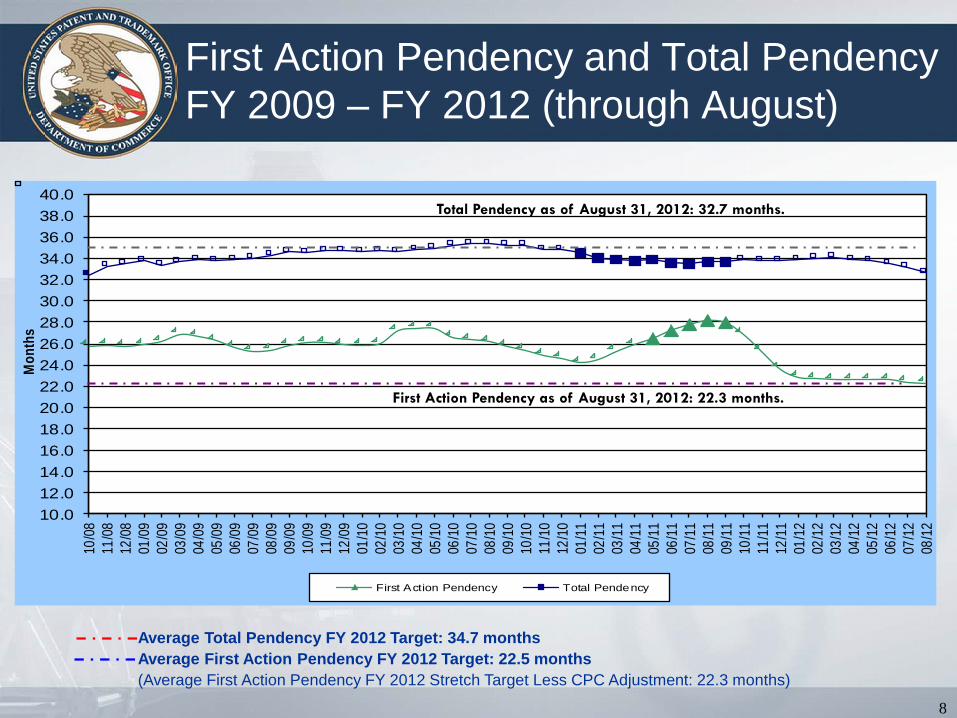
First Action Pendency and Total Pendency FY 2009 – FY 2012 (through August)
8
10.012.014.016.018.020.022.024.026.028.030.032.034.036.038.040.0
10/0
811
/08
12/0
801
/09
02/0
903
/09
04/0
905
/09
06/0
907
/09
08/0
909
/09
10/0
911
/09
12/0
901
/10
02/1
003
/10
04/1
005
/10
06/1
007
/10
08/1
009
/10
10/1
011
/10
12/1
001
/11
02/1
103
/11
04/1
105
/11
06/1
107
/11
08/1
109
/11
10/1
111
/11
12/1
101
/12
02/1
203
/12
04/1
205
/12
06/1
207
/12
08/1
2
Mon
ths
First Action Pendency Total Pendency
First Action Pendency as of August 31, 2012: 22.3 months.
Total Pendency as of August 31, 2012: 32.7 months.
Average Total Pendency FY 2012 Target: 34.7 months Average First Action Pendency FY 2012 Target: 22.5 months (Average First Action Pendency FY 2012 Stretch Target Less CPC Adjustment: 22.3 months)
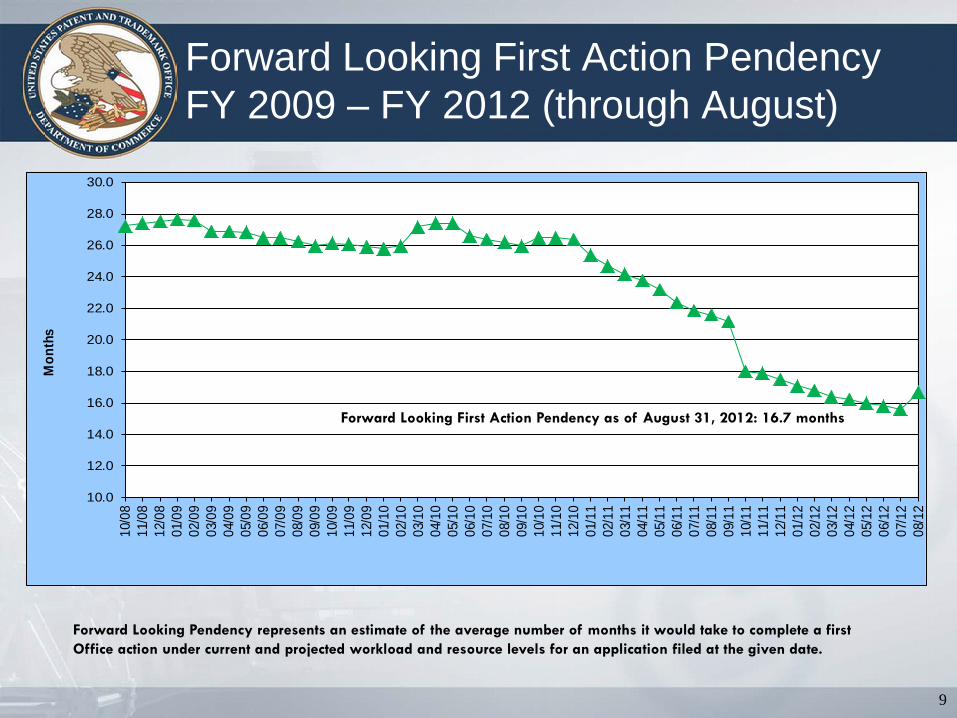
Forward Looking First Action Pendency FY 2009 – FY 2012 (through August)
10.0
12.0
14.0
16.0
18.0
20.0
22.0
24.0
26.0
28.0
30.0
10/0
811
/08
12/0
801
/09
02/0
903
/09
04/0
905
/09
06/0
907
/09
08/0
909
/09
10/0
911
/09
12/0
901
/10
02/1
003
/10
04/1
005
/10
06/1
007
/10
08/1
009
/10
10/1
011
/10
12/1
001
/11
02/1
103
/11
04/1
105
/11
06/1
107
/11
08/1
109
/11
10/1
111
/11
12/1
101
/12
02/1
203
/12
04/1
205
/12
06/1
207
/12
08/1
2
Mon
ths
Forward Looking Pendency represents an estimate of the average number of months it would take to complete a first Office action under current and projected workload and resource levels for an application filed at the given date.
Forward Looking First Action Pendency as of August 31, 2012: 16.7 months
9
10
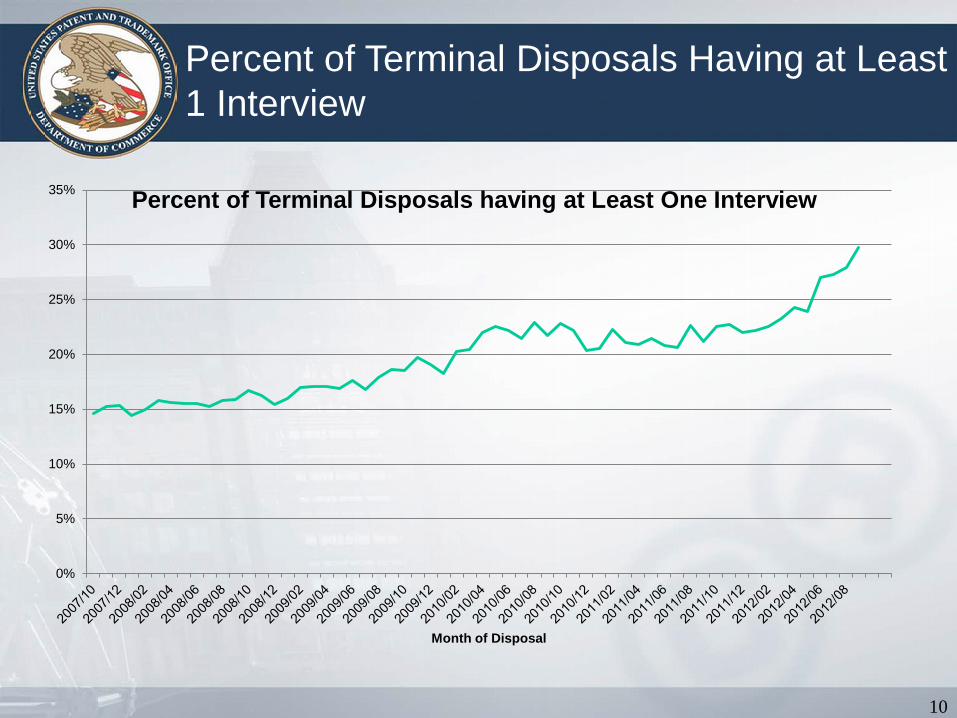
Percent of Terminal Disposals Having at Least 1 Interview
0%
5%
10%
15%
20%
25%
30%
35%
Month of Disposal
Percent of Terminal Disposals having at Least One Interview
11
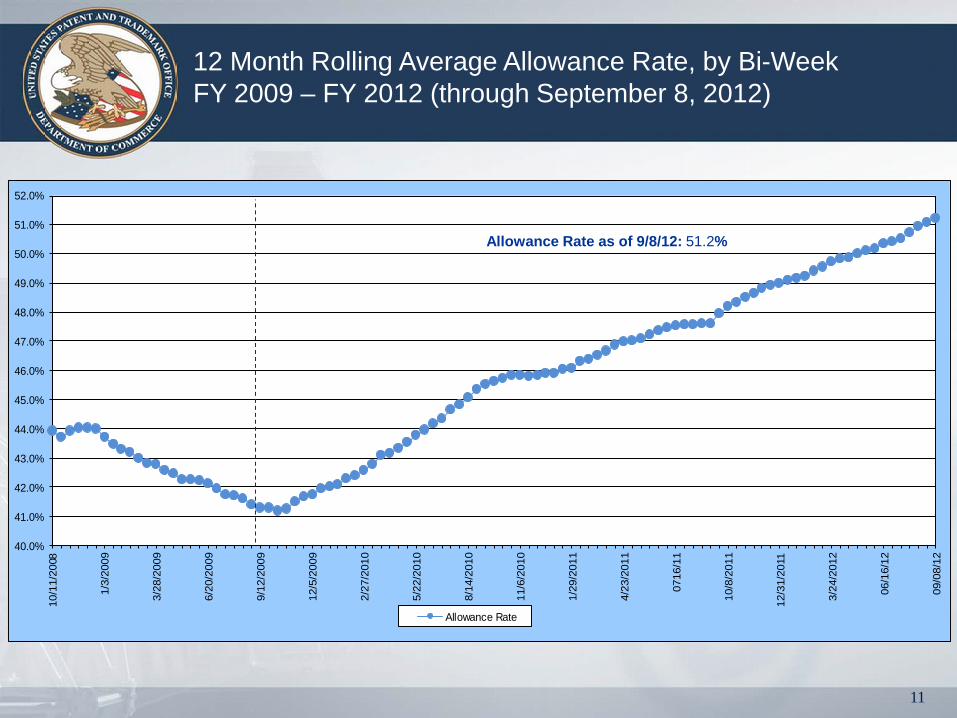
12 Month Rolling Average Allowance Rate, by Bi-Week FY 2009 – FY 2012 (through September 8, 2012)
40.0%
41.0%
42.0%
43.0%
44.0%
45.0%
46.0%
47.0%
48.0%
49.0%
50.0%
51.0%
52.0%
10/1
1/20
08
1/3/
2009
3/28
/200
9
6/20
/200
9
9/12
/200
9
12/5
/200
9
2/27
/201
0
5/22
/201
0
8/14
/201
0
11/6
/201
0
1/29
/201
1
4/23
/201
1
0716
/11
10/8
/201
1
12/3
1/20
11
3/24
/201
2
06/1
6/12
09/0
8/12
Allowance Rate
Allowance Rate as of 9/8/12: 51.2%
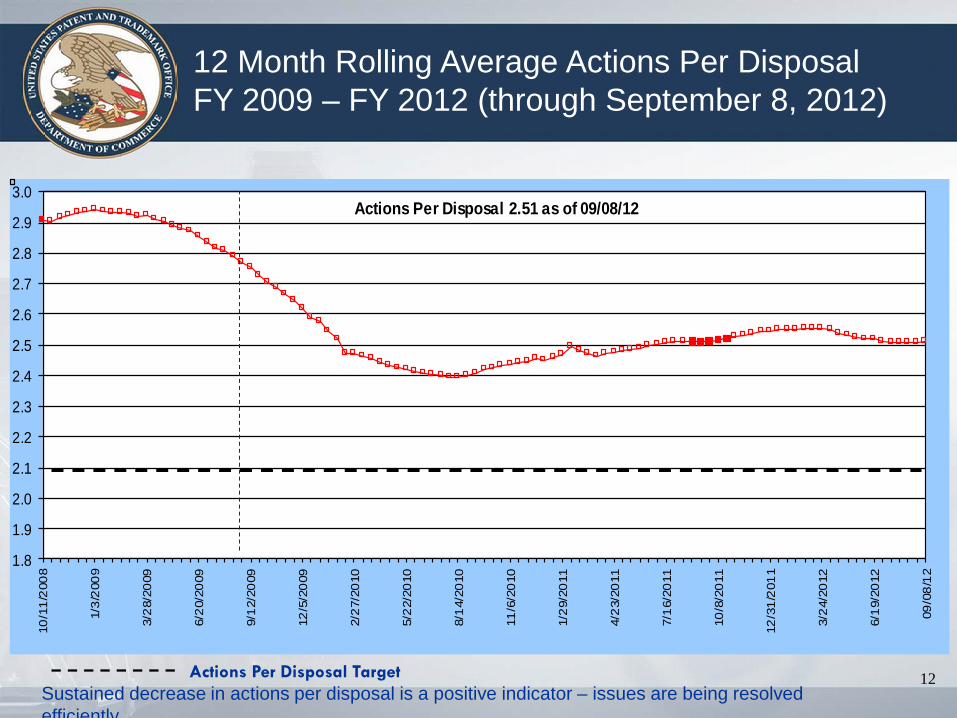
Actions Per Disposal Target Sustained decrease in actions per disposal is a positive indicator – issues are being resolved efficiently
12 Month Rolling Average Actions Per Disposal FY 2009 – FY 2012 (through September 8, 2012)
1.8
1.9
2.0
2.1
2.2
2.3
2.4
2.5
2.6
2.7
2.8
2.9
3.0
10/1
1/2
008
1/3
/200
9
3/2
8/20
09
6/2
0/20
09
9/1
2/20
09
12/5
/20
09
2/2
7/20
10
5/2
2/20
10
8/1
4/20
10
11/6
/20
10
1/2
9/20
11
4/2
3/20
11
7/1
6/20
11
10/8
/20
11
12/3
1/2
011
3/2
4/20
12
6/1
9/20
12
09/0
8/1
2
Actions Per Disposal 2.51 as of 09/08/12
12
0.00.10.20.30.40.50.60.70.80.91.01.11.21.31.41.51.61.71.81.92.02.12.22.32.42.5
2007
/10
2008
/02
2008
/06
2008
/10
2009
/02
2009
/06
2009
/10
2010
/02
2010
/06
2010
/10
2011
/02
2011
/06
2011
/10
2012
/02
2012
/06
13
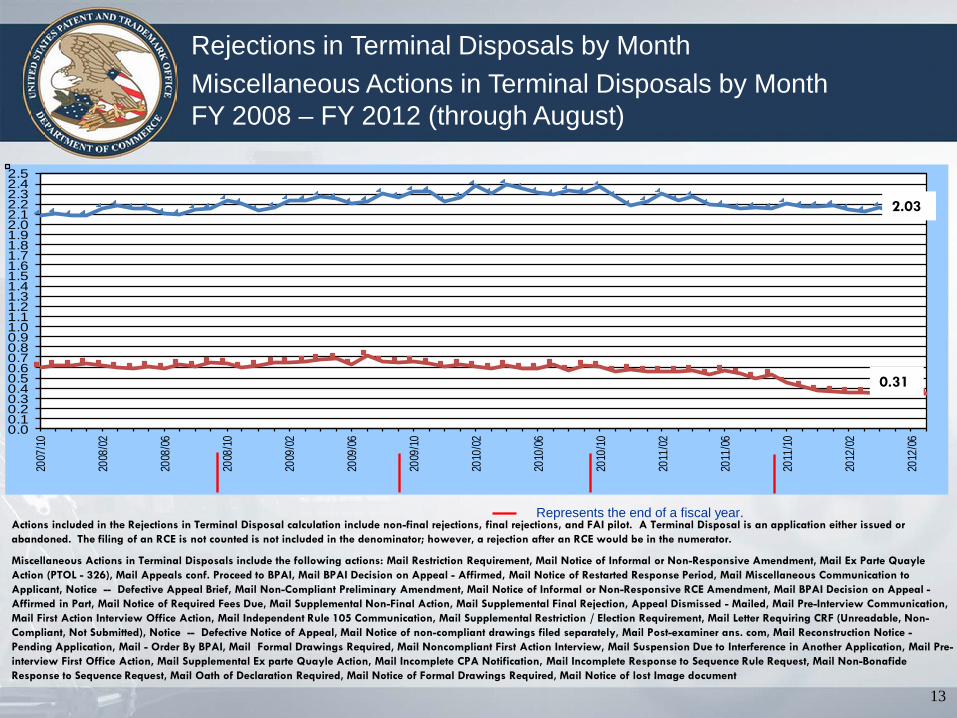
Rejections in Terminal Disposals by Month Miscellaneous Actions in Terminal Disposals by Month FY 2008 – FY 2012 (through August)
Actions included in the Rejections in Terminal Disposal calculation include non-final rejections, final rejections, and FAI pilot. A Terminal Disposal is an application either issued or abandoned. The filing of an RCE is not counted is not included in the denominator; however, a rejection after an RCE would be in the numerator.
Miscellaneous Actions in Terminal Disposals include the following actions: Mail Restriction Requirement, Mail Notice of Informal or Non-Responsive Amendment, Mail Ex Parte Quayle Action (PTOL - 326), Mail Appeals conf. Proceed to BPAI, Mail BPAI Decision on Appeal - Affirmed, Mail Notice of Restarted Response Period, Mail Miscellaneous Communication to Applicant, Notice -- Defective Appeal Brief, Mail Non-Compliant Preliminary Amendment, Mail Notice of Informal or Non-Responsive RCE Amendment, Mail BPAI Decision on Appeal - Affirmed in Part, Mail Notice of Required Fees Due, Mail Supplemental Non-Final Action, Mail Supplemental Final Rejection, Appeal Dismissed - Mailed, Mail Pre-Interview Communication, Mail First Action Interview Office Action, Mail Independent Rule 105 Communication, Mail Supplemental Restriction / Election Requirement, Mail Letter Requiring CRF (Unreadable, Non-Compliant, Not Submitted), Notice -- Defective Notice of Appeal, Mail Notice of non-compliant drawings filed separately, Mail Post-examiner ans. com, Mail Reconstruction Notice - Pending Application, Mail - Order By BPAI, Mail Formal Drawings Required, Mail Noncompliant First Action Interview, Mail Suspension Due to Interference in Another Application, Mail Pre-interview First Office Action, Mail Supplemental Ex parte Quayle Action, Mail Incomplete CPA Notification, Mail Incomplete Response to Sequence Rule Request, Mail Non-Bonafide Response to Sequence Request, Mail Oath of Declaration Required, Mail Notice of Formal Drawings Required, Mail Notice of lost Image document
Represents the end of a fiscal year.
2.03
0.31
14
0%
1%
2%
3%
4%
5%
6%
7%
8%
9%
10%
2001 2002 2003 2004 2005 2006 2007 2008 2009 2010 2011 10/11 11/11 12/11 01/12 02/12 03/12 04/12 05/12 06/12 07/12 08/12
Perc
ent
Fiscal Year
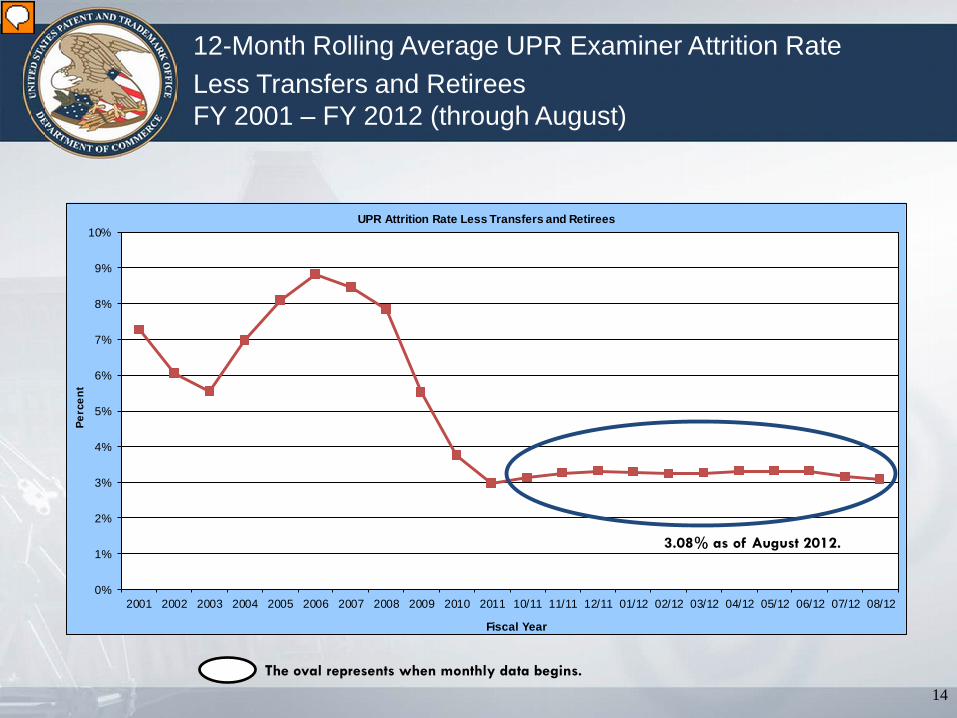
UPR Attrition Rate Less Transfers and Retirees
12-Month Rolling Average UPR Examiner Attrition Rate Less Transfers and Retirees FY 2001 – FY 2012 (through August)
3.08% as of August 2012.
The oval represents when monthly data begins.
01,0002,0003,0004,0005,0006,0007,0008,0009,000
10,00011,00012,00013,00014,00015,00016,00017,00018,00019,00020,00021,00022,00023,00024,00025,000
13 15 17 19 21 23 25 27 29 31 33 35 37 39 41 43 45 47 49 51 53 55 57 59
Num
ber o
f App
licat
ions
Months
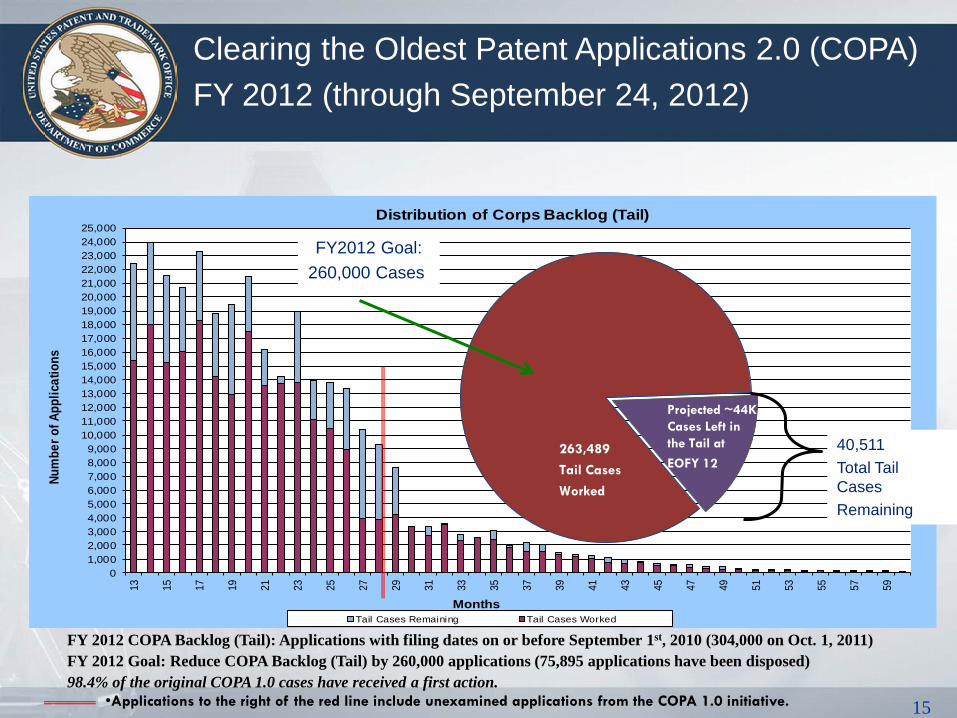
Distribution of Corps Backlog (Tail)
Tail Cases Remaining Tail Cases Worked
15
FY 2012 COPA Backlog (Tail): Applications with filing dates on or before September 1st, 2010 (304,000 on Oct. 1, 2011) FY 2012 Goal: Reduce COPA Backlog (Tail) by 260,000 applications (75,895 applications have been disposed) 98.4% of the original COPA 1.0 cases have received a first action.
40,511 Total Tail Cases Remaining
FY2012 Goal: 260,000 Cases
263,489 Tail Cases Worked
Clearing the Oldest Patent Applications 2.0 (COPA) FY 2012 (through September 24, 2012)
Projected ~44K Cases Left in the Tail at EOFY 12
•Applications to the right of the red line include unexamined applications from the COPA 1.0 initiative.
16
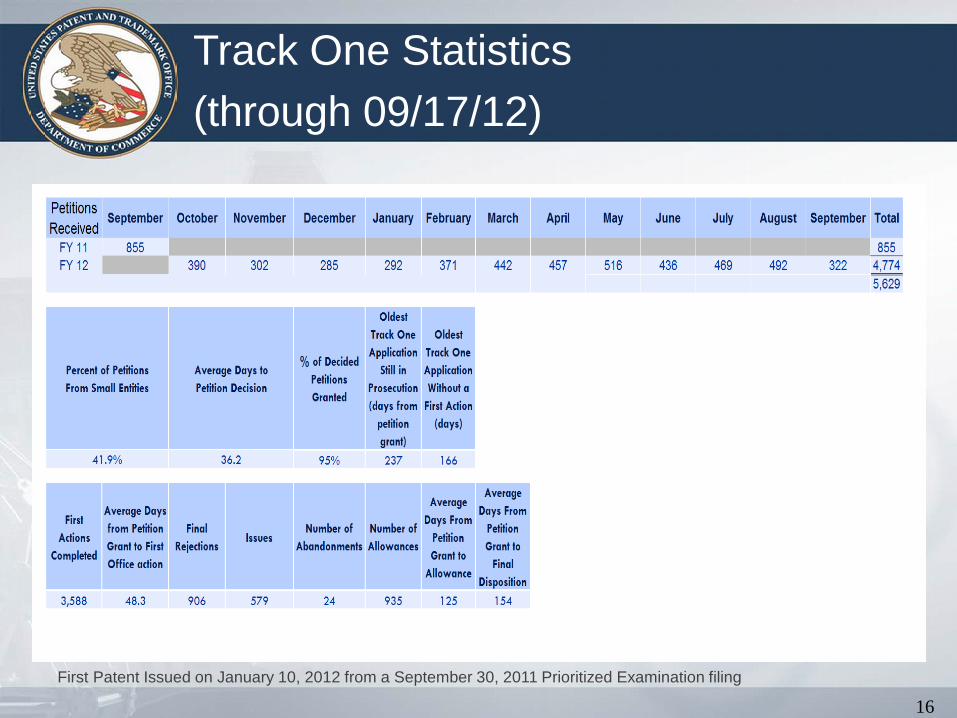
Track One Statistics (through 09/17/12)
First Patent Issued on January 10, 2012 from a September 30, 2011 Prioritized Examination filing First Patent Issued on January 10, 2012 from a September 30, 2011 Prioritized Examination filing
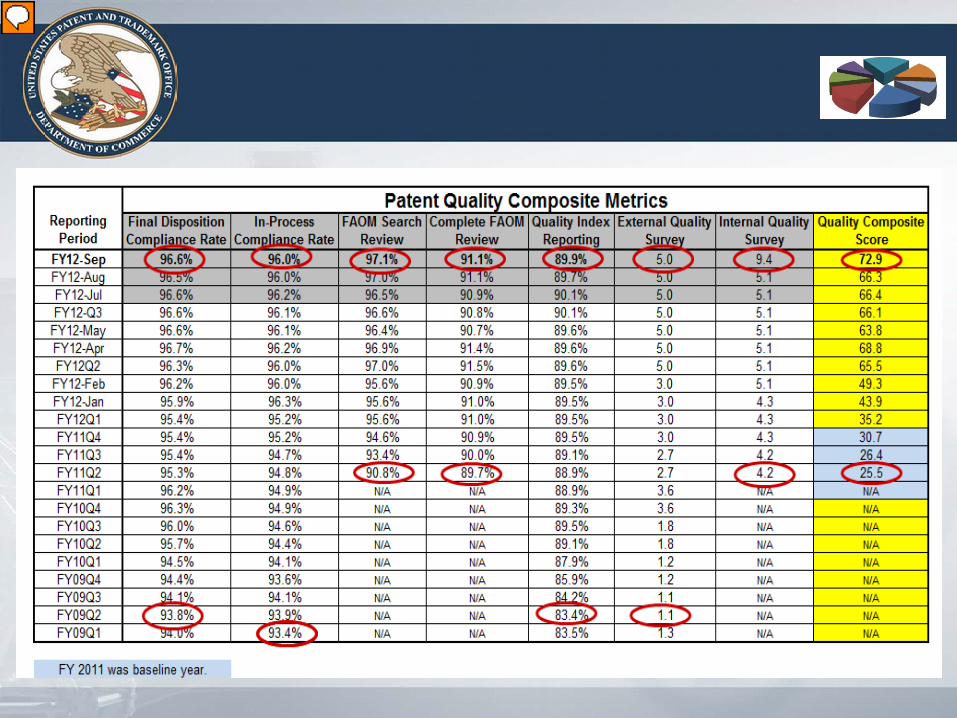
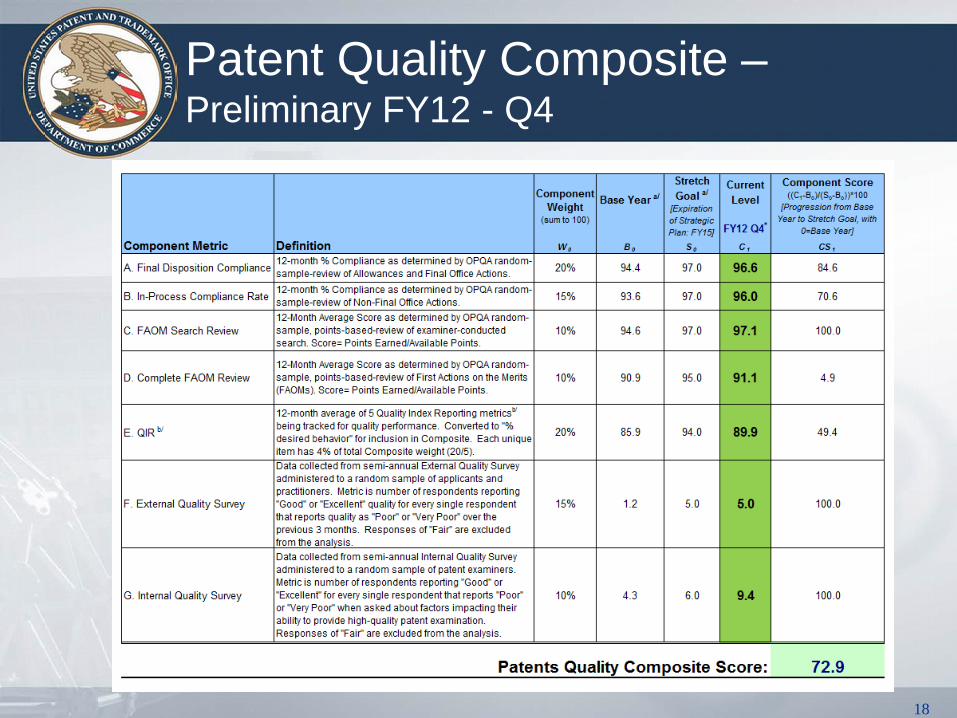
Patent Quality Composite – Preliminary FY12 - Q4
18
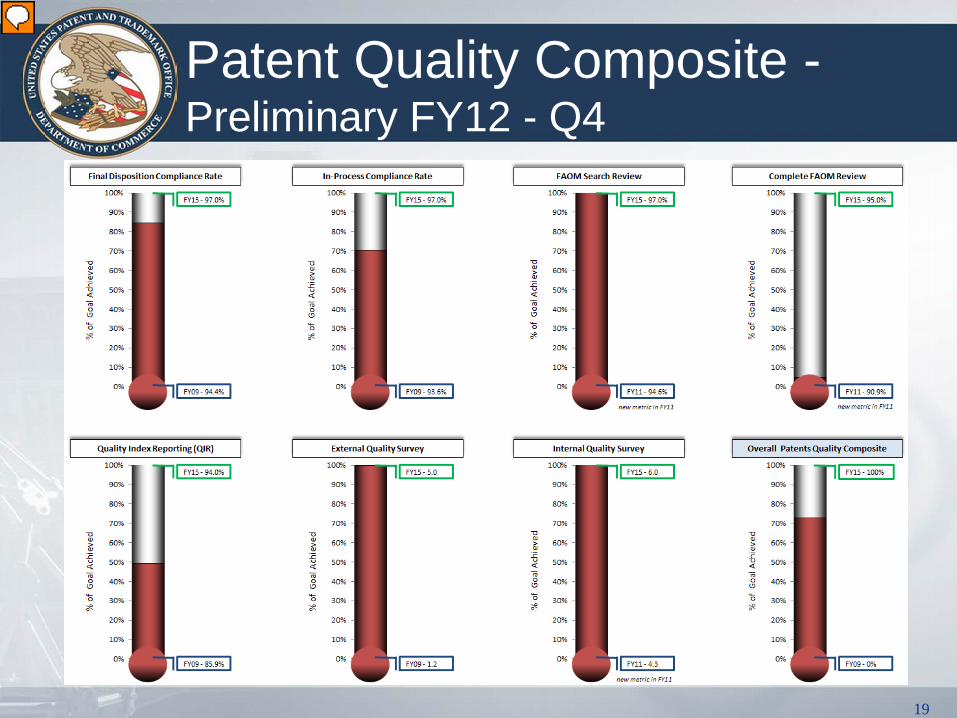
Patent Quality Composite - Preliminary FY12 - Q4
19
Patent Quality Composite - Preliminary FY12 - Q4
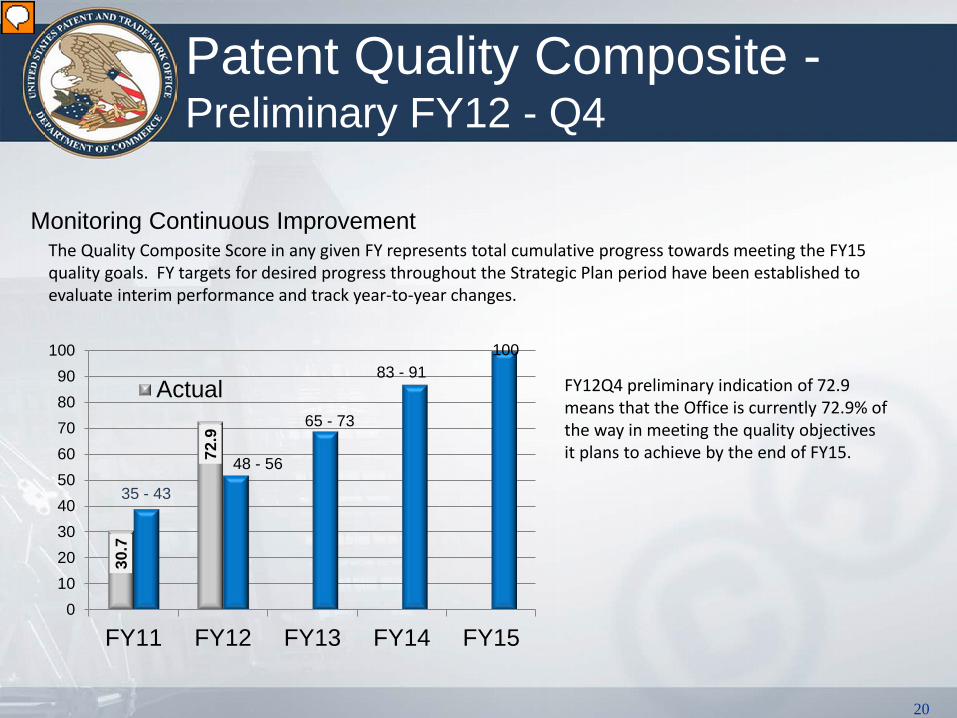
Monitoring Continuous Improvement The Quality Composite Score in any given FY represents total cumulative progress towards meeting the FY15 quality goals. FY targets for desired progress throughout the Strategic Plan period have been established to evaluate interim performance and track year-to-year changes.
FY12Q4 preliminary indication of 72.9 means that the Office is currently 72.9% of the way in meeting the quality objectives it plans to achieve by the end of FY15.
20
30.7
72.9
0102030405060708090
100
FY11 FY12 FY13 FY14 FY15
Actual
48 - 56
65 - 73
83 - 91 100
35 - 43


![Berkeley Patent Damages Workshop Report · comm'n, the evolving ip marketplace: aligning patent notice and remedies with competition 8 (2011) [hereinafter "marketplace report"]; u.s](https://img.pdfslide.us/doc/110x75/5fdd29b7a7294023d54e949a/berkeley-patent-damages-workshop-report-commn-the-evolving-ip-marketplace-aligning.jpg)