Embed Size (px)
Citation preview

HOLLOW BAR SOIL NAILS Pullout Test Program
Publication No. FHWA-CFL/TD-10-001 May 2010
Central Federal Lands Highway Division
12300 West Dakota Avenue Lakewood, CO 80228


Technical Report Documentation Page
1. Report No.
FHWA-CFL/TD-10-001 2. Government Accession No.
3. Recipient's Catalog No.
5. Report Date
May 2010 4. Title and Subtitle
Hollow Bar Soil Nails Pullout Test Program 6. Performing Organization Code
7. Author(s)
Allen W. Cadden, P.E., Jesús E. Gómez, Ph.D., P.E., Andrew C. Baxter, P.G., Thomas Bird
8. Performing Organization Report No.
10. Work Unit No. (TRAIS)
9. Performing Organization Name and Address
Schnabel Engineering LLC ADSC 510 East Gay Street 8445 Freeport Parkway, Suite 325 West Chester, PA 19380 Irving, TX 75063
11. Contract or Grant No.
DTFH68-07-P-00092 13. Type of Report and Period Covered
Final Report July 2007 – May 2010
12. Sponsoring Agency Name and Address
Federal Highway Administration Central Federal Lands Highway Division 12300 W. Dakota Avenue, Suite 210 Lakewood, CO 80228
14. Sponsoring Agency Code
HFTS-16.4 15. Supplementary Notes
COTR: Justin Henwood, FHWA-CFLHD. Advisory Panel Members: Matthew Demarco and Roger Surdahl, FHWA-CFLHD; Scott Anderson and Barry Siel, FHWA-RC; and Rich Barrows, FHWA-WFLHD. This project was funded by the FHWA Federal Lands Highway Geotechnical Program, the FHWA Federal Lands Highway Technology Deployment Program, and the Association of Drilled Shaft Contractors – The International Association of Foundation Drilling. 16. Abstract
The use of Hollow Bar Soil Nails (HBSNs) is growing in the excavation support and retaining wall construction. It is anticipated that the use of the HBSN technology could reduce construction schedules, costs, and environmental impacts. The current state of practice for design bond strengths and load testing procedures is based on the current soil nail practice but varies depending on the installation contractor and product recommendations. The objective of this study was two-fold. The first objective was to develop an initial data file from installation and testing at four sites of the available grout-to-ground bond stress of HBSNs, and to determine if correlations exist with traditional solid bar, drill, and grout soil nails (for example, the published nominal values in FHWA-IF-03-017 [GEC No. 7]). The second objective was to establish recommendations for practical, standard ways of performing pullout tests on HBSNs. Comparisons between the pullout test results showed that the HBSNs generally developed larger bond strength values in granular soils than the SBSNs. Three installation methods for purposes of pullout and proof testing were evaluated. Of which two were found to be to be satisfactory; however, the third one noted to have a significant Doughnut Effect and was not recommended for pullout testing. Test results of the four sites are included in detail on the attached CD ROM.
17. Key Words
HOLLOW BAR SOIL NAILS, LOAD TESTING, SOIL NAILS, HOLLOW BAR MICROPILES
18. Distribution Statement
No restriction. This document is available to the public from the sponsoring agency at the website http://www.cflhd.gov.
19. Security Classif. (of this report)
Unclassified 20. Security Classif. (of this page)
Unclassified 21. No. of Pages
427 (60 printed)
(367 on CD ROM)
22. Price
Form DOT F 1700.7 (8-72) Reproduction of completed page authorized

ii
SI* (MODERN METRIC) CONVERSION FACTORS
APPROXIMATE CONVERSIONS TO SI UNITS Symbol When You Know Multiply By To Find Symbol
LENGTHin inches 25.4 millimeters mm ft feet 0.305 meters m yd yards 0.914 meters m mi miles 1.61 kilometers km
AREAin2 square inches 645.2 square millimeters mm2 ft2 square feet 0.093 square meters m2 yd2 square yard 0.836 square meters m2 ac acres 0.405 hectares ha mi2 square miles 2.59 square kilometers km2
VOLUMEfl oz fluid ounces 29.57 milliliters mL gal gallons 3.785 liters L ft3 cubic feet 0.028 cubic meters m3 yd3 cubic yards 0.765 cubic meters m3
NOTE: volumes greater than 1000 L shall be shown in m3 MASS
oz ounces 28.35 grams g lb pounds 0.454 kilograms kg T short tons (2000 lb) 0.907 megagrams (or "metric ton") Mg (or "t")
TEMPERATURE (exact degrees)°F Fahrenheit 5 (F-32)/9 Celsius °C
or (F-32)/1.8 ILLUMINATION
fc foot-candles 10.76 lux lx fl foot-Lamberts 3.426 candela/m2 cd/m2
FORCE and PRESSURE or STRESS lbf poundforce 4.45 newtons N lbf/in2 poundforce per square inch 6.89 kilopascals kPa
APPROXIMATE CONVERSIONS FROM SI UNITS
Symbol When You Know Multiply By To Find Symbol LENGTH
mm millimeters 0.039 inches in m meters 3.28 feet ft m meters 1.09 yards yd km kilometers 0.621 miles mi
AREAmm2 square millimeters 0.0016 square inches in2 m2 square meters 10.764 square feet ft2 m2 square meters 1.195 square yards yd2 ha hectares 2.47 acres ac km2 square kilometers 0.386 square miles mi2
VOLUMEmL milliliters 0.034 fluid ounces fl oz L liters 0.264 gallons gal m3 cubic meters 35.314 cubic feet ft3 m3 cubic meters 1.307 cubic yards yd3
MASSg grams 0.035 ounces oz kg kilograms 2.202 pounds lb Mg (or "t") megagrams (or "metric ton") 1.103 short tons (2000 lb) T
TEMPERATURE (exact degrees) °C Celsius 1.8C+32 Fahrenheit °F
ILLUMINATION lx lux 0.0929 foot-candles fc cd/m2 candela/m2 0.2919 foot-Lamberts fl
FORCE and PRESSURE or STRESSN newtons 0.225 poundforce lbf kPa kilopascals 0.145 poundforce per square inch lbf/in2

HOLLOW BAR SOIL NAILS PULLOUT TEST PROGRAM – TABLE OF CONTENTS ______________________________________________________________________
iii
TABLE OF CONTENTS
CHAPTER 1 – INTRODUCTION ..................................................................................................1 CHAPTER 2 – BACKGROUND ....................................................................................................3 FACTORS AFFECTING BOND STRENGTH OF SOIL NAILS......................................3 HBSN BOND STRENGTH AND ITS MEASUREMENT ................................................5 CHAPTER 3 – FIELD STUDY AND ANALYSIS PROGRAM ...................................................7 INSTALLATION, TESTING, AND ANALYSIS PROGRAM .........................................7 SITE SELECTION ..............................................................................................................7 SITE DESCRIPTIONS........................................................................................................8 Site 1: Block 76 Site (Details are shown in the Appendix 1 on the attached CD ROM) ..................................................................................8 Site 2: Posillico Site (Details are shown in the Appendix 2 on the attached CD ROM) ..................................................................................8 Site 3: Sunset Mesa Site (Details are shown in the Appendix 3 on the attached CD ROM) ..................................................................................8 Site 4: Olympia Site (Details are shown in the Appendix 4 on the attached CD ROM) ..................................................................................9 SOIL NAIL INSTALLATION METHOD..........................................................................9 Method A: Traditional Test SBSN Installed Using Casing ..................................9 Method B: Hollow Bar Installed with Debonding Sheath and Water Flushing...........................................................................................11 Method C: Hollow Bar Installed with Debonding Sheath and Without Flushing........................................................................................13 Method D: Hollow Bar with Bondbreaker Installed by Re-drilling a Pre-grouted Hole...............................................................................................14 CONSTRUCTION DETAILS: MATERIALS, INSTRUMENTATION, AND INSTALLATION ..............................................................................................................15 Materials ................................................................................................................15 Strain Gauges 17 Equipment and Installation ....................................................................................18 SOIL NAIL TESTING ......................................................................................................20 Load Testing Setup ................................................................................................21 Strain Gauge Use at Olympia Site .........................................................................21 CHAPTER 4 – FILED TEST RESULTS ......................................................................................23 OVERVIEW OF DATA....................................................................................................23 Load Test Interpretation Methods..........................................................................28

HOLLOW BAR SOIL NAILS PULLOUT TEST PROGRAM – TABLE OF CONTENTS ______________________________________________________________________
iv
CHAPTER 5 – ANALYSIS AND INTERPRETATION..............................................................29 ANALYSIS OF INTERPRETED BOND STRENGTH DATA .......................................29 Exhumed Test Nails...............................................................................................34 Discussion on Interpreted Bond Values.................................................................35 The Doughnut Effect..............................................................................................36 Strain Gauge Data ..................................................................................................38 CHAPTER 6 – CONCLUSIONS ..................................................................................................43 REFERENCES ..............................................................................................................................47 APPENDIX 1 – BLOCK 76 SITE DATA.....................................................................................49 APPENDIX 2 – POSILLICO SITE DATA.................................................................................135 APPENDIX 3 – SUNSET MESA SITE DATA..........................................................................229 APPENDIX 4 – OLYMPIA SITE DATA...................................................................................331 (Appendices are located on the attached CD ROM)

HOLLOW BAR SOIL NAILS PULLOUT TEST PROGRAM – TABLE OF CONTENTS ______________________________________________________________________
v
LIST OF FIGURES
Figure 1. Photograph. Installation (Method A) of a solid bar at the Posillico Site. .............10 Figure 2. Schematic. Solid bar soil nail installed using Method A. .....................................10 Figure 3. Photograph. Outlet end of flushing tube. ..............................................................11 Figure 4. Schematic. HBSN installed using Method B........................................................12 Figure 5. Photograph. Grout remaining in the casing after flushing at the Sunset Mesa Site. ..............................................................................................12 Figure 6. Schematic. HBSN installed using Method C........................................................14 Figure 7. Schematic. HBSN installed using Method D........................................................15 Figure 8. Photograph. Obermann high shear mixer grout pump..........................................17 Figure 9. Photograph. Geokon 4200-AX strain gauge with threadbar attachment and notched dumbbells. ....................................................................................18 Figure 10. Photograph. Casing installation at the Sunset Mesa Site......................................19 Figure 11. Photograph. Top hammer setup used for installation Methods B and C. Note the grout pressure gauge at the swivel and centralizer used to hold PVC in place. ....................................................................................................19 Figure 12. Photograph. Load test setup at Sunset Mesa Site. ................................................21 Figure 13. Graph. Interpreted bond strength for the HBSN and SBSN. ................................30 Figure 14. Graph. Normalized interpreted bond strength. .....................................................32 Figure 15. Photograph. Exhumed HBSN at the Sunset Mesa Site.........................................35 Figure 16. Schematic. Geometry and resistance mechanism of the Doughnut Effect. ..........37 Figure 17. Graph. Load distribution from strain gauges in HBSN B1 (Olympia Site)..........38 Figure 18. Graph. Load distribution from strain gauges from HBSN C2 (Olympia Site). ....39 Figure 19. Graph. Load distribution from strain gauges from HBSN D2 (Olympia Site). ....39 Figure 20. Graph. Measured load within the free length of the soil nail from the Olympia Site .....................................................................................................40

HOLLOW BAR SOIL NAILS PULLOUT TEST PROGRAM – TABLE OF CONTENTS ______________________________________________________________________
vi
LIST OF TABLES
Table 1. Estimated bond strength of soil nails in soil and rock .............................................4 Table 2. Soil nail material summary ....................................................................................16 Table 3. Typical verification test load schedule ..................................................................20 Table 4. Block 76 load test data summary ...........................................................................24 Table 5. Posillico load test data summary............................................................................25 Table 6. Sunset Mesa load test data summary .....................................................................26 Table 7. Olympia load test data summary............................................................................27 Table 8. Range of bond strength by soil type and installation method................................33 Table 9. Bond strength comparison .....................................................................................34 Table 10. Range of bond zone diameters measured from exhumed nails..............................35 Table 11. Comparison of strain gauge data to deformation data ...........................................41

HOLLOW BAR SOIL NAILS PULLOUT TEST PROGRAM – TABLE OF CONTENTS ______________________________________________________________________
vii
LIST OF ABBREVIATIONS AND SYMBOLS α Bond strength = Ultimate shear strength of grout-to-ground interface A Cross sectional area of the steel reinforcing bar AASHTO American Association of State Highway and Transportation Officials ADSC Association of Drilled Shaft Contractors – The International Association of
Foundation Drilling AER Anchored Earth Retention AL Alignment Load ASTM American Society for Testing and Materials Dnom Nominal diameter of the drill hole [in] DTL Design Test Load [kip] E Young’s Modulus of steel, 29,000 ksi FHWA Federal Highway Administration ft Foot (feet) Fy Yield (nominal) strength of hollow bar soil nail GEC Geotechnical Engineering Circular HBSN Hollow Bar Soil Nail ID Inside diameter in Inches kPa Kilo Pascal Kip 1000 lb LBV Test nail bonded length [ft] MTL Maximum Test Load OD Outside diameter PVC Poly Vinyl Chloride Qultimate Pullout load [lb]. If pullout does not occur at the maximum test load, it is noted
with (*) in the table SBSN Solid Bar Soil Nail SOP State of Practice ~ Approximately equal to

HOLLOW BAR SOIL NAILS PULLOUT TEST PROGRAM – TABLE OF CONTENTS ______________________________________________________________________
viii
ACKNOWLEDGMENTS
The authors of this report would like to extend a debt of gratitude to many people and organizations that provided valuable input into this effort. First, The Association of Drilled Shaft Contractors – International Association of Foundation Drilling (ADSC) anchored this effort through their Anchored Earth Retention Committee lead by Kyle Camper and Tom Bird. Numerous participants from Schnabel Engineering LLC, involved in this effort included Javier Rodríguez, P.E., Johanna Mikita, Mark Rohrbach, and Helen Foreman.
This work also could not have been completed without the in-kind contributions from numerous contractors including: Nicholson Construction Company - Western District, Williams Form Engineering Corp., Con-Tech Systems Ltd., DSI America, DBM Contractors Inc. - Pacific Northwest Region, TEI Rock Drills Inc., Mountain Highwall Concrete Contractors Inc., Peterson Geotechnical Construction LLC, and Posillico Construction Inc. Special thanks are also extended to the review team for this effort:
Mountain Highwall Concrete Contractors Inc. TEI Rock Drills Inc. Posillico Construction Inc. Peterson Geotechnical Construction LLC
HBSN Study Review Team:
Bernard Froemel – DSI America Lucian Bogdan – DSI America Cary Lange – Nicholson Construction Company Dan Thome – Nicholson Construction Company Tom Richards – Nicholson Construction Company Donald Bruce – Geosystems L.P. Horst Aschenbroich – Con-Tech Systems Ltd. David Weatherby – Schnabel Foundation Co. Jon Bennett – Geostructures Inc. Joe Patterson – TEI Rock Drills Inc. Tom Printz – Williams Form Engineering Corp. Michael Moore – ADSC Jerold Bishop – Geotechnical Design Services Inc. John R. Wolosick – Hayward Baker Inc. Kyle Vanderberg – Mays Construction Specialties Inc. Mick Muller – Yenter Companies Inc. Naresh Samtani – NCS Consultants LLC Kathryn Griswell – CALTRANS Robert Carnevale – DBM Contractors Inc.
FHWA Advisory Panel:
Justin Henwood, Matthew Demarco, Roger Surdahl, Scott Anderson, Barry Siel, and Rich Barrows.

CHAPTER 1 – INTRODUCTION ______________________________________________________________________
1
CHAPTER 1 – INTRODUCTION Hollow Bar Soil Nails (HBSNs) differ from Solid Bar Soil Nails (SBSNs) in that HBSNs are typically advanced through their full design length with a sacrificial bit using grout as the drilling fluid; thus drilling, grouting, and tendon installation are all accomplished as part of one single process. Conversely, depending on the soil conditions, SBSNs are installed by pre-drilling a hole with or without temporary casing, which is then grouted. For SBSNs only, the steel is introduced before or after grouting depending on the specifics of the construction site. The Hollow-Core Soil Nails State-of-Practice Report issued by the Federal Highway Administration (FHWA, 2006) (SOP) provides several areas for further investigation. This report focuses on additional research and guidance for design of grout-to-ground bond and testing of HBSNs. HBSNs are typically used in collapsing ground conditions where the simultaneous injection of grout through the reinforcing bar during drilling keeps the drill hole from collapsing. Due to their installation method, the procedures for typical solid bar installation and testing are not appropriate. This work as discussed hereinafter had two objectives. The first objective was to develop an initial data file of the available grout-to-ground bond strength of HBSNs, and to determine if correlations exist with traditional drilled and grouted SBSNs. For this objective, several practical installation procedures for HBSNs were used to install nails for testing. A total of 39 test HBSNs were installed in four different project sites across the United States. The test data collected was used to develop the initial database on bond values and to establish recommendations for the practical installation of test HBSNs. The second objective was to establish recommendations for practical, standardized methods of performing comparable pullout tests on HBSNs. These recommendations may include unique test HBSN design and related standardization installation procedures. This report includes recommendations for installation, testing, and documentation for HBSNs as a result of this research work, and recommendations for further study.


CHAPTER 2 – BACKGROUND ______________________________________________________________________
3
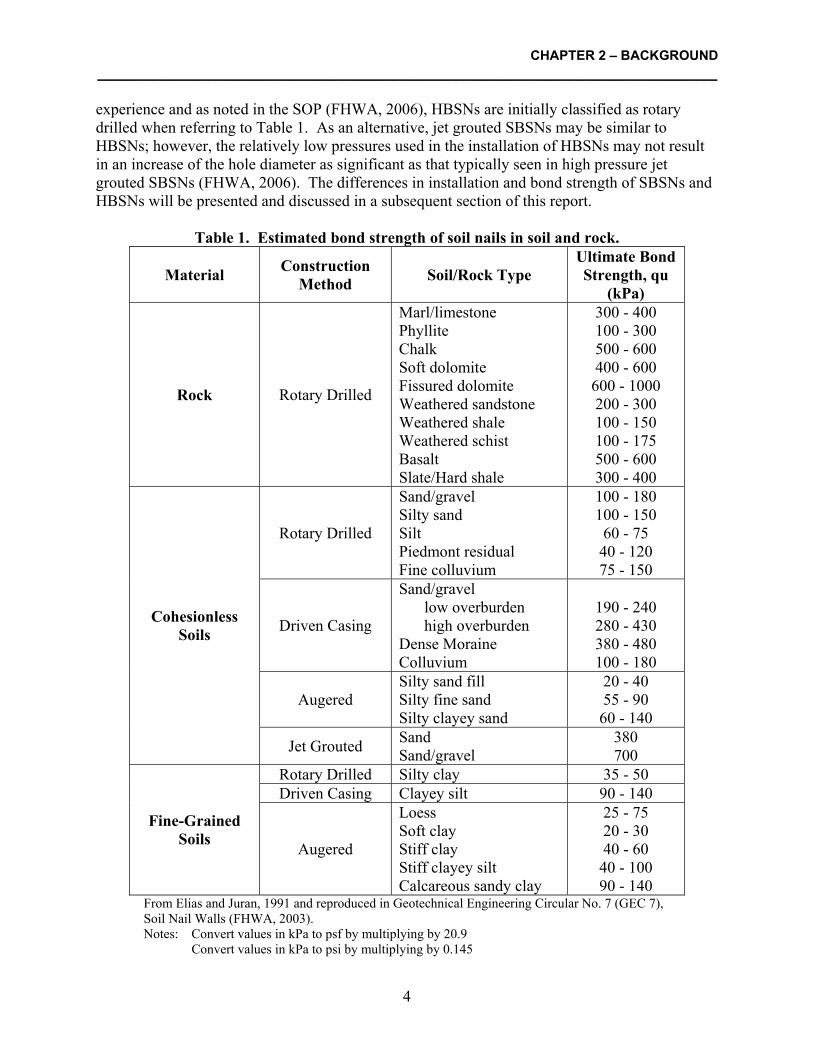
CHAPTER 2 – BACKGROUND FACTORS AFFECTING BOND STRENGTH OF SOIL NAILS HBSNs have been used in practice for over 15 years for both temporary and long-term excavation support. A description of the application, materials, installation methods, and design for HBSNs is provided in the Hollow-Core Soil Nails State-of-Practice (SOP) Report issued by the Federal Highway Administration (FHWA, 2006). In addition, the general design methods for local failure mechanisms and global stability for soil nail walls are provided in the Geotechnical Engineering Circular No. 7 (GEC 7), Soil Nail Walls (FHWA, 2003). The bond strength at a given point along a soil nail corresponds to the shear strength along the interface between the grout and the ground at that same point. Typically, the interface strength between flat structural fascia and the ground depends on the following factors (Gómez et al., 2000, 2003, and 2008):
Effective and total strength parameters of the soil or rock. Roughness of the grout-ground interface. Confining stresses. Rate of loading and soil permeability.
In the case of soil nails, other factors that may influence the average bond strength along a soil nail include:
Stiffness of the soil or rock. Diameter of the soil nail, including permeated zone. Length and axial stiffness of the nail transferring the nail load to the ground.
As the soil nail tends to slide past the soil, the roughness of the interface between the soil nail and the ground may cause radial expansion of the soil at the nail interface. The normal stresses acting on the interface may increase, thus increasing the available bond strength under drained conditions. The magnitude of the normal stress would depend on the bond zone roughness and on the stiffness of the soil or rock around the nail. The average bond strength also depends on the interface shear stress level reached at different points along the bond zone. Shorter and stiffer soil nails will likely favor simultaneous mobilization of bond strength along their entire length; whereas longer, more flexible nails would favor mobilization of shear strength along their length at different times and present somewhat lower average bond strength in identical formations. The current document governing soil nail design and construction, GEC 7, includes a table of estimated bond strength values for gravity grouted SBSNs installed in soil and rock. The table was originally compiled by Elias and Juran in 1991 (FHWA, 2003), and is reproduced here as Table 1. The influence of the ground characteristics and drilling method on the estimated bond strength is evident as shown in Table 1. Although this table does not reflect all the factors that affect the bond strength of soil nails, it does provide a useful range of bond values for preliminary design and is of frequent use in practical design applications. From the authors'
CHAPTER 2 – BACKGROUND ______________________________________________________________________
4
experience and as noted in the SOP (FHWA, 2006), HBSNs are initially classified as rotary drilled when referring to Table 1. As an alternative, jet grouted SBSNs may be similar to HBSNs; however, the relatively low pressures used in the installation of HBSNs may not result in an increase of the hole diameter as significant as that typically seen in high pressure jet grouted SBSNs (FHWA, 2006). The differences in installation and bond strength of SBSNs and HBSNs will be presented and discussed in a subsequent section of this report.
Table 1. Estimated bond strength of soil nails in soil and rock.
Material Construction
Method Soil/Rock Type
Ultimate Bond Strength, qu
(kPa)
Rock Rotary Drilled
Marl/limestone Phyllite Chalk Soft dolomite Fissured dolomite Weathered sandstone Weathered shale Weathered schist Basalt Slate/Hard shale
300 - 400 100 - 300 500 - 600 400 - 600 600 - 1000 200 - 300 100 - 150 100 - 175 500 - 600 300 - 400
Rotary Drilled
Sand/gravel Silty sand Silt Piedmont residual Fine colluvium
100 - 180 100 - 150 60 - 75 40 - 120 75 - 150
Driven Casing
Sand/gravel low overburden high overburden
Dense Moraine Colluvium
190 - 240 280 - 430 380 - 480 100 - 180
Augered Silty sand fill Silty fine sand Silty clayey sand
20 - 40 55 - 90 60 - 140
Cohesionless Soils
Jet Grouted Sand Sand/gravel
380 700
Rotary Drilled Silty clay 35 - 50 Driven Casing Clayey silt 90 - 140
Fine-Grained Soils
Augered
Loess Soft clay Stiff clay Stiff clayey silt Calcareous sandy clay
25 - 75 20 - 30 40 - 60 40 - 100 90 - 140
From Elias and Juran, 1991 and reproduced in Geotechnical Engineering Circular No. 7 (GEC 7), Soil Nail Walls (FHWA, 2003). Notes: Convert values in kPa to psf by multiplying by 20.9
Convert values in kPa to psi by multiplying by 0.145

CHAPTER 2 – BACKGROUND ______________________________________________________________________
5
HBSN BOND STRENGTH AND ITS MEASUREMENT In response to the first objective of this research, we reviewed the factors that affect the bond strength of the grout to soil or rock as it relates to HBSNs. The higher grout injection pressures used for installation of HBSNs may lead to either undercutting and permeation of grout in granular soils or to undercutting of fine-grained soils. It is widely believed that results of higher grout injection pressures have a positive impact on the grout-to-ground bond strength. The increase in bond strength will depend on the soil characteristics and on the installation process. Some of the installation features affecting bond strength include grout mix properties at time of drilling, injection pressure of the grout, drill bit size and type, and drilling feed rate. Another important variable would likely be whether a leaner grout (higher water to cement ratio) is used for drilling, as this may promote more intense permeation of grout in granular soils. One suggested technique to summarize the factors that promote increased bond strength in HBSNs during design is to multiply the drill bit diameter by a summary parameter or factor to account for undercutting and grout permeation (Con-Tech 2009). This factor is dependent on the soil type being penetrated with the HBSN. The results of the tests performed for this investigation provide some insight into the suitability of using factored diameter values for the design of HBSNs. Extrapolation of bond strength values for typical SBSNs for use in the design of HBSNs can be difficult. Current soil nail testing includes verification tests and proof tests as part of the testing program. During installation of a solid bar test nail, the pre-drilled hole is filled with grout only to a predetermined bond length, leaving an upper unbonded length free of grout. The position and length of the bond zone in a test nail are selected to test the bond strength in a specific stratum. Results of the tests enable back calculation of the in situ bond strength of the grout-ground interface and verification of the design assumptions critical to internal and global stability of a soil nail wall. For traditional SBSNs, the installation and testing procedures are as defined in current FHWA documents (for example, FHWA, 2003). Conversely, the concurrent injection of grout during the drilling of an HBSN results in a complete column of grout. There are no universally established and accepted installation procedures to allow consistent creation of bonded and unbonded zones within a test HBSN for selective bond strength verification. Based on the authors’ experience and as reported in the SOP (FHWA 2006), the unbonded zone of test HBSNs has been developed by flushing grout, or through isolation by using a pre-installed smooth casing bondbreaker, or both. Each contractor develops a different procedure depending on the peculiarities of each job site, the required unbonded length, the available equipment and materials, and their own preferences. Thus, reported values of bond strength from differing contractors can vary greatly. Therefore, development of a suitable installation and testing protocol for HBSNs is a significant need at this time.


CHAPTER 3 – FIELD STUDY AND ANALYSIS PROGRAM ______________________________________________________________________
7
CHAPTER 3 – FIELD STUDY AND ANALYSIS PROGRAM INSTALLATION, TESTING, AND ANALYSIS PROGRAM The FHWA approached the International Association of Foundation Drilling (ADSC) Anchored Earth Retention (AER) Committee to coordinate an effort to look at the feasibility of using HBSNs on permanent soil nail wall construction. The AER Committee selected Schnabel Engineering (Schnabel) as the Principal Investigator for the activity. Using preliminary installation and test protocols developed by an ADSC AER Task Force and FHWA personnel, Schnabel finalized a work plan consisting of site selection, soil nail installation techniques, and testing procedures. Working with the ADSC AER Committee and with the aid of ADSC-experienced contractors around the United States, Schnabel identified the following four sites, which were suitable for installation and testing of HBSNs for this investigation:
Site 1: City Creek Center, Block 76 (Block 76 Site), located in Salt Lake City, Utah Site 2: Posillico Storage Yard (Posillico Site), located in Bohemia, New York Site 3: Sunset Mesa Gravel Pit (Sunset Mesa Site), located in Montrose County,
Colorado Site 4: DIS Wheeler Property (Olympia Site), located in Olympia, Washington
At each site, eight to twelve test soil nails were installed and tested in accordance with the installation, testing, and recording plans established in the program installation protocol (work plan) dated 1/10/2008. The installation, testing, and recording plans are reiterated in this chapter. A comparison was made between the calculated bond strength values from each installation method. In addition, the bond strength values of the test nails were compared to typical bond values from SBSNs using rotary drilled and jet grouted installation methods. The following pages contain pertinent details of each of the test sites, and detailed descriptions of the installation procedures used. SITE SELECTION The research team focused on sites where the use of HBSNs would provide practical advantages with respect to conventionally installed SBSNs (for example, sites where readily loosened granular soil deposits were present, which necessitated the use of temporary casing during the drilling and installation of SBSNs). Preferable soil conditions for testing included:
a) Colluvium sites. b) Sands/Silty sands that are marginally stable for cuts. c) Clean sands such as coastal beach areas.
It should be noted that HBSNs may be advantageous in other soil deposits not included in this list. The four sites selected met the above criteria while representing a variety of geographical and geological conditions across the United States. In general, the sites ranged from clayey fine sand

CHAPTER 3 – FIELD STUDY AND ANALYSIS PROGRAM ______________________________________________________________________
8
to poorly graded gravel containing cobbles and boulders. The following sections provide a brief description of the sites. More detailed information is included in the appended data reports (Appendices 1-4) that were generated after each test program was completed. It is noted that the applicability of hollow bars is not limited to granular soils. There are possibly a number of other geotechnical conditions where HBSNs would be advantageous over SBSNs, or where SBSNs might require casing for their installation. However, this research focused on sites where HBSNs would prevent the need for casing for the installation of production nails, and limit both the potential for collapse of the hole and development of grout body constrictions. SITE DESCRIPTIONS The location and soil deposits for each of the four test sites are described in the following paragraphs. The soil descriptions are based on the soil boring and laboratory test data available for each site, included in Appendices 1-4, and on-site observation noted on installation logs. Site 1: Block 76 Site (Details are shown in the Appendix 1 on the attached CD ROM) Test Site 1 was an active construction site known as City Creek Center – Block 76, and is located in Salt Lake City, Utah. The site is at the corner of Maine and ES Temple Streets. A temporary soil nail retaining wall was required for a site access ramp. Nine test nails were installed by Nicholson Construction near the base of this ramp and were exhumed during final construction. The exhumed nails were not logged; however, photographs of the nails are included in the Appendix 1. Based on the observations noted during the installation of the soil nails and available geotechnical borings, the subsurface conditions consisted of moist to wet, poorly to well graded gravel of medium to hard density, with silt, sand, cobbles, and the occasional clay seams. The geotechnical borings are included in the Appendix 1. Site 2: Posillico Site (Details are shown in the Appendix 2 on the attached CD ROM) Posillico Construction operates a storage yard in Bohemia, New York, which was used as Test Site 2 for this research study. Based on the geotechnical boring by Schnabel (Schnabel, 2006), this site is underlain by relatively clean, fine to coarse sand with layers containing cobbles, as well as lenses of thin silt or clay. A trench was excavated at this site to allow installation of nails into the trench wall. Peterson Geotechnical and Posillico Construction installed the nails and performed the testing. All nails were exhumed after testing. Site 3: Sunset Mesa Site (Details are shown in the Appendix 3 on the attached CD ROM) Test Site 3 was located at the active Sunset Mesa Gravel Pit in Montrose County, Colorado. The gravel pit is used for borrow material on local projects. Based on the geotechnical report by Buckhorn Geotech, Inc. (Buckhorn, 2008) developed for the test area, the geologic stratigraphy consists of uniform poorly graded gravel with sand. Buckhorn Geotech, Inc. describes the soil in which the HBSNs were installed as damp, dense, sandy gravel, cobbles, and boulders with trace fines.

CHAPTER 3 – FIELD STUDY AND ANALYSIS PROGRAM ______________________________________________________________________
9
A working bench and excavated face was created by Mountain Highwall Construction and eight nails were installed by Mountain Highwall and TEI Rock Drill for purposes of this testing program. All nails were exhumed after testing; photographs were provided by Mountain Highwall for review. Site 4: Olympia Site (Details are shown in the Appendix 4 on the attached CD ROM) Test Site 4 was located in Olympia, Washington, and is known as the DIS Wheeler property at the southeast corner of 14th Avenue and Jefferson Street. The test area was located within the limits of a temporary stormwater retention area constructed on the north side of the site. This area was excavated to a depth of about 10 ft with sloping sides. The test area setup was located along the eastern side of this retention basin and all nails were drilled from the bottom of the basin. As such, the nails entered the slope about two to three feet above the bottom of the basin. Based on the available geotechnical site investigation report (Haley & Aldrich, 2008), the geologic stratigraphy consists of fill overlying recessional outwash/glacio-lacustrine deposits. The encountered fill material consisted of soft to medium stiff silt and clay with variable debris and organic matter content. The soil nails were installed just below the fill layer in the recessional outwash/glacio-lacustrine deposits, which consist of stratified layers of sand and silt of soft to medium density. Field observation indicated the material into which the soil nails were installed was generally clayey fine sand. SOIL NAIL INSTALLATION METHODS Three methods were originally identified and selected for this test program. Method A is a baseline for comparison with the conventional SBSN. Methods B and C were conceived as practical ways to create an unbonded length along a test HBSN. They have been used in some form or another by contractors in past construction projects. In particular, Method C was expected to be a readily constructible production testing protocol. Method D was conceived prior to installation and testing at the fourth site and may be a potential alternate to Methods B and C. Method D offers certain advantages in some cases as described subsequently in this report. Method A: Traditional Test SBSN Installed Using Casing This is the typical procedure for installation of test SBSNs, where the free length of the soil nail is achieved with the aid of a temporary casing as shown in Figure 1. For this project, the test SBSNs were drilled using casing and a drag bit or roller bit. The method of casing advancement and bit type are indicated on the installation logs, included in the site reports in Appendices 1-4. After completion of drilling, the rods and drill bit were withdrawn and the tendon with centralizers was inserted. The tendon was a bare all-thread No. 14 bar (Fy=75 ksi) fitted with a PVC sheath along the intended free (or unbonded) length, as shown in Figure 2. The intended bond length below the bottom of the PVC sheath was tremie grouted while controlling grout volume based on a nominal hole diameter. The casing was then pulled to the top of the bond zone and the grout level was checked; grout was added or flushed as necessary. Upon

CHAPTER 3 – FIELD STUDY AND ANALYSIS PROGRAM ______________________________________________________________________
10
completion of the soil nail, the temporary casing was withdrawn from the hole, allowing the in-situ soil to collapse around the nail and smooth PVC sheath. For the test nails installed following this procedure, there is no grout intentionally surrounding the free length of the SBSN.
Figure 1. Photograph. Installation (Method A) of a solid bar at the
Posillico Site.
Structural Grout
Solid Thread Bar
Temporary Casing (Withdrawn)
Smooth PVC Sheath
Possible Raveled Soil After Grout Flushing
Figure 2. Schematic. Solid bar soil nail installed using Method A.

CHAPTER 3 – FIELD STUDY AND ANALYSIS PROGRAM ______________________________________________________________________
11
Method B: Hollow Bar Installed with Debonding Sheath and Water Flushing For Method B, HBSNs were installed by drilling with a temporary casing and a drag bit or roller bit completely through the unbonded length and stopping at the top of the desired bond zone. The method of casing advancement and bit type are indicated on the installation logs. After the casing was installed and the drill bit withdrawn, the hollow bar with a sacrificial drill bit was inserted into the casing. Drilling continued following typical installation procedures for HBSNs (as discussed in FHWA, 2006). To ensure the required free length was truly unbonded, the HBSN was fitted with a smooth PVC sheath along the free length only. Once drilling was completed, the grout was flushed from the annular space between the sheath and the temporary casing. In some cases, the smooth PVC sheath was slid over the hollow bar after its installation. Flushing of the unbonded length was performed using a narrow hose and water. Several variations of the flushing tube tips were attempted, including bending them into a "J" shape and cutting several openings in the side of the tube as shown in Figure 3. For each variation of flushing tip, water was not permitted to flow directly toward the grouted bond zone.
Figure 3. Photograph. Outlet end of flushing tube. After flushing, the casing was withdrawn, allowing the hole to collapse around the PVC and HBSN in the unbonded length. A schematic diagram of an installed Method B HBSN is shown in Figure 4. For the test nails installed following this procedure, there is no grout intentionally surrounding the free length. The depth of flushed grout in the casing was measured using a tape measure or rod during flushing. However, grout was in the withdrawn casing at depths where the nail was expected to be fully flushed. This occurrence is noted on the logs. Of particular

CHAPTER 3 – FIELD STUDY AND ANALYSIS PROGRAM ______________________________________________________________________
12
note, significant grout remained in the casing at the Sunset Mesa site where the contractor elected to wait until the end of the day to pull all the casing for Method B nails as shown in Figure 5.
Structural GroutSolid Thread Bar
Smooth PVC Sheath
Sacrificial Drill Bit
Possible Raveled Soil After Grout Flushing
Figure 4. Schematic. HBSN installed using Method B.
Figure 5. Photograph. Grout remaining in the casing after flushing at the Sunset Mesa Site.

CHAPTER 3 – FIELD STUDY AND ANALYSIS PROGRAM ______________________________________________________________________
13
Method C: Hollow Bar Installed with Debonding Sheath and Without Flushing To prohibit grout-to-ground load transfer, it is a common industry practice to place a PVC bondbreaker onto the HBSN along the length of the bar in the unbonded zone. Upon completion of the soil nail installation, a body of grout remains in the annular space around the PVC bondbreaker. For Method C, HBSNs were installed following established installation procedures as noted in the SOP (FHWA, 2006). Efforts were made to monitor the installation rate and grout flow for consistency throughout drilling; however, soil conditions and driller preferences had some impact on the ability to control the consistency of the parameters. Installation rate was generally consistent at a site but varied from site to site. Grout return was maintained throughout all drilling. The structural grout mix was used during drilling and final grouting. Using a single grout mixture was considered to be a more conservative approach for two reasons: (1) the thinner grout (typically used during drilling) is more likely to penetrate deeper into granular soils, resulting in larger grouted zones and thus increased nail capacity, and (2) the single grouting methods are often utilized by contractors. Debonding of the hollow bar along the intended free length was accomplished by fitting the bar with a smooth PVC sheath, which was secured to the coupler using duct tape. Grease was applied to the surface of the bar before installation of the smooth PVC sheath. A schematic diagram of an installed Method C HBSN is shown in Figure 6. Only at the Olympia Site, the smooth PVC sheath was pushed over the bar and through the grout after drilling. Installation of the smooth PVC sheath after grouting was possible because there was no tendency for collapse of the drill holes as observed during nail installation using Methods A and B. It is the experience of the authors that inserting the smooth PVC sheath after installation of the test HBSN may be difficult or impossible at many sites, and should not be relied upon except in cases where the required free length is relatively short. It is noted that for the test nails installed following this method, there is a substantial annulus of grout that remains around the free length.

CHAPTER 3 – FIELD STUDY AND ANALYSIS PROGRAM ______________________________________________________________________
14
Structural Grout
Solid Thread Bar
Smooth PVC Sheath
Sacrificial Drill Bit
Figure 6. Schematic. HBSN installed using Method C.
Method D: Hollow Bar with Bondbreaker Installed by Re-drilling a Pre-grouted Hole Method D was performed only at the Olympia Site. The intent of this method was to create a hole that would be resistant to collapsing without the need for temporary casing, and that could be subsequently flushed as described in Method B. For Method D, the installer drilled and grouted the intended free length of the test nail using the same equipment and setup for a typical HBSN installation. Upon completion of the drilling to the top of the bond zone, the hollow bar was retracted and the grout allowed to set over night. This initial grout body was re-drilled within 24 hours during typical HBSN installation procedures. The intent was to have a soil-cement annulus around the free length of the bar and to allow flushing of the unbonded zone. At the Olympia Site, redrilling through the day-old grout was accomplished with little difficulty. The hollow bar did, however, tend to drift toward the upper left of the initial grout body during drilling, thus resulting in an eccentric annulus with respect to the pre-drilled hole. However, the hole did remain open and flushing was completed successfully. A schematic diagram of an installed Method D HBSN is shown in Figure 7.

CHAPTER 3 – FIELD STUDY AND ANALYSIS PROGRAM ______________________________________________________________________
15
Structural Grout
Solid Thread Bar
Smooth PVC Sheath
Grout Flushed (No Possible Raveled Soil)
Sacrificial Drill Bit
Figure 7. Schematic. HBSN installed using Method D.
CONSTRUCTION DETAILS: MATERIALS, INSTRUMENTATION, AND INSTALLATION At each site, except as noted on the logs and summary table, both the SBSNs and HBSNs were located in the same geologic material. The soil nails were installed at 3 ft to 5 ft center-to-center spacing along an approximately horizontal line. Materials
Materials from various suppliers were used. However, they all met certain pre-established criteria. Bar and drill bits were supplied by several manufacturers including Williams Form, Con-Tech Systems Ltd. (CTS), and DSI America. Each bar and drill bit type, size, strength, and manufacturer are noted on the logs. Bar size was determined based on applicability to typical SBSN and HBSN production methods, as well as on the maximum test load that could be applied. In general, larger bars were selected to attempt to induce geotechnical failure of the bond zone of the test nails in order to obtain ultimate bond strength values. Centralizers were installed on all SBSNs and HBSNs with exception of non-CTS HBSNs. Centralizers are not a manufactured component of the bar system. Table 2 summarizes materials and dimensions used at each site for each installation method.

CHAPTER 3 – FIELD STUDY AND ANALYSIS PROGRAM ______________________________________________________________________
16
Table 2. Soil nail material summary.
Site Bit Type Bit Size (in)
Casing Outer
Diameter (in)
Casing Wall
Thickness (in)
Bar Type Bar ID Bar
Supplier
Sacrificial Wing/Drag
5 4.5 0.25 Solid # 14 Williams
Block 76
Carbide 4 4.5 0.25 Hollow
Core R51N Williams
Roller 5 7 0.188 Solid # 14 Williams
Posillico
Cross Cut 5.1 7 0.188 Hollow
Core 52/26 mm Con-Tech
Super Jaw 7.75 7 0.43 Solid # 14 Williams Sunset Mesa
Carbide 5 7 0.43 Hollow
Core 52/26 mm Con-Tech
-- 4 6.25 0.25 Solid # 14 DSI
Olympia
Cross Cut 4.52 6.25 0.25 Hollow
Core R51N DSI
The grout mix used for this research study was comprised of Type I, Type II, or Type V cement with a target water-cement ratio of about 0.44 (1 bag of cement per 5 gallons of water). The grout was mixed using a high shear mixer group pump (typical pump shown in Figure 8). The specific gravity of the grout was measured before injection into the hole at the end of the tremie tube, or connection of the hose and swivel. Occasionally the specific gravity of the grout return was also measured. For nails where a pre-measured volume of grout was placed, no return was expected or observed. As noted on the drill logs, the specific gravity of the sampled grout was at least 1.8, as measured using a mud balance. Grout cubes were also collected and tested for strength. The grout cubes were prepared and tested in accordance with ASTM C109/C109M-02, Standard Test Method for Compressive Strength of Hydraulic Cement Mortars (using 2-inch or 50-millimeter cube specimens). As discussed in a previous section, the same grout mix was used during the entire drilling process, for both drilling and final grouting.

CHAPTER 3 – FIELD STUDY AND ANALYSIS PROGRAM ______________________________________________________________________
17
Figure 8. Photograph. Obermann high shear mixer grout pump. Strain Gauges Based on suggestions developed from the review meeting following completion of testing in the first three sites, strain gauges were utilized only at the Olympia Site. Four Geokon modified Model 4200 strain gauges were installed into one HBSN for each of the methods used (Methods B, C, and D) at the Olympia Site. The use of strain gauges was considered in order to measure axial strain and evaluate the load transfer along the length of the nails. The strain gauges used were Geokon Model 4200-AX as shown in Figure 9, which have a relatively small diameter (maximum 19 mm). To reduce the cable diameter, the thermistors were not activated. The wings of the dumbbell style strain gauge were notched to allow the cables to pass without having to increase the overall diameter of the strain gauge footprint. On either end of the dumbbell, Geokon welded a nut, which provided a positive connection for a ¼-inch diameter all-thread bar. The ¼-inch diameter all-thread bar was used to space and to plunge the gauges into the grout column within the hollow core bar.

CHAPTER 3 – FIELD STUDY AND ANALYSIS PROGRAM ______________________________________________________________________
18
Figure 9. Photograph. Geokon Model 4200-AX strain gauge with threadbar attachment and notched dumbbells.
Equipment and Installation The equipment for each site depended on subsurface conditions and equipment availability to the contractor. The Sunset Mesa, Block 76, and Posillico sites required two different rigs: one to install the casing as shown in Figure 10, and one to perform the rotary hollow bar drilling. In general, the equipment used at each site was sufficient to successfully complete the installation. The equipment used at each site is listed on the respective drill logs. For the installation of the HBSNs, a pressure gauge was installed at the swivel, as shown in Figure 11. The grout pressure during installation of the HBSNs is noted on the drill logs. The installation processes for Methods A, B, C and D were relatively consistent. Several factors that may affect the bond stress such as rotation rate, advancement rate, grout pressure, grout flow rate and grout mix data were collected and noted on the drill logs.

CHAPTER 3 – FIELD STUDY AND ANALYSIS PROGRAM ______________________________________________________________________
19
Figure 10. Photograph. Casing installation at the
Sunset Mesa Site.
Figure 11. Photograph. Top hammer setup used for installation Methods B and C. Note the grout pressure gauge
at the swivel and centralizer used to hold PVC in place.

CHAPTER 3 – FIELD STUDY AND ANALYSIS PROGRAM ______________________________________________________________________
20
SOIL NAIL TESTING The soil nails were tested using typical verification testing methods found in GEC 7 (FHWA, 2003). Typically, verification tests are completed on “sacrificial” nails prior to construction using the same installation methods as production soil nails. Verification tests are generally intended to verify a factor of safety of the bond strength, or to reach ultimate or pull-out loads. For this study, the bonded lengths and bar sizes were designed to attempt pull-out failure of the test soil nail, based on the presumptive bond strength and drill hole diameters. Per GEC 7 (FHWA, 2003), “pullout failure is defined as the inability to further increase the test load while there is continued pullout movement of the test nail.” For the purpose of establishing load increments, a Design Test Load (DTL) was established for each test, and is used as a reference in the data collection spreadsheets. The value of DTL was equal to the intended maximum test load divided by a factor of two. Since the objective was to reach pull-out failure, the bar was sized to allow the nail to be loaded to more than 150% of the ultimate load capacity given by the presumptive bond strength. However, in several cases, pull-out could not be achieved at these high loads. The load test schedule in Table 3 was used as a starting point for each load test. Soil nail movement was recorded during each load increment and during creep holds in accordance with FHWA guidelines. As testing was performed at a given site, the subsequent load test increments may have been adjusted to collect intermediate data or data beyond the assumed bond strength or 2x DTL. At low loads this hold time was reduced for some tests (see load test logs in Appendices 1-4). The creep test may have been performed at a different multiple of the DTL, considering anticipated pull-out load, as shown on the test results.
Table 3. Typical verification test load schedule.
Test Load Increment Hold Time (minutes)
AL (0.05DTL max) 1
0.25DTL 10
0.50DTL 10
0.75DTL 10
1.00DTL 10
1.25DTL 10
1.50DTL (creep test) 60
1.75DTL 10
2.00DTL (maximum load) 10
AL 1 Notes: AL = Alignment load DTL = Design test load

CHAPTER 3 – FIELD STUDY AND ANALYSIS PROGRAM ______________________________________________________________________
21
Load Testing Setup
The load testing setup varied from site to site but consisted of the following critical components: two dial gauges, dial gauge support, jack and pressure gauge, and a reaction frame. Pressure gauges were graduated in increments not greater than 100 psi (689.5-kPa). The dial gauges were capable of measuring to 0.001 inches (0.025 millimeters). The Sunset Mesa typical load test setup is shown in Figure 12.
Figure 12. Photograph. Load test setup at Sunset Mesa Site. The reaction for the test load was generally provided by a steel plate supported on wood cribbing, which was laid out to provide a flat surface perpendicular to the nail alignment. Cribbing and plates spread the load over an area of at least nine square feet. Where shallow benches were constructed for nail installation, additional efforts were required to prevent passive failure of the wall face during jacking. Strain Gauge Use at Olympia Site Four Geokon 4200-AX strain gauges were installed into the HBSNs in order to measure axial strain and evaluate the load transfer along the nails. The gauges were installed inside the hollow portion of the bar after final grouting. The hollow core provided confinement of the grout in which the strain gauges were installed. One gauge was located within the unbonded length, while the remaining four gauges were distributed within the bond zone. The gauge inside the unbonded length was intended to detect load shedding that might occur along the unbonded length.

CHAPTER 3 – FIELD STUDY AND ANALYSIS PROGRAM ______________________________________________________________________
22
The load at each strain gauge was calculated using Equation (1):
P = εaAE (1) where: P = Force in nail εa = Axial strain as measured by the gauge E = Young’s Modulus of steel, 29,000 ksi A = Cross-sectional area of the steel reinforcing bar During initial loading of the soil nail, before the grout develops generalized tensile cracking, this equation underestimates the axial load of the soil nail. However, the interpretation of the strain gauge data focused in determining the bond strength along the soil nail under relatively large test loads, and once the contribution of the grout to the axial stiffness has become negligible or zero.

CHAPTER 4 – FIELD TEST RESULTS ______________________________________________________________________
23
CHAPTER 4 – FIELD TEST RESULTS OVERVIEW OF DATA The appended Data Reports provide details about each test site, nail layout, soil conditions, and test results; and the reader is directed to the appendices for further details. A summary of the load test data is shown in Tables 4 through 7 for the four sites to provide a ready comparison of the information for the purposes of this summary report. The following notes explain the column headings for Tables 4 through 7. Column Descriptions:
Nail Number/Installation Method: Nail reference number from the field and installation method as discussed in Chapter 3.
Maximum Test Load: Jack load at soil nail pullout if pullout occurred; otherwise maximum test load.
Maximum Movement: Cumulative movement measured at the soil nail tail with dial gauges at the maximum test load just prior to unloading.
Residual Movement: Cumulative movement measured at the soil nail tail with dial gauges after unloading to alignment load at maximum test load.
Pullout Failure Achieved?: "Yes" indicates pullout failure achieved at the maximum test load. "No" indicates pullout failure was not achieved at the maximum test load.
Bond Length: The distance from the tip of the bar farthest from the soil face to the edge of the coupler or smooth-walled PVC, whichever is shorter.
Average Drilling Rate (ft/min): Average of the drilling rate measurements within the bond length.
Calculated Average Bond Strength (psi): Bond strength as calculated per Equation (2), which follows Table 7.
Soil Type Along Bond Zone: Soil type encountered in the bond zone based on nearby borings and drill cuttings observed during soil nail drilling. Soil density / consistency is based on nearby borings. The soil type is designated as Group Symbols in accordance with ASTM D2487 Unified Soil Classification System.

CHAPTER 4 – FIELD TEST RESULTS ______________________________________________________________________
24
Table 4. Block 76 load test data summary.
Nail Number/
Installation Method
Maximum Test Load
(kip)
Maximum Movement
(in)
Residual Movement
(in)
Pullout Failure
Achieved?
Bonded Length
(ft)
Average Drilling
Rate (ft/min)
Calculated Average
Bond Strength
(psi)
Soil Type Along Bond Zone/
Density
A1 102.5 1.346 N/A Yes 6.0 3.2 75.5
A2 68.5 1.174 N/A Yes 6.0 1.5 50.5
A3 111.6 1.496 N/A Yes 6.0 1.1 82.2
SP with gravel/ Dense
B1 136.6 0.720 0.164 No 6.0 3.4 151.0
B3 141.4 0.744 0.172 No 6.0 3.1 156.3
GP with sand/ Dense
B4
56.5 1.162 N/A Yes 6.0 5.6 62.4
SP/ Dense
C1 135.6 0.613 0.215 No 6.0 2.2 149.9
C2 140.4 0.581 0.162 No 6.0 1.4 155.2
C3 140.9 0.577 0.129 No 6.0 1.5 155.7
GP with sand/ Dense

CHAPTER 4 – FIELD TEST RESULTS ______________________________________________________________________
25
Table 5. Posillico load test data summary.
Nail Number/
Installation Method
Maximum Test Load
(kip)
Maximum Movement
(in)
Residual Movement
(in)
Pullout Failure
Achieved?
Bonded Length
(ft)
Average Drilling
Rate (ft/min)
Calculated Average
Bond Strength
(psi)
Soil Type Along Bond Zone/
Density
A1 20.9 1.027 N/A(1) Yes 6.0 0.6 13.2
A2 20.9 1.804 N/A(1) Yes 6.0 1.0 13.2
B1 82.1 1.163 N/A(1) Yes 6.0 1.7 71.2
B2 91.8 2.953 N/A(1) Yes 6.0 3.6 79.6
B3 75.7 1.604 N/A(1) Yes 6.0 - 65.6
C1 151.9 1.577 0.963 Yes 6.0 0.4 131.7
C2 116.5 2.007 N/A(1) Yes 6.0 0.8 101.0
C3(2) 73.5 0.836 N/A(1) No(2) 6.0 1.0 63.7
SP/ Med. Dense
Notes: (1) Final alignment load deflection of movement reading not collected. (2) A wedge of soil failed behind the cribbing at a load of 73.5 kip.

CHAPTER 4 – FIELD TEST RESULTS ______________________________________________________________________
26
Table 6. Sunset Mesa load test data summary.
Nail Number/
Installation Method
Maximum Test Load
(kip)
Maximum Movement
(in)
Residual Movement
(in)
Pullout Failure
Achieved?
Bonded Length
(ft)
Average Drilling
Rate (ft/min)
Calculated Average
Bond Strength
(psi)
Soil Type Along Bond Zone/
Density
A2 93.2 1.436 1.010 Yes 6.0 0.6 53.2
A3 113.1 1.310 0.890 Yes 6.0 0.6 64.5
B1 105.1 0.764 0.403 No 6.0 1.9 91.1
B2 119.0 1.497 0.982 Yes 6.0 2.9 103.2
B3 103.1 0.930 0.498 Yes 6.0 1.5 89.4
C1 135.1 0.454 0.093 No 6.0 0.7 117.1
C2 146.3 0.909 0.416 Yes 6.0 2.0 126.8
C3 134.9 0.680 0.211 No 6.0 0.1 116.9
GP with sand/ Med.
Dense – Dense (1)
Notes: (1) Test boring data not available, based on observation and drilling action.

CHAPTER 4 – FIELD TEST RESULTS ______________________________________________________________________
27
Table 7. Olympia load test data summary.
Nail Number/
Installation Method
Maximum Test Load
(kip)
Maximum Movement
(in)
Residual Movement(1)
(in)
Pullout Failure
Achieved?
Bonded Length
(ft)
Average Drilling
Rate (ft/min)
Calculated Average
Bond Strength
(psi)
Soil Type Along Bond
Zone/ Consistency
A1 35.4 0.400 N/A Yes 10.0 5.0 15.0
A2 40.4 0.676 N/A Yes 10.0 3.5 17.1
A3 30.1 N/A N/A Yes 10.0 3.0 12.8
B1 22.9 0.676 N/A Yes 7.0 4.5 19.2
B2 24.1 2.273 N/A Yes 7.0 3.5 20.2
B3 22.3 1.317 N/A Yes 7.0 5.0 18.7
C1(2) 31.6 1.155 N/A Yes 10.0 5.7 18.5
C2(2) 25.4 0.175 N/A Yes 10.0 5.3 14.9
C3(2) 41.6 2.201 N/A Yes 10.0 4.4 24.4
D1 40.4 N/A N/A Yes 10.0 2.5 23.7
D2 30.4 0.404 N/A Yes 10.0 3.8 17.8
D3 32.9 1.142 N/A Yes 10.0 3.1 19.3
SC/ Med. to
Stiff
Notes: (1) Residual movement not applicable at final pullout cycle. Residual movement observed at intermittent cycles in data and plots in Appendix 4.
(2) Not installed in conformance to Method C; grout was partially flushed from unbonded length.

CHAPTER 4 – FIELD TEST RESULTS ______________________________________________________________________
28
Load Test Interpretation Methods For test nails that underwent geotechnical failure during testing, the average bond strength along the bond zone was calculated using the following expression:
12.
BVnom
ultimate
LD
Q
(2)
where: LBV = Test nail bonded length [ft] Qultimate = Pullout load [lb]. If pullout does not occur at the maximum test load, it
is noted as an asterisk (*) in the table α = Average ultimate bond strength [psi] Dnom = Nominal diameter of the drill hole (drill bit diameter) [in]
The bonded length was considered from the tip of the bar at the bottom of the bond zone to the bottom of the unbonded zone. The length of the coupler was considered part of the bond zone since the measured top of grout location was generally centered at the interface between the PVC and coupler. It was expected that the load would transfer to the top of the grout in the bond zone from the threaded bar. Generally, the grout body diameter will be larger than the nominal drill hole diameter. Consequently, the actual average ultimate bond strength may be less than the value given by Equation (2). However, it is important to recognize that the actual diameter of the bond zone is rarely known, and design of soil nails must necessarily be done based on the nominal drill hole diameter.

CHAPTER 5 – ANALYSIS AND INTERPRETATION ______________________________________________________________________
29
CHAPTER 5 – ANALYSIS AND INTERPRETATION ANALYSIS OF INTERPRETED BOND STRENGTH DATA Figure 13 contains the interpreted bond strength data for all sites and installation methods. Mobilized bond stress values in test nails that did not fail are marked with an asterisk (*). It is noted that the values shown correspond to average interpreted bond strength along the bond length of the nail, and may not be representative of larger, localized values along the bond zone. The average interpreted bond strengths are likely affected by the displacement-softening and post-peak reduction of shear strength phenomena that typically occur at the interfaces between structural materials and granular soils (Gómez et al. 2003). Littlejohn et al. (1977) provide an extensive discussion on the variation of mobilized bond stress along tiebacks and anchors that is also directly applicable to soil nails.

CHAPTER 5 – ANALYSIS AND INTERPRETATION ______________________________________________________________________
30
Figure 13. Graph. Interpreted bond strength for the HBSN and SBSN.
As shown on Figure 13, the bond strength along the test nails ranged from approximately 10 psi to a maximum of 155 psi. Two key points are observed in the data and are further discussed in

CHAPTER 5 – ANALYSIS AND INTERPRETATION ______________________________________________________________________
31
this chapter: (1) The data shows that the bond strength along the HBSNs was generally larger than the bond strength along the SBSNs, especially in clean sands and gravel. (2) The data also shows that the average bond strength calculated based on Equation (2) was generally larger in soil nails debonded according to Method C than in those debonded using Method B. The bond strength data was normalized by dividing the bond strength of each test nail at a site by the average bond strength measured in Type A nails (SBSNs) at that same site. The normalized bond strength data is shown in Figure 14. It can be seen that the bond strength along the HBSNs installed using Method B was generally more than 1.5 times larger than the bond strength along the SBSNs installed using Method A. The difference in bond strength is likely due to the effect of the HBSN grouting procedure on the surrounding soil, which results in a larger grout body with considerable surface roughness. Test HBSNs debonded using Method C generally yielded bond strength values that were significantly larger than those measured in Method B nails. The larger values measured in the Method C nails are likely an artifact of the contribution of the grout annulus left above the bond zone and around the free length of the nails, which is a product of the installation procedure. Consequently, the following discussion focuses on the bond values interpreted from the test SBSNs installed using Method A, and the test HBSNs debonded using Method B. It is important to note that five of the eight test HBSNs in the gravel did not reach failure. Therefore, in these test nails, the actual average bond strength is larger than that given by the maximum test load.

CHAPTER 5 – ANALYSIS AND INTERPRETATION ______________________________________________________________________
32
Figure 14. Graph. Normalized interpreted bond strength.
Table 8 contains the ranges of bond strength values for gravity-grouted rotary drilled SBSNs given in GEC 7 (FHWA, 2003) for various types of soils that generally correspond to those encountered in the sites chosen for this investigation. The tests on SBSNs yielded bond strength values that are within the range of values given in FHWA (2003) for silty sand and poorly graded sand. However, the test results suggest that the values in FHWA (2003) are conservative for gravelly sand and sandy gravel similar to those tested in this study. The bond strength values

CHAPTER 5 – ANALYSIS AND INTERPRETATION ______________________________________________________________________
33
interpreted from HBSN tests were all larger than those given by FHWA (2003) for gravity-grouted nails.
Table 8. Range of bond strength by soil type and installation method.
Grout-to-Ground Nominal Strengths
Soil Type
FHWA (2005) Rotary Drilled
Grout-to-Ground Nominal
Strengths / Jet Grouted
psi (kPa)
Installation Method A
psi (kPa)
Installation Method B
psi (kPa)
Installation Method C
psi (kPa)
Installation Method D
psi (kPa)
Silty Sand (SM)
14.5-21.8 (100-150)
55.1 (380)
12.8-17.1 (88-118)
18.7-24.4 (129-168)
*not performed
17.8-23.7 (123-163)
Poorly Graded Sand (SP)
14.5-26.1 (100-180)
55.1 (380)
13.2 (91)
71.2-79.6 (491-549)
63.7-131.7 (439-908)
-
SP with Gravel
14.5-26.1 (100-180)
101.5 (700)
50.5-82.2 (348-567)
- - -
GP with Sand
14.5-26.1 (100-180)
101.5 (700)
53.2-64.5 (367-445)
62.4-156.3 (430-1059)
116.9-155.7 (806-1074)
-
There was no significant difference between the bond strength values interpreted from the tests performed on the HBSNs and SBSNs in clayey sand at the Olympia Site and those given by FHWA (2003). Con-Tech Systems Ltd. (CTS), supplier of the Ischebeck Injection Bore bars, has proposed the use of bond diameter magnification factors (Con-Tech, 2005). The CTS method assumes the injection bore process results in a diameter of the as-drilled hole larger than the bit diameter. CTS establishes enlargement factors for various soil types. It is noted, however, that the actual effective enlargement of a hole would depend on drilling parameters such as drilling rate and grout injection pressure. The normalized bond strength values for the tested HBSNs debonded using installation Method B, which are depicted in Figure 14, correspond to this concept of enlargement factor. The normalized bond strength values (Method B) have been reproduced in Table 9, together with the enlargement factors proposed by CTS. Bond strength values were calculated applying the magnification factors proposed by CTS to the bond strength values interpreted from tests on soil nails installed using Method A. The CTS bond

CHAPTER 5 – ANALYSIS AND INTERPRETATION ______________________________________________________________________
34
strength values are compared to the bond strength values interpreted from Method B test nails in Table 9. The bond strength values given by FHWA (2005) for pressure grouted micropiles (Type B) are also shown for comparison. To avoid confusion with Method B soil nails, these micropiles are referred to as “pressure-grouted micropiles” throughout this report. The bond strength values interpreted from data collected from the four sites are consistent with or larger than the bond strength values calculated using the magnification factor proposed by CTS. They are also consistent with or larger than the bond strength values given by FHWA (2005) for pressure-grouted micropiles in similar soils.
Table 9. Bond strength comparison.
Grout-to-Ground Nominal Strengths
Soil Type Method A psi
(kPa)
Method B psi
(kPa)
CTS psi
(kPa)*
FHWA (2005) Grout-to-Ground
Nominal Strengths for Pressure-
grouted Micropiles psi
(kPa)
Silty Sand (SM) 12.8-17.1 (88-118)
18.7-24.4 (129-139)
1.5 (Factor) 19.2-25.7
(132.4-176.9)
Sand (some silt) 10-27.5 (70-190)
Poorly Graded Sand (SP)
13.2 (91)
71.2-79.6 (491-549)
1.5 (Factor) 19.8 (137)
Sand (some Gravel) 17.5-52
(120-360)
SP with Gravel 50.5-82.2 (348-567)
- 1.5 (Factor) 75.8-123.3 (522.3-851)
Sand (some Gravel) 17.5-52
(120-360)
GP with Sand 53.2-64.5 (367-445)
62.4-156.3 (430-1059)
2 (Factor) 106.5-129 (550-667)
Gravel (some Sand) 17.5-52
(120-360) * Bond strength values were calculated applying the magnification factors proposed by CTS to the
bond strength values interpreted from tests on soil nails installed using Method A. Exhumed Test Nails Tested nails were exhumed at three of the sites. Exhumed nails were photographed and logged at the Posillico and Sunset Mesa Sites and only partially photographed at the Block 76 site. The appended data reports for the Posillico and Sunset Mesa Sites provide measurements and photographs of the exhumed nails, which show significant differences between the SBSNs and the HBSNs in both the hole diameter and the uniformity of the hole diameter. The cased method of solid bar installation (Method A) results in a relatively uniform diameter equivalent to the outside diameter of the casing. Little to no grout penetration was observed around the SBSNs as would be evidenced by irregularities and cemented soil around the perimeter of the bond zone. The Block 76 data is not included as it is not complete; however, available photographs are included in Appendix 1.

CHAPTER 5 – ANALYSIS AND INTERPRETATION ______________________________________________________________________
35
Comparison of the effects due to the various installation methods (Methods B, C and D), indicates there was significant evidence of limited soil mixing, irregular bond diameter (Table 10), and grout penetration. For the gravel site (Sunset Mesa) large cobbles and boulders were engaged with the bar, which likely generated a “deadman effect” during testing. Typical bonding to gravel at the Sunset Mesa Site is shown in Figure 15.
Table 10. Range of bond zone diameters measured from exhumed nails.
Location Number of Nails
Exhumed Soil Type Method A Methods B and C
Sunset Mesa Site
12 GP with sand ~8" ~8" to ~18"
Posillico Site 12 SP ~7" to 8" 6¼" to 9½"
HBSNs debonded using Method C presented a significant annulus of grout around the debonded free length. This annulus can absorb part of the load that was intended to be transmitted entirely to the bond zone, which is discussed in the following section.
Figure 15. Photograph. Exhumed HBSN at the Posillico Site.
Discussion on Interpreted Bond Values
Based on the test results and observations, the effect of the hollow bar installation process creates an enlarged bond zone. It appears that the enlarged bond zone diameter is due to scour of the soil caused by the grout flow, and permeation of the grout into the granular materials. The

CHAPTER 5 – ANALYSIS AND INTERPRETATION ______________________________________________________________________
36
resulting grout body has an irregular surface with significant roughness, and has an average diameter that is typically larger than the nominal drill bit diameter. Additionally, the process of installation of the hollow bar is not likely to induce loosening or decompression of the soils. In SBSNs, the average diameter of the grout body will depend on the internal roughness of the borehole. An SBSN grout body diameter that is significantly larger than the nominal diameter is most likely an indication of significant loss of soil during drilling. This indication may in turn suggest that there was significant disturbance or loosening of the soils during soil nail installation. Consequently, an SBSN grout diameter that is larger than a nominal drill bit diameter does not necessarily result in a larger capacity of the soil nail. Larger diameter drill holes in Method A test nails were observed at the Posillico Site. Loosening of the poorly graded soils may have been responsible for the low bond strength values interpreted from the tests. The interpreted bond stress values were even lower than those given in GEC 7 (FHWA 2006). With SBSNs where there is no significant soil disturbance, the grout body diameter will be somewhat similar to the nominal drill bit diameter, and there will be little or no permeation of the grout into the soil. Thus, the average load-transfer ratio, defined as the load shed from the grouted element per unit length (bond strength times the nominal drill hole diameter), will be lower than that of a correctly installed hollow core bar where scouring and permeation of the soils take place. In medium stiff to hard, fine-grained soils, the scouring and permeation effects of the hollow core bar are minimized. Thus, average load-transfer ratio values would likely be similar to those for correctly installed SBSNs. In summary, the enhanced grout body shape and the reduced disturbance of the soils are considered to be the two main phenomena that contribute to the enhanced capacity of the HBSNs with respect to that of the SBSNs. It is important to note, however, that there is insufficient information to evaluate the relative contributions of these factors. The drilling parameters are believed to play a significant role in these factors, and these drilling parameters will vary from project to project. Thus, an estimate of what portion of the bond strength gain in a hollow core bar is due to the increased diameter is not possible at this time. The Doughnut Effect The average bond strength values interpreted from tests on HBSNs debonded using Method C are larger than those for Method B soil nails. It is assumed that the difference in average bond strength is a testing artifact, herein referred to as Doughnut Effect, which is inherent to the Method C installation. Soil nails installed using Method C have a significant annulus of grout around the debonded length of the nail. The load applied to the soil nail through the hollow bar is transferred directly

CHAPTER 5 – ANALYSIS AND INTERPRETATION ______________________________________________________________________
37
to the bond zone below the free length of the soil nail. However, as the bond zone displaces along its longitudinal axis during loading, it tends to compress the annulus of grout around the free length of the nail. If the grout-filled annulus was small enough that it could not withstand significant compressive force, then this effect would be limited. However, the grouted annulus in the tested nails can likely withstand significant compressive forces. Therefore, a significant portion of the load transferred to the bond zone is transferred back to the annulus of grout along the free length of the nail. A schematic diagram of the forces resulting from the Doughnut Effect is show as Figure 16. Consequently, the actual bond zone length of the soil nail is longer than intended. Therefore, Equation (2) overestimates the average bond strength of Method C nails shown in Figure 13 and in Table 9.
Figure 16. Schematic. Geometry and resistance mechanism of the Doughnut Effect.
The extent to which the annulus along the free length is capable of transferring load to the ground would depend on several factors such as grout-to-ground bond strength along the free length, the compressive strength of the grout, confinement of this grout, the size of the doughnut, and lack of confinement due to the proximity to the excavation face. It is noted that, for this investigation, 4.5-inch bit diameters were used compared to the 2.5-inch OD smooth PVC sheath. Therefore, given the enlargement of the drill hole, the grout annulus may have been 1.0 to 2.0 inches thick, or even thicker. Such an annulus would be capable of transferring significant axial loads. If a larger PVC bondbreaker or smaller bits are used, the grout annulus may be 0.5 to 1-inch thick, and may not be able to transfer large loads to the free length of the nail. However, such load transfer may still be significant and must be considered for interpretation of the tests.

CHAPTER 5 – ANALYSIS AND INTERPRETATION ______________________________________________________________________
38
Based on the data presented in Figures 13 and 14, the Doughnut Effect was not significant in Method C nails installed at the Olympia Site. As noted in Table 7, grout was partially flushed from the unbonded length at this site. It is then possible that the grout annulus did not provide significant added resistance. The Doughnut Effect may not be significant in Method D nails, where re-drilling of the initial grout may prevent the existence of a significant, intact grout annulus. The remaining grout annulus is likely a relatively thin soil-grout shell of lower strength than the structural grout. It is also possible that the action of drilling deteriorates the pre-installed grout sufficiently to prevent the pre-installed grout from being able to transfer significant axial loads. This method was tried in a relatively fine-grained material where limited scour and grout penetration occurred. Strain Gauge Data For the soil nails installed at the Olympia Site, the axial load along the test soil nails during testing was interpreted from the data from strain gauges installed inside the HBSNs. The axial load is shown in Figures 17 through 19. It is important to note that the load tests also included unload-reload cycles. Therefore, the axial load response may have been affected by locked-in axial loads. For simplicity, the plots do not include axial loads during unloading-reloading.
0
2
4
6
8
10
12
14
16
18
20
0 5 10 15 20 25 30 35
Dep
th [f
t]
Load (kip)
50% DTL 75% DTL 100% DTL 150% DTL 200% DTL
Soil Face
Top of Bond Zone
Tip of Soil Nail
Figure 17. Graph. Load distribution from strain gauges in HBSN B1 (Olympia Site).

CHAPTER 5 – ANALYSIS AND INTERPRETATION ______________________________________________________________________
39
0
2
4
6
8
10
12
14
16
18
20
-5 0 5 10 15 20 25 30 35
Dep
th [f
t]Load (kip)
25% DTL 50% DTL 75% DTL 100% DTL 125% DTL 150% DTL 175% DTL
Soil Face
Top of Bond Zone
Tip of Soil Nail
Figure 18. Graph. Load distribution from strain gauges in HBSN C2 (Olympia Site).
0
2
4
6
8
10
12
14
16
18
20
0 5 10 15 20 25 30 35
Dep
th [f
t]
Load (kip)
50% DTL 75% DTL 100% DTL 150% DTL 200% DTL
Strain gage may have malfunctioned after 10.7 kips.
Soil Face
Top of Bond Zone
Tip of Soil Nail
Figure 19. Graph. Load distribution from strain gauges in HBSN D2 (Olympia Site).

CHAPTER 5 – ANALYSIS AND INTERPRETATION ______________________________________________________________________
40
Based on the information presented in Figures 17 through 19 only, it would appear that the intended free length was not fully debonded from the surrounding soil in any of the test nails. The plots in the figures show that the axial load in the intended free length was less than the applied load, thus indicating that there was load transfer from the soil nail to surrounding ground. Figure 20 shows the evolution of the interpreted axial load in the intended free length during testing. During the first test load increment, the strain gauges did not show a significant response to the applied load at the nail head. However, during subsequent test load increments, soil nails installed following Methods B and D showed interpreted axial load increases that followed almost a one to one relationship with the applied test load increments. This suggests that the test soil nails installed using Methods B and D were sufficiently debonded from the surrounding soil.
0.0
5.0
10.0
15.0
20.0
25.0
30.0
35.0
0.0 5.0 10.0 15.0 20.0 25.0 30.0 35.0
Axi
al lo
ad f
rom
gau
ge (
kip)
Jack load (kip)
Test Nail B1
Test Nail C2
Test Nail D2
Figure 20. Graph. Measured load within the free
length of the soil nail from the Olympia Site.
Figure 20 also suggests that with Method C, installation debonding was not as efficient as with Methods B and D. However, debonding was also significant as the axial load increments in the intended free length were approximately 60% of the applied test load increments. Even though there may have been significant debonding of the bar with respect to the grout annulus, a significant Doughnut Effect, described previously, may still exist.

CHAPTER 5 – ANALYSIS AND INTERPRETATION ______________________________________________________________________
41
Figures 17 through 19 also allow the calculation of the bond stresses along the bond zone of the tested soil nails. Table 11 compares the values of bond strength calculated from the strain gauge data to the average bond strength values from Table 10. It is observed that the calculated average bond strength from Table 10 generally matches the maximum interpreted bond strength from the strain gauges. This is consistent with the relatively linear axial load distribution along the bond zone depicted in the figures. It is noted that these test nails were loaded to geotechnical failure. In a soil nail that does not reach geotechnical failure, strain gauge data is useful in providing information to determine the actual bond strength of the soil nail.
Table 11. Comparison of strain gauge data to deformation data.
Nail Number
Calculated Average Bond Strength from
Displacement Data (psi)
Calculated Average Bond Strength from
Strain Gauge (psi)
Maximum Interpreted Bond Strength from Strain Gauge within Bond Zone
(psi)
B1 19.2 11.6 5.3 C2 14.9 10.9 13.7 D2 17.8 14.6 10.8
The similarity between the maximum and the average bond strength in Table 11 is also consistent with a negligible Doughnut Effect in the Olympia Site Method C nails discussed in the preceding section. The results inferred from the strain gauge readings prompt the following conclusions:
All three installation methods followed for the hollow core bars (B, C, and D) provided significant debonding.
Method C debonding was less efficient than the debonding achieved using Methods B and D. However, the use of strain gauges in the intended free length of Method C soil nails could allow adequate interpretation of the test results.
There was no significant Doughnut Effect in Method C nails at the Olympia Site,
possibly due to partial flushing of the unbonded zone (only performed at this site).


CHAPTER 6 – CONCLUSIONS ______________________________________________________________________
43
CHAPTER 6 – CONCLUSIONS The tests performed for this investigation provided valuable insight into the behavior of HBSNs, and constituted the first published concerted effort in establishing suitable installation procedures for test HBSNs. Geotechnical failure was achieved in most of the tests performed during this investigation. However, at some sites, failure of the test nails did not take place in the granular soils. Therefore, the data given in this report includes maximum tested bond values and not ultimate values for some of the tests. It must be noted, however, that most of the test nails that did not achieve geotechnical failure were installed using Method C. It is likely that in these nails, the Doughnut Effect was significant and the maximum bond values reported are overestimated as discussed in the report. The results of the tests performed on SBSNs installed in Silty Sand (SM) and Poorly Graded Sand (SP) showed values of average bond strength similar to the presumptive values given by FHWA (2003). However, the calculated bond strength values for SBSNs in Poorly Graded Sand with Gravel (SP with Gravel) and Poorly Graded Gravel with Sand (GP with Sand) were significantly higher than the FHWA presumptive values. Therefore, it may be concluded that the presumptive values given by FHWA for SBSNs in coarse granular soils may be conservative. This is consistent with the experience of the authors based on load testing of soil nails, tiebacks, and micropiles installed in coarse granular soils. The tests showed that HBSNs generally develop larger bond strength values in granular soils than traditional SBSNs. This is due to the larger grout body created by undercutting and permeation of the soils by the grout, and to more pronounced roughness features in the surface of the grout body. Consequently, the FHWA presumptive values for SBSNs are likely very conservative in most cases. In granular soils with a significant content of fines (SM and SC), the calculated average bond values for HBSNs installed using Methods B and D were similar to those for Method A nails, and to the presumptive values given by FHWA (2003). This suggests that undercutting and permeation of these soils by the grout are not as significant as in more predominantly granular soils. Observation of exhumed HBSNs that were installed in predominantly granular soils reveals that the grout body along the bond zone is significantly larger than the nominal drill bit diameter. This is caused by undercutting of the soil by the jet of grout exiting the drill bit. Comparison of the exhumed HBSNs and SBSNs suggests that the grout body of the HBSN is larger and rougher than that of the SBSN installed in the same formation. Also, in granular soils, exhumed HBSNs show an exterior zone of grout-permeated soil adhered to the bond zone, which further contributes to the capacity of the soil nail.

CHAPTER 6 – CONCLUSIONS ______________________________________________________________________
44
The Method B installation procedure (Hollow Bar Installed with Debonding Sheath and Water Flushing) provided efficient debonding of the soil nail along the intended unbonded length. However, this method requires equipment to install and remove the casing within the free length, which is not typically used for HBSN installation. In addition, if this method is used for production soil nails to be proof-tested, it would not be possible to provide a suitable grout cover along the unbonded length after testing. Therefore, this method would not be suitable for permanent soil nails used for proof testing. Method D (Hollow Bar with Bondbreaker Installed by Re-drilling a Pre-grouted Hole) also provided efficient debonding of the soil nail along its intended unbonded length. However, the effectiveness of this method in debonding the soil nail may vary depending on the soils at the site, and the experience of the driller. Therefore, it is advisable to request that the contractor provide proof that the test loads are not being transferred to the free length of the soil nail. This can be accomplished using strain gauges near the top and bottom of the unbonded length. Method, D can possibly be used for proof testing of production soil nails in long-term support applications. If the hole is stable after re-drilling, it may be possible to re-grout the unbonded zone after testing. In HBSNs installed using Method C, significant debonding was achieved along the intended unbonded length. However, the efficiency of debonding was less than that achieved using Methods B and D. In addition, a significant Doughnut Effect was inferred from the test data from soil nails installed following Method C. The annular grout around the debonded zone of the nail may transfer significant loads from the bond zone below up along the unbonded length, thus biasing the test results and providing inaccurate, unconservative values of average bond strength. Consequently, Method C is not recommended unless the tendon of the soil nail is fitted with a suitable number of strain gauges that allow determination of the bond stresses mobilized along the bond zone. In most cases, a minimum of four strain gauges would be necessary: two along the unbonded length, and two along the bonded length. It is also likely that the tendon of the soil nail needs to be oversized to allow sufficient load to mobilize the design ultimate bond stress along the bond zone. The Doughnut Effect was not observed in Method C HBSNs installed at the Olympia Site, possibly because the annulus around the unbonded length was partially flushed. Flushing of Method C nails is not recommended as a standard test procedure. The tests at the Olympia Site showed that it is possible to install a suitable number of strain gauges within hollow core bars for measurement of axial strain with depth. A suitable number and location of strain gauges may aid in the correct determination of bond strength values in Method C soil nails, and should be a requirement in any test nail where there is uncertainty about the efficiency of the debonding procedure used, or on the existence or not of a significant Doughnut Effect. Interpretation of strain gauge data must consider the stiffness of the grout in tension when relatively small loads are applied to the soil nail.

CHAPTER 6 – CONCLUSIONS ______________________________________________________________________
45
In many soils, it is clear that there is a benefit to anchor design developed by the HBSN installation processes. The evaluation of testing methods is not complete at this time, and further data collection is warranted to finalize a testing protocol and establish preliminary design bond values or diameter magnification factors.


REFERENCES ______________________________________________________________________
47
REFERENCES
1. Applied Geotechnical Engineering Consultants, Inc. (AGEC) (2008). “Boring Logs City Creek Center Block 75,” Project No. 1071517, Salt Lake City, Utah.
2. American Society for Testing Materials (ASTM) (2002). “Standard Test Method for
Compressive Strength of Hydraulic Cement Mortars (using 2-inch or 50-millimeter cube specimens),” Annual Book of ASTM Standards, C109/C109M-02.
3. American Society for Testing Materials (ASTM) (2002). “Standard Practice for
Classification of Soils for Engineering Purposes (Unified Soil Classification System),” Annual Book of ASTM Standards, D2487-06.
4. Buckhorn Geotech (2008). “ADSC/FHWA Hollow Bar Soil Nail Test Programme
Surficial Geology of 'Hogback' County Gravel Pit Sunset Mesa, Montrose County, Colorado,” Report 08-364-GEO, Montrose, Colorado.
5. Con-Tech Systems, Ltd. (2005).
http://www.contechsystems.com/Products/Prod_IBOTD.html. Technical Data for IBO-Titan Bars.
6. FHWA (2003). Soil Nail Walls, Geotechnical Engineering Circular No. 7, Report
Number FHWA0-IF-03-017. (Authors: Lazarte, C.A. et al.)
7. FHWA (2006) Hollow-Core Soil Nails – State-of-Practice. Publication Number, Unassigned. (Authors: Samtani, N.C., Nowatzki, E.A.)
8. FHWA (1994). Soil Nailing Field Inspectors Manual-Soil Nail, Report No. FHWA-SA-
93-068. (Authors: Porterfield, J.A., Cotton, D.M., Byrne, R.J.)
9. FHWA (2005). Micropile Design and Construction (Reference Manual for NHI Course 132078). Report No. FHWA-NHI-05-039. (Authors: Sabatini, P.J. et al.)
10. GeoEngineers (2007). “Geotechnical Information DIS Wheeler Site,” Report 10389-008-
00, Olympia, Washington.
11. Gómez, J.E., Filz, G.M. and Ebeling, R.M. (2000), “Development of an Improved Numerical Model for Concrete-to-Soil Interfaces in Soil-Structure Interaction Analyses, Report 2,” Technical Report ITL-99-1, U.S. Army Engineer Research and Development Center, Vicksburg, MA, August 2000.
12. Gómez, J.E., Filz, G.M., Ebeling, R.M. (2003), “Extended Hyperbolic Model for Sand-
to-Concrete Interfaces,” ASCE Journal of Geotechnical and Geoenvironmental Engineering, Vol. 129, No. 11, November 1, 2003.

REFERENCES ______________________________________________________________________
48
13. Gómez, J.E., Filz, G.M., Ebeling, R.M., Dove, J.E. (2008), ”Sand-to-Concrete Interface Response to Complex Load Paths in a Large Displacement Shear Box,” ASTM Geotechnical Testing Journal, Volume 31, Issue 4, July 2008.
14. Littlejohn, G.S., Bruce, D.A. (1977), Rock anchors state of the art. Foundation
Publication LTD.
15. Schnabel Engineering (2008). “Geotechnical Information Boring B-1 and Subsequent Laboratory Tests,” Report 08150002, Bohemia, New York.

APPENDICES 1-4 ______________________________________________________________________
APPENDIX 1 – BLOCK 76 SITE DATA (86 PAGES)
APPENDIX 2 – POSILLICO SITE DATA (94 PAGES)
APPENDIX 3 – SUNSET MESA SITE DATA (102 PAGES)
APPENDIX 4 – OLYMPIA SITE DATA (85 PAGES)
(Appendices are located on the attached CD ROM)