Embed Size (px)
Citation preview

International Journal of Techno-Management Research, Vol. 01, Issue 02, September 2013 ISSN: 2321-3744
1 IJTMR www.ijtmr.com
Customers’ Perception towards the Fast Moving Consumer Goods in Rural Market:
An Analysis
Dr. Surinder Singh Kundu
Assistant Prof. & Incharge, Department Of Commerce, Chaudhary Devi Lal University, Sirsa
Abstract
A consumer sets a frame of references in his/her mind to choose or purchase a product or service of
same or different brands or producers. Keeping in view the frame of references the present paper is an
attempt to study the factors affecting the purchase decision of consumers towards purchase of the Fast
Moving Consumer Goods (FMCGs) and to recommend the policies which may be adopted by the
advertisers to enhance awareness among the rural buyers. The study used primary data collected from a
sample of 1000 rural consumers from the 40 villages of 04 districts of Haryana state with the help of a
well-structured questionnaire by following „Foot-in-Door Strategy‟ (FIDS). And found that rural buyers
perceived that TV commercials followed by print advertisements and word of mouth plays a significant
role for taking the decision to purchase these FMCGs. Further, they consider their own experience,
display at shops; incentive schemes for the purchase of these FMCGs, whereas they do not fully agree
that advice of beautician influences their decision towards the purchase of these FMCGs. On the other
hand, rural buyers perceived that social factors are no so strong that those may influence their decision
to purchase these FMCGs. Hence, it may be recommended that the producers or marketers should frame
ethical advertising strategies keeping in mind that rural people are fond of electronic and print media
advertisements.
Key Words: Frame of References, Foot-in-Door Strategy, FMCGs.
Introduction
As we know, consumers have different frame of references formed out of the information gathered from
their experience. They try to fit the goods and services in these frames of references. If they do not fit
they reject the things. Many of these reference points are subconscious because they are deeply imbedded
in the subconscious mind. It is important to have knowledge of assumptions and beliefs held by
consumers. Some consumers may use price as an index of quality. They may declare a product or service
as cheap if it sells at a price substantially below the level at which competitive brands are selling.
Consumers make a number of assumptions regarding products, services and producers often without fact,
e.g. the beer in pastel colour bottles is thought to be lighter and beer in the coloured bottles is considered
stronger. Similarly, natural fabrics e.g. wool are considered better that synthetic; and the products
International Journal of Techno-Management Research, Vol. 01, Issue 02, September 2013 ISSN: 2321-3744
2 IJTMR www.ijtmr.com
produced in one country are considered superior than produced in other country. Attributes and beliefs
are closely related to attitude but harder to change than attitudes. Many times, they are obtained from
previous generations and are implanted in an early age of person. People above certain group affiliations
and their assumptions and beliefs are drawn from affiliations as in the case of a social class (Sumathi, et
al., 2003).
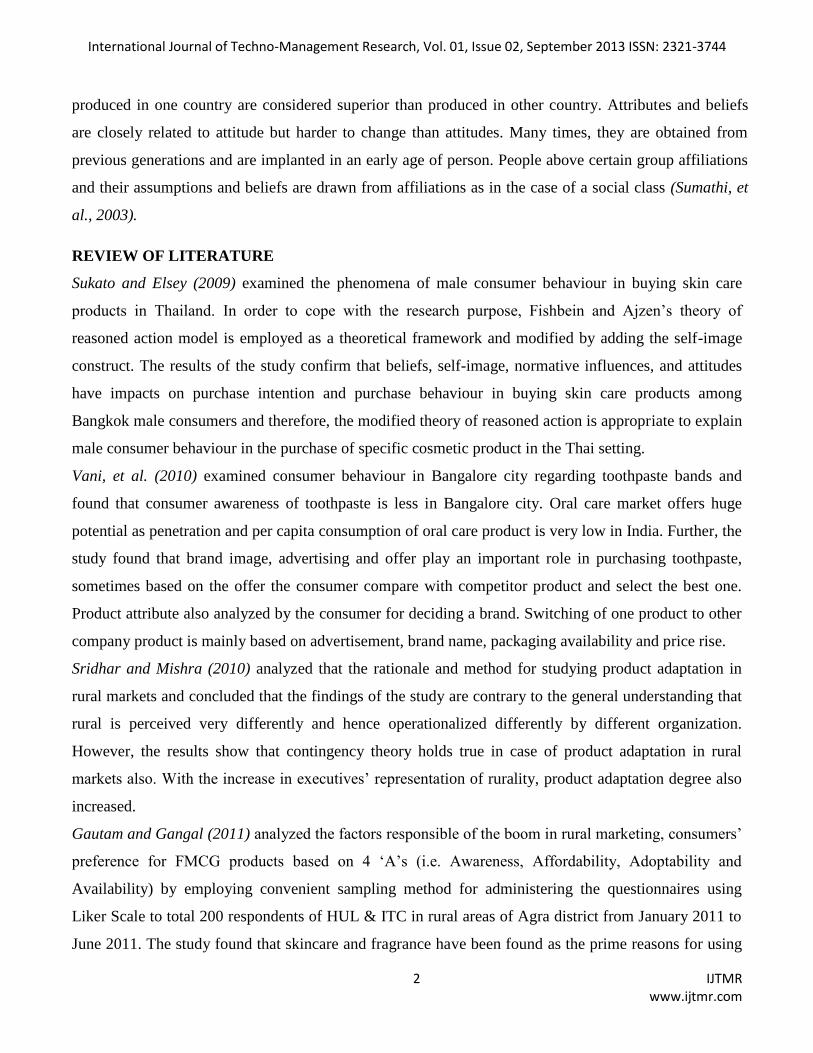
REVIEW OF LITERATURE
Sukato and Elsey (2009) examined the phenomena of male consumer behaviour in buying skin care
products in Thailand. In order to cope with the research purpose, Fishbein and Ajzen‟s theory of
reasoned action model is employed as a theoretical framework and modified by adding the self-image
construct. The results of the study confirm that beliefs, self-image, normative influences, and attitudes
have impacts on purchase intention and purchase behaviour in buying skin care products among
Bangkok male consumers and therefore, the modified theory of reasoned action is appropriate to explain
male consumer behaviour in the purchase of specific cosmetic product in the Thai setting.
Vani, et al. (2010) examined consumer behaviour in Bangalore city regarding toothpaste bands and
found that consumer awareness of toothpaste is less in Bangalore city. Oral care market offers huge
potential as penetration and per capita consumption of oral care product is very low in India. Further, the
study found that brand image, advertising and offer play an important role in purchasing toothpaste,
sometimes based on the offer the consumer compare with competitor product and select the best one.
Product attribute also analyzed by the consumer for deciding a brand. Switching of one product to other
company product is mainly based on advertisement, brand name, packaging availability and price rise.
Sridhar and Mishra (2010) analyzed that the rationale and method for studying product adaptation in
rural markets and concluded that the findings of the study are contrary to the general understanding that
rural is perceived very differently and hence operationalized differently by different organization.
However, the results show that contingency theory holds true in case of product adaptation in rural
markets also. With the increase in executives‟ representation of rurality, product adaptation degree also
increased.
Gautam and Gangal (2011) analyzed the factors responsible of the boom in rural marketing, consumers‟
preference for FMCG products based on 4 „A‟s (i.e. Awareness, Affordability, Adoptability and
Availability) by employing convenient sampling method for administering the questionnaires using
Liker Scale to total 200 respondents of HUL & ITC in rural areas of Agra district from January 2011 to
June 2011. The study found that skincare and fragrance have been found as the prime reasons for using

International Journal of Techno-Management Research, Vol. 01, Issue 02, September 2013 ISSN: 2321-3744
3 IJTMR www.ijtmr.com
bathing soaps (personal wash) and consumers buy detergent due to its primary function for cleanliness
and few purchase it for its fragrance. The cleanliness followed by freshness has been the primary
motives to purchase toothpaste (oral care) and some consumers also purchase it for protection of gums
and whiteness value. The consumers purchase hair oil for hair care and good looks. The study also found
that the factors influencing the purchase decision of the respondents, consumers buying are influence the
most by the product factor due to design, quality, durability, made from safe environment and product
range but few respondents are not satisfied with the packaging, image and size of the product. Both the
companies are almost on the same platform regarding the factors of competitive price, shape, design,
Haats and mandis and message/languages/ presentation of advertisement. The consumers are showing
their dissatisfaction for malls and super markets, greater mobility, shop is conveniently situated, and
product display is attractive, value for price paid, cash discount and pricing policy. Lastly, the study
concluded that in parameters like, image, shape and size, packaging, durability, small size products, low
priced sample packets, price scheme, celebrity endorsement and use of transport like autos, camel carts,
HUL has an edge over ITC.
Vernekar and Wadhwa (2011) examined the consumer attitudes and perceptions towards eco-friendly
products in FMCG sector and their willingness to pay on green products. The study revealed that the
green products have substantial awareness among urban Indian customers and they are willing to pay
something more on green products. The majority of customers considered that package is most
important element of such products.
Chandrasekhar (2012) analyzed the consumer buying behaviour and brand loyalty in rural markets
regarding fast moving consumer goods and found that brand loyalty is more in Badangpet and Nadergul
region and less in Chintulla in soaps category. In hair oil category, branded products usage is more in
Badangpet and Nadergul villages and consumer prefer to purchase local brands in Chintulla village. It is
also found that Vatika and Navratan hair oils dominate in Badangpet, Parachute hair oil in Nadergul and
Gograda local brand and Dabur in Chintulla. In case of Biscuits category, consumers mostly buy in
loose, which are available in nearby shops like Salt biscuits, Osmania biscuits etc. Parle-G and Tiger are
mostly used brands in Badangpet. Tea is purchased in loose, which is available in local shops. The
popular brands Red Label, Three Roses and Gemini are used in Badangpet village. Further, the study
found that coffee consumption is very less or no consumption in Nadergul and Chintulla villages. In
case of washing powder, Nirma dominate all the three selected sample rural markets regions. In remote
area like Chintulla, Nirma sell Rs. 1 sachets. In washing soap category, Rin, 501, Nirma, XXX and Extra

International Journal of Techno-Management Research, Vol. 01, Issue 02, September 2013 ISSN: 2321-3744
4 IJTMR www.ijtmr.com
Local Brand dominates all the three selected rural markets. It is also concluded that Ponds, Chintol and
Santoor face powder dominated the market and Pond‟s has dominated the market in consumption in
Badangpet. In sum, the study also found that male members of the family are alone going to buy
consumer products and women are not interested in shopping and do not come out from their houses
frequently.
Jain and Sharma (2012) analyzed the brand awareness and customer preferences for FMCG products
in rural market of Garhwal region. The study found that average awareness of the respondents in the
rural market is approximately 75 per cent, 70 per cent, 72 per cent, 64 per cent and 73 per cent in case of
shampoo, washing powder, soap, tea, toothpaste respectively, which infers that people in the rural
market have on an average awareness about most of the products. In the shampoo category, the study
found that the respondents give 1st rank to Pantene and last rank to Chik; in case of washing powder, 1
st
rank to Surf Excel and last rank to Nirma; to soap category, 1st rank to Dettol and last rank to Rexona; in
case of Tea, 1st rank to Tata tea and last rank to Maharani tea and in category of toothpaste, 1
st rank to
Colgate and last rank to Cibaca which infers that advertising and marketing activities have major
influences in choices of people in rural market. The study further found that among various factors like
quality, price, easy availability, family liking, advertisement, variety, credit attributes of brand
preference; the quality is the first preference in case of brand choices and rural people give least
preference to variety and credit attributes. It is also concluded that there is a positive impact of media on
brand preference of FMCG products among consumers.
Jayswal and Shah (2012) analyzed the effect of some selected FMCG product‟s television
advertisements with commonly used negative emotional appeals on cognitive message processing style
of Indian house wives. The study revealing different effect of different advertisement with negative
emotional appeals derived that advertising creative aspect has considered most important and it has been
truly said that “what you say is equally important to how you say.” Through varied hypothesis
developed by the researcher, the findings is negative emotional advertising appeal makes the cognitive
response positive, helps to form positive attitude and this increases the customer intention to buy the
brand. The different advertising themes have difference in their effect on individual perception.
Prajapati and Thakor (2012) examined the competitive and innovative promotional tools used by
toothpaste companies in rural market and its impact on consumer buying behaviour in Gujarat. The
study found that rural consumers are more concerned about the quality, brand name of the oral care
products purchased by them. Further, it was also found that once the rural consumers found that certain

International Journal of Techno-Management Research, Vol. 01, Issue 02, September 2013 ISSN: 2321-3744
5 IJTMR www.ijtmr.com
brands are suitable to them, they do not change it easily due to influence of friends or social groups and
lack of availability of their usual brands. In toothpaste category, Colgate and Close-up are the most
favorite brands. Price, promotional schemes, color and availability of the product are more influencing
factor when they buy the toothpaste. Rural consumers are generally following the instructions of the
retailers for buying the toothpaste and also consider the promotional scheme when buy the toothpaste
and the prices off schemes are the most influencing scheme to them. When there are special discount
and dentist suggest them to purchase the toothpaste they definitely purchase it.
Ranu and Rishu (2012) analyzed the scope of Ingredient branding in creating sustainable differentiation
advantage for FMCG companies. The results of the study revealed that careful planning must be done
before entering into a relationship in order to maximize the benefits of any ingredient branding strategy.
Along with the costs involved in forming and maintaining the alliance, and the opportunity cost involved
for the partnering firm, the consumer‟s quality sensitivity and their ability to evaluate quality must also
be considered. Firms considering an ingredient branding strategy must also evaluate the customer‟s
perception toward each brand prior to the alliance. The perceived fit of the products as well as the
brands must be understood, and the level of customer familiarity with each brand must be gauged. This
will help marketers in developing a successful Ingredient branding strategy, which builds on the
strengths of the partnering brands and generates additional value for the consumer.
Mishra, et al. (2012) examined the major dimensions of consumers‟ perception about the benefits they
derive from different types of sales promotion schemes in durable goods and to build a framework
showing the valid relationships among all types of multiple consumer benefits of sales promotion in
consumer durables. This exploratory study is mainly based on field survey carried out in India. The
findings indicate that consumers perceive factors like savings, higher product quality, shopping
convenience categorized as utilitarian benefits and value expression, entertainment, exploration
categorized as hedonic benefits as primary reasons for taking advantage of various sales promotion
schemes.
Vaishnani (2012) examined and measured brand equity perception with reference to sales promotion
schemes for selected FMCG products and it is concluded that there is no significant difference between
of brand equity perception among gender as one of the demographic variables. Apart from it, it is
concluded that there is significant difference between brand equity perceptions among various
employment status. Adding to it, it is clear that self employed consumers compare to not employed

International Journal of Techno-Management Research, Vol. 01, Issue 02, September 2013 ISSN: 2321-3744
6 IJTMR www.ijtmr.com
consumers perceive sales promotion schemes less favorably. Furthermore, it is concluded that there is no
significant difference between brand equity perception and educational qualification.
Franco, et al. (2012) analyzed and focused on use of modern portfolio theory in price promotions,
which have become a key component in the marketing mix of stimulating sales, particularly in the
FMCG environment. The hypothesis of this study is that previous limitation of modern portfolio theory
in marketing can be overcome through use of brackets of price promotion. This is proven through study
of FMCG data and it is shown that price promotions can be optimized to improve return without
increased risk.
After, reviewing the existing literature it is observed that the above studies have considered different
factors a lot. However, these studies not focussed upon the purchase decision behaviour of rural areas.
Consequently, the present study entitled “Customer’ Perception towards the Fast Moving Consumer
Goods in Rural Market: An Analysis” may be conducted.
Methodology and Objectives
The present study is of exploratory, descriptive, pure and empirical in nature. The present research paper
attempts to identify the factors affecting the purchase decisions of customers towards the purchase of
FMCGs and to recommend the particular factors that should be considered most important for such type
of decisions. To achieve the said objectives, only twelfth question item of the questionnaire (Total 16
question items) was used. The study used primary data collected with the help of a well-structured
questionnaire by following „Foot-in-Door Strategy‟ (FIDS) (Malhotra, et al., 2010). Further, to analyze
and interpret the data frequency distribution, mean, mode, percentage for exploratory data analysis and
standard deviation (S. D.), correlation, F-test (ANOVA) and factor analysis were used for confirmatory
data analysis. In the light of the above mentioned objective the following hypothesis was that the rural
buyers do not significantly differ demographically towards factors influencing their purchasing decision
for fast moving consumer goods (H1).
Sampling Plan
The steps in the sampling design were as follows:
Target Population: Elements: Male and Female Rural Buyers; Sampling Unit: Rural Buyer; Extent:
Haryana State; and Time: May, 2011 to September, 2011.

International Journal of Techno-Management Research, Vol. 01, Issue 02, September 2013 ISSN: 2321-3744
7 IJTMR www.ijtmr.com
Sampling Frame: Map of Haryana State, Sampling Technique: Multi-Stage Sampling and Sample Size:
1,000 (04 districts x10 villages per district x 25 respondents per village). To confirm the sample size of
1,000 was adequate, calculations for sample size(n) determination by proportion were made as follows,
using the maximum possible population variation (π=0.5). The precision of D in the present study was
±0.05 for a 95 percent confidence level (z=1.96). n=π(1- π)z2/D
2 , n=(0.5)(1-0.5)(1.96)
2/(0.05)
2 =384.16
or 385 rounded to the next higher integer.
Therefore, the 1,000 sample size may be considered more than sufficient (Malhotra, et al., 2010).
In the present study, the sampling quota called for sampling rural buyers with 50:50 ratio to eliminate
distortion and due to a non-representative gender ratio (Table 1). Hence, gender was the control
dimension. In total, multi-stage sampling was used in the present study.
Data Preparation
After the data collection, the data was prepared for the further analysis (Kundu, et al., 2013). A data file
namely "UGC_F. No. 5-270(1)2009 (HRP)_MRP_Datawarehouse" was prepared which was viewed as
an n×m matrix of number and values, where n is the number of respondents or records and m is the
number of variables or fields. In the present research paper, the twelfth question item‟s data from the
said data warehouse was used for analysis and interpretation.
Results and Discussion
Table 2 gives a general understanding towards 36 factors affecting the purchase decision taken by rural
buyers towards FMCGs under study. The response on these factors were collected from rural buyers on
5-point Likert scale from 5 for strongly agree, 4 for agree, 3 for neither agree nor disagree, 2 for disagree
to 1 for strongly disagree continuum. The mean values of most of the variables are more than 3, which
gives the inference that rural buyers admit that the above said factors certainly affect their decision
regarding the purchase of all fast moving consumer goods.
To test the appropriateness of factor analysis technique the correlation between the variables is checked
and Kaiser-Meyer-Olkin (KMO) measure of sampling adequacy statistic is also used for the same. The
correlation matrix is a lower triangle matrix showing the simple correlation, r, between all possible pairs
of variables included in the analysis. Being an identity matrix of population correlation matrix, all the
diagonal terms are 1, and all off-diagonal terms are 0. The test statistics for Sphercity is based on a Chi-
square transformation of the determinants of the correlation matrix. A large value of the test statistic

International Journal of Techno-Management Research, Vol. 01, Issue 02, September 2013 ISSN: 2321-3744
8 IJTMR www.ijtmr.com
favours the rejection of the null hypothesis. Further, KMO compares the magnitude of the observed
correlation coefficients to the magnitude of partial correlation coefficients. Small the value of KMO
statistic indicate that the correlation between pairs of variables cannot be explained by other variables
and the factor analysis may not be appropriate. Generally, a value greater than 0.5 is desirable for the
test statistic. Here, it can be seen from Table 3 that the null hypothesis, that the population correlation
matrix is an identity matrix, is rejected by Bartlett's Test of Sphericity. The approximate Chi-square
statistic value is 22612.664 with 630 degree of freedom, which is significant at 0.05 level. The value of
KMO statistic (.774) is also large (>0.5). Thus, factor analysis may be considered as appropriate
techniques for analyzing the correlation matrix. The matrix constructed from the data obtained in form
of the responses of rural buyers‟ overall opinion about the factors influence their decision to purchase
various FMCGs.
Once, it has been determined that factor analysis is suitable for analyzing the data, an appropriate
method must be selected. The approach used to drive the weight or factors score coefficients. The two
basic approaches are principal component analysis (PCA) and Common factor analysis (CFA). In PCA,
the total variance in data is considered. The diagonal of the correlation matrix consists of unities and full
variance is brought into the factor analysis. PCA is recommended when the primary concern is to
determine the minimum number of factors that will account for maximum variance in the data for use in
subsequent multivariate analysis. Further, PCA may be carried out if the correlation for the variables
contains at least two correlations of 0.30 or greater. The correlation matrix of 36 variables which were
developed to know the overall opinion of rural buyers towards factors influence their decision to
purchase FMCGs under study and it is found there are high correlations between the variables; therefore,
it may be stated that factor analysis is appropriate. Further, it is found that 17 variables have the
correlations above 0.30. Therefore, PCA method is used for extraction of variable for the component or
factor concerned.
The extraction communalities for each variable which is the amount of variance a variable shares with
all the other variables being considered. It is also the proportion of variance explained by the common
factors.
In the Table 4, five factors have been extracted on the basis of prior knowledge to describe the
relationships among variable in a best way. Further, the scree plot associated with this analysis is given
in Exhibit 1. From the scree plot, a distinct break occurs at five factors. Finally, from the cumulative
percentage of variance accounted for, it can be seen that five account for 50.835 per cent of the variance,

International Journal of Techno-Management Research, Vol. 01, Issue 02, September 2013 ISSN: 2321-3744
9 IJTMR www.ijtmr.com
contributed by first component is 17.480 followed by second (9.914 per cent), third (8.257 per cent),
fourth (7.740 per cent) and fifth (7.444 per cent) of total variance.
The rotation was made by the most commonly used method i. e. varimax procedure. This is an
orthogonal method of rotation that minimizes the number of variables with high loadings on a factor,
thereby enhancing the interpretability of the factors. Interpretation is facilitated by identifying the
variables that have large loadings on the same factor. That factor can be interpreted in terms of the
variables that load high on it. For the purpose of interpretation, each factor was composed of variables
that loaded 0.30 or higher on that factor. In case, where variables loaded 0.30 or above on two factors,
each variable was assigned to the factor where it had the highest loading. The maximum of each row
(ignoring the sign) indicates the respective variable belongs to the respective component (Table 5).
After interpretation of the factors, Table 6 enlists the rating of factors on the basis of their importance
and also depicts the results through ANOVA. It depicts that factor 3 is at the top by which rural buyers
perceived that TV commercials ( =4.20) followed by print advertisements ( =4.18) and word of mouth
( =.95) plays a significant role for taking the decision to purchase these FMCGs. Further, they consider
their own experience, display at shop, incentive schemes for the purchase of these FMCGs. Whereas,
they do not fully agree that advice of beautician influence their decision towards the purchase of these
FMCGs ( ==3.07). On the other hand, rural buyers perceived that social factors are no so strong that
those may influence their decision to purchase these FMCGs (factor 5, =3.084).
As far as F-statistics (ANOVA) is concerned, Table 6 shows that rural buyers significantly differ
education, gender, income and occupation-wise towards cultural and psychological factors; age,
education marital, income, occupation and district-wise towards social factors and marital status wise
they differ towards demographic factors which may influence their purchasing decision of fast moving
consumer goods at 0.01 significance level with respective degrees of freedom of demographic
characteristics of the rural buyers by rejecting null hypothesis.
Concluding Remarks
In total, it is found that rural buyers perceived that TV commercials followed by print advertisements
and word of mouth plays a significant role for taking the decision to purchase these FMCGs. Further,
they consider their own experience, display at shops; incentive schemes for the purchase of these
FMCGs, whereas they do not fully agree that advice of beautician influences their decision towards the
purchase of these FMCGs. On the other hand, rural buyers perceived that social factors are no so strong

International Journal of Techno-Management Research, Vol. 01, Issue 02, September 2013 ISSN: 2321-3744
10 IJTMR www.ijtmr.com
that those may influence their decision to purchase these FMCGs. Therefore, it may be recommended
that the producers or marketers should frame ethical advertising strategies keeping in mind that rural
people are fond of electronic and print media advertisements.
References
1. Chandrasekhar, B. V. N. G. (2012), “Consumer buying behaviour and brand loyalty in rural
markets: FMCG”, IOSR Journal of Business and Management, Vol. 3, Issue 2, pp. 50-67.
2. Franco-Laverde, J., Littlewood, A., Ellis, C., Schraner, I., and Varua, M-E, (2012), “FMCG
portfolio budget allocation to price promotions using modern portfolio theory”, International
Review of Business Research Papers, Vol. 8, No. 5, pp. 16-30.
3. Gautam, N., and Gangal, V. K. (2011), “Consumers‟ preference for FMCG products in rural
India: a comparative study of HUL & ITC”, APOTHEOSIS: Tirpude‟s National Journal of
Business Research, Vol. 2, Issue 1, pp. 115-123.
4. Jain, A., and Sharma, M. (2012), “Brand awareness and customer preferences for FMCG
products in rural market: an empirical study on the rural market of Garhwal region”, VSRD
International Journal of Business & Management Research, Vol. 2, No. 8, pp. 434-443.
5. Jayswal, M., and Shah, K. (2012), “A study of effect of negative emotional appeals on cognitive
message processing style of Indian house wives with specific focus on FMCG product‟s
television advertisements”, Asian Journal of Research in Business Economics and Management,
Vol. 2, Issue 3, pp. 58-72.
6. Kundu, Surinder Singh and Kumar, Vinod (2013). Modes of Advertisements Used by Rural
Populace: An Empirical Study, In Kundu, Subash C., Punia, Bijender K., Shabnam Saxena,
Suresh K. Mittal and Anjali Gupta (Eds.), Researches in Business and Management–Academic
and Professional Perspective, Delhi: Wisdom Publications, p. 404.
7. Malhotra, Naresh K. and Dash, Satyabhusan. Marketing Research-An Applied Orientation. 6th
ed. (New Delhi: Pearson Education, Inc. 2010), pp. 591-601.
8. Mishra, U. S., Das, J. R., Mishra, B. B. and Mishra, P. (2012), “Perceived benefit analysis of
sales promotion: a case of consumer durables”, International Research Journal of Finance and
Economics, Issue 98, pp. 145-154.
9. Prajapati, S. and Thakor, M. (2012), “Competitive and innovative promotional tools used by
toothpaste companies for rural market and its impact on consumer buying behavior in Gujarat”,
International Referred Research Journal, Vol. 3, Issue 3(2), pp. 82-86.
10. Ranu, G., and Rishu, R. (2012), “Ingredient branding: a differentiation strategy for FMCG
companies”, Asian Journal of Management Research, Vol. 2, Issue 2, pp. 761-768.
11. Sridhar, G., and Mishra, D. (2010), “Executives social representation of rurality and product
adaptation: a case of rural markets in India”, APJML, Vol. 23, No. 3, pp. 285-303.
12. Srinivastava, T N and Rego, Sahilaja. Business Research Methodology. 1st ed., New Delhi: Tata
McGraw Hill Education Private Limited. 2011, pp. 14.66-14.86.
13. Sukato, N., and Elsey, B. (2009), “A model of male consumer behaviour in buying skin care
products in Thailand”, ABAC Journal, Vol. 29, No. 1, pp. 39-52.
14. Sumathi, S. and Saravanavel, P. (2003). Marketing Research & Consumer Behaviour. New
Delhi: Vikas Publishing House Pvt. Ltd., p. 322.
15. Vaishnani, H. B. (2012), “An empirical study of measuring brand equity perception with
reference to sales promotion schemes for selected FMCG products”, Golden Research Thoughts,
Vol. 1, Issue 7, pp. 1-4.

International Journal of Techno-Management Research, Vol. 01, Issue 02, September 2013 ISSN: 2321-3744
11 IJTMR www.ijtmr.com
16. Vani, G., Babu, M. G., and Panchanathan, N. (2010), “Toothpaste brands: a study of consumer
behaviour in Bangalore city”, Journal of Economics and Behavioral Studies, Vol. 1, No. 1, pp.
27-39.
17. Vernekar, S. S., and Wadhwa, P. (2011), “An empirical study of consumers attitudes and
perception regarding eco-friendly FMCG products, with special reference to Delhi and NCR
region”, Opinion, Vol. 1, No. 1, pp. 64-74.

International Journal of Techno-Management Research, Vol. 01, Issue 02, September 2013 ISSN: 2321-3744
12 IJTMR www.ijtmr.com
Exhibit 1: Scree Plot.
Source: Primary (Data processed through PASW 18.0).
Table 1: Demographic Profile of Rural Buyers
Demographic Basis
Gender Total
Male Female
Age (Years) 10-20 117 132 249
20-30 126 125 251
30-40 98 98 196
40-50 99 93 192
50 and Above 60 52 112
Total 500 500 1000
Edu
cati
on
Illiterate 16 54 70
Below Matric 68 146 214
Matric 184 161 345
10+2 107 65 172
Graduate 75 49 124
Post-Graduate 28 15 43
Any Other 22 10 32
Total 500 500 1000
Marital Status Bachelor 199 182 381
Married 301 318 619
Total 500 500 1000
Income (Rs.) Less Than 5,000 22 10 32
5,000-10,000 35 37 72
10,000-15,000 90 83 173
15,000-20,000 160 189 349
20,000-25,000 110 120 230
More Than 25,000 83 61 144
Total 500 500 1000
Occ
up
atio
n
Student 174 175 349
Housewife 3 277 280
Businessman 54 2 56
Employee (Private Sector) 67 15 82
Employee (Public Sector) 100 26 126
Farmer/Labourer 82 1 83
Any Other 20 4 24
Total 500 500 1000
Source: Primary (Data processed through PASW 18.0).

International Journal of Techno-Management Research, Vol. 01, Issue 02, September 2013 ISSN: 2321-3744
13 IJTMR www.ijtmr.com
Table 2: Descriptive Statistics for Factor influencing the purchase decision of rural buyers towards FMCGs
Sr. No. Factor Mean Std. Deviation
N
1 Print advertisements 4.18 .927 1000
2 T.V. commercials 4.20 .872 1000
3 Word of mouth 3.95 .966 1000
4 Salespeople 3.72 1.097 1000
5 Incentive schemes 3.46 1.183 1000
6 Own experience 3.36 1.181 1000
7 Advice of beautician 3.07 1.135 1000
8 Display at shop 3.27 1.138 1000
9 Occasion 3.11 1.183 1000
10 Reference Group 2.98 1.207 1000
11 Trial 3.01 1.224 1000
12 Availability of the product 3.08 1.194 1000
13 Non-availability of the expected brand 3.00 1.222 1000
14 Income 3.19 1.186 1000
15 Family 3.28 1.213 1000
16 Locality 3.33 1.198 1000
17 Age 3.35 1.232 1000
18 Social class/status 3.29 1.185 1000
19 Culture 3.25 1.209 1000
20 Climate/Environment 3.19 1.196 1000
21 Advice of Doctor 3.14 1.215 1000
22 Price of the Product 3.21 1.181 1000
23 Packaging of the product 3.20 1.196 1000
24 Labelling of the product 3.20 1.219 1000
25 Quality of the product 3.25 1.224 1000
26 Taste Change 3.16 1.202 1000
27 Defective Products 3.11 1.265 1000
28 Out dated 3.09 1.267 1000
29 New Ingredient 3.11 1.221 1000
30 Brand Loyalty 3.18 1.182 1000
31 Life of the product 3.20 1.211 1000
32 To follow the Celebrity 3.16 1.217 1000
33 Personality and Lifestyle 3.28 1.198 1000
34 Attitude and behaviour 3.29 1.187 1000
35 Need and Motives 3.24 1.203 1000
36 Quantity of the product 3.25 1.224 1000
Source: Primary (Data processed through PASW 18.0).
Table 3: KMO and Bartlett's Test
Kaiser-Meyer-Olkin Measure of Sampling Adequacy. .774
Bartlett's Test of Sphericity Approx. Chi-Square 22612.664
Df 630
Sig. .000
Source: Primary (Data processed through PASW 18.0).

International Journal of Techno-Management Research, Vol. 01, Issue 02, September 2013 ISSN: 2321-3744
14 IJTMR www.ijtmr.com
Table 4: Total Variance Explained
Component Initial Eigenvalues Extraction Sums of Squared Loadings Rotation Sums of Squared Loadings
Total % of Variance Cumulative % Total % of Variance Cumulative % Total % of Variance Cumulative %
1 6.293 17.480 17.480 6.293 17.480 17.480 4.453 12.368 12.368
2 3.569 9.914 27.395 3.569 9.914 27.395 4.094 11.371 23.739
3 2.972 8.257 35.651 2.972 8.257 35.651 3.652 10.145 33.885
4 2.786 7.740 43.391 2.786 7.740 43.391 3.120 8.666 42.550
5 2.680 7.444 50.835 2.680 7.444 50.835 2.982 8.284 50.835
Extraction Method: Principal Component Analysis. Source: Primary (Data processed through PASW 18.0).
Table 5: Factors influencing the Purchase Decision of Rural Buyers towards FMCGS
Factor Factor interpretation (% of variance explained)
Loading Variables included in the factor
F1 Cultural and Psychological Factors (17.480)
.734 34 Attitude and behaviour
.710 33 Personality and Lifestyle
.688 35 Need and Motives
.658 36 Quantity of the product
.610 32 To follow the Celebrity
.488 22 Price of the Product
.488 21 Advice of Doctor
.478 20 Climate/Environment
.447 31 Life of the product
.440 19 Culture
F2 Social Factors (9.914)
.760 28 Out dated
.716 27 Defective Products
.686 11 Trial
.659 29 New Ingredient
.607 12 Availability of the product
.596 10 Reference Group
.523 13 Non-availability of the expected brand
.513 26 Taste Change
.474 30 Brand Loyalty
.417 9 Occasion
F3 Psychographic and Promotional Factors (8.257)
.757 4 Salespeople
.737 5 Incentive schemes
.707 3 Word of mouth
.657 6 Own experience
.533 2 T.V. commercials
.487 7 Advice of beautician
.411 8 Display at shop
.311 1 Print advertisements
F4 Demographic Factors (7.740)
.793 16 Locality
.785 15 Family
.672 17 Age
.647 14 Income
.404 18 Social class/status
F5 Self-concepts (7.444) .776 24 Labelling of the product
.698 25 Quality of the product
.658 23 Packaging of the product
Source: Primary (Data processed through PASW 18.0).

International Journal of Techno-Management Research, Vol. 01, Issue 02, September 2013 ISSN: 2321-3744
15 IJTMR www.ijtmr.com
Table 6: Factors influencing the Overall Opinion of Rural Buyers towards the Advertisement of Tooth Brush Factor Mean
of Variable
Inferential Statistics
Age (df=4, 995)
Education (df=6, 993)
Gender (df=1, 998)
Marital Status (df=1, 998)
Income (df=5, 994)
Occupation (df=6, 993)
Districts (df=3, 996)
F Sig. F Sig. F Sig. F Sig. F Sig. F Sig. F Sig.
Cultural and Psychological Factors
3.221 (3) 2.147 .073 4.504 .000* .052 .820 .935 .334 4.663 .000* 4.663 .000* 2.266 .079
34 Attitude and behaviour
3.29 1.829 .121 4.018 .001* .006 .936 1.544 .214 1.367 .234 .867 .518 1.575 .194
33 Personality and Lifestyle
3.28 1.828 .121 3.629 .001* .178 .673 1.749 .186 1.938 .086 1.616 .139 3.016 .029
35 Need and Motives 3.24 1.012 .400 2.880 .009* .249 .618 2.011 .156 4.046 .001* 1.153 .330 3.065 .027
36 Quantity of the product
3.25 1.731 .141 3.509 .002* .683 .409 2.099 .148 3.348 .005* 2.021 .060 3.710 .011
32 To follow the Celebrity
3.16 1.643 .161 3.868 .001* .649 .421 .340 .560 3.013 .010 2.510 .020 6.136 .000*
22 Price of the Product 3.21 1.869 .114 2.943 .007* .413 .521 .019 .890 2.897 .013 .805 .566 1.810 .144
21 Advice of Doctor 3.14 1.453 .215 2.743 .012 .244 .621 .247 .619 4.550 .000* .691 .657 12.414 .000*
20 Climate/Environment 3.19 2.832 .024 2.747 .012 .338 .561 .130 .719 3.578 .003* 1.331 .240 2.529 .056
31 Life of the product 3.2 1.075 .368 2.139 .047 .011 .917 1.962 .162 4.886 .000* 1.237 .284 3.609 .013
19 Culture 3.25 1.488 .204 3.024 .006* 1.449 .229 .764 .382 3.957 .001* 2.289 .034 3.547 .014
Social Factors (F2) 3.084 (5) 5.166 .000* 8.668 .000* .028 .867 9.855 .002* 7.887 .000* 7.887 .000* 33.061 .000*
28 Out dated 3.09 1.488 .204 5.230 .000* .010 .921 4.665 .031 3.095 .009* 2.069 .054 19.692 .000*
27 Defective Products 3.11 2.597 .035 5.760 .000* .141 .708 5.634 .018 2.509 .029 2.576 .018 20.896 .000*
11 Trial 3.01 3.367 .010 4.488 .000* 1.805 .179 6.331 .012 5.865 .000* 4.669 .000* 18.468 .000*
29 New Ingredient 3.12 3.455 .008* 3.631 .001* .017 .897 4.159 .042 2.539 .027 1.007 .419 8.374 .000*
12 Availability of the product
3.08 3.298 .011 3.617 .001* .006 .937 4.693 .031 4.822 .000* 3.280 .003* 6.870 .000*
10 Reference Group 2.98 4.333 .002* 4.899 .000* .001 .979 6.966 .008* 4.557 .000* 5.047 .000* 12.293 .000*
13 Non-availability of the expected brand
3.00 1.971 .097 3.545 .002* 1.610 .205 1.908 .167 3.730 .002* 1.541 .162 13.794 .000*
26 Taste Change 3.16 1.621 .167 3.614 .001* 1.108 .293 5.080 .024 4.996 .000* 1.457 .190 17.302 .000*
30 Brand Loyalty 3.18 2.048 .086 4.435 .000* .232 .630 3.291 .070 3.392 .005* 1.656 .129 5.561 .001*
9 Occasion 3.11 3.551 .007* 1.999 .063 .412 .521 2.981 .085 2.368 .038 2.663 .014 5.679 .001*
Psychographic and Promotional Factors (F3)
3.650 (1) 2.085 .081 2.207 .040 .348 .555 1.108 .293 .864 .505 .864 .505 1.142 .331
4 Salespeople 3.72 .769 .546 1.153 .329 .748 .387 1.294 .256 2.427 .034 1.442 .196 .494 .687
5 Incentive schemes 3.46 1.263 .283 3.414 .002* .086 .769 .718 .397 .462 .805 .501 .808 .989 .397
3 Word of mouth 3.95 1.863 .115 2.814 .010 .274 .601 4.534 .033 .955 .445 3.172 .004* .658 .578
6 Own experience 3.36 3.105 .015 2.591 .017 .645 .422 5.431 .020 1.127 .344 2.871 .009* 3.658 .012
2 TV commercials 4.20 3.385 .009* 4.194 .000* 4.752 .029 7.000 .008* 2.252 .047 3.624 .001* 2.786 .040
7 Advice of beautician 3.07 2.335 .054 2.265 .035 .447 .504 3.288 .070 .672 .645 1.312 .249 12.510 .000*
8 Display at shop 3.27 6.034 .000* 2.199 .041 .000 1.000 9.155 .003* 3.664 .003* 3.239 .004* 2.820 .038
1 Print advertisements 4.18 2.059 .084 2.765 .011 2.573 .109 2.799 .095 1.643 .146 3.222 .004* 16.899 .000*
Demographic Factors (F4) 3.288 (2) 1.797 .127 2.014 .061 .548 .459 8.588 .003* .771 .570 .771 .570 3.217 .022
16 Locality 3.33 2.297 .057 1.077 .374 1.476 .225 8.133 .004* .599 .701 1.980 .066 2.289 .077
15 Family 3.28 2.692 .030 1.277 .265 .495 .482 10.450 .001* 2.224 .050 2.455 .023 1.347 .258
17 Age 3.35 2.348 .053 1.464 .187 1.277 .259 4.867 .028 1.964 .082 2.737 .012 4.268 .005*
14 Income 3.19 1.281 .275 1.528 .166 2.829 .093 4.088 .043 2.094 .064 2.975 .007* 3.698 .012
18 Social class/status 3.29 2.155 .072 2.395 .026 .206 .650 2.843 .092 1.602 .157 1.901 .078 2.594 .051
Self-concepts (F5) 3.217 (4) 1.434 .221 .859 .525 .001 .972 1.148 .284 1.844 .102 1.844 .102 2.956 .032
24 Labelling of the product
3.2 2.484 .042 1.490 .178 .454 .500 2.408 .121 3.081 .009* 1.164 .324 4.820 .002*
25 Quality of the product
3.25 2.337 .054 2.602 .017 .818 .366 6.531 .011 1.648 .145 2.396 .026 5.322 .001*
23 Packaging of the product
3.2 3.626 .006 4.052 .001* .308 .579 .754 .386 2.650 .022 .880 .509 4.414 .004*
Note: Value in the parenthesis shows rank, *significant at .01 level. Source: Primary (Data processed through PASW 18.0).