Embed Size (px)
Citation preview
Yearly KPIs Report for Social Media Department (2014 – 2015)
Client: Perfect Client
ANACOM MEDIA SOCIAL DEPT REPORT
2
Toolkit/Manual Requests from Website (Lead Generation) .................................... 3
Financial Advisor Toolkit ...................................................................................... 3 FA Form Submissions ....................................................................................... 3 FA Toolkit Conversion Rate ............................................................................... 4
CPA Manual ........................................................................................................... 5 CPA Form Submissions .................................................................................... 5 CPA Manual Conversion Rate ........................................................................... 6
Study Group Sign-Ups from Social Media (Lead Generation) ................................. 7 Page Views to Landing Page ................................................................................. 7 Cost Per Click ....................................................................................................... 8 Number of Clicks .................................................................................................. 8 Study Group Leads ................................................................................................ 9 Cost Per Lead ....................................................................................................... 9
Website Traffic from Social Media ......................................................................... 10 Blog / Content Strategy .......................................................................................... 12
Page View for Blog .............................................................................................. 12 Average Time on Page – Blog Posts ................................................................... 13
Alex Sonkin’s LinkedIn Profile ............................................................................... 14 Leads Via Alex’s LinkedIn Inbox ......................................................................... 14 Profile Views to Alex Sonkin’s Profile ................................................................ 15
Perfect Client Twitter ............................................................................................. 16 Twitter Leads ...................................................................................................... 16 Twitter Followers ................................................................................................ 16 Twitter Profile Visits ........................................................................................... 17 Twitter Link Clicks .............................................................................................. 17
Perfect Client YouTube ........................................................................................... 18 YouTube Views .................................................................................................... 18 YouTube Video Rank on Website ........................................................................ 19 YouTube Minutes Watched ................................................................................. 20 YouTube Subscribers .......................................................................................... 21 YouTube Average View Duration ......................................................................... 21 List of YouTube keywords ................................................................................... 22
ATPI and CPA Outreach on Social Media ............................................................... 23 CPA Impressions ................................................................................................ 23
Potential Traffic Opportunities ............................................................................... 23 Email Marketing ................................................................................................. 23
Summary of Stats ................................................................................................... 25
ANACOM MEDIA SOCIAL DEPT REPORT
3
Toolkit/Manual Requests from Website (Lead Generation)
Financial Advisor Toolkit • Currently, on the website, an FA can request a toolkit through a form on the page
www.myperfectclient.com/toolkit. To get to this page, someone has to visit myperfectclient.com/fas and click “Download Info Pack”. For every lead, your sales team is notified through email. A phone call should happen with your salesperson within a week of that person downloading the toolkit.
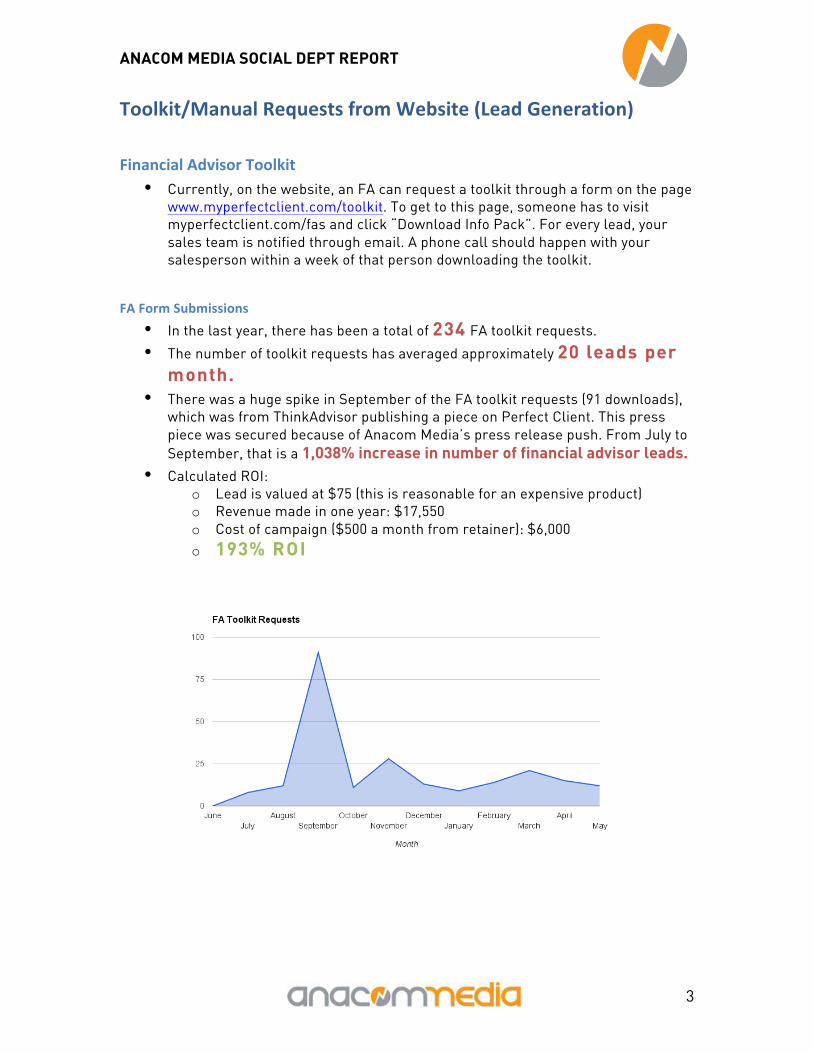
FA Form Submissions • In the last year, there has been a total of 234 FA toolkit requests.
• The number of toolkit requests has averaged approximately 20 leads per month.
• There was a huge spike in September of the FA toolkit requests (91 downloads), which was from ThinkAdvisor publishing a piece on Perfect Client. This press piece was secured because of Anacom Media’s press release push. From July to September, that is a 1,038% increase in number of financial advisor leads.
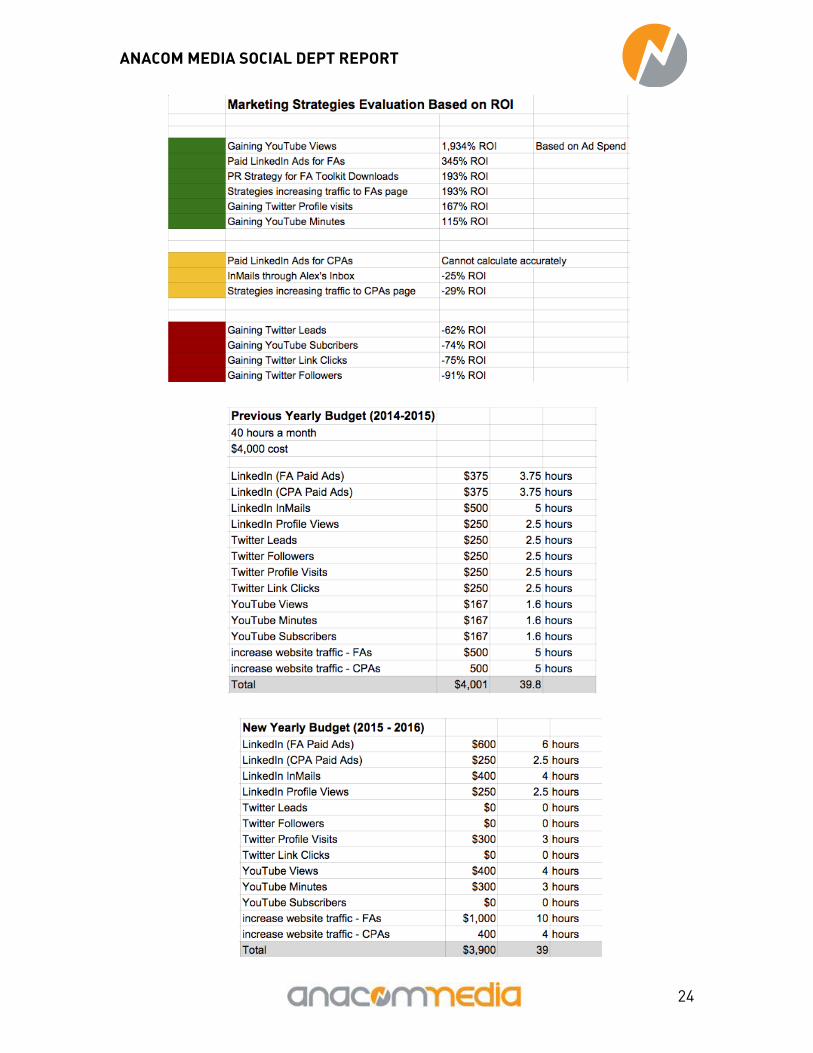
• Calculated ROI: o Lead is valued at $75 (this is reasonable for an expensive product) o Revenue made in one year: $17,550 o Cost of campaign ($500 a month from retainer): $6,000 o 193% ROI
ANACOM MEDIA SOCIAL DEPT REPORT
4
FA Toolkit Conversion Rate
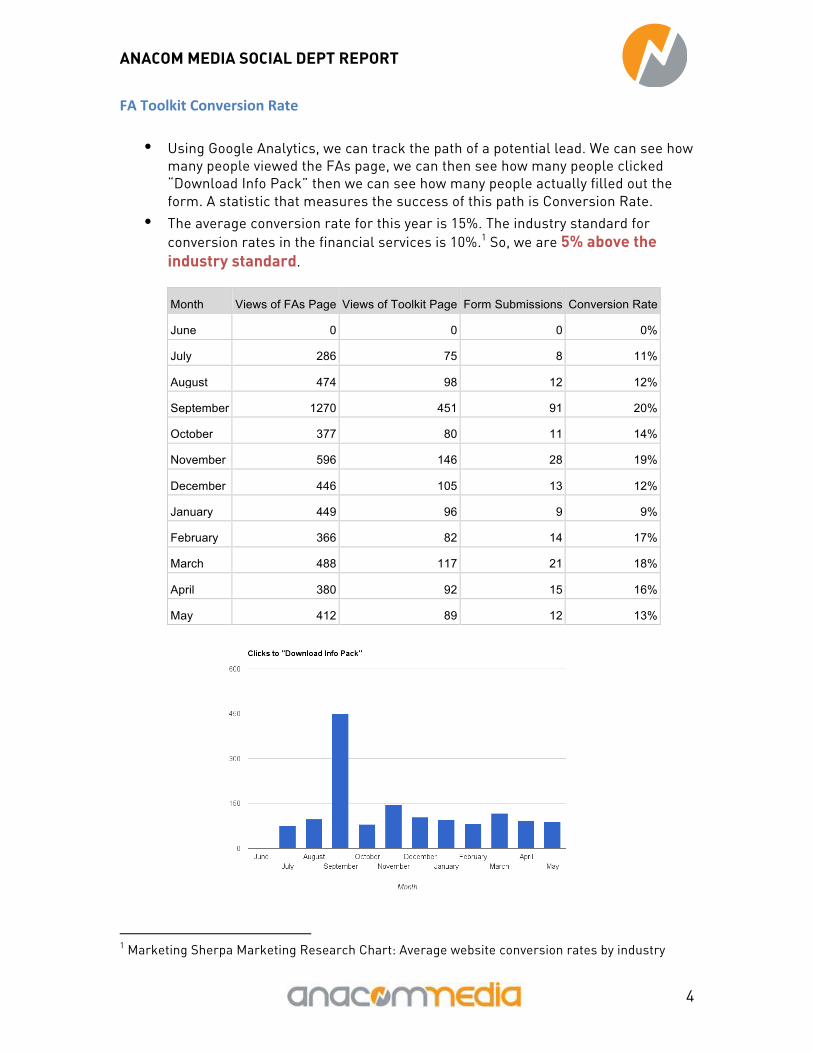
• Using Google Analytics, we can track the path of a potential lead. We can see how many people viewed the FAs page, we can then see how many people clicked “Download Info Pack” then we can see how many people actually filled out the form. A statistic that measures the success of this path is Conversion Rate.
• The average conversion rate for this year is 15%. The industry standard for conversion rates in the financial services is 10%.1 So, we are 5% above the industry standard.
1 Marketing Sherpa Marketing Research Chart: Average website conversion rates by industry
Month Views of FAs Page Views of Toolkit Page Form Submissions Conversion Rate
June 0 0 0 0%
July 286 75 8 11%
August 474 98 12 12%
September 1270 451 91 20%
October 377 80 11 14%
November 596 146 28 19%
December 446 105 13 12%
January 449 96 9 9%
February 366 82 14 17%
March 488 117 21 18%
April 380 92 15 16%
May 412 89 12 13%
ANACOM MEDIA SOCIAL DEPT REPORT
5
CPA Manual
• Currently, on the website, a CPA can request a manual through a form on the page www.myperfectclient.com/manual. To get to this page, someone has to visit myperfectclient.com/cpas and click “Download Info Pack”. For every lead, your sales team is notified through email. A phone call should happen with your salesperson within a week of that person downloading the toolkit.
CPA Form Submissions
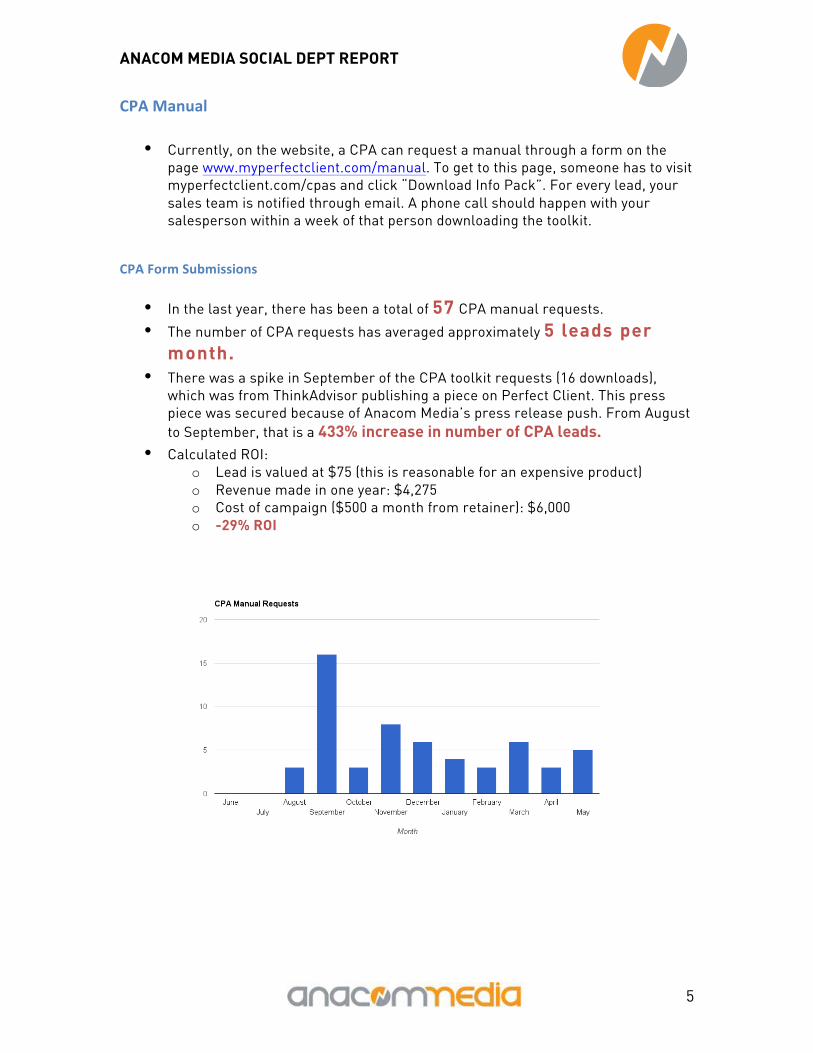
• In the last year, there has been a total of 57 CPA manual requests.
• The number of CPA requests has averaged approximately 5 leads per month.
• There was a spike in September of the CPA toolkit requests (16 downloads), which was from ThinkAdvisor publishing a piece on Perfect Client. This press piece was secured because of Anacom Media’s press release push. From August to September, that is a 433% increase in number of CPA leads.
• Calculated ROI: o Lead is valued at $75 (this is reasonable for an expensive product) o Revenue made in one year: $4,275 o Cost of campaign ($500 a month from retainer): $6,000 o -29% ROI
ANACOM MEDIA SOCIAL DEPT REPORT
6
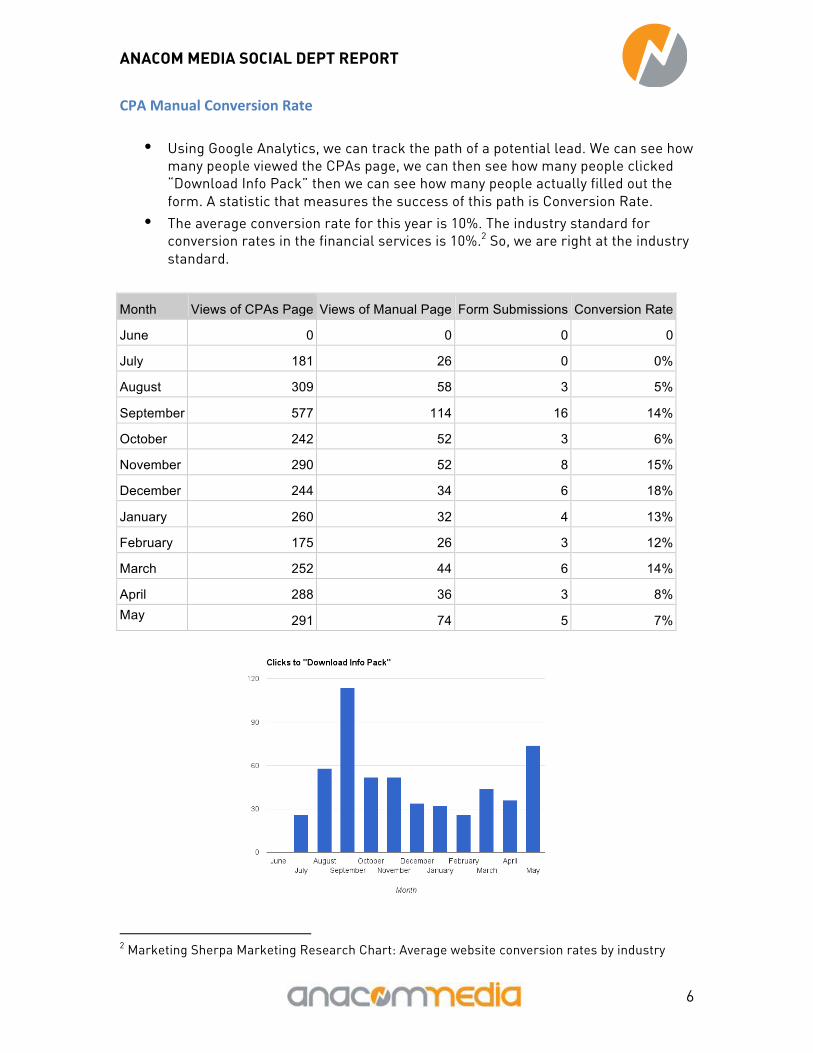
CPA Manual Conversion Rate
• Using Google Analytics, we can track the path of a potential lead. We can see how many people viewed the CPAs page, we can then see how many people clicked “Download Info Pack” then we can see how many people actually filled out the form. A statistic that measures the success of this path is Conversion Rate.
• The average conversion rate for this year is 10%. The industry standard for conversion rates in the financial services is 10%.2 So, we are right at the industry standard.
Month Views of CPAs Page Views of Manual Page Form Submissions Conversion Rate
June 0 0 0 0
July 181 26 0 0%
August 309 58 3 5%
September 577 114 16 14%
October 242 52 3 6%
November 290 52 8 15%
December 244 34 6 18%
January 260 32 4 13%
February 175 26 3 12%
March 252 44 6 14%
April 288 36 3 8% May 291 74 5 7%
2 Marketing Sherpa Marketing Research Chart: Average website conversion rates by industry
ANACOM MEDIA SOCIAL DEPT REPORT
7
Study Group Sign-‐Ups from Social Media (Lead Generation)
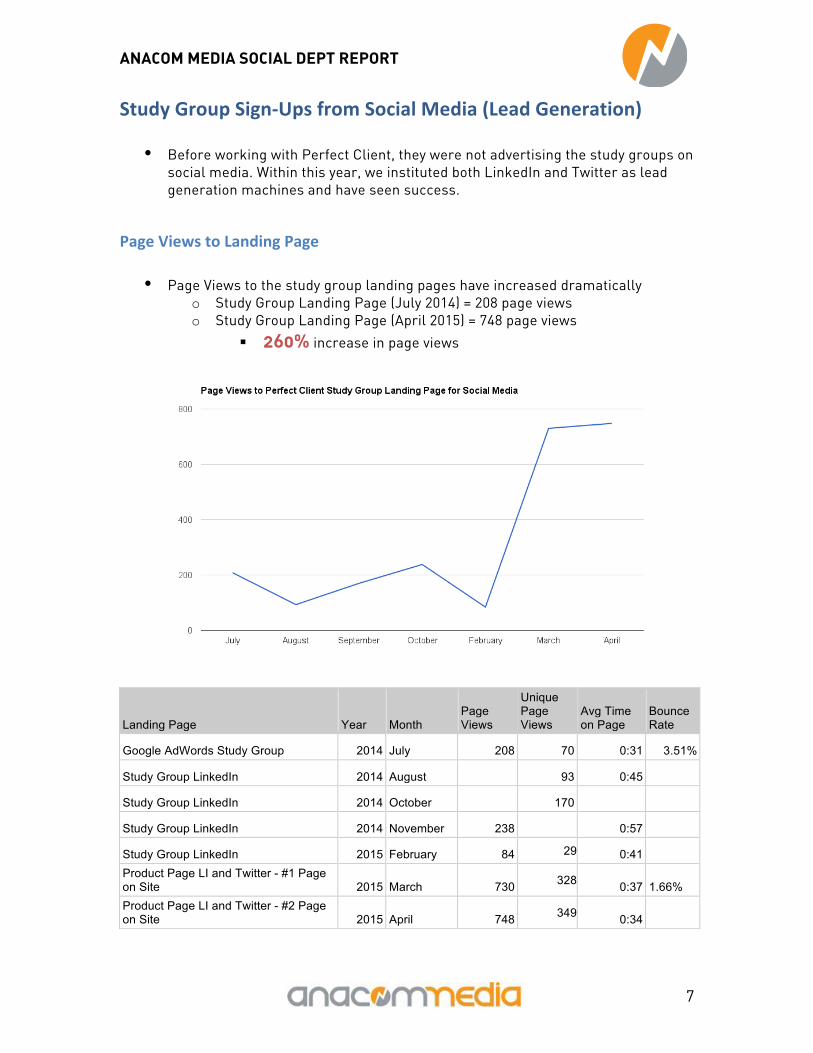
• Before working with Perfect Client, they were not advertising the study groups on social media. Within this year, we instituted both LinkedIn and Twitter as lead generation machines and have seen success.
Page Views to Landing Page
• Page Views to the study group landing pages have increased dramatically o Study Group Landing Page (July 2014) = 208 page views o Study Group Landing Page (April 2015) = 748 page views
! 260% increase in page views
Landing Page Year Month Page Views
Unique Page Views
Avg Time on Page
Bounce Rate
Google AdWords Study Group 2014 July 208 70 0:31 3.51%
Study Group LinkedIn 2014 August 93 0:45
Study Group LinkedIn 2014 October 170
Study Group LinkedIn 2014 November 238 0:57
Study Group LinkedIn 2015 February 84 29 0:41 Product Page LI and Twitter - #1 Page
on Site 2015 March 730 328 0:37 1.66% Product Page LI and Twitter - #2 Page on Site 2015 April 748 349 0:34
ANACOM MEDIA SOCIAL DEPT REPORT
8
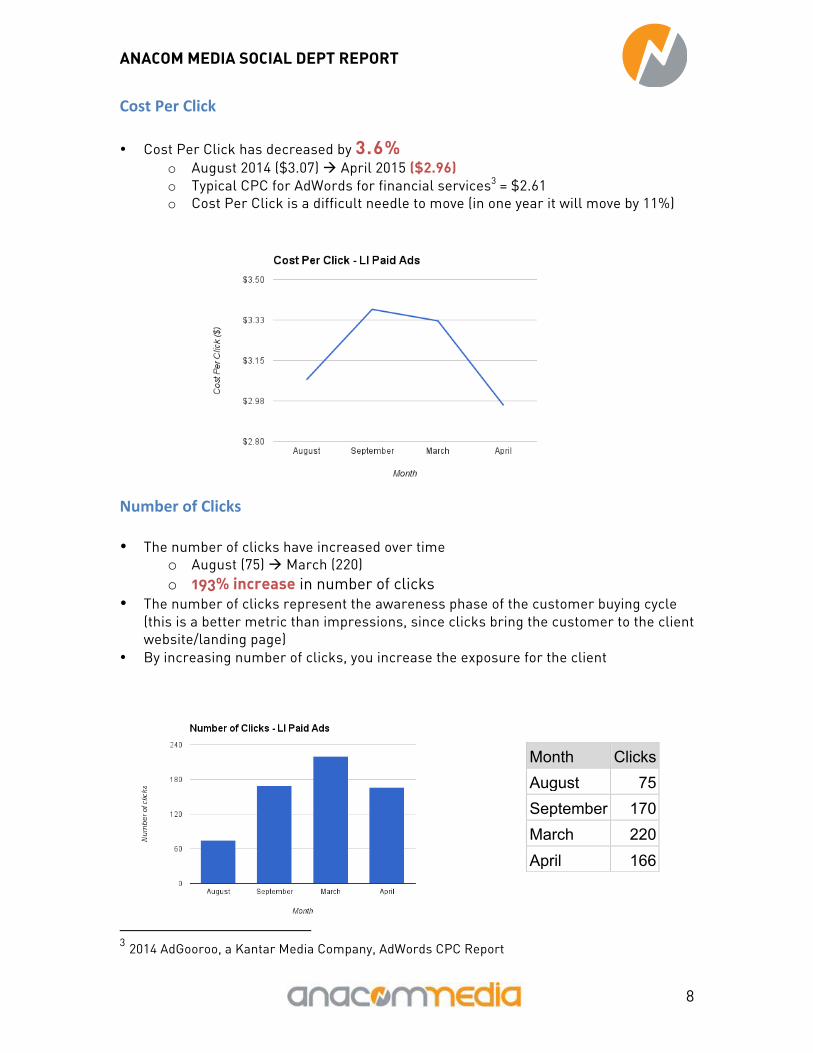
Cost Per Click • Cost Per Click has decreased by 3.6%
o August 2014 ($3.07) " April 2015 ($2.96) o Typical CPC for AdWords for financial services3 = $2.61 o Cost Per Click is a difficult needle to move (in one year it will move by 11%)
Number of Clicks • The number of clicks have increased over time
o August (75) " March (220) o 193% increase in number of clicks
• The number of clicks represent the awareness phase of the customer buying cycle (this is a better metric than impressions, since clicks bring the customer to the client website/landing page)
• By increasing number of clicks, you increase the exposure for the client
3 2014 AdGooroo, a Kantar Media Company, AdWords CPC Report
Month Clicks August 75 September 170 March 220 April 166
ANACOM MEDIA SOCIAL DEPT REPORT
9
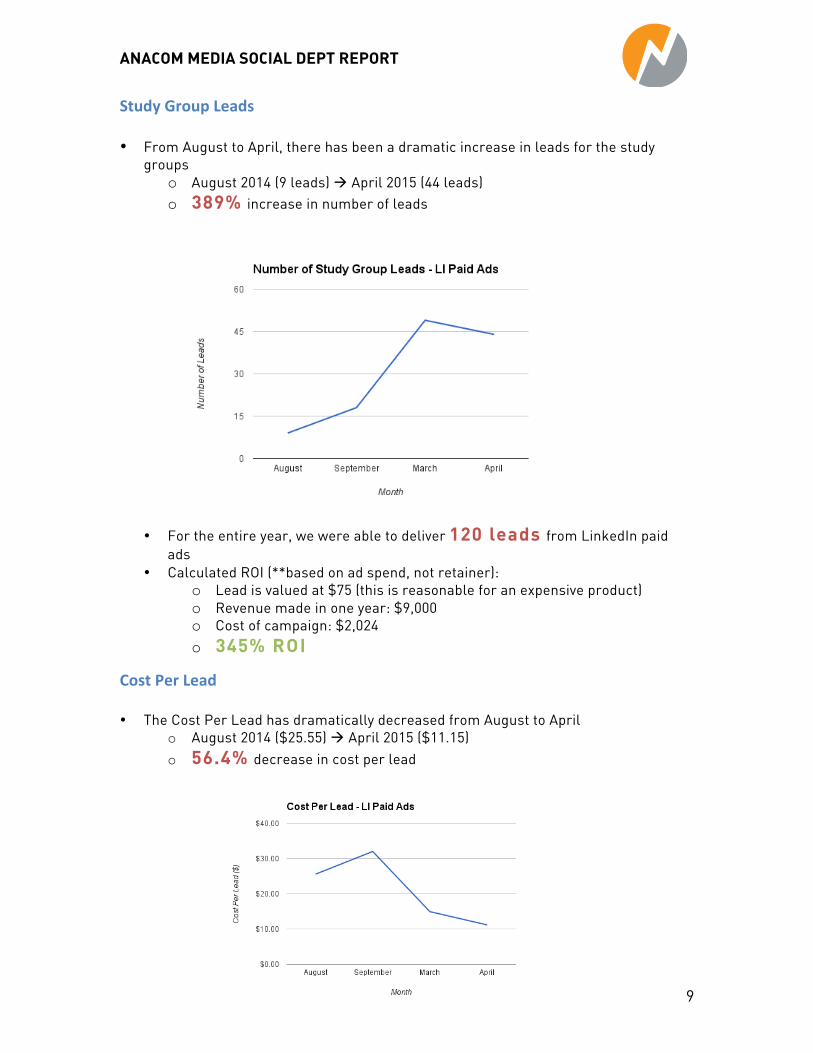
Study Group Leads • From August to April, there has been a dramatic increase in leads for the study
groups o August 2014 (9 leads) " April 2015 (44 leads) o 389% increase in number of leads
• For the entire year, we were able to deliver 120 leads from LinkedIn paid ads
• Calculated ROI (**based on ad spend, not retainer): o Lead is valued at $75 (this is reasonable for an expensive product) o Revenue made in one year: $9,000 o Cost of campaign: $2,024 o 345% ROI
Cost Per Lead • The Cost Per Lead has dramatically decreased from August to April
o August 2014 ($25.55) " April 2015 ($11.15) o 56.4% decrease in cost per lead
ANACOM MEDIA SOCIAL DEPT REPORT
10
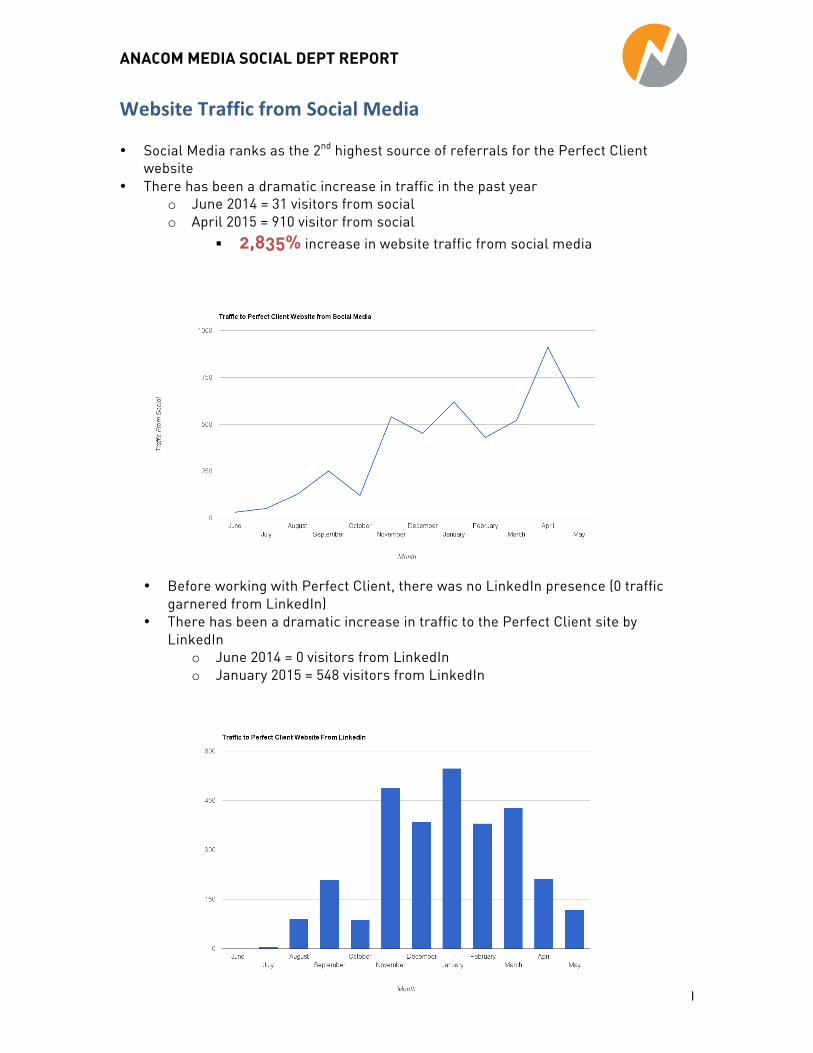
Website Traffic from Social Media • Social Media ranks as the 2nd highest source of referrals for the Perfect Client
website • There has been a dramatic increase in traffic in the past year
o June 2014 = 31 visitors from social o April 2015 = 910 visitor from social
! 2,835% increase in website traffic from social media
• Before working with Perfect Client, there was no LinkedIn presence (0 traffic
garnered from LinkedIn) • There has been a dramatic increase in traffic to the Perfect Client site by
LinkedIn o June 2014 = 0 visitors from LinkedIn o January 2015 = 548 visitors from LinkedIn
ANACOM MEDIA SOCIAL DEPT REPORT
11
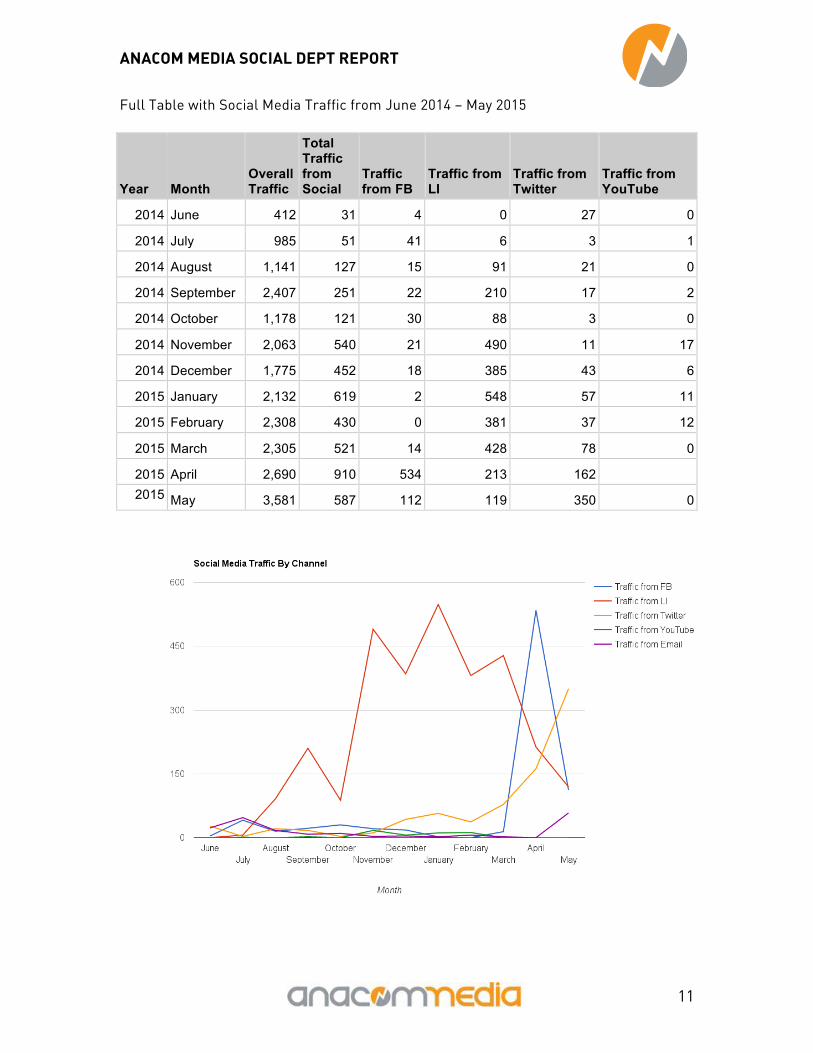
Full Table with Social Media Traffic from June 2014 – May 2015
Year Month Overall Traffic
Total Traffic from Social
Traffic from FB
Traffic from LI
Traffic from Twitter
Traffic from YouTube
2014 June 412 31 4 0 27 0
2014 July 985 51 41 6 3 1
2014 August 1,141 127 15 91 21 0
2014 September 2,407 251 22 210 17 2
2014 October 1,178 121 30 88 3 0
2014 November 2,063 540 21 490 11 17
2014 December 1,775 452 18 385 43 6
2015 January 2,132 619 2 548 57 11
2015 February 2,308 430 0 381 37 12
2015 March 2,305 521 14 428 78 0
2015 April 2,690 910 534 213 162 2015 May 3,581 587 112 119 350 0
ANACOM MEDIA SOCIAL DEPT REPORT
12
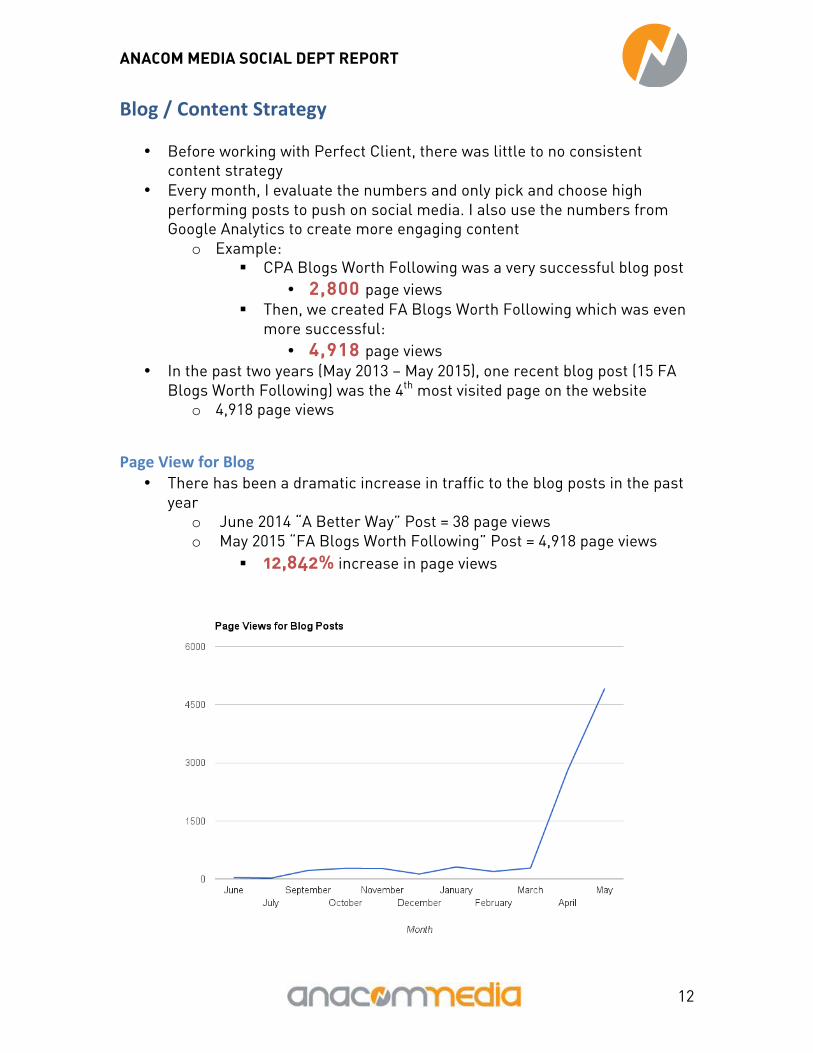
Blog / Content Strategy
• Before working with Perfect Client, there was little to no consistent content strategy
• Every month, I evaluate the numbers and only pick and choose high performing posts to push on social media. I also use the numbers from Google Analytics to create more engaging content
o Example: ! CPA Blogs Worth Following was a very successful blog post
• 2,800 page views ! Then, we created FA Blogs Worth Following which was even
more successful: • 4,918 page views
• In the past two years (May 2013 – May 2015), one recent blog post (15 FA Blogs Worth Following) was the 4th most visited page on the website
o 4,918 page views
Page View for Blog • There has been a dramatic increase in traffic to the blog posts in the past
year o June 2014 “A Better Way” Post = 38 page views o May 2015 “FA Blogs Worth Following” Post = 4,918 page views
! 12,842% increase in page views
ANACOM MEDIA SOCIAL DEPT REPORT
13
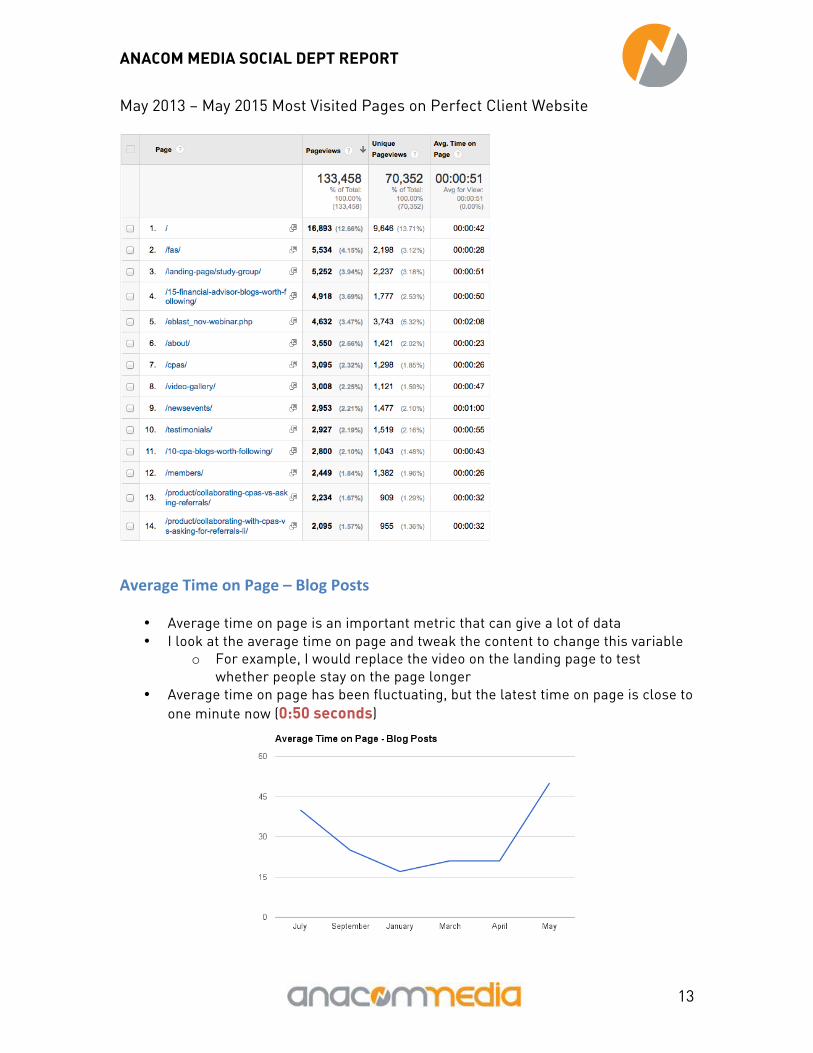
May 2013 – May 2015 Most Visited Pages on Perfect Client Website
Average Time on Page – Blog Posts
• Average time on page is an important metric that can give a lot of data • I look at the average time on page and tweak the content to change this variable
o For example, I would replace the video on the landing page to test whether people stay on the page longer
• Average time on page has been fluctuating, but the latest time on page is close to one minute now (0:50 seconds)
ANACOM MEDIA SOCIAL DEPT REPORT
14
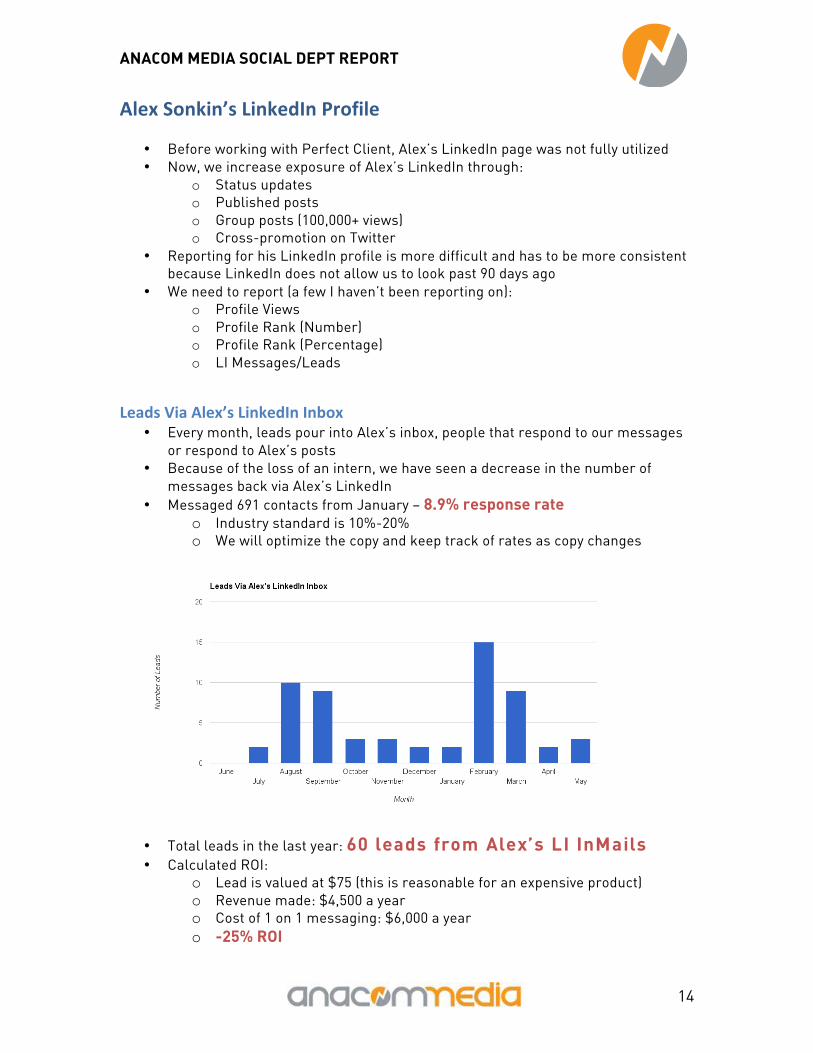
Alex Sonkin’s LinkedIn Profile
• Before working with Perfect Client, Alex’s LinkedIn page was not fully utilized • Now, we increase exposure of Alex’s LinkedIn through:
o Status updates o Published posts o Group posts (100,000+ views) o Cross-promotion on Twitter
• Reporting for his LinkedIn profile is more difficult and has to be more consistent because LinkedIn does not allow us to look past 90 days ago
• We need to report (a few I haven’t been reporting on): o Profile Views o Profile Rank (Number) o Profile Rank (Percentage) o LI Messages/Leads
Leads Via Alex’s LinkedIn Inbox • Every month, leads pour into Alex’s inbox, people that respond to our messages
or respond to Alex’s posts • Because of the loss of an intern, we have seen a decrease in the number of
messages back via Alex’s LinkedIn • Messaged 691 contacts from January – 8.9% response rate
o Industry standard is 10%-20% o We will optimize the copy and keep track of rates as copy changes
• Total leads in the last year: 60 leads from Alex’s LI InMails • Calculated ROI:
o Lead is valued at $75 (this is reasonable for an expensive product) o Revenue made: $4,500 a year o Cost of 1 on 1 messaging: $6,000 a year o -25% ROI
ANACOM MEDIA SOCIAL DEPT REPORT
15
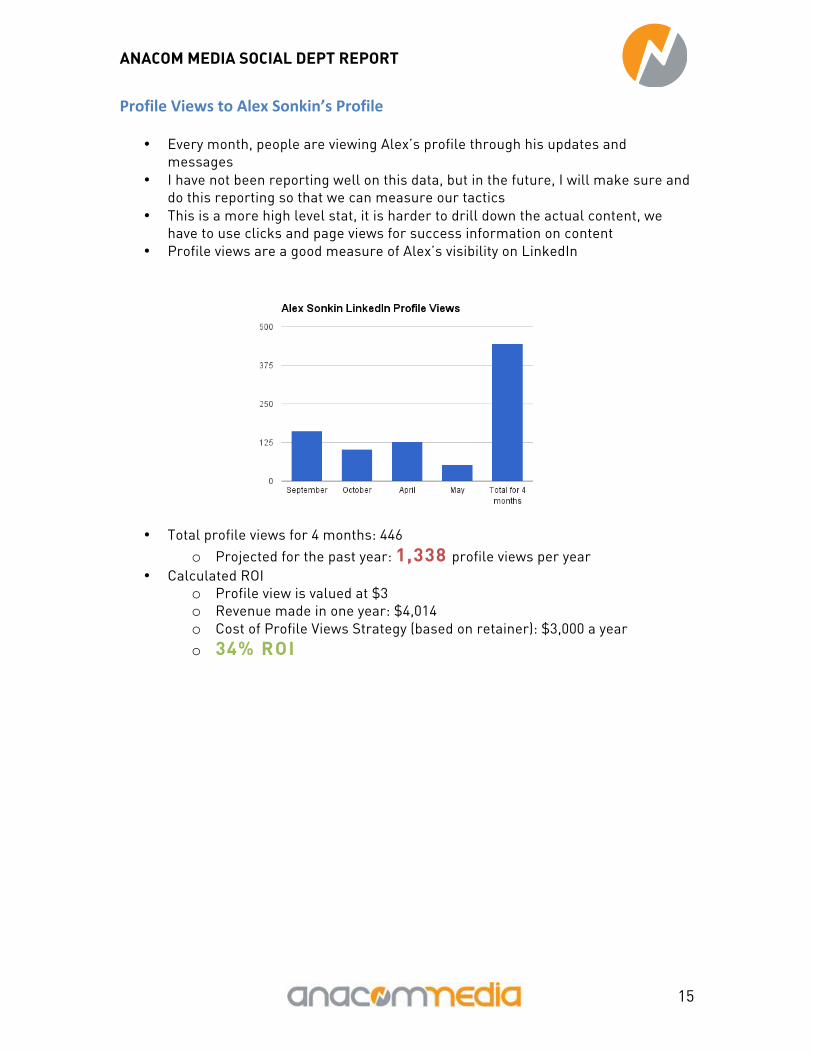
Profile Views to Alex Sonkin’s Profile
• Every month, people are viewing Alex’s profile through his updates and messages
• I have not been reporting well on this data, but in the future, I will make sure and do this reporting so that we can measure our tactics
• This is a more high level stat, it is harder to drill down the actual content, we have to use clicks and page views for success information on content
• Profile views are a good measure of Alex’s visibility on LinkedIn
• Total profile views for 4 months: 446 o Projected for the past year: 1,338 profile views per year
• Calculated ROI o Profile view is valued at $3 o Revenue made in one year: $4,014 o Cost of Profile Views Strategy (based on retainer): $3,000 a year o 34% ROI
ANACOM MEDIA SOCIAL DEPT REPORT
16
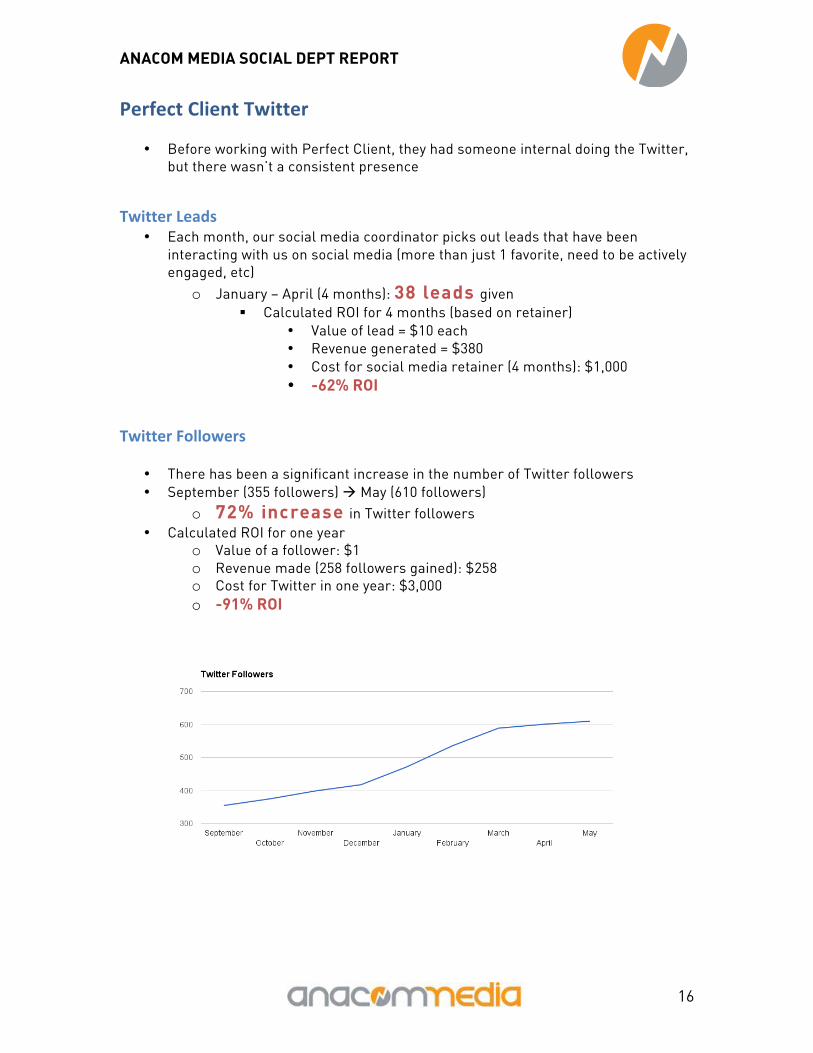
Perfect Client Twitter
• Before working with Perfect Client, they had someone internal doing the Twitter, but there wasn’t a consistent presence
Twitter Leads • Each month, our social media coordinator picks out leads that have been
interacting with us on social media (more than just 1 favorite, need to be actively engaged, etc)
o January – April (4 months): 38 leads given ! Calculated ROI for 4 months (based on retainer)
• Value of lead = $10 each • Revenue generated = $380 • Cost for social media retainer (4 months): $1,000 • -62% ROI
Twitter Followers
• There has been a significant increase in the number of Twitter followers • September (355 followers) " May (610 followers)
o 72% increase in Twitter followers • Calculated ROI for one year
o Value of a follower: $1 o Revenue made (258 followers gained): $258 o Cost for Twitter in one year: $3,000 o -91% ROI
•
ANACOM MEDIA SOCIAL DEPT REPORT
17
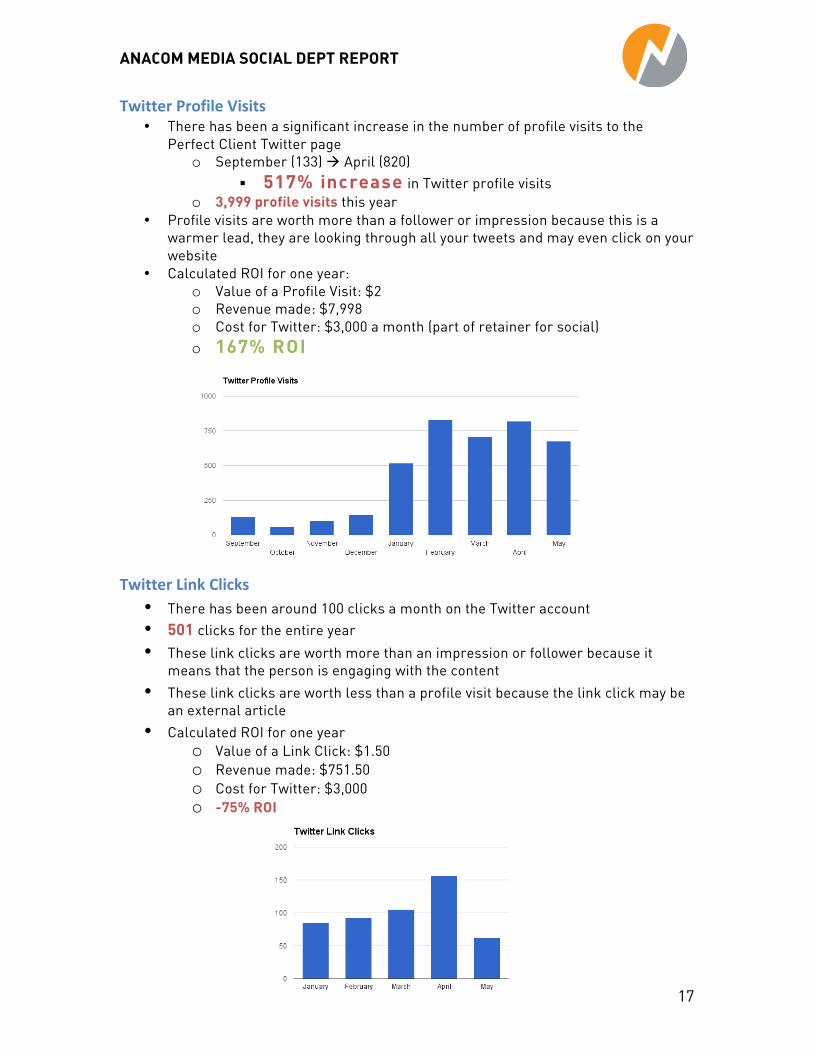
Twitter Profile Visits • There has been a significant increase in the number of profile visits to the
Perfect Client Twitter page o September (133) " April (820)
! 517% increase in Twitter profile visits o 3,999 profile visits this year
• Profile visits are worth more than a follower or impression because this is a warmer lead, they are looking through all your tweets and may even click on your website
• Calculated ROI for one year: o Value of a Profile Visit: $2 o Revenue made: $7,998 o Cost for Twitter: $3,000 a month (part of retainer for social) o 167% ROI
Twitter Link Clicks • There has been around 100 clicks a month on the Twitter account • 501 clicks for the entire year • These link clicks are worth more than an impression or follower because it
means that the person is engaging with the content • These link clicks are worth less than a profile visit because the link click may be
an external article • Calculated ROI for one year
o Value of a Link Click: $1.50 o Revenue made: $751.50 o Cost for Twitter: $3,000 o -75% ROI
ANACOM MEDIA SOCIAL DEPT REPORT
18
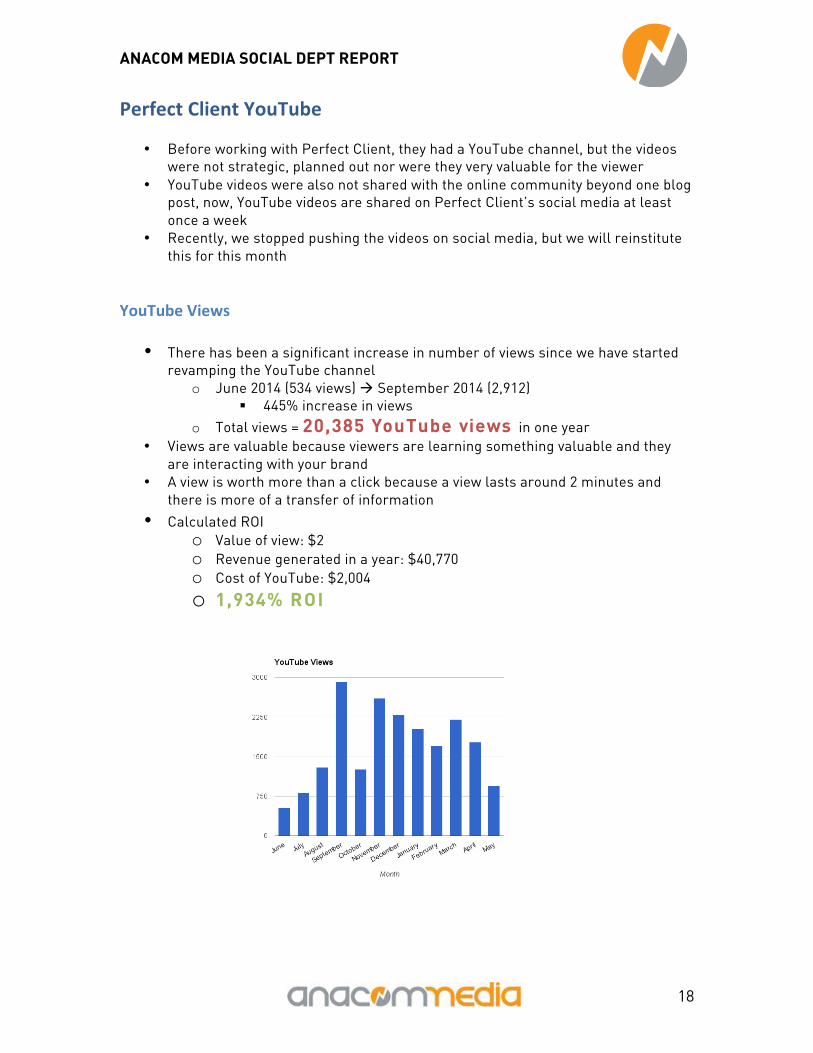
Perfect Client YouTube
• Before working with Perfect Client, they had a YouTube channel, but the videos were not strategic, planned out nor were they very valuable for the viewer
• YouTube videos were also not shared with the online community beyond one blog post, now, YouTube videos are shared on Perfect Client’s social media at least once a week
• Recently, we stopped pushing the videos on social media, but we will reinstitute this for this month
YouTube Views
• There has been a significant increase in number of views since we have started revamping the YouTube channel
o June 2014 (534 views) " September 2014 (2,912) ! 445% increase in views
o Total views = 20,385 YouTube views in one year • Views are valuable because viewers are learning something valuable and they
are interacting with your brand • A view is worth more than a click because a view lasts around 2 minutes and
there is more of a transfer of information
• Calculated ROI o Value of view: $2 o Revenue generated in a year: $40,770 o Cost of YouTube: $2,004 o 1,934% ROI
ANACOM MEDIA SOCIAL DEPT REPORT
19
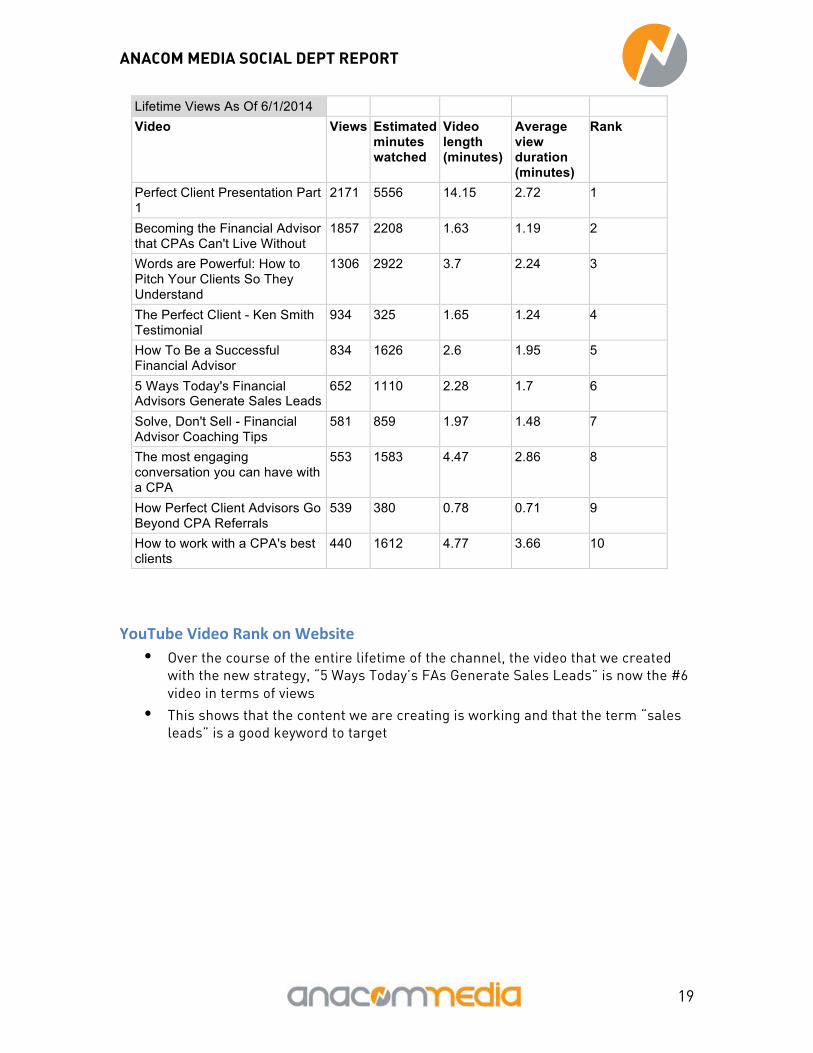
YouTube Video Rank on Website • Over the course of the entire lifetime of the channel, the video that we created
with the new strategy, “5 Ways Today’s FAs Generate Sales Leads” is now the #6 video in terms of views
• This shows that the content we are creating is working and that the term “sales leads” is a good keyword to target
Lifetime Views As Of 6/1/2014 Video Views Estimated
minutes watched
Video length (minutes)
Average view duration (minutes)
Rank
Perfect Client Presentation Part 1
2171 5556 14.15 2.72 1
Becoming the Financial Advisor that CPAs Can't Live Without
1857 2208 1.63 1.19 2
Words are Powerful: How to Pitch Your Clients So They Understand
1306 2922 3.7 2.24 3
The Perfect Client - Ken Smith Testimonial
934 325 1.65 1.24 4
How To Be a Successful Financial Advisor
834 1626 2.6 1.95 5
5 Ways Today's Financial Advisors Generate Sales Leads
652 1110 2.28 1.7 6
Solve, Don't Sell - Financial Advisor Coaching Tips
581 859 1.97 1.48 7
The most engaging conversation you can have with a CPA
553 1583 4.47 2.86 8
How Perfect Client Advisors Go Beyond CPA Referrals
539 380 0.78 0.71 9
How to work with a CPA's best clients
440 1612 4.77 3.66 10
ANACOM MEDIA SOCIAL DEPT REPORT
20
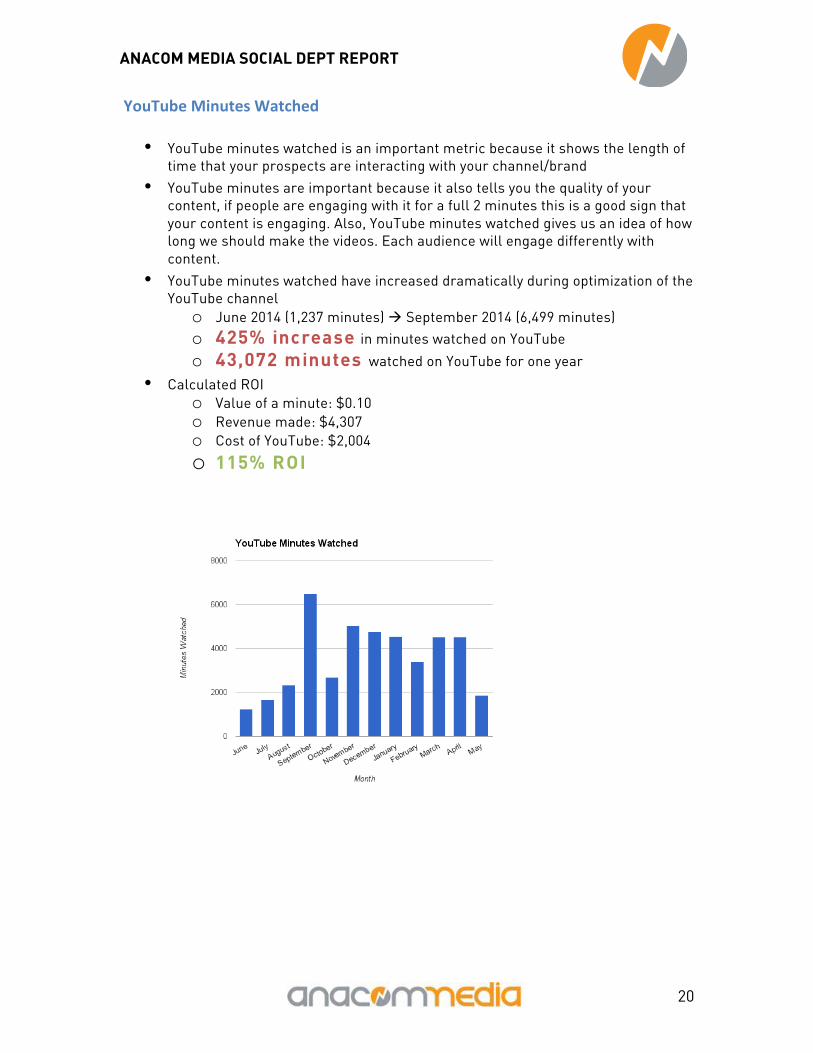
YouTube Minutes Watched
• YouTube minutes watched is an important metric because it shows the length of time that your prospects are interacting with your channel/brand
• YouTube minutes are important because it also tells you the quality of your content, if people are engaging with it for a full 2 minutes this is a good sign that your content is engaging. Also, YouTube minutes watched gives us an idea of how long we should make the videos. Each audience will engage differently with content.
• YouTube minutes watched have increased dramatically during optimization of the YouTube channel
o June 2014 (1,237 minutes) " September 2014 (6,499 minutes) o 425% increase in minutes watched on YouTube o 43,072 minutes watched on YouTube for one year
• Calculated ROI o Value of a minute: $0.10 o Revenue made: $4,307 o Cost of YouTube: $2,004 o 115% ROI
ANACOM MEDIA SOCIAL DEPT REPORT
21
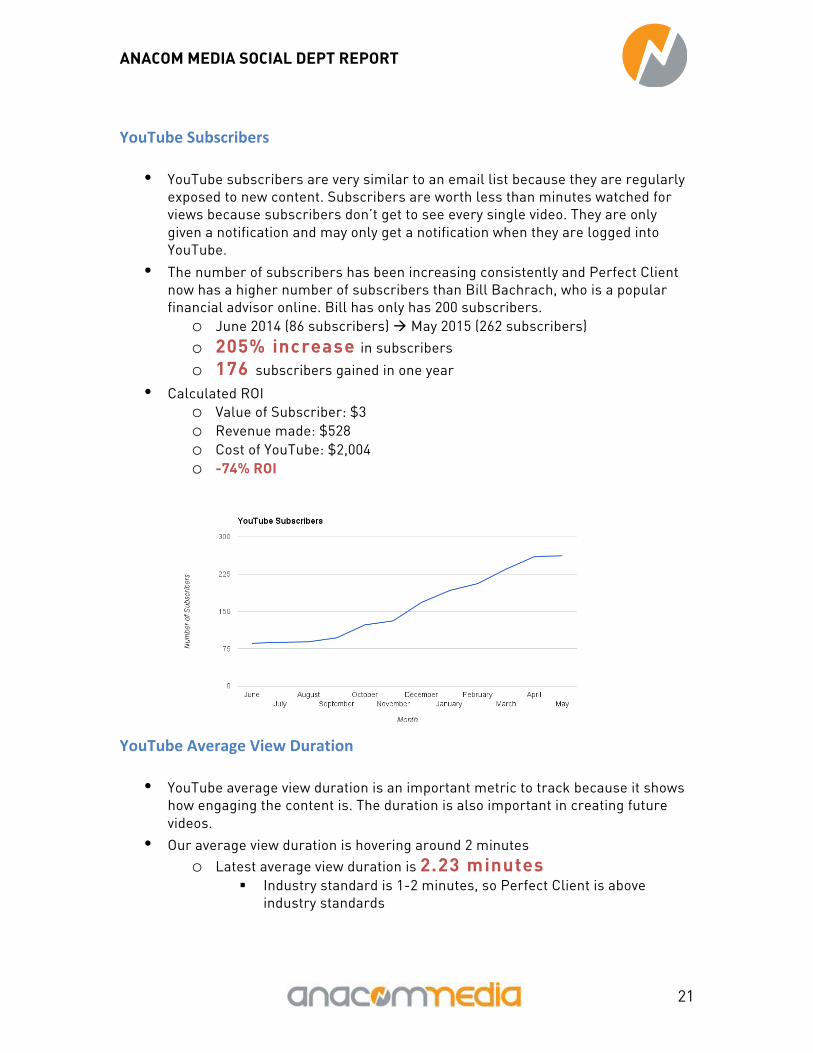
YouTube Subscribers
• YouTube subscribers are very similar to an email list because they are regularly exposed to new content. Subscribers are worth less than minutes watched for views because subscribers don’t get to see every single video. They are only given a notification and may only get a notification when they are logged into YouTube.
• The number of subscribers has been increasing consistently and Perfect Client now has a higher number of subscribers than Bill Bachrach, who is a popular financial advisor online. Bill has only has 200 subscribers.
o June 2014 (86 subscribers) " May 2015 (262 subscribers) o 205% increase in subscribers o 176 subscribers gained in one year
• Calculated ROI o Value of Subscriber: $3 o Revenue made: $528 o Cost of YouTube: $2,004 o -74% ROI
YouTube Average View Duration
• YouTube average view duration is an important metric to track because it shows how engaging the content is. The duration is also important in creating future videos.
• Our average view duration is hovering around 2 minutes o Latest average view duration is 2.23 minutes
! Industry standard is 1-2 minutes, so Perfect Client is above industry standards
ANACOM MEDIA SOCIAL DEPT REPORT
22
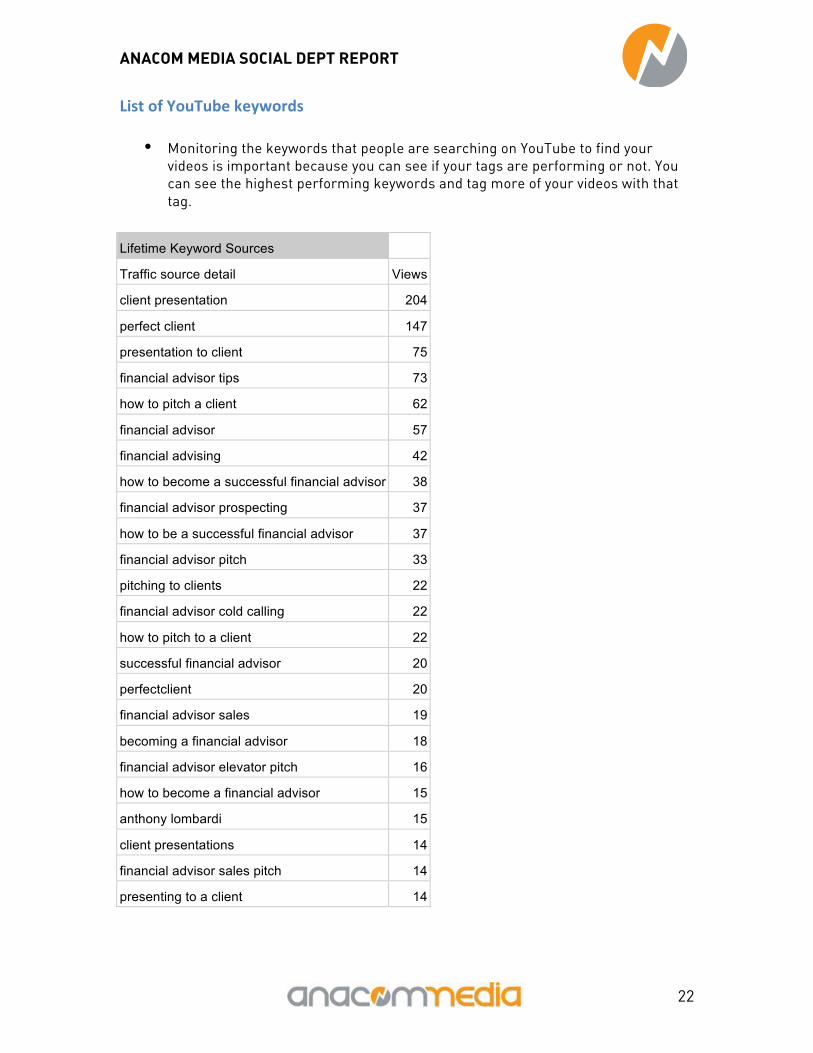
List of YouTube keywords
• Monitoring the keywords that people are searching on YouTube to find your videos is important because you can see if your tags are performing or not. You can see the highest performing keywords and tag more of your videos with that tag.
Lifetime Keyword Sources
Traffic source detail Views
client presentation 204
perfect client 147
presentation to client 75
financial advisor tips 73
how to pitch a client 62
financial advisor 57
financial advising 42
how to become a successful financial advisor 38
financial advisor prospecting 37
how to be a successful financial advisor 37
financial advisor pitch 33
pitching to clients 22
financial advisor cold calling 22
how to pitch to a client 22
successful financial advisor 20
perfectclient 20
financial advisor sales 19
becoming a financial advisor 18
financial advisor elevator pitch 16
how to become a financial advisor 15
anthony lombardi 15
client presentations 14
financial advisor sales pitch 14
presenting to a client 14
ANACOM MEDIA SOCIAL DEPT REPORT
23
ATPI and CPA Outreach on Social Media
• Before working with Perfect Client, they were not advertising the ATPI or the CPA landing pages at all on social media. For a couple of months this year, we tested the CPA audience on LinkedIn, but saw limited success. However, there was a good amount of impressions.
CPA Impressions
• In the three months of the CPA/ATPI campaign, we garnered 244,815 impressions for CPAs online.
Potential Traffic Opportunities
Email Marketing
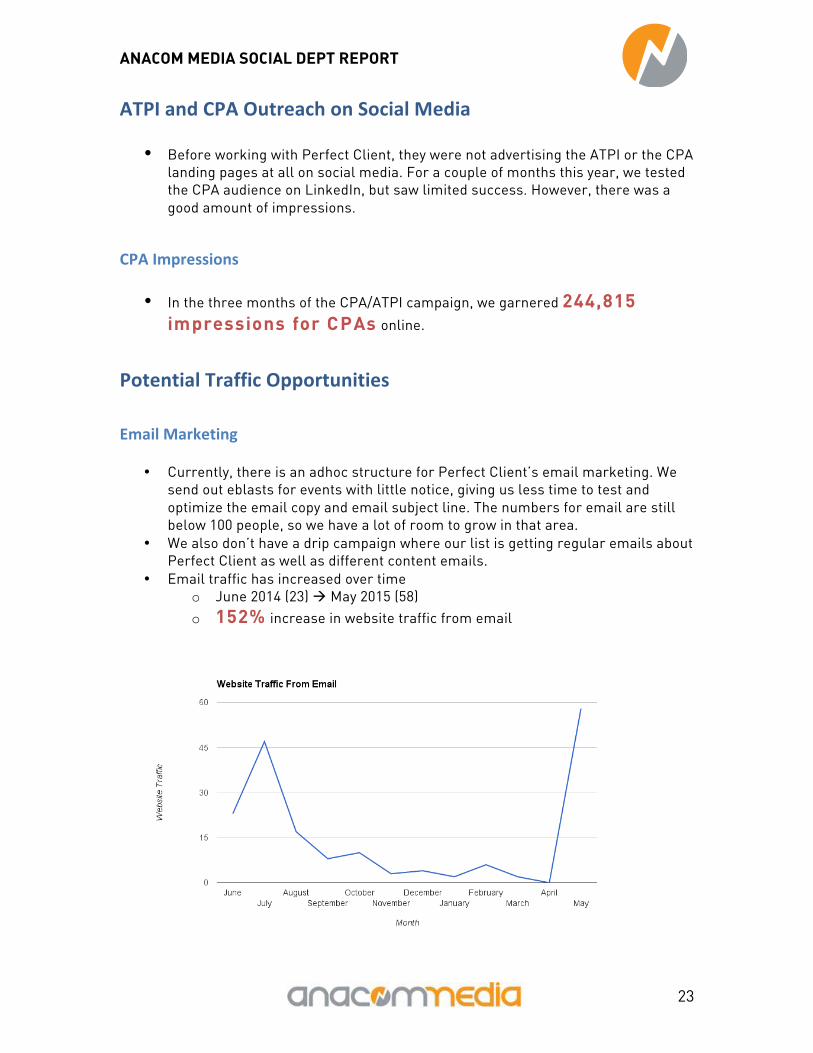
• Currently, there is an adhoc structure for Perfect Client’s email marketing. We send out eblasts for events with little notice, giving us less time to test and optimize the email copy and email subject line. The numbers for email are still below 100 people, so we have a lot of room to grow in that area.
• We also don’t have a drip campaign where our list is getting regular emails about Perfect Client as well as different content emails.
• Email traffic has increased over time o June 2014 (23) " May 2015 (58) o 152% increase in website traffic from email
ANACOM MEDIA SOCIAL DEPT REPORT
24
ANACOM MEDIA SOCIAL DEPT REPORT
25
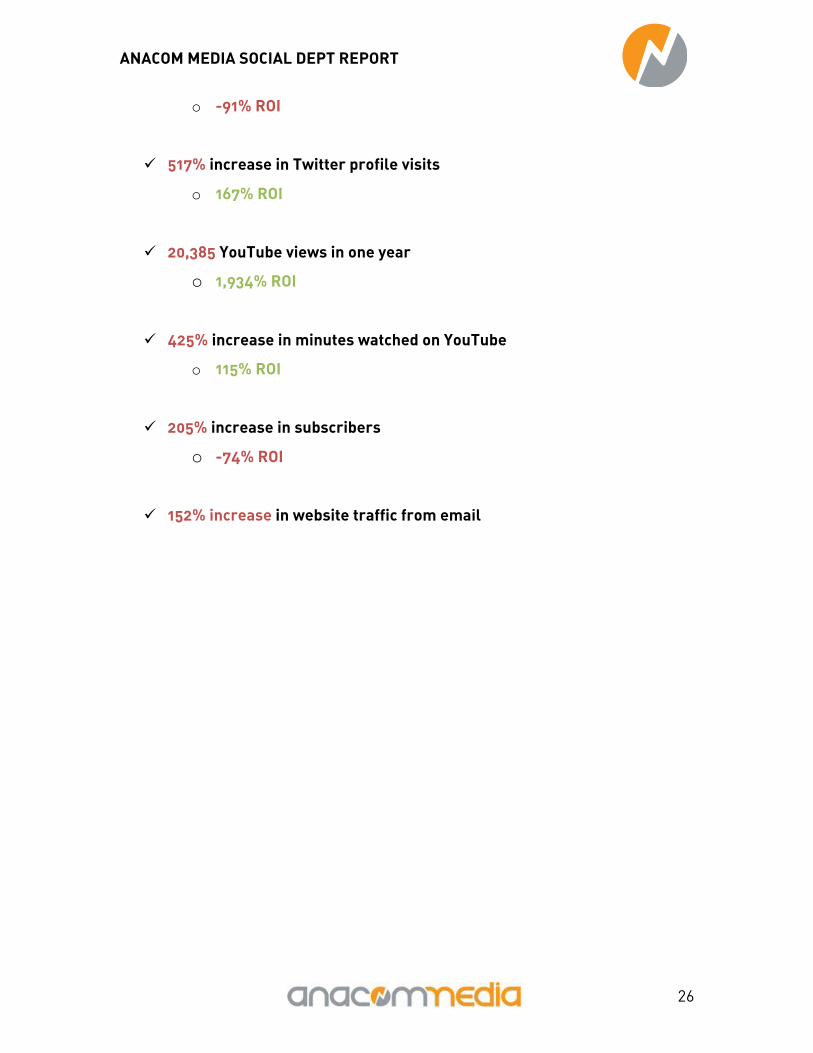
Summary of Stats
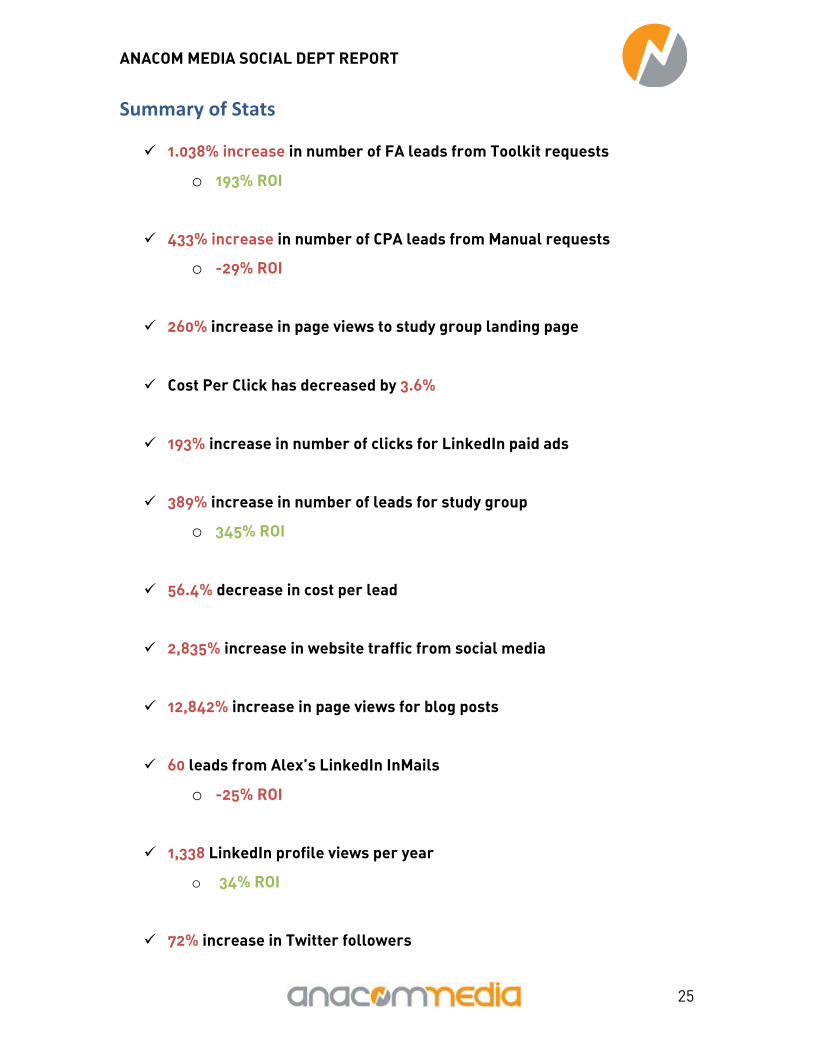
# 1.038% increase in number of FA leads from Toolkit requests
o 193% ROI
# 433% increase in number of CPA leads from Manual requests
o -29% ROI
# 260% increase in page views to study group landing page
# Cost Per Click has decreased by 3.6%
# 193% increase in number of clicks for LinkedIn paid ads
# 389% increase in number of leads for study group
o 345% ROI
# 56.4% decrease in cost per lead
# 2,835% increase in website traffic from social media
# 12,842% increase in page views for blog posts
# 60 leads from Alex’s LinkedIn InMails
o -25% ROI
# 1,338 LinkedIn profile views per year
o 34% ROI
# 72% increase in Twitter followers
ANACOM MEDIA SOCIAL DEPT REPORT
26
o -91% ROI
# 517% increase in Twitter profile visits
o 167% ROI
# 20,385 YouTube views in one year
o 1,934% ROI
# 425% increase in minutes watched on YouTube
o 115% ROI
# 205% increase in subscribers
o -74% ROI
# 152% increase in website traffic from email
ANACOM MEDIA SOCIAL DEPT REPORT
27
Yearly KPIs Report for Social Media Department (2014 – 2015)
Client: Perfect Client