Embed Size (px)
Citation preview

Omnicom
A N N U A L R E P O R T
2015
01.68250cover.qxp 4/6/16 3:12 PM Page 1

Omnicom
A N N U A L R E P O R T
2015
01a.68250flysheet.qxp 3/31/16 8:22 PM Page 1

UNITED STATESSECURITIES AND EXCHANGE COMMISSION
Washington, D.C. 20549
FORM 10-KANNUAL REPORT PURSUANT TO SECTION 13 OR 15(d) OF THE SECURITIES EXCHANGE ACT OF 1934
FOR FISCAL YEAR ENDED DECEMBER 31, 2015
Commission File Number: 1-10551
OMNICOM GROUP INC.(Exact name of registrant as specified in its charter)
New York 13-1514814(State or other jurisdiction of (I.R.S. Employer Identification No.)incorporation or organization)
437 Madison Avenue, New York, NY 10022(Address of principal executive offices) (Zip Code)
Registrant’s telephone number, including area code: (212) 415-3600
Securities Registered Pursuant to Section 12(b) of the Act:Title of each class Name of each exchange on which registered______________ ___________________________________
Common Stock, $.15 Par Value New York Stock Exchange
Securities Registered Pursuant to Section 12(g) of the Act: None
Indicate by check mark if the registrant is a well-known seasoned issuer, as defined in Rule 405 of the Securities Act.Yes No
Indicate by check mark if the registrant is not required to file reports pursuant to Section 13 or Section 15(d) ofthe Act.
Yes No
Indicate by check mark whether the registrant (1) has filed all reports required to be filed by Section 13 or 15(d)of the Securities Exchange Act of 1934 during the preceding twelve months (or for such shorter period that theregistrant was required to file such reports) and (2) has been subject to such filing requirements for the past 90 days.
Yes No
Indicate by check mark whether the registrant has submitted electronically and posted on its corporate web site, ifany, every interactive data file required to be submitted and posted pursuant to Rule 405 of Regulation S-T during thepreceding twelve months (or for such shorter period that the registrant was required to submit and post such files).
Yes No
Indicate by check mark if disclosure of delinquent filers pursuant to Item 405 of Regulation S-K is not containedherein, and will not be contained, to the best of registrant’s knowledge, in definitive proxy or information statementsincorporated by reference in Part III of this Form 10-K or any amendment to this Form 10-K.
Indicate by check mark whether the registrant is a large accelerated filer, an accelerated filer, a non-acceleratedfiler, or a smaller reporting company.
Large accelerated filer Accelerated filer Non-accelerated filer Smaller reporting company
Indicate by check mark whether the registrant is a shell company (as defined in Rule 12b-2 of the Exchange Act).
Yes No
The aggregate market value of the voting and non-voting common stock held by non-affiliates as of June 30,2015 was $16,891,929,000.
As of January 27, 2016, there were 239,590,579 shares of Omnicom Group Inc. Common Stock outstanding.
Portions of the Omnicom Group Inc. Definitive Proxy Statement for the Annual Meeting of Shareholders scheduledto be held on May 24, 2016 are incorporated by reference into Part III of this report to the extent described herein.
03.68250-10K.qxp 3/31/16 6:47 PM Page A


OMNICOM GROUP INC.
ANNUAL REPORT ON FORM 10-K FOR THE YEAR ENDED DECEMBER 31, 2015
TABLE OF CONTENTSPage
PART IItem 1 Business . . . . . . . . . . . . . . . . . . . . . . . . . . . . . . . . . . . . . . . . . . . . . . . . . . . . . . . . . . . . . 1Item 1A. Risk Factors . . . . . . . . . . . . . . . . . . . . . . . . . . . . . . . . . . . . . . . . . . . . . . . . . . . . . . . . . . 3Item 1B. Unresolved Staff Comments . . . . . . . . . . . . . . . . . . . . . . . . . . . . . . . . . . . . . . . . . . . . . . 6Item 2. Properties . . . . . . . . . . . . . . . . . . . . . . . . . . . . . . . . . . . . . . . . . . . . . . . . . . . . . . . . . . . . 6Item 3. Legal Proceedings . . . . . . . . . . . . . . . . . . . . . . . . . . . . . . . . . . . . . . . . . . . . . . . . . . . . . . 6Item 4. Mine Safety Disclosures . . . . . . . . . . . . . . . . . . . . . . . . . . . . . . . . . . . . . . . . . . . . . . . . . 6
PART II
Item 5. Market for Registrant’s Common Equity, Related Stockholder Matters andIssuer Purchases of Equity Securities . . . . . . . . . . . . . . . . . . . . . . . . . . . . . . . . . . . 7
Item 6. Selected Financial Data . . . . . . . . . . . . . . . . . . . . . . . . . . . . . . . . . . . . . . . . . . . . . . . . . . 8Item 7. Management’s Discussion and Analysis of Financial Condition
and Results of Operations . . . . . . . . . . . . . . . . . . . . . . . . . . . . . . . . . . . . . . . . . . . 8Item 7A. Quantitative and Qualitative Disclosures About Market Risk . . . . . . . . . . . . . . . . . . . . . 26Item 8. Financial Statements and Supplementary Data . . . . . . . . . . . . . . . . . . . . . . . . . . . . . . . . 28Item 9. Changes in and Disagreements With Accountants on Accounting and
Financial Disclosure . . . . . . . . . . . . . . . . . . . . . . . . . . . . . . . . . . . . . . . . . . . . . . . . 28Item 9A. Controls and Procedures . . . . . . . . . . . . . . . . . . . . . . . . . . . . . . . . . . . . . . . . . . . . . . . . . 28Item 9B. Other Information . . . . . . . . . . . . . . . . . . . . . . . . . . . . . . . . . . . . . . . . . . . . . . . . . . . . . 28
PART III
Item 10. Directors, Executive Officers and Corporate Governance . . . . . . . . . . . . . . . . . . . . . . . . 29Item 11. Executive Compensation . . . . . . . . . . . . . . . . . . . . . . . . . . . . . . . . . . . . . . . . . . . . . . . . 29Item 12. Security Ownership of Certain Beneficial Owners and Management and
Related Stockholder Matters . . . . . . . . . . . . . . . . . . . . . . . . . . . . . . . . . . . . . . . . . 29Item 13. Certain Relationships and Related Transactions, and Director Independence . . . . . . . . . 29Item 14. Principal Accounting Fees and Services . . . . . . . . . . . . . . . . . . . . . . . . . . . . . . . . . . . . . . 29
PART IV
Item 15. Exhibits, Financial Statement Schedules . . . . . . . . . . . . . . . . . . . . . . . . . . . . . . . . . . . . . 29
Signatures . . . . . . . . . . . . . . . . . . . . . . . . . . . . . . . . . . . . . . . . . . . . . . . . . . . . . . . . . . . . . . . . . . . . . . . 33Management Report on Internal Control Over Financial Reporting . . . . . . . . . . . . . . . . . . . . . . . . . . . F-1Reports of Independent Registered Public Accounting Firm . . . . . . . . . . . . . . . . . . . . . . . . . . . . . . . . . F-2Consolidated Financial Statements . . . . . . . . . . . . . . . . . . . . . . . . . . . . . . . . . . . . . . . . . . . . . . . . . . . . F-4Notes to Consolidated Financial Statements . . . . . . . . . . . . . . . . . . . . . . . . . . . . . . . . . . . . . . . . . . . . . F-9Selected Quarterly Financial Data . . . . . . . . . . . . . . . . . . . . . . . . . . . . . . . . . . . . . . . . . . . . . . . . . . . . . F-36Schedule II — Valuation and Qualifying Accounts . . . . . . . . . . . . . . . . . . . . . . . . . . . . . . . . . . . . . . . . S-1
i
03.68250-10K.qxp 3/31/16 6:47 PM Page i

FORWARD-LOOKING STATEMENTS
Certain statements in this Annual Report on Form 10-K constitute forward-looking statements, includingstatements within the meaning of the Private Securities Litigation Reform Act of 1995. In addition, from time totime, the Company or its representatives have made, or may make, forward-looking statements, orally or in writing.These statements may discuss goals, intentions and expectations as to future plans, trends, events, results ofoperations or financial condition, or otherwise, based on current beliefs of the Company’s management as well asassumptions made by, and information currently available to, the Company’s management. Forward-lookingstatements may be accompanied by words such as “aim,” “anticipate,” “believe,” “plan,” “could,” “should,” “would,”“estimate,” “expect,” “forecast,” “future,” “guidance,” “intend,” “may,” “will,” “possible,” “potential,” “predict,”“project” or similar words, phrases or expressions. These forward-looking statements are subject to various risks anduncertainties, many of which are outside the Company’s control. Therefore, you should not place undue reliance onsuch statements. Factors that could cause actual results to differ materially from those in the forward-lookingstatements include: international, national or local economic conditions that could adversely affect the Company orits clients; losses on media purchases and production costs incurred on behalf of clients; reductions in clientspending, a slowdown in client payments and a deterioration in the credit markets; ability to attract new clients andretain existing clients in the manner anticipated; changes in client advertising, marketing and corporatecommunications requirements; failure to manage potential conflicts of interest between or among clients;unanticipated changes relating to competitive factors in the advertising, marketing and corporate communicationsindustries; ability to hire and retain key personnel; currency exchange rate fluctuations; reliance on informationtechnology systems; changes in legislation or governmental regulations affecting the Company or its clients; risksassociated with assumptions the Company makes in connection with its critical accounting estimates and legalproceedings; and the Company’s international operations, which are subject to the risks of currency repatriationrestrictions, social or political conditions and regulatory environment. The foregoing list of factors is not exhaustive.You should carefully consider the foregoing factors and the other risks and uncertainties that may affect theCompany’s business, including those described in Item 1A, “Risk Factors” and Item 7, “Management’s Discussionand Analysis of Financial Condition and Results of Operations” in this report. Except as required under applicablelaw, the Company does not assume any obligation to update these forward-looking statements.
AVAILABLE INFORMATION
We file annual, quarterly and current reports and any amendments to those reports, proxy statements andother information with the U.S. Securities and Exchange Commission, or SEC. Documents we file with the SEC areavailable free of charge on our website at http://investor.omnicomgroup.com, as soon as reasonably practicable aftersuch material is filed with the SEC. The information included on or available through our website is not part of thisor any other report we file with the SEC. Any document that we file with the SEC is available on the SEC’s websiteat www.sec.gov and also may be read and copied at the SEC’s Public Reference Room located at 100 F Street, N.E.,Washington, DC 20549. Please call the SEC at 1-800-SEC-0330 for further information regarding the operation ofthe Public Reference Room.
ii
03.68250-10K.qxp 3/31/16 6:47 PM Page ii

PART I
Introduction
This report is our 2015 annual report to shareholders and our 2015 Annual Report on Form 10-K, or 2015 10-K.
Omnicom Group Inc. is a leading global advertising, marketing and corporate communications company andthrough its branded networks and agencies provides those services to over 5,000 clients in more than 100 countries.The terms “Omnicom,” “the Company,” “we,” “our” and “us” each refer to Omnicom Group Inc. and itssubsidiaries unless the context indicates otherwise.
Item 1. Business
Our Business
Omnicom, which was formed in 1986, is a strategic holding company and a leading global provider ofadvertising, marketing and corporate communications services. We operate in a highly competitive industry andcompete against other global advertising and marketing services companies, as well as other independent companies.The proliferation of media channels, including the rapid development and integration of interactive technologies andmediums, has fragmented consumer audiences targeted by our clients. These developments make it more complexfor marketers to reach their target audiences in a cost-effective way, causing them to turn to global service providerssuch as Omnicom for a customized mix of advertising and marketing services designed to make the best use of theirtotal marketing expenditure.
Our branded networks and agencies, which operate in all major markets around the world, provide acomprehensive range of services in four fundamental disciplines: advertising, customer relationship management, orCRM, public relations and specialty communications. Although the medium used to reach a client’s target audiencemay differ across each of these disciplines, we develop and deliver the marketing message in a similar way byproviding client-specific advertising and marketing services. Services included in these four disciplines are:
Our business model was built and continues to evolve around our clients. While our networks and agenciesoperate under different names and frame their ideas in different disciplines, we organize our services around ourclients. The fundamental premise of our business is to deliver our services and allocate our resources based on thespecific requirements of our clients. As clients increase their demands for marketing effectiveness and efficiency, theyhave tended to consolidate their business with larger, multi-disciplinary agencies or integrated groups of agencies.Accordingly, our business model requires that multiple agencies within Omnicom collaborate in formal and informal
1
advertisingbrand consultancycontent marketingcorporate social responsibility consultingcrisis communicationscustom publishingdata analyticsdatabase managementdirect marketingentertainment marketingenvironmental designexperiential marketingfield marketingfinancial/corporate business-to-business advertisinggraphic arts/digital imaginghealthcare communicationsinstore design
interactive marketinginvestor relationsmarketing researchmedia planning and buyingmobile marketingmulti-cultural marketingnon-profit marketingorganizational communicationspackage designproduct placementpromotional marketingpublic affairspublic relationsreputation consultingretail marketingsearch engine marketingsocial media marketingsports and event marketing
03.68250-10K.qxp 3/31/16 6:47 PM Page 1

virtual client networks that cut across internal organizational structures to execute against our clients’ specificmarketing requirements. We believe that this organizational philosophy, and our ability to execute it, differentiates usfrom our competitors.
Our networks and agencies that comprise our virtual client networks provide us with the ability to integrateservices across all disciplines and geographies, meaning that the delivery of our services can, and does, take placeacross agencies, networks and geographic regions simultaneously. Further, we believe that our virtual network strategyfacilitates better integration of services required by the demands of the marketplace for our services. Our over-archingbusiness strategy is to continue to use our virtual networks to grow our business relationships with our clients.
The various components of our business, including revenue by discipline and geographic area, and materialfactors that affected us in 2015 are discussed in Item 7, “Management’s Discussion and Analysis of FinancialCondition and Results of Operations,” or MD&A, of this report. None of the acquisitions or dispositions,individually or in the aggregate, in the three year period ended December 31, 2015 was material to our results ofoperations or financial position. For information about our acquisitions, see Note 4 to the consolidated financialstatements.
Geographic Regions
In 2015, our United States operations represented approximately 56% of our revenue. As discussed more fullyin the Critical Accounting Policies section of the MD&A, our branded networks and agencies conduct business on aglobal basis and operate in the following geographic regions: The Americas, which includes North America and LatinAmerica; EMEA, which includes Europe, the Middle East and Africa; and, Asia Pacific, which includes Australia,China, India, Japan, Korea, New Zealand, Singapore and other Asian countries. The networks have regionalreporting units that are responsible for the agencies in their region. Agencies within the regional reporting units servesimilar clients in similar industries and in many cases the same clients and have similar economic characteristics.Accordingly, we provide financial information by geographic region in the MD&A and in Note 7 to the consolidatedfinancial statements and segment information in Note 7.
Our Clients
Our clients operate in virtually every industry sector of the global economy. In many cases, multiple agenciesor networks serve different brand and/or product groups within the same client. For example, in 2015, our largestclient, which represented 2.7% of revenue, was served by more than 250 of our agencies and our 100 largest clients,which represented approximately 52% of revenue, were each served, on average, by more than 50 of our agencies.
Our Employees
At December 31, 2015, we employed approximately 74,900 people. The skill sets of our workforce across ouragencies and within each discipline are similar. Common to all is the ability to understand a client’s brand or productand their selling proposition and to develop a unique message to communicate the value of the brand or product tothe client’s target audience. Recognizing the importance of this core competency, we have established tailoredtraining and education programs for our client service professionals around this competency. See the MD&A for adiscussion of the effect of salary and related costs on our results of operations.
Executive Officers of the Registrant
At January 27, 2016, our executive officers were:Name Position Age__________ ______________ ______
Bruce Crawford . . . . . . . . . . . . . Chairman of the Board 86John D. Wren . . . . . . . . . . . . . . . President and Chief Executive Officer 63Philip J. Angelastro . . . . . . . . . . . Executive Vice President and Chief Financial Officer 51Michael J. O’Brien . . . . . . . . . . . Senior Vice President, General Counsel and Secretary 54Dennis E. Hewitt . . . . . . . . . . . . Treasurer 71Andrew L. Castellaneta . . . . . . . . Senior Vice President, Chief Accounting Officer 57Peter L. Swiecicki . . . . . . . . . . . . Senior Vice President, Finance and Controller 57Jonathan B. Nelson . . . . . . . . . . . CEO, Omnicom Digital 48
2
03.68250-10K.qxp 3/31/16 6:47 PM Page 2
Each executive officer has held his present position for at least five years, except: Mr. Angelastro was namedExecutive Vice President and Chief Financial Officer in September 2014 and previously served as Senior VicePresident Finance and Controller from 2002 until September 2014; Mr. Castellaneta was named Senior VicePresident, Chief Accounting Officer in January 2015 and previously served as Assistant Controller from 2000 untilJanuary 2015; and, Mr. Swiecicki was named Senior Vice President, Finance and Controller in January 2015 andpreviously served as Director of Business Operations from 2013 until January 2015 and previously held variouspositions with BBDO Worldwide from 1983 until 2013.
Additional information about our directors and executive officers will appear in our definitive proxy statement,which is expected to be filed with the SEC by April 14, 2016.
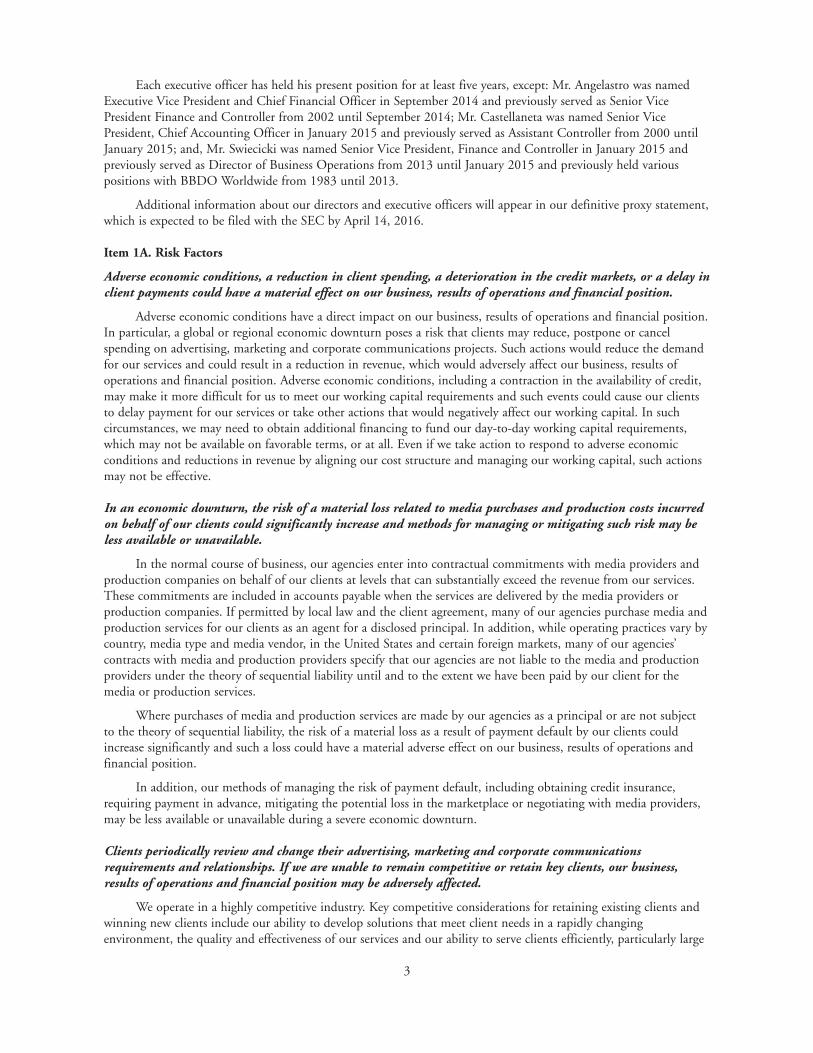
Item 1A. Risk Factors
Adverse economic conditions, a reduction in client spending, a deterioration in the credit markets, or a delay inclient payments could have a material effect on our business, results of operations and financial position.
Adverse economic conditions have a direct impact on our business, results of operations and financial position.In particular, a global or regional economic downturn poses a risk that clients may reduce, postpone or cancelspending on advertising, marketing and corporate communications projects. Such actions would reduce the demandfor our services and could result in a reduction in revenue, which would adversely affect our business, results ofoperations and financial position. Adverse economic conditions, including a contraction in the availability of credit,may make it more difficult for us to meet our working capital requirements and such events could cause our clientsto delay payment for our services or take other actions that would negatively affect our working capital. In suchcircumstances, we may need to obtain additional financing to fund our day-to-day working capital requirements,which may not be available on favorable terms, or at all. Even if we take action to respond to adverse economicconditions and reductions in revenue by aligning our cost structure and managing our working capital, such actionsmay not be effective.
In an economic downturn, the risk of a material loss related to media purchases and production costs incurredon behalf of our clients could significantly increase and methods for managing or mitigating such risk may beless available or unavailable.
In the normal course of business, our agencies enter into contractual commitments with media providers andproduction companies on behalf of our clients at levels that can substantially exceed the revenue from our services.These commitments are included in accounts payable when the services are delivered by the media providers orproduction companies. If permitted by local law and the client agreement, many of our agencies purchase media andproduction services for our clients as an agent for a disclosed principal. In addition, while operating practices vary bycountry, media type and media vendor, in the United States and certain foreign markets, many of our agencies’contracts with media and production providers specify that our agencies are not liable to the media and productionproviders under the theory of sequential liability until and to the extent we have been paid by our client for themedia or production services.
Where purchases of media and production services are made by our agencies as a principal or are not subjectto the theory of sequential liability, the risk of a material loss as a result of payment default by our clients couldincrease significantly and such a loss could have a material adverse effect on our business, results of operations andfinancial position.
In addition, our methods of managing the risk of payment default, including obtaining credit insurance,requiring payment in advance, mitigating the potential loss in the marketplace or negotiating with media providers,may be less available or unavailable during a severe economic downturn.
Clients periodically review and change their advertising, marketing and corporate communicationsrequirements and relationships. If we are unable to remain competitive or retain key clients, our business,results of operations and financial position may be adversely affected.
We operate in a highly competitive industry. Key competitive considerations for retaining existing clients andwinning new clients include our ability to develop solutions that meet client needs in a rapidly changingenvironment, the quality and effectiveness of our services and our ability to serve clients efficiently, particularly large
3
03.68250-10K.qxp 3/31/16 6:47 PM Page 3

multinational clients, on a broad geographic basis. While many of our client relationships are long-standing, fromtime to time clients put their advertising, marketing and corporate communications business up for competitivereview. We have won and lost accounts in the past as a result of these reviews. To the extent that we are not able toremain competitive or retain key clients, our revenue may be adversely affected, which could have a material adverseeffect on our business, results of operations and financial position.
The loss of several of our largest clients could have a material adverse effect on our business, results ofoperations and financial position.
In 2015, approximately 52% of our revenue came from our 100 largest clients. Clients generally are able toreduce or cancel their current or future spending on advertising, marketing and corporate communications projectsat any time on short notice for any reason. A significant reduction in spending on our services by our largest clients,or the loss of several of our largest clients, if not replaced by new clients or an increase in business from existingclients, would adversely affect our revenue and could have a material adverse effect on our business, results ofoperations and financial position.
Acquiring new clients and retaining existing clients depends on our ability to avoid and manage conflicts ofinterest arising from other client relationships, retaining key personnel and maintaining a highly skilledworkforce.
Our ability to acquire new clients and to retain existing clients may, in some cases, be limited by clients’perceptions of, or policies concerning, conflicts of interest arising from other client relationships. If we are unable tomaintain multiple agencies to manage multiple client relationships and avoid potential conflicts of interests, ourbusiness, results of operations and financial position may be adversely affected.
Our employees are our most important assets and our ability to attract and retain key personnel is animportant aspect of our competitiveness. If we are unable to attract and retain key personnel, our ability to provideour services in the manner clients have come to expect may be adversely affected, which could harm our reputationand result in a loss of clients, which could have a material adverse effect on our business, results of operations andfinancial position.
Currency exchange rate fluctuations could impact our business, results of operations and financial position.
Our international operations represent approximately 44% of our revenue. We operate in all majorinternational markets including the European Union, the United Kingdom, Australia, Brazil, Canada, China andJapan. Our agencies transact business in more than 50 different currencies. Substantially all of our foreign operationstransact business in their local currency and accordingly, their financial statements are translated into U.S. Dollars.As a result, both adverse and beneficial fluctuations in foreign exchange rates would impact our business, results ofoperations and financial position.
We rely extensively on information technology systems and cybersecurity incidents could adversely affect us.
We rely on information technology systems and infrastructure to process, store and transmit data, includingpersonally identifiable information, summarize results and manage our business, including maintaining clientadvertising and marketing information. Our information technology systems are potentially vulnerable to systemfailures and network disruptions, malicious intrusion and random attack. Likewise, data security incidents andbreaches by employees and others with or without permitted access to our systems may pose a risk that sensitive datamay be exposed to unauthorized persons or to the public. Additionally, we use third parties, including cloudproviders, to store, transmit or process data. There can be no assurance that the measures we have taken to protectour data and information technology systems will prevent system failures or network disruptions or breaches in oursystems, or in the systems of third parties we use, and such events could adversely affect our reputation or business.
Government regulation and consumer advocates may limit the scope and content of our services, which couldaffect our ability to meet our clients’ needs, which could have a material adverse effect on our business, resultsof operations and financial position.
Government agencies and consumer groups directly or indirectly affect or attempt to affect the scope, contentand manner of presentation of advertising, marketing and corporate communications services, through regulation or
4
03.68250-10K.qxp 3/31/16 6:47 PM Page 4

other governmental action, which could affect our ability to meet our clients’ needs. Such regulation may seek,among other things, to limit the tax deductibility of advertising expenditures by certain industries or for certainproducts and services. In addition, there has been a tendency on the part of businesses to resort to the judicial systemto challenge advertising practices and claims, which could cause our clients affected by such actions to reduce theirspending on our services. Any limitation or judicial action that affects our ability to meet our clients’ needs orreduces client spending on our services could have a material adverse effect on our business, results of operations andfinancial position.
Further, laws and regulations, related to user privacy, use of personal information and Internet trackingtechnologies have been proposed or enacted in the United States and certain international markets. These laws andregulations could affect the acceptance of new communications technologies and the use of current communicationstechnologies as advertising mediums. These actions could affect our business and reduce demand for certain of ourservices, which could have a material adverse effect on our business, results of operations and financial position.
As a global business we face certain risks of doing business internationally and we are exposed to risks fromoperating in high-growth markets and developing countries, which could have a material adverse effect on ourbusiness, results of operations and financial position.
We face a number of risks associated with a global business. The operational and financial performance of ourbusinesses are typically tied to global and regional economic conditions, competition for new business and talentedstaff, currency fluctuation, political conditions, regulatory environment and other risks associated with extensiveinternational operations. In addition, we conduct business in numerous high-growth markets and developingcountries which tend to have longer billing collection cycles, currency repatriation restrictions and commercial lawsthat can be undeveloped, vague, inconsistently enforced, retroactively applied or frequently changed. The risksassociated with our international operations could have a material adverse effect on our business, results of operationsand financial position. Additionally, we are subject to U.S. and international anti-corruption and anti-bribery laws,including the Foreign Corrupt Practices Act of 1977, in all jurisdictions where we operate. These laws are complexand stringent and any violation of these laws could have an adverse effect on our business and reputation. Forfinancial information by geographic region, see Note 7 to the consolidated financial statements.
We may be unsuccessful in evaluating material risks involved in completed and future acquisitions.
We regularly evaluate potential acquisitions of businesses that are complementary to our businesses and clientneeds. As part of the evaluation, we conduct business, legal and financial due diligence with the goal of identifyingand evaluating material risks involved in any particular transaction. Despite our efforts, we may be unsuccessful inascertaining or evaluating all such risks. As a result, the intended advantages of any given acquisition may not berealized. If we fail to identify certain material risks from one or more acquisitions, our business, results of operationsand financial position could be adversely affected.
Our goodwill may become impaired, which could have a material adverse effect on our business, results ofoperations and financial position.
In accordance with generally accepted accounting principles in the United States, or U.S. GAAP or GAAP, wehave recorded a significant amount of goodwill related to our acquisitions; a substantial portion of which representsthe specialized know-how of the acquired workforce. As discussed in Note 2 to the consolidated financial statements,we review the carrying value of goodwill for impairment annually at the end of the second quarter of the year andwhenever events or circumstances indicate the carrying value may not be recoverable. The estimates and assumptionsabout future results of operations and cash flows made in connection with the impairment testing could differ fromfuture actual results of operations and cash flows. While we have concluded, for each year presented in the financialstatements included in this report, that our goodwill is not impaired, future events could cause us to conclude thatthe asset values associated with a given operation may become impaired. Any resulting non-cash impairment chargecould have a material adverse effect on our business, results of operations and financial position.
5
03.68250-10K.qxp 3/31/16 6:47 PM Page 5

We could be affected by future laws or regulations enacted in response to climate change concerns and otheractions.
Generally, our businesses are not directly affected by current cap and trade laws and other regulatoryrequirements aimed at mitigating the impact of climate change by reducing emissions or otherwise; although, ourbusinesses could be in the future. However, we could be indirectly affected by increased prices for goods or servicesprovided to us by companies that are directly affected by these laws and regulations and pass their increased coststhrough to their customers. Further, if our clients are impacted by such laws or requirements, either directly orindirectly, their spending for advertising and marketing services may decline, which could adversely impact ourbusiness, results of operations and financial position. Additionally, to comply with potential future changes inenvironmental laws and regulations, we may need to incur additional costs; therefore, at this time, we cannotestimate what impact such costs may have on our business, results of operations and financial position.
Item 1B. Unresolved Staff Comments
None.
Item 2. Properties
We conduct business in offices throughout the world. We lease substantially all our office space and the facilityrequirements of our businesses are similar across geographic regions and disciplines. We believe that our facilities areadequate for our current operations and are well maintained. Our principal corporate offices are located at437 Madison Avenue, New York, New York; One East Weaver Street, Greenwich, Connecticut and 525 OkeechobeeBoulevard, West Palm Beach, Florida. We also maintain executive offices in London, England; Shanghai, China andSingapore.
We lease substantially all our office space under operating leases that expire at various dates. Lease obligationsof our foreign operations are generally denominated in their local currency. Office base rent expense in 2015, 2014and 2013 was $331.5 million, $361.9 million and $369.3 million, respectively, net of rent received from non-cancelable third-party subleases of $11.0 million, $11.2 million and $10.6 million, respectively.
Future minimum office base rent under non-cancelable operating leases, net of rent receivable from existingnon-cancelable third-party subleases, is (in millions):
Net Rent_________
2016 . . . . . . . . . . . . . . . . . . . . . . . . . . . . . . . . . . . . . . . . . . . . . . . . . . . . . . . . . . . . . . . . . . . . . . . . . . $ 276.82017 . . . . . . . . . . . . . . . . . . . . . . . . . . . . . . . . . . . . . . . . . . . . . . . . . . . . . . . . . . . . . . . . . . . . . . . . . . 207.72018 . . . . . . . . . . . . . . . . . . . . . . . . . . . . . . . . . . . . . . . . . . . . . . . . . . . . . . . . . . . . . . . . . . . . . . . . . . 169.02019 . . . . . . . . . . . . . . . . . . . . . . . . . . . . . . . . . . . . . . . . . . . . . . . . . . . . . . . . . . . . . . . . . . . . . . . . . . 145.72020 . . . . . . . . . . . . . . . . . . . . . . . . . . . . . . . . . . . . . . . . . . . . . . . . . . . . . . . . . . . . . . . . . . . . . . . . . . 122.5Thereafter . . . . . . . . . . . . . . . . . . . . . . . . . . . . . . . . . . . . . . . . . . . . . . . . . . . . . . . . . . . . . . . . . . . . . . 419.3______________
$1,341.0____________________________
See Note 14 to the consolidated financial statements for a description of our lease commitments and theMD&A for a description of the impact of leases on our operating expenses.
Item 3. Legal Proceedings
In the ordinary course of business, we are involved in various legal proceedings. We do not presently expectthat these proceedings will have a material adverse effect on our results of operations or financial position.
Item 4. Mine Safety Disclosures
Not Applicable.
6
03.68250-10K.qxp 3/31/16 6:47 PM Page 6

PART II
Item 5. Market for Registrant’s Common Equity, Related Stockholder Matters and Issuer Purchases of EquitySecurities
Our common stock is listed and traded on the New York Stock Exchange, or NYSE, under the symbol“OMC.” As of January 27, 2016, there were 2,194 registered holders of our common stock.
The quarterly high and low sales prices for our common stock reported by the NYSE and dividends paid pershare for 2015 and 2014 were:
Dividends PaidHigh Low Per Share_________ _______ __________________________
2015
First Quarter . . . . . . . . . . . . . . . . . . . . . . . . . . . . . . . . . . . . . . . . $80.98 $71.98 $0.50Second Quarter . . . . . . . . . . . . . . . . . . . . . . . . . . . . . . . . . . . . . . 79.28 69.02 0.50Third Quarter . . . . . . . . . . . . . . . . . . . . . . . . . . . . . . . . . . . . . . . 74.56 64.31 0.50Fourth Quarter . . . . . . . . . . . . . . . . . . . . . . . . . . . . . . . . . . . . . . 77.57 64.44 0.50
2014
First Quarter . . . . . . . . . . . . . . . . . . . . . . . . . . . . . . . . . . . . . . . . $76.87 $70.59 $0.40Second Quarter . . . . . . . . . . . . . . . . . . . . . . . . . . . . . . . . . . . . . . 72.84 65.43 0.50Third Quarter . . . . . . . . . . . . . . . . . . . . . . . . . . . . . . . . . . . . . . . 74.14 68.32 0.50Fourth Quarter . . . . . . . . . . . . . . . . . . . . . . . . . . . . . . . . . . . . . . 78.49 64.03 0.50
Stock repurchases during the three months ended December 31, 2015 were:Total Number ofShares Purchased Maximum Number of
Total Number Average as Part of Publicly Shares that May Yet of Shares Price Paid Announced Plans Be Purchased Under
Period Purchased Per Share or Programs the Plans or Programs___________ _______________________ _________________ ______________________________ _____________________________________
October 2015 . . . . . . . . . . . . . . . . . . . . . . . 106,826 $71.50 — —November 2015 . . . . . . . . . . . . . . . . . . . . . 4,484 72.36 — —December 2015 . . . . . . . . . . . . . . . . . . . . . 2,818,733 75.12 — —________________ ___________ ______ ______
2,930,043 $74.98 — —________________ ___________ ______ ______________________ ___________ ______ ______
During the three months ended December 31, 2015, we purchased 2,800,000 shares of our common stock inthe open market for general corporate purposes and withheld 130,043 shares from employees to satisfy estimatedstatutory income tax obligations related to restricted stock vesting and stock option exercises. The value of thecommon stock withheld was based on the closing price of our common stock on the applicable vesting or exercisedate.
There were no unregistered sales of equity securities during the three months ended December 31, 2015.
For information on securities authorized for issuance under our equity compensation plans, see Item 12,“Security Ownership of Certain Beneficial Owners and Management and Related Stockholder Matters,” whichrelevant information will be included under the caption “Equity Compensation Plans” in our definitive proxystatement, which is expected to be filed with the SEC by April 14, 2016.
7
03.68250-10K.qxp 3/31/16 6:47 PM Page 7

Item 6. Selected Financial Data
The following selected financial data should be read in conjunction with our consolidated financial statementsand related notes that begin on page F-1 of this report, as well as the MD&A.
(In millions, except per share amounts)_______________________________________________________________________________________________________________________________________For the years ended December 31: 2015 2014 2013 2012 2011_____________________ _____________________ _____________________ _____________________ _____________________
Revenue . . . . . . . . . . . . . . . . . . . . . . . . $15,134.4 $15,317.8 $14,584.5 $14,219.4 $13,872.5Operating Income . . . . . . . . . . . . . . . . 1,920.1 1,944.1 1,825.3 1,804.2 1,671.1Net Income – Omnicom Group Inc. . . 1,093.9 1,104.0 991.1 998.3 952.6Net Income Per Common Share –
Omnicom Group Inc.:Basic . . . . . . . . . . . . . . . . . . . . . . . . 4.43 4.27 3.73 3.64 3.38Diluted . . . . . . . . . . . . . . . . . . . . . . 4.41 4.24 3.71 3.61 3.33
Dividends Declared Per Common Share . . . . . . . . . . . . . . . . . 2.00 1.90 1.60 1.20 1.00
(In millions)_______________________________________________________________________________________________________________________________________At December 31: 2015 2014 2013 2012 2011_____________________ _____________________ _____________________ _____________________ _____________________
Cash and cash equivalents and short-term investments . . . . . . . . . . . . $ 2,619.7 $ 2,390.3 $ 2,728.7 $ 2,698.9 $ 1,805.0
Total Assets . . . . . . . . . . . . . . . . . . . . . . 22,110.7 21,428.4 21,980.4 21,971.4 20,323.4Long-Term Obligations:
Long-term debt . . . . . . . . . . . . . . . . 3,564.2 4,542.1 3,763.3 3,768.8 2,510.6Convertible debt . . . . . . . . . . . . . . . — — 252.7 659.4 659.4
Long-term liabilities . . . . . . . . . . . . . . . 800.5 774.3 685.1 739.9 602.0Total Shareholders’ Equity . . . . . . . . . . 2,452.4 2,850.0 3,582.4 3,460.8 3,504.3
In 2014 and 2013, we incurred $8.8 million and $41.4 million, respectively, of expenses in connection withthe proposed merger with Publicis Groupe S.A., or Publicis, which were primarily comprised of professional fees.On May 8, 2014, the proposed merger was terminated. Excluding the effect of the merger expenses from both years,Operating Income, Net Income – Omnicom Group Inc. and Diluted Net Income per Common Share – OmnicomGroup Inc. for the years ended December 31, 2014 and 2013 were $1,952.9 million, $1,101.4 million and$4.23 and $1,866.7 million, $1,026.0 million and $3.84, respectively.
As described in Note 2 to the consolidated financial statements, on December 31, 2015, we adopted FASBAccounting Standards Update, or ASU, 2015-03, and FASB ASU 2015-17. As a result, total assets and long-termdebt for 2014, 2013, 2012 and 2011 have been adjusted to reflect the retrospective adoption of ASU 2015-03 andASU 2015-17. The adoption of ASU 2015-03 and ASU 2015-17 did not have any effect on results of operations ortotal shareholders’ equity.
Item 7. Management’s Discussion and Analysis of Financial Condition and Results of Operations
EXECUTIVE SUMMARY
We are a strategic holding company providing advertising, marketing and corporate communications servicesto clients through our branded networks and agencies around the world. On a global, pan-regional and local basis,our networks and agencies provide a comprehensive range of services in four fundamental disciplines: advertising,CRM, public relations and specialty communications. Our business model was built and continues to evolve aroundour clients. While our networks and agencies operate under different names and frame their ideas in differentdisciplines, we organize our services around our clients. The fundamental premise of our business is that our clients’specific requirements should be the central focus in how we deliver our services and allocate our resources. Thisclient-centric business model requires that multiple agencies collaborate in formal and informal virtual networks thatcut across internal organizational structures to deliver consistent brand messages for a specific client and executeagainst each of our clients’ specific marketing requirements. We continually seek to grow our business with ourexisting clients by maintaining our client-centric approach, as well as expanding our existing business relationships
8
03.68250-10K.qxp 3/31/16 6:47 PM Page 8

into new markets and with new clients. In addition, we pursue selective acquisitions of complementary companieswith strong entrepreneurial management teams that typically currently serve or have the ability to serve our existingclient base.
As a leading global advertising, marketing and corporate communications company, we operate in all majormarkets and have a large and diverse client base. In 2015, our largest client accounted for 2.7% of our revenue andour 100 largest clients accounted for approximately 52% of our revenue. Our business is spread across a significantnumber of industry sectors with no one industry comprising more than 13% of our revenue in 2015. Although ourrevenue is generally balanced between the United States and international markets and we have a large and diverseclient base, we are not immune to general economic downturns.
As described in more detail below, in 2015 our revenue decreased $183.4 million, or 1.2%, compared to 2014.Beginning in the fourth quarter of 2014 and continuing throughout 2015, substantially all foreign currenciesweakened against the U.S. Dollar. Changes in foreign exchange rates reduced revenue by $1.0 billion or 6.6%,acquisitions, net of dispositions increased revenue $14.6 million or 0.1% and organic growth increased revenue$810.8 million or 5.3%.
Global economic conditions have a direct impact on our business and financial performance. In particular, acontraction in global or regional economic conditions poses a risk that our clients may reduce, postpone or cancelspending on advertising, marketing and corporate communications services which would reduce the demand for ourservices. In 2015, the United States experienced modest economic growth and the major economies of Asiacontinued their moderate expansion. Economic conditions in the Euro Zone remain unsettled and economicconditions in Brazil continued a downward trend that began in the second quarter of 2015. The economic and fiscalissues facing certain countries in the Euro Zone continue to cause economic uncertainty in that market; however, theimpact on our business varies by country. We will continue to monitor economic conditions closely, as well as clientrevenue levels and other factors and, in response to reductions in our client revenue, if necessary, we will take actionsavailable to us to align our cost structure and manage our working capital. There can be no assurance whether, or towhat extent, our efforts to mitigate any impact of future adverse economic conditions, reductions in client revenue,changes in client creditworthiness and other developments will be effective.
Certain business trends have had a positive impact on our business and industry. These trends include clientsincreasingly expanding the focus of their brand strategies from national markets to pan-regional and global marketsand integrating traditional and non-traditional marketing channels, as well as utilizing new communicationstechnologies and emerging digital platforms. Additionally, in an effort to gain greater efficiency and effectivenessfrom their total marketing expenditures, clients continue to require greater coordination of marketing activities. Webelieve these trends have benefited our business in the past and over the medium and long term will continue toprovide a competitive advantage to us.
In the near term, barring unforeseen events and excluding the impact of changes in foreign exchange rates, as aresult of continued improvement in operating performance by many of our agencies and new business activities, weexpect our 2016 revenue to increase modestly in excess of the weighted average nominal GDP growth in our majormarkets. We expect to continue to identify acquisition opportunities intended to build upon the core capabilities ofour strategic business platforms, expand our operations in the emerging markets and enhance our capabilities toleverage new technologies that are being used by marketers today.
Given our size and breadth, we manage our business by monitoring several financial indicators. The keyindicators that we focus on are revenue and operating expenses. We analyze revenue growth by reviewing thecomponents and mix of the growth, including growth by principal regional market, growth by marketing discipline,impact from foreign currency fluctuations, growth from acquisitions and growth from our largest clients.
In 2015, our revenue decreased 1.2% compared to 2014. Changes in foreign exchange rates reduced revenue6.6%, acquisitions, net of dispositions increased revenue 0.1% and organic growth increased revenue 5.3%. Acrossour principal regional markets, the changes in revenue were: North America increased 4.1%, Europe decreased 9.3%,Latin America decreased 25% and Asia Pacific decreased 2%. In North America, moderate growth in the UnitedStates and Canada was partially offset by the weakening of the Canadian Dollar against the U.S. Dollar. In Europe,growth in the U.K., Germany and Spain was offset by the weakening of all major European currencies against theU.S. Dollar and negative performance in The Netherlands and France. The decrease in revenue in Latin America wasa result of the weakening of all currencies in the region and negative performance in Chile and Brazil, which offset
9
03.68250-10K.qxp 3/31/16 6:47 PM Page 9

strong growth in Mexico. In Brazil, the decline resulted from a difficult comparison to the prior year period, whichincluded additional client spending related to the World Cup primarily in the second quarter of 2014 and a recentdecline in economic conditions. In Asia Pacific, strong growth in the major economies in the region was offset by theweakening of the currencies in the region. The change in revenue in 2015 compared to 2014, including the negativeimpact of currency changes, in our four fundamental disciplines was: advertising increased 1.8%, CRM decreased5.6%, public relations decreased 2.3% and specialty communications increased 0.8%.
We measure operating expenses in two distinct cost categories: salary and service costs and office and generalexpenses. Salary and service costs consist of employee compensation, including freelance labor, and related costs anddirect service costs. Office and general expenses consist of rent and occupancy costs, technology costs, depreciationand amortization and other overhead expenses. Each of our agencies requires professionals with the skill sets that arecommon across our disciplines. At the core of the skill sets is the ability to understand a client’s brand or productand its selling proposition and the ability to develop a unique message to communicate the value of the brand orproduct to the client’s target audience. The facility requirements of our agencies are similar across geographic regionsand disciplines, and their technology requirements are generally limited to personal computers, servers and off-the-shelf software.
Similar to revenue, operating expenses decreased in 2015 compared to 2014 as a result of the weakening ofsubstantially all foreign currencies against the U.S. Dollar. Salary and service costs, which normally tend to fluctuatewith changes in revenue, increased $11.9 million, or 0.1%, in 2015 compared to 2014, primarily reflectingincreases related to changes in the mix of our business during the period. Office and general expenses, which are lessdirectly linked to changes in revenue than salary and service costs, decreased $171.3 million, or 8.5%, in 2015compared to 2014.
Operating margins and earnings before interest, taxes and amortization of intangible assets, or EBITA, marginswere unchanged year-over-year at 12.7% and 13.4%, respectively.
Net interest expense for 2015 increased $7.4 million to $141.5 million from $134.1 million in 2014. Interestexpense increased $3.9 million to $181.1 million in 2015, primarily resulting from the interest expense on the$750 million principal amount of the 3.65% Senior Notes due 2024, or 2024 Notes, issued in October 2014,partially offset by the benefit of the interest rate swaps on the 3.625% Senior Notes due 2022, or 2022 Notes, andthe 4.45% Senior Notes due 2020, or 2020 Notes. Interest income decreased $3.5 million to $39.6 million in 2015resulting from lower interest earned on cash balances in our international treasury centers and the negative impact ofchanges in foreign exchange rates.
Our effective tax rate was unchanged at 32.8%. Income tax expense for 2014 reflects the recognition of anincome tax benefit of approximately $11 million, related to expenses incurred in prior periods in connection withthe proposed merger with Publicis, which was terminated on May 8, 2014. Prior to the termination of the merger,the majority of the merger costs, which were incurred in 2013, were capitalized for income tax purposes and therelated tax benefits were not recorded. Because the proposed merger was terminated, the merger costs were no longerrequired to be capitalized for income tax purposes. Excluding the income tax effect of the merger expenses, incometax expense for 2014 would have been $604.5 million.The decrease in the effective tax rate in 2015 from theeffective tax rate in 2014, excluding the income tax benefit related to the proposed merger, is primarily due to a legalentity restructuring of our European operations. As a result of the reorganization, a certain portion of the foreignearnings in the affected countries is subject to lower effective tax rates.
Net income – Omnicom Group Inc. for 2015 decreased $10.1 million, or 0.9%, to $1,093.9 million from$1,104.0 million in 2014. The year-over-year decrease is due to the factors described above. Diluted net income percommon share – Omnicom Group Inc. increased 4.0% to $4.41 in 2015, compared to $4.24 in 2014 due to thefactors described above, as well as the impact of the reduction in our weighted average common shares outstandingresulting from repurchases of our common stock, net of shares issued for stock option exercises and shares issuedunder our employee stock purchase plan.
CRITICAL ACCOUNTING POLICIES
The following summary of our critical accounting policies provides a better understanding of our financialstatements and the related discussion in this MD&A. We believe that the following policies may involve a higherdegree of judgment and complexity in their application than most of our accounting policies and represent the
10
03.68250-10K.qxp 3/31/16 6:47 PM Page 10

critical accounting policies used in the preparation of our financial statements. Readers are encouraged to considerthis summary together with our financial statements and the related notes, including Note 2, Significant AccountingPolicies, for a more complete understanding of the critical accounting policies discussed below.
Estimates
Our financial statements are prepared in conformity with U.S. GAAP and require us to make estimates andassumptions that affect the reported amounts of assets, liabilities, revenue and expenses in the consolidated financialstatements and accompanying notes. We use a fair value approach in testing goodwill for impairment and whenevaluating our equity method and cost method investments to determine if an other-than-temporary impairment hasoccurred. Actual results could differ from those estimates and assumptions.
Acquisitions and Goodwill
We have made and expect to continue to make selective acquisitions. The valuation of potential acquisitions isbased on various factors, including specialized know-how, reputation, geographic coverage, competitive position andservice offerings of the target businesses, as well as our experience and judgment.
Business combinations are accounted for using the acquisition method. The assets acquired, includingidentified intangible assets, liabilities assumed and any noncontrolling interest in the acquired business are recordedat their acquisition date fair values. In circumstances where control is obtained and less than 100% of a business isacquired, goodwill is recorded as if 100% were acquired. Acquisition-related costs, including advisory, legal,accounting, valuation and other costs are expensed as incurred. Certain acquisitions include an initial payment atclosing and provide for future additional contingent purchase price payments (earn-outs), which are recorded as aliability at the acquisition date fair value. Subsequent changes in the fair value of the liability are recorded in resultsof operations. The results of operations of acquired businesses are included in results of operations from theacquisition date. In 2015, we completed 8 acquisitions of new subsidiaries.
Our acquisition strategy is focused on acquiring the expertise of an assembled workforce in order to continueto build upon the core capabilities of our various strategic business platforms and agency brands through theexpansion of their geographic reach or their service capabilities to better serve our clients. Additional key factors weconsider include the competitive position and specialized know-how of the acquisition targets. Accordingly, as istypical in most service businesses, a substantial portion of the intangible asset value we acquire is the know-how ofthe people, which is treated as part of goodwill and is not valued separately. For each acquisition, we undertake adetailed review to identify other intangible assets and a valuation is performed for all such identified assets. Asignificant portion of the identifiable intangible assets acquired is derived from customer relationships, including therelated customer contracts, as well as trade names. In valuing these identified intangible assets, we typically use anincome approach and consider comparable market participant measurements.
We evaluate goodwill for impairment at least annually at the end of the second quarter of the year andwhenever events or circumstances indicate the carrying value may not be recoverable. We identified our regionalreporting units as components of our operating segments, which are our five agency networks. The regionalreporting units of each agency network are responsible for the agencies in their region. They report to the segmentmanagers and facilitate the administrative and logistical requirements of our client-centric strategy for deliveringservices to clients in their regions. We have concluded that for each of our operating segments, their regionalreporting units have similar economic characteristics and should be aggregated for purposes of testing goodwill forimpairment at the operating segment level. Our conclusion was based on a detailed analysis of the aggregationcriteria set forth in FASB ASC Topic 280, Segment Reporting, and the guidance set forth in FASB ASC Topic 350,Intangibles – Goodwill and Other. Consistent with our fundamental business strategy, the agencies within ourregional reporting units serve similar clients in similar industries, and in many cases the same clients. In addition, theagencies within our regional reporting units have similar economic characteristics. The main economic componentsof each agency are employee compensation and related costs and direct service costs and office and general costs,which include rent and occupancy costs, technology costs that are generally limited to personal computers, serversand off-the-shelf software and other overhead expenses. Finally, the expected benefits of our acquisitions are typicallyshared by multiple agencies in various regions as they work together to integrate the acquired agency into our clientservice strategy.
11
03.68250-10K.qxp 3/31/16 6:47 PM Page 11

Goodwill Impairment Review – Estimates and Assumptions
We use the following valuation methodologies to determine the fair value of our reporting units: (1) theincome approach, which utilizes discounted expected future cash flows, (2) comparative market participant multiplesfor EBITDA (earnings before interest, taxes, depreciation and amortization) and (3) when available, consideration ofrecent and similar acquisition transactions.
In applying the income approach, we use estimates to derive the discounted expected cash flows (“DCF”) foreach reporting unit that serves as the basis of our valuation. These estimates and assumptions include revenue growthand operating margin, EBITDA, tax rates, capital expenditures, weighted average cost of capital and related discountrates and expected long-term cash flow growth rates. All of these estimates and assumptions are affected byconditions specific to our businesses, economic conditions related to the industry we operate in, as well as conditionsin the global economy. The assumptions that have the most significant effect on our valuations derived using a DCFmethodology are: (1) the expected long-term growth rate of our reporting units’ cash flows and (2) the weightedaverage cost of capital (“WACC”).
The assumptions used for the long-term growth rate and WACC in our evaluations as of June 30, 2015 and2014 were:
June 30,_________________________________________________________________________2015 2014________________ ________________
Long-Term Growth Rate . . . . . . . . . . . . . . . . . . . . . . . . . . . . . . . . . . . . . 4% 4%WACC . . . . . . . . . . . . . . . . . . . . . . . . . . . . . . . . . . . . . . . . . . . . . . . . . . . 10.1% – 10.7% 9.9% – 10.6%
Long-term growth rate represents our estimate of the long-term growth rate for our industry and the marketsof the global economy we operate in. For the past ten years, the average historical revenue growth rate of ourreporting units and the Average Nominal GDP growth of the countries comprising the major markets that accountfor substantially all of our revenue was approximately 4.8% and 4.0%, respectively. We considered this historywhen determining the long-term growth rates used in our annual impairment test at June 30, 2015. We believemarketing expenditures over the long term have a high correlation to GDP. We also believe based on our historicalperformance, that our long-term growth rate will exceed Average Nominal GDP growth in the markets weoperate in. For our annual test as of June 30, 2015, we used an estimated long-term growth rate of 4% for ourreporting units.
When performing the annual impairment test as of June 30, 2015 and estimating the future cash flows of ourreporting units, we considered the current macroeconomic environment, as well as industry and market specificconditions at mid-year 2015. In the first half of 2015, we experienced an increase in our revenue of 5.2%, whichexcludes growth from acquisitions and the impact from changes in foreign exchange rates. Economic conditions inthe Euro Zone are unsettled and the continuing fiscal issues faced by many countries in the European Union hascaused economic difficulty in certain of our Euro Zone markets. During 2015, weakness in most Latin Americaneconomies we operate in has the potential to affect our near-term performance in that region. We considered theeffect of these conditions in our annual impairment test.
The WACC is comprised of: (1) a risk-free rate of return, (2) a business risk index ascribed to us and tocompanies in our industry comparable to our reporting units based on a market derived variable that measures thevolatility of the share price of equity securities relative to the volatility of the overall equity market, (3) an equity riskpremium that is based on the rate of return on equity of publicly traded companies with business characteristicscomparable to our reporting units and (4) a current after-tax market rate of return on debt of companies withbusiness characteristics similar to our reporting units, each weighted by the relative market value percentages of ourequity and debt.
Our five reporting units vary in size with respect to revenue and the amount of debt allocated to them. Thesedifferences drive variations in fair value among our reporting units. In addition, these differences as well asdifferences in book value, including goodwill, cause variations in the amount by which fair value exceeds book valueamong the reporting units. The reporting unit goodwill balances and debt vary by reporting unit primarily becauseour three legacy agency networks were acquired at the formation of Omnicom and were accounted for as a poolingof interests that did not result in any additional debt or goodwill being recorded. The remaining two agencynetworks were built through a combination of internal growth and acquisitions that were accounted for using theacquisition method and as a result, they have a relatively higher amount of goodwill and debt.
12
03.68250-10K.qxp 3/31/16 6:47 PM Page 12

Goodwill Impairment Review – Conclusion
Under U.S. GAAP, we have the option of either assessing qualitative factors to determine whether it is more-likely-than-not that the carrying value of our reporting units exceeds their respective fair value or proceeding directlyto Step 1 of the goodwill impairment test. Although not required, we performed Step 1 of the annual impairmenttest and compared the fair value of each of our reporting units to its respective carrying value, including goodwill.Based on the results of our impairment test, we concluded that our goodwill at June 30, 2015 was not impaired,because the fair value of each of our reporting units was substantially in excess of its respective net book value. Theminimum decline in fair value that one of our reporting units would need to experience in order to fail Step 1 of thegoodwill impairment test was approximately 74%. Notwithstanding our belief that the assumptions we used forWACC and long-term growth rate in our impairment testing are reasonable, we performed a sensitivity analysis foreach of our reporting units. The results of this sensitivity analysis on our impairment test as of June 30, 2015revealed that if the WACC increased by 1% and/or the long-term growth rate decreased by 1%, the fair value of eachof our reporting units would continue to be substantially in excess of its respective net book value and would passStep 1 of the impairment test.
We will continue to perform our impairment test at the end of the second quarter of each year unless events orcircumstances trigger the need for an interim impairment test. The estimates used in our goodwill impairment testdo not constitute forecasts or projections of future results of operations, but rather are estimates and assumptionsbased on historical results and assessments of macroeconomic factors affecting our reporting units as of the valuationdate. We believe that our estimates and assumptions are reasonable, but they are subject to change from period toperiod. Actual results of operations and other factors will likely differ from the estimates used in our discounted cashflow valuation and it is possible that differences could be material. A change in the estimates we use could result in adecline in the estimated fair value of one or more of our reporting units from the amounts derived as of our latestvaluation and could cause us to fail Step 1 of our goodwill impairment test if the estimated fair value for thereporting unit is less than the carrying value of the net assets of the reporting unit, including its goodwill. A largedecline in estimated fair value of a reporting unit could result in a non-cash impairment charge and may have anadverse effect on our results of operations and financial position.
Subsequent to the annual impairment test at June 30, 2015, there were no events or circumstances thattriggered the need for an interim impairment test. Additional information about acquisitions and goodwill appears inNotes 2, 4 and 5 to the consolidated financial statements.
Revenue Recognition
We recognize revenue in accordance with FASB ASC Topic 605, Revenue Recognition, and applicable SEC StaffAccounting Bulletins. Substantially all of our revenue is derived from fees for services based on a rate per hour orequivalent basis. Revenue is realized when the service is performed in accordance with the client arrangement andupon the completion of the earnings process. Prior to recognizing revenue, persuasive evidence of an arrangementmust exist, the sales price must be fixed or determinable, delivery, performance and acceptance must be inaccordance with the client arrangement and collection must be reasonably assured. These principles are thefoundation of our revenue recognition policy and apply to all client arrangements in each of our service disciplines:advertising, CRM, public relations and specialty communications. Certain of our businesses earn a portion of theirrevenue as commissions based upon performance in accordance with client arrangements. Because the services thatwe provide across each of our disciplines are similar and delivered to clients in similar ways, all of the key elements inrevenue recognition apply to client arrangements in each of our four disciplines.
In the majority of our businesses, we act as an agent and record revenue equal to the net amount retainedwhen the fee or commission is earned. Although, in certain markets, we may bear credit risk with respect to theseactivities, the arrangements with our clients are such that we act as an agent on their behalf. In these cases, costsincurred with third-party suppliers are excluded from our revenue. In certain arrangements, we act as principal andwe contract directly with third-party suppliers and media providers and production companies and we are theprimary obligor. In these circumstances, revenue is recorded at the gross amount billed since revenue has been earnedfor the sale of goods or services.
13
03.68250-10K.qxp 3/31/16 6:47 PM Page 13

Some of our client arrangements include performance incentive provisions designed to link a portion of ourrevenue to our performance relative to quantitative and qualitative goals. We recognize performance incentives inrevenue when the specific quantitative goals are achieved, or when our performance against qualitative goals isdetermined by the client. We may receive rebates or credits from certain vendors based on transactions entered intoon behalf of clients. These rebates or credits are remitted to the clients or retained by us based on the terms of theclient contract or local law. Amounts passed on to clients are recorded as a liability and amounts retained by us arerecorded as revenue when earned.
In May 2014, the FASB issued FASB ASU 2014-09, Revenue from Contracts with Customers, or ASU 2014-09,which will replace all existing revenue recognition guidance under U.S. GAAP. On July 9, 2015, the FASB approveda one year deferral of the effective date of ASU 2014-09 to all annual and interim periods beginning after December15, 2017, with early application permitted only for annual and interim periods beginning after December 31, 2016.ASU 2014-09 provides for one of two methods of transition: retrospective application to each prior period presented;or, recognition of the cumulative effect of retrospective application of the new standard as of the beginning of theperiod of initial application. Presently, we are not yet in a position to conclude on the application date or thetransition method we will choose. While our implementation effort is ongoing, based on our initial assessment theimpact of the application of the new standard will likely result in a change in the timing of our revenue recognitionfor performance incentives received from clients and the recognition of certain reimbursable out-of-pocket costs asrevenue. Performance incentives are currently recognized in revenue when specific quantitative goals are achieved, orwhen our performance against qualitative goals is determined by the client. Under the new standard, we will berequired to estimate the amount of the incentive that will be earned at the inception of the contract and recognizethe incentive over the term of the contract. While performance incentives are not material to our revenue, this willresult in an acceleration in revenue recognition for certain contract incentives compared to the current method.Certain incidental costs that are reimbursed by our clients and are currently required to be recorded in revenue willlikely not be recorded as revenue under the new standard. We expect this will result in less revenue and related costrecorded in our results of operations. While, we have not yet completed our assessment, we do not expect thischange to have a material impact to our revenue and it will not result in any change to operating income.
Additional information about our revenue recognition policy appears in Note 2 to the consolidated financialstatements.
Share-Based Compensation
The majority of our incentive based share awards represent restricted stock awards and performance restrictedstock awards, or PRSUs. Share-based compensation for these awards is determined and fixed on the grant date usingthe closing price of our common stock and we assume that substantially all the PRSUs will vest.
Share-based compensation expense of $99.4 million, $93.5 million and $86.3 million, in 2015, 2014 and2013, respectively, was primarily attributed to restricted stock awards. Information about our specific awards andstock plans can be found in Note 9 to the consolidated financial statements.
NEW ACCOUNTING STANDARDS
See Note 2 to the consolidated financial statements for a description of accounting standards that wereadopted in 2015 and our significant accounting policies and Note 20 for a discussion of accounting standards notyet implemented.
14
03.68250-10K.qxp 3/31/16 6:47 PM Page 14

RESULTS OF OPERATIONS – 2015 Compared to 2014 (in millions):2015 2014__________ __________
Revenue . . . . . . . . . . . . . . . . . . . . . . . . . . . . . . . . . . . . . . . . . . . . . . . . . . . . . . $15,134.4 $15,317.8Operating Expenses:
Salary and service costs . . . . . . . . . . . . . . . . . . . . . . . . . . . . . . . . . . . . . . . . 11,361.9 11,350.0Office and general expenses . . . . . . . . . . . . . . . . . . . . . . . . . . . . . . . . . . . . 1,852.4 2,023.7________________ ________________
Total Operating Expenses . . . . . . . . . . . . . . . . . . . . . . . . . . . . . . . . . . . . . . . . 13,214.3 13,373.7Add back: Amortization of intangible assets . . . . . . . . . . . . . . . . . . . . . . . . . . 109.3 107.1________________ ________________
13,105.0 13,266.6________________ ________________Earnings before interest, taxes and amortization of
intangible assets (“EBITA”) . . . . . . . . . . . . . . . . . . . . . . . . . . . . . . . . . . . . 2,029.4 2,051.2EBITA Margin – % . . . . . . . . . . . . . . . . . . . . . . . . . . . . . . . . . . . . . . . . . . . . . 13.4% 13.4%Deduct: Amortization of intangible assets . . . . . . . . . . . . . . . . . . . . . . . . . . . . 109.3 107.1________________ ________________Operating Income . . . . . . . . . . . . . . . . . . . . . . . . . . . . . . . . . . . . . . . . . . . . . . 1,920.1 1,944.1Operating Margin – % . . . . . . . . . . . . . . . . . . . . . . . . . . . . . . . . . . . . . . . . . . 12.7% 12.7%Interest Expense . . . . . . . . . . . . . . . . . . . . . . . . . . . . . . . . . . . . . . . . . . . . . . . 181.1 177.2Interest Income . . . . . . . . . . . . . . . . . . . . . . . . . . . . . . . . . . . . . . . . . . . . . . . . 39.6 43.1________________ ________________Income Before Income Taxes and Income From
Equity Method Investments . . . . . . . . . . . . . . . . . . . . . . . . . . . . . . . . . . . . 1,778.6 1,810.0Income Tax Expense . . . . . . . . . . . . . . . . . . . . . . . . . . . . . . . . . . . . . . . . . . . . 583.6 593.1Income From Equity Method Investments . . . . . . . . . . . . . . . . . . . . . . . . . . . 8.4 16.2________________ ________________Net Income . . . . . . . . . . . . . . . . . . . . . . . . . . . . . . . . . . . . . . . . . . . . . . . . . . . 1,203.4 1,233.1Net Income Attributed To Noncontrolling Interests . . . . . . . . . . . . . . . . . . . . 109.5 129.1________________ ________________Net Income – Omnicom Group Inc. . . . . . . . . . . . . . . . . . . . . . . . . . . . . . . . $ 1,093.9 $ 1,104.0________________ ________________________________ ________________
EBITA, which we define as earnings before interest, taxes and amortization of intangible assets, and EBITAMargin, which we define as EBITA divided by Revenue, are Non-GAAP financial measures. We use EBITA andEBITA Margin as additional operating performance measures, which exclude the non-cash amortization expense ofacquired intangible assets. The table above reconciles EBITA and EBITA Margin to the U.S. GAAP financialmeasure of Operating Income for the periods presented. We believe that EBITA and EBITA Margin are usefulmeasures to evaluate the performance of our businesses. Non-GAAP financial measures should not be considered inisolation from or as a substitute for financial information presented in compliance with U.S. GAAP. Non-GAAPfinancial measures reported by us may not be comparable to similarly titled amounts reported by other companies.
Revenue
In 2015, revenue decreased $183.4 million, or 1.2%, to $15,134.4 million from $15,317.8 million in 2014.Changes in foreign exchange rates reduced revenue $1.0 billion, acquisitions net of dispositions increased revenue$14.6 million and organic growth increased revenue $810.8 million.
The components of 2015 revenue change in the United States (“Domestic”) and the remainder of the world(“International”) were (in millions):
Total Domestic International________________________________________ _______________________________________ ________________________________________$ % $ % $ %___________________ ______________ __________________ ______________ __________________ ______________
December 31, 2014 . . . . . . . . . . . . . . . . . . $15,317.8 $8,185.9 $7,131.9Components of revenue change:
Foreign exchange impact . . . . . . . . . . . (1,008.8) (6.6)% — —% (1,008.8) (14.1)%Acquisitions, net of dispositions . . . . . . 14.6 0.1% (37.0) (0.5)% 51.6 0.7%Organic growth . . . . . . . . . . . . . . . . . . 810.8 5.3% 377.8 4.6% 433.0 6.1%________________ ______________ ______________
December 31, 2015 . . . . . . . . . . . . . . . . . . $15,134.4 (1.2)% $8,526.7 4.2% $6,607.7 (7.4)%________________ ______________ ______________________________ ______________ ______________
15
03.68250-10K.qxp 3/31/16 6:47 PM Page 15

The components and percentages are calculated as follows:
• The foreign exchange impact is calculated by translating the current period’s local currency revenueusing the prior period average exchange rates to derive current period constant currency revenue (in thiscase $16,143.2 million for the Total column). The foreign exchange impact is the difference betweenthe current period revenue in U.S. Dollars and the current period constant currency revenue($15,134.4 million less $16,143.2 million for the Total column).
• Acquisitions, net of dispositions is calculated by aggregating the prior period revenue of the acquiredbusinesses, less the prior period revenue of any business that was disposed of in the current period.
• Organic growth is calculated by subtracting both the foreign exchange and acquisition components fromtotal revenue growth.
• The percentage change is calculated by dividing the individual component amount by the prior periodrevenue base of that component ($15,317.8 million for the Total column).
For the year ended December 31, 2015, changes in foreign exchange rates reduced revenue by 6.6%, or$1.0 billion, compared to 2014. Substantially all currencies have weakened against the U.S. Dollar, with the mostsignificant impacts resulting from the weakening of the Euro and British Pound, as well as the Australian Dollar,Brazilian Real, Canadian Dollar and Russian Ruble.
Our results of operations are subject to risk from the translation to U.S. Dollars of the revenue and expenses ofour foreign operations, which are generally denominated in their local currency. However, for the most part, becausethe revenue and expenses of our foreign operations are denominated in the same currency, the economic impact onoperating margin is minimized. Assuming exchange rates at February 8, 2016 remain unchanged, we expect theimpact of changes in foreign exchange rates to reduce 2016 revenue by approximately 2.0%.
Revenue for 2015 and the percentage change in revenue and organic growth from 2014 in our principalregional markets were (in millions):
% Organic $ % Change Growth__________ _________ _________
Americas:North America . . . . . . . . . . . . . . . . . . . . . . . . . . . . . . . . . . . . . . . . $ 9,029.2 4.1% 5.4%Latin America . . . . . . . . . . . . . . . . . . . . . . . . . . . . . . . . . . . . . . . . . 329.8 (25.0)% (3.3)%
EMEA:Europe . . . . . . . . . . . . . . . . . . . . . . . . . . . . . . . . . . . . . . . . . . . . . . 3,942.9 (9.3)% 4.9%Middle East and Africa . . . . . . . . . . . . . . . . . . . . . . . . . . . . . . . . . . 260.6 1.7% 6.8%
Asia Pacific . . . . . . . . . . . . . . . . . . . . . . . . . . . . . . . . . . . . . . . . . . . . . . 1,571.9 (2.0)% 7.9%________________$15,134.4 (1.2)% 5.3%________________________________
Europe comprises the U.K. and the Euro currency countries, and other European countries that have notadopted the European Union Monetary standard. In 2015, the percentage of revenue attributed to the U.K. and tothe Euro currency and other European countries was 10.0% and 16.1%, respectively. In 2015, revenue increased0.2% in the U.K. and revenue decreased 14.3% in the Euro currency and other European countries.
In North America, moderate growth in the United States and Canada was partially offset by the weakening ofthe Canadian Dollar against the U.S. Dollar. In Europe, growth in the U.K., Germany and Spain was offset by theweakening of all major European currencies against the U.S. Dollar and negative performance in The Netherlandsand France. The decrease in revenue in Latin America was a result of the weakening of all currencies in the regionand negative performance in Chile and Brazil, which offset strong growth in Mexico. In Brazil, the decline resultedfrom a difficult comparison to the prior year period, which included additional client spending related to the WorldCup primarily in the second quarter of 2014, and a recent decline in economic conditions. In Asia Pacific, stronggrowth in the major economies in the region was offset by the weakening of the currencies in the region.
In the normal course of business, our agencies both gain and lose business from clients each year due to avariety of factors. The net change in 2015 was an overall gain in new business. Under our client-centric approach, weseek to broaden our relationships with all of our clients. Our largest client represented 2.7% and 2.6% of revenue in2015 and 2014, respectively. Our ten largest and 100 largest clients represented 17.9% and 52.3% of revenue in2015, respectively and 18.1% and 50.4% of revenue in 2014, respectively.
16
03.68250-10K.qxp 3/31/16 6:47 PM Page 16

Driven by our clients’ continuous demand for more effective and efficient marketing activities, we strive toprovide an extensive range of advertising, marketing and corporate communications services through various client-centric networks that are organized to meet specific client objectives. These services include advertising, brandconsultancy, content marketing, corporate social responsibility consulting, crisis communications, custom publishing,data analytics, database management, direct marketing, entertainment marketing, environmental design, experientialmarketing, field marketing, financial/corporate business-to-business advertising, graphic arts/digital imaging,healthcare communications, instore design, interactive marketing, investor relations, marketing research, mediaplanning and buying, mobile marketing, multi-cultural marketing, non-profit marketing, organizationalcommunications, outsource sales support, package design, product placement, promotional marketing, public affairs,public relations, reputation consulting, retail marketing, search engine marketing, social media marketing and sportsand event marketing. In an effort to monitor the changing needs of our clients and to further expand the scope ofour services to key clients, we monitor revenue across a broad range of disciplines and group them into the followingfour categories: advertising, CRM, public relations and specialty communications.
Revenue for 2015 and 2014 and the percentage change in revenue and organic growth from 2014 bydiscipline were (in millions):
Year Ended December 31,_________________________________________________________________________________2015 2014 2015 vs. 2014________________________________________ ________________________________________ ____________________________________________________________________
% of % of $ % % Organic $ Revenue $ Revenue Change Change Growth____________________ ________________ ____________________ ________________ ___________________ ____________________ ____________________
Advertising . . . . . . . . . . . . . . . . $ 7,730.2 51.1% $ 7,593.5 49.6% $ 136.7 1.8% 9.3%CRM . . . . . . . . . . . . . . . . . . . . 4,958.2 32.7% 5,254.4 34.3% (296.2) (5.6)% 1.9%Public relations . . . . . . . . . . . . . 1,361.0 9.0% 1,393.7 9.1% (32.7) (2.3)% (1.4)%Specialty communications . . . . 1,085.0 7.2% 1,076.2 7.0% 8.8 0.8% 2.2%________________ ________________ ____________
$15,134.4 $15,317.8 $(183.4) (1.2)% 5.3%________________ ________________ ____________________________ ________________ ____________
We operate in a number of industry sectors. The percentage of revenue by industry sector for 2015 and 2014 was:2015 2014_______________ _______________
Food and Beverage . . . . . . . . . . . . . . . . . . . . . . . . . . . . . . . . . . . . . . . . . . . . . . . . . . . . . . . 13% 13%Consumer Products . . . . . . . . . . . . . . . . . . . . . . . . . . . . . . . . . . . . . . . . . . . . . . . . . . . . . . 9% 9%Pharmaceuticals and Health Care . . . . . . . . . . . . . . . . . . . . . . . . . . . . . . . . . . . . . . . . . . . . 11% 10%Financial Services . . . . . . . . . . . . . . . . . . . . . . . . . . . . . . . . . . . . . . . . . . . . . . . . . . . . . . . . 7% 7%Technology . . . . . . . . . . . . . . . . . . . . . . . . . . . . . . . . . . . . . . . . . . . . . . . . . . . . . . . . . . . . . 10% 9%Auto . . . . . . . . . . . . . . . . . . . . . . . . . . . . . . . . . . . . . . . . . . . . . . . . . . . . . . . . . . . . . . . . . . 8% 8%Travel and Entertainment . . . . . . . . . . . . . . . . . . . . . . . . . . . . . . . . . . . . . . . . . . . . . . . . . . 6% 6%Telecommunications . . . . . . . . . . . . . . . . . . . . . . . . . . . . . . . . . . . . . . . . . . . . . . . . . . . . . . 5% 5%Retail . . . . . . . . . . . . . . . . . . . . . . . . . . . . . . . . . . . . . . . . . . . . . . . . . . . . . . . . . . . . . . . . . 6% 7%Other . . . . . . . . . . . . . . . . . . . . . . . . . . . . . . . . . . . . . . . . . . . . . . . . . . . . . . . . . . . . . . . . . 25% 26%
Operating Expenses
Operating expenses for 2015 compared to 2014 were (in millions):Year Ended December 31,____________________________________________________________________________________
2015 2014 2015 vs. 2014_____________________________________________________________ ____________________________________________________________ ______________________________________% of % ofTotal Total
% of Operating % of Operating $ %$ Revenue Expenses $ Revenue Expenses Change Change__________ ________ _________ __________ ________ _________ _________ _______
Revenue . . . . . . . . . . . . . . . . $15,134.4 $15,317.8 $(183.4) (1.2)%Operating Expenses:
Salary and service costs . . 11,361.9 75.1% 86.0% 11,350.0 74.1% 84.9% 11.9 0.1%Office and general
expenses . . . . . . . . . . . 1,852.4 12.2% 14.0% 2,023.7 13.2% 15.1% (171.3) (8.5)%________________ _______ ________________ _______ ____________Operating Expenses . . . . . . . 13,214.3 87.3% 13,373.7 87.3% (159.4) (1.2)%________________ ________________ ____________Operating Income . . . . . . . . $ 1,920.1 12.7% $ 1,944.1 12.7% $ (24.0) (1.2)%________________ ________________ ____________________________ ________________ ____________
17
03.68250-10K.qxp 3/31/16 6:47 PM Page 17

Similar to revenue, operating expenses decreased in 2015 compared to 2014 as a result of the weakening ofsubstantially all foreign currencies against the U.S. Dollar. Salary and service costs, which normally tend to fluctuatewith changes in revenue, increased $11.9 million in 2015 compared to 2014, primarily reflecting increases related tochanges in the mix of our business during the period. Office and general expenses, which are less directly linked tochanges in revenue than salary and service costs, decreased $171.3 million in 2015 compared to 2014, reflecting thecontinuing effort by our agencies to reduce operating costs.
Operating margins and EBITA margins were unchanged year-over-year at 12.7% and 13.4%, respectively. In2014, we incurred $8.8 million of expenses in connection with the proposed merger with Publicis, which wereprimarily comprised of professional fees. On May 8, 2014, the proposed merger was terminated.
Net Interest Expense
Net interest expense increased $7.4 million to $141.5 million in 2015 from $134.1 million in 2014. Interestexpense increased $3.9 million to $181.1 million in 2015, primarily resulting from the interest expense on the2024 Notes, issued in October 2014, partially offset by the benefit of the interest rate swaps on the 2022 Notes and2020 Notes. Interest income decreased $3.5 million to $39.6 million in 2015 resulting from lower interest earned oncash balances in our international treasury centers and the negative impact of changes in foreign exchange rates.
In October 2015, we terminated the swap on the 2020 Notes and reduced the notional amount of theswap on the 2022 Notes to $1 billion. Additionally, we entered into a fixed-to-floating interest rate swap on the$750 million principal amount of the 2024 Notes. On January 19, 2016, we terminated the remaining $1.0 billionnotional amount of the swap on the 2022 Notes.
Income Taxes
Our effective tax rate was unchanged at 32.8%. Income tax expense for 2014 reflects the recognition of anincome tax benefit of approximately $11 million related to previously incurred expenses for the proposed mergerwith Publicis. On May 8, 2014, the proposed merger was terminated. Prior to the termination of the merger, themajority of the merger costs, which were incurred in 2013, were capitalized for income tax purposes and the relatedtax benefits were not recorded. Because the merger was terminated, the merger costs were no longer required to becapitalized for income tax purposes. Excluding the income tax benefit of $11 million related to the proposed merger,income tax expense for 2014 would have been $604.5 million. The decrease in the effective tax rate for 2015 fromthe effective tax rate for 2014 excluding the income tax benefit related to the proposed merger, is primarily due to alegal entity restructuring of our European operations. As a result of the reorganization, a certain portion of theforeign earnings in the affected countries is subject to lower effective tax rates.
Net Income Per Common Share – Omnicom Group Inc.
Net income – Omnicom Group Inc. decreased $10.1 million, or 0.9%, to $1,093.9 million in 2015 from$1,104.0 million in 2014. The year-over-year decrease is due to the factors described above. Diluted net income percommon share – Omnicom Group Inc. increased 4.0% to $4.41 in 2015, compared to $4.24 in 2014 due to thefactors described above, as well as the impact of the reduction in our weighted average common shares outstandingresulting from repurchases of our common stock, stock option exercises and shares issued under our employee stockpurchase plan. Excluding the net effect of the merger, which includes the income tax benefit of approximately$11 million, net income – Omnicom Group Inc. and diluted net income per common share – Omnicom GroupInc. for 2014 were $1,101.4 million and $4.23, respectively.
18
03.68250-10K.qxp 3/31/16 6:47 PM Page 18

RESULTS OF OPERATIONS – 2014 Compared to 2013 (in millions):2014 2013__________ __________
Revenue . . . . . . . . . . . . . . . . . . . . . . . . . . . . . . . . . . . . . . . . . . . . . . . . . . . . . . $15,317.8 $14,584.5Operating Expenses:
Salary and service costs . . . . . . . . . . . . . . . . . . . . . . . . . . . . . . . . . . . . . . . . 11,350.0 10,724.4Office and general expenses . . . . . . . . . . . . . . . . . . . . . . . . . . . . . . . . . . . . 2,023.7 2,034.8________________ ________________
Total Operating Expenses . . . . . . . . . . . . . . . . . . . . . . . . . . . . . . . . . . . . . . . . 13,373.7 12,759.2Add back: Amortization of intangible assets . . . . . . . . . . . . . . . . . . . . . . . . . . 107.1 100.8________________ ________________
13,266.6 12,658.4________________ ________________Earnings before interest, taxes and amortization of
intangible assets (“EBITA”) . . . . . . . . . . . . . . . . . . . . . . . . . . . . . . . . . . . . 2,051.2 1,926.1EBITA Margin – % . . . . . . . . . . . . . . . . . . . . . . . . . . . . . . . . . . . . . . . . . . . . . 13.4% 13.2%Deduct: Amortization of intangible assets . . . . . . . . . . . . . . . . . . . . . . . . . . . . 107.1 100.8________________ ________________Operating Income . . . . . . . . . . . . . . . . . . . . . . . . . . . . . . . . . . . . . . . . . . . . . . 1,944.1 1,825.3Operating Margin – % . . . . . . . . . . . . . . . . . . . . . . . . . . . . . . . . . . . . . . . . . . 12.7% 12.5%Interest Expense . . . . . . . . . . . . . . . . . . . . . . . . . . . . . . . . . . . . . . . . . . . . . . . 177.2 197.2Interest Income . . . . . . . . . . . . . . . . . . . . . . . . . . . . . . . . . . . . . . . . . . . . . . . . 43.1 32.8________________ ________________Income Before Income Taxes and Income From
Equity Method Investments . . . . . . . . . . . . . . . . . . . . . . . . . . . . . . . . . . . . 1,810.0 1,660.9Income Tax Expense . . . . . . . . . . . . . . . . . . . . . . . . . . . . . . . . . . . . . . . . . . . . 593.1 565.2Income From Equity Method Investments . . . . . . . . . . . . . . . . . . . . . . . . . . . 16.2 15.9________________ ________________Net Income . . . . . . . . . . . . . . . . . . . . . . . . . . . . . . . . . . . . . . . . . . . . . . . . . . . 1,233.1 1,111.6Net Income Attributed To Noncontrolling Interests . . . . . . . . . . . . . . . . . . . . 129.1 120.5________________ ________________Net Income – Omnicom Group Inc. . . . . . . . . . . . . . . . . . . . . . . . . . . . . . . . $ 1,104.0 $ 991.1________________ ________________________________ ________________
In 2014 and 2013, we incurred $8.8 million and $41.4 million of expenses in connection with the proposedmerger with Publicis, which were primarily comprised of professional fees. On May 8, 2014, the proposed mergerwas terminated. Excluding the merger expenses, operating income and operating margin for 2014 and 2013 were$1,952.9 million and 12.7% and $1,866.7 million and 12.8%, respectively, and EBITA and EBITA margin for2014 and 2013 were $2,060.0 million and 13.4% and $1,967.5 million and 13.5%, respectively. Excluding theincome tax effect of the merger expenses of $11.4 million in 2014 and $6.5 million in 2013, income tax expense was$604.5 million in 2014 and $571.7 million in 2013. Excluding the after-tax effect of the merger expenses, netincome – Omnicom Group Inc. was $1,101.4 million in 2014 and $1,026.0 million in 2013.
EBITA, which we define as earnings before interest, taxes and amortization of intangible assets, and EBITAMargin, which we define as EBITA divided by Revenue, are Non-GAAP financial measures. We use EBITA andEBITA Margin as additional operating performance measures, which exclude the non-cash amortization expense ofacquired intangible assets. The table above reconciles EBITA and EBITA Margin to the U.S. GAAP financialmeasure of Operating Income for the periods presented. We believe that EBITA and EBITA Margin are usefulmeasures to evaluate the performance of our businesses. Non-GAAP financial measures should not be considered inisolation from or as a substitute for financial information presented in compliance with U.S. GAAP. Non-GAAPfinancial measures reported by us may not be comparable to similarly titled amounts reported by other companies.
Revenue
In 2014, revenue increased $733.3 million, or 5.0%, to $15,317.8 million from $14,584.5 million in 2013.Changes in foreign exchange rates reduced revenue $112.6 million, acquisitions net of dispositions increased revenueby $19.0 million and organic growth increased revenue $826.9 million.
19
34958_omni_82p.pdf pg 1 April 5, 2016 11:52:37

The components of 2014 revenue change in the United States (“Domestic”) and the remainder of the world(“International”) were (in millions):
Total Domestic International________________________________________ _______________________________________ ________________________________________$ % $ % $ %____________________ ______________ __________________ ______________ __________________ ______________
December 31, 2013 . . . . . . . . . . . . . . . . . . . $14,584.5 $7,569.7 $7,014.8Components of revenue change:
Foreign exchange impact . . . . . . . . . . . . . (112.6) (0.8)% — —% (112.6) (1.6)%Acquisitions, net of dispositions . . . . . . . . 19.0 0.1% (48.4) (0.6)% 67.4 1.0%Organic growth . . . . . . . . . . . . . . . . . . . . 826.9 5.7% 664.6 8.8% 162.3 2.3%________________ ______________ ______________
December 31, 2014 . . . . . . . . . . . . . . . . . . . $15,317.8 5.0% $8,185.9 8.1% $7,131.9 1.7%________________ ______________ ______________________________ ______________ ______________
The components and percentages are calculated as follows:
• The foreign exchange impact is calculated by translating the current period’s local currency revenue usingthe prior period average exchange rates to derive current period constant currency revenue (in this case$15,430.4 million for the Total column). The foreign exchange impact is the difference between thecurrent period revenue in U.S. Dollars and the current period constant currency revenue($15,317.8 million less $15,430.4 million for the Total column).
• Acquisitions, net of dispositions is calculated by aggregating the prior period revenue of the acquiredbusinesses, less the prior period revenue of any business that was disposed of in the current period.
• Organic growth is calculated by subtracting both the foreign exchange and acquisition components fromtotal revenue growth.
• The percentage change is calculated by dividing the individual component amount by the prior periodrevenue base of that component ($14,584.5 million for the Total column).
For the year ended December 31, 2014, changes in foreign exchange rates reduced revenue by 0.8%, or$112.6 million, compared to 2013. The most significant impacts resulted from the weakening of several currencies,including the Australian Dollar, Brazilian Real, Canadian Dollar, Japanese Yen, Russian Ruble and South African Rand,against the U.S. Dollar. This was partially offset by the strengthening of the British Pound against the U.S. Dollar.
Revenue for 2014 and the percentage change in revenue and organic growth from 2013 in our principalregional markets were (in millions):
% Organic$ % Change Growth___________ __________ ___________
Americas:North America . . . . . . . . . . . . . . . . . . . . . . . . . . . . . . . . . . . . . . . . $ 8,672.0 6.3% 7.3%Latin America . . . . . . . . . . . . . . . . . . . . . . . . . . . . . . . . . . . . . . . . 439.7 0.5% 5.7%
EMEA:Europe . . . . . . . . . . . . . . . . . . . . . . . . . . . . . . . . . . . . . . . . . . . . . . 4,346.4 4.3% 2.6%Middle East and Africa . . . . . . . . . . . . . . . . . . . . . . . . . . . . . . . . . 256.1 7.2% 10.1%
Asia Pacific . . . . . . . . . . . . . . . . . . . . . . . . . . . . . . . . . . . . . . . . . . . . . 1,603.6 1.5% 4.6%________________$15,317.8 5.0% 5.7%________________________________
Europe comprises the U.K. and the Euro currency countries, and other European countries that have notadopted the European Union Monetary standard. In 2014, the percentage of revenue attributed to the U.K. and tothe Euro currency and other European countries was 9.8% and 18.5%, respectively. In 2014, revenue increased13.1% in the U.K. and revenue increased 0.1% in the Euro currency and other European countries.
In the normal course of business, our agencies both gain and lose business from clients each year due to avariety of factors. The net change in 2014 was an overall gain in new business. Under our client-centric approach, weseek to broaden our relationships with all of our clients. Our largest client represented 2.6% and 2.7% of ourrevenue in 2014 and 2013, respectively. Our ten largest and 100 largest clients represented 18.1% and 50.4% ofrevenue in 2014, respectively, and 19.1% and 51.3% of revenue in 2013, respectively.
20
34958_omni_82p.pdf pg 2 April 5, 2016 11:52:37
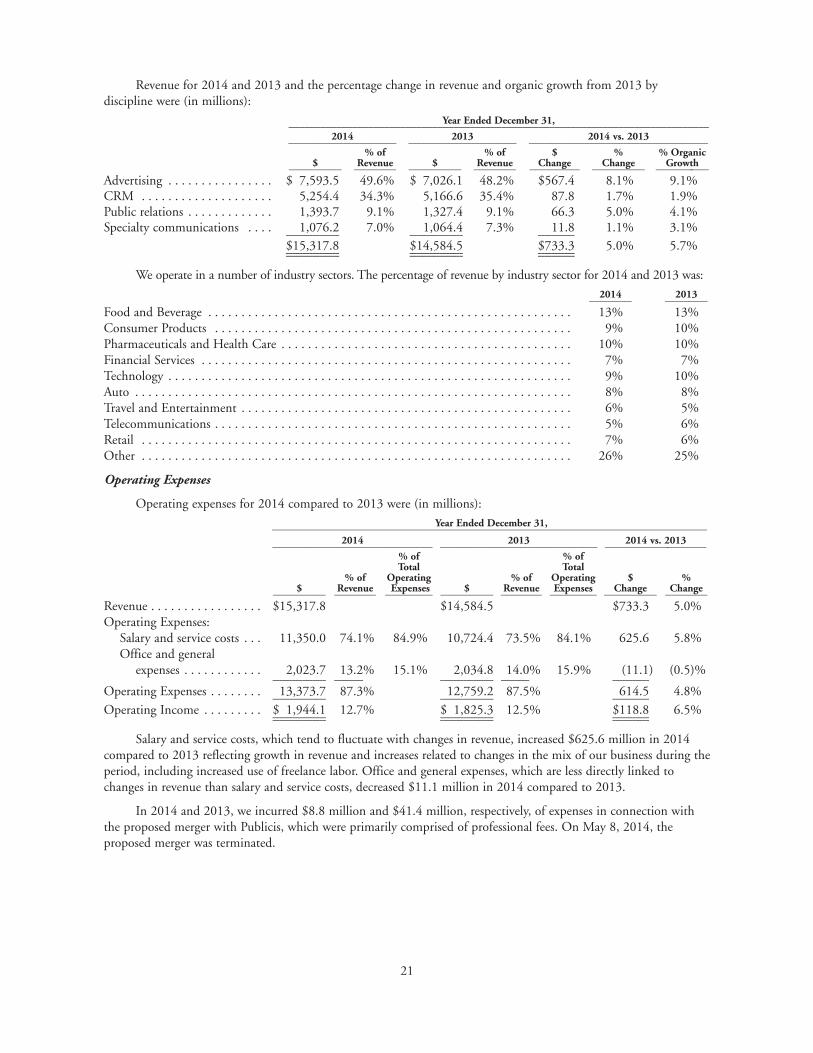
Revenue for 2014 and 2013 and the percentage change in revenue and organic growth from 2013 bydiscipline were (in millions):
Year Ended December 31,_______________________________________________________________________________2014 2013 2014 vs. 2013_________________________________________ _________________________________________ ____________________________________________________________________
% of % of $ % % Organic$ Revenue $ Revenue Change Change Growth____________________ ________________ ____________________ ________________ ___________________ ____________________ _____________________
Advertising . . . . . . . . . . . . . . . . $ 7,593.5 49.6% $ 7,026.1 48.2% $567.4 8.1% 9.1%CRM . . . . . . . . . . . . . . . . . . . . 5,254.4 34.3% 5,166.6 35.4% 87.8 1.7% 1.9%Public relations . . . . . . . . . . . . . 1,393.7 9.1% 1,327.4 9.1% 66.3 5.0% 4.1%Specialty communications . . . . 1,076.2 7.0% 1,064.4 7.3% 11.8 1.1% 3.1%________________ ________________ ___________
$15,317.8 $14,584.5 $733.3 5.0% 5.7%________________ ________________ ___________________________ ________________ ___________
We operate in a number of industry sectors. The percentage of revenue by industry sector for 2014 and 2013 was:2014 2013________________ ________________
Food and Beverage . . . . . . . . . . . . . . . . . . . . . . . . . . . . . . . . . . . . . . . . . . . . . . . . . . . . . . . 13% 13%Consumer Products . . . . . . . . . . . . . . . . . . . . . . . . . . . . . . . . . . . . . . . . . . . . . . . . . . . . . . 9% 10%Pharmaceuticals and Health Care . . . . . . . . . . . . . . . . . . . . . . . . . . . . . . . . . . . . . . . . . . . . 10% 10%Financial Services . . . . . . . . . . . . . . . . . . . . . . . . . . . . . . . . . . . . . . . . . . . . . . . . . . . . . . . . 7% 7%Technology . . . . . . . . . . . . . . . . . . . . . . . . . . . . . . . . . . . . . . . . . . . . . . . . . . . . . . . . . . . . . 9% 10%Auto . . . . . . . . . . . . . . . . . . . . . . . . . . . . . . . . . . . . . . . . . . . . . . . . . . . . . . . . . . . . . . . . . . 8% 8%Travel and Entertainment . . . . . . . . . . . . . . . . . . . . . . . . . . . . . . . . . . . . . . . . . . . . . . . . . . 6% 5%Telecommunications . . . . . . . . . . . . . . . . . . . . . . . . . . . . . . . . . . . . . . . . . . . . . . . . . . . . . . 5% 6%Retail . . . . . . . . . . . . . . . . . . . . . . . . . . . . . . . . . . . . . . . . . . . . . . . . . . . . . . . . . . . . . . . . . 7% 6%Other . . . . . . . . . . . . . . . . . . . . . . . . . . . . . . . . . . . . . . . . . . . . . . . . . . . . . . . . . . . . . . . . . 26% 25%
Operating Expenses
Operating expenses for 2014 compared to 2013 were (in millions):Year Ended December 31,___________________________________________________________________________________
2014 2013 2014 vs. 2013______________________________________________________________ _____________________________________________________________ _______________________________________% of % ofTotal Total
% of Operating % of Operating $ %$ Revenue Expenses $ Revenue Expenses Change Change__________ ________ _________ __________ ________ _________ __________ ________
Revenue . . . . . . . . . . . . . . . . . $15,317.8 $14,584.5 $733.3 5.0%Operating Expenses:
Salary and service costs . . . 11,350.0 74.1% 84.9% 10,724.4 73.5% 84.1% 625.6 5.8%Office and general
expenses . . . . . . . . . . . . 2,023.7 13.2% 15.1% 2,034.8 14.0% 15.9% (11.1) (0.5)%________________ _________ ________________ _________ ___________Operating Expenses . . . . . . . . 13,373.7 87.3% 12,759.2 87.5% 614.5 4.8%________________ ________________ ___________Operating Income . . . . . . . . . $ 1,944.1 12.7% $ 1,825.3 12.5% $118.8 6.5%________________ ________________ ___________________________ ________________ ___________
Salary and service costs, which tend to fluctuate with changes in revenue, increased $625.6 million in 2014compared to 2013 reflecting growth in revenue and increases related to changes in the mix of our business during theperiod, including increased use of freelance labor. Office and general expenses, which are less directly linked tochanges in revenue than salary and service costs, decreased $11.1 million in 2014 compared to 2013.
In 2014 and 2013, we incurred $8.8 million and $41.4 million, respectively, of expenses in connection withthe proposed merger with Publicis, which were primarily comprised of professional fees. On May 8, 2014, theproposed merger was terminated.
21
34958_omni_82p.pdf pg 3 April 5, 2016 11:52:37
Operating margins in 2014 increased to 12.7% from 12.5% in 2013 and EBITA margins in 2014 increased to13.4% from 13.2% in 2013. Excluding the merger expenses from both years, operating income and operatingmargins for 2014 and 2013 were $1,952.9 million and 12.7% and $1,866.7 million and 12.8%, respectively, andEBITA and EBITA margins for 2014 and 2013 were $2,060.0 million and 13.4% and $1,967.5 million and 13.5%,respectively.
Net Interest Expense
Net interest expense decreased $30.3 million to $134.1 million in 2014 from $164.4 million in 2013. InOctober 2014, we issued $750 million principal amount of the 2024 Notes and in September 2014, we entered intoa fixed-to-floating interest rate swap on the 2020 Notes. In 2014, the benefit from the swap on the 2020 Notessubstantially offset the interest expense on the 2024 Notes. Interest expense for 2014 decreased $20.0 million to$177.2 million, primarily resulting from the benefit from the swap on the 2022 Notes, entered into in May 2014.The interest rate swaps have the economic effect of converting the 2022 Notes and the 2020 Notes from fixed rateobligations to floating rate obligations. Interest income increased $10.3 million to $43.1 million in 2014 resultingfrom our cash management efforts and interest earned on cash balances in our international treasury centers.
Income Taxes
Our effective tax rate decreased to 32.8% in 2014 from 34.0% in 2013. Income taxes for 2014 and 2013reflect the recognition of an income tax benefit of $11.4 million and $6.5 million, respectively, related to expensesincurred in connection with the proposed merger with Publicis. Prior to the termination of the proposed merger onMay 8, 2014, the majority of the merger costs were capitalized for income tax purposes and the related tax benefitswere not recorded. Because the proposed merger was terminated, the merger costs were no longer required to becapitalized for income tax purposes. Excluding the income tax effect of the merger expenses from both years, incometax expense for 2014 and 2013 would have been $604.5 million and $571.7 million, respectively.
Net Income Per Common Share – Omnicom Group Inc.
Net income – Omnicom Group Inc. increased $112.9 million, or 11.4%, to $1,104.0 million in 2014 from$991.1 million in 2013. The year-over-year decrease in net income – Omnicom Group Inc. is due to the factorsdescribed above. Diluted net income per common share – Omnicom Group Inc. increased 14.3% to $4.24 in 2014,compared to $3.71 in 2013 due to the factors described above, as well as the impact of the reduction in ourweighted average common shares outstanding resulting from repurchases of our common stock, net of shares issuedfor the conversion of the Convertible Notes due 2032, or 2032 notes, stock option exercises and shares issuedunder our employee stock purchase plan. In the second quarter of 2014, following the termination of the proposedmerger with Publicis, we resumed repurchases of our common stock. Excluding the after-tax effect of the mergerexpenses from both years, net income – Omnicom Group Inc. for 2014 and 2013 was $1,101.4 million and$1,026.0 million, respectively, and diluted net income per common share – Omnicom Group Inc. was $4.23 and$3.84, respectively.
LIQUIDITY AND CAPITAL RESOURCES
Cash Sources and Requirements
Our primary source of liquidity is operating cash flow. In addition to our cash and cash equivalents, additionalliquidity sources include access to the commercial paper market, our $2.5 billion revolving credit facility, or CreditFacility, uncommitted domestic and international credit lines and access to the capital markets. These sources ofliquidity fund our non-discretionary cash requirements and our discretionary spending.
Working capital is our principal non-discretionary funding requirement. In addition, we have contractualobligations related to our senior notes, including the repayment of the $1 billion 5.9% Senior Notes due April 15,2016, or 2016 Notes, recurring business operations, primarily related to lease obligations, and contingent purchaseprice obligations (earn-outs) from prior acquisitions. Our principal discretionary cash spending includes dividendpayments to common shareholders, capital expenditures, strategic acquisitions and repurchases of our common stock.We have a short-term borrowing requirement normally peaking during the second quarter of the year primarily dueto the timing of payments for incentive compensation, income taxes and contingent purchase price obligations.
22
03.68250-10K.qxp 3/31/16 6:47 PM Page 22

Based on past performance and current expectations, we believe that our operating cash flow will be sufficientto meet our non-discretionary cash requirements, excluding the repayment of the 2016 Notes, and our discretionaryspending through 2016. Our cash and cash equivalents, access to the commercial paper market, Credit Facility,uncommitted credit lines and access to the capital markets provide additional sources of liquidity, as well asproviding funding for the repayment of the 2016 Notes.
Our cash and cash equivalents increased $217.1 million to $2.6 billion at December 31, 2015, from $2.4billion at December 31, 2014. The components of the increase for 2015 are (in millions):
Sources
Cash flow from operations . . . . . . . . . . . . . . . . . . . . . . . . . . . . . . . . . . . . . . . . . . $ 2,172.3Deduct increase in operating capital . . . . . . . . . . . . . . . . . . . . . . . . . . . . . . . . . . (557.6)_______________Principal cash sources . . . . . . . . . . . . . . . . . . . . . . . . . . . . . . . . . . . . . . . . . . . . . 1,614.7
Uses
Capital expenditures . . . . . . . . . . . . . . . . . . . . . . . . . . . . . . . . . . . . . . . . . . . . . . $(202.7)Dividends paid to common shareholders . . . . . . . . . . . . . . . . . . . . . . . . . . . . . . . (496.7)Dividends paid to shareholders of noncontrolling interests . . . . . . . . . . . . . . . . . (129.4)Acquisition payments, including payment of contingent purchase
price obligations and acquisition of additional noncontrolling interests, net of cash acquired . . . . . . . . . . . . . . . . . . . . . . . . . . . . . . . . . . . . . (149.6)
Repurchases of common stock, net of proceeds from stock plans and tax benefits . . . . . . . . . . . . . . . . . . . . . . . . . . . . . . . . . . . . . . . . . . . (680.2)____________
Principal cash uses . . . . . . . . . . . . . . . . . . . . . . . . . . . . . . . . . . . . . . . . . . . . . . . . (1,658.6)_______________Principal cash uses in excess of principal cash sources . . . . . . . . . . . . . . . . . . . . . (43.9)Foreign exchange rate changes . . . . . . . . . . . . . . . . . . . . . . . . . . . . . . . . . . . . . . . (262.6)Financing activities and other . . . . . . . . . . . . . . . . . . . . . . . . . . . . . . . . . . . . . . . (34.0)Increase in operating capital . . . . . . . . . . . . . . . . . . . . . . . . . . . . . . . . . . . . . . . . . 557.6_______________Increase in cash and cash equivalents . . . . . . . . . . . . . . . . . . . . . . . . . . . . . . . . . . $ 217.1______________________________
Principal cash sources and principal cash uses amounts are Non-GAAP financial measures. These amountsexclude changes in working capital and other investing and financing activities, including commercial paper issuancesand redemptions used to fund working capital changes. This presentation reflects the metrics used by us to assess oursources and uses of cash and was derived from our statement of cash flows. We believe that this presentation ismeaningful to understand the primary sources and uses of our cash flow and the effect on our cash and cashequivalents. Non-GAAP financial measures should not be considered in isolation from, or as a substitute for,financial information presented in compliance with U.S. GAAP. Non-GAAP financial measures as reported by usmay not be comparable to similarly titled amounts reported by other companies. Additional information regardingour cash flows can be found in our consolidated financial statements.
Cash Management
Our regional treasury centers in North America, Europe and Asia, which are structured as wholly ownedfinance subsidiaries, manage our cash and liquidity. Each day, operations with excess funds invest these funds withtheir regional treasury center. Likewise, operations that require funds borrow from their regional treasury center.The treasury centers aggregate the net position which is either invested with or borrowed from third parties. To theextent that our treasury centers require liquidity, they have the ability to issue up to a total of $2 billion of U.S.Dollar-denominated commercial paper or borrow under the Credit Facility or the uncommitted credit lines. Thisprocess enables us to manage our debt more efficiently and utilize our cash more effectively, as well as manage ourrisk to foreign exchange rate changes. In countries where we either do not conduct treasury operations or it is notfeasible for one of our treasury centers to fund net borrowing requirements on an intercompany basis, we arrange forlocal currency uncommitted credit lines.
We have policies governing counterparty credit risk with financial institutions that hold our cash and cashequivalents and we have deposit limits for each institution. In countries where we conduct treasury operations,generally the counterparties are either branches or subsidiaries of institutions that are party to the Credit Facility.
23
03.68250-10K.qxp 3/31/16 6:47 PM Page 23

These institutions generally have credit ratings equal to or better than our credit ratings. In countries where we donot conduct treasury operations, all cash and cash equivalents are held by counterparties that meet specific minimumcredit standards.
Our net debt position, which we define as total debt outstanding less cash and cash equivalents and short-terminvestments, decreased $208.3 million at December 31, 2015, as compared to December 31, 2014, primarily due toan increase in cash and cash equivalents and short-term investments resulting from an increase in operating capital of$557.6 million, partially offset by a decrease in foreign cash balances of $262.6 million from the translation of localcurrencies to U.S. Dollars and principal cash uses in excess of principal cash sources of $43.9 million, as describedabove. The components of net debt at December 31, 2015 and 2014 were (in millions):
2015 2014__________ __________
Debt:Short-term debt . . . . . . . . . . . . . . . . . . . . . . . . . . . . . . . . . . . . . . . . . . . . . . $ 5.2 $ 7.25.9% Senior Notes due 2016 . . . . . . . . . . . . . . . . . . . . . . . . . . . . . . . . . . . . 1,000.0 1,000.06.25% Senior Notes due 2019 . . . . . . . . . . . . . . . . . . . . . . . . . . . . . . . . . . . 500.0 500.04.45% Senior Notes due 2020 . . . . . . . . . . . . . . . . . . . . . . . . . . . . . . . . . . . 1,000.0 1,000.03.625% Senior Notes due 2022 . . . . . . . . . . . . . . . . . . . . . . . . . . . . . . . . . . 1,250.0 1,250.03.65% Senior Notes due 2024 . . . . . . . . . . . . . . . . . . . . . . . . . . . . . . . . . . . 750.0 750.0Other debt . . . . . . . . . . . . . . . . . . . . . . . . . . . . . . . . . . . . . . . . . . . . . . . . . . 0.3 0.5Unamortized premium (discount) on senior notes, net . . . . . . . . . . . . . . . . 10.1 11.1Debt issuance costs . . . . . . . . . . . . . . . . . . . . . . . . . . . . . . . . . . . . . . . . . . . . (16.9) (20.5)Adjustment to carrying value for interest rate swaps . . . . . . . . . . . . . . . . . . . 72.1 51.4_______________ _______________
Total debt . . . . . . . . . . . . . . . . . . . . . . . . . . . . . . . . . . . . . . . . . . . . . . . . . . . . . 4,570.8 4,549.7Cash and cash equivalents and short-term investments . . . . . . . . . . . . . . . . . . . (2,619.7) (2,390.3)_______________ _______________Net debt . . . . . . . . . . . . . . . . . . . . . . . . . . . . . . . . . . . . . . . . . . . . . . . . . . . . . . $ 1,951.1 $ 2,159.4_______________ ______________________________ _______________
Net debt is a Non-GAAP financial measure. This presentation, together with the comparable U.S. GAAPmeasures, reflects one of the key metrics we use to assess our cash management performance. Non-GAAP financialmeasures should not be considered in isolation from, or as a substitute for, financial information presented incompliance with US GAAP. Non-GAAP financial measures as reported by us may not be comparable to similarlytitled amounts reported by other companies.
At December 31, 2015, our foreign subsidiaries held approximately $1.4 billion of our total cash and cashequivalents of $2.6 billion. The majority of the cash is available to us, net of any taxes payable upon repatriation tothe United States. Changes in international tax rules or changes in U.S. tax rules and regulations coveringinternational operations and foreign tax credits may affect our future reported financial results or the way we conductour business.
Debt Instruments and Related Covenants
At December 31, 2015, as a source of short-term financing, we have a $2.5 billion Credit Facility, whichexpires on July 31, 2020, domestic and international uncommitted credit lines aggregating $1.2 billion and we canissue up to $2 billion of commercial paper.
The Credit Facility contains financial covenants that require us to maintain a Leverage Ratio of consolidatedindebtedness to consolidated EBITDA of no more than 3 times for the most recently ended 12-month period(EBITDA is defined as earnings before interest, taxes, depreciation and amortization) and an Interest Coverage Ratioof consolidated EBITDA to interest expense of at least 5 times for the most recently ended 12-month period. AtDecember 31, 2015, we were in compliance with these covenants as our Leverage Ratio was 2.1 times and ourInterest Coverage Ratio was 12.2 times. The Credit Facility does not limit our ability to declare or pay dividends orrepurchase our common stock.
Omnicom and its wholly owned finance subsidiary Omnicom Capital Inc., or OCI, are co-obligors under allthe senior notes. The senior notes are a joint and several liability of us and OCI and we unconditionally guaranteeOCI’s obligations with respect to the senior notes. OCI provides funding for our operations by incurring debt andlending the proceeds to our operating subsidiaries. OCI’s assets consist of cash and cash equivalents andintercompany loans made to our operating subsidiaries and the related interest receivable. There are no restrictions
24
03.68250-10K.qxp 3/31/16 6:47 PM Page 24

on the ability of OCI or us to obtain funds from our subsidiaries through dividends, loans or advances. Our seniornotes are senior unsecured obligations that rank equal in right of payment with all existing and future unsecuredsenior indebtedness.
On March 26, 2015, in connection with the maturity of our 2016 Notes, we entered into a $1.0 billionforward-starting interest rate swap. The swap mitigates the risk of changes in the semi-annual interest paymentsfrom inception to May 2, 2016, the contractual termination date of the swap, and effectively locks in the fixedinterest rate, excluding the effect of our credit spread, on any refinancing at 2.32%. In October 2015, we terminatedthe interest rate swap on the 2020 Notes and reduced the notional amount of the interest rate swap on the 2022Notes to $1.0 billion. Additionally, in October 2015, we entered into a fixed-to-floating interest rate swap on the$750 million principal amount of our 2024 Notes. On January 19, 2016, we terminated the remaining $1.0 billionnotional amount of the swap on the 2022 Notes. A complete discussion of our interest rate swaps is included inNote 6 to the consolidated financial statements.
Credit Markets and Availability of Credit
We typically fund our day-to-day liquidity by issuing commercial paper. As an additional source of funding,we may borrow under the Credit Facility or the uncommitted credit lines. At December 31, 2015, there were nooutstanding commercial paper issuances or borrowings under the Credit Facility or the uncommitted credit lines.
Commercial paper activity for the three years ended December 31, 2015 was (dollars in millions):2015 2014 2013__________ __________ __________
Average amount outstanding during the year . . . . . . . . . . . . $ 964.8 $ 909.0 $ 471.7Maximum amount outstanding during the year . . . . . . . . . . $ 1,720.7 $ 1,795.8 $ 1,027.5Total issuances during the year . . . . . . . . . . . . . . . . . . . . . . . $26,615.5 $18,539.9 $11,786.9Average days outstanding . . . . . . . . . . . . . . . . . . . . . . . . . . . 13.2 20.3 14.6Weighted average interest rate . . . . . . . . . . . . . . . . . . . . . . . . 0.46% 0.29% 0.33%
Our access to the commercial paper market and the cost of these borrowings are affected by our credit ratingsand market conditions. S&P rates our long-term and short-term debt BBB+ and A2, respectively, and Moody’s ratesour long-term and short-term debt Baa1 and P2, respectively. Our outstanding senior notes and Credit Facility donot contain provisions that require acceleration of cash payments in the event our debt credit ratings aredowngraded.
We expect to continue funding our day-to-day liquidity by issuing commercial paper. However, disruptions in thecredit markets may lead to periods of illiquidity in the commercial paper market and higher credit spreads. To mitigateany future disruption in the credit markets and to fund our liquidity we may borrow under the Credit Facility or accessthe capital markets if favorable conditions exist. We will continue to monitor closely our liquidity and conditions in thecredit markets. We cannot predict with any certainty the impact on us of any future disruptions in the credit markets.In such circumstances, we may need to obtain additional financing to fund our day-to-day working capitalrequirements. Such additional financing may not be available on favorable terms, or at all.
25
03.68250-10K.qxp 3/31/16 6:47 PM Page 25

Contractual Obligations and Other Commercial Commitments
In the normal course of business we enter into numerous contractual and commercial undertakings. Thefollowing tables should be read in conjunction with our consolidated financial statements.
Contractual obligations at December 31, 2015 were (in millions):Obligation Due__________________________________________________________________________________
TotalObligation 2016 2017 – 2018 2019 – 2020 After 2020__________________ _________________ _____________________ _____________________ ____________________
Long-term debt:Principal . . . . . . . . . . . . . . . . . . . . . . . . $4,500.3 $1,000.3 $ — $1,500.0 $2,000.0Interest . . . . . . . . . . . . . . . . . . . . . . . . . 862.5 165.6 296.9 234.6 165.4
Lease obligations . . . . . . . . . . . . . . . . . . . . 1,444.3 323.4 420.9 277.8 422.2Deferred tax liability – convertible debt . . 197.3 65.8 131.5 — —Contingent purchase price obligations . . . 322.0 81.5 214.8 25.7 —Defined benefit pension plans
benefit obligation . . . . . . . . . . . . . . . . . 234.8 8.5 17.7 22.0 186.6Postemployment arrangements
benefit obligation . . . . . . . . . . . . . . . . . 115.9 9.3 16.4 12.0 78.2Uncertain tax positions . . . . . . . . . . . . . . . 113.0 18.7 28.3 66.0 —______________ ______________ ______________ ______________ ______________
$7,790.1 $1,673.1 $1,126.5 $2,138.1 $2,852.4______________ ______________ ______________ ______________ ____________________________ ______________ ______________ ______________ ______________
Certain acquisitions include an initial payment at closing and provide for future additional contingentpurchase price payments (earn-outs), which are recorded as a liability at the acquisition date fair value. Subsequentchanges in the fair value of the liability are recorded in our results of operations.
The unfunded benefit obligation for our defined benefit pension plans and liability for our postemploymentarrangements was $281.8 million at December 31, 2015. In 2015, we contributed $4.2 million to our definedbenefit pension plans and paid $8.7 million in benefits for our postemployment arrangements. We do not expectthese payments to increase significantly in 2016.
The liability for uncertain tax positions is subject to uncertainty as to when or if the liability will be paid. Wehave assigned the liability to the periods presented based on our judgment as to when these liabilities will be resolvedby the appropriate taxing authorities.
Commercial commitments at December 31, 2015 were (in millions):Commitment Expires__________________________________________________________________________________
TotalCommitment 2016 2017 – 2018 2019 – 2020 After 2020_______________________ _________________ _____________________ _____________________ ____________________
Standby letters of credit . . . . . . . . . . . . . . . $ 7.8 $ 6.4 $ 0.8 $ — $0.6Guarantees . . . . . . . . . . . . . . . . . . . . . . . . . 93.4 62.2 26.0 2.6 2.6___________ _________ _________ _______ _______
$101.2 $68.6 $26.8 $2.6 $3.2___________ _________ _________ _______ __________________ _________ _________ _______ _______
At December 31, 2015, there were no significant off-balance sheet arrangements.
Item 7A. Quantitative and Qualitative Disclosures About Market Risk
We manage our exposure to foreign exchange and interest rate risk through various strategies, including the useof derivative financial instruments. We use forward foreign exchange contracts as economic hedges to manage thecash flow volatility arising from foreign exchange rate fluctuations. Additionally, we use interest rate swaps to manageour interest expense and structure our debt portfolio to achieve a mix of fixed rate and floating rate debt. We do notuse derivative instruments for trading or speculative purposes. Utilizing derivative instruments exposes us to the riskthat counterparties to the derivative contracts will fail to meet their contractual obligations. To mitigate counterpartycredit risk, we have a policy of only entering into derivative contracts with carefully selected major financialinstitutions based on specific minimum credit standards and other factors.
We evaluate the effects of changes in foreign currency exchange rates, interest rates and other relevant marketrisks on our derivative instruments. We periodically determine the potential loss from market risk on our derivativeinstruments by performing a value-at-risk, or VaR, analysis. VaR is a statistical model that utilizes historical currency
26
03.68250-10K.qxp 3/31/16 6:47 PM Page 26

exchange and interest rate data to measure the potential impact on future earnings of our derivative financialinstruments assuming normal market conditions. The VaR model is not intended to represent actual losses but isused as a risk estimation and management tool. Based on the results of the model, we estimate with 95% confidencea maximum one-day change in the net fair value of our derivative financial instruments at December 31, 2015 wasnot significant.
Foreign Exchange Risk
Our results of operations are subject to risk from the translation to U.S. Dollars of the revenue and expenses ofour foreign operations, which are generally denominated in their local currency. For the most part, revenue andexpenses of our foreign operations are denominated in the same currency, which minimizes the economic impact onour operating margin. The effects of currency exchange transactions on our results of operations are discussed inNote 2 to the consolidated financial statements.
Our international operations represent approximately 44% of our revenue. While our major internationalmarkets include the European Union, the United Kingdom, Australia, Brazil, Canada, China and Japan, our agenciestransact business in more than 50 different currencies.
As an integral part of our global treasury operations, we centralize our cash and use multicurrency pools tomanage the foreign exchange risk between subsidiaries and their respective treasury centers from which they borrowor invest funds. However, in certain circumstances, subsidiaries borrow or invest with a treasury center operating in adifferent currency. At December 31, 2015, we had outstanding forward foreign exchange contracts with an aggregatenotional amount of $22.1 million to manage the foreign exchange risk associated with these activities. Additionally,there are circumstances where revenue and expense transactions are not denominated in the same currency. In theseinstances, amounts are either promptly settled or hedged with forward contracts. At December 31, 2015, we hadoutstanding forward foreign exchange contracts with an aggregate notional amount of $85.9 million to manage theforeign exchange risk of these activities.
Foreign currency derivative instruments are designated as economic hedges; therefore, any gain or loss in fairvalue incurred on those instruments is generally offset by decreases or increases in the fair value of the underlyingexposures. By using these financial instruments, we reduced financial risk of adverse foreign exchange changes byforegoing any gain (reward) which might have occurred if the markets moved favorably.
Interest Rate Risk
We use interest rate swaps to manage our interest cost and structure our long-term debt portfolio to achieve amix of fixed rate and floating rate debt. Based on market conditions, we may terminate the swaps to reduce ourexposure to rising interest rates or to monetize any gain and lock in a reduction in interest expense over the term ofthe underlying debt. At December 31, 2015, the total aggregate principal amount of our fixed rate senior notes was$4.5 billion and the total notional amount of the fixed-to-floating interest rate swaps was $1.75 billion. The interestrate swaps have the economic effect of converting our debt portfolio to 61% fixed rate obligations and 39% floatingrate obligations. On January 19, 2016, we terminated the remaining $1.0 billion notional amount of the swap onthe 2022 Notes, reducing the outstanding notional amount of the swaps to $750 million.
Also, we are exposed to interest rate volatility on future debt issuances. To manage this risk, we use forward-starting interest rate swaps to lock in the interest rate on future debt issuances. At December 31, 2015, the totalnotional amount of the forward-starting interest rate swaps was $1.0 billion. Upon settlement of the swap, any gainor loss on the effective portion of the swap will be amortized to interest expense over the term of the new debt orwill be recorded in results of operations if the refinancing is not completed.
A complete discussion of our interest rate swaps is included in Note 6 to the consolidated financial statements.
Credit Risk
We provide advertising, marketing and corporate communications services to several thousand clients whooperate in nearly every industry sector of the global economy and we grant credit to qualified clients in the normalcourse of business. Due to the diversified nature of our client base, we do not believe that we are exposed to aconcentration of credit risk as our largest client accounted for 2.7% of revenue in 2015. However, during periods ofeconomic downturn, the credit profiles of our clients could change.
27
03.68250-10K.qxp 3/31/16 6:47 PM Page 27
In the normal course of business, our agencies enter into contractual commitments with media providers andproduction companies on behalf of our clients at levels that can substantially exceed the revenue from our services.These commitments are included in accounts payable when the services are delivered by the media providers orproduction companies. If permitted by local law and the client agreement, many of our agencies purchase media andproduction services for our clients as an agent for a disclosed principal. In addition, while operating practices vary bycountry, media type and media vendor, in the United States and certain foreign markets, many of our agencies’contracts with media and production providers specify that our agencies are not liable to the media and productionproviders under the theory of sequential liability until and to the extent we have been paid by our client for themedia or production services.
Where purchases of media and production services are made by our agencies as a principal or are not subjectto the theory of sequential liability, the risk of a material loss as a result of payment default by our clients couldincrease significantly and such a loss could have a material adverse effect on our business, results of operations andfinancial position.
In addition, our methods of managing the risk of payment default, including obtaining credit insurance,requiring payment in advance, mitigating the potential loss in the marketplace or negotiating with media providers,may be less available or unavailable during a severe economic downturn.
Item 8. Financial Statements and Supplementary Data
See Item 15, “Exhibits, Financial Statement Schedules.”
Item 9. Changes in and Disagreements With Accountants on Accounting and Financial Disclosure
None.
Item 9A. Controls and Procedures
We maintain disclosure controls and procedures designed to ensure that information required to be disclosedin reports we file with the SEC is recorded, processed, summarized and reported within applicable time periods.Disclosure controls and procedures include, without limitation, controls and procedures designed to ensure thatinformation required to be disclosed by us in the reports we file or submit under the Securities Exchange Act of1934, as amended, or the Exchange Act, is accumulated and communicated to management, including our ChiefExecutive Officer, or CEO, and Chief Financial Officer, or CFO, as appropriate to allow timely decisions regardingrequired disclosure. Management, including our CEO and CFO, conducted an evaluation of the effectiveness of ourdisclosure controls and procedures as of December 31, 2015. Based on that evaluation, our CEO and CFOconcluded that, as of December 31, 2015, our disclosure controls and procedures are effective to ensure thatdecisions can be made timely with respect to required disclosures, as well as ensuring that the recording, processing,summarization and reporting of information required to be included in our Annual Report on Form 10-K for theyear ended December 31, 2015 are appropriate.
Our management is responsible for establishing and maintaining adequate internal control over financialreporting, as such term is defined in Exchange Act Rule 13a-15(f ). Management, with the participation of our CEO,CFO and our agencies, conducted an evaluation of the effectiveness of our internal control over financial reportingbased on the framework in Internal Control – Integrated Framework (2013) issued by the Committee of SponsoringOrganizations of the Treadway Commission. Based on that evaluation, our CEO and CFO concluded that ourinternal control over financial reporting was effective as of December 31, 2015. There have not been any changes inour internal control over financial reporting during our most recent fiscal quarter that have materially affected or arereasonably likely to materially affect our internal control over financial reporting.
KPMG LLP, an independent registered public accounting firm that audited our consolidated financialstatements included in this Annual Report on Form 10-K, has issued an attestation report on Omnicom’s internalcontrol over financial reporting as of December 31, 2015, dated February 9, 2016, which is included on page F-3 ofthis 2015 10-K.
Item 9B. Other Information
None.
28
03.68250-10K.qxp 3/31/16 6:47 PM Page 28

PART III
Item 10. Directors, Executive Officers and Corporate Governance
The information regarding Executive Officers of the Registrant is included in Part I, Item 1, “Business.”Additional information called for by this Item, to the extent not included in this document, is incorporated herein byreference to the information to be included under the captions “Corporate Governance,” “Items To Be Voted On –Item 1 – Election of Directors,” “Additional Information – Section 16(a) Beneficial Ownership Reporting Compliance”and “Shareholder Proposals For The 2017 Annual Meeting” in our definitive proxy statement, which is expected to befiled with the SEC within 120 days of the fiscal year ended December 31, 2015, or our Proxy Statement.
Item 11. Executive Compensation
The information called for by this Item is incorporated herein by reference to the information to be includedunder the captions “Executive Compensation,” “Directors’ Compensation For Fiscal 2015” and “CorporateGovernance – Compensation Committee Interlocks and Insider Participation” in our Proxy Statement.
Item 12. Security Ownership of Certain Beneficial Owners and Management and Related Stockholder Matters
The information called for by this Item is incorporated herein by reference to the information to be includedunder the captions “Equity Compensation Plans” and “Stock Ownership” in our Proxy Statement.
Item 13. Certain Relationships and Related Transactions, and Director Independence
The information called for by this Item is incorporated herein by reference to the information to be includedunder the captions “Additional Information – Transactions with Related Persons” and “Corporate Governance –Board Composition” in our Proxy Statement.
Item 14. Principal Accounting Fees and Services
The information called for by this Item is incorporated herein by reference to the information to be includedunder the caption “Audit Related Matters – Fees Paid to Independent Auditors” in our Proxy Statement.
PART IV
Item 15. Exhibits, Financial Statement Schedules
(a)(1) Financial Statements: Page________
Management Report on Internal Control Over Financial Reporting . . . . . . . . . . . . . . . . . . . . . . . . . . F-1Report of Independent Registered Public Accounting Firm . . . . . . . . . . . . . . . . . . . . . . . . . . . . . . . . . F-2Report of Independent Registered Public Accounting Firm . . . . . . . . . . . . . . . . . . . . . . . . . . . . . . . . . F-3Consolidated Balance Sheets at December 31, 2015 and 2014 . . . . . . . . . . . . . . . . . . . . . . . . . . . . . . F-4Consolidated Statements of Income for the Three Years Ended December 31, 2015 . . . . . . . . . . . . . . F-5Consolidated Statements of Comprehensive Income for the Three Years Ended December 31, 2015 . . F-6Consolidated Statements of Equity for the Three Years Ended December 31, 2015 . . . . . . . . . . . . . . F-7Consolidated Statements of Cash Flows for the Three Years Ended December 31, 2015 . . . . . . . . . . . F-8Notes to Consolidated Financial Statements . . . . . . . . . . . . . . . . . . . . . . . . . . . . . . . . . . . . . . . . . . . . F-9Selected Quarterly Financial Data (Unaudited) . . . . . . . . . . . . . . . . . . . . . . . . . . . . . . . . . . . . . . . . . . F-36
(a)(2) Financial Statement Schedules:Schedule II — Valuation and Qualifying Accounts for the Three Years Ended December 31, 2015 . . S-1All other schedules are omitted because they are not applicable.
29
03.68250-10K.qxp 3/31/16 6:47 PM Page 29

(a)(3) Exhibits:ExhibitNumber Description___________ ________________3(i) Restated Certificate of Incorporation of Omnicom Group Inc. (Exhibit 3.1 to our Quarterly Report
on Form 10-Q (File No. 1-10551) for the quarter ended September 30, 2011 and incorporated hereinby reference).
3(ii) By-laws of Omnicom Group Inc., as amended and restated on May 22, 2012 (Exhibit 3.2 to ourCurrent Report on Form 8-K (File No. 1-10551) dated May 24, 2012 and incorporated hereinby reference).
4.1 Form of Senior Debt Securities Indenture (Exhibit 4.1 to our Registration Statement on Form S-3(Registration No. 333-132625) dated March 22, 2006 and incorporated herein by reference).
4.2 First Supplemental Indenture to the Form of the Senior Debt Securities Indenture, dated as ofMarch 29, 2006, among Omnicom Group Inc., Omnicom Capital Inc., Omnicom Finance Inc. andJPMorgan Chase Bank, N.A., as trustee, in connection with our issuance of $1 billion 5.9% Notes due2016 (Exhibit 4.2 to our Current Report on Form 8-K (File No. 1-10551) dated March 29, 2006(“March 29, 2006 8-K”) and incorporated herein by reference).
4.3 Second Supplemental Indenture to the Form of the Senior Debt Securities Indenture, dated as ofJuly 20, 2012, among Omnicom Group Inc., Omnicom Capital Inc. and Deutsche Bank TrustCompany Americas, as trustee, (Exhibit 4.3 to our Current Report on Form 8-K (File No. 1-10551)dated July 20, 2012 (“July 20,2012 8-K”) and incorporated herein by reference).
4.4 Form of 5.9% Notes due 2016 (Exhibit 4.3 to the March 29, 2006 8-K and incorporated hereinby reference).
4.5 Indenture, dated as of July 1, 2009, among Omnicom Group Inc., Omnicom Capital Inc., OmnicomFinance Inc. and Deutsche Bank Trust Company Americas, as trustee (“2009 Base Indenture”)(Exhibit 4.1 to our Current Report on Form 8-K (File No. 1-10551) dated July 1, 2009 (“July 1, 20098-K”) and incorporated herein by reference).
4.6 First Supplemental Indenture to the 2009 Base Indenture, dated as of July 1, 2009, among OmnicomGroup Inc., Omnicom Capital Inc., Omnicom Finance Inc. and Deutsche Bank Trust CompanyAmericas, as trustee, in connection with our issuance of $500 million 6.25% Senior Notes due 2019(Exhibit 4.2 to the July 1, 2009 8-K and incorporated herein by reference).
4.7 Second Supplemental Indenture to the 2009 Base Indenture, dated as of August 5, 2010, amongOmnicom Group Inc., Omnicom Capital Inc., Omnicom Finance Inc. and Deutsche Bank TrustCompany Americas, as trustee, in connection with our issuance of $1 billion 4.45% Senior Notes due2020 (Exhibit 4.1 to our Current Report on Form 8-K (File No. 1-10551) dated August 5, 2010(“August 5, 2010 8-K”) and incorporated herein by reference).
4.8 Third Supplemental Indenture to the 2009 Base Indenture, dated as of April 23, 2012, amongOmnicom Group Inc., Omnicom Capital Inc., Omnicom Finance Inc. and Deutsche Bank TrustCompany Americas, as trustee, in connection with our issuance of $750 million 3.625% Senior Notesdue 2022 (Exhibit 4.1 to our Current Report on Form 8-K (File No. 1-10551) dated April 23, 2012and incorporated herein by reference).
4.9 Fourth Supplemental Indenture to the 2009 Base Indenture, dated as of July 20, 2012, amongOmnicom Group Inc., Omnicom Capital Inc. and Deutsche Bank Trust Company Americas, astrustee, (Exhibit 4.4 to the July 20, 2012 8-K and incorporated herein by reference).
4.10 Fifth Supplemental Indenture to the 2009 Base Indenture, dated as of August 9, 2012, amongOmnicom Group Inc., Omnicom Capital Inc. and Deutsche Bank Trust Company Americas, astrustee, in connection with our issuance of $500 million 3.625% Senior Notes due 2022 (Exhibit 4.1to our Current Report on Form 8-K (File No. 1-10551) dated August 9, 2012 (“August 9, 2012 8-K”)and incorporated herein by reference).
4.11 Form of 6.25% Notes due 2019 (Exhibit 4.3 to the July 1, 2009 8-K and incorporated hereinby reference).
4.12 Form of 4.45% Notes due 2020 (Exhibit 4.2 to the August 5, 2010 8-K and incorporated hereinby reference).
4.13 Form of 3.625% Notes due 2022 (Exhibit 4.2 to the August 9, 2012 8-K and incorporated hereinby reference).
30
03.68250-10K.qxp 3/31/16 6:47 PM Page 30

4.14 Base Indenture, dated as of October 29, 2014, among Omnicom Group Inc., Omnicom Capital Inc.and Deutsche Bank Trust Company Americas, as trustee, (Exhibit 4.1 to our Current Report on Form8-K (File No. 1-10551) dated October 29, 2014 (“October 29, 2014 8-K”) and incorporated hereinby reference).
4.15 First Supplemental Indenture, dated as of October 29, 2014, among Omnicom Group Inc., OmnicomCapital Inc. and Deutsche Bank Trust Company Americas, as trustee, in connection with our issuanceof $750 million 3.65% Senior Notes due 2024 (Exhibit 4.2 to the October 29, 2014 8-K andincorporated herein by reference).
4.16 Form of 3.65% Notes due 2024 (Exhibit 4.3 to the October 29, 2014 8-K and incorporated hereinby reference).
10.1 Amended and Restated Five Year Credit Agreement, dated as of July 31, 2014, by and amongOmnicom Capital Inc., Omnicom Finance plc, Omnicom Group Inc., the banks, financial institutionsand other institutional lenders and initial issuing banks listed on the signature pages thereof, CitigroupGlobal Markets Inc., J.P. Morgan Securities LLC, HSBC Securities (USA) Inc. and Wells FargoSecurities, LLC as lead arrangers and book managers, JPMorgan Chase Bank, N.A., HSBC Securities(USA) Inc. and Wells Fargo Bank, National Association, as syndication agents, BNP Paribas andU.S. Bank National Association, as documentation agents, and Citibank, N.A., as administrative agentfor the lenders (Exhibit 10.1 to our Current Report on Form 8-K (File No. 1-10551) filed on August 1,2014 and incorporated herein by reference).
10.2 Instrument of Resignation, Appointment and Acceptance, dated October 5, 2006, amongOmnicom Group Inc., Omnicom Capital Inc., Omnicom Finance Inc., JPMorgan Chase Bank, N.A.and Deutsche Bank Trust Company Americas (Exhibit 10.1 to our Current Report on Form 8-K(File No. 1-10551) dated October 11, 2006 and incorporated herein by reference).
10.3 Director Equity Plan for Non-employee Directors (Appendix B to our Proxy Statement (File No. 1-10551)filed on April 23, 2004 and incorporated herein by reference).
10.4 Standard form of our Executive Salary Continuation Plan Agreement (Exhibit 10.5 to our AnnualReport on Form 10-K (File No. 1-10551) for the year ended December 31, 2012 (“2012 10-K”) andincorporated herein by reference).
10.5 Standard form of the Director Indemnification Agreement (Exhibit 10.25 to our Annual Report onForm 10-K (File No. 1-10551) for the year ended December 31, 1989 and incorporated herein byreference).
10.6 Equity Incentive Plan (Exhibit 4.3 to our Registration Statement on Form S-8 (RegistrationNo. 333-108063) dated August 18, 2003 and incorporated herein by reference).
10.7 Senior Management Incentive Plan as amended and restated on December 4, 2008 (Exhibit 10.9 toour Annual Report on Form 10-K (File No. 1-10551) for the year ended December 31, 2008 (“200810-K”) and incorporated herein by reference).
10.8 Omnicom Group Inc. SERCR Plan (Exhibit 10.10 to our Annual Report on Form 10-K(File No. 1-10551) for the year ended December 31, 2011 and incorporated herein by reference).
10.9 Form of Award Agreement under the Omnicom Group Inc. SERCR Plan (Exhibit 10.2 to our CurrentReport on Form 8-K (File No. 1-10551) dated December 13, 2006 and incorporated herein byreference).
10.10 Omnicom Group Inc. Amended and Restated 2007 Incentive Award Plan (Appendix A to our ProxyStatement (File No. 1-10551) filed on April 15, 2010 and incorporated herein by reference).
10.11 Form of Indemnification Agreement (Exhibit 10.1 to our Quarterly Report on Form 10-Q(File No. 1-10551) for the quarter ended June 30, 2007 and incorporated herein by reference).
10.12 Director Compensation and Deferred Stock Program (Exhibit 10.13 to the 2012 10-K andincorporated herein by reference).
10.13 Restricted Stock Unit Deferred Compensation Plan (Exhibit 10.16 to the 2008 10-K and incorporatedherein by reference).
10.14 Restricted Stock Deferred Compensation Plan (Exhibit 10.17 to the 2008 10-K and incorporatedherein by reference).
10.15 Amendment No. 1 to the Restricted Stock Deferred Compensation Plan (Exhibit 10.18 to the 200810-K and incorporated herein by reference).
31
34958_omni_82p.pdf pg 4 April 5, 2016 11:52:37

10.16 Amendment No. 2 to the Restricted Stock Deferred Compensation Plan (Exhibit 10.19 to the 200810-K and incorporated herein by reference).
10.17 Form of Grant Notice and Option Agreement (Exhibit 10.20 to our Annual Report on Form 10-K(File No. 1-10551) for the year ended December 31, 2010 (“2010 10-K”) and incorporated hereinby reference).
10.18 Form of Grant Notice and Restricted Stock Agreement (Exhibit 10.21 to 2010 10-K and incorporatedherein by reference).
10.19 Form of Grant Notice and Restricted Stock Unit Agreement (Exhibit 10.22 to 2010 10-K andincorporated herein by reference).
10.20 Form of Grant Notice and Performance Restricted Stock Unit Agreement (Exhibit 10.1 to ourQuarterly Report on Form 10-Q (File No. 1-10551) for the quarter ended June 30, 2011 andincorporated herein by reference).
10.21 Omnicom Group Inc. 2013 Incentive Award Plan (Appendix A to our Proxy Statement(File No. 1-10551) filed on April 11, 2013 and incorporated herein by reference).
10.22 Separation Agreement and General Release between Omnicom Management Inc. and Randall J.Weisenburger (Exhibit 10.23 to our Annual Report on Form 10-K (File No. 1-10551) for the yearended December 31, 2014 and incorporated herein by reference).
12 Computation of Ratio of Earnings to Fixed Charges.21 Subsidiaries of the Registrant.23 Consent of KPMG LLP.31.1 Certification of Chief Executive Officer and President required by Rule 13a-14(a) under the Securities
Exchange Act of 1934, as amended.31.2 Certification of Executive Vice President and Chief Financial Officer required by Rule 13a-14(a) under
the Securities Exchange Act of 1934, as amended.32 Certification of the Chief Executive Officer and President and the Executive Vice President and Chief
Financial Officer required by Rule 13a-14(b) under the Securities Exchange Act of 1934, as amended,and 18 U.S.C. Section 1350.
101 Interactive Data File.
32
34958_omni_82p.pdf pg 5 April 5, 2016 11:52:37

SIGNATURES
Pursuant to the requirements of Section 13 or 15(d) of the Securities Exchange Act of 1934, theregistrant has duly caused this report to be signed on its behalf by the undersigned, thereunto dulyauthorized.
OMNICOM GROUP INC.
February 9, 2016 BY: /S/ PHILIP J. ANGELASTRO
Philip J. AngelastroExecutive Vice President and Chief Financial Officer
Pursuant to the requirements of the Securities Exchange Act of 1934, this report has been signed belowby the following persons on behalf of the registrant and in the capacities and on the dates indicated.
Signature Title Date________________ ________ ________
/S/ BRUCE CRAWFORD Chairman and Director February 9, 2016Bruce Crawford
/S/ JOHN D. WREN Chief Executive Officer and February 9, 2016John D. Wren President and Director
(Principal Executive Officer)
/S/ PHILIP J. ANGELASTRO Executive Vice President and February 9, 2016Philip J. Angelastro Chief Financial Officer
(Principal Financial Officer)
/S/ ANDREW L. CASTELLANETA Senior Vice President, February 9, 2016Andrew L. Castellaneta Chief Accounting Officer
(Principal Accounting Officer)
/S/ ALAN R. BATKIN Director February 9, 2016Alan R. Batkin
/S/ MARY C. CHOKSI Director February 9, 2016Mary C. Choksi
/S/ ROBERT CHARLES CLARK Director February 9, 2016Robert Charles Clark
/S/ LEONARD S. COLEMAN, JR. Director February 9, 2016Leonard S. Coleman, Jr.
/S/ ERROL M. COOK Director February 9, 2016Errol M. Cook
/S/ SUSAN S. DENISON Director February 9, 2016Susan S. Denison
/S/ MICHAEL A. HENNING Director February 9, 2016Michael A. Henning
/S/ JOHN R. MURPHY Director February 9, 2016John R. Murphy
/S/ JOHN R. PURCELL Director February 9, 2016John R. Purcell
/S/ LINDA JOHNSON RICE Director February 9, 2016Linda Johnson Rice
/S/ GARY L. ROUBOS Director February 9, 2016Gary L. Roubos
33
03.68250-10K.qxp 3/31/16 6:47 PM Page 33

[THIS PAGE INTENTIONALLY LEFT BLANK]

F-1
MANAGEMENT REPORT ON INTERNAL CONTROL OVER FINANCIAL REPORTING
Management is responsible for the preparation of the consolidated financial statements and relatedinformation of Omnicom Group Inc. (“Omnicom”). Management uses its best judgment to ensure that theconsolidated financial statements present fairly, in all material respects, Omnicom’s consolidated financial positionand results of operations in conformity with generally accepted accounting principles in the United States.
The financial statements have been audited by an independent registered public accounting firm inaccordance with the standards of the Public Company Accounting Oversight Board. Their report expresses theindependent accountant’s judgment as to the fairness of management’s reported financial position, results ofoperations and cash flows. This judgment is based on the procedures described in the second paragraph oftheir report.
Omnicom management is responsible for establishing and maintaining adequate internal control overfinancial reporting, as such term is defined in Securities Exchange Act Rule 13a-15(f ). Management, with theparticipation of our Chief Executive Officer, or CEO, Chief Financial Officer, or CFO, and our agencies, conductedan evaluation of the effectiveness of our internal control over financial reporting based on the framework in InternalControl – Integrated Framework (2013) issued by the Committee of Sponsoring Organizations of the TreadwayCommission. Based on that evaluation, our CEO and CFO concluded that our internal control over financialreporting was effective as of December 31, 2015. There have not been any changes in our internal control overfinancial reporting during our fourth fiscal quarter that have materially affected or are reasonably likely to affect ourinternal control over financial reporting.
KPMG LLP, an independent registered public accounting firm that audited our consolidated financialstatements included in this Annual Report on Form 10-K, has issued an attestation report on Omnicom’s internalcontrol over financial reporting as of December 31, 2015, dated February 9, 2016.
The Board of Directors of Omnicom has an Audit Committee comprised of five independent directors. TheAudit Committee meets periodically with financial management, Internal Audit and the independent auditors toreview accounting, control, audit and financial reporting matters.
04.68250-F1_F8.qxp 3/31/16 6:49 PM Page 1

F-2
REPORT OF INDEPENDENT REGISTERED PUBLIC ACCOUNTING FIRM
The Board of Directors and Shareholders ofOmnicom Group Inc.:
We have audited the accompanying consolidated balance sheets of Omnicom Group Inc. and subsidiaries (the“Company”) as of December 31, 2015 and 2014, and the related consolidated statements of income, comprehensiveincome, equity and cash flows for each of the years in the three-year period ended December 31, 2015. Inconnection with our audits of the consolidated financial statements, we also have audited financial statementschedule II. These consolidated financial statements and financial statement schedule are the responsibility of theCompany’s management. Our responsibility is to express an opinion on these consolidated financial statements andfinancial statement schedule based on our audits.
We conducted our audits in accordance with the standards of the Public Company Accounting OversightBoard (United States). Those standards require that we plan and perform the audit to obtain reasonable assuranceabout whether the financial statements are free of material misstatement. An audit includes examining, on a testbasis, evidence supporting the amounts and disclosures in the financial statements. An audit also includes assessingthe accounting principles used and significant estimates made by management, as well as evaluating the overallfinancial statement presentation. We believe that our audits provide a reasonable basis for our opinion.
In our opinion, the consolidated financial statements referred to above present fairly, in all material respects,the financial position of Omnicom Group Inc. and subsidiaries as of December 31, 2015 and 2014, and the resultsof their operations and their cash flows for each of the years in the three-year period ended December 31, 2015, inconformity with U.S. generally accepted accounting principles. Also, in our opinion, the related financial statementschedule on page S-1, when considered in relation to the basic consolidated financial statements taken as a whole,presents fairly, in all material respects, the information set forth therein.
We also have audited, in accordance with the standards of the Public Company Accounting Oversight Board(United States), Omnicom Group Inc. and subsidiaries’ internal control over financial reporting as of December 31,2015, based on criteria established in Internal Control – Integrated Framework (2013) issued by the Committee ofSponsoring Organizations of the Treadway Commission (COSO), and our report dated February 9, 2016 expressedan unqualified opinion on the effectiveness of the Company’s internal control over financial reporting.
/s/ KPMG LLPNew York, New YorkFebruary 9, 2016
04.68250-F1_F8.qxp 3/31/16 6:49 PM Page 2

F-3
REPORT OF INDEPENDENT REGISTERED PUBLIC ACCOUNTING FIRM
The Board of Directors and Shareholders ofOmnicom Group Inc.:
We have audited Omnicom Group Inc. and subsidiaries’ (the “Company”) internal control over financialreporting as of December 31, 2015, based on criteria established in Internal Control – Integrated Framework (2013)issued by the Committee of Sponsoring Organizations of the Treadway Commission (COSO). The Company’smanagement is responsible for maintaining effective internal control over financial reporting, and for its assessmentof the effectiveness of internal control over financial reporting, included in the accompanying Management Reporton Internal Control Over Financial Reporting. Our responsibility is to express an opinion on the Company’sinternal control over financial reporting based on our audit.
We conducted our audit in accordance with the standards of the Public Company Accounting OversightBoard (United States). Those standards require that we plan and perform the audit to obtain reasonable assuranceabout whether effective internal control over financial reporting was maintained in all material respects. Our auditincluded obtaining an understanding of internal control over financial reporting, assessing the risk that a materialweakness exists, and testing and evaluating the design and operating effectiveness of internal control based on theassessed risk. Our audit also included performing such other procedures as we considered necessary in thecircumstances. We believe that our audit provides a reasonable basis for our opinion.
A company’s internal control over financial reporting is a process designed to provide reasonable assuranceregarding the reliability of financial reporting and the preparation of financial statements for external purposes inaccordance with generally accepted accounting principles. A company’s internal control over financial reportingincludes those policies and procedures that (1) pertain to the maintenance of records that, in reasonable detail,accurately and fairly reflect the transactions and dispositions of the assets of the company; (2) provide reasonableassurance that transactions are recorded as necessary to permit preparation of financial statements in accordance withgenerally accepted accounting principles, and that receipts and expenditures of the company are being made only inaccordance with authorizations of management and directors of the company; and (3) provide reasonable assuranceregarding prevention or timely detection of unauthorized acquisition, use, or disposition of the company’s assets thatcould have a material effect on the financial statements.
Because of its inherent limitations, internal control over financial reporting may not prevent or detectmisstatements. Also, projections of any evaluation of effectiveness to future periods are subject to the risk thatcontrols may become inadequate because of changes in conditions, or that the degree of compliance with thepolicies or procedures may deteriorate.
In our opinion, Omnicom Group Inc. and subsidiaries maintained, in all material respects, effective internalcontrol over financial reporting as of December 31, 2015, based on criteria established in Internal Control –Integrated Framework (2013) issued by the Committee of Sponsoring Organizations of the Treadway Commission.
We also have audited, in accordance with the standards of the Public Company Accounting Oversight Board(United States), the consolidated balance sheets of Omnicom Group Inc. and subsidiaries as of December 31, 2015and 2014, and the related consolidated statements of income, comprehensive income, equity and cash flows for eachof the years in the three-year period ended December 31, 2015, and our report dated February 9, 2016 expressed anunqualified opinion on those consolidated financial statements.
/s/ KPMG LLPNew York, New YorkFebruary 9, 2016
04.68250-F1_F8.qxp 3/31/16 6:49 PM Page 3

F-4
The accompanying notes to the consolidated financial statements are an integral part of these statements.
OMNICOM GROUP INC. AND SUBSIDIARIESCONSOLIDATED BALANCE SHEETS(In millions, except per share amounts)
December 31,__________________________
2015 2014____________________ ____________________A S S E T S
CURRENT ASSETS:Cash and cash equivalents . . . . . . . . . . . . . . . . . . . . . . . . . . . . . . . . . . . . . . . . . . $ 2,605.2 $ 2,388.1Short-term investments, at cost . . . . . . . . . . . . . . . . . . . . . . . . . . . . . . . . . . . . . . 14.5 2.2Accounts receivable, net of allowance for doubtful accounts of $22.5 and $24.9 . . 7,220.9 6,524.7Work in process . . . . . . . . . . . . . . . . . . . . . . . . . . . . . . . . . . . . . . . . . . . . . . . . . 1,122.7 1,166.6Other current assets . . . . . . . . . . . . . . . . . . . . . . . . . . . . . . . . . . . . . . . . . . . . . . 1,017.2 998.1________ ________
Total Current Assets . . . . . . . . . . . . . . . . . . . . . . . . . . . . . . . . . . . . . . . . . . . . 11,980.5 11,079.7________ ________PROPERTY AND EQUIPMENT
at cost, less accumulated depreciation of $1,206.6 and $1,221.2 . . . . . . . . . . . . 692.7 708.0EQUITY METHOD INVESTMENTS . . . . . . . . . . . . . . . . . . . . . . . . . . . . . . . . . . . . . . . . 136.6 148.2GOODWILL . . . . . . . . . . . . . . . . . . . . . . . . . . . . . . . . . . . . . . . . . . . . . . . . . . . . . . . . 8,676.4 8,822.2INTANGIBLE ASSETS, net of accumulated amortization of $680.7 and $611.4 . . . . . 344.8 389.4OTHER ASSETS . . . . . . . . . . . . . . . . . . . . . . . . . . . . . . . . . . . . . . . . . . . . . . . . . . . . . 279.7 280.9________ ________
TOTAL ASSETS . . . . . . . . . . . . . . . . . . . . . . . . . . . . . . . . . . . . . . . . . . . . . . . . . $22,110.7 $21,428.4________ ________________ ________
L I A B I L I T I E S A N D E Q U I T YCURRENT LIABILITIES:
Accounts payable . . . . . . . . . . . . . . . . . . . . . . . . . . . . . . . . . . . . . . . . . . . . . . . . $ 9,812.0 $ 8,797.5Customer advances . . . . . . . . . . . . . . . . . . . . . . . . . . . . . . . . . . . . . . . . . . . . . . . 1,283.5 1,180.9Current portion of debt . . . . . . . . . . . . . . . . . . . . . . . . . . . . . . . . . . . . . . . . . . . 1,001.4 0.4Short-term debt . . . . . . . . . . . . . . . . . . . . . . . . . . . . . . . . . . . . . . . . . . . . . . . . . 5.2 7.2Taxes payable . . . . . . . . . . . . . . . . . . . . . . . . . . . . . . . . . . . . . . . . . . . . . . . . . . . 319.1 301.1Other current liabilities . . . . . . . . . . . . . . . . . . . . . . . . . . . . . . . . . . . . . . . . . . . . 1,798.4 1,774.0________ ________
Total Current Liabilities . . . . . . . . . . . . . . . . . . . . . . . . . . . . . . . . . . . . . . . . . 14,219.6 12,061.1________ ________LONG-TERM DEBT . . . . . . . . . . . . . . . . . . . . . . . . . . . . . . . . . . . . . . . . . . . . . . . . . . 3,564.2 4,542.1LONG-TERM LIABILITIES . . . . . . . . . . . . . . . . . . . . . . . . . . . . . . . . . . . . . . . . . . . . . . 800.5 774.3LONG-TERM DEFERRED TAX LIABILITIES . . . . . . . . . . . . . . . . . . . . . . . . . . . . . . . . . 469.1 543.9COMMITMENTS AND CONTINGENT LIABILITIES (SEE NOTE 16)TEMPORARY EQUITY – REDEEMABLE NONCONTROLLING INTERESTS . . . . . . . . . . . . . 167.9 185.7EQUITY:
Shareholders’ Equity:Preferred stock, $1.00 par value, 7.5 million shares authorized,
none issued . . . . . . . . . . . . . . . . . . . . . . . . . . . . . . . . . . . . . . . . . . . . . . . . — —Common stock, $0.15 par value, 1.0 billion shares authorized,
397.2 million shares issued, 239.7 million and 246.7 million shares outstanding . . . . . . . . . . . . . . . . . . . . . . . . . . . . . . . . . . . . . . . . . . . 59.6 59.6
Additional paid-in capital . . . . . . . . . . . . . . . . . . . . . . . . . . . . . . . . . . . . . . . . 859.9 818.6Retained earnings . . . . . . . . . . . . . . . . . . . . . . . . . . . . . . . . . . . . . . . . . . . . . . 10,178.2 9,576.9Accumulated other comprehensive income (loss) . . . . . . . . . . . . . . . . . . . . . . (1,015.4) (618.2)Treasury stock, at cost, 157.5 million and 150.5 million shares . . . . . . . . . . . (7,629.9) (6,986.9)________ ________
Total Shareholders’ Equity . . . . . . . . . . . . . . . . . . . . . . . . . . . . . . . . . . . . . 2,452.4 2,850.0Noncontrolling interests . . . . . . . . . . . . . . . . . . . . . . . . . . . . . . . . . . . . . . . . . . . 437.0 471.3________ ________
Total Equity . . . . . . . . . . . . . . . . . . . . . . . . . . . . . . . . . . . . . . . . . . . . . . . . 2,889.4 3,321.3________ ________TOTAL LIABILITIES AND EQUITY . . . . . . . . . . . . . . . . . . . . . . . . . . . . . . . . . . . . . . $22,110.7 $21,428.4________ ________________ ________
04.68250-F1_F8.qxp 3/31/16 6:49 PM Page 4

F-5
The accompanying notes to the consolidated financial statements are an integral part of these statements.
OMNICOM GROUP INC. AND SUBSIDIARIESCONSOLIDATED STATEMENTS OF INCOME
(In millions, except per share amounts)Years Ended December 31,____________________________________________________________________________________________
2015 2014 2013________________ ________________ ________________
REVENUE . . . . . . . . . . . . . . . . . . . . . . . . . . . . . . . . . . . . . . . . . $15,134.4 $15,317.8 $14,584.5
OPERATING EXPENSES . . . . . . . . . . . . . . . . . . . . . . . . . . . . . . . . 13,214.3 13,373.7 12,759.2________________ ________________ ________________
OPERATING INCOME . . . . . . . . . . . . . . . . . . . . . . . . . . . . . . . . . 1,920.1 1,944.1 1,825.3
INTEREST EXPENSE . . . . . . . . . . . . . . . . . . . . . . . . . . . . . . . . . . 181.1 177.2 197.2
INTEREST INCOME . . . . . . . . . . . . . . . . . . . . . . . . . . . . . . . . . . . 39.6 43.1 32.8________________ ________________ ________________
INCOME BEFORE INCOME TAXES AND INCOME FROM
EQUITY METHOD INVESTMENTS . . . . . . . . . . . . . . . . . . . . . . 1,778.6 1,810.0 1,660.9
INCOME TAX EXPENSE . . . . . . . . . . . . . . . . . . . . . . . . . . . . . . . . 583.6 593.1 565.2
INCOME FROM EQUITY METHOD INVESTMENTS . . . . . . . . . . . . 8.4 16.2 15.9________________ ________________ ________________
NET INCOME . . . . . . . . . . . . . . . . . . . . . . . . . . . . . . . . . . . . . . 1,203.4 1,233.1 1,111.6
NET INCOME ATTRIBUTED TO NONCONTROLLING
INTERESTS . . . . . . . . . . . . . . . . . . . . . . . . . . . . . . . . . . . . . . . 109.5 129.1 120.5________________ ________________ ________________
NET INCOME – OMNICOM GROUP INC. . . . . . . . . . . . . . . . . . . $ 1,093.9 $ 1,104.0 $ 991.1________________ ________________ ________________________________ ________________ ________________
NET INCOME PER SHARE – OMNICOM GROUP INC.:Basic . . . . . . . . . . . . . . . . . . . . . . . . . . . . . . . . . . . . . . . . . . . $ 4.43 $ 4.27 $ 3.73Diluted . . . . . . . . . . . . . . . . . . . . . . . . . . . . . . . . . . . . . . . . . $ 4.41 $ 4.24 $ 3.71
DIVIDENDS DECLARED PER COMMON SHARE . . . . . . . . . . . . . . $ 2.00 $ 1.90 $ 1.60
04.68250-F1_F8.qxp 3/31/16 6:49 PM Page 5

F-6
OMNICOM GROUP INC. AND SUBSIDIARIESCONSOLIDATED STATEMENTS OF COMPREHENSIVE INCOME
(In millions)Years Ended December 31,___________________________________________________________________________________________
2015 2014 2013_______________ _______________ _______________
NET INCOME . . . . . . . . . . . . . . . . . . . . . . . . . . . . . . . . . . . . . . $1,203.4 $1,233.1 $1,111.6______________ ______________ ______________
Unrealized gain (loss) on cash flow hedge, net of income taxes of ($2.3) . . . . . . . . . . . . . . . . . . . . . . . . (3.3) — —
Unrealized gain (loss) on available-for-sale securities, net of income taxes of $0.1 and $0.2 and $0.2 for 2015, 2014 and 2013, respectively . . . . . . . . . . 0.3 0.4 0.4
Foreign currency translation adjustment, net of income taxes of ($220.0) and ($227.9) and ($62.3) for 2015, 2014 and 2013, respectively . . . . . . . . . . . (427.2) (442.4) (120.6)
Defined benefit pension and postemployment plans adjustment, net of income taxes of $2.8 and ($15.5) and $14.1 for 2015, 2014 and 2013, respectively . . . . . . . . . 4.2 (23.3) 21.0______________ ______________ ______________
OTHER COMPREHENSIVE INCOME (LOSS) . . . . . . . . . . . . . . . . . (426.0) (465.3) (99.2)______________ ______________ ______________
COMPREHENSIVE INCOME . . . . . . . . . . . . . . . . . . . . . . . . . . . . . 777.4 767.8 1,012.4
COMPREHENSIVE INCOME ATTRIBUTED TO
NONCONTROLLING INTERESTS . . . . . . . . . . . . . . . . . . . . . . . 80.7 90.4 83.4______________ ______________ ______________
COMPREHENSIVE INCOME – OMNICOM GROUP INC. . . . . . . . . $ 696.7 $ 677.4 $ 929.0______________ ______________ ____________________________ ______________ ______________
The accompanying notes to the consolidated financial statements are an integral part of these statements.
04.68250-F1_F8.qxp 3/31/16 6:49 PM Page 6

F-7
The accompanying notes to the consolidated financial statements are an integral part of these statements.
OMNICOM GROUP INC. AND SUBSIDIARIESCONSOLIDATED STATEMENTS OF EQUITY
Three Years Ended December 31, 2015(In millions, except per share amounts)
Omnicom Group Inc._______________________________________________________________________________________________________________________________________________________________Accumulated
Common StockAdditional Other Total
_____________________ Paid-in Retained Comprehensive Treasury Shareholders’ Noncontrolling TotalShares Par Value Capital Earnings Income (Loss) Stock Equity Interests Equity_____________________ _________________ ___________________ ________________ ___________________________ _________________ ________________________ __________________________ _______________
Balance as of December 31, 2012 . . . . . . . . . . . 397.2 $59.6 $836.6 $8,394.4 $(129.5) $(5,700.3) $3,460.8 $495.5 $3,956.3Net Income . . . . . . . . . . . . . . . . . . . . . . . . . . . . 991.1 991.1 120.5 1,111.6Other comprehensive income (loss) . . . . . . . . . . (62.1) (62.1) (37.1) (99.2)Dividends to noncontrolling interests . . . . . . . . (100.6) (100.6)Acquisition of noncontrolling interests . . . . . . . (16.8) (16.8) (8.2) (25.0)Increase in noncontrolling interests from
business combinations . . . . . . . . . . . . . . . . . . 15.4 15.4Change in temporary equity . . . . . . . . . . . . . . . (3.6) (3.6) (3.6)Shares issued for conversion of
convertible notes . . . . . . . . . . . . . . . . . . . . . . (34.3) 68.8 34.5 34.5Common stock dividends declared
($1.60 per share) . . . . . . . . . . . . . . . . . . . . . . (424.3) (424.3) (424.3)Share-based compensation . . . . . . . . . . . . . . . . . 86.3 86.3 86.3Stock issued, share-based compensation . . . . . . . (51.1) 142.9 91.8 91.8Common stock repurchased . . . . . . . . . . . . . . . (575.3) (575.3) (575.3)_________ _________ ___________ ________________ _______________ _______________ ______________ ___________ ______________Balance as of December 31, 2013 . . . . . . . . . . . 397.2 59.6 817.1 8,961.2 (191.6) (6,063.9) 3,582.4 485.5 4,067.9Net Income . . . . . . . . . . . . . . . . . . . . . . . . . . . . 1,104.0 1,104.0 129.1 1,233.1Other comprehensive income (loss) . . . . . . . . . . (426.6) (426.6) (38.7) (465.3)Dividends to noncontrolling interests . . . . . . . . (111.3) (111.3)Acquisition of noncontrolling interests . . . . . . . (64.5) (64.5) (27.8) (92.3)Increase in noncontrolling interests from
business combinations . . . . . . . . . . . . . . . . . . 34.5 34.5Change in temporary equity . . . . . . . . . . . . . . . 7.9 7.9 7.9Shares issued for conversion of
convertible notes . . . . . . . . . . . . . . . . . . . . . . (25.5) 57.7 32.2 32.2Common stock dividends declared
($1.90 per share) . . . . . . . . . . . . . . . . . . . . . . (488.3) (488.3) (488.3)Share-based compensation . . . . . . . . . . . . . . . . . 93.5 93.5 93.5Stock issued, share-based compensation . . . . . . . (9.9) 82.3 72.4 72.4Common stock repurchased . . . . . . . . . . . . . . . (1,063.0) (1,063.0) (1,063.0)_________ _________ ___________ ________________ _______________ _______________ ______________ ___________ ______________Balance as of December 31, 2014 . . . . . . . . . . . 397.2 59.6 818.6 9,576.9 (618.2) (6,986.9) 2,850.0 471.3 3,321.3Net Income . . . . . . . . . . . . . . . . . . . . . . . . . . . . 1,093.9 1,093.9 109.5 1,203.4Other comprehensive income (loss) . . . . . . . . . . (397.2) (397.2) (28.8) (426.0)Dividends to noncontrolling interests . . . . . . . . (129.4) (129.4)Acquisition of noncontrolling interests . . . . . . . (38.8) (38.8) (24.2) (63.0)Increase in noncontrolling interests
from business combinations . . . . . . . . . . . . . . 38.6 38.6Change in temporary equity . . . . . . . . . . . . . . . 11.9 11.9 11.9Common stock dividends declared
($2.00 per share) . . . . . . . . . . . . . . . . . . . . . . (492.6) (492.6) (492.6)Share-based compensation . . . . . . . . . . . . . . . . . 99.4 99.4 99.4Stock issued, share-based compensation . . . . . . . (31.2) 84.5 53.3 53.3Common stock repurchased . . . . . . . . . . . . . . . (727.5) (727.5) (727.5)_________ _________ ___________ ________________ _______________ _______________ ______________ ___________ ______________Balance as of December 31, 2015 . . . . . . . . . . . 397.2 $59.6 $859.9 $10,178.2 $(1,015.4) $(7,629.9) $2,452.4 $437.0 $2,889.4_________ _________ ___________ ________________ _______________ _______________ ______________ ___________ _______________________ _________ ___________ ________________ _______________ _______________ ______________ ___________ ______________
04.68250-F1_F8.qxp 3/31/16 6:49 PM Page 7

F-8
OMNICOM GROUP INC. AND SUBSIDIARIESCONSOLIDATED STATEMENTS OF CASH FLOWS
(In millions)Years Ended December 31,____________________________________________________________________________
2015 2014 2013____________________ ____________________ ___________________
Cash Flows from Operating Activities:Net income . . . . . . . . . . . . . . . . . . . . . . . . . . . . . . . . . . . . . . . . . . . . . $ 1,203.4 $ 1,233.1 $ 1,111.6Adjustments to reconcile net income to net cash provided by
operating activities:Depreciation . . . . . . . . . . . . . . . . . . . . . . . . . . . . . . . . . . . . . . . . . . 181.8 187.3 184.0Amortization of intangible assets . . . . . . . . . . . . . . . . . . . . . . . . . . 109.3 107.1 100.8Amortization of deferred gain from termination of
interest rate swaps . . . . . . . . . . . . . . . . . . . . . . . . . . . . . . . . . . . . (9.2) (7.2) (7.3)Share-based compensation . . . . . . . . . . . . . . . . . . . . . . . . . . . . . . . 99.4 93.5 86.3Excess tax benefit from share-based compensation . . . . . . . . . . . . . (27.2) (29.6) (37.8)Deferred gain from termination of interest rate swaps . . . . . . . . . . 50.4 — —Other, net . . . . . . . . . . . . . . . . . . . . . . . . . . . . . . . . . . . . . . . . . . . . 6.8 (1.5) 20.1Change in operating capital . . . . . . . . . . . . . . . . . . . . . . . . . . . . . . 557.6 (106.2) 351.3_______________ _______________ _______________
Net Cash Provided By Operating Activities . . . . . . . . . . . . . . . . . . . . . . 2,172.3 1,476.5 1,809.0_______________ _______________ _______________Cash Flows from Investing Activities:
Capital expenditures . . . . . . . . . . . . . . . . . . . . . . . . . . . . . . . . . . . . . . (202.7) (213.0) (212.0)Acquisition of businesses and interests in affiliates,
net of cash acquired . . . . . . . . . . . . . . . . . . . . . . . . . . . . . . . . . . . . (60.3) (74.9) (32.8)Other, net . . . . . . . . . . . . . . . . . . . . . . . . . . . . . . . . . . . . . . . . . . . . . . (0.5) 21.0 16.6_______________ _______________ _______________
Net Cash Used In Investing Activities . . . . . . . . . . . . . . . . . . . . . . . . . . . (263.5) (266.9) (228.2)_______________ _______________ _______________Cash Flows from Financing Activities:
Proceeds from (repayment of ) short-term debt . . . . . . . . . . . . . . . . . . (1.1) 2.1 (0.4)Proceeds from borrowings . . . . . . . . . . . . . . . . . . . . . . . . . . . . . . . . . . — 747.6 —Redemption of convertible debt . . . . . . . . . . . . . . . . . . . . . . . . . . . . . — (252.7) (406.7)Dividends paid to common shareholders . . . . . . . . . . . . . . . . . . . . . . (496.7) (468.0) (318.4)Repurchases of common stock . . . . . . . . . . . . . . . . . . . . . . . . . . . . . . (727.5) (1,063.0) (575.3)Proceeds from stock plans . . . . . . . . . . . . . . . . . . . . . . . . . . . . . . . . . . 20.1 39.3 52.3Acquisition of additional noncontrolling interests . . . . . . . . . . . . . . . . (33.5) (69.5) (8.9)Dividends paid to noncontrolling interest shareholders . . . . . . . . . . . (129.4) (111.3) (100.6)Payment of contingent purchase price obligations . . . . . . . . . . . . . . . . (55.3) (83.2) (70.5)Excess tax benefit from share-based compensation . . . . . . . . . . . . . . . 27.2 29.6 37.8Other, net . . . . . . . . . . . . . . . . . . . . . . . . . . . . . . . . . . . . . . . . . . . . . . (32.9) (29.0) (29.1)_______________ _______________ _______________
Net Cash Used In Financing Activities . . . . . . . . . . . . . . . . . . . . . . . . . . (1,429.1) (1,258.1) (1,419.8)_______________ _______________ _______________Effect of foreign exchange rate changes on cash and cash equivalents . . . (262.6) (273.9) (128.8)_______________ _______________ _______________Net Increase (Decrease) in Cash and Cash Equivalents . . . . . . . . . . . . . . 217.1 (322.4) 32.2Cash and Cash Equivalents at the Beginning of Year . . . . . . . . . . . . . . . 2,388.1 2,710.5 2,678.3_______________ _______________ _______________Cash and Cash Equivalents at the End of Year . . . . . . . . . . . . . . . . . . . . $ 2,605.2 $ 2,388.1 $ 2,710.5_______________ _______________ ______________________________ _______________ _______________
The accompanying notes to the consolidated financial statements are an integral part of these statements.
04.68250-F1_F8.qxp 3/31/16 6:49 PM Page 8

F-9
OMNICOM GROUP INC. AND SUBSIDIARIESNOTES TO CONSOLIDATED FINANCIAL STATEMENTS
1. Presentation of Financial Statements
The terms “Omnicom,” “the Company,” “we,” “our” and “us” each refer to Omnicom Group Inc. and itssubsidiaries, unless the context indicates otherwise. The accompanying consolidated financial statements wereprepared in accordance with generally accepted accounting principles in the United States (“U.S. GAAP” or“GAAP”). All intercompany balances and transactions have been eliminated.
The preparation of financial statements in conformity with U.S. GAAP requires us to make estimates andassumptions that affect the amounts reported in the consolidated financial statements and accompanying notes.Actual results could differ from those estimates and assumptions.
2. Significant Accounting Policies
Accounting Changes. On December 31, 2015, we retrospectively adopted FASB Accounting Standards Update(“ASU”) 2015-03, Interest – Imputation of Interest (Subtopic 835-30): Simplifying the Presentation of Debt IssuanceCosts (“ASU 2015-03”) and FASB ASU 2015-17, Income Taxes (Topic 740): Balance Sheet Classification of DeferredTaxes (“ASU 2015-17”). ASU 2015-03 requires that debt issuance costs be presented as a direct reduction from thecarrying amount of debt and ASU 2015-17 requires that deferred tax assets and liabilities be classified asnoncurrent. As a result of the adoption of ASU 2015-03 and ASU 2015-17, the balance sheet at December 31,2014 was adjusted to reflect the reclassification of $20.5 million from other assets to long-term notes payable and$110.8 million from other current assets to long-term deferred tax liabilities.
Revenue Recognition. We recognize revenue in accordance with FASB Accounting Standards Codification(“FASB ASC”) Topic 605, Revenue Recognition, and applicable SEC Staff Accounting Bulletins. Substantially all ofour revenue is derived from fees for services based on a rate per hour or equivalent basis. Revenue is realized whenthe service is performed in accordance with the client arrangement and upon the completion of the earnings process.Prior to recognizing revenue, persuasive evidence of an arrangement must exist, the sales price must be fixed ordeterminable, delivery, performance and acceptance must be in accordance with the client arrangement andcollection must be reasonably assured. These principles are the foundation of our revenue recognition policy andapply to all client arrangements in each of our service disciplines: advertising, customer relationship management,public relations and specialty communications. Certain of our businesses earn a portion of their revenue ascommissions based on performance in accordance with client arrangements. Because the services that we provideacross each of our disciplines are similar and delivered to clients in similar ways, all of the key elements of ourrevenue recognition policy apply to client arrangements in each of our four disciplines. Revenue is recorded net ofsales, use and value added taxes.
In the majority of our businesses, we act as an agent and record revenue equal to the net amount retainedwhen the fee or commission is earned. Although, in certain markets, we may bear credit risk with respect to theseactivities, the arrangements with our clients are such that we act as an agent on their behalf. In these cases, costsincurred with third-party suppliers are excluded from our revenue. In certain arrangements, we act as principal andwe contract directly with third-party suppliers and media providers and production companies and we are theprimary obligor. In these circumstances, revenue is recorded at the gross amount billed since revenue has beenearned for the sale of goods or services.
Some of our client arrangements include performance incentive provisions designed to link a portion of ourrevenue to our performance relative to quantitative and qualitative goals. We recognize performance incentives inrevenue when specific quantitative goals are achieved, or when our performance against qualitative goals isdetermined by the client. We may receive rebates or credits from vendors for transactions entered into on behalf ofclients. These rebates or credits are remitted to the clients or retained by us based on the terms of the client contractor local law. Amounts passed on to clients are recorded as a liability and amounts retained by us are recorded asrevenue when earned.
05.68250-notes.qxp 3/31/16 6:53 PM Page 9

OMNICOM GROUP INC. AND SUBSIDIARIESNOTES TO CONSOLIDATED FINANCIAL STATEMENTS (Continued)
F-10
Operating Expenses. Operating expenses represent salary and service costs and office and general expenses.Salary and service costs consist of employee compensation and related costs and direct service costs. Office andgeneral costs consist of rent and occupancy costs, technology costs, depreciation and amortization and otheroverhead expenses.
Operating expenses for the three years ended December 31, 2015 were (in millions):
2015 2014 2013____________________ ____________________ ____________________
Salary and service costs . . . . . . . . . . . . . . . . . . . . . . . . . . . . . . . . . . . . $11,361.9 $11,350.0 $10,724.4Office and general expenses . . . . . . . . . . . . . . . . . . . . . . . . . . . . . . . . . 1,852.4 2,023.7 2,034.8________________ ________________ ________________
$13,214.3 $13,373.7 $12,759.2________________ ________________ ________________________________ ________________ ________________
Cash and Cash Equivalents. Highly liquid investments consisting of interest-bearing time deposits with originalmaturities of three months or less are classified as cash equivalents. We have policies governing counterparty creditrisk for financial institutions that hold our cash and cash equivalents and we have deposit limits for each institution.
Short-Term Investments. Short-term investments consist of interest-bearing time deposits with maturities of lessthan twelve months. Short-term investments are carried at cost, which approximates fair value.
Work in Process. Work in process includes costs incurred on behalf of clients in providing advertising andmarketing services, including media and production costs, and fees that have not yet been billed. Media andproduction costs are billed during the production process and fees are normally billed within the next 30 days.
Property and Equipment. Property and equipment are carried at cost and are depreciated over the estimateduseful lives of the assets using the straight-line method. The estimated useful lives range from seven to ten years forfurniture and three to five years for equipment. Leasehold improvements are amortized on a straight-line basis overthe shorter of the related lease term or the estimated useful life of the asset. Property under capital lease isdepreciated on a straight-line basis over the lease term.
Equity Method Investments. Investments in companies where we exercise significant influence over theoperating and financial policies of the investee and own less than 50% of the equity are accounted for using theequity method. Our proportionate share of the net income or loss of equity method investments is included inresults of operations and any dividends received reduce the carrying value of the investment. The excess of the costof our investment over our proportionate share of the fair value of the net assets of the investee at the acquisitiondate is recognized as goodwill and included in the carrying amount of the investment. Goodwill in the equitymethod investments is not amortized. Gains and losses from changes in equity method investments are recorded inresults of operations until control is achieved. In circumstances where the change results in obtaining control, theexisting carrying value of the investment is remeasured to the acquisition date fair value and any gain or loss isrecognized in results of operations.
Cost Method Investments. Investments in companies where we do not exercise significant influence over theoperating and financial policies of the investee and own less than 20% of the equity are accounted for using the costmethod. Cost method investments are are included in other assets and are carried at cost, which approximates or isless than fair value. The carrying value of our cost method investments was $21.5 million and $21.8 million atDecember 31, 2015 and 2014, respectively.
We periodically review the carrying value of the equity method and cost method investments to determine ifthere has been an other-than-temporary decline in carrying value. A variety of factors are considered whendetermining if a decline in carrying value is other-than-temporary, including the financial condition and businessprospects of the investee, as well as our investment intent.
Available-for-Sale Securities. Investments in common stock of publicly traded companies are classified asavailable-for-sale securities. These investments are included in other assets and are carried at fair value using quotedmarket prices. Unrealized gains and losses are recorded in accumulated other comprehensive income. The carryingvalue of the available-for-sale securities was $4.8 million and $4.9 million at December 31, 2015 and 2014,respectively.
05.68250-notes.qxp 3/31/16 6:53 PM Page 10

OMNICOM GROUP INC. AND SUBSIDIARIESNOTES TO CONSOLIDATED FINANCIAL STATEMENTS (Continued)
F-11
Goodwill and Intangible Assets. Goodwill represents the excess of the acquisition cost over the fair value of thenet assets acquired. Goodwill is not amortized, but is periodically reviewed for impairment. Intangible assets, whichconsist primarily of customer relationships, including the related customer contracts and trade names, and purchasedand internally developed software are amortized over their estimated useful lives ranging from five to ten years. Weconsider a number of factors in determining the useful lives and amortization method, including the pattern inwhich the economic benefits are consumed, as well as trade name recognition and customer attrition. There is noestimated residual value for the intangible assets.
We review the carrying value of goodwill for impairment annually at the end of the second quarter of the yearand whenever events or circumstances indicate the carrying value may not be recoverable. The impairmentevaluation utilizes a two-step test. The first step compares the fair value of each reporting unit, which we identifiedas our five agency networks, to its carrying value, including goodwill. If the fair value of the reporting unit is equalto or greater than its carrying value, goodwill is not impaired and no further testing is required. If the carrying valueexceeds fair value, then the second step of the impairment test is performed in order to determine if the implied fairvalue of the goodwill of the reporting unit exceeds the carrying value of that goodwill. Goodwill is impaired whenthe carrying value of the goodwill exceeds its implied fair value. Impaired goodwill is written down to its impliedfair value with a charge recorded in results of operations in the period the impairment is identified.
We identified our regional reporting units as components of our operating segments, which are our fiveagency networks. The regional reporting units of each agency network monitor the performance and are responsiblefor the agencies in their region. They report to the segment managers and facilitate the administrative and logisticalrequirements of our client-centric strategy for delivering services to clients in their regions. We have concluded that,for each of our operating segments, their regional reporting units had similar economic characteristics and should beaggregated for purposes of testing goodwill for impairment at the operating segment level. Our conclusion was basedon a detailed analysis of the aggregation criteria set forth in FASB ASC Topic 280, Segment Reporting, and theguidance set forth in FASB ASC Topic 350, Intangibles – Goodwill and Other. Consistent with our fundamentalbusiness strategy, the agencies within our regional reporting units serve similar clients in similar industries, and inmany cases the same clients. The main economic components of each agency are employee compensation andrelated costs and direct service costs and office and general costs, which include rent and occupancy costs,technology costs that are generally limited to personal computers, servers and off-the-shelf software and otheroverhead costs. Finally, the expected benefits of our acquisitions are typically shared by multiple agencies in variousregions as they work together to integrate the acquired agency into our client service strategy. We use the followingvaluation methodologies to determine the fair value of our reporting units: (1) the income approach, which utilizesdiscounted expected future cash flows, (2) comparative market participant multiples of EBITDA (earnings beforeinterest, taxes, depreciation and amortization) and (3) when available, consideration of recent and similar acquisitiontransactions.
Based on the results of the annual impairment test, we concluded that at June 30, 2015 and 2014 ourgoodwill was not impaired because the fair value of each of our reporting units were substantially in excess of theirrespective net book value. Subsequent to the annual impairment test of goodwill at June 30, 2015, there were noevents or circumstances that triggered the need for an interim impairment test.
Debt Issuance Costs. Debt issuance costs are capitalized and amortized to interest expense over the life of therelated debt and are presented as a direct reduction from the carrying amount of debt.
Temporary Equity – Redeemable Noncontrolling Interests. Owners of noncontrolling equity interests in some ofour subsidiaries have the right in certain circumstances to require us to purchase all or a portion of their equityinterests at fair value as defined in the applicable agreements. The intent of the parties is to approximate fair value atthe time of redemption by using a multiple of earnings that is consistent with generally accepted valuation practicesused by market participants in our industry. These contingent redemption rights are embedded in the equity securityat issuance, are not free-standing instruments, do not represent a de facto financing and are not under our control.
05.68250-notes.qxp 3/31/16 6:53 PM Page 11

OMNICOM GROUP INC. AND SUBSIDIARIESNOTES TO CONSOLIDATED FINANCIAL STATEMENTS (Continued)
F-12
Treasury Stock. Common stock repurchases are accounted for at cost and are recorded as treasury stock.Reissued treasury stock, primarily in connection with share-based compensation plans, is accounted for at averagecost. Gains or losses on reissued treasury stock arising from the difference between the average cost and the fair valueof the award are recorded in additional paid-in capital and do not affect results of operations.
Business Combinations. Business combinations are accounted for using the acquisition method andaccordingly, the assets acquired, including identified intangible assets, liabilities assumed and any noncontrollinginterest in the acquired business are recorded at their acquisition date fair values. In circumstances where control isobtained and less than 100% of a business is acquired, goodwill is recorded as if 100% were acquired.Acquisition-related costs, including advisory, legal, accounting, valuation and other costs are expensed as incurred.Certain acquisitions include an initial payment at closing and provide for future additional contingent purchaseprice payments (earn-outs), which are recorded as a liability at the acquisition date fair value using the discount ratein effect on the acquisition date. Subsequent changes in the fair value of the liability are recorded in results ofoperations. Generally, there is no cap on the amount that can be earned under the contingent purchase pricearrangements and payments are not contingent upon future employment. The results of operations of acquiredbusinesses are included in results of operations from the acquisition date.
Noncontrolling Interests. Noncontrolling interests represent equity interests in consolidated subsidiaries held bythird-parties. Noncontrolling interests are presented as a component of equity and the proportionate share of netincome attributed to the noncontrolling interests is recorded in results of operations. Changes in noncontrollinginterests that do not result in a loss of control are accounted for in equity. Gains and losses from the changes innoncontrolling interests that result in a loss of control are recorded in results of operations.
Foreign Currency Translation and Transactions. Substantially all of our foreign subsidiaries use their localcurrency as their functional currency. Assets and liabilities are translated into U.S. Dollars at the exchange rate onthe balance sheet date and revenue and expenses are translated at the average exchange rate for the period.Translation adjustments are recorded in accumulated other comprehensive income. Net foreign currency transactiongains recorded in results of operations in 2015, 2014 and 2013 were $4.7 million, $8.7 million and $2.7 million,respectively.
Share-Based Compensation. Share-based compensation for restricted stock and stock option awards ismeasured at the grant date fair value. The fair value of restricted stock awards is determined and fixed on the grantdate using the closing price of our common stock and is recorded in additional paid-in capital. The fair value ofstock option awards is determined using the Black-Scholes option valuation model. For awards that have a serviceonly vesting condition, compensation expense is recognized on a straight-line basis over the requisite service period.For awards with a performance vesting condition, compensation expense is recognized on a graded-vesting basis.Typically, all share-based awards are settled with treasury stock. See Note 9 for additional information regarding ourspecific award plans and estimates and assumptions used to determine the fair value of our share-basedcompensation awards.
Salary Continuation Agreements. Arrangements with certain present and former employees provide forcontinuing payments for periods up to ten years after cessation of full-time employment in consideration foragreement by the employees not to compete with us and to render consulting services during the postemploymentperiod. Such payments, which are subject to certain limitations, including our operating performance during thepostemployment period, represent the fair value of the services rendered and are expensed in such periods.
Severance. The liability for one-time termination benefits, such as severance pay or benefit payouts, ismeasured and recognized at fair value in the period the liability is incurred. Subsequent changes to the liability arerecognized in results of operations in the period of change.
05.68250-notes.qxp 3/31/16 6:53 PM Page 12

OMNICOM GROUP INC. AND SUBSIDIARIESNOTES TO CONSOLIDATED FINANCIAL STATEMENTS (Continued)
F-13
Defined Benefit Pension Plans and Postemployment Arrangements. The funded status of our defined benefit plansis recorded as an asset or liability. Funded status is the difference between the fair value of plan assets and the benefitobligation at December 31, the measurement date, determined on a plan-by-plan basis. The benefit obligation forthe defined benefit plans is the projected benefit obligation (“PBO”), which represents the actuarial present value ofbenefits expected to be paid upon retirement based on estimated future compensation levels. The fair value of planassets represents the current market value. Overfunded plans where the fair value of plan assets exceeds the benefitobligation are aggregated and recorded as a prepaid pension asset equal to the excess. Underfunded plans where thebenefit obligation exceeds the fair value of plan assets are aggregated and recorded as a liability equal to the excess.We record the liability for our postemployment arrangements. The benefit obligation of our postemploymentarrangements is the PBO and these arrangements are not funded. The current portion of the benefit obligation forthe defined benefit plans and postemployment arrangements, which represents the actuarial present value of benefitspayable in the next twelve months that exceed the fair value of plan assets, is recorded in other current liabilities andthe long-term portion is recorded in long-term liabilities.
Deferred Compensation. Some of our subsidiaries have individual deferred compensation arrangements withcertain executives that provide for payments over varying terms upon retirement, cessation of employment or death.The cost of these arrangements is accrued during the employee’s service period.
Income Taxes. We use the asset and liability method of accounting for income taxes. Under this method,income tax expense is recognized for the amount of taxes payable for the current period and the deferred taxesrecognized during the period. Deferred income taxes reflect the temporary difference between assets and liabilitiesthat are recognized for financial reporting purposes and income tax purposes and are recorded as noncurrent.Deferred income taxes are measured using the enacted tax rates that are assumed to be in effect when the differencesreverse. Deferred tax assets result from recording expenses in the financial statements which are not currentlydeductible for tax purposes, such as share-based compensation expense, tax loss and credit carryforwards anddifferences between the tax basis and book basis of assets and liabilities recorded in connection with acquisitions.Deferred tax liabilities result principally from basis differences arising from deductible goodwill and intangible assets,interest expense on financial instruments which is currently deductible for tax purposes but have not been expensedin the financial statements and tax rate differentials on unremitted foreign earnings. Valuation allowances arerecorded where it is more likely than not that all or a portion of a deferred tax asset will not be realized. In assessingthe need for a valuation allowance, we evaluate factors such as prior earnings history, expected future earnings,carry-back and carry-forward periods and tax strategies that could potentially enhance the likelihood of therealization of a deferred tax asset.
We have provided U.S. federal and state income taxes on earnings of foreign operations that have not beenindefinitely reinvested and we have not provided U.S. federal and state income taxes on the cumulative earnings offoreign subsidiaries that have been indefinitely reinvested. Interest and penalties related to tax positions taken in ourtax returns are recorded in income tax expense.
Net Income Per Common Share. Basic net income per common share is based on the weighted average numberof common shares outstanding during the period. Diluted net income per common share is based on the weightedaverage number of common shares outstanding, plus, the dilutive effect of common share equivalents, which includeoutstanding stock options and restricted stock.
Net income per common share is computed using the two-class method, which is an earnings allocationmethod for computing net income per common share when a company’s capital structure includes common stockand participating securities. The majority of the unvested restricted stock awards receive non-forfeitable dividends atthe same rate as the common stock and therefore are considered participating securities. Under the two-classmethod, basic and diluted net income per common share is reduced for a presumed hypothetical distribution ofearnings to holders of the unvested restricted stock receiving non-forfeitable dividends.
34958_omni_82p.pdf pg 6 April 5, 2016 11:52:37

OMNICOM GROUP INC. AND SUBSIDIARIESNOTES TO CONSOLIDATED FINANCIAL STATEMENTS (Continued)
F-14
Concentration of Credit Risk. We provide advertising, marketing and corporate communications services toseveral thousand clients who operate in nearly every sector of the global economy and we grant credit to qualifiedclients in the normal course of business. Due to the diversified nature of our client base, we do not believe that weare exposed to a concentration of credit risk as our largest client accounted for 2.7% of revenue in 2015.
Derivative Financial Instruments. All derivative instruments, including certain derivative instrumentsembedded in other contracts, are recorded at fair value. Derivatives qualify for hedge accounting if: (1) the hedginginstrument is designated as a hedge at inception, (2) the hedged exposure is specifically identifiable and exposes usto risk and (3) a change in fair value of the derivative financial instrument and an opposite change in the fair valueof the hedged exposure have a high degree of correlation. The method of assessing hedge effectiveness and measuringhedge ineffectiveness is formally documented at hedge inception. Hedge effectiveness is assessed and hedgeineffectiveness is measured at least quarterly throughout the designated hedge period. If the derivative is a hedge,depending on the nature of the hedge, changes in the fair value of the derivative will either be offset against thechange in fair value of the hedged asset, liability or firm commitment through results of operations or recognized inother comprehensive income until the hedged item is recognized in results of operations. The ineffective portion ofthe change in fair value of a derivative used as hedge is recognized in results of operations. We do not use derivativefinancial instruments for trading or speculative purposes.
Fair Value. We apply the fair value measurement guidance in FASB ASC Topic 820, Fair Value Measurementsand Disclosures, for our financial assets and liabilities that are required to be measured at fair value and for ournonfinancial assets and liabilities that are not required to be measured at fair value on a recurring basis, whichincludes goodwill and other identifiable intangible assets. The measurement of fair value requires the use oftechniques based on observable and unobservable inputs. Observable inputs reflect market data obtained fromindependent sources, while unobservable inputs reflect our market assumptions. The inputs create the following fairvalue hierarchy:
• Level 1 – Unadjusted quoted prices in active markets for identical assets or liabilities.
• Level 2 – Unadjusted quoted prices in active markets for similar assets or liabilities; unadjusted quotedprices for identical assets or liabilities in markets that are not active; and model-derived valuations withobservable inputs.
• Level 3 – Unobservable inputs for the asset or liability.
We use unadjusted quoted market prices to determine the fair value of our financial assets and liabilities andclassify such items in Level 1. We use unadjusted quoted market prices for similar assets and liabilities in activemarkets and model-derived valuations and classify such items in Level 2.
In determining the fair value of financial assets and liabilities, we consider certain market valuationadjustments that market participants would consider in determining fair value, including: counterparty credit riskadjustments applied to financial assets and liabilities, taking into account the actual credit risk of the counterpartywhen valuing assets measured at fair value and credit risk adjustments applied to reflect our credit risk whenvaluing liabilities measured at fair value. To mitigate the counterparty credit risk, we have a policy of only enteringinto contracts with carefully selected major financial institutions based on specific minimum credit standards andother factors.
Reclassifications. Certain reclassifications have been made to the prior year financial information to conform tothe current year presentation.
34958_omni_82p.pdf pg 7 April 5, 2016 11:52:38

OMNICOM GROUP INC. AND SUBSIDIARIESNOTES TO CONSOLIDATED FINANCIAL STATEMENTS (Continued)
F-15
3. Net Income per Common Share
The computations of basic and diluted net income per common share for the three years ended December 31,2015 were (in millions, except per share amounts):
2015 2014 2013______________ ___________ ___________Net Income Available for Common Shares:
Net income – Omnicom Group Inc. . . . . . . . . . . . . . . . . . . . . . $1,093.9 $1,104.0 $991.1Net income allocated to participating securities . . . . . . . . . . . . . (12.4) (20.4) (25.1)______________ ______________ ___________
$1,081.5 $1,083.6 $966.0______________ ______________ _________________________ ______________ ___________Weighted Average Shares:
Basic . . . . . . . . . . . . . . . . . . . . . . . . . . . . . . . . . . . . . . . . . . . . . . 244.2 253.9 258.9Dilutive stock options and restricted shares . . . . . . . . . . . . . . . . 1.0 1.4 1.5______________ ______________ ___________Diluted . . . . . . . . . . . . . . . . . . . . . . . . . . . . . . . . . . . . . . . . . . . . 245.2 255.3 260.4______________ ______________ _________________________ ______________ ___________
Anti-dilutive stock options and restricted shares . . . . . . . . . . . . . . . 0.1 0.6 0.7Net Income per Common Share – Omnicom Group Inc.:
Basic . . . . . . . . . . . . . . . . . . . . . . . . . . . . . . . . . . . . . . . . . . . . . . $ 4.43 $ 4.27 $ 3.73Diluted . . . . . . . . . . . . . . . . . . . . . . . . . . . . . . . . . . . . . . . . . . . . $ 4.41 $ 4.24 $ 3.71
4. Business Combinations
In 2015, we completed 8 acquisitions of new subsidiaries, which increased goodwill $144.7 million.Approximately $28.3 million of the goodwill recorded in 2015 is expected to be deductible for income tax purposes.Further, we acquired additional equity interests in certain majority owned subsidiaries, which are accounted for asequity transactions and no additional goodwill was recorded. None of the acquisitions in 2015, either individuallyor in the aggregate, was material to our results of operations or financial position.
The valuation of the acquired businesses is based on various factors, including specialized know-how,reputation, geographic coverage, competitive position and service offerings, as well as our experience and judgment.Our acquisition strategy is focused on acquiring the expertise of an assembled workforce in order to continue tobuild upon the core capabilities of our strategic business platforms and agency brands, through the expansion oftheir geographic area or their service capabilities to better serve our clients. Certain acquisitions include an initialpayment at closing and provide for future additional contingent purchase price payments (earn-outs), which arederived using the performance of the acquired entity and are based on predetermined formulas. The liability forcontingent purchase price obligations was $322.0 million and $300.7 million at December 31, 2015 and 2014,respectively, of which $81.5 million and $105.5 million, respectively, is included in other current liabilities.
For each acquisition, we undertake a detailed review to identify other intangible assets and a valuation isperformed for all such identified assets. We use several market participant measurements to determine fair value.This approach includes consideration of similar and recent transactions, as well as utilizing discounted expected cashflow methodologies and when available and as appropriate, we use comparative market multiples to supplement ouranalysis. As is typical for most service businesses, a substantial portion of the intangible asset value we acquire is thespecialized know-how of the workforce, which is treated as part of goodwill and is not valued separately. Asignificant portion of the identifiable intangible assets acquired is derived from customer relationships, including therelated customer contracts, as well as trade names. One of the primary drivers in executing our acquisition strategy isthe existence of, or the ability to, expand our existing client relationships. The expected benefits of our acquisitionsare typically shared across multiple agencies and regions.
05.68250-notes.qxp 3/31/16 6:53 PM Page 15

OMNICOM GROUP INC. AND SUBSIDIARIESNOTES TO CONSOLIDATED FINANCIAL STATEMENTS (Continued)
F-16
5. Goodwill and Intangible Assets
Goodwill and intangible assets at December 31, 2015 and 2014 were (in millions):
2015 2014_______________________________________________________________________ _____________________________________________________________________Gross Net Gross Net
Carrying Accumulated Carrying Carrying Accumulated CarryingValue Amortization Value Value Amortization Value___________________ ________________________ __________________ ___________________ ________________________ __________________
Goodwill . . . . . . . . . . . . . . . . . . . . $9,205.7 $(529.3) $8,676.4 $9,377.6 $(555.4) $8,822.2______________ ____________ ______________ ______________ ____________ ____________________________ ____________ ______________ ______________ ____________ ______________
Intangible assets:
Purchased and internally developed software . . . . . . . . $ 310.5 $(239.9) $ 70.6 $ 298.7 $(221.4) $ 77.3
Customer related and other . . . 715.0 (440.8) 274.2 702.1 (390.0) 312.1______________ ____________ ______________ ______________ ____________ ______________
$1,025.5 $(680.7) $ 344.8 $1,000.8 $(611.4) $ 389.4______________ ____________ ______________ ______________ ____________ ____________________________ ____________ ______________ ______________ ____________ ______________
Changes in goodwill for the years ended December 31, 2015 and 2014 were (in millions):
2015 2014__________________ __________________
January 1 . . . . . . . . . . . . . . . . . . . . . . . . . . . . . . . . . . . . . . . . . . . . . . . . . . . . . . . . . . . . . . . . . $8,822.2 $8,916.0Acquisitions . . . . . . . . . . . . . . . . . . . . . . . . . . . . . . . . . . . . . . . . . . . . . . . . . . . . . . . . . . . . . . . 144.7 222.4Dispositions . . . . . . . . . . . . . . . . . . . . . . . . . . . . . . . . . . . . . . . . . . . . . . . . . . . . . . . . . . . . . . . (3.0) (3.0)Foreign currency translation . . . . . . . . . . . . . . . . . . . . . . . . . . . . . . . . . . . . . . . . . . . . . . . . . . (287.5) (313.2)______________ ______________December 31 . . . . . . . . . . . . . . . . . . . . . . . . . . . . . . . . . . . . . . . . . . . . . . . . . . . . . . . . . . . . . . $8,676.4 $8,822.2______________ ____________________________ ______________
There were no goodwill impairment losses recorded in 2015 or 2014 and there are no accumulated goodwillimpairment losses. Goodwill for acquisitions completed in 2015 and 2014 includes $19.3 million and$43.5 million, respectively, of goodwill attributed to noncontrolling interests in the acquired businesses.
6. Debt
Credit Facilities
As a source of short-term financing, we have a $2.5 billion revolving credit facility (“Credit Facility”),domestic and international uncommitted credit lines and we can issue up to $2 billion of commercial paper. InJuly 2015, we extended the term of our Credit Facility to July 31, 2020. The uncommitted credit lines aggregate$1.2 billion and $937.8 million at December 31, 2015 and 2014, respectively. There were no outstandingcommercial paper issuances or borrowings under the Credit Facility or the uncommitted credit lines atDecember 31, 2015 and 2014.
Available and unused credit lines at December 31, 2015 and 2014 were (in millions):
2015 2014__________________ __________________
Credit Facility . . . . . . . . . . . . . . . . . . . . . . . . . . . . . . . . . . . . . . . . . . . . . . . . . . . . . . . . . . . . . $2,500.0 $2,500.0Uncommitted credit lines . . . . . . . . . . . . . . . . . . . . . . . . . . . . . . . . . . . . . . . . . . . . . . . . . . . . 1,157.7 937.8______________ ______________Available and unused credit lines . . . . . . . . . . . . . . . . . . . . . . . . . . . . . . . . . . . . . . . . . . . . . . . $3,657.7 $3,437.8______________ ____________________________ ______________
The Credit Facility contains financial covenants that require us to maintain a Leverage Ratio of consolidatedindebtedness to consolidated EBITDA of no more than 3 times for the most recently ended 12-month period(EBITDA is defined as earnings before interest, taxes, depreciation and amortization) and an Interest Coverage Ratioof consolidated EBITDA to interest expense of at least 5 times for the most recently ended 12-month period. AtDecember 31, 2015, we were in compliance with these covenants as our Leverage Ratio was 2.1 times and ourInterest Coverage Ratio was 12.2 times. The Credit Facility does not limit our ability to declare or pay dividends orrepurchase our common stock.
05.68250-notes.qxp 3/31/16 6:53 PM Page 16

OMNICOM GROUP INC. AND SUBSIDIARIESNOTES TO CONSOLIDATED FINANCIAL STATEMENTS (Continued)
F-17
Short-Term Debt
Short-term debt at December 31, 2015 and 2014, of $5.2 million and $7.2 million, respectively, representsbank overdrafts of our international subsidiaries. Due to the short-term nature of this debt, carrying valueapproximates fair value. At December 31, 2015 and 2014, the weighted average interest rate on this debt was3.7% and 6.0%, respectively.
Long-Term Debt
Long-term debt at December 31, 2015 and 2014 was (in millions):
2015 2014__________________ __________________
5.9% Senior Notes due 2016 . . . . . . . . . . . . . . . . . . . . . . . . . . . . . . . . . . . . . . . . . . . . . . . . . $ 1,000.0 $ 1,000.06.25% Senior Notes due 2019 . . . . . . . . . . . . . . . . . . . . . . . . . . . . . . . . . . . . . . . . . . . . . . . . 500.0 500.04.45% Senior Notes due 2020 . . . . . . . . . . . . . . . . . . . . . . . . . . . . . . . . . . . . . . . . . . . . . . . . 1,000.0 1,000.03.625% Senior Notes due 2022 . . . . . . . . . . . . . . . . . . . . . . . . . . . . . . . . . . . . . . . . . . . . . . . 1,250.0 1,250.03.65% Senior Notes due 2024 . . . . . . . . . . . . . . . . . . . . . . . . . . . . . . . . . . . . . . . . . . . . . . . . 750.0 750.0Other debt . . . . . . . . . . . . . . . . . . . . . . . . . . . . . . . . . . . . . . . . . . . . . . . . . . . . . . . . . . . . . . . . 0.3 0.5_______________ _______________
4,500.3 4,500.5Unamortized premium (discount) on senior notes, net . . . . . . . . . . . . . . . . . . . . . . . . . . . . . . 10.1 11.1Debt issuance costs . . . . . . . . . . . . . . . . . . . . . . . . . . . . . . . . . . . . . . . . . . . . . . . . . . . . . . . . . (16.9) (20.5)Adjustment to carrying value for interest rate swaps . . . . . . . . . . . . . . . . . . . . . . . . . . . . . . . . 72.1 51.4_______________ _______________
4,565.6 4,542.5Current portion . . . . . . . . . . . . . . . . . . . . . . . . . . . . . . . . . . . . . . . . . . . . . . . . . . . . . . . . . . . . (1,001.4) (0.4)_______________ _______________
Long-term debt . . . . . . . . . . . . . . . . . . . . . . . . . . . . . . . . . . . . . . . . . . . . . . . . . . . . . . . . . . $ 3,564.2 $ 4,542.1_______________ ______________________________ _______________
The contractual maturities of our long-term debt at December 31, 2015 are (in millions):
2016 . . . . . . . . . . . . . . . . . . . . . . . . . . . . . . . . . . . . . . . . . . . . . . . . . . . . . . . . . . . . . . . . . . . . . . . . . . . . . . $1,000.32017 . . . . . . . . . . . . . . . . . . . . . . . . . . . . . . . . . . . . . . . . . . . . . . . . . . . . . . . . . . . . . . . . . . . . . . . . . . . . . . —2018 . . . . . . . . . . . . . . . . . . . . . . . . . . . . . . . . . . . . . . . . . . . . . . . . . . . . . . . . . . . . . . . . . . . . . . . . . . . . . . —2019 . . . . . . . . . . . . . . . . . . . . . . . . . . . . . . . . . . . . . . . . . . . . . . . . . . . . . . . . . . . . . . . . . . . . . . . . . . . . . . 500.02020 . . . . . . . . . . . . . . . . . . . . . . . . . . . . . . . . . . . . . . . . . . . . . . . . . . . . . . . . . . . . . . . . . . . . . . . . . . . . . . 1,000.0Thereafter . . . . . . . . . . . . . . . . . . . . . . . . . . . . . . . . . . . . . . . . . . . . . . . . . . . . . . . . . . . . . . . . . . . . . . . . . . 2,000.0______________
$4,500.3____________________________
Omnicom and its wholly owned finance subsidiary Omnicom Capital Inc. (“OCI”) are co-obligors under allthe senior notes. The senior notes are a joint and several liability of us and OCI and we unconditionally guaranteeOCI’s obligations with respect to the senior notes. OCI provides funding for our operations by incurring debt andlending the proceeds to our operating subsidiaries. OCI’s assets consist of cash and cash equivalents andintercompany loans made to our operating subsidiaries and the related interest receivable. There are no restrictionson the ability of OCI or us to obtain funds from our subsidiaries through dividends, loans or advances. Our seniornotes are senior unsecured obligations that rank equal in right of payment with all existing and future unsecuredsenior indebtedness.
On March 26, 2015, in connection with the maturity of our 5.9% Senior Notes on April 15, 2016 (“2016Notes”), we entered into a $1.0 billion forward-starting interest rate swap. The swap mitigates the risk of changes inthe semi-annual interest payments from inception to May 2, 2016, the contractual termination date, and isdesignated as a cash flow hedge. The swap effectively locks in the fixed interest rate, excluding the effect of ourcredit spread, on any refinancing at 2.32%. The swap is carried at fair value and any net gain or loss is recorded inaccumulated other comprehensive income. Upon settlement of the swap, any gain or loss on the effective portion ofthe swap will be amortized to interest expense over the term of the new debt or will be recorded in results ofoperations if the refinancing is not completed. At December 31, 2015, we recorded a liability of $5.6 million, which
05.68250-notes.qxp 3/31/16 6:53 PM Page 17

OMNICOM GROUP INC. AND SUBSIDIARIESNOTES TO CONSOLIDATED FINANCIAL STATEMENTS (Continued)
F-18
is included in other current liabilities and the related loss of $3.3 million, net of income taxes, is recorded inaccumulated other comprehensive income, and almost no hedge ineffectiveness is recorded. The 2016 Notes areclassified as current.
In May 2014, we entered into a fixed-to-floating interest rate swap on the $1.25 billion principal amount ofthe 3.625% Senior Notes due 2022 (“2022 Notes”). In September 2014 we entered into a fixed-to-floating interestrate swap on the $1 billion principal amount of the 4.45% Senior Notes due 2020 (“2020 Notes”).
In October 2015, we terminated the swap on the 2020 Notes and realized a gain of $36.9 million and wereduced the notional amount of the swap on the 2022 Notes to $1.0 billion and realized a gain of $13.5 million.The gains will be amortized to interest expense over the remaining term of the notes. Additionally, in October 2015,we entered into a fixed-to-floating interest rate swap on the $750 million principal amount of the 3.65% SeniorNotes due 2024 (“2024 Notes”). The swaps hedge the risk of changes in fair value of the notes attributable tochanges in the benchmark LIBOR interest rate. We receive fixed interest rate payments equal to the couponinterest rate on the notes and pay a variable interest rate equal to three month LIBOR, plus a spread of 1.05% onthe 2022 Notes and a spread of 1.72% on the 2024 Notes. The swaps qualify and are designated as fair valuehedges on the 2022 Notes and 2024 Notes and have the economic effect of converting the notes from fixed rateobligations to floating rate obligations. Gains and losses attributed to changes in the fair value of the swapssubstantially offset changes in the fair value of the notes attributed to changes in the benchmark interest rate.The net interest settlement is recorded in interest expense. At December 31, 2015, we recorded a receivable of$32.2 million, which is included in other assets, on the swap on the 2022 Notes and a liability of $10.0 million,which is included in long-term liabilities, on the swap of the 2024 Notes. At December 31, 2014 we recorded areceivable of $42.7 million, which is included in other assets, on the swaps on the 2020 Notes and the 2022 Notes.The receivable and liability represent the fair value of the swaps that is substantially offset by the change in thecarrying value of the notes reflecting the change in fair value of the notes. Accordingly, any hedge ineffectiveness wasnot material to our results of operations. On January 19, 2016, we terminated the remaining $1.0 billion notionalamount of the swap on the 2022 Notes.
Convertible Debt
There was no convertible debt outstanding at December 31, 2015 and 2014.
On July 31, 2014, we redeemed the outstanding Convertible Notes due July 31, 2032 (“2032 Notes”) for$252.7 million in cash. Prior to redemption, the noteholders converted their notes into 1,217,112 shares of ourcommon stock. On June 17, 2013, we redeemed the outstanding Convertible Notes due 2033 (“2033 Notes”) andthe Convertible Notes due 2038 (“2038 Notes”) for $406.1 million in cash. Prior to redemption, the noteholdersconverted their notes into 1,499,792 shares of our common stock.
Interest Expense
Interest expense for the three years ended December 31, 2015 is composed of (in millions):2015 2014 2013______________ ______________ ______________
Long-term debt . . . . . . . . . . . . . . . . . . . . . . . . . . . . . . . . . . . . . . . . . . . . . . . . $210.2 $192.7 $182.0Interest rate swaps . . . . . . . . . . . . . . . . . . . . . . . . . . . . . . . . . . . . . . . . . . . . . . (53.3) (37.7) (7.3)Commercial paper . . . . . . . . . . . . . . . . . . . . . . . . . . . . . . . . . . . . . . . . . . . . . . 4.8 2.9 1.7Fees . . . . . . . . . . . . . . . . . . . . . . . . . . . . . . . . . . . . . . . . . . . . . . . . . . . . . . . . . 5.7 6.2 6.5Other . . . . . . . . . . . . . . . . . . . . . . . . . . . . . . . . . . . . . . . . . . . . . . . . . . . . . . . . 13.7 13.1 14.3___________ ___________ ___________
$181.1 $177.2 $197.2___________ ___________ ______________________ ___________ ___________
05.68250-notes.qxp 3/31/16 7:21 PM Page 18

OMNICOM GROUP INC. AND SUBSIDIARIESNOTES TO CONSOLIDATED FINANCIAL STATEMENTS (Continued)
F-19
7. Segment Reporting
Our five branded agency networks operate in the advertising, marketing and corporate communicationsservices industry, and are organized into agency networks, virtual client networks, regional reporting units andoperating groups. Our networks, virtual client networks and agencies increasingly share clients and provide clientswith integrated services. The main economic components of each agency are employee compensation and relatedcosts and direct service costs and office and general costs which include rent and occupancy costs, technology costsand other overhead expenses. Therefore, given these similarities, we aggregate our operating segments, which are ourfive agency networks, into one reporting segment.
The agency networks’ regional reporting units comprise three principal regions; the Americas, EMEA and AsiaPacific. The regional reporting units monitor the performance and are responsible for the agencies in their region.Agencies within the regional reporting units serve similar clients in similar industries and in many cases the sameclients and have similar economic characteristics.
Revenue and long-lived assets and goodwill by geographic region as of and for the three years endedDecember 31, 2015 were (in millions):
Americas EMEA Asia Pacific__________________ __________________ ____________________2015
Revenue . . . . . . . . . . . . . . . . . . . . . . . . . . . . . . . . . . . . . . . . . . . . . . $9,359.0 $4,203.5 $1,571.9Long-lived assets and goodwill . . . . . . . . . . . . . . . . . . . . . . . . . . . . . 6,103.4 2,737.8 527.9
2014Revenue . . . . . . . . . . . . . . . . . . . . . . . . . . . . . . . . . . . . . . . . . . . . . . $9,111.7 $4,602.5 $1,603.6Long-lived assets and goodwill . . . . . . . . . . . . . . . . . . . . . . . . . . . . . 6,157.8 2,800.8 571.6
2013Revenue . . . . . . . . . . . . . . . . . . . . . . . . . . . . . . . . . . . . . . . . . . . . . . $8,597.1 $4,407.4 $1,580.0Long-lived assets and goodwill . . . . . . . . . . . . . . . . . . . . . . . . . . . . . 6,082.6 2,984.6 586.2
The Americas comprises North America, which includes the United States, Canada and Puerto Rico, and LatinAmerica, which includes Mexico. EMEA comprises the United Kingdom, the Euro currency countries, other Europeancountries that have not adopted the European Union Monetary standard, the Middle East and Africa. Asia Pacificcomprises Australia, China, India, Japan, Korea, New Zealand, Singapore and other Asian countries. Revenue in theUnited States in 2015, 2014 and 2013 was $8,526.7 million, $8,185.9 million and $7,569.7 million, respectively.
8. Equity Method Investments
Income from our equity method investments in 2015, 2014 and 2013 was $8.4 million, $16.2 million and$15.9 million, respectively, and our proportionate share in their net assets at December 31, 2015 and 2014 was$45.3 million and $49.0 million, respectively. Our equity method investments are not material to our results ofoperations or financial position; therefore, summarized financial information is not required to be presented.
9. Share-Based Compensation Plans
Share-based incentive awards are granted to employees under the 2013 Incentive Award Plan (“2013 Plan”),which is administered by the Compensation Committee of the Board of Directors (“Compensation Committee”).Awards include stock options, restricted stock and other stock awards. The maximum number of shares of commonstock that can be granted under the 2013 Plan is 33 million shares plus any shares awarded under the 2013 Planand any prior plan that have been forfeited or have expired. Stock option awards reduce the number of sharesavailable for grant on a one-for-one basis and all other awards reduce the number of shares available for grant by3.5 shares for each share awarded. The terms of each award and the exercise date are determined by theCompensation Committee. The 2013 Plan does not permit the holder of an award to elect cash settlement underany circumstances. At December 31, 2015, there were 31,635,829 shares available for grant under the 2013 Plan. Ifall shares available for grant were for awards other than stock options, shares available for grant would be 9,038,808.
05.68250-notes.qxp 3/31/16 6:53 PM Page 19

OMNICOM GROUP INC. AND SUBSIDIARIESNOTES TO CONSOLIDATED FINANCIAL STATEMENTS (Continued)
F-20
Share-based compensation expense in 2015, 2014 and 2013 was $99.4 million, $93.5 million and$86.3 million, respectively. At December 31, 2015, unamortized share-based compensation that will be expensedover the next five years is $185.7 million. We record a deferred tax asset for the share-based compensation expenserecognized for financial reporting purposes that has not been deducted on our income tax return. If the actual taxdeduction exceeds the deferred tax asset, the difference is recorded in additional paid-in capital (“APIC Pool”). If theactual tax deduction is less than the deferred tax asset and no APIC Pool exists, the difference is recorded in resultsof operations. To the extent that future tax deductions are less than the deferred tax assets recorded, we expect tohave sufficient excess tax benefits within the APIC Pool available to offset any potential future shortfall.
Stock Options
The exercise price of stock option awards cannot be less than 100% of the market price of our common stockon the grant date and the option term cannot exceed ten years from the grant date. Generally, stock option awardsvest 30% per year in the first two years and are fully vested three years from the grant date.
Stock option activity for the three years ended December 31, 2015 was:
2015 2014 2013__________________________________________ ___________________________________________ __________________________________________Weighted Weighted WeightedAverage Average AverageExercise Exercise Exercise
Shares Price Shares Price Shares Price___________ ________ ___________ ________ ___________ ________
January 1 . . . . . . . . . . . . . . . . . . . . . . . . 1,652,140 $27.97 2,643,680 $26.39 5,590,880 $25.72Granted . . . . . . . . . . . . . . . . . . . . . . . . . . — 60,000 $66.16 60,000 $70.68Exercised . . . . . . . . . . . . . . . . . . . . . . . . . (511,593) $25.98 (1,046,540) $26.19 (3,021,200) $26.01(Forfeited) reinstated . . . . . . . . . . . . . . . . — (5,000) $23.40 14,000 $23.40__________________ __________________ __________________December 31 . . . . . . . . . . . . . . . . . . . . . 1,140,547 $28.86 1,652,140 $27.97 2,643,680 $26.39__________________ __________________ ____________________________________ __________________ __________________Exercisable December 31 . . . . . . . . . . . . 1,074,547 $26.47 1,526,140 $24.95 2,505,680 $24.67__________________ __________________ ____________________________________ __________________ __________________
Options outstanding and exercisable at December 31, 2015 were:
Options Outstanding Options Exercisable________________________________________________ _____________________________Weighted Average
Exercise Remaining Weighted Average Weighted AveragePrices Range Shares Contractual Life Exercise Price Shares Exercise Price_________________ ___________ ________________ ________________ __________ ________________
$23.40 to $29.99 . . . . . . . . . 978,547 3.2 years $23.40 978,547 $23.40$30.00 to $44.99 . . . . . . . . . 21,000 5.9 years $43.49 21,000 $43.49$45.00 to $59.99 . . . . . . . . . 30,000 6.8 years $49.65 30,000 $49.65$60.00 to $70.68 . . . . . . . . . 111,000 8.3 years $68.60 45,000 $69.78________ ________
1,140,547 1,074,547________ ________________ ________
The fair value of each grant was determined on the grant date using the Black-Scholes option valuationmodel. The Black-Scholes assumptions (without adjusting for the risk of forfeiture and lack of liquidity) and theweighted average fair value per share for options granted were:
2014 2013__________________________ __________________________
Expected option lives . . . . . . . . . . . . . . . . . . . . . . . . . . . . . . . . . . . . . . . . . . . . . 5 years 5 yearsRisk free interest rate . . . . . . . . . . . . . . . . . . . . . . . . . . . . . . . . . . . . . . . . . . . . . 1.4% 1.4%Expected volatility . . . . . . . . . . . . . . . . . . . . . . . . . . . . . . . . . . . . . . . . . . . . . . . . 22.3% 26.0%Dividend yield . . . . . . . . . . . . . . . . . . . . . . . . . . . . . . . . . . . . . . . . . . . . . . . . . . 3.0% 2.0%Weighted average fair value per option granted . . . . . . . . . . . . . . . . . . . . . . . . . . $10.50 $14.50
05.68250-notes.qxp 3/31/16 6:53 PM Page 20

OMNICOM GROUP INC. AND SUBSIDIARIESNOTES TO CONSOLIDATED FINANCIAL STATEMENTS (Continued)
F-21
Restricted Stock
Restricted stock activity for the three years ended December 31, 2015 was:
2015 2014 2013_____________________ _____________________ _____________________January 1 . . . . . . . . . . . . . . . . . . . . . . . . . . . . . . . . . . . . . . . 5,040,641 6,090,697 7,241,490Granted . . . . . . . . . . . . . . . . . . . . . . . . . . . . . . . . . . . . . . . . 1,208,964 915,922 706,900Vested . . . . . . . . . . . . . . . . . . . . . . . . . . . . . . . . . . . . . . . . . (1,631,343) (1,619,444) (1,490,786)Forfeited . . . . . . . . . . . . . . . . . . . . . . . . . . . . . . . . . . . . . . . (269,157) (346,534) (366,907)_________________ _________________ _________________December 31 . . . . . . . . . . . . . . . . . . . . . . . . . . . . . . . . . . . . 4,349,105 5,040,641 6,090,697_________________ _________________ __________________________________ _________________ _________________Weighted average grant date fair value of
shares granted in the period . . . . . . . . . . . . . . . . . . . . . . . $64.49 $64.92 $60.98Weighted average grant date fair value at December 31 . . . . $55.08 $50.98 $47.47
Generally, restricted shares vest 20% per year and are fully vested five years from the grant date provided theemployee remains employed by us. Restricted shares may not be sold, transferred, pledged or otherwise encumbereduntil the forfeiture restrictions lapse. Under most circumstances, the employee forfeits the shares if employmentceases prior to the end of the restriction period.
Performance Restricted Stock Units
The Compensation Committee grants certain employees performance restricted stock units (“PRSUs”). EachPRSU represents the right to receive one share of common stock on vesting. The ultimate number of PRSUsreceived by the employee depends on the Company’s average return on equity over a three year period compared tothe average return on equity of a peer group of four principal competitors over the same period. Generally, thePRSUs vest three years from grant date. The PRSUs have a service and performance vesting condition andcompensation expense is recognized on a graded-vesting basis. Over the performance period, compensation expenseis adjusted upward or downward based on our estimate of the probability of achieving the performance target forthe portion of the awards subject to the performance vesting condition. We assume that substantially all the PRSUswill vest.
PRSU activity of the three years ended December 31, 2015 was:
2015 2014 2013__________________________________________ ___________________________________________ __________________________________________Weighted Weighted WeightedAverage Average Average
Grant Date Grant Date Grant DateShares Fair Value Shares Fair Value Shares Fair Value___________ ________ ___________ ________ ___________ ________
January 1 . . . . . . . . . . . . . . . . . . . . . . . . 622,859 $56.16 681,555 $51.19 538,948 $48.74Granted . . . . . . . . . . . . . . . . . . . . . . . . . . 161,625 77.68 188,621 69.89 183,998 57.77Distributed . . . . . . . . . . . . . . . . . . . . . . . (239,387) 48.94 (165,562) 48.56 (41,391) 48.56Forfeited . . . . . . . . . . . . . . . . . . . . . . . . . (10,641) 48.87 (81,755) 61.76 — —_____________ _____________ _____________December 31 . . . . . . . . . . . . . . . . . . . . . 534,456 $66.05 622,859 $56.16 681,555 $51.19_____________ _____________ __________________________ _____________ _____________
ESPP
We have an employee stock purchase plan (“ESPP”) that enables employees to purchase our common stockthrough payroll deductions over each plan quarter at 95% of the market price on the last trading day of the planquarter. Purchases are limited to 10% of eligible compensation as defined by the Employee Retirement Income SecurityAct of 1974 (“ERISA”). In 2015, 2014 and 2013, employees purchased 111,849 shares, 113,293 shares and 175,002shares, respectively. All shares purchased were treasury stock, for which we received $7.8 million, $8.0 million and$9.9 million, respectively. At December 31, 2015, there were 8,966,234 shares available for the ESPP.
05.68250-notes.qxp 3/31/16 6:53 PM Page 21

OMNICOM GROUP INC. AND SUBSIDIARIESNOTES TO CONSOLIDATED FINANCIAL STATEMENTS (Continued)
F-22
10. Income Taxes
We file a consolidated U.S. federal income tax return and income tax returns in various state and localjurisdictions. Our subsidiaries file tax returns in various foreign jurisdictions. Our principal foreign jurisdictionsinclude the United Kingdom, France and Germany. The Internal Revenue Service has completed its examination ofour federal tax returns through 2010. Tax returns in the United Kingdom, France and Germany have been examinedthrough 2012, 2010 and 2009, respectively.
Income before income taxes for the three years ended December 31, 2015 was (in millions):
2015 2014 2013_________________ _________________ _________________
Domestic . . . . . . . . . . . . . . . . . . . . . . . . . . . . . . . . . . . . . . . . . . . . . . . . . . . $ 803.3 $ 739.9 $ 629.4International . . . . . . . . . . . . . . . . . . . . . . . . . . . . . . . . . . . . . . . . . . . . . . . . . 975.3 1,070.1 1,031.5______________ ______________ ______________
$1,778.6 $1,810.0 $1,660.9______________ ______________ ____________________________ ______________ ______________
Income tax expense (benefit) for the three years ended December 31, 2015 was (in millions):2015 2014 2013_________________ _________________ _________________
Current:Federal . . . . . . . . . . . . . . . . . . . . . . . . . . . . . . . . . . . . . . . . . . . . . . . . . . . . . $ 342.3 $ 356.1 $246.3State and local . . . . . . . . . . . . . . . . . . . . . . . . . . . . . . . . . . . . . . . . . . . . . . . 29.9 38.1 30.6International . . . . . . . . . . . . . . . . . . . . . . . . . . . . . . . . . . . . . . . . . . . . . . . . . 324.5 344.8 336.5____________ ____________ ___________
696.7 739.0 613.4____________ ____________ ___________Deferred:
Federal . . . . . . . . . . . . . . . . . . . . . . . . . . . . . . . . . . . . . . . . . . . . . . . . . . . . . (86.7) (106.4) 0.3State and local . . . . . . . . . . . . . . . . . . . . . . . . . . . . . . . . . . . . . . . . . . . . . . . 12.1 (2.3) (3.6)International . . . . . . . . . . . . . . . . . . . . . . . . . . . . . . . . . . . . . . . . . . . . . . . . . (38.5) (37.2) (44.9)____________ ____________ ___________
(113.1) (145.9) (48.2)____________ ____________ ___________$ 583.6 $ 593.1 $565.2____________ ____________ _______________________ ____________ ___________
The reconciliation from the statutory U.S. federal income tax rate to our effective tax rate is:2015 2014 2013_____________ _____________ _____________
Statutory U.S. federal income tax rate . . . . . . . . . . . . . . . . . . . . . . . . . . . . . . . 35.0% 35.0% 35.0%State and local income taxes, net of federal income tax benefit . . . . . . . . . . . . . 1.5 1.3 1.0International tax rate differentials . . . . . . . . . . . . . . . . . . . . . . . . . . . . . . . . . . . (3.7) (3.3) (3.0)Other . . . . . . . . . . . . . . . . . . . . . . . . . . . . . . . . . . . . . . . . . . . . . . . . . . . . . . . . — (0.2) 1.0_______ _______ _______Effective tax rate . . . . . . . . . . . . . . . . . . . . . . . . . . . . . . . . . . . . . . . . . . . . . . . . 32.8% 32.8% 34.0%_______ _______ ______________ _______ _______
The international tax rate differentials are primarily attributed to our earnings in the U.K., Germany, France,the United Arab Emirates and Singapore being taxed at different rates than the U.S. statutory tax rate. Income taxexpense for 2014 reflects the recognition of an income tax benefit of approximately $11 million related to previouslyincurred expenses for the proposed merger with Publicis Groupe S.A. (“Publicis”). On May 8, 2014, the proposedmerger was terminated. Prior to the termination of the merger, the majority of the merger costs, which wereincurred in 2013, were capitalized for income tax purposes and the related tax benefits were not recorded. Becausethe merger was terminated, the merger costs were no longer required to be capitalized for income tax purposes.Excluding the income tax benefit of $11 million related to the proposed merger, income tax expense for 2014 wouldhave been $604.5 million. The decrease in the effective tax rate for 2015 from the effective tax rate for 2014,excluding the income tax benefit related to the proposed merger, is primarily due to a legal entity restructuring ofour European operations. As a result of the reorganization, a certain portion of the foreign earnings in the affectedcountries is subject to lower effective tax rates.
Income tax expense for 2015, 2014 and 2013 includes $1.1 million, $1.7 million and $1.6 million,respectively, of interest, net of tax benefit, and penalties related to tax positions taken on our tax returns. AtDecember 31, 2015 and 2014, the accrued interest and penalties were $8.4 million and $14.2 million, respectively.
05.68250-notes.qxp 3/31/16 6:53 PM Page 22

OMNICOM GROUP INC. AND SUBSIDIARIESNOTES TO CONSOLIDATED FINANCIAL STATEMENTS (Continued)
F-23
The components of deferred tax assets and liabilities at December 31, 2015 and 2014 were (in millions):
2015 2014_________________ _________________
Deferred tax assets:Compensation and severance . . . . . . . . . . . . . . . . . . . . . . . . . . . . . . . . . . . . . . . . . . . . . . . $ 293.8 $ 311.9Tax loss and credit carryforwards . . . . . . . . . . . . . . . . . . . . . . . . . . . . . . . . . . . . . . . . . . . . 113.3 95.6Basis differences from acquisitions . . . . . . . . . . . . . . . . . . . . . . . . . . . . . . . . . . . . . . . . . . . 37.1 38.0Basis differences from short-term assets and liabilities . . . . . . . . . . . . . . . . . . . . . . . . . . . . 27.2 27.8Other . . . . . . . . . . . . . . . . . . . . . . . . . . . . . . . . . . . . . . . . . . . . . . . . . . . . . . . . . . . . . . . . . 26.9 33.0______________ ______________Deferred tax assets . . . . . . . . . . . . . . . . . . . . . . . . . . . . . . . . . . . . . . . . . . . . . . . . . . . . . . . 498.3 506.3Valuation allowance . . . . . . . . . . . . . . . . . . . . . . . . . . . . . . . . . . . . . . . . . . . . . . . . . . . . . . (35.3) (34.1)______________ ______________Net deferred tax assets . . . . . . . . . . . . . . . . . . . . . . . . . . . . . . . . . . . . . . . . . . . . . . . . . . . . $ 463.0 $ 472.2______________ ____________________________ ______________
Deferred tax liabilities:Goodwill and intangible assets . . . . . . . . . . . . . . . . . . . . . . . . . . . . . . . . . . . . . . . . . . . . . $ 729.5 $ 706.1Financial instruments . . . . . . . . . . . . . . . . . . . . . . . . . . . . . . . . . . . . . . . . . . . . . . . . . . . . 197.3 263.1Unremitted foreign earnings . . . . . . . . . . . . . . . . . . . . . . . . . . . . . . . . . . . . . . . . . . . . . . . 9.9 51.1Basis differences from investments . . . . . . . . . . . . . . . . . . . . . . . . . . . . . . . . . . . . . . . . . . . (4.6) (4.2)______________ ______________Deferred tax liabilities . . . . . . . . . . . . . . . . . . . . . . . . . . . . . . . . . . . . . . . . . . . . . . . . . . . . $ 932.1 $1,016.1______________ ____________________________ ______________
Long-term deferred tax liabilities . . . . . . . . . . . . . . . . . . . . . . . . . . . . . . . . . . . . . . . . . . . . . . $ 469.1 $ 543.9______________ ____________________________ ______________
Long-term deferred tax liabilities at December 31, 2014 were adjusted to reflect the retrospective adoption ofASU 2015-17 (See Note 2).
The American Recovery and Reinvestment Act of 2009 provided an election where qualifying cancellation ofindebtedness income for debt reacquired in 2009 and 2010 was deferred and included in taxable income from 2014to 2018. In 2009 and 2010, we redeemed $1.4 billion of our debt resulting in a tax liability of approximately$329 million. Through December 31, 2015, we paid $132 million of the liability and the remainder will be paidfrom 2016 through 2018. Substantially all the deferred tax liability for financial instruments at December 31, 2015and 2014, relates to the reacquired debt.
In 2014, as a result of the conversion of the 2032 Notes (See Note 6), we paid $66.2 million, representingthe excess of the accreted value of the notes for income tax purposes over the conversion value and reclassified$32.2 million, representing the difference between the issue price of the notes and the conversion value fromlong-term deferred tax liabilities to additional paid-in capital. As a result of the conversion of the 2033 Notes and2038 Notes in 2013 (See Note 6), in 2014 we paid $52.7 million, representing the excess of the accreted value ofthe notes for income tax purposes over the conversion value and in 2013 reclassified $34.5 million, representing thetax effect of the difference between the issue price of the notes and the conversion value from long-term deferred taxliabilities to additional paid-in capital.
We have concluded that it is more likely than not that we will be able to realize our net deferred tax assets infuture periods because results of future operations are expected to generate sufficient taxable income. The valuationallowance of $35.3 million and $34.1 million at December 31, 2015 and 2014, respectively, relates to tax loss andcredit carryforwards in the United States and international jurisdictions. Tax loss and credit carryforwards for whichthere is no valuation allowance are available for periods ranging from 2016 to 2035, which is longer than theforecasted utilization of such carryforwards.
We have not provided U.S. federal income and foreign withholding taxes on approximately $2.1 billion ofcumulative undistributed earnings of certain foreign subsidiaries. We intend to indefinitely reinvest these earnings inour international operations for working capital requirements and expansion in the region and we currently have noplans to repatriate these funds. We cannot determine the amount of taxes and foreign tax credits associated with thefuture repatriation of such earnings and therefore cannot quantify the tax liability.
05.68250-notes.qxp 3/31/16 6:53 PM Page 23

OMNICOM GROUP INC. AND SUBSIDIARIESNOTES TO CONSOLIDATED FINANCIAL STATEMENTS (Continued)
F-24
In 2015, the weakening of substantially all foreign currencies against the U.S. Dollar impacted the translationof approximately $1.1 billion of the cumulative undistributed earnings of certain foreign operations that are notindefinitely reinvested. The foreign tax credits on those earnings substantially offset the U.S. federal tax liability onany repatriation. We have provided $9.9 million of residual U.S. taxes on those earnings. Changes in internationaltax rules or changes in U.S. tax rules and regulations covering international operations and foreign tax credits mayaffect our future reported financial results or the way we conduct our business.
A reconciliation of our unrecognized tax benefits at December 31, 2015 and 2014 is (in millions):
2015 2014______________ ______________
January 1 . . . . . . . . . . . . . . . . . . . . . . . . . . . . . . . . . . . . . . . . . . . . . . . . . . . . . . . . . . . . . . . . . $139.8 $137.8Additions:
Current year tax positions . . . . . . . . . . . . . . . . . . . . . . . . . . . . . . . . . . . . . . . . . . . . . . . . . . 5.8 6.0Prior year tax positions . . . . . . . . . . . . . . . . . . . . . . . . . . . . . . . . . . . . . . . . . . . . . . . . . . . . 0.2 1.0
Reduction of prior year tax positions . . . . . . . . . . . . . . . . . . . . . . . . . . . . . . . . . . . . . . . . . . . . (25.1) 0.5Settlements . . . . . . . . . . . . . . . . . . . . . . . . . . . . . . . . . . . . . . . . . . . . . . . . . . . . . . . . . . . . . . . (6.0) (0.8)Lapse of statute of limitations . . . . . . . . . . . . . . . . . . . . . . . . . . . . . . . . . . . . . . . . . . . . . . . . . — (2.9)Foreign currency translation . . . . . . . . . . . . . . . . . . . . . . . . . . . . . . . . . . . . . . . . . . . . . . . . . . (1.7) (1.8)___________ ___________December 31 . . . . . . . . . . . . . . . . . . . . . . . . . . . . . . . . . . . . . . . . . . . . . . . . . . . . . . . . . . . . . . $113.0 $139.8___________ ______________________ ___________
The majority of the liability for uncertain tax positions is recorded in long-term liabilities. At December 31,2015 and 2014, approximately $52.2 million and $58.6 million, respectively, of the liability for uncertain taxpositions would affect our effective tax rate upon resolution of the uncertain tax positions.
11. Pension and Other Postemployment Benefits
Defined Contribution Plans
Our domestic and international subsidiaries provide retirement benefits for their employees primarily throughdefined contribution profit sharing and savings plans. Contributions to the plans vary by subsidiary and havegenerally been in amounts up to the maximum percentage of total eligible compensation of participating employeesthat is deductible for income tax purposes. Contribution expense in 2015, 2014 and 2013 was $105.7 million,$108.4 million and $109.3 million, respectively.
Defined Benefit Pension Plans
Two of our U.S. businesses and several of our non-U.S. businesses sponsor noncontributory defined benefitpension plans. These plans provide benefits to employees based on formulas recognizing length of service andearnings. The U.S. plans cover approximately 1,200 participants, are closed to new participants and do notaccrue future benefit credits. The non-U.S. plans, which include plans required by local law, cover approximately6,500 participants and are not covered by ERISA.
We have a Senior Executive Restrictive Covenant and Retention Plan (“Retention Plan”) for certain executiveofficers of Omnicom selected by the Compensation Committee. The Retention Plan is a non-qualified deferredcompensation severance plan that was adopted to secure non-competition, non-solicitation, non-disparagement andongoing consulting services from such executive officers and to strengthen the retention aspect of executive officercompensation. The Retention Plan provides annual payments upon termination following at least seven years ofservice with Omnicom or its subsidiaries to the participants or to their beneficiaries. A participant’s annual benefit ispayable for 15 consecutive calendar years following termination, but in no event prior to age 55. The annual benefitis equal to the lesser of (i) the participant’s final average pay times an applicable percentage, which is based upon theexecutive’s years of service as an executive officer, not to exceed 35% or (ii) $1.5 million adjusted for cost-of-living,beginning with the second annual payment, not to exceed 2.5% per year. The Retention Plan is not funded andbenefits are paid when due.
05.68250-notes.qxp 3/31/16 6:53 PM Page 24

OMNICOM GROUP INC. AND SUBSIDIARIESNOTES TO CONSOLIDATED FINANCIAL STATEMENTS (Continued)
F-25
The components of net periodic benefit cost for the three years ended December 31, 2015 were (in millions):
2015 2014 2013____________ ____________ ____________
Service cost . . . . . . . . . . . . . . . . . . . . . . . . . . . . . . . . . . . . . . . . . . . . . . . . . . . . $ 5.3 $ 6.8 $ 4.6Interest cost . . . . . . . . . . . . . . . . . . . . . . . . . . . . . . . . . . . . . . . . . . . . . . . . . . . . 7.6 8.2 7.3Expected return on plan assets . . . . . . . . . . . . . . . . . . . . . . . . . . . . . . . . . . . . . . (4.0) (4.2) (3.7)Amortization of prior service cost . . . . . . . . . . . . . . . . . . . . . . . . . . . . . . . . . . . 4.3 4.3 3.6Amortization of actuarial (gains) losses . . . . . . . . . . . . . . . . . . . . . . . . . . . . . . . 5.7 2.3 3.5_________ _________ _________
$18.9 $17.4 $15.3_________ _________ __________________ _________ _________
Included in accumulated other comprehensive income at December 31, 2015 and 2014 were unrecognizedactuarial gains and losses and unrecognized prior service cost of $95.0 million, $59.0 million net of tax, and$91.0 million, $56.0 million net of tax, respectively, that have not yet been recognized in net periodic benefit cost.The unrecognized actuarial gains and losses and unrecognized prior service cost included in accumulated othercomprehensive income and expected to be recognized in net periodic benefit cost in 2016 is $9.4 million.
The weighted average assumptions used to determine net periodic benefit cost for the three years endedDecember 31, 2015 were:
2015 2014 2013___________ ___________ ___________
Discount rate . . . . . . . . . . . . . . . . . . . . . . . . . . . . . . . . . . . . . . . . . . . . . . . . . . . 3.5% 4.5% 3.9%Compensation increases . . . . . . . . . . . . . . . . . . . . . . . . . . . . . . . . . . . . . . . . . . . 1.9% 1.8% 1.6%Expected return on plan assets . . . . . . . . . . . . . . . . . . . . . . . . . . . . . . . . . . . . . . 5.7% 5.8% 5.3%
The expected long-term rate of return for plan assets for the U.S. plans is based on several factors, includingcurrent and expected asset allocations, historical and expected returns on various asset classes and current and futuremarket conditions. A total return investment approach using a mix of equities and fixed income investmentsmaximizes the long-term return. This strategy is intended to minimize plan expense by achieving long-term returnsin excess of the growth in plan liabilities over time. The discount rate used to compute net periodic benefit cost isbased on yields of available high-quality bonds and reflects the expected cash flow as of the measurement date. Theexpected returns on plan assets and discount rates for the non-U.S. plans are based on local factors, including eachplan’s investment approach, local interest rates and plan participant profiles.
Experience gains and losses and the effects of changes in actuarial assumptions are generally amortized over aperiod no longer than the expected average future service of active employees.
Our funding policy is to contribute amounts sufficient to meet minimum funding requirements in accordancewith the applicable employee benefit and tax laws that the plans are subject to, plus such additional amounts as wemay determine to be appropriate. In 2015, 2014 and 2013, we contributed $4.2 million, $3.2 million, $5.5 million,respectively, to our defined benefit pension plans and we do not expect our 2016 contributions to differ materiallyfrom our 2015 contributions.
05.68250-notes.qxp 3/31/16 6:53 PM Page 25

OMNICOM GROUP INC. AND SUBSIDIARIESNOTES TO CONSOLIDATED FINANCIAL STATEMENTS (Continued)
F-26
At December 31, 2015 and 2014, the benefit obligation, fair value of plan assets and funded status of ourdefined benefit pension plans were (in millions):
2015 2014_______________ _______________
Benefit Obligation:January 1 . . . . . . . . . . . . . . . . . . . . . . . . . . . . . . . . . . . . . . . . . . . . . . . . . . . . . . . . . $ 222.7 $ 185.7Service cost . . . . . . . . . . . . . . . . . . . . . . . . . . . . . . . . . . . . . . . . . . . . . . . . . . . . . . . 5.3 6.8Interest cost . . . . . . . . . . . . . . . . . . . . . . . . . . . . . . . . . . . . . . . . . . . . . . . . . . . . . . . 7.6 8.2Actuarial (gains) losses . . . . . . . . . . . . . . . . . . . . . . . . . . . . . . . . . . . . . . . . . . . . . . . 5.9 31.3Benefits paid . . . . . . . . . . . . . . . . . . . . . . . . . . . . . . . . . . . . . . . . . . . . . . . . . . . . . . (7.2) (5.0)Foreign currency translation and other . . . . . . . . . . . . . . . . . . . . . . . . . . . . . . . . . . 0.5 (4.3)____________ ____________December 31 . . . . . . . . . . . . . . . . . . . . . . . . . . . . . . . . . . . . . . . . . . . . . . . . . . . . . . $ 234.8 $ 222.7____________ ________________________ ____________
Fair Value of Plan Assets:January 1 . . . . . . . . . . . . . . . . . . . . . . . . . . . . . . . . . . . . . . . . . . . . . . . . . . . . . . . . . $ 74.4 $ 72.2Actual return on plan assets . . . . . . . . . . . . . . . . . . . . . . . . . . . . . . . . . . . . . . . . . . . (0.5) 6.5Employer contributions . . . . . . . . . . . . . . . . . . . . . . . . . . . . . . . . . . . . . . . . . . . . . . 4.2 3.2Benefits paid . . . . . . . . . . . . . . . . . . . . . . . . . . . . . . . . . . . . . . . . . . . . . . . . . . . . . . (7.2) (5.0)Foreign currency translation and other . . . . . . . . . . . . . . . . . . . . . . . . . . . . . . . . . . (2.0) (2.5)____________ ____________December 31 . . . . . . . . . . . . . . . . . . . . . . . . . . . . . . . . . . . . . . . . . . . . . . . . . . . . . . $ 68.9 $ 74.4____________ ________________________ ____________
Funded Status December 31 . . . . . . . . . . . . . . . . . . . . . . . . . . . . . . . . . . . . . . . . . . $(165.9) $(148.3)____________ ________________________ ____________
At December 31, 2015 and 2014, the funded status was classified as follows (in millions):
2015 2014_______________ _______________
Other assets . . . . . . . . . . . . . . . . . . . . . . . . . . . . . . . . . . . . . . . . . . . . . . . . . . . . . . . . $ 5.4 $ 4.6Other current liabilities . . . . . . . . . . . . . . . . . . . . . . . . . . . . . . . . . . . . . . . . . . . . . . . (4.6) (4.4)Long-term liabilities . . . . . . . . . . . . . . . . . . . . . . . . . . . . . . . . . . . . . . . . . . . . . . . . . . (166.7) (148.5)____________ ____________
$(165.9) $(148.3)____________ ________________________ ____________
The accumulated benefit obligation for our defined benefit pension plans at December 31, 2015 and 2014,was $226.0 million and $210.0 million, respectively.
At December 31, 2015 and 2014, plans with benefit obligations in excess of plan assets were (in millions):
2015 2014______________ ______________
Benefit obligation . . . . . . . . . . . . . . . . . . . . . . . . . . . . . . . . . . . . . . . . . . . . . . . . . . . . $215.9 $212.0Plan assets . . . . . . . . . . . . . . . . . . . . . . . . . . . . . . . . . . . . . . . . . . . . . . . . . . . . . . . . . 44.6 59.0___________ ___________
$171.3 $153.0___________ ______________________ ___________
The weighted average assumptions used to determine the benefit obligation at December 31, 2015 and 2014,were:
2015 2014__________ __________
Discount rate . . . . . . . . . . . . . . . . . . . . . . . . . . . . . . . . . . . . . . . . . . . . . . . . . . . . . . . 3.8% 3.5%Compensation increases . . . . . . . . . . . . . . . . . . . . . . . . . . . . . . . . . . . . . . . . . . . . . . . 2.0% 1.8%
At December 31, 2015, the estimated benefits expected to be paid over the next 10 years are (in millions):
2016 . . . . . . . . . . . . . . . . . . . . . . . . . . . . . . . . . . . . . . . . . . . . . . . . . . . . . . . . . . . . . . . . . . . . . . . . . . . . . . $ 8.52017 . . . . . . . . . . . . . . . . . . . . . . . . . . . . . . . . . . . . . . . . . . . . . . . . . . . . . . . . . . . . . . . . . . . . . . . . . . . . . . 9.22018 . . . . . . . . . . . . . . . . . . . . . . . . . . . . . . . . . . . . . . . . . . . . . . . . . . . . . . . . . . . . . . . . . . . . . . . . . . . . . . 8.52019 . . . . . . . . . . . . . . . . . . . . . . . . . . . . . . . . . . . . . . . . . . . . . . . . . . . . . . . . . . . . . . . . . . . . . . . . . . . . . . 10.22020 . . . . . . . . . . . . . . . . . . . . . . . . . . . . . . . . . . . . . . . . . . . . . . . . . . . . . . . . . . . . . . . . . . . . . . . . . . . . . . 11.82021 – 2025 . . . . . . . . . . . . . . . . . . . . . . . . . . . . . . . . . . . . . . . . . . . . . . . . . . . . . . . . . . . . . . . . . . . . . . . . 82.7
05.68250-notes.qxp 3/31/16 6:53 PM Page 26

OMNICOM GROUP INC. AND SUBSIDIARIESNOTES TO CONSOLIDATED FINANCIAL STATEMENTS (Continued)
F-27
The fair value of plan assets at December 31, 2015 and 2014 was (in millions):
Level 1 Level 2 Level 3 Total_______ _______ _______ ______2015
Cash . . . . . . . . . . . . . . . . . . . . . . . . . . . . . . . . . . . . . $ 1.8 $ 1.8Mutual funds . . . . . . . . . . . . . . . . . . . . . . . . . . . . . . 39.7 39.7Unit trusts . . . . . . . . . . . . . . . . . . . . . . . . . . . . . . . . . 22.9 22.9Insurance contracts . . . . . . . . . . . . . . . . . . . . . . . . . . $ 4.2 4.2Other . . . . . . . . . . . . . . . . . . . . . . . . . . . . . . . . . . . . $ 0.3 0.3_________ _________ _________ _________
$64.4 $ 0.3 $ 4.2 $68.9_________ _________ _________ __________________ _________ _________ _________
2014Cash . . . . . . . . . . . . . . . . . . . . . . . . . . . . . . . . . . . . . $ 2.6 $ 2.6Mutual funds . . . . . . . . . . . . . . . . . . . . . . . . . . . . . . 43.4 43.4Unit trusts . . . . . . . . . . . . . . . . . . . . . . . . . . . . . . . . . 24.4 24.4Insurance contracts . . . . . . . . . . . . . . . . . . . . . . . . . . $ 3.7 3.7Other . . . . . . . . . . . . . . . . . . . . . . . . . . . . . . . . . . . . $ 0.3 0.3_________ _________ _________ _________
$70.4 $ 0.3 $ 3.7 $74.4_________ _________ _________ __________________ _________ _________ _________
Mutual funds and unit trusts are publicly traded and are valued using quoted market prices. The mutual fundsand unit trusts include investments in equity and fixed income securities. Insurance contracts primarily consist ofguaranteed investment contracts. Other investments primarily consist of commingled short-term investment funds.
Changes in the fair value of plan assets measured using Level 3 inputs at December 31, 2015 and 2014 were(in millions):
2015 2014___________ ___________
January 1 . . . . . . . . . . . . . . . . . . . . . . . . . . . . . . . . . . . . . . . . . . . . . . . . . . . . . . . . . . . . . . . . . . $3.7 $3.4Actual return on assets . . . . . . . . . . . . . . . . . . . . . . . . . . . . . . . . . . . . . . . . . . . . . . . . . . . . . . . . 0.1 0.1Purchases, sales and settlements, net . . . . . . . . . . . . . . . . . . . . . . . . . . . . . . . . . . . . . . . . . . . . . 0.4 0.2_______ _______December 31 . . . . . . . . . . . . . . . . . . . . . . . . . . . . . . . . . . . . . . . . . . . . . . . . . . . . . . . . . . . . . . . $4.2 $3.7_______ ______________ _______
The weighted average asset allocations at December 31, 2015 and 2014 were:2015 2014__________________________________________________ ___________________
Target Actual ActualAllocation Allocation Allocation___________________ ____________________ ___________________
Cash . . . . . . . . . . . . . . . . . . . . . . . . . . . . . . . . . . . . . . . . . . . . . . . . . . . 4% 3% 3%Mutual funds . . . . . . . . . . . . . . . . . . . . . . . . . . . . . . . . . . . . . . . . . . . . 54% 58% 58%Unit trusts . . . . . . . . . . . . . . . . . . . . . . . . . . . . . . . . . . . . . . . . . . . . . . 34% 33% 33%Insurance contracts . . . . . . . . . . . . . . . . . . . . . . . . . . . . . . . . . . . . . . . . 6% 6% 5%Other . . . . . . . . . . . . . . . . . . . . . . . . . . . . . . . . . . . . . . . . . . . . . . . . . . 2% —% 1%______ ______ ______
100% 100% 100%______ ______ ____________ ______ ______
Risk tolerance for these plans is established through consideration of plan liabilities, funded status andevaluation of the overall investment environment. The investment portfolios contain a diversified blend of equityand fixed-income investments. Equity investments are diversified across geography and market capitalizationthrough investment in large and medium capitalization U.S. and international equities and U.S. and internationaldebt securities. Investment risk is measured and monitored on an ongoing basis through annual liabilitymeasurements, and periodic asset/liability studies and investment portfolio reviews.
Postemployment Arrangements
We have executive retirement agreements under which benefits will be paid to participants or to theirbeneficiaries over periods up to ten years beginning after cessation of full-time employment. Our postemploymentarrangements are unfunded and benefits are paid when due.
05.68250-notes.qxp 3/31/16 6:53 PM Page 27

OMNICOM GROUP INC. AND SUBSIDIARIESNOTES TO CONSOLIDATED FINANCIAL STATEMENTS (Continued)
F-28
The components of net periodic benefit cost for the three years ended December 31, 2015 were (in millions):
2015 2014 2013____________ ____________ ____________Service cost . . . . . . . . . . . . . . . . . . . . . . . . . . . . . . . . . . . . . . . . . . $ 4.8 $ 3.8 $ 4.1Interest cost . . . . . . . . . . . . . . . . . . . . . . . . . . . . . . . . . . . . . . . . . . 4.3 4.5 4.3Amortization of prior service cost . . . . . . . . . . . . . . . . . . . . . . . . . 3.2 2.1 1.9Amortization of actuarial (gains) losses . . . . . . . . . . . . . . . . . . . . . 1.6 0.9 1.5___________ ___________ ___________
$13.9 $11.3 $11.8___________ ___________ ______________________ ___________ ___________
Included in accumulated other comprehensive income at December 31, 2015 and 2014 were unrecognizedactuarial gains and losses and unrecognized prior service cost of $49.0 million, $29.0 million net of income taxes,and $60.0 million, $36.0 million net of income taxes, respectively, that have not yet been recognized in the netperiodic benefit cost. The unrecognized actuarial gains and losses and unrecognized prior service cost included inaccumulated other comprehensive income and expected to be recognized in net periodic benefit cost in 2016 is$4.2 million.
The weighted average assumptions used to determine net periodic benefit cost for the three years endedDecember 31, 2015 were:
2015 2014 2013___________ ___________ ___________
Discount rate . . . . . . . . . . . . . . . . . . . . . . . . . . . . . . . . . . . . . . . . . 3.8% 4.7% 4.1%Compensation increases . . . . . . . . . . . . . . . . . . . . . . . . . . . . . . . . 3.5% 3.5% 3.5%
Experience gains and losses and effects of changes in actuarial assumptions are amortized over a period nolonger than the expected average future service of active employees.
At December 31, 2015 and 2014, the benefit obligation was (in millions):
2015 2014______________ ______________
January 1 . . . . . . . . . . . . . . . . . . . . . . . . . . . . . . . . . . . . . . . . . . . . . . . . . . . . . . . . . . . . . . . . . $122.1 $104.2Service cost . . . . . . . . . . . . . . . . . . . . . . . . . . . . . . . . . . . . . . . . . . . . . . . . . . . . . . . . . . . . . . . 4.8 3.8Interest cost . . . . . . . . . . . . . . . . . . . . . . . . . . . . . . . . . . . . . . . . . . . . . . . . . . . . . . . . . . . . . . . 4.3 4.5Amendments . . . . . . . . . . . . . . . . . . . . . . . . . . . . . . . . . . . . . . . . . . . . . . . . . . . . . . . . . . . . . . (0.6) 7.5Actuarial (gains) losses . . . . . . . . . . . . . . . . . . . . . . . . . . . . . . . . . . . . . . . . . . . . . . . . . . . . . . . (6.0) 11.3Benefits paid . . . . . . . . . . . . . . . . . . . . . . . . . . . . . . . . . . . . . . . . . . . . . . . . . . . . . . . . . . . . . . (8.7) (9.2)___________ ___________December 31 . . . . . . . . . . . . . . . . . . . . . . . . . . . . . . . . . . . . . . . . . . . . . . . . . . . . . . . . . . . . . . $115.9 $122.1___________ ______________________ ___________
At December 31, 2015 and 2014, the liability was classified as follows (in millions):
2015 2014______________ ______________
Other current liabilities . . . . . . . . . . . . . . . . . . . . . . . . . . . . . . . . . . . . . . . . . . . . . . . . . . . . . . $ 9.3 $ 8.7Long-term liabilities . . . . . . . . . . . . . . . . . . . . . . . . . . . . . . . . . . . . . . . . . . . . . . . . . . . . . . . . 106.6 113.4___________ ___________
$115.9 $122.1___________ ______________________ ___________
The weighted average assumptions used to determine the benefit obligation at December 31, 2015 and 2014were:
2015 2014___________ ___________
Discount rate . . . . . . . . . . . . . . . . . . . . . . . . . . . . . . . . . . . . . . . . . . . . . . . . . . . . . . . . . . . . . . . 4.1% 3.8%Compensation increases . . . . . . . . . . . . . . . . . . . . . . . . . . . . . . . . . . . . . . . . . . . . . . . . . . . . . . . 3.5% 3.5%
05.68250-notes.qxp 3/31/16 6:53 PM Page 28
OMNICOM GROUP INC. AND SUBSIDIARIESNOTES TO CONSOLIDATED FINANCIAL STATEMENTS (Continued)
F-29
At December 31, 2015, the estimated benefits expected to be paid over the next 10 years are (in millions):
2016 . . . . . . . . . . . . . . . . . . . . . . . . . . . . . . . . . . . . . . . . . . . . . . . . . . . . . . . . . . . . . . . . . . . . . . . . . . . . . . . $ 9.32017 . . . . . . . . . . . . . . . . . . . . . . . . . . . . . . . . . . . . . . . . . . . . . . . . . . . . . . . . . . . . . . . . . . . . . . . . . . . . . . . 8.32018 . . . . . . . . . . . . . . . . . . . . . . . . . . . . . . . . . . . . . . . . . . . . . . . . . . . . . . . . . . . . . . . . . . . . . . . . . . . . . . . 8.12019 . . . . . . . . . . . . . . . . . . . . . . . . . . . . . . . . . . . . . . . . . . . . . . . . . . . . . . . . . . . . . . . . . . . . . . . . . . . . . . . 6.52020 . . . . . . . . . . . . . . . . . . . . . . . . . . . . . . . . . . . . . . . . . . . . . . . . . . . . . . . . . . . . . . . . . . . . . . . . . . . . . . . 5.52021 – 2025 . . . . . . . . . . . . . . . . . . . . . . . . . . . . . . . . . . . . . . . . . . . . . . . . . . . . . . . . . . . . . . . . . . . . . . . . 29.0
12. Supplemental Cash Flow Data
The change in operating capital for the three years ended December 31, 2015 was (in millions):
2015 2014 2013____________________ ____________________ ____________________
(Increase) decrease in accounts receivable . . . . . . . . . . . . . . . . . . $(1,063.6) $(227.1) $ 244.8(Increase) decrease in work in process and other
current assets . . . . . . . . . . . . . . . . . . . . . . . . . . . . . . . . . . . . . (74.7) (14.2) (413.9)Increase (decrease) in accounts payable . . . . . . . . . . . . . . . . . . . 1,443.7 231.3 236.6Increase (decrease) in customer advances and other
current liabilities . . . . . . . . . . . . . . . . . . . . . . . . . . . . . . . . . . 203.9 (24.0) 159.6Change in other assets and liabilities, net . . . . . . . . . . . . . . . . . . 48.3 (72.2) 124.2_______________ _____________ _____________
$ 557.6 $(106.2) $ 351.3_______________ _____________ ____________________________ _____________ _____________
Income taxes paid . . . . . . . . . . . . . . . . . . . . . . . . . . . . . . . . . . . $ 540.1 $ 610.1 $ 472.4Interest paid . . . . . . . . . . . . . . . . . . . . . . . . . . . . . . . . . . . . . . . . $ 173.9 $ 188.6 $ 192.8
In 2014, as a result of the conversion of the 2032 Notes (See Note 6), we issued 1,217,112 shares of ourcommon stock to satisfy the conversion premium. Based on the closing prices of our common stock on thesettlement dates, the issuances resulted in a non-cash pretax financing activity of $89.2 million, net of the cash taxbenefit of $32.2 million (See Note 10).
In 2013, as a result of the conversion of the 2033 Notes and the 2038 Notes (See Note 6), we issued1,499,792 shares of our common stock to satisfy the conversion premium. Based on the closing prices of ourcommon stock on the settlement dates, the issuances resulted in a non-cash pretax financing activity of $95.4 million,net of the cash tax benefit of $34.5 million (See Note 10).
13. Noncontrolling Interests
Changes in the ownership interests in our less than 100% owned subsidiaries during the three years endedDecember 31, 2015 were (in millions):
2015 2014 2013______________ ______________ ______________
Net income attributed to Omnicom Group Inc. $1,093.9 $1,104.0 $991.1______________ ______________ ___________Transfers (to) from noncontrolling interests:
Increase in additional paid-in capital from sale of shares in noncontrolling interests 1.7 6.3 5.2
Decrease in additional paid-in capital from purchase of shares in noncontrolling interests (40.5) (70.8) (22.0)______________ ______________ ___________
Net transfers (to) from noncontrolling interests (38.8) (64.5) (16.8)______________ ______________ ___________Change from net income attributed to Omnicom Group Inc.
and transfers (to) from noncontrolling interests $1,055.1 $1,039.5 $974.3______________ ______________ _________________________ ______________ ___________
05.68250-notes.qxp 3/31/16 6:53 PM Page 29

OMNICOM GROUP INC. AND SUBSIDIARIESNOTES TO CONSOLIDATED FINANCIAL STATEMENTS (Continued)
F-30
14. Leases
We lease substantially all our office space under operating leases and equipment under operating and capitalleases. Office leases may include renewal options. In circumstances where the exercise of a renewal option isreasonably assured at the inception of the lease, the renewal period is included in the determination of the leaseterm. Office leases may also include scheduled rent increases and concessions, such as rent abatements and landlordincentives and tenant improvement allowances. Scheduled rent increases are recognized on a straight-line basis overthe lease term and concessions are recorded as deferred rent and are amortized to rent expense on a straight-line basisover the lease term. Certain office leases require payment of real estate taxes and other occupancy costs and thesecosts are not included in rent expense. Leasehold improvements made at inception or during the lease term areamortized over the shorter of the asset life or the lease term, which may include renewal periods where the renewal isreasonably assured.
Rent expense for the three years ended December 31, 2015 was (in millions):
2015 2014 2013______________ ______________ ______________
Office base rent . . . . . . . . . . . . . . . . . . . . . . . . . . . . . . . . . . . . . . . . . . . . . . . $342.5 $373.1 $379.9Third party sublease rent . . . . . . . . . . . . . . . . . . . . . . . . . . . . . . . . . . . . . . . . (11.0) (11.2) (10.6)___________ ___________ ___________Net office rent . . . . . . . . . . . . . . . . . . . . . . . . . . . . . . . . . . . . . . . . . . . . . . . . 331.5 361.9 369.3Equipment rent . . . . . . . . . . . . . . . . . . . . . . . . . . . . . . . . . . . . . . . . . . . . . . . 22.6 27.9 33.1___________ ___________ ___________
$354.1 $389.8 $402.4___________ ___________ ______________________ ___________ ___________
Future minimum payments under non-cancelable operating leases, reduced by third party sublease rentreceivable from existing non-cancelable subleases, and capital leases are (in millions):
Operating CapitalLeases Leases_________________ ______________
2016 . . . . . . . . . . . . . . . . . . . . . . . . . . . . . . . . . . . . . . . . . . . . . . . . . . . . . . . . . . . . . . . . . . $305.0 $23.72017 . . . . . . . . . . . . . . . . . . . . . . . . . . . . . . . . . . . . . . . . . . . . . . . . . . . . . . . . . . . . . . . . . . 224.5 16.12018 . . . . . . . . . . . . . . . . . . . . . . . . . . . . . . . . . . . . . . . . . . . . . . . . . . . . . . . . . . . . . . . . . . 176.0 9.12019 . . . . . . . . . . . . . . . . . . . . . . . . . . . . . . . . . . . . . . . . . . . . . . . . . . . . . . . . . . . . . . . . . . 147.1 5.02020 . . . . . . . . . . . . . . . . . . . . . . . . . . . . . . . . . . . . . . . . . . . . . . . . . . . . . . . . . . . . . . . . . . 122.7 3.3Thereafter . . . . . . . . . . . . . . . . . . . . . . . . . . . . . . . . . . . . . . . . . . . . . . . . . . . . . . . . . . . . . . 419.4 2.8______________ _________Minimum lease payments . . . . . . . . . . . . . . . . . . . . . . . . . . . . . . . . . . . . . . . . . . . . . . . . . . 1,394.7 60.0Sublease rent . . . . . . . . . . . . . . . . . . . . . . . . . . . . . . . . . . . . . . . . . . . . . . . . . . . . . . . . . . . . (10.4)______________
Net rent . . . . . . . . . . . . . . . . . . . . . . . . . . . . . . . . . . . . . . . . . . . . . . . . . . . . . . . . . . . . . $1,384.3____________________________Interest component . . . . . . . . . . . . . . . . . . . . . . . . . . . . . . . . . . . . . . . . . . . . . . . . . . . . . . . (2.0)_________
Present value of minimum lease payments . . . . . . . . . . . . . . . . . . . . . . . . . . . . . . . . . . . $58.0__________________
Property under capital lease and capital lease obligations as of December 31, 2015 and 2014 were (inmillions):
2015 2014______________ ______________
Property under capital lease:Cost . . . . . . . . . . . . . . . . . . . . . . . . . . . . . . . . . . . . . . . . . . . . . . . . . . . . . . . . . . . . . . . . . $154.6 $146.3Accumulated depreciation . . . . . . . . . . . . . . . . . . . . . . . . . . . . . . . . . . . . . . . . . . . . . . . . . (100.4) (90.6)___________ ___________
$ 54.2 $55.7___________ ______________________ ___________Capital lease obligations:
Current . . . . . . . . . . . . . . . . . . . . . . . . . . . . . . . . . . . . . . . . . . . . . . . . . . . . . . . . . . . . . . . $ 22.8 $ 23.2Long-term . . . . . . . . . . . . . . . . . . . . . . . . . . . . . . . . . . . . . . . . . . . . . . . . . . . . . . . . . . . . . 35.2 34.0___________ ___________
$ 58.0 $ 57.2___________ ______________________ ___________
Depreciation expense for property under capital lease in 2015, 2014 and 2013 was $26.5 million, $26.1million and $26.4 million, respectively.
05.68250-notes.qxp 3/31/16 6:53 PM Page 30

OMNICOM GROUP INC. AND SUBSIDIARIESNOTES TO CONSOLIDATED FINANCIAL STATEMENTS (Continued)
F-31
15. Temporary Equity – Redeemable Noncontrolling Interests
Owners of noncontrolling equity interests in some of our subsidiaries have the right in certain circumstancesto require us to purchase all or a portion of their equity interests at fair value as defined in the applicableagreements. Assuming that the subsidiaries perform over the relevant periods at their current profit levels, atDecember 31, 2015 the aggregate estimated maximum amount we could be required to pay in future periods is$167.9 million, of which $131.9 million is currently exercisable by the holders. If these rights are exercised, therewould be an increase in the net income attributable to Omnicom as a result of our increased ownership interest andthe reduction of net income attributable to noncontrolling interests. The ultimate amount paid could besignificantly different because the redemption amount is primarily dependent on the future results of operations ofthe subject businesses, the timing of the exercise of these rights and changes in foreign currency exchange rates.
16. Commitments and Contingent Liabilities
In the ordinary course of business, we are involved in various legal proceedings. We do not presently expectthat these proceedings will have a material adverse effect on our results of operations or financial position.
17. Changes in Accumulated Other Comprehensive Income (Loss)
The changes in accumulated other comprehensive income (loss) for the years ended December 31, 2015 and2014 were (in millions):
Unrealized Defined BenefitUnrealized Gain (Loss) on Pension and Foreign
Gain (Loss) on Available-for-Sale Postemployment Currency2015 Cash Flow Hedge Securities Plans Translation Total_______________ _______________ ______________ __________ __________
January 1 . . . . . . . . . . . . . . . . . . . . . . $ — $(1.2) $(92.1) $(524.9) $ (618.2)_________ _________ __________ ____________ _______________Other comprehensive income (loss)
before reclassifications . . . . . . . . . . (3.3) 0.3 — (398.4) (401.4)Amounts reclassified (to) from
accumulated other comprehensive income (loss) . . . . . . . . . . . . . . . . . — — 4.2 — 4.2_________ _________ __________ ____________ _______________
Other comprehensive income (loss) . . . . . . . . . . . . . . . . . . . . . . . (3.3) 0.3 4.2 (398.4) (397.2)_________ _________ __________ ____________ _______________
December 31 . . . . . . . . . . . . . . . . . . . $(3.3) $(0.9) $(87.9) $(923.3) $(1,015.4)_________ _________ __________ ____________ ________________________ _________ __________ ____________ _______________
2014
January 1 . . . . . . . . . . . . . . . . . . . . . . $ — $(1.6) $(68.8) $(121.2) $ (191.6)_________ _________ __________ ____________ _______________Other comprehensive income
(loss) before reclassifications . . . . . . — 0.4 — (403.7) (403.3)Amounts reclassified (to) from
accumulated other comprehensive income (loss) . . . . . . . . . . . . . . . . . — — (23.3) — (23.3)_________ _________ __________ ____________ _______________
Other comprehensive income (loss) . . . . . . . . . . . . . . . . . — 0.4 (23.3) (403.7) (426.6)_________ _________ __________ ____________ _______________
December 31 . . . . . . . . . . . . . . . . . . . $ — $(1.2) $(92.1) $(524.9) $ (618.2)_________ _________ __________ ____________ ________________________ _________ __________ ____________ _______________
05.68250-notes.qxp 3/31/16 6:53 PM Page 31

OMNICOM GROUP INC. AND SUBSIDIARIESNOTES TO CONSOLIDATED FINANCIAL STATEMENTS (Continued)
F-32
Reclassifications from accumulated other comprehensive income (loss) for the year ended December 31, 2015and 2014 were (in millions):
2015 2014______________ ______________
Amortization of defined benefit pension and postemployment plans:Prior service cost . . . . . . . . . . . . . . . . . . . . . . . . . . . . . . . . . . . . . . . . . . . . . . . . . . . . . . . . . $ 7.5 $ 6.4Actuarial (gains) losses . . . . . . . . . . . . . . . . . . . . . . . . . . . . . . . . . . . . . . . . . . . . . . . . . . . . . 7.3 3.2________ _________
Net periodic benefit cost (Note 11) . . . . . . . . . . . . . . . . . . . . . . . . . . . . . . . . . . . . . . . . . . . . . 14.8 9.6Income taxes . . . . . . . . . . . . . . . . . . . . . . . . . . . . . . . . . . . . . . . . . . . . . . . . . . . . . . . . . . . . . . . 5.9 3.8________ _________Periodic benefit cost, net of income tax . . . . . . . . . . . . . . . . . . . . . . . . . . . . . . . . . . . . . . . . . . $ 8.9 $ 5.8________ _________________ _________
18. Fair Value
Financial assets and liabilities measured at fair value on a recurring basis at December 31, 2015 and 2014 were(in millions):
2015 Level 1 Level 2 Level 3 Total__________________ __________________ __________________ __________________
Assets:Cash and cash equivalents . . . . . . . . . . . . . . . . . . . . . . $2,605.2 $2,605.2Short-term investments . . . . . . . . . . . . . . . . . . . . . . . . 14.5 14.5Available-for-sale securities . . . . . . . . . . . . . . . . . . . . . . 4.8 4.8Interest rate and foreign currency
derivative instruments . . . . . . . . . . . . . . . . . . . . . . . $32.4 32.4Liabilities:
Interest rate and foreign currency derivative instruments . . . . . . . . . . . . . . . . . . . . . . . $15.9 $ 15.9
Contingent purchase price obligations . . . . . . . . . . . . . $322.0 322.02014
Assets:Cash and cash equivalents . . . . . . . . . . . . . . . . . . . . . . $2,388.1 $2,388.1Short-term investments . . . . . . . . . . . . . . . . . . . . . . . . 2.2 2.2Available-for-sale securities . . . . . . . . . . . . . . . . . . . . . . 4.9 4.9Interest rate and foreign currency
derivative instruments . . . . . . . . . . . . . . . . . . . . . . . $43.1 43.1Liabilities:
Foreign currency derivative instruments . . . . . . . . . . . . $ 0.4 $ 0.4Contingent purchase price obligations . . . . . . . . . . . . . $300.7 300.7
The changes in contingent purchase price obligations for the years ended December 31, 2015 and 2014 were(in millions):
2015 2014______________ ______________
January 1 . . . . . . . . . . . . . . . . . . . . . . . . . . . . . . . . . . . . . . . . . . . . . . . . . . . . . . . . . . . . . . . . . $300.7 $220.2Acquisitions . . . . . . . . . . . . . . . . . . . . . . . . . . . . . . . . . . . . . . . . . . . . . . . . . . . . . . . . . . . . . . . 98.9 167.1Revaluation and interest . . . . . . . . . . . . . . . . . . . . . . . . . . . . . . . . . . . . . . . . . . . . . . . . . . . . . 21.8 11.0Payments . . . . . . . . . . . . . . . . . . . . . . . . . . . . . . . . . . . . . . . . . . . . . . . . . . . . . . . . . . . . . . . . . (58.6) (83.2)Deferred payment . . . . . . . . . . . . . . . . . . . . . . . . . . . . . . . . . . . . . . . . . . . . . . . . . . . . . . . . . . (21.4) —Foreign currency translation . . . . . . . . . . . . . . . . . . . . . . . . . . . . . . . . . . . . . . . . . . . . . . . . . . (19.4) (14.4)___________ ___________December 31 . . . . . . . . . . . . . . . . . . . . . . . . . . . . . . . . . . . . . . . . . . . . . . . . . . . . . . . . . . . . . . $322.0 $300.7___________ ______________________ ___________
05.68250-notes.qxp 3/31/16 6:53 PM Page 32

OMNICOM GROUP INC. AND SUBSIDIARIESNOTES TO CONSOLIDATED FINANCIAL STATEMENTS (Continued)
F-33
The carrying amount and fair value of our financial assets and liabilities at December 31, 2015 and 2014 were(in millions):
2015 2014________________________________________________ ________________________________________________Carrying Fair Carrying FairAmount Value Amount Value_________ _________ _________ _________
Assets:Cash and cash equivalents . . . . . . . . . . . . . . . . . . . $2,605.2 $2,605.2 $2,388.1 $2,388.1Short-term investments . . . . . . . . . . . . . . . . . . . . . 14.5 14.5 2.2 2.2Available-for-sale securities . . . . . . . . . . . . . . . . . . 4.8 4.8 4.9 4.9Interest rate and foreign currency
derivative instruments . . . . . . . . . . . . . . . . . . . . 32.4 32.4 43.1 43.1Cost method investments . . . . . . . . . . . . . . . . . . . 21.5 21.5 21.8 21.8
Liabilities:Short-term debt . . . . . . . . . . . . . . . . . . . . . . . . . . $ 5.2 $ 5.2 $ 7.2 $ 7.2Interest rate and foreign currency
derivative instruments . . . . . . . . . . . . . . . . . . . . 15.9 15.9 0.4 0.4Contingent purchase price obligations . . . . . . . . . 322.0 322.0 300.7 300.7Long-term debt, including current portion . . . . . . 4,565.6 4,655.9 4,542.5 4,754.9
The estimated fair value of the foreign currency and interest rate derivative instruments is determined usingmodel-derived valuations, taking into consideration foreign currency rates for the foreign currency derivatives andreadily observable inputs for LIBOR interest rates and yield curves to derive the present value of the future cashflows for the interest rate swap derivatives and counterparty credit risk for each. The estimated fair value of thecontingent purchase price obligations is calculated in accordance with the terms of each acquisition agreement and isdiscounted. The fair value of long-term debt is based on quoted market prices.
19. Derivative Instruments and Hedging Activities
We manage our exposure to foreign exchange and interest rate risk through various strategies, including theuse of derivative financial instruments. We use forward foreign exchange contracts as economic hedges to managethe cash flow volatility arising from foreign exchange rate fluctuations. Additionally, we use interest rate swaps tomanage our interest expense and structure our debt portfolio to achieve a mix of fixed rate and floating rate debt.We do not use derivative instruments for trading or speculative purposes. Using derivative instruments exposes us tothe risk that counterparties to the derivative contracts will fail to meet their contractual obligations. To mitigatecounterparty credit risk, we have a policy of only entering into derivative contracts with carefully selected majorfinancial institutions based on specific minimum credit standards and other factors.
We evaluate the effects of changes in foreign currency exchange rates, interest rates and other relevant marketrisks on our derivative instruments. We periodically determine the potential loss from market risk on our derivativeinstruments by performing a value-at-risk, or VaR, analysis. VaR is a statistical model that utilizes historical currencyexchange and interest rate data to measure the potential impact on future earnings of our derivative financialinstruments assuming normal market conditions. The VaR model is not intended to represent actual losses but isused as a risk estimation and management tool. Based on the results of the model, we estimate with 95% confidencea maximum one-day change in the net fair value of our derivative financial instruments at December 31, 2015 wasnot significant.
Foreign Exchange Risk
As an integral part of our global treasury operations, we centralize our cash and use multicurrency pools tomanage the foreign exchange risk between subsidiaries and their respective treasury centers from which they borrowor invest funds. However, in certain circumstances, subsidiaries borrow or invest with a treasury center operating ina different currency. At December 31, 2015 and 2014, we had outstanding forward foreign exchange contracts withan aggregate notional amount of $22.1 million and $113.1 million, respectively, to manage the foreign exchange risk
05.68250-notes.qxp 3/31/16 6:53 PM Page 33

OMNICOM GROUP INC. AND SUBSIDIARIESNOTES TO CONSOLIDATED FINANCIAL STATEMENTS (Continued)
F-34
associated with these activities. Additionally, there are circumstances where revenue and expense transactions are notdenominated in the same currency. In these instances, amounts are either promptly settled or hedged with forwardcontracts. At December 31, 2015 and 2014, we had outstanding forward foreign exchange contracts with anaggregate notional amount of $85.9 million and $44.0 million, respectively, to manage the foreign exchange risk ofthese activities. See Note 18 for a discussion of the fair value of these instruments. The terms of our forwardcontracts are generally less than 90 days.
Foreign currency derivative instruments are designated as fair value hedges; therefore, any gain or loss in fairvalue incurred on those instruments is recorded in results of operations and is generally offset by decreases orincreases in the fair value of the underlying exposures. By using these financial instruments, we reduced financial riskof adverse foreign exchange changes by foregoing any gain (reward) which might have occurred if the marketsmoved favorably.
Interest Rate Risk
We use interest rate swaps to manage our interest cost and structure our long-term debt portfolio to achieve amix of fixed rate and floating rate debt. Based on market conditions, we may terminate the swaps to reduce ourexposure to rising interest rates or to monetize any gain and lock in a reduction in interest expense over the term ofthe underlying debt. At December 31, 2015 and 2014, the total notional amount of the fixed-to-floating interestrate swaps was $1.75 billion and $2.25 billion, respectively. On January 19, 2016, we terminated the remaining$1.0 billion notional amount of the swap on the 2022 Notes.
Also, we are exposed to interest rate volatility on future debt issuances. To manage this risk, we useforward-starting interest rate swaps to lock in the interest rate on future debt issuances. At December 31, 2015, thetotal notional amount of the forward-starting interest rate swaps was $1.0 billion.
See Note 6 for a complete discussion of our interest rate swaps.
20. New Accounting Standards
In May 2014, the FASB issued FASB ASU 2014-09, Revenue from Contracts with Customers (“ASU 2014-09”),which will replace all existing revenue recognition guidance under U.S. GAAP. On July 9, 2015, the FASB approveda one year deferral of the effective date of ASU 2014-09 all annual and interim periods beginning afterDecember 15, 2017, with early application permitted only for annual and interim periods beginning afterDecember 31, 2016. ASU 2014-09 provides for one of two methods of transition: retrospective application to eachprior period presented; or, recognition of the cumulative effect of retrospective application of the new standard as ofthe beginning of the period of initial application. Presently, we are not yet in a position to conclude on theapplication date or the transition method we will choose. Based on our initial assessment, the impact of theapplication of the new standard will likely result in a change in the timing of our revenue recognition forperformance incentives received from clients and the recognition of certain reimbursable out-of-pocket costs asrevenue. Performance incentives are currently recognized in revenue when specific quantitative goals are achieved, orwhen our performance against qualitative goals is determined by the client. Under the new standard, we will berequired to estimate the amount of the incentive that will be earned at the inception of the contract and recognizethe incentive over the term of the contract. While performance incentives are not material to our revenue, this willresult in an acceleration in revenue recognition for certain contract incentives compared to the current method.Certain incidental costs that are reimbursed by our clients and are currently required to be recorded in revenue willlikely not be recorded as revenue under the new standard. We expect this will result in less revenue and related costrecorded in our results of operations. While, we have not yet completed our assessment, we do not expect thischange to have a material impact to our revenue and it will not result in any change to operating income.
In February 2015, the FASB issued FASB ASU 2015-02, Consolidation (Topic 810): Amendments to theConsolidation Analysis (“ASU 2015-02”), which changes the consolidation analysis for both the variable interestmodel and for the voting model for limited partnerships and similar entities. ASU 2015-02 is effective for annualand interim periods beginning after December 15, 2015 and early application is permitted. ASU 2015-02 provides
05.68250-notes.qxp 3/31/16 6:53 PM Page 34

OMNICOM GROUP INC. AND SUBSIDIARIESNOTES TO CONSOLIDATED FINANCIAL STATEMENTS (Continued)
F-35
for one of two methods of transition: retrospective application to each prior period presented; or, recognition of thecumulative effect of retrospective application of the new standard in the period of initial application. We appliedASU 2015-02 on January 1, 2016 and the application of the new standard did not have a significant impact on ourresults of operations or financial position.
In January 2016, the FASB issued FASB ASU 2016-01, Financial Instruments – Overall: Recognition andMeasurement of Financial Assets and Liabilities (“ASU 2016-01”), which will require equity investments, exceptequity method investments, to be measured at fair value and any changes in fair value will be recognized in results ofoperations. ASU 2016-01 is effective for annual and interim periods beginning after December 15, 2017 and earlyapplication is not permitted. ASU 2016-01 provides for the recognition of the cumulative effect of retrospectiveapplication of the new standard in the period of initial application. We will apply ASU 2016-01 on January 1, 2018and we expect that the application of the new standard will not have a significant impact on our results ofoperations or financial position.
21. Subsequent Events
We have evaluated events subsequent to the balance sheet date and determined there have not been any otherevents that have occurred that would require adjustment to or disclosure in the consolidated financial statements.
05.68250-notes.qxp 3/31/16 6:53 PM Page 35

F-36
OMNICOM GROUP INC. AND SUBSIDIARIESSelected Quarterly Financial Data (Unaudited)
(In millions, except per share amounts)
The Company’s unaudited selected quarterly financial data for the years ended December 31, 2015 and 2014were:
Quarter____________________________________________________________________________________________________First Second Third Fourth__________________ __________________ __________________ __________________
Revenue2015 . . . . . . . . . . . . . . . . . . . . . . . . . . . . . . . . . . . . . . . $3,469.2 $3,805.3 $3,706.6 $4,153.32014 . . . . . . . . . . . . . . . . . . . . . . . . . . . . . . . . . . . . . . . 3,502.2 3,870.9 3,749.6 4,195.1
Operating Expenses2015 . . . . . . . . . . . . . . . . . . . . . . . . . . . . . . . . . . . . . . . 3,091.5 3,266.7 3,278.3 3,577.82014 . . . . . . . . . . . . . . . . . . . . . . . . . . . . . . . . . . . . . . . 3,119.5 3,322.5 3,316.0 3,615.7
Operating Income2015 . . . . . . . . . . . . . . . . . . . . . . . . . . . . . . . . . . . . . . . 377.7 538.6 428.3 575.52014 . . . . . . . . . . . . . . . . . . . . . . . . . . . . . . . . . . . . . . . 382.7 548.4 433.6 579.4
Net Income – Omnicom Group Inc.2015 . . . . . . . . . . . . . . . . . . . . . . . . . . . . . . . . . . . . . . . 209.1 313.9 239.3 331.62014 . . . . . . . . . . . . . . . . . . . . . . . . . . . . . . . . . . . . . . . 205.5 325.2 243.8 329.5
Net Income Per Share Omnicom Group Inc. – Basic2015 . . . . . . . . . . . . . . . . . . . . . . . . . . . . . . . . . . . . . . . 0.84 1.27 0.97 1.352014 . . . . . . . . . . . . . . . . . . . . . . . . . . . . . . . . . . . . . . . 0.78 1.24 0.95 1.30
Net Income Per Share Omnicom Group Inc. – Diluted2015 . . . . . . . . . . . . . . . . . . . . . . . . . . . . . . . . . . . . . . . 0.83 1.26 0.97 1.352014 . . . . . . . . . . . . . . . . . . . . . . . . . . . . . . . . . . . . . . . 0.77 1.23 0.95 1.30
In the first and second quarters of 2014, we incurred $7.0 million and $1.8 million, respectively, of expensesin connection with the proposed merger with Publicis which were primarily comprised of professional fees. OnMay 8, 2014, the proposed merger was terminated. Excluding the effect of the merger expenses, Operating Income,Net Income – Omnicom Group Inc. and Diluted Net Income per Common Share – Omnicom Group Inc. for thefirst and second quarters of 2014 were $389.7 million and $550.2 million, $212.3 million and $315.8 million, and$0.80 and $1.20, respectively.
06.68250-Sch_Ex.qxp 3/31/16 6:55 PM Page 36
OMNICOM GROUP INC. AND SUBSIDIARIESSCHEDULE II — VALUATION AND QUALIFYING ACCOUNTS
For the Three Years Ended December 31, 2015(In millions)
TranslationBalance Charged to Removal of Adjustment Balance
Beginning Costs and Uncollectible Increase End ofDescription of Period Expenses Receivables (Decrease) Period_____________________ __________________ ___________________ _____________________ ____________________ __________________
Valuation accounts deducted from assets:
Allowance for Doubtful Accounts:
December 31, 2015 . . . . . . . . . . . . . . $24.9 $ 4.4 $ (5.4) $(1.4) $22.5
December 31, 2014 . . . . . . . . . . . . . . 32.6 8.5 (14.9) (1.3) 24.9
December 31, 2013 . . . . . . . . . . . . . . 35.9 9.7 (12.8) (0.2) 32.6
S-1
06.68250-Sch_Ex.qxp 3/31/16 6:55 PM Page 1

[THIS PAGE INTENTIONALLY LEFT BLANK]
00.ILB.qxp 3/31/16 8:32 PM Page 1

Omnicom
Past performance does not guarantee future results. This Annual Report to Shareholders contains forward-looking statements, and actual results could differmaterially. Risk factors that could cause actual results to differ are set forth in the “Risk Factors” section and throughout our 2015 Form 10-K, which is includedin this Annual Report.
0%
10%
20%
30%
40%
50%
15141312111009080706
Cumulative Cost of Net Shares Repurchased – Payments for repurchases of common stock less proceeds from stock plans.
Cumulative Dividends Paid.
Cumulative Net Income – Omnicom Group Inc.
(1) Represents cumulative amounts and percentages for the period 2004 through 2015. However 2004 and 2005 are not presented.
Percentage of Cumulative Net Income Returned to Shareholders – Cumulative Dividends Paid plus Cumulative Cost of Net Shares Repurchased divided by Cumulative Net Income.
$0.0
$3.0
$6.0
$9.0
$12.0
15141312111009080706
$3.0
$6.0
$9.0
$12.0
15141312111009080706
$3.3
108%
$2.4
110%
0.9
3.7
$4.3
105%
1.1
3.6
$5.1
92%
1.3
4.8
$5.9
103%
1.6
5.6
$6.9
103%
2.3
7.0
$8.9
104%
2.8
8.0
$10.0
108%
3.3
8.7
$11.1
108%
2.0
6.5
$7.9
107%
Financial Performance
Return On Equity — 10 Year Average 27.4%
Cumulative Percentage of Net Income Returned to Shareholders(1)
($ in billions)
Return on Equity – Net Income for each year divided by average Shareholder’s Equity for that year.
34958_omni_82p.pdf pg 8 April 5, 2016 11:52:38

OmnicomFinancial Highlights
2015 2014 2013 2012 2011
(In millions, except per share amounts)
Operating Data:Revenue $15,134.4 $15,317.8 $14,584.5 $14,219.4 $13,872.5Operating Income 1,920.1 1,944.1 1,825.3 1,804.2 1,671.12Net Income – Omnicom Group Inc. 1,093.9 1,104.0 991.1 998.3 952.6
Net Income Per Share – Omnicom Group Inc.:Basic $4.43 $4.27 $3.73 $3.64 $3.38Diluted 4.41 4.24 3.71 3.61 3.33
Dividends Per Share $2.00 $1.90 $1.60 $1.20 $1.00
PERFORMANCE GRAPH
The graph below compares the cumulative total return on our common stock during the last five fiscal years withthe Standard & Poor’s 500 Composite Index and a peer group of publicly held corporate communications andmarketing holding companies. The peer group consists of The Interpublic Group of Companies, Inc., WPP plc,Publicis Groupe SA and Havas SA. The graph shows the value at the end of each year of each $100 invested in ourcommon stock, the S&P 500 Index and the peer group. The graph assumes the reinvestment of dividends.
Returns depicted in the graph are not indicative of future performance.
Comparison of Cumulative Five Year Return
$0
$50
$100
$150
$200
$250
Dec10 Dec11 Dec12 Dec13 Dec14 Dec15
Omnicom Group, Inc. S&P 500 Index Peer Group
07.68250back.qxp 3/31/16 8:26 PM Page 1

Omnicom
Committees Of The Board
AUDITJohn R. Murphy, Chairman Michael A. Henning, Vice Chairman Mary C. ChoksiRobert Charles ClarkErrol M. CookDeborah J. Kissire
FINANCEBruce Crawford, Chairman Alan R. BatkinMary C. ChoksiJohn R. MurphyJohn R. Purcell Gary L. Roubos
COMPENSATIONGary L. Roubos, ChairmanSusan S. Denison, Vice ChairmanAlan R. BatkinLeonard S. Coleman, Jr.Michael A. HenningLinda Johnson Rice
GOVERNANCEJohn R. Purcell, ChairmanRobert Charles Clark, Vice ChairmanLeonard S. Coleman, Jr.Errol M. CookSusan S. DenisonLinda Johnson Rice
EXECUTIVELeonard S. Coleman, Jr., ChairmanBruce CrawfordJohn R. MurphyJohn R. PurcellGary L. Roubos
Board Of Directors
BRUCE CRAWFORDChairman, Omnicom Group Inc.
JOHN D. WRENPresident and Chief Executive Officer,Omnicom Group Inc.
LEONARD S. COLEMAN, JR.‡Former Senior Advisor, Major League Baseball,Former Chairman, Arena Co.
ALAN R. BATKINChairman and Chief Executive Officer,Converse Associates, Inc.
MARY C. CHOKSIFounding Partner and Senior Advisor, Strategic Investment Group
ROBERT CHARLES CLARKHarvard University Distinguished Service Professor, Harvard Law School
ERROL M. COOKPrivate Investor and Consultant,Former Managing Director and Partner, Warburg Pincus
SUSAN S. DENISONFormer Partner, Cook Associates
MICHAEL A. HENNINGFormer Deputy Chairman, Ernst & Young
DEBORAH J. KISSIREFormer Vice Chair and Regional Managing Partner, Ernst & Young
JOHN R. MURPHYFormer Trustee, National Geographic Society
JOHN R. PURCELLChairman and Chief Executive Officer,Grenadier Associates Ltd.
LINDA JOHNSON RICEChairman, Johnson Publishing Company, Inc.
GARY L. ROUBOSFormer Chairman, Dover Corporation
‡ Lead Independent Director
Officers
JOHN D. WRENPresident and Chief Executive Officer
PHILIP J. ANGELASTROExecutive Vice President and Chief Financial Officer
ANDREW L. CASTELLANETASenior Vice President, Chief Accounting Officer
SERGE DUMONTVice ChairmanChairman, Omnicom Asia Pacific
DENNIS E. HEWITTTreasurer
ASIT MEHRAExecutive Vice President
JONATHAN B. NELSONChief Executive Officer, Omnicom Digital
MICHAEL J. O’BRIENSenior Vice President, General Counsel and Secretary
JANET RICCIOExecutive Vice President
RITA E. RODRIGUEZExecutive Vice President
PETER SHERMANExecutive Vice President
PETER L. SWIECICKISenior Vice President, Finance and Controller
TIFFANY R. WARRENSenior Vice President and Chief Diversity Officer
JOHN C. WYNNESenior Vice President – Tax
07.68250back.qxp 3/31/16 8:26 PM Page 2

OmnicomCorporate Information
PRINCIPAL EXECUTIVE OFFICES
OMNICOM GROUP INC. 437 Madison Avenue New York, New York 10022 Tel: (212) 415-3600
OMNICOM GROUP INC. One East Weaver Street Greenwich, Connecticut 06831 Tel: (203) 618-1500
OMNICOM GROUP INC.525 Okeechobee BoulevardSuite 870West Palm Beach, Florida 33411Tel: (561) 207-2200
OMNICOM EUROPE LIMITED239 Old Marylebone Road London, NWI 5QT United KingdomTel: +44 (0) 20 7298 7007
OMNICOM ASIA PACIFIC – SINGAPORECreative Centre at PicoLobby B Level 820 Kallang AvenueSingapore 339411Tel: +65 6671 4420
OMNICOM ASIA PACIFIC – SHANGHAI3701, 1 Grand Gateway, No. 1 Hong Qiao RoadXu Hui District, Shanghai 200030P.R. ChinaTel: +86 21 6407 0066, ext 846
www.omnicomgroup.com
ANNUAL MEETINGThe Annual Meeting of Shareholders will beheld on Tuesday, May 24, 2016, at10 A.M. Eastern Daylight Time atZimmerman Advertising6600 North Andrews AvenueFt. Lauderdale, FL 33309
SEC CERTIFICATIONSThe certifications by the Chief Executive Officer andPresident and the Executive Vice President and ChiefFinancial Officer of Omnicom Group Inc., required underSections 302 and 906 of the Sarbanes-Oxley Act of 2002,have been filed as exhibits to the company’s 2015 AnnualReport on Form 10-K.
NYSE CERTIFICATIONAfter the 2016 Annual Meeting of Shareholders,Omnicom intends to file with the New York StockExchange (NYSE) the CEO certification regardingOmnicom’s compliance with the NYSE’s corporategovernance listing standards as required by NYSE rule303A.12. Last year, the Chief Executive Officer andPresident of Omnicom submitted this certification to theNYSE on June 17, 2015.
STOCK LISTINGOmnicom common stock istraded on the New York Stock Exchange.The ticker symbol is OMC.
TRANSFER AGENT & REGISTRARWells Fargo Bank, NAShareowner ServicesPO Box 64854, St. Paul, Minnesota 55164-0854www.shareowneronline.com
INVESTOR SERVICES PROGRAMAn Investor Services Program, which includes direct stockpurchase and dividend reinvestment features, is available toshareholders of record and other interested investors. Forfurther information, please contact Wells FargoShareowner Services at 800.468.9716 or go towww.shareowneronline.com.
STOCK TRANSFER MATTERS/CHANGE OF ADDRESSTo assist you in handling matters relating tostock transfer or change of address, pleasewrite to or call our transfer agent:Wells Fargo Shareowner ServicesPO Box 64854, St. Paul, Minnesota 55164-0854800.468.9716Or, by courier to: Wells Fargo Shareowner Services1110 Centre Pointe Curve, Suite 101Mendota Heights, Minnesota 55120-4100
INDEPENDENT AUDITORSKPMG LLP345 Park AvenueNew York, New York 10154
Printed on Recycled Paper
07.68250back.qxp 3/31/16 8:26 PM Page 3