Embed Size (px)
Citation preview
© 11/20/2010, LV WANG
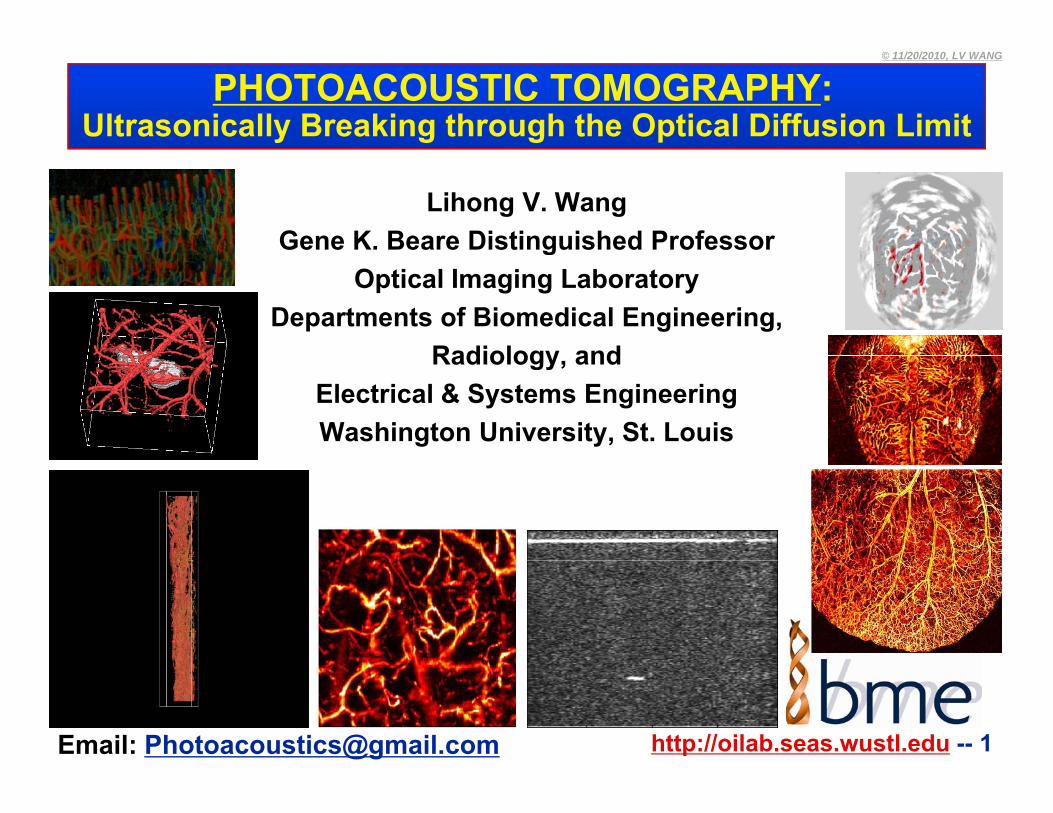
PHOTOACOUSTIC TOMOGRAPHY:Ultrasonically Breaking through the Optical Diffusion Limit
Lihong V. WangGene K. Beare Distinguished Professorg
Optical Imaging LaboratoryDepartments of Biomedical Engineering,
Radiology andRadiology, andElectrical & Systems EngineeringWashington University, St. Louis
http://oilab.seas.wustl.edu -- 1Email: [email protected]
© 11/20/2010, LV WANG
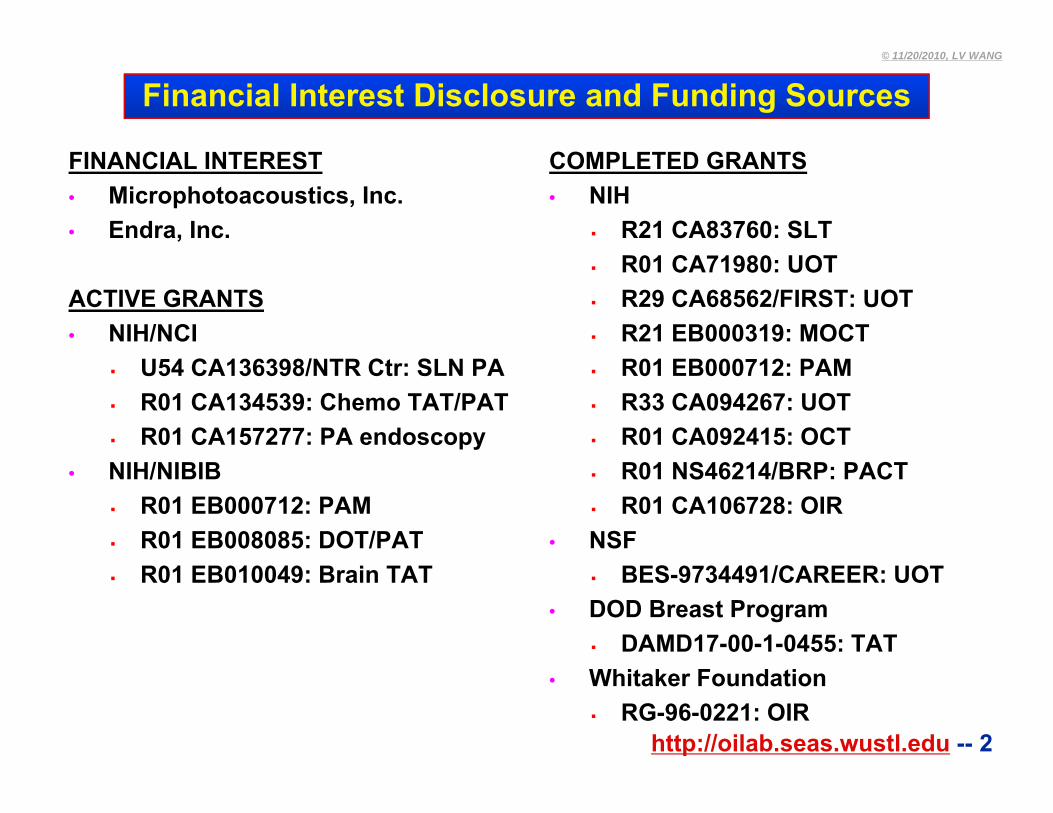
Financial Interest Disclosure and Funding Sources
FINANCIAL INTEREST• Microphotoacoustics, Inc.• Endra, Inc.
COMPLETED GRANTS• NIH
R21 CA83760: SLT
ACTIVE GRANTS• NIH/NCI
R01 CA71980: UOT R29 CA68562/FIRST: UOT R21 EB000319: MOCT
U54 CA136398/NTR Ctr: SLN PA R01 CA134539: Chemo TAT/PAT R01 CA157277: PA endoscopy
R01 EB000712: PAM R33 CA094267: UOT R01 CA092415: OCT
• NIH/NIBIB R01 EB000712: PAM R01 EB008085: DOT/PAT
R01 NS46214/BRP: PACT R01 CA106728: OIR
• NSF R01 EB010049: Brain TAT BES-9734491/CAREER: UOT
• DOD Breast Program DAMD17-00-1-0455: TAT
http://oilab.seas.wustl.edu -- 2
• Whitaker Foundation RG-96-0221: OIR
© 11/20/2010, LV WANG
Outline
• Motivation and challenges
• Photoacoustic computed tomography
Circular geometryg y
Linear geometry
• Photoacoustic microscopy
Acoustic resolution
Optical resolution
Di i dhttp://oilab.seas.wustl.edu -- 3
• Discussion and summary
© 11/20/2010, LV WANG
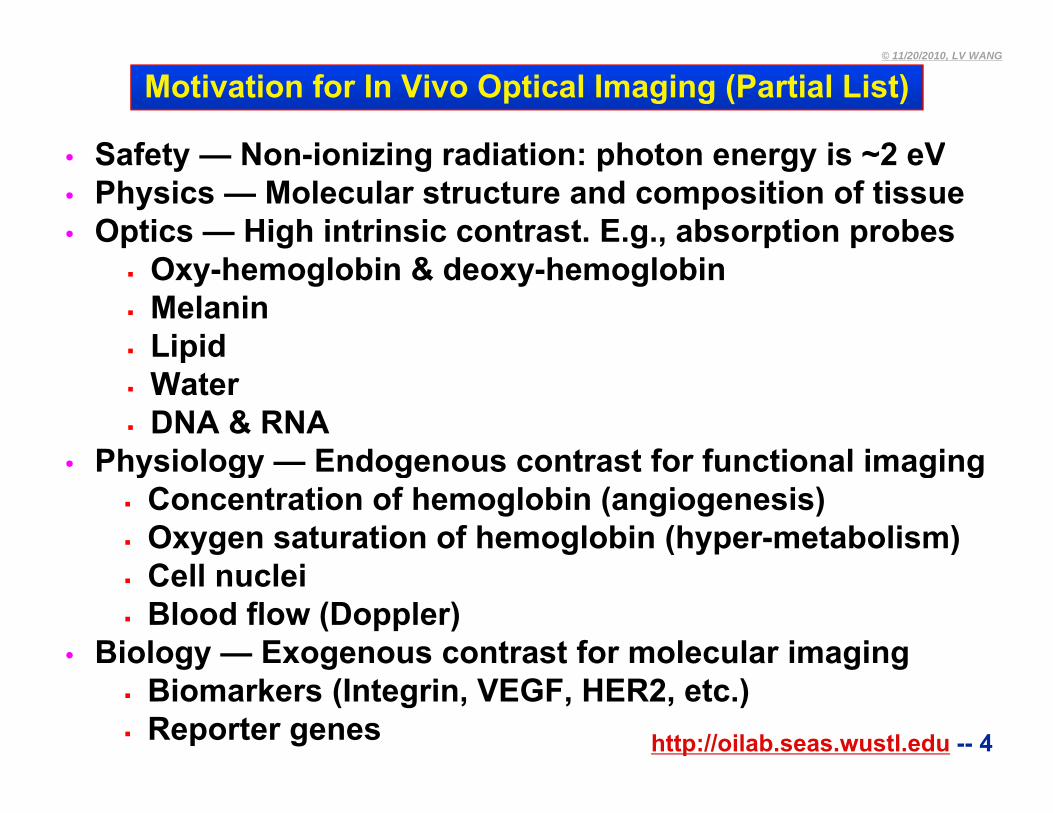
Motivation for In Vivo Optical Imaging (Partial List)
Safety Non ionizing radiation: photon energy is 2 eV• Safety — Non-ionizing radiation: photon energy is ~2 eV• Physics — Molecular structure and composition of tissue • Optics — High intrinsic contrast. E.g., absorption probes
Oxy-hemoglobin & deoxy-hemoglobin Melanin LipidLipid Water DNA & RNA
Physiology Endogenous contrast for functional imaging• Physiology — Endogenous contrast for functional imaging Concentration of hemoglobin (angiogenesis) Oxygen saturation of hemoglobin (hyper-metabolism) Cell nuclei Blood flow (Doppler)
• Biology — Exogenous contrast for molecular imaging
http://oilab.seas.wustl.edu -- 4
o ogy oge ous co t ast o o ecu a ag g Biomarkers (Integrin, VEGF, HER2, etc.) Reporter genes
© 11/20/2010, LV WANG
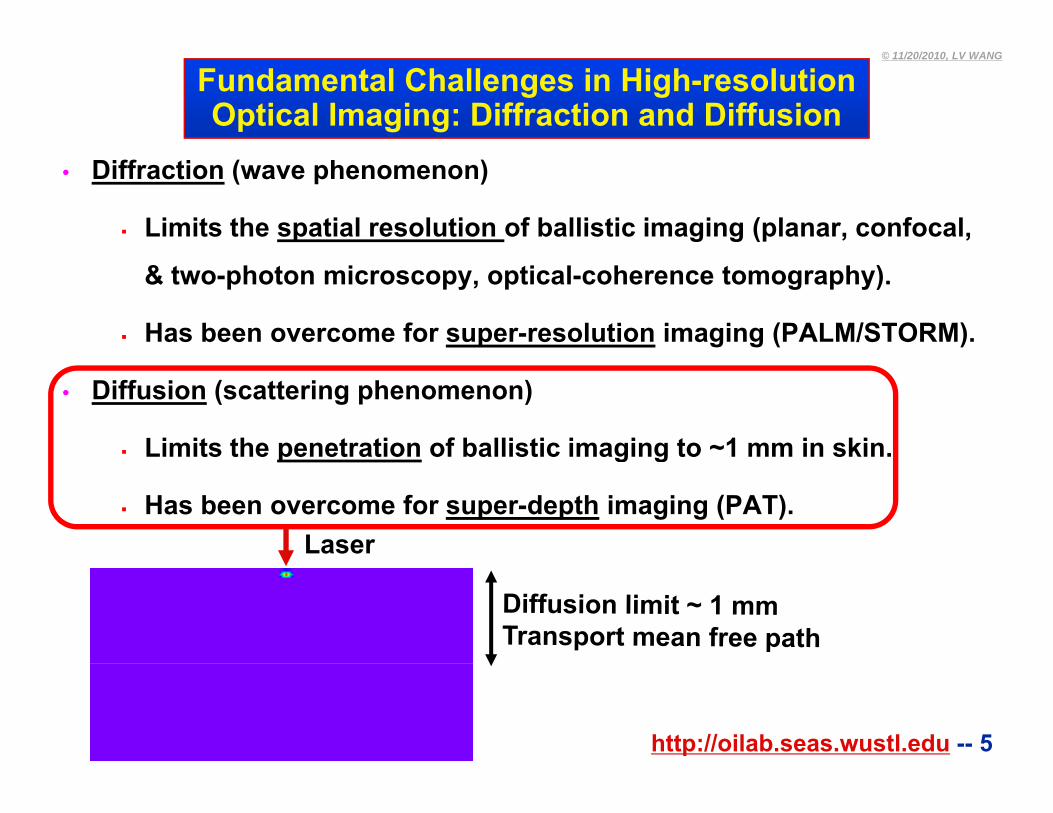
Fundamental Challenges in High-resolutionOptical Imaging: Diffraction and Diffusion
• Diffraction (wave phenomenon)
Limits the spatial resolution of ballistic imaging (planar, confocal,
& two-photon microscopy, optical-coherence tomography).
Has been overcome for super-resolution imaging (PALM/STORM).
• Diffusion (scattering phenomenon)
Limits the penetration of ballistic imaging to ~1 mm in skin.p g g
Has been overcome for super-depth imaging (PAT).Laser
http://oilab.seas.wustl.edu -- 5
© 11/20/2010, LV WANG
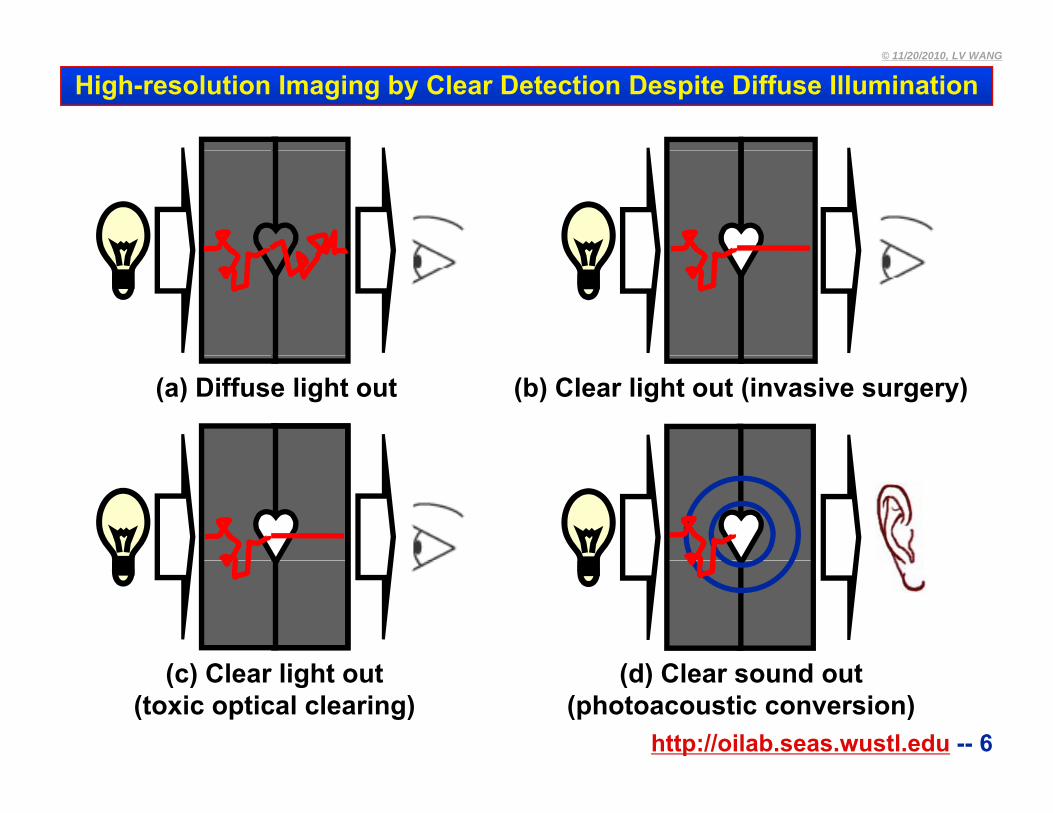
High-resolution Imaging by Clear Detection Despite Diffuse Illumination
(a) Diffuse light out (b) Clear light out (invasive surgery)
( ) C ( ) C
http://oilab.seas.wustl.edu -- 6
(c) Clear light out(toxic optical clearing)
(d) Clear sound out(photoacoustic conversion)
© 11/20/2010, LV WANG
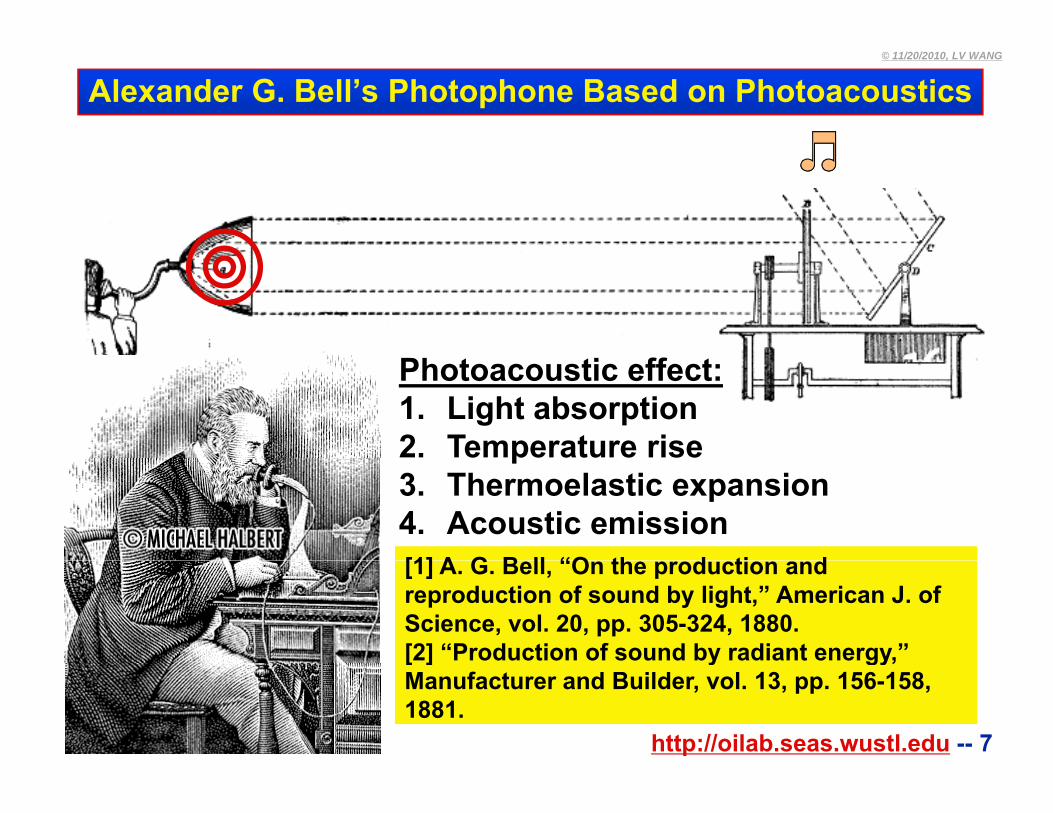
Alexander G. Bell’s Photophone Based on Photoacoustics
Photoacoustic effect:1. Light absorption2. Temperature rise
[1] A G B ll “O th d ti d
p3. Thermoelastic expansion4. Acoustic emission[1] A. G. Bell, “On the production and reproduction of sound by light,” American J. of Science, vol. 20, pp. 305-324, 1880.[2] “Production of sound by radiant energy,”
http://oilab.seas.wustl.edu -- 7
[ ] y gy,Manufacturer and Builder, vol. 13, pp. 156-158, 1881.
© 11/20/2010, LV WANG
Outline
• Motivation and challenges
• Photoacoustic computed tomography
Circular geometryg y
Linear geometry
• Photoacoustic microscopy
Acoustic resolution
Optical resolution
Di i dhttp://oilab.seas.wustl.edu -- 8
• Discussion and summary
© 11/20/2010, LV WANG
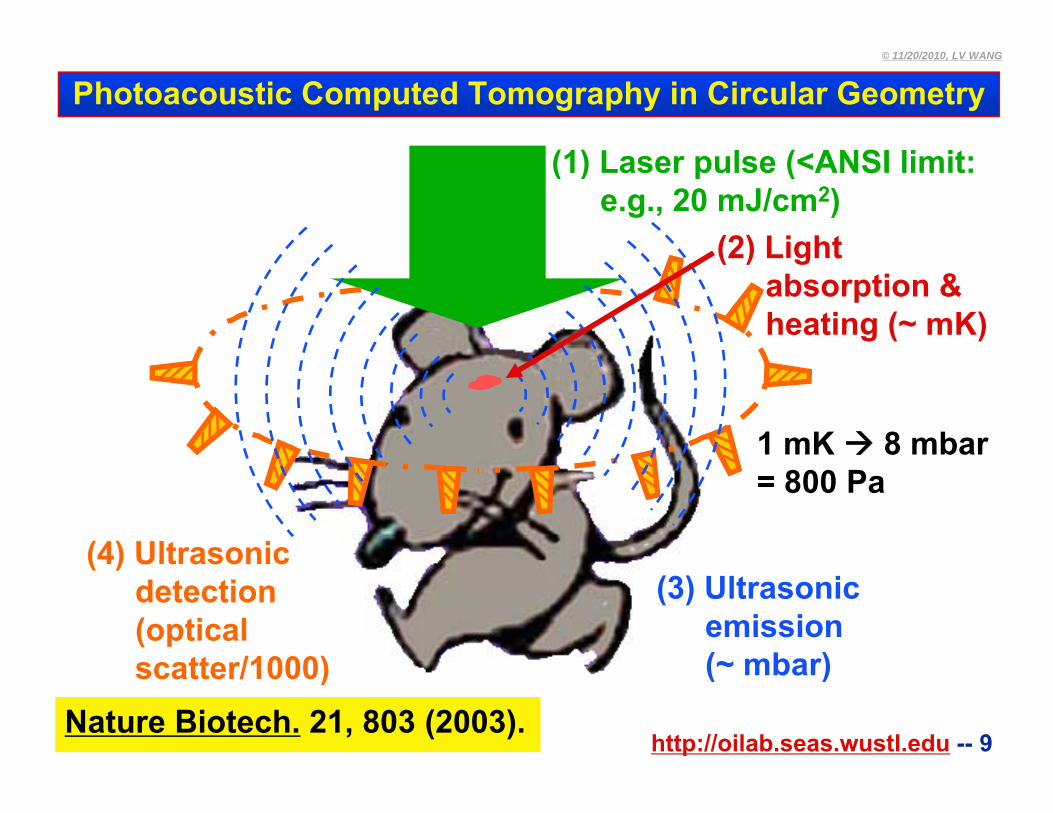
Photoacoustic Computed Tomography in Circular Geometry
(1) L l ( ANSI li i(1) Laser pulse (<ANSI limit:e.g., 20 mJ/cm2)
(2) Light(2) Light absorption & heating (~ mK)
1 mK 8 mbar
(4) Ultrasonic
= 800 Pa
(4) Ultrasonic detection(optical scatter/1000)
(3) Ultrasonic emission (~ mbar)
http://oilab.seas.wustl.edu -- 9
scatter/1000) (~ mbar)
Nature Biotech. 21, 803 (2003).
© 11/20/2010, LV WANG
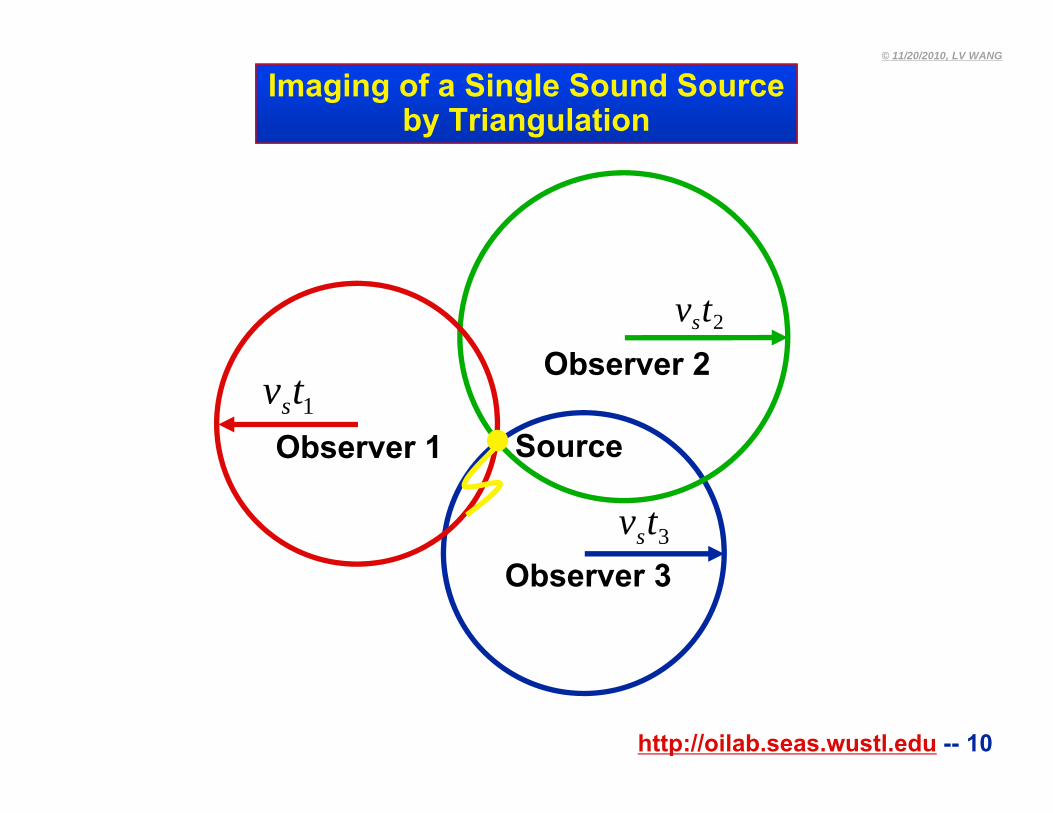
Imaging of a Single Sound Sourceby Triangulation
Ob 22tvs
Observer 21tvs
Observer 1 Source
3tvs
Obse e
Observer 3
http://oilab.seas.wustl.edu -- 10
© 11/20/2010, LV WANG
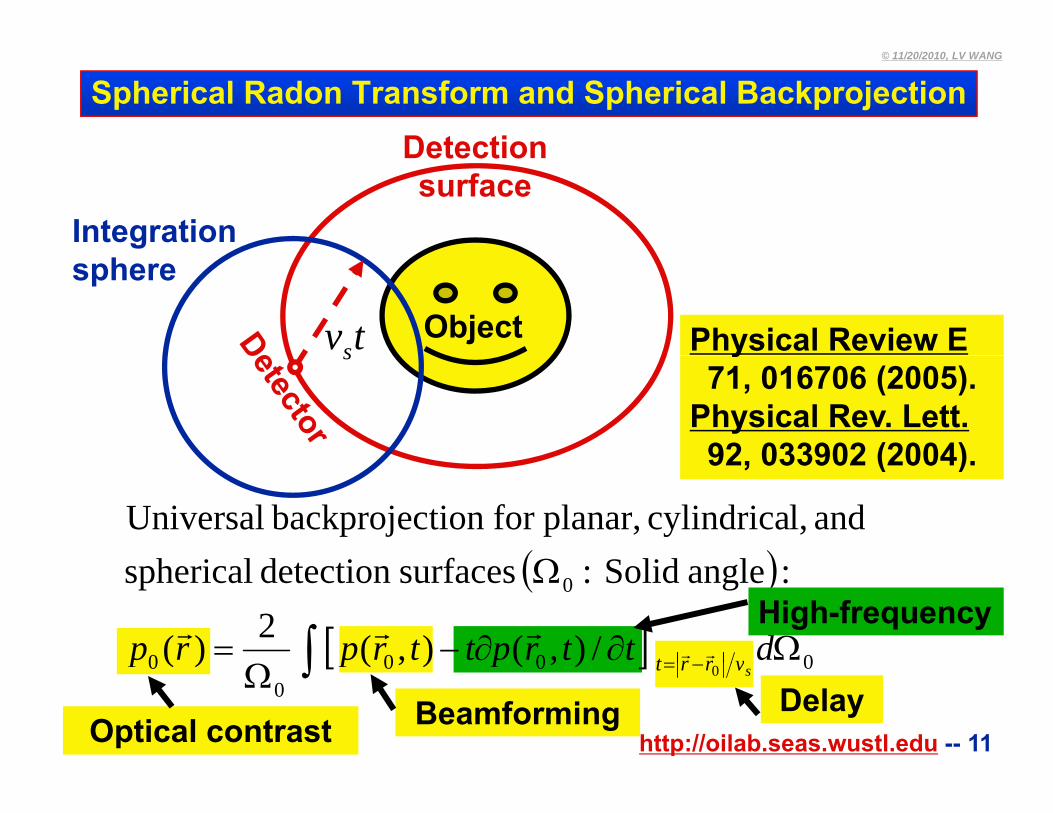
Spherical Radon Transform and Spherical BackprojectionDetection
Integration
Detectionsurface
tvs
sphere
Object Physical Review Es y71, 016706 (2005).
Physical Rev. Lett.92 033902 (2004)
lS lidfd ih i l and l,cylindrica planar,for tion backprojec Universal
92, 033902 (2004).
/),(),(2)(
:angleSolid :surfacesdetection spherical
0000
0
dttrpttrprp vrrt High-frequency
http://oilab.seas.wustl.edu -- 11
),(),()( 0000
0 0 pppsvrrt
Beamforming DelayOptical contrast
© 11/20/2010, LV WANG
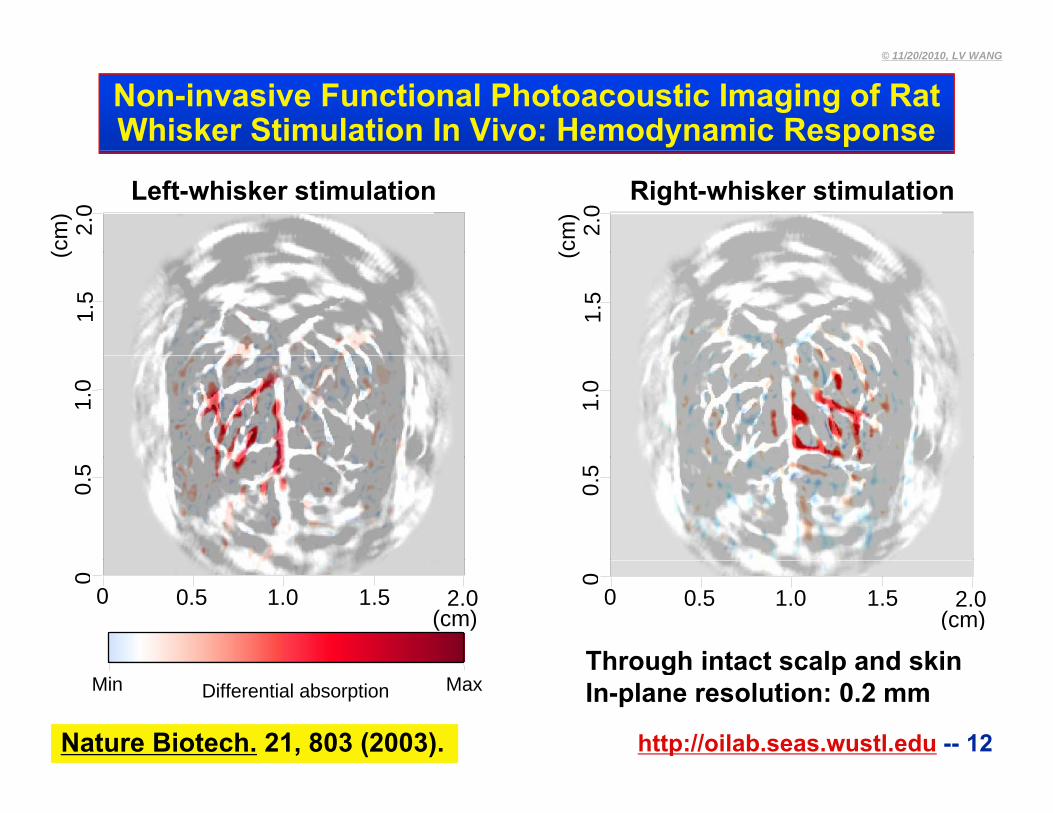
Non-invasive Functional Photoacoustic Imaging of RatWhisker Stimulation In Vivo: Hemodynamic Response
Left-whisker stimulation
2.0
(cm
)
2.0
(cm
)
Right-whisker stimulation
1.5
(
1.5
(
1.0
1.0
0.5
0.5
0 0.5 1.0 2.0
0
(cm)1.5 0 0.5 1.0 2.0
0(cm)
1.5
Through intact scalp and skin
http://oilab.seas.wustl.edu -- 12
Differential absorption MaxMin
Nature Biotech. 21, 803 (2003).
Through intact scalp and skinIn-plane resolution: 0.2 mm
© 11/20/2010, LV WANG
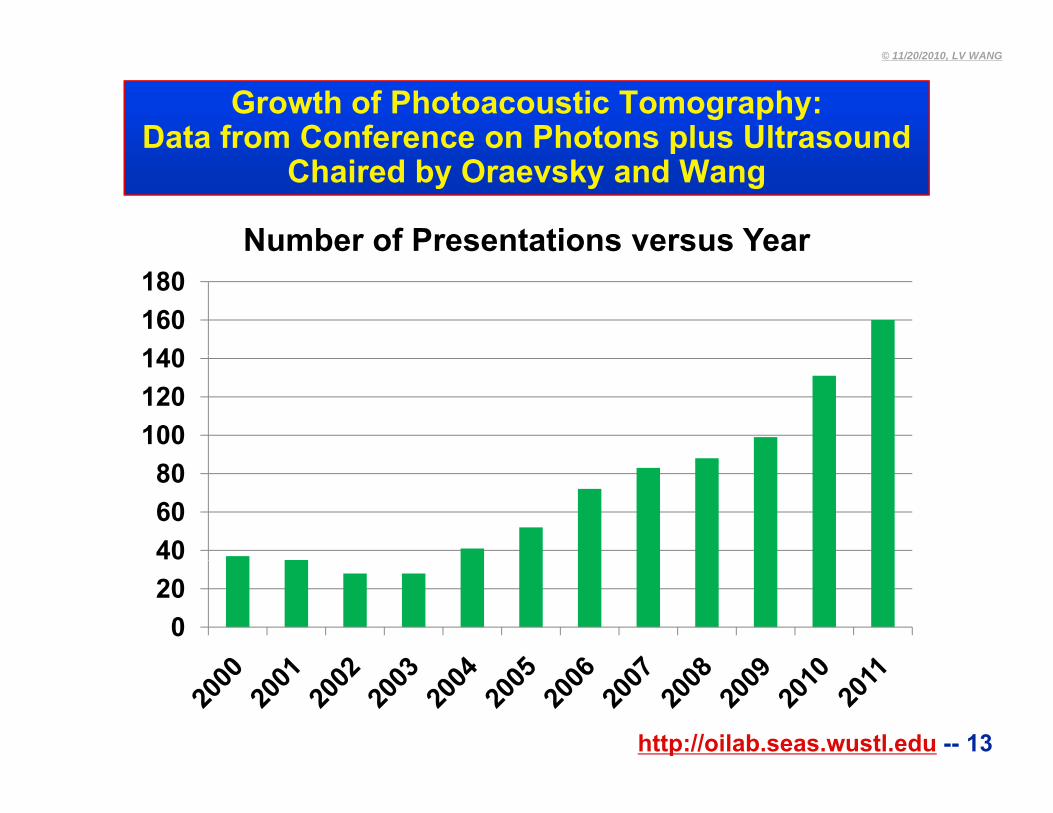
Growth of Photoacoustic Tomography:Data from Conference on Photons plus Ultrasoundp
Chaired by Oraevsky and Wang
Number of Presentations versus Year
140160180
100120140
406080
020
http://oilab.seas.wustl.edu -- 13
© 11/20/2010, LV WANG
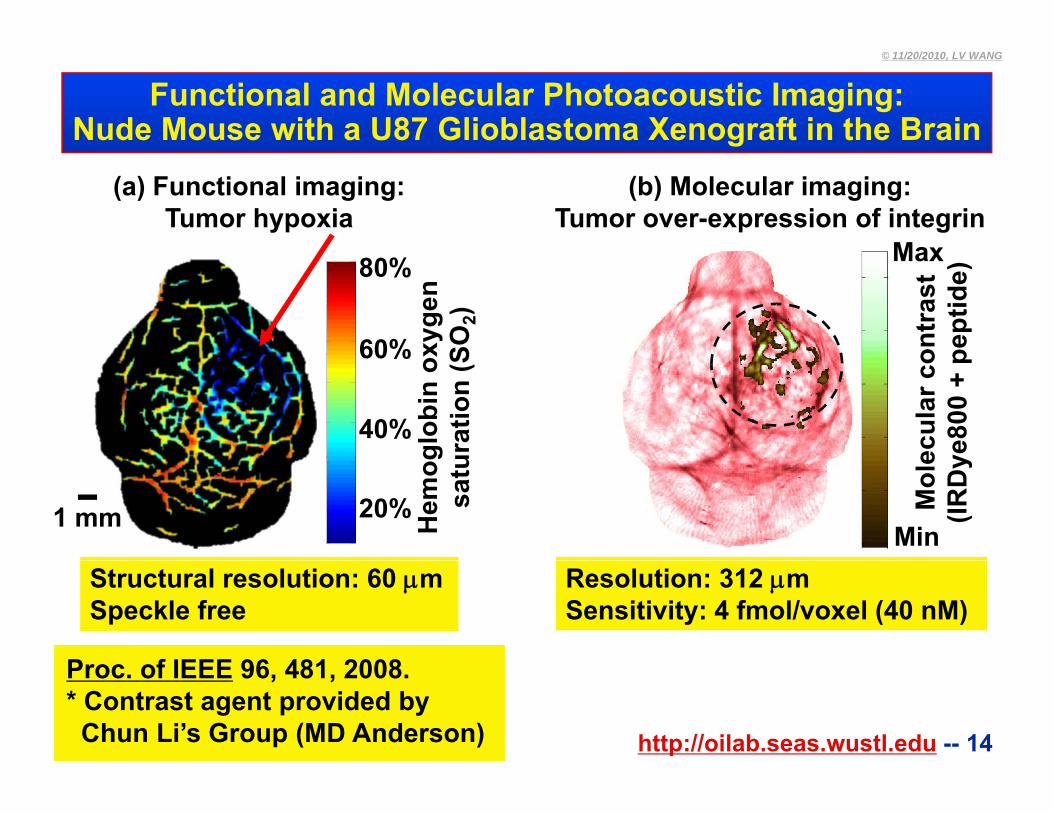
Functional and Molecular Photoacoustic Imaging:Nude Mouse with a U87 Glioblastoma Xenograft in the Brain
(b) Molecular imaging:Tumor over-expression of integrin
Max
(a) Functional imaging:Tumor hypoxia
60%
80%
xyge
n SO
2)
Max
ontr
ast
pept
ide)
40%
60%
glob
in o
xur
atio
n (S
ecul
ar c
oye
800
+ p
20% Hem
ogsa
tu
Min
Mol
e(IR
Dy
1 mm
Structural resolution: 60 mSpeckle free
Resolution: 312 mSensitivity: 4 fmol/voxel (40 nM)
P f IEEE 96 481 2008
http://oilab.seas.wustl.edu -- 14
Proc. of IEEE 96, 481, 2008.* Contrast agent provided by Chun Li’s Group (MD Anderson)
© 11/20/2010, LV WANG
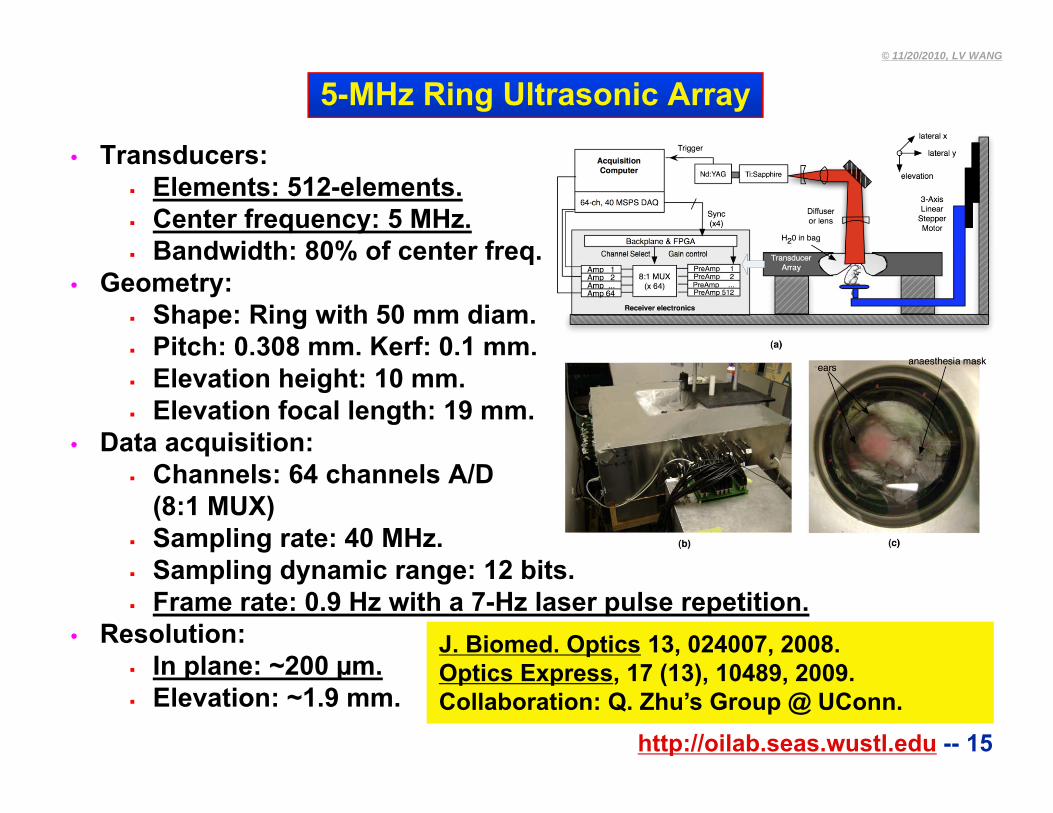
5-MHz Ring Ultrasonic Array
Transducers:• Transducers: Elements: 512-elements. Center frequency: 5 MHz.
Bandwidth: 80% of center freq Bandwidth: 80% of center freq.• Geometry:
Shape: Ring with 50 mm diam. Pitch: 0.308 mm. Kerf: 0.1 mm.tc 0 308 e 0 Elevation height: 10 mm. Elevation focal length: 19 mm.
• Data acquisition: Channels: 64 channels A/D
(8:1 MUX) Sampling rate: 40 MHz.
S li d i 12 bit Sampling dynamic range: 12 bits. Frame rate: 0.9 Hz with a 7-Hz laser pulse repetition.
• Resolution: In plane: ~200 µm
J. Biomed. Optics 13, 024007, 2008.
http://oilab.seas.wustl.edu -- 15
In plane: ~200 µm. Elevation: ~1.9 mm.
Optics Express, 17 (13), 10489, 2009.Collaboration: Q. Zhu’s Group @ UConn.
© 11/20/2010, LV WANG
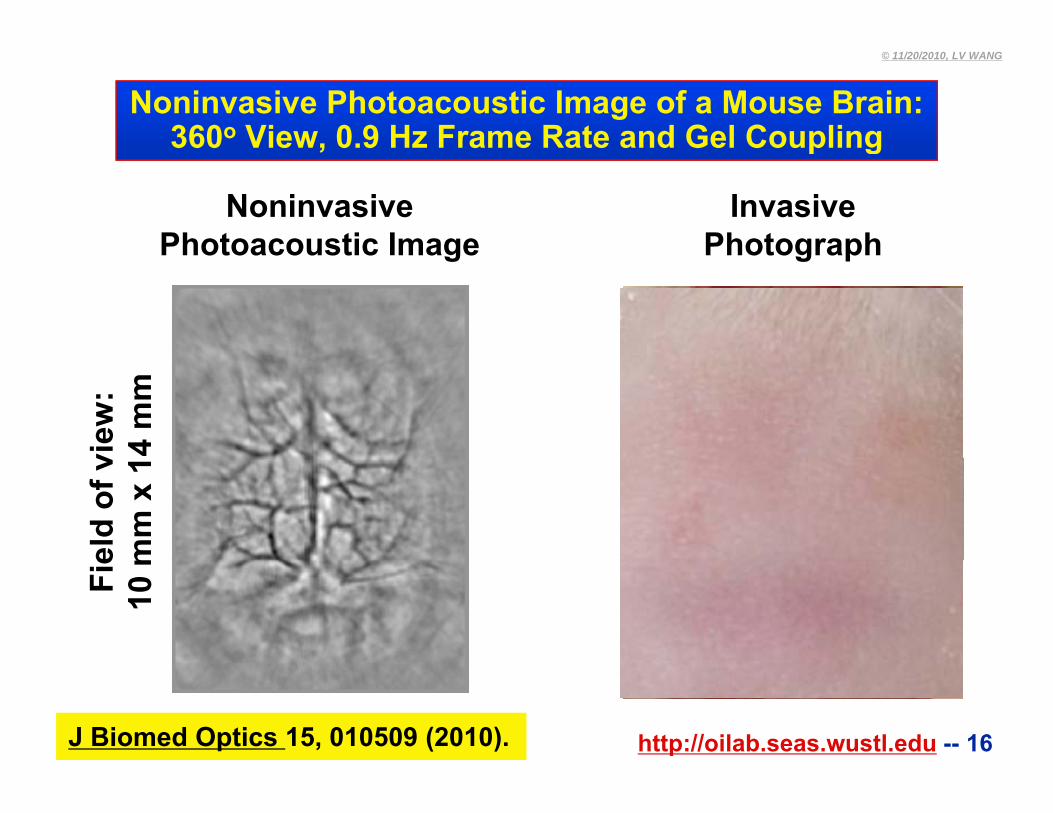
Noninvasive Photoacoustic Image of a Mouse Brain:360o View, 0.9 Hz Frame Rate and Gel Coupling, p g
NoninvasivePhotoacoustic Image
InvasivePhotographPhotoacoustic Image Photograph
view
: 4
mm
el
d of
vm
m x
1Fi
e10
m
http://oilab.seas.wustl.edu -- 16J Biomed Optics 15, 010509 (2010).
© 11/20/2010, LV WANG
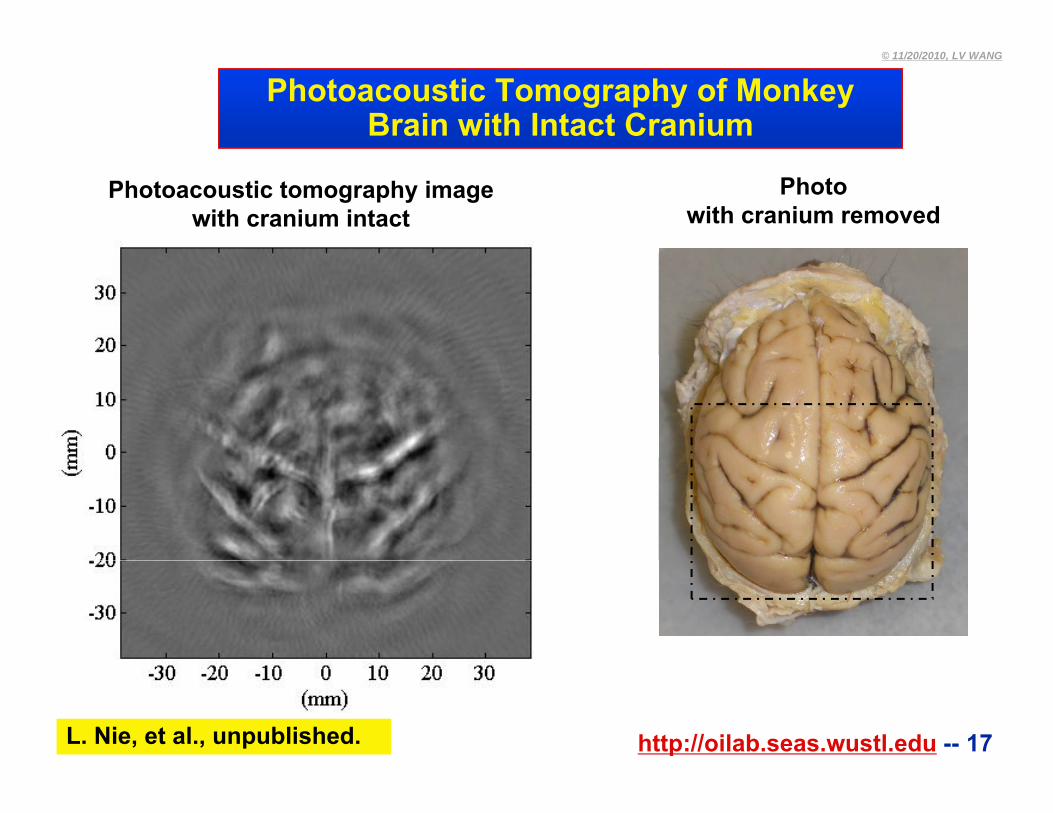
Photoacoustic Tomography of Monkey Brain with Intact Cranium
Photo with cranium removed
Photoacoustic tomography imagewith cranium intact
http://oilab.seas.wustl.edu -- 17L. Nie, et al., unpublished.
© 11/20/2010, LV WANG
Outline
• Motivation and challenges
• Photoacoustic computed tomography
Circular geometryg y
Linear geometry
• Photoacoustic microscopy
Acoustic resolution
Optical resolution
Di i dhttp://oilab.seas.wustl.edu -- 18
• Discussion and summary
© 11/20/2010, LV WANG
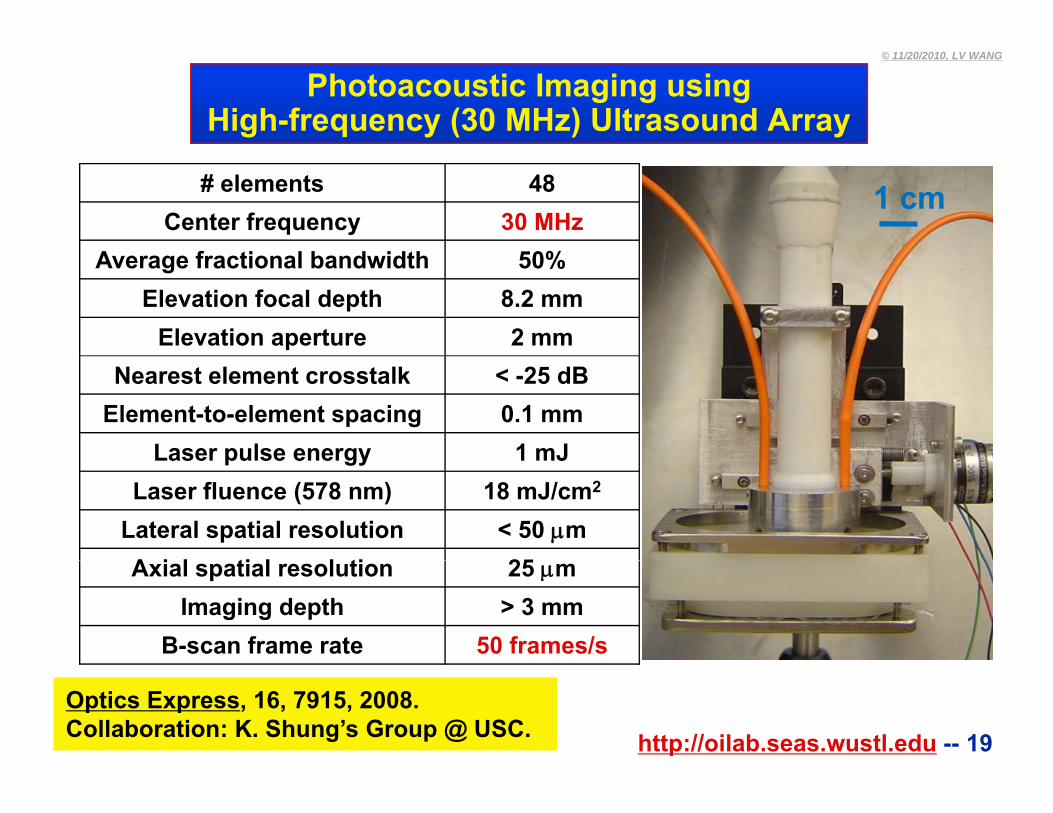
Photoacoustic Imaging usingHigh-frequency (30 MHz) Ultrasound Array
# elements 48Center frequency 30 MHz
A f ti l b d idth 50%
1 cm
Average fractional bandwidth 50%Elevation focal depth 8.2 mm
Elevation aperture 2 mmNearest element crosstalk < -25 dB
Element-to-element spacing 0.1 mmLaser pulse energy 1 mJLaser pulse energy 1 mJ
Laser fluence (578 nm) 18 mJ/cm2
Lateral spatial resolution < 50 mA i l ti l l ti 25Axial spatial resolution 25 m
Imaging depth > 3 mmB-scan frame rate 50 frames/s
http://oilab.seas.wustl.edu -- 19
Optics Express, 16, 7915, 2008.Collaboration: K. Shung’s Group @ USC.
© 11/20/2010, LV WANG
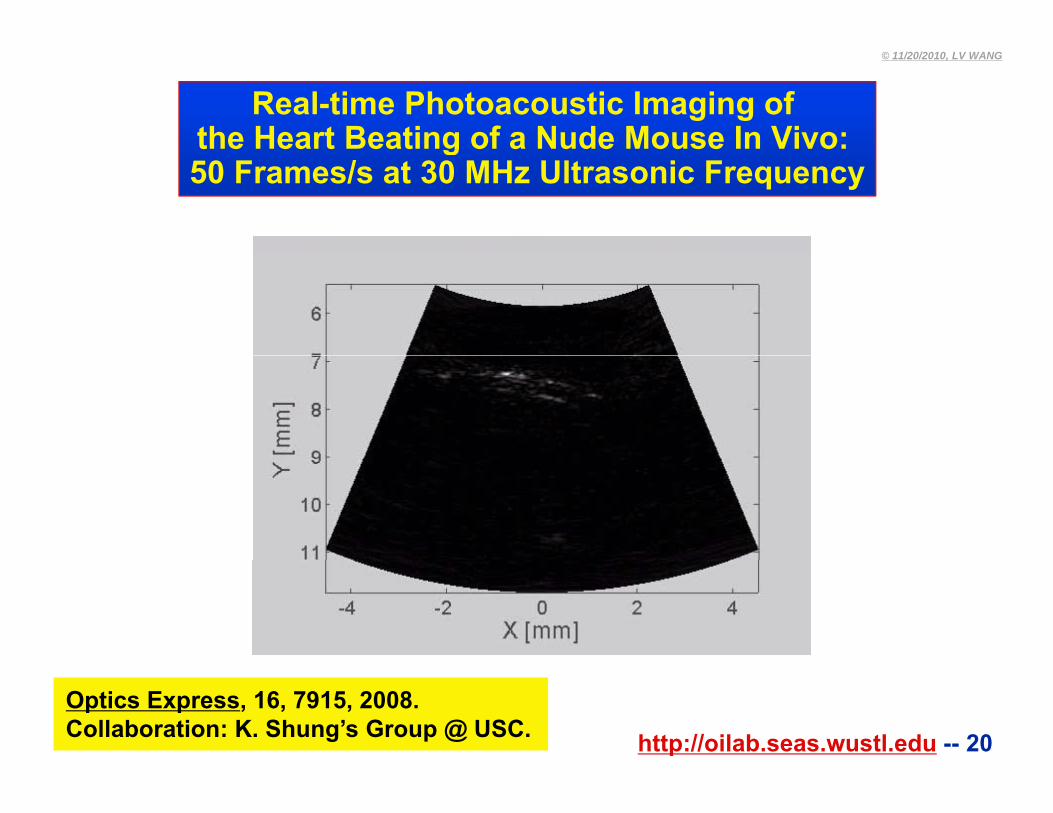
Real-time Photoacoustic Imaging of the Heart Beating of a Nude Mouse In Vivo: g50 Frames/s at 30 MHz Ultrasonic Frequency
http://oilab.seas.wustl.edu -- 20
Optics Express, 16, 7915, 2008.Collaboration: K. Shung’s Group @ USC.
© 11/20/2010, LV WANG
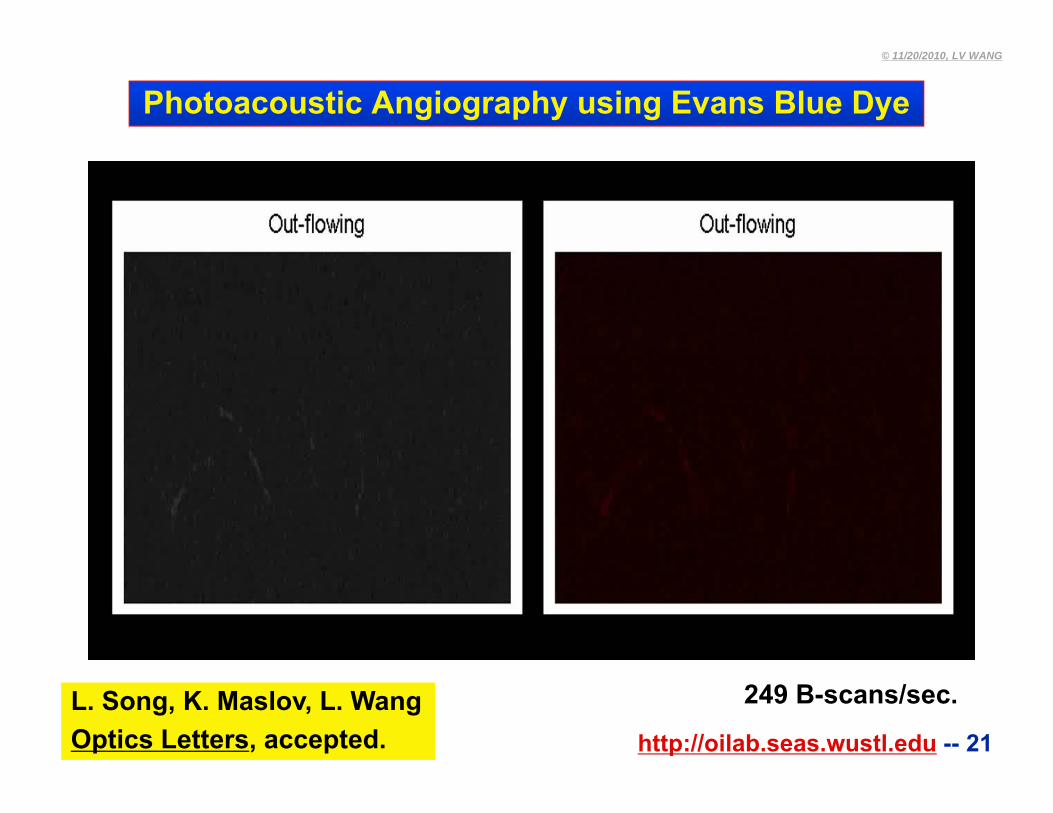
Photoacoustic Angiography using Evans Blue Dye
http://oilab.seas.wustl.edu -- 21L. Song, K. Maslov, L. WangOptics Letters, accepted.
249 B-scans/sec.
© 11/20/2010, LV WANG
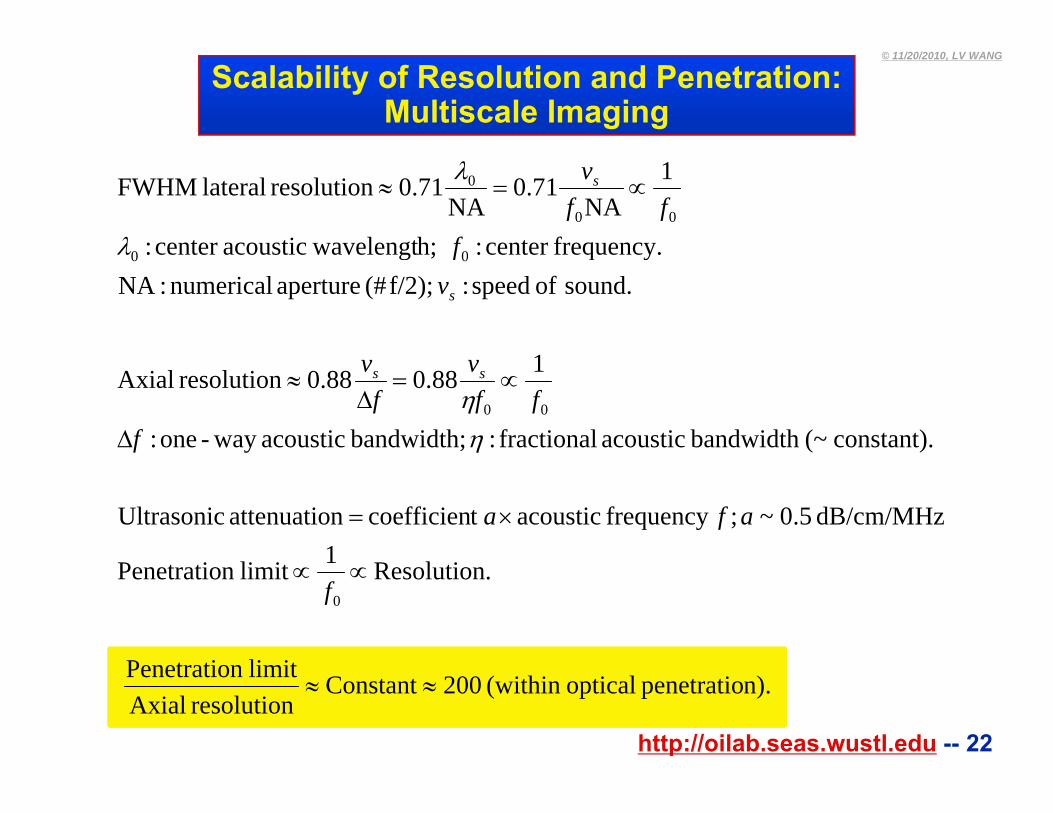
Scalability of Resolution and Penetration:Multiscale Imaging
frequency.center:h;wavelengtacousticcenter:
1NA
71.0NA
71.0 resolution lateral FWHM
00
00
0
fff
vs
1
sound. of speed : f/2);(# aperture numerical :NAfrequency.center : h; wavelengtacousticcenter : 00
vf
s
constant).(~bandwidth acoustic fractional : bandwidth; acousticway -one :
188.0 88.0 resolution Axial00
fff
vf
v ss
1dB/cm/MHz 5.0~;frequency acoustict coefficien n attenuatio Ultrasonic afa
li itP t ti
.Resolution1limit n Penetratio0
f
http://oilab.seas.wustl.edu -- 22
n).penetratio optical(within 200Constant resolution Axial
limitn Penetratio
© 11/20/2010, LV WANG
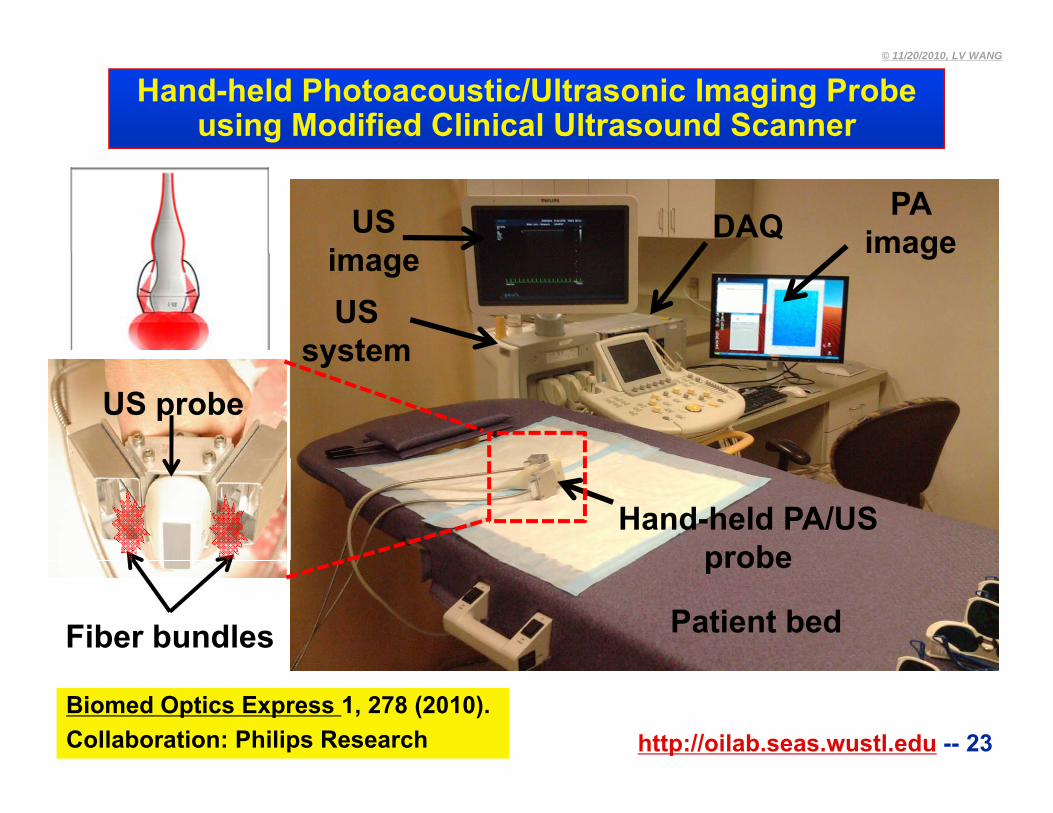
Hand-held Photoacoustic/Ultrasonic Imaging Probeusing Modified Clinical Ultrasound Scanner
DAQPA
imageUSi
US Scan
US system
imageimage
US probeScanner
system
Hand-held PA/US probe
Fiber bundles Patient bed
probe
http://oilab.seas.wustl.edu -- 23Biomed Optics Express 1, 278 (2010).Collaboration: Philips Research
© 11/20/2010, LV WANG
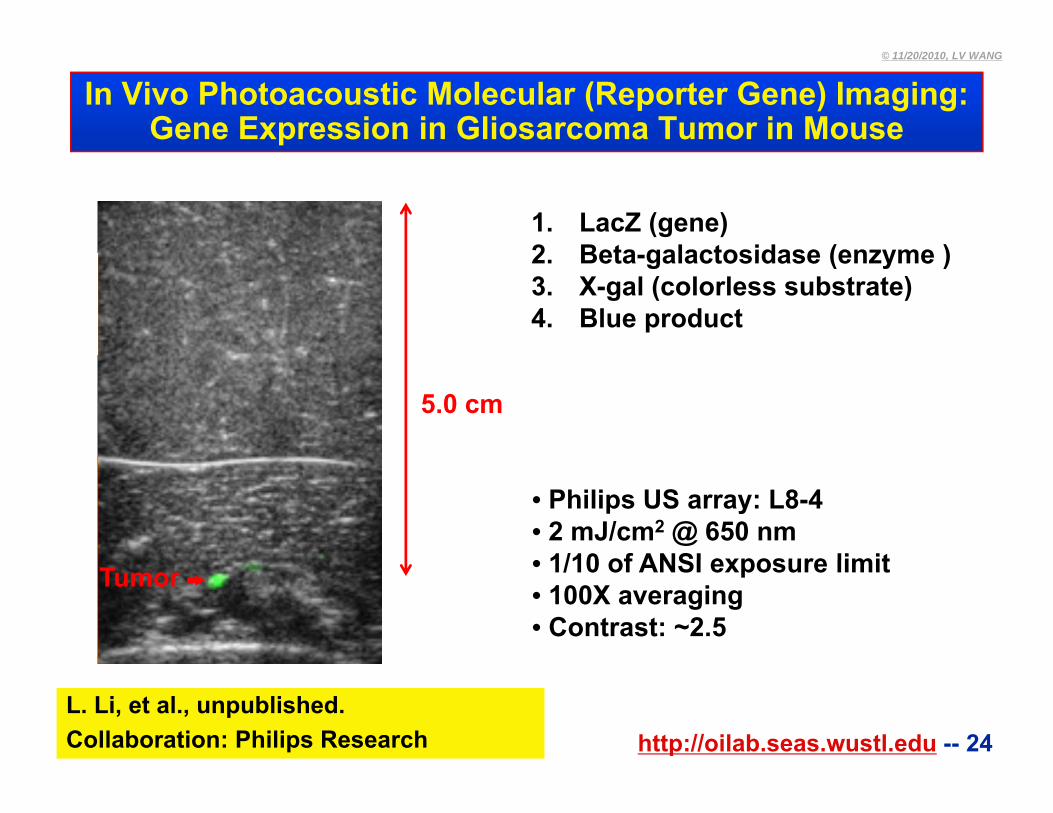
In Vivo Photoacoustic Molecular (Reporter Gene) Imaging:Gene Expression in Gliosarcoma Tumor in Mouse
1. LacZ (gene)2 Beta galactosidase (enzyme )2. Beta-galactosidase (enzyme )3. X-gal (colorless substrate)4. Blue product
5.0 cm
• Philips US array: L8-4• 2 mJ/cm2 @ 650 nm• 1/10 of ANSI exposure limitTumor • 1/10 of ANSI exposure limit• 100X averaging• Contrast: ~2.5
http://oilab.seas.wustl.edu -- 24L. Li, et al., unpublished.Collaboration: Philips Research
© 11/20/2010, LV WANG
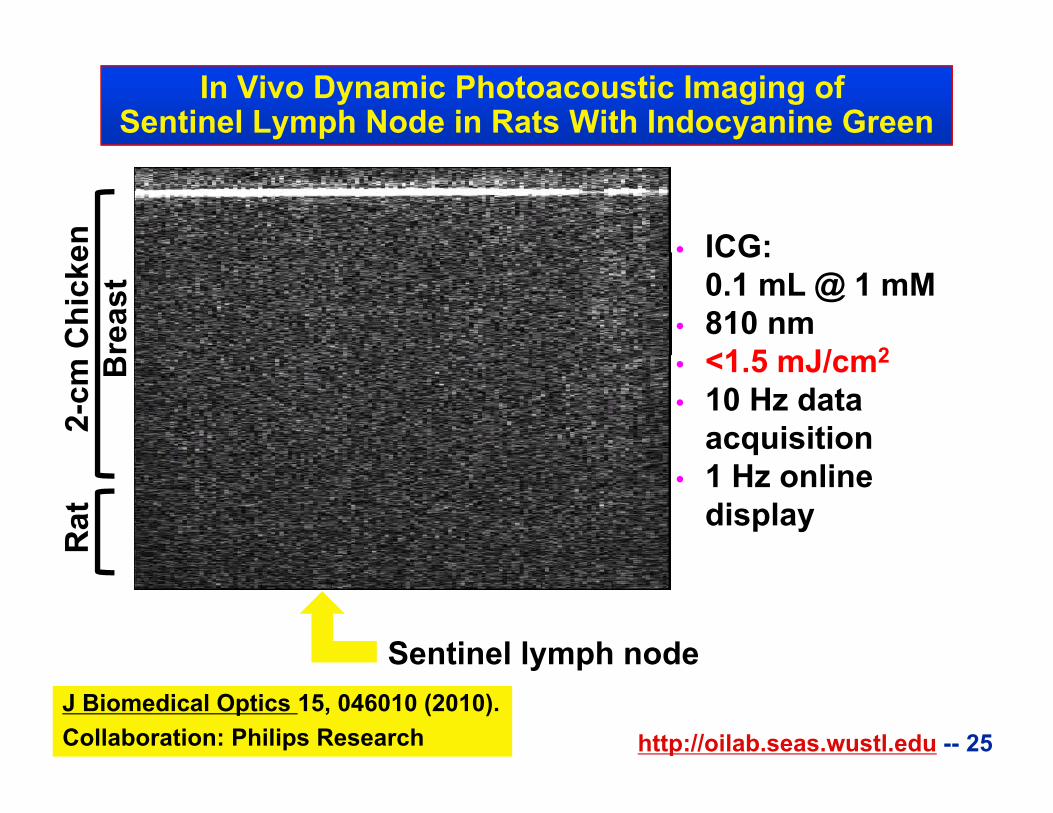
In Vivo Dynamic Photoacoustic Imaging of Sentinel Lymph Node in Rats With Indocyanine Green
en
• ICG:
Chi
cke
reas
t
ICG: 0.1 mL @ 1 mM
• 810 nm<1 5 mJ/cm2
2-cm
B • <1.5 mJ/cm2
• 10 Hz data acquisition
Rat
• 1 Hz online display
Sentinel lymph node
http://oilab.seas.wustl.edu -- 25
Sentinel lymph node J Biomedical Optics 15, 046010 (2010).Collaboration: Philips Research
© 11/20/2010, LV WANG
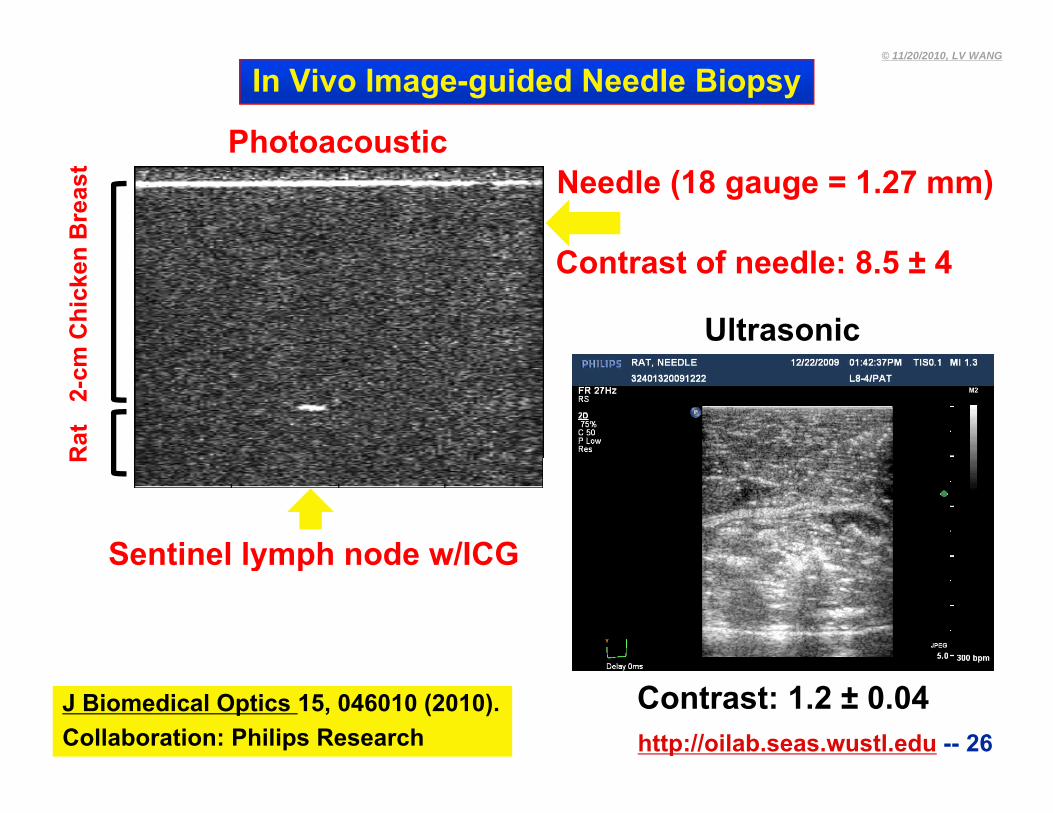
In Vivo Image-guided Needle Biopsy
Photoacoustic
n B
reas
t Needle (18 gauge = 1.27 mm)Photoacoustic
C t t f dl 8 5 ± 4
m C
hick
en
Ultrasonic
Contrast of needle: 8.5 ± 4
2-cm
Rat
Sentinel lymph node w/ICG
R
Sentinel lymph node w/ICG
http://oilab.seas.wustl.edu -- 26
Contrast: 1.2 ± 0.04J Biomedical Optics 15, 046010 (2010).Collaboration: Philips Research
© 11/20/2010, LV WANG
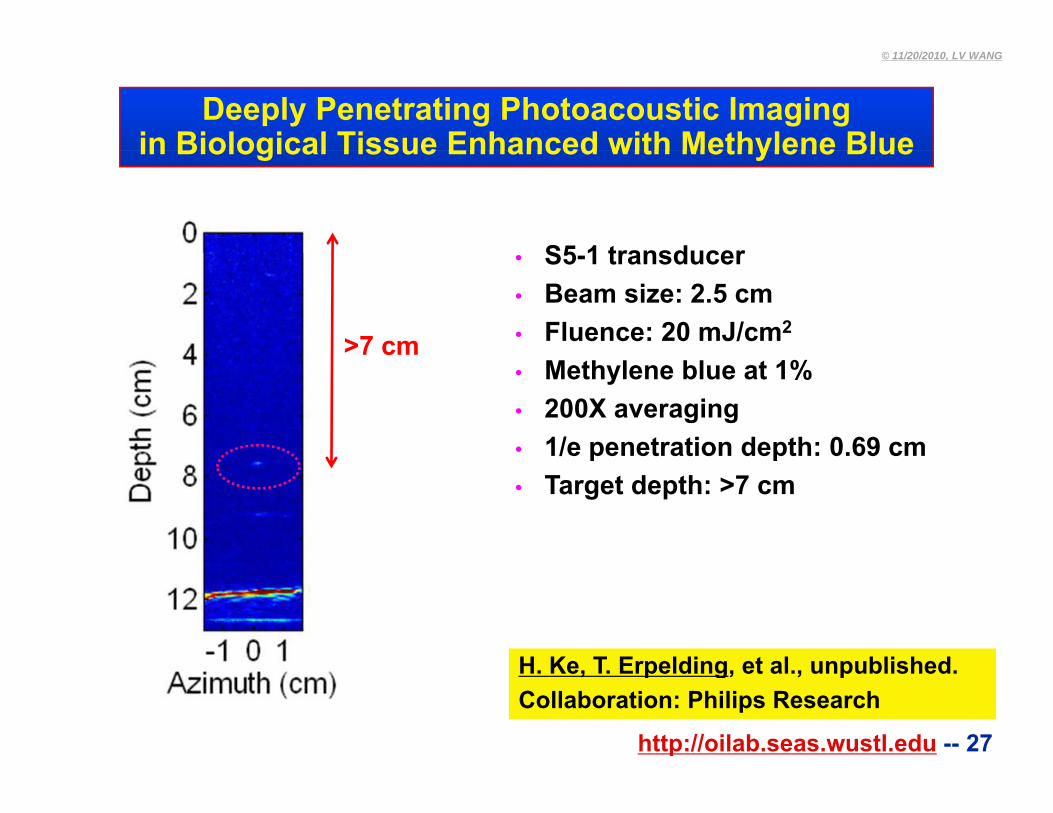
Deeply Penetrating Photoacoustic Imagingin Biological Tissue Enhanced with Methylene Bluein Biological Tissue Enhanced with Methylene Blue
S5 1 transducer• S5-1 transducer• Beam size: 2.5 cm• Fluence: 20 mJ/cm2
>7 cm• Methylene blue at 1%• 200X averaging• 1/e penetration depth: 0.69 cmp p• Target depth: >7 cm
H Ke T Erpelding et al unpublished
http://oilab.seas.wustl.edu -- 27
H. Ke, T. Erpelding, et al., unpublished.Collaboration: Philips Research
© 11/20/2010, LV WANG
Outline
• Motivation and challenges
• Photoacoustic computed tomography
Circular geometryg y
Linear geometry
• Photoacoustic microscopy
Acoustic resolution
Optical resolution
Di i dhttp://oilab.seas.wustl.edu -- 28
• Discussion and summary
© 11/20/2010, LV WANG
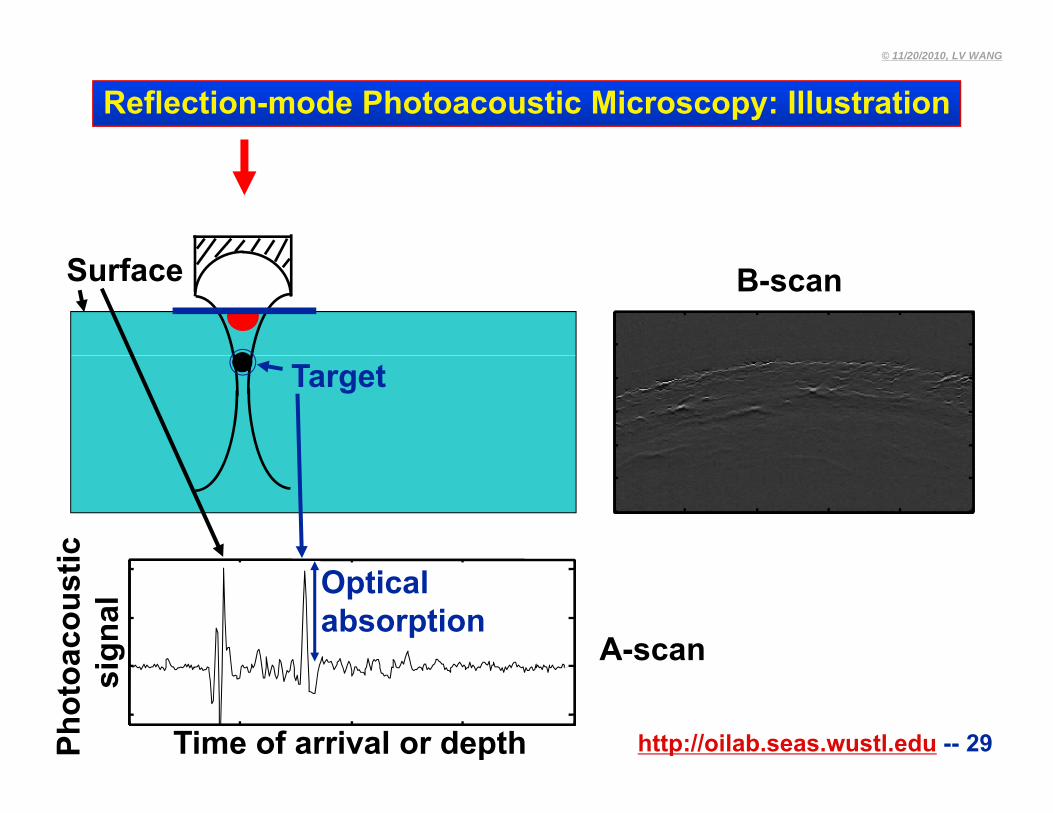
Reflection-mode Photoacoustic Microscopy: Illustration
Surface B-scan
Target
ic
acou
sti
gnal
Optical absorption
A-scan
http://oilab.seas.wustl.edu -- 29Time of arrival or depth Phot
oa si
© 11/20/2010, LV WANG
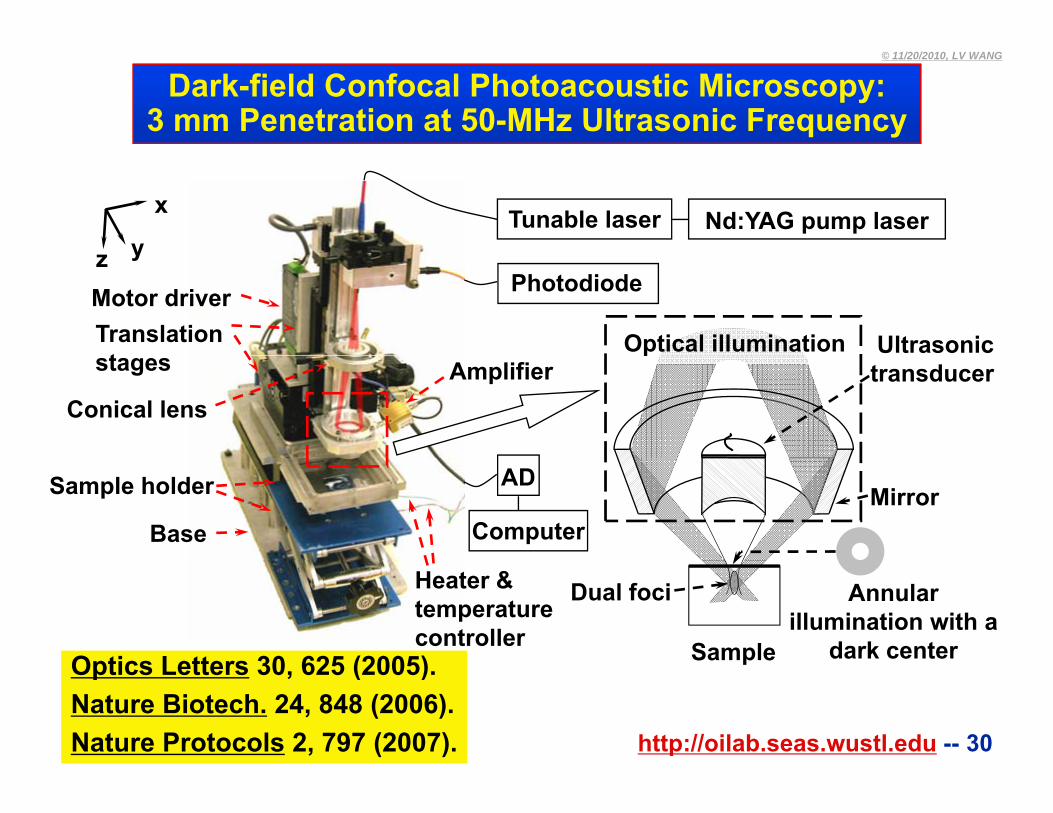
Dark-field Confocal Photoacoustic Microscopy:3 mm Penetration at 50-MHz Ultrasonic Frequency
y
x Tunable laser Nd:YAG pump laseryz
Motor driverTranslation
t
Photodiode
Ultrasonic Optical illuminationstages Amplifier
Conical lenstransducer
p
Sample holder
Base
AD
ComputerMirror
Heater & temperature controller
Dual foci
Sample
Annular illumination with a
dark center Optics Letters 30 625 (2005)
http://oilab.seas.wustl.edu -- 30
pOptics Letters 30, 625 (2005).Nature Biotech. 24, 848 (2006).Nature Protocols 2, 797 (2007).
© 11/20/2010, LV WANG
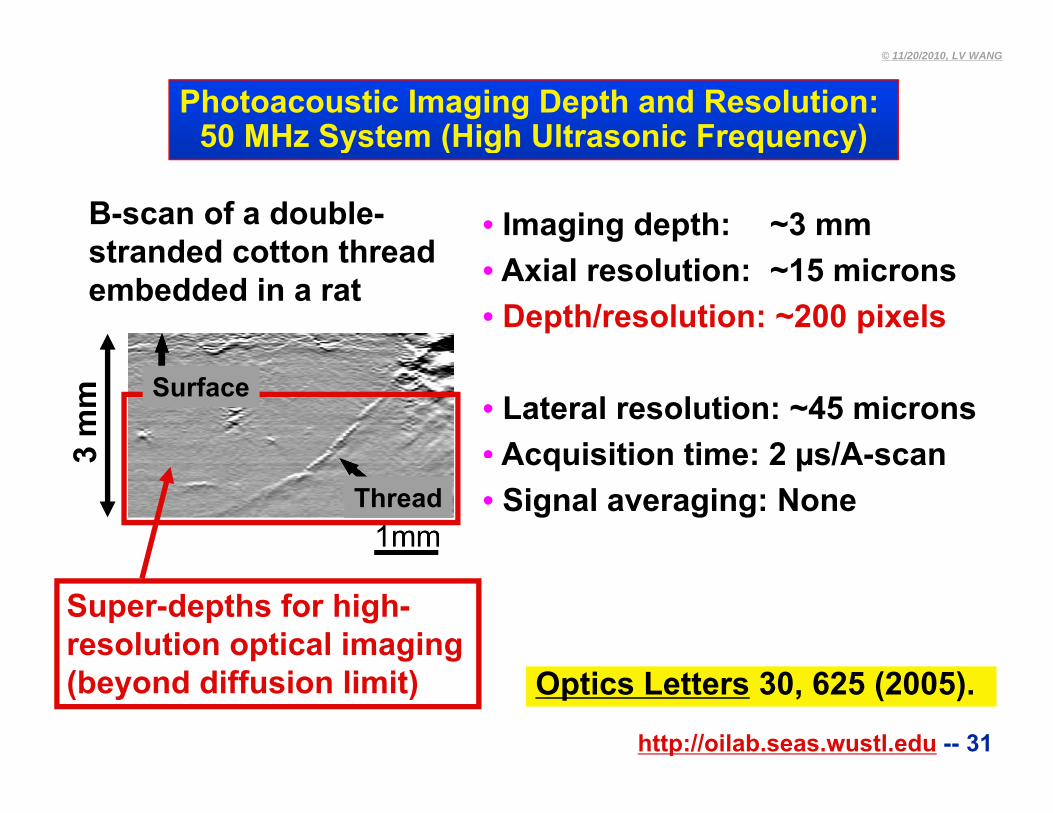
Photoacoustic Imaging Depth and Resolution: 50 MHz System (High Ultrasonic Frequency)y ( g q y)
B-scan of a double-stranded cotton thread
• Imaging depth: ~3 mmstranded cotton thread embedded in a rat • Axial resolution: ~15 microns
• Depth/resolution: ~200 pixels
• Lateral resolution: ~45 microns• Acquisition time: 2 µs/A-scan3
mm Surface
Acquisition time: 2 µs/A-scan• Signal averaging: None
3
Thread
Super-depths for high-resolution optical imaging
http://oilab.seas.wustl.edu -- 31
Optics Letters 30, 625 (2005).(beyond diffusion limit)
© 11/20/2010, LV WANG
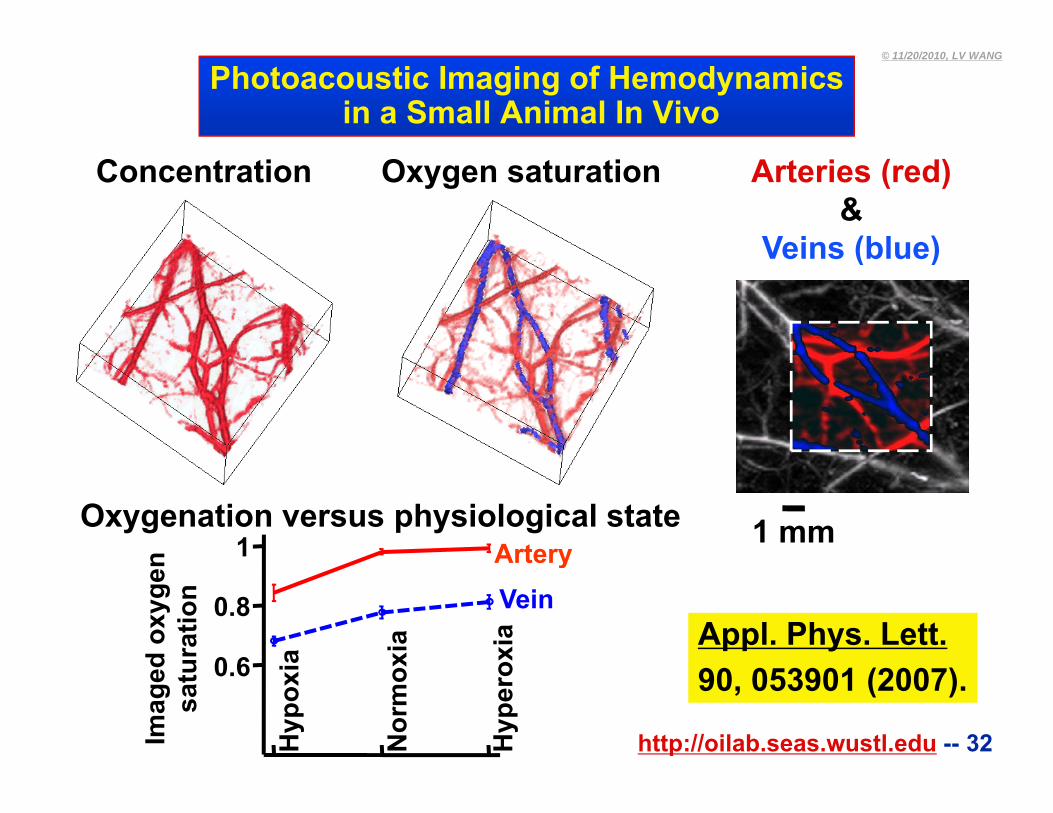
Photoacoustic Imaging of Hemodynamicsin a Small Animal In Vivo
Concentration Oxygen saturation Arteries (red)&
Veins (blue)Veins (blue)
1n ArteryOxygenation versus physiological state 1 mm
0 6
0.8
d ox
ygen
urat
ion Vein
Artery
Appl. Phys. Lett.
a xia
oxia
http://oilab.seas.wustl.edu -- 32
0.6
Imag
edsa
tu 90, 053901 (2007).
Hyp
oxi
Nor
mox
Hyp
ero
© 11/20/2010, LV WANG
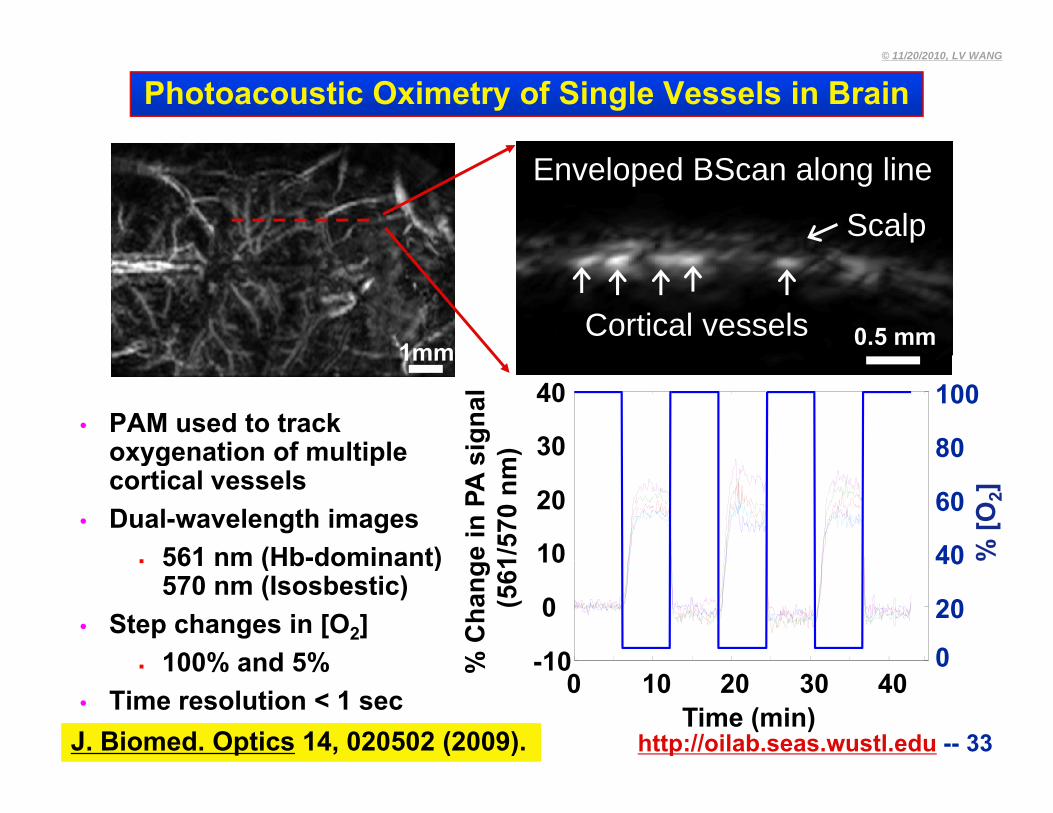
Photoacoustic Oximetry of Single Vessels in Brain
Enveloped BScan along line
Scalp
1mm 0.5 mmCortical vessels1mm
30
40
sign
alm
) 80
100• PAM used to track
oxygenation of multiple
10
20e
in P
A s
1/57
0 nm
40
60
% [O
2]
oxygenation of multiple cortical vessels
• Dual-wavelength images 561 nm (Hb-dominant)
-10
0
10
% C
hang (561
0
20
40 % 561 nm (Hb-dominant)570 nm (Isosbestic)
• Step changes in [O2]100% and 5%
http://oilab.seas.wustl.edu -- 33
-10%
0 10 20 30 400
Time (min)
100% and 5%• Time resolution < 1 sec
J. Biomed. Optics 14, 020502 (2009).
© 11/20/2010, LV WANG
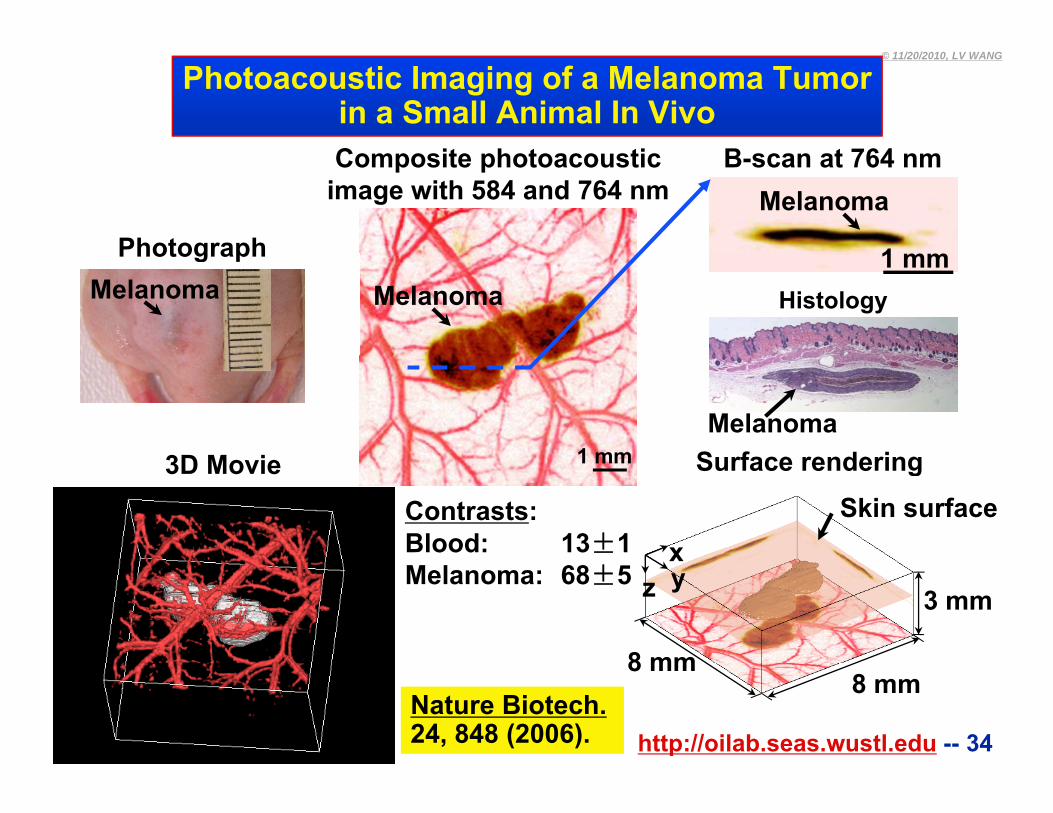
Photoacoustic Imaging of a Melanoma Tumorin a Small Animal In VivoC it h t ti B t 764Composite photoacoustic
image with 584 and 764 nm
1
Melanoma
Photograph
B-scan at 764 nm
Melanoma1 mm
MelanomaPhotograph
Histology
1 mmMelanoma
Surface rendering3D M iSkin surface
x
1 mm Surface rendering3D Movie
Contrasts:Blood: 13±1
3 mmzxy
8 mm
Melanoma: 68±5
http://oilab.seas.wustl.edu -- 34
8 mm8 mm
Nature Biotech.24, 848 (2006).
© 11/20/2010, LV WANG
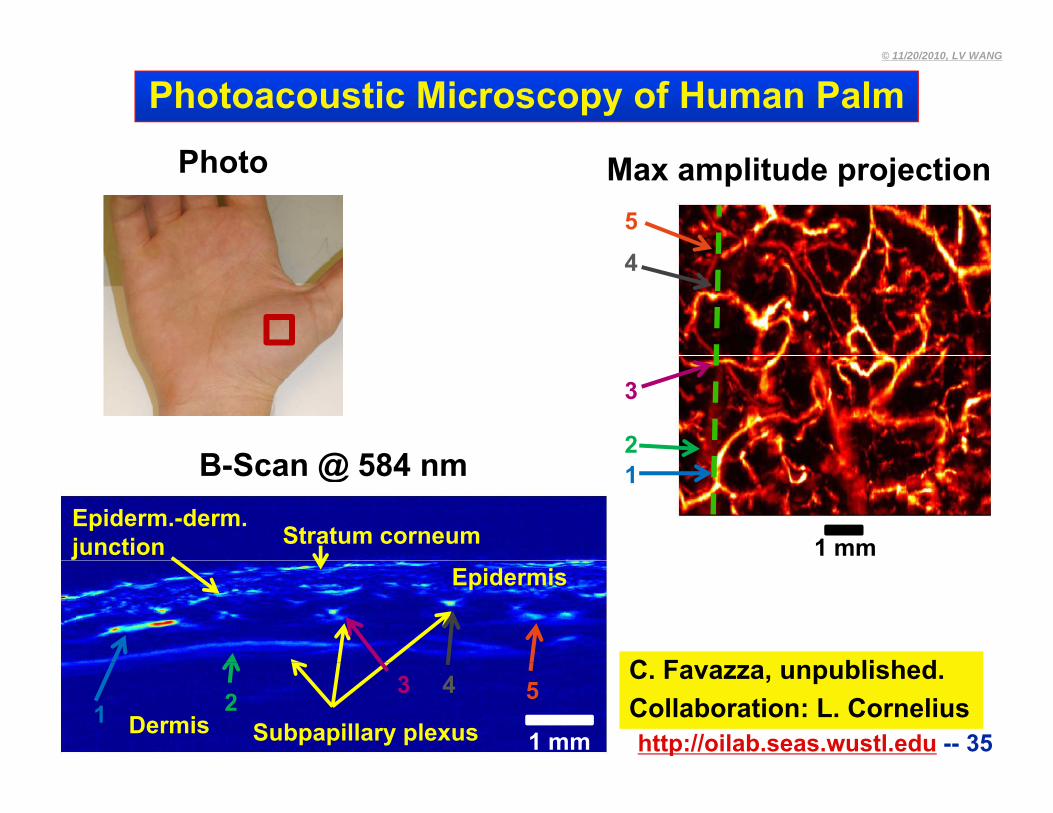
Photoacoustic Microscopy of Human Palm
Ph tPhoto Max amplitude projection5
4
B S @ 5842
3
B-Scan @ 584 nmEpiderm.-derm. junction Stratum corneum 1 mm
1
C F bli h d
Epidermis
http://oilab.seas.wustl.edu -- 35
C. Favazza, unpublished.Collaboration: L. CorneliusDermis Subpapillary plexus 1 mm
1 23 4 5
© 11/20/2010, LV WANG
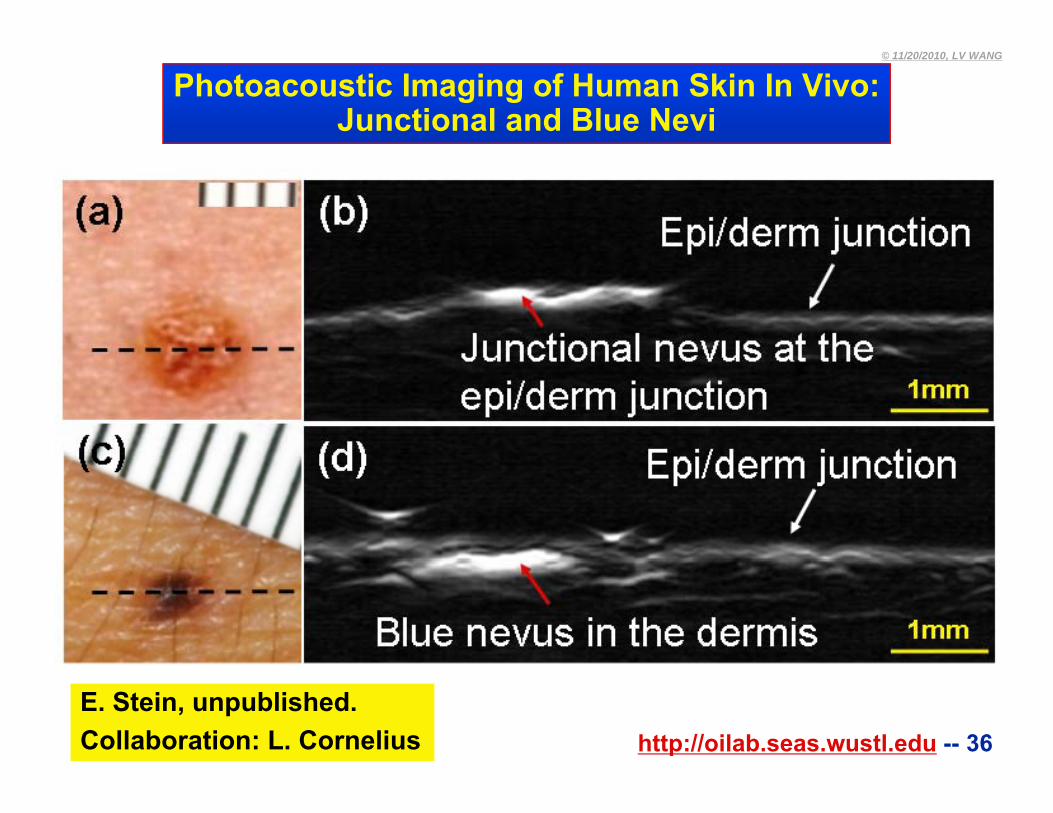
Photoacoustic Imaging of Human Skin In Vivo:Junctional and Blue Nevi
http://oilab.seas.wustl.edu -- 36E. Stein, unpublished.Collaboration: L. Cornelius
© 11/20/2010, LV WANG
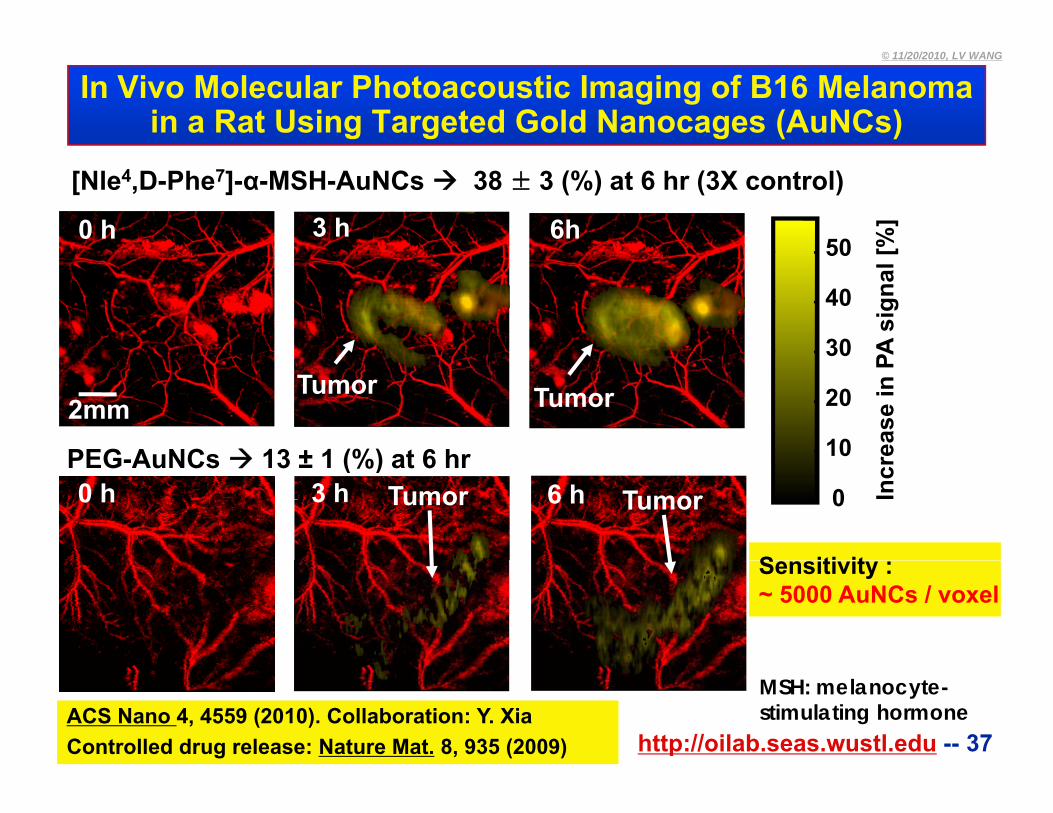
In Vivo Molecular Photoacoustic Imaging of B16 Melanomain a Rat Using Targeted Gold Nanocages (AuNCs)
[Nle4,D-Phe7]-α-MSH-AuNCs 38 ± 3 (%) at 6 hr (3X control)
0 h 3 h 6h
[%]
50
PA s
igna
l [
30
40
50
PEG AuNCs 13 ± 1 (%) at 6 hr
2mmTumor Tumor
reas
e in
P
10
20
30
PEG-AuNCs 13 ± 1 (%) at 6 hr
S iti it
0 h 3 h Tumor 6 h Tumor Incr
0
Sensitivity :~ 5000 AuNCs / voxel
http://oilab.seas.wustl.edu -- 37ACS Nano 4, 4559 (2010). Collaboration: Y. XiaControlled drug release: Nature Mat. 8, 935 (2009)
MSH: melanocyte-stimulating hormone
© 11/20/2010, LV WANG
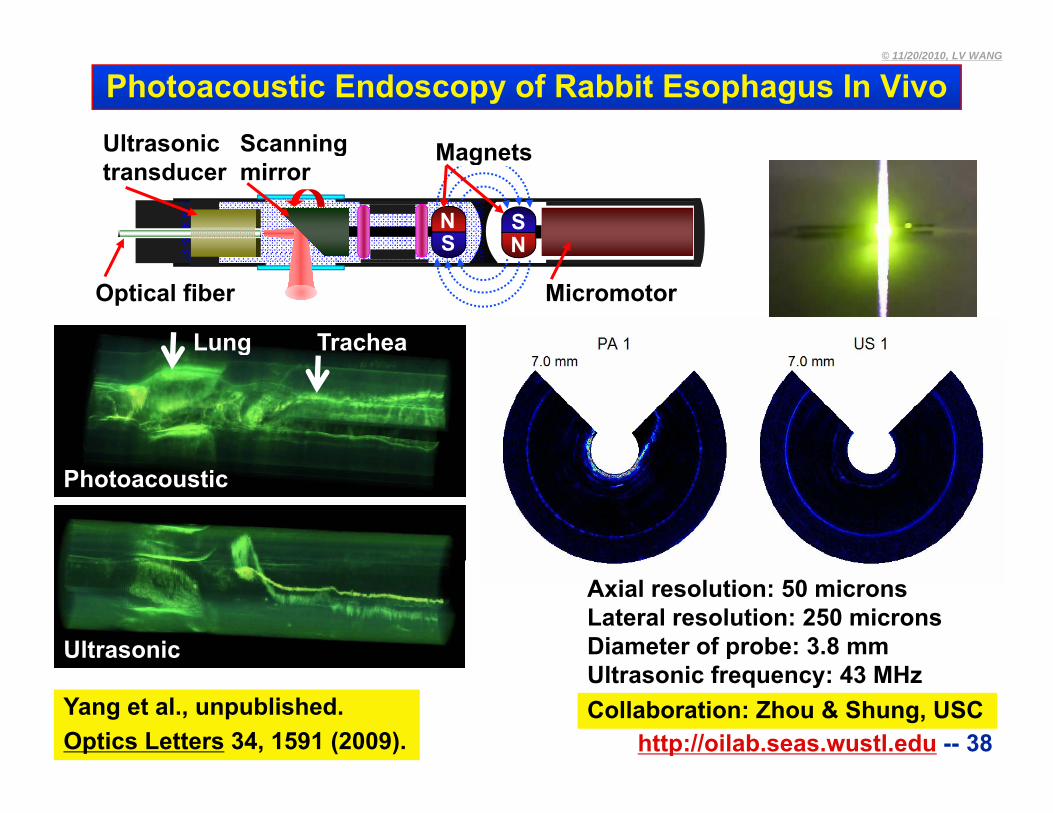
Photoacoustic Endoscopy of Rabbit Esophagus In VivoScanning MagnetsUltrasonic Scanningmirror
NS N
S
MagnetsUltrasonictransducer
Optical fiber Micromotor
Lung Trachea
Photoacoustic
Ultrasonic
Axial resolution: 50 micronsLateral resolution: 250 micronsDiameter of probe: 3.8 mm
http://oilab.seas.wustl.edu -- 38Yang et al., unpublished.Optics Letters 34, 1591 (2009).
Collaboration: Zhou & Shung, USCUltrasonic frequency: 43 MHz
© 11/20/2010, LV WANG
Outline
• Motivation and challenges
• Photoacoustic computed tomography
Circular geometryg y
Linear geometry
• Photoacoustic microscopy
Acoustic resolution
Optical resolution
Di i dhttp://oilab.seas.wustl.edu -- 39
• Discussion and summary
© 11/20/2010, LV WANG
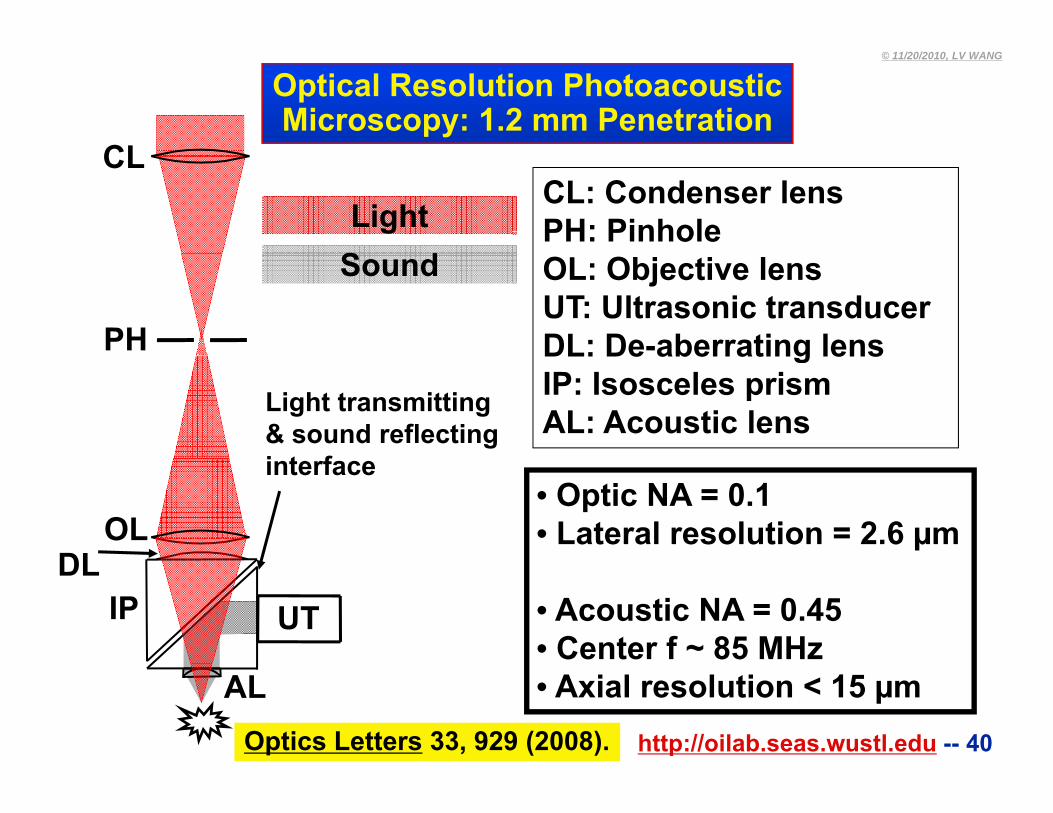
Optical Resolution PhotoacousticMicroscopy: 1.2 mm Penetration
CLCL: Condenser lensPH: Pinhole
CL
LightS OL: Objective lens
UT: Ultrasonic transducerDL: De-aberrating lensPH
Sound
DL: De aberrating lensIP: Isosceles prismAL: Acoustic lensLight transmitting
& sound reflectingi t f
OLDL
• Optic NA = 0.1• Lateral resolution = 2.6 µm
interface
DLUTIP • Acoustic NA = 0.45
• Center f ~ 85 MHz
http://oilab.seas.wustl.edu -- 40
AL • Axial resolution < 15 µmOptics Letters 33, 929 (2008).
© 11/20/2010, LV WANG
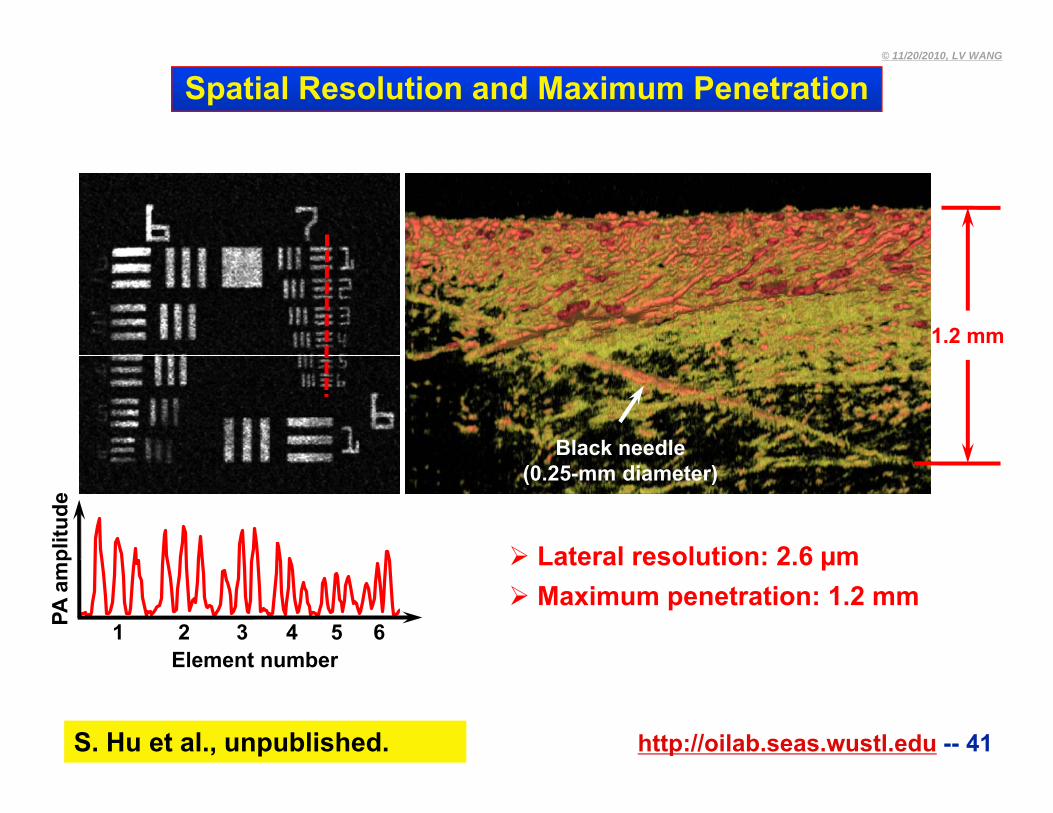
Spatial Resolution and Maximum Penetration
1.2 mm
Black needle
plitu
de
(0.25-mm diameter)
Lateral resolution: 2 6 µm
1 2 3 4 5 6PA a
m
Element number
Lateral resolution: 2.6 µm Maximum penetration: 1.2 mm
http://oilab.seas.wustl.edu -- 41
Element number
S. Hu et al., unpublished.
© 11/20/2010, LV WANG
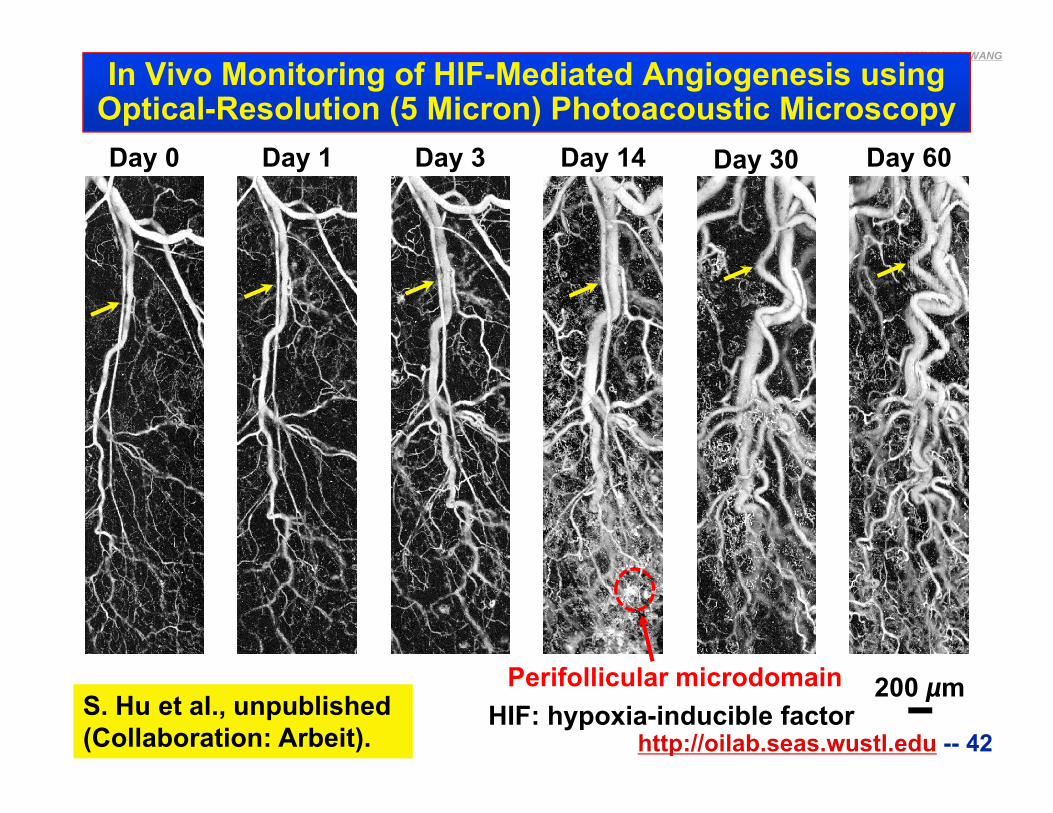
In Vivo Monitoring of HIF-Mediated Angiogenesis usingOptical-Resolution (5 Micron) Photoacoustic Microscopy
D 30D 0 D 1 D 60D 3 D 14 Day 30Day 0 Day 1 Day 60Day 3 Day 14
http://oilab.seas.wustl.edu -- 42S. Hu et al., unpublished (Collaboration: Arbeit).
200 µmHIF: hypoxia-inducible factor
Perifollicular microdomain
© 11/20/2010, LV WANG
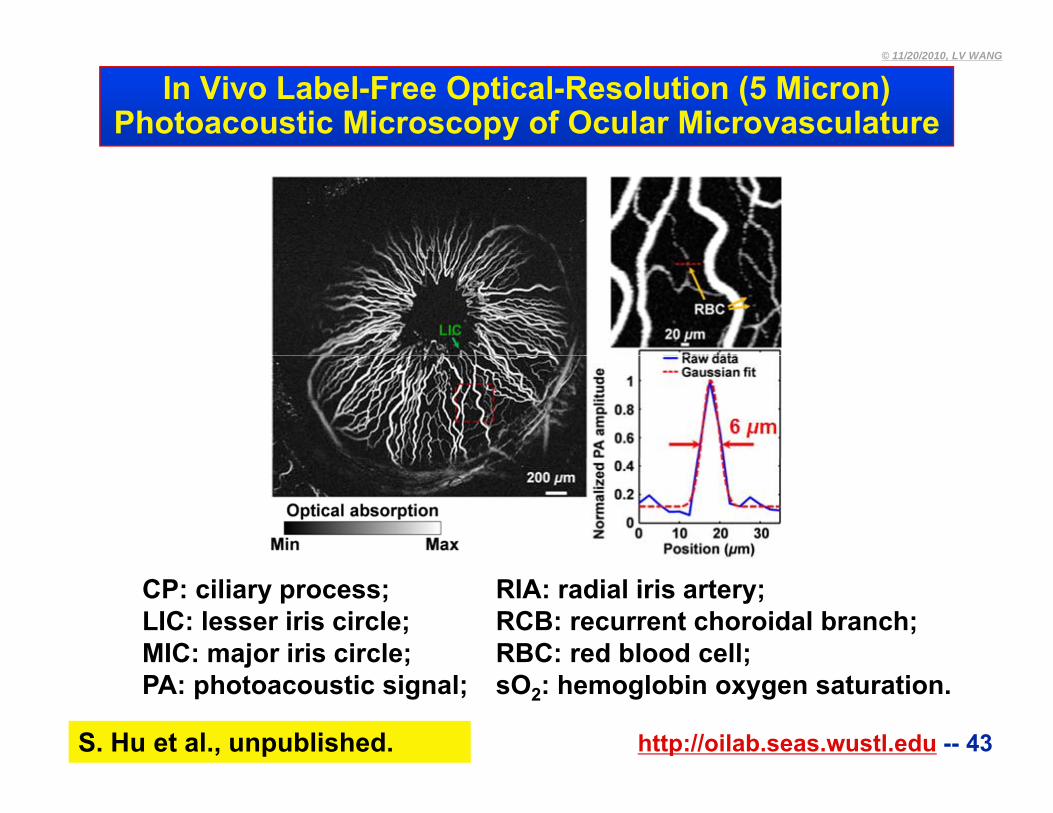
In Vivo Label-Free Optical-Resolution (5 Micron)Photoacoustic Microscopy of Ocular Microvasculature
CP: ciliary process; LIC: lesser iris circle; MIC: major iris circle;
RIA: radial iris artery; RCB: recurrent choroidal branch;RBC: red blood cell;
http://oilab.seas.wustl.edu -- 43
j ;PA: photoacoustic signal;
S. Hu et al., unpublished.
;sO2: hemoglobin oxygen saturation.
© 11/20/2010, LV WANG
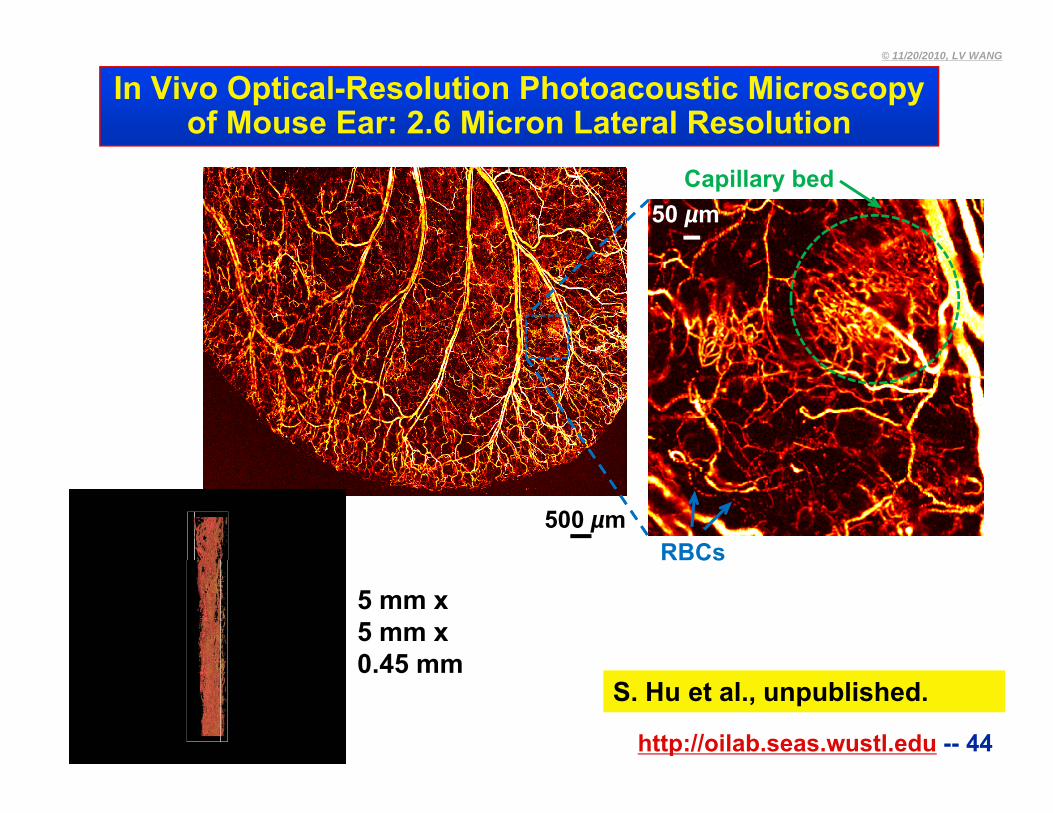
In Vivo Optical-Resolution Photoacoustic Microscopyof Mouse Ear: 2.6 Micron Lateral Resolution
Capillary bed50 µm
500 µmRBCs
5 mm x 5 mm x 0 45 mm
Cs
http://oilab.seas.wustl.edu -- 44
S. Hu et al., unpublished.0.45 mm
© 11/20/2010, LV WANG
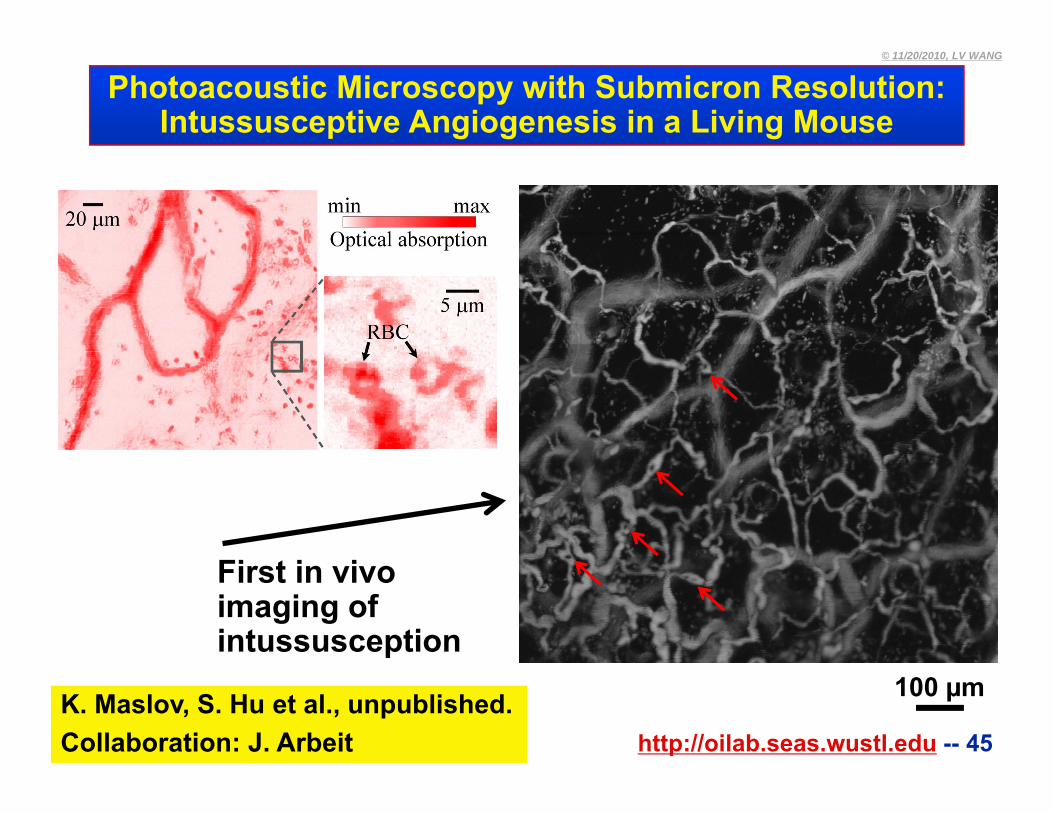
Photoacoustic Microscopy with Submicron Resolution:Intussusceptive Angiogenesis in a Living Mouse
Fi t i iFirst in vivo imaging of intussusception
http://oilab.seas.wustl.edu -- 45K. Maslov, S. Hu et al., unpublished.Collaboration: J. Arbeit
100 µm
© 11/20/2010, LV WANG
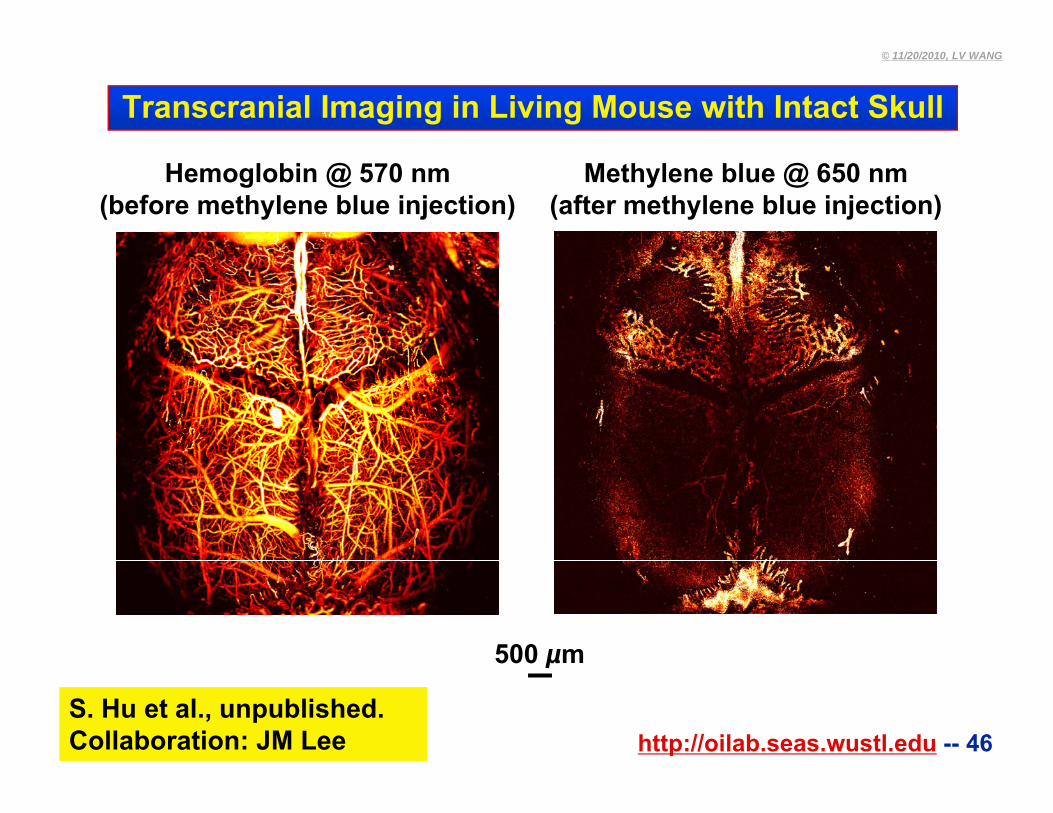
Transcranial Imaging in Living Mouse with Intact Skull
Hemoglobin @ 570 nm(before methylene blue injection)
Methylene blue @ 650 nm(after methylene blue injection)
500 µm
http://oilab.seas.wustl.edu -- 46
500 µ
S. Hu et al., unpublished.Collaboration: JM Lee
© 11/20/2010, LV WANG
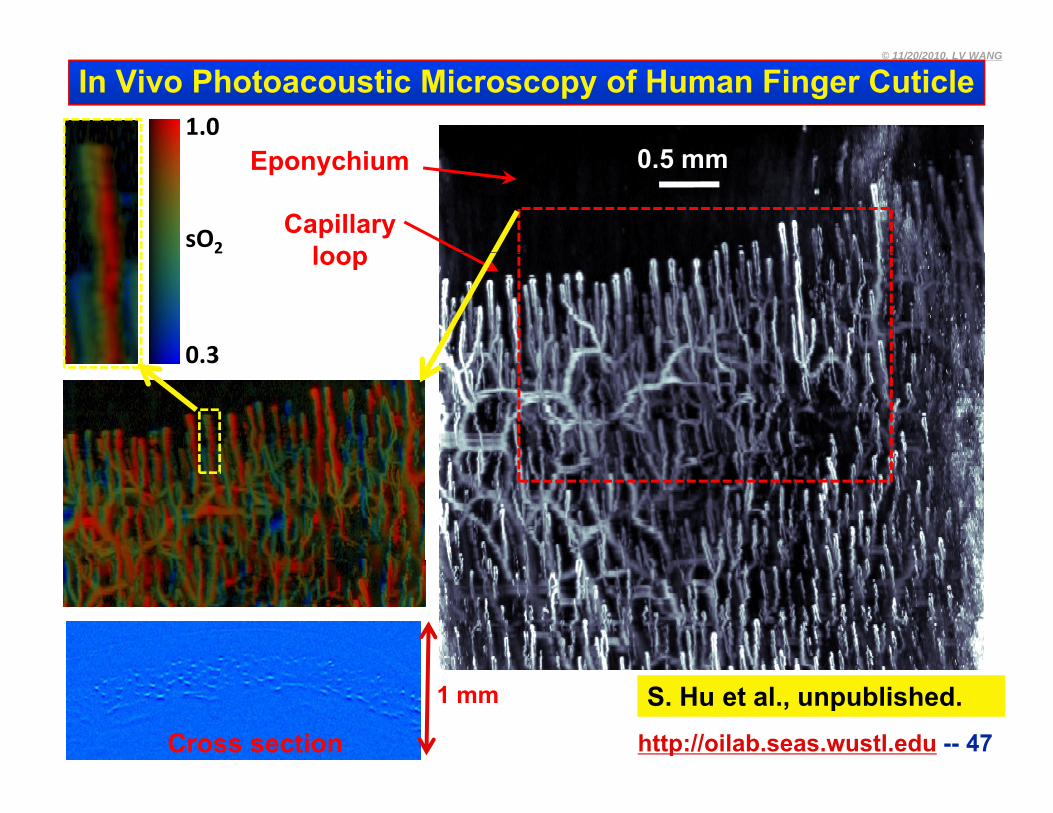
In Vivo Photoacoustic Microscopy of Human Finger Cuticle1.0
0 5
sO2Capillary
loop
Eponychium 0.5 mm
0 3
2 loop
0.3
http://oilab.seas.wustl.edu -- 47
S. Hu et al., unpublished.1 mm
Cross section
© 11/20/2010, LV WANG
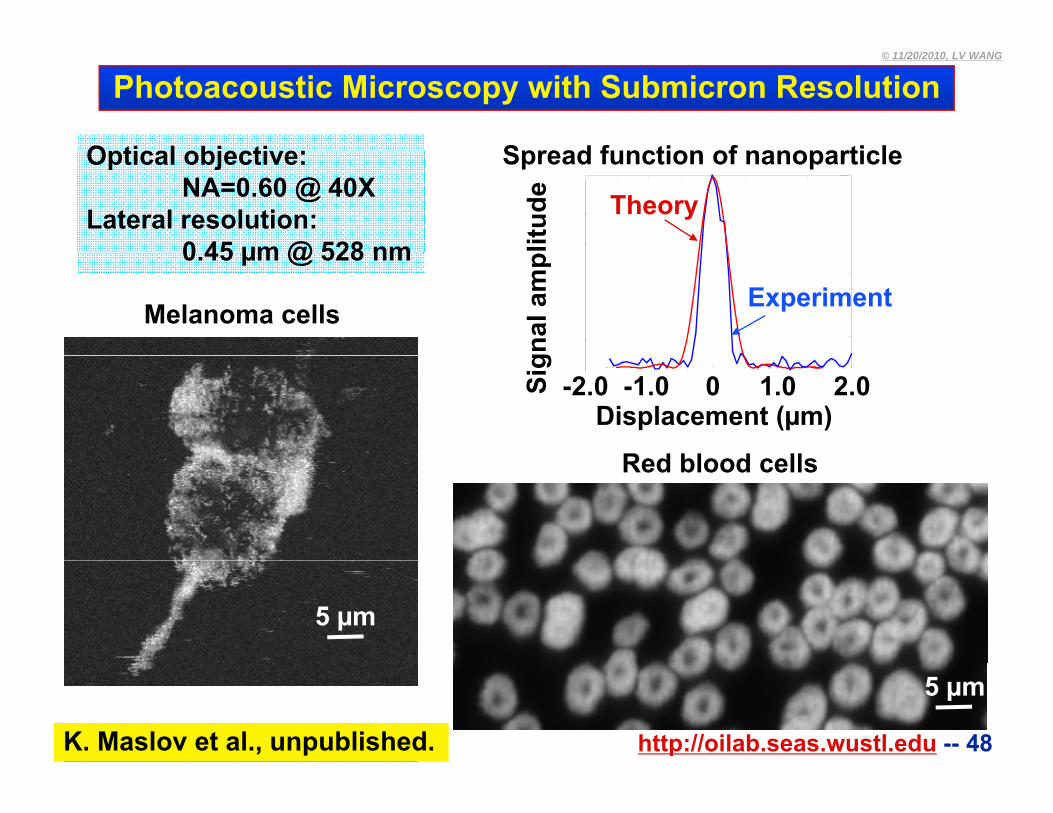
O ti l bj ti
Photoacoustic Microscopy with Submicron Resolution
Spread f nction of nanoparticleOptical objective: NA=0.60 @ 40X
Lateral resolution: 0 45 µm @ 528 nm
Spread function of nanoparticle
litud
e Theory
Melanoma cells
0.45 µm @ 528 nm
gnal
am
p
Experiment
-2.0 -1.0 0 1.0 2.0
R d bl d ll
Displacement (µm)
Sig
Red blood cells
5 µm
http://oilab.seas.wustl.edu -- 48
5 µm
K. Maslov et al., unpublished.
© 11/20/2010, LV WANG
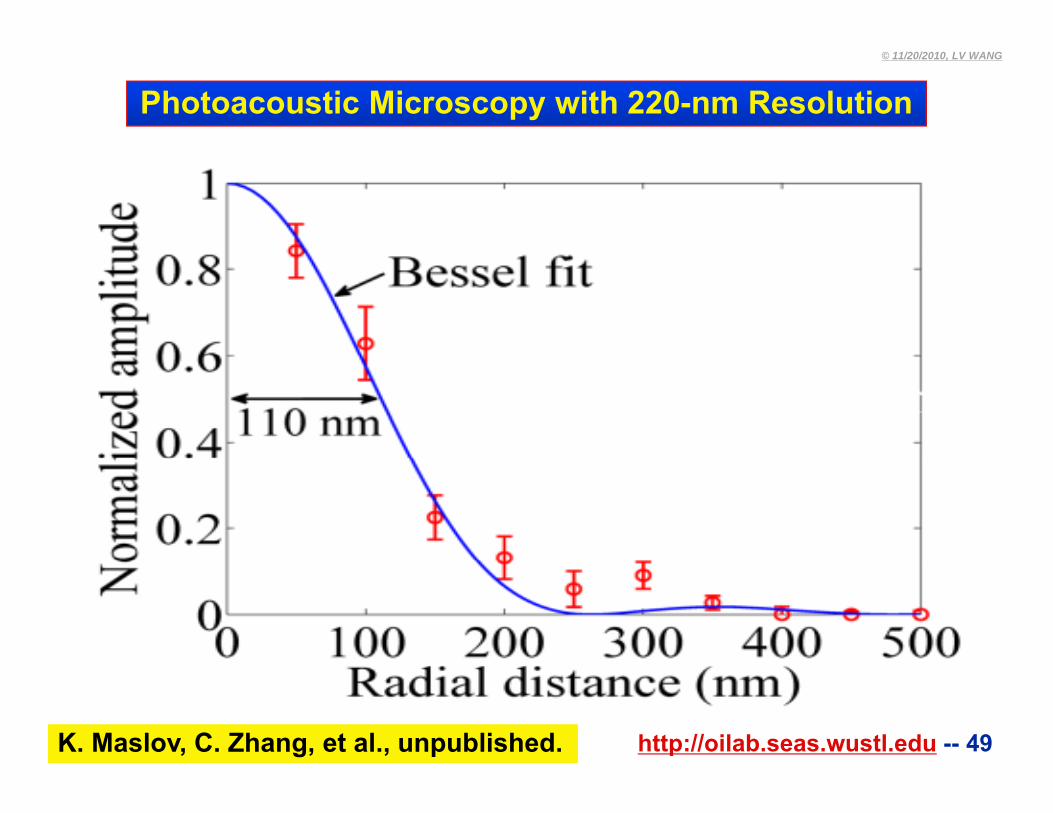
Photoacoustic Microscopy with 220-nm Resolution
http://oilab.seas.wustl.edu -- 49K. Maslov, C. Zhang, et al., unpublished.
© 11/20/2010, LV WANG
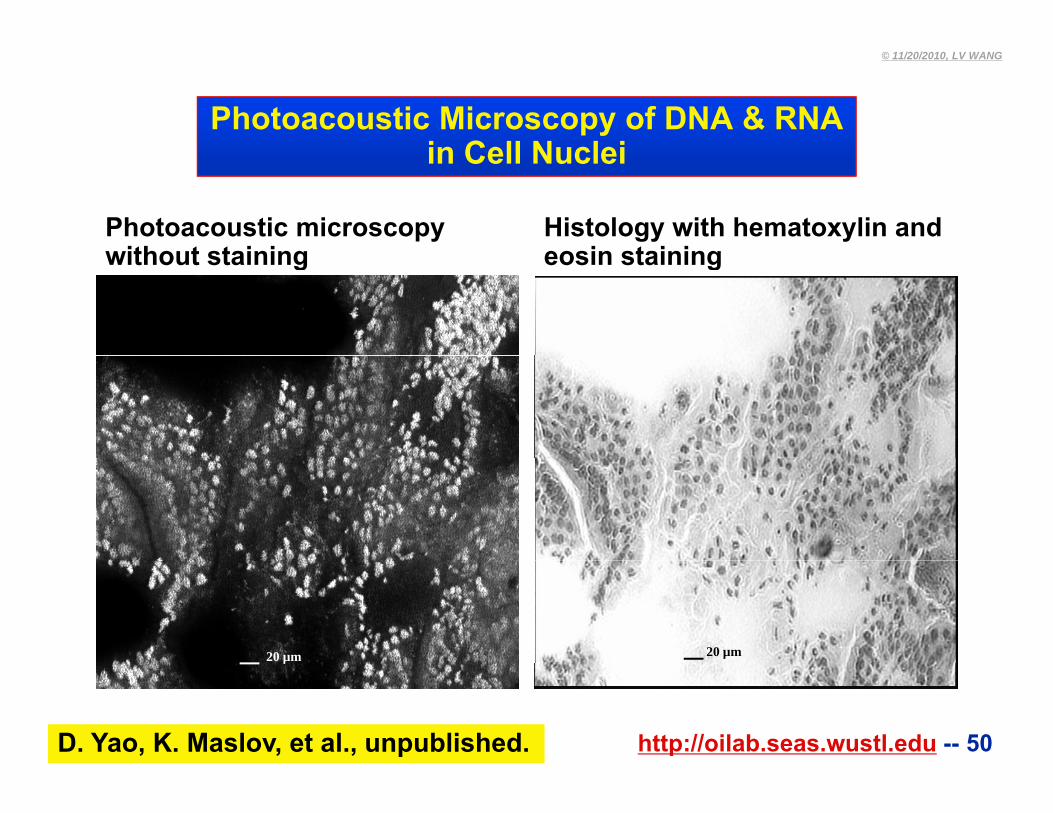
Photoacoustic Microscopy of DNA & RNAin Cell Nucleiin Cell Nuclei
Photoacoustic microscopy without staining
Histology with hematoxylin and eosin stainingwithout staining eosin staining
20 µm 20 µm
http://oilab.seas.wustl.edu -- 50
µ
D. Yao, K. Maslov, et al., unpublished.
© 11/20/2010, LV WANG
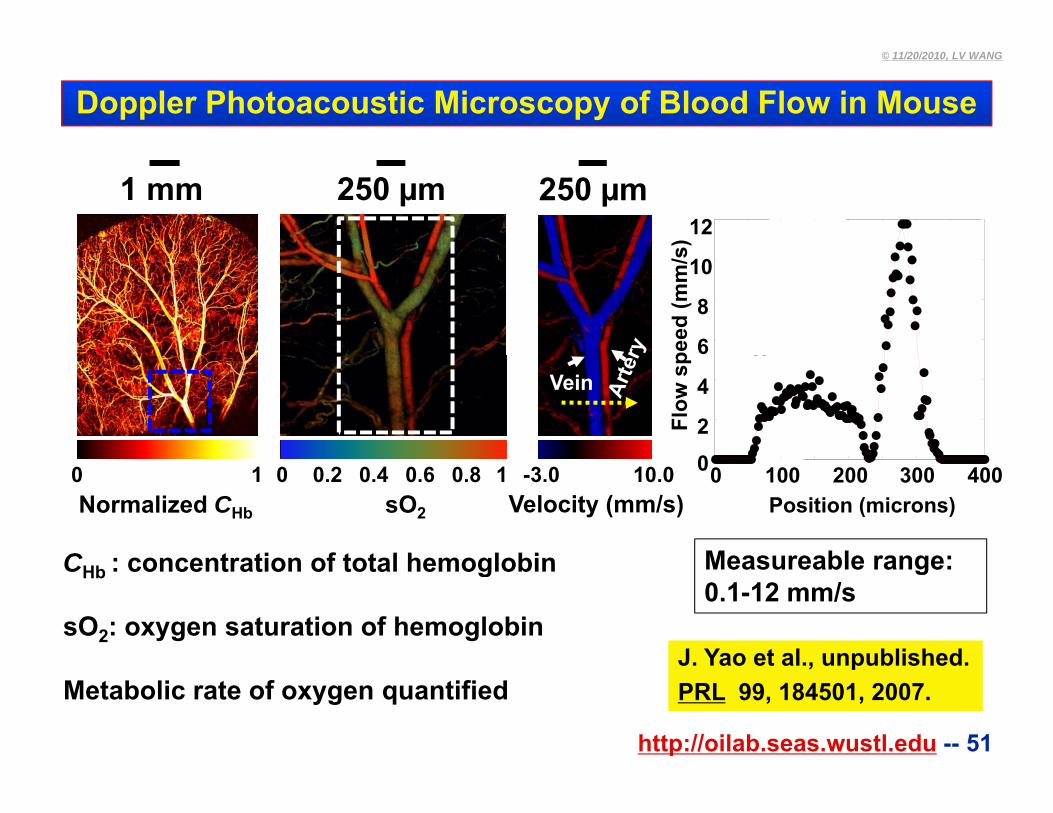
Doppler Photoacoustic Microscopy of Blood Flow in Mouse
12
s)
1 mm 250 µm 250 µm
ArteryV i6
8
10
peed
(mm
/s
VeinVein
02
4
Flow
sp
Measureable range:
Normalized CHb
0 1 0 10.4 0.6 0.80.2 10.0-3.0sO2 Velocity (mm/s)
C : concentration of total hemoglobin
0 100 200 300 4000
Position (microns)
J. Yao et al., unpublished.
Measureable range: 0.1-12 mm/s
CHb : concentration of total hemoglobin
sO2: oxygen saturation of hemoglobin
http://oilab.seas.wustl.edu -- 51
J. Yao et al., unpublished.PRL 99, 184501, 2007.Metabolic rate of oxygen quantified
© 11/20/2010, LV WANG
Outline
• Motivation and challenges
• Photoacoustic computed tomography
Circular geometryg y
Linear geometry
• Photoacoustic microscopy
Acoustic resolution
Optical resolution
Di i dhttp://oilab.seas.wustl.edu -- 52
• Discussion and summary
© 11/20/2010, LV WANG
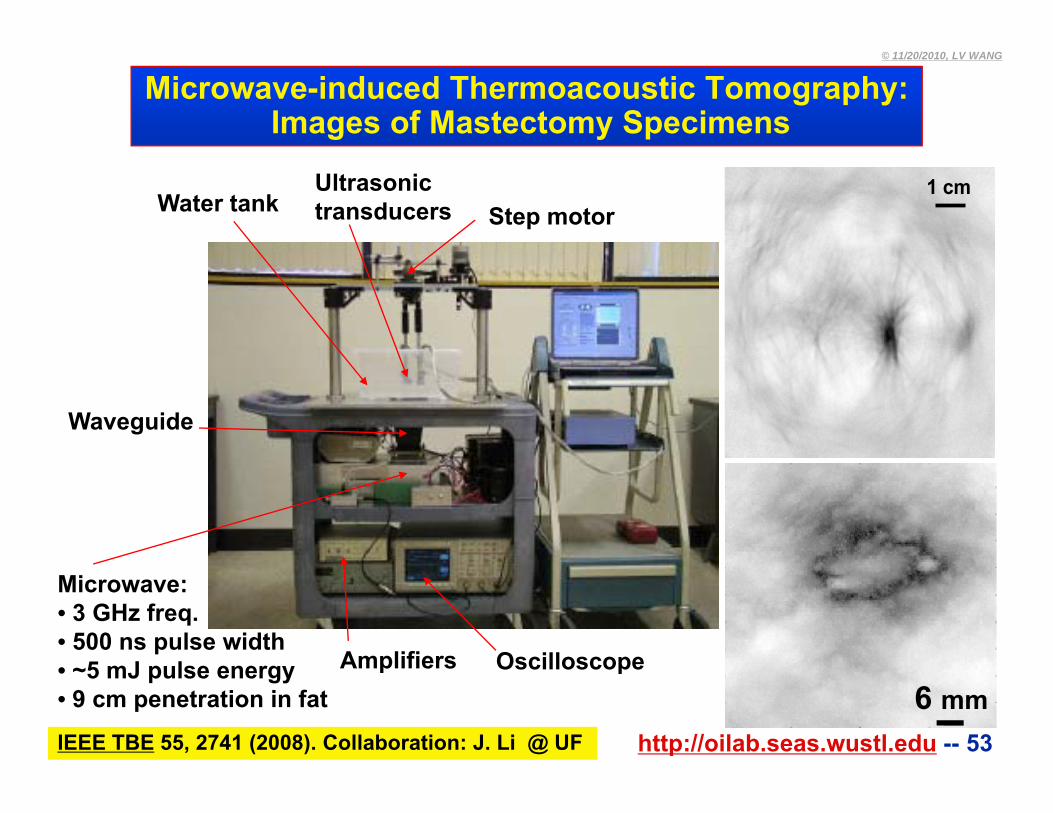
Microwave-induced Thermoacoustic Tomography:Images of Mastectomy Specimens
Water tankUltrasonic transducers Step motor
1 cm
Waveguide
Amplifiers Oscilloscope
Microwave:• 3 GHz freq.• 500 ns pulse width
5 J l
http://oilab.seas.wustl.edu -- 53
Amplifiers Oscilloscope• ~5 mJ pulse energy• 9 cm penetration in fat 6 mmIEEE TBE 55, 2741 (2008). Collaboration: J. Li @ UF
© 11/20/2010, LV WANG
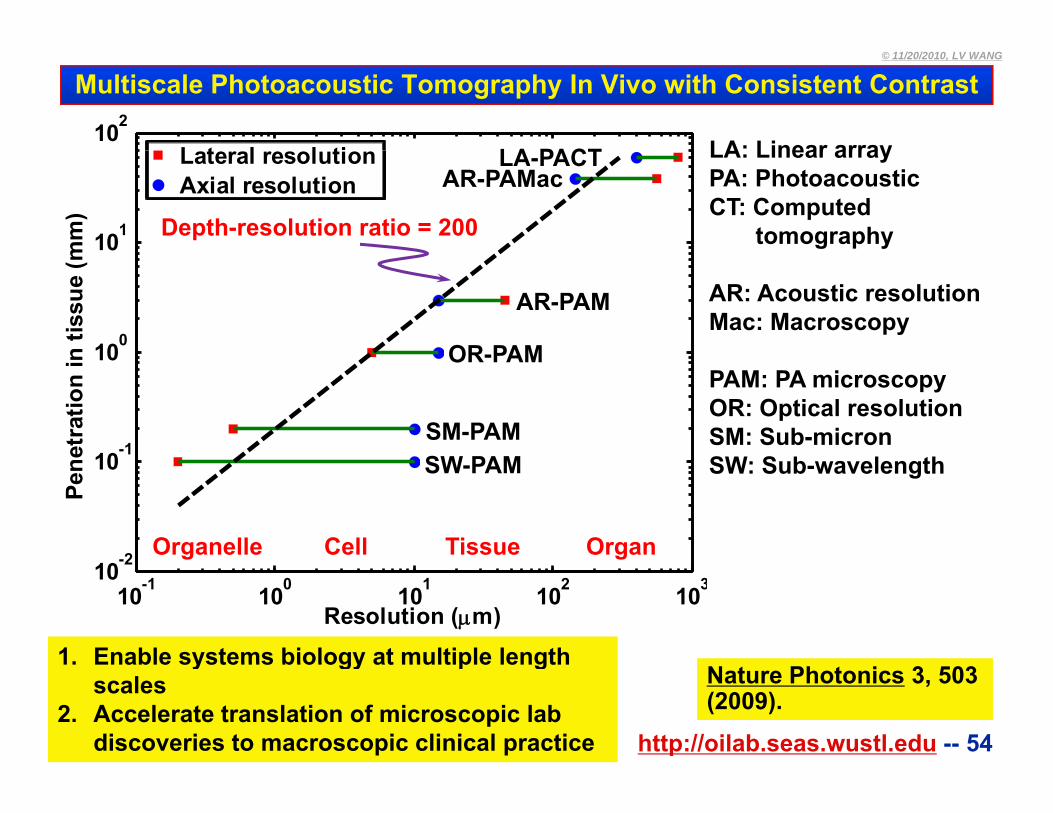
Multiscale Photoacoustic Tomography In Vivo with Consistent Contrast
102
L t l l ti LA PACT LA: Linear array
101
mm
)
Lateral resolutionAxial resolution
LA-PACTAR-PAMac
LA: Linear arrayPA: PhotoacousticCT: Computed
tomographyDepth-resolution ratio = 200
100
n tis
sue
(m
OR-PAM
AR-PAM AR: Acoustic resolutionMac: Macroscopy
10-1
10
etra
tion
in
SM-PAM
OR-PAM
SW PAM
PAM: PA microscopyOR: Optical resolutionSM: Sub-micronSW S b l th
-2
10
Pen SW-PAM SW: Sub-wavelength
Organelle Cell Tissue Organ
10-1 100 101 102 10310-2
Resolution (m)
1. Enable systems biology at multiple length
http://oilab.seas.wustl.edu -- 54
Nature Photonics 3, 503 (2009).
1. Enable systems biology at multiple length scales
2. Accelerate translation of microscopic lab discoveries to macroscopic clinical practice
© 11/20/2010, LV WANG
Preclinical Imaging Applications
1. Non-fluorescent pigments (red blood cells & melanin)2. Angiogenesis and anti-angiogenic response3. Microcirculation physiology and pathology4. Drug response for screening5. Brain functions6. Biomarkers7 Gene activities through reporter genes7. Gene activities through reporter genes
http://oilab.seas.wustl.edu -- 55
© 11/20/2010, LV WANG
Clinical Imaging Applications
1. Melanoma cancer screening2. Gastrointestinal tract and colon endoscopy3. Neonatal brain (fontanel) and adult brain mapping4. Breast cancer detection5. Prostate cancer detection6. Guided sentinel lymph node needle/core biopsy for
cancer stagingcancer staging7. Early response to chemotherapy8. Dosimetry in thermal therapy9. Blood flow, oxygenation, and tissue metabolism
imaging
http://oilab.seas.wustl.edu -- 56
© 11/20/2010, LV WANG
Summary1. Photoacoustic tomography by optical excitation and ultrasonic detection2. Diffusion limit (~1 mm) broken: Super-depths (up to 7 cm) reached3. Single capillaries and single cells resolved in vivo (0.22 micron resolution)4. Multiscale imaging achieved by scaling depth and resolution5. Background-free detection built-in (no absorption, no signal)6. Highest sensitivity to optical absorption (100%) among all modalities7. Either non-fluorescent or fluorescent pigments detected8. Multiple chromophores resolved spectrally9. Functional imaging derived from endogenous chromophores10. Molecular imaging enabled by targeted contrast agents11. Reporter genes imaged12. Doppler imaging of flow demonstrated13. Frame rates of 50 and 249 Hz achieved online and offline14. Speckle artifacts avoided15. Non-ionizing radiation used16. Costs relatively low
http://oilab.seas.wustl.edu -- 57
y17. Contact acoustic detection through gel or liquid18. Cavity and thick bone attenuations to ultrasound
© 11/20/2010, LV WANG
Credits to Lab Members
CURRENT RECENT ALUMNICURRENTAlejandro Garcia-UribeAmos DanielliArie KrumholzBin Huang
Hui FangChul-Hong KimGeng KuM jit P ik
Liang SongLidai WangLiming NiePuxiang Lai
Bin RaoChi ZhangChris FavazzaDa Kang Yao
Manojit PramanikKwanghyun SongEric SteinXueding Wang
Rameez ChatniRobert BerrySong HuWenxin Xing
Dongsu DuGuo LiHaixin KeHonglin Liu
Xueding Wang Minghua XuYuan XuXinmai YangRoger Zemp
Xiao XuXin CaiYan LiuYu Wang
Joon Mo YangJun XiaJunjie YaoKarthik Omanakuttan
Roger ZempHao Zhang
BME Dept
Yuchen YuanYuta SuzukiZhen JiangZhun Xu
Konstantin MaslovLi Li
Washington U
Zijian Guo
http://oilab.seas.wustl.edu -- 58
© 11/20/2010, LV WANG
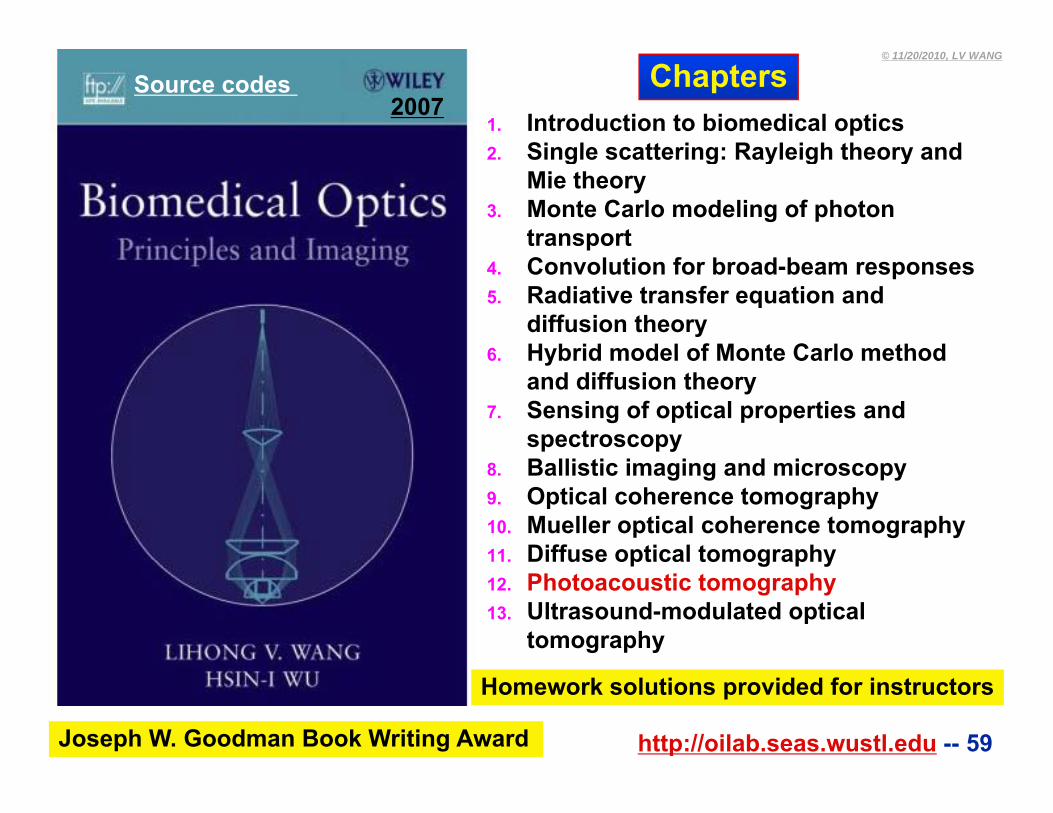
Chapters1. Introduction to biomedical optics2 Single scattering: Rayleigh theory and
2007Source codes
2. Single scattering: Rayleigh theory and Mie theory
3. Monte Carlo modeling of photon transport
4. Convolution for broad-beam responses5. Radiative transfer equation and
diffusion theory6 Hybrid model of Monte Carlo method6. Hybrid model of Monte Carlo method
and diffusion theory7. Sensing of optical properties and
spectroscopy8. Ballistic imaging and microscopy9. Optical coherence tomography10. Mueller optical coherence tomography11. Diffuse optical tomography11. Diffuse optical tomography12. Photoacoustic tomography13. Ultrasound-modulated optical
tomography
http://oilab.seas.wustl.edu -- 59
Homework solutions provided for instructors
Joseph W. Goodman Book Writing Award
© 11/20/2010, LV WANG
• JOB OPENINGS: Postdoctoral Predoctoral
Recorded presentations• Recorded presentations available on our web
• Please visit our web athttp://oilab.seas.wustl.edu
http://oilab.seas.wustl.edu -- 60


![Moct Seminar Report[1]](https://img.pdfslide.us/doc/110x75/577d205f1a28ab4e1e92b07a/moct-seminar-report1.jpg)