Embed Size (px)
Citation preview
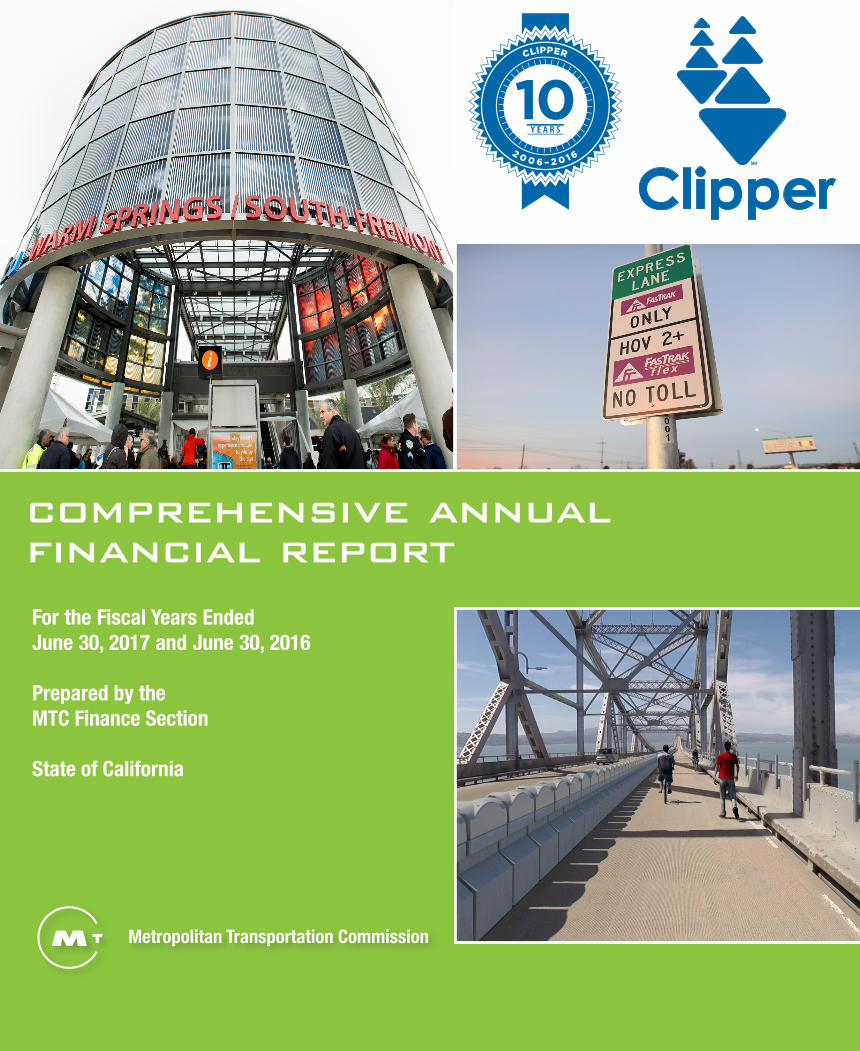
For the Fiscal Years Ended June 30, 2017 and June 30, 2016
Prepared by the MTC Finance Section State of California
comprehensive annual financial report
SM
Clipper
CLIPPER
2 0 0 6 – 2 0 1 6
10
Metropolitan Transportation Commission

Front Cover Credits (Clockwise from upper left):
Opening of Warm Springs BART Station: Noah Berger Clipper 10th anniversary logo Express Lane sign: Noah Berger I-580 Improvement Project: Rendering of bicycle/pedestrian lane on upper deck of Richmond-San Rafael Bridge

)RU�WKH�)LVFDO�<HDUV�(QGHG�-XQH����������DQG�
-XQH���������
comprehensive annual financial report

Metropolitan Transportation CommissionTable of ContentsJune 30, 2017 and 2016
Page
Introductory Section
Letter of Transmittal i-iii
Organizational Chart iv
List of Commissioners and Appointed Officials v
Certificate of Achievement For Excellence in Financial Reporting vi
Financial Section
Report of Independent Auditors 1 - 3
Management's Discussion and Analysis 4 - 17
Basic Financial Statements
Government-wide Financial Statements
Statement of Net Position 18 - 19Statement of Activities 20 - 21
Governmental Fund Financial Statements
Balance Sheet - Governmental Funds, and Reconciliation of the Balance Sheet -Governmental Funds to the Statement of Net Position 22 - 25
Statement of Revenues, Expenditures and Changes in Fund Balances -Governmental Funds 26 - 27
Reconciliation of the Statement of Revenues, Expenditures and Changes in FundBalances - Governmental Funds to the Statement of Activities 28
Proprietary Fund Financial Statements
Statement of Net Position - Proprietary Funds 29 - 30Statement of Revenues, Expenses and Changes in Net Position -
Proprietary Funds 31 - 32Statement of Cash Flows - Proprietary Funds 33 - 36
Fiduciary Fund Financial Statements
Statement of Fiduciary Assets and Liabilities - Agency Funds 37

Metropolitan Transportation CommissionTable of ContentsJune 30, 2017 and 2016
Page
Notes to the Financial Statements
Summary of Significant Accounting Policies 38 - 54 Net Position 55 Cash and Investments 55 - 60 Capital Assets 61 - 64 Long-Term Debt 65 - 74 Leases 75 Interfund Receivables, Payables and Transfers 76 - 78 Employees' Retirement Plan 78 - 84 Post Employment Healthcare Benefits 84 - 87 Commitments and Contingencies 87 - 88 Risk Management 88 Related Party Transactions 88 - 89 Subsequent Events 89
Required Supplementary Information
Schedule of Revenues, Expenditures and Changes in Fund Balances - Budget andActual - General Fund 91
Schedule of Revenues, Expenditures and Changes in Fund Balances - Budget andActual - AB 664 Net Toll Revenue Reserves Fund 92
Schedule of Revenues, Expenditures and Changes in Fund Balances - Budget andActual - State Transit Assistance Fund 93
Schedule of Revenues, Expenditures and Changes in Fund Balances - Budget andActual - Rail Reserves Fund 94
Schedule of Revenues, Expenditures and Changes in Fund Balances - Budget andActual - BART Car Exchange Fund 95
Schedules of Funding Progress 96Schedule of Changes in the Net Pension Liability (unaudited) 97Schedule of Employer Contributions (unaudited) 98
Other Supplementary Information
Combining Balance Sheet - Non-Major Governmental Funds 100Combining Statement of Revenues, Expenditures and Changes in Fund Balances -
Non-Major Governmental Funds 101Schedule of Revenues, Expenditures and Changes in Fund Balances - Budget and
Actual - Transit Reserves Fund 102Schedule of Revenues, Expenditures and Changes in Fund Balances - Budget and
Actual - Exchange Fund 103Schedule of Revenues, Expenditures and Changes in Fund Balances - Budget and
Actual - Feeder Bus Fund 104Schedule of Revenues, Expenditures and Changes in Fund Balances - Budget and
Actual - Prop 1B Fund 105Schedule of Expenditures by Natural Classification 106Schedule of Overhead, Salaries and Benefits Expenditures - Governmental Funds 107Schedule of Expenditures - Federal Highway Administration GrantFY2017 OWPMTC 108
Toll Bridge Rate Schedule 109Schedule of Computations Demonstrating Bond Covenant Compliance - BATA
Proprietary Fund 110 - 111

Metropolitan Transportation CommissionTable of ContentsJune 30, 2017 and 2016
Page
Schedule of Operating Revenues and Expenses - BATA Proprietary Fund - By Bridge 112Combining Statement of Changes in Assets and Liabilities by Participant - Agency
Funds 113 - 115Statement of Cash Collections and Disbursements - Agency Fund/ Clipper® Program 116Schedule of Interest Rate Swaps Summary - BATA Proprietary Fund 117Schedule of Interest Rate Swaps for Series 2001 - BATA Proprietary Fund 118Schedule of Interest Rate Swaps for Series 2006 - BATA Proprietary Fund 119Schedule of Interest Rate Swaps for Series 2007 - BATA Proprietary Fund 120Schedule of SIFMA Rate Swaps for Series 2008 F-1 - BATA Proprietary Fund 121
Statistical Section
Financial Trends
Net Position by Component 123Changes in Net Position 124 - 125Fund Balances of Governmental Funds 126Changes in Fund Balances of Governmental Funds 127
Revenue Capacity
Primary Government Revenues 128Primary Government Expenses by Function 129Toll Revenues - by Bridge 130Paid and Free Vehicles - by Bridge (in Number of Vehicles) 131Average Toll Rate Revenues - by Bridge 132
Debt Capacity
Ratios of General Bonded Debt Outstanding 133Pledged-Revenue Coverage 134
Demographic and Economic Information
Miscellaneous Statistics at June 30, 2017 135Demographic Statistics for Nine San Francisco Bay Area Counties 136Ten Largest Employers 137
Operating Information
Full-Time Equivalent Employees by Function 138Ratio of Retiree Medical Premium to Covered Payroll 139


LY

COMMISSIONERS
Jake Mackenzie, Chair Sonoma County and Cities
Scott Haggerty, Vice Chair Alameda County
Alicia C. Aguirre Cities of San Mateo County
Tom Azumbrado U.S. Department of Housing and Urban Development
Jeannie Bruins Cities of Santa Clara County
Damon Connolly Marin County and Cities
Dave Cortese Santa Clara County
Carol Dutra-Vernaci Cities of Alameda County
Dorene M. Giacopini U.S. Department of Transportation
Federal D. Glover Contra Costa County
Anne W. Halsted SF Bay Conservation and Development Commission
Nick Josefowitz San Francisco Mayor’s Appointee
Jane Kim City and County of San Francisco
Sam Liccardo San Jose Mayor’s Appointee
Alfredo Pedroza Napa County and Cities
Julie Pierce Association of Bay Area Governments
Bijan Sartipi California State Transportation Agency
Libby Schaaf Oakland Mayor’s Appointee
Warren Slocum San Mateo County
James P. Spering Solano County and Cities
Amy R. Worth Cities of Contra Costa County
APPOINTED OFFICIALS
Steve Heminger Executive Director
Adrienne Weil Legal Counsel
Y

YL

PricewaterhouseCoopers LLP, Three Embarcadero Center, San Francisco, CA 94111-4004T: (415) 498 5000, F: (415) 498 7100, www.pwc.com/us
Report of Independent Auditors
To the Commissioners of the Metropolitan Transportation Commission:
We have audited the accompanying financial statements of the governmental activities, the business-type activities, the discretely presented component unit, each major fund, the aggregate remaining fund information and the fiduciary funds of the Metropolitan Transportation Commission (the “Commission”) as of and for the years ended June 30, 2017 and 2016 and the related notes to the financial statements, which collectively comprise the Commission’s basic financial statements as listed in the table of contents.
Management’s Responsibility for the Financial Statements
Management is responsible for the preparation and fair presentation of the financial statements in accordance with accounting principles generally accepted in the United States of America; this includes the design, implementation, and maintenance of internal control relevant to the preparation and fair presentation of financial statements that are free from material misstatement, whether due to fraud or error.
Auditors’ Responsibility
Our responsibility is to express opinions on the financial statements based on our audits. We conducted our audits in accordance with auditing standards generally accepted in the United States of America. Those standards require that we plan and perform the audit to obtain reasonable assurance about whether the financial statements are free from material misstatement.
An audit involves performing procedures to obtain audit evidence about the amounts and disclosures in the financial statements. The procedures selected depend on our judgment, including the assessment of the risks of material misstatement of the financial statements, whether due to fraud or error. In making those risk assessments, we consider internal control relevant to the Commission’s preparation and fair presentation of the financial statements in order to design audit procedures that are appropriate in the circumstances, but not for the purpose of expressing an opinion on the effectiveness of the Commission’s internal control. Accordingly, we express no such opinion. An audit also includes evaluating the appropriateness of accounting policies used and the reasonableness of significant accounting estimates made by management, as well as evaluating the overall presentation of the financial statements. We believe that the audit evidence we have obtained is sufficient and appropriate to provide a basis for our audit opinions.
2
Opinions
In our opinion, the financial statements referred to above present fairly, in all material respects, the respective financial position of the governmental activities, the business-type activities, the discretely presented component unit, each major fund, the aggregate remaining fund information and the fiduciary funds of the Metropolitan Transportation Commission at June 30, 2017 and 2016 and, where applicable,the respective changes in financial position and cash flows thereof for the years then ended in accordance with accounting principles generally accepted in the United States of America.
Other Matters
Required Supplementary Information
The accompanying management’s discussion and analysis (“MD&A”) on pages 4 through 17 and other required supplementary information (“RSI”) on pages 90 through 98 are required by accounting principles generally accepted in the United States of America to supplement the basic financial statements. Suchinformation, although not a part of the basic financial statements, is required by the Governmental Accounting Standards Board who considers it to be an essential part of financial reporting for placing the basic financial statements in an appropriate operational, economic, or historical context. We have applied certain limited procedures to the required supplementary information in accordance with auditing standards generally accepted in the United States of America, which consisted of inquiries of management about the methods of preparing the information and comparing the information for consistency with management's responses to our inquiries, the basic financial statements, and other knowledge we obtained during our audits of the basic financial statements. We do not express an opinion or provide any assurance on the information because the limited procedures do not provide us with sufficient evidence to express an opinion or provide any assurance.
Other Supplementary Information
Our audits were conducted for the purpose of forming opinions on the financial statements that collectively comprise the Commission’s basic financial statements. The supplementary schedules identified in the table of contents under Other Supplementary Information and appearing on pages 99 through 121 are presented for purposes of additional analysis and are not a required part of the basic financial statements. The information is the responsibility of management and was derived from and relates directly to the underlying accounting and other records used to prepare the basic financial statements. The information has been subjected to the auditing procedures applied in the audit of the basic financial statements and certain additional procedures, including comparing and reconciling such information directly to the underlying accounting and other records used to prepare the basic financial statements or to the basic financial statements themselves and other additional procedures, in accordance with auditing standards generally accepted in the United States of America. In our opinion, these supplementary schedules are fairly stated, in all material respects, in relation to the basic financial statements taken as a whole.

3
Statistical Section
Our audits were conducted for the purpose of forming opinions on the financial statements that collectively comprise the Commission’s basic financial statements. The charts, schedules and other information identified in the table of contents under the Statistical Section and appearing on pages 122 through 139are presented for purposes of additional analysis and are not a required part of the basic financial statements. Such information has not been subjected to the auditing procedures applied in the audits of the basic financial statements, and accordingly, we do not express an opinion or provide any assurance on it.
San Francisco, CaliforniaOctober 25, 2017
Metropolitan Transportation CommissionFinancial Statements for the years ended June 30, 2017 and 2016Management's Discussion and Analysis (unaudited - $ in thousands)
Management's Discussion and Analysis
This section presents an overview of the financial activities of the Metropolitan Transportation Commission(MTC), as well as its blended and discretely presented component units as discussed separately below for theyears ended June 30, 2017 and 2016. Except as otherwise stated, all amounts described below are expressed inthousands of dollars.
A. Financial Highlights
Fiscal year 2017 was another busy and productive year for MTC and for the nine-county region. Sales tax andtoll revenue continued to increase as the economy showed signs of improvement from the previous year. Thefollowing are some of the highlights from fiscal year 2017:
Sales tax revenue in the region has increased for seven straight years, increasing by 48.3% since fiscal year
2010.
In May 2017, MTC and the Association of Bay Area Government (ABAG) signed a Contract for Services,
whereas effective July 1, 2017, ABAG's legacy employees became MTC's employees, and all previous
ABAG operations are now run by MTC under the contract.
In June 2017, both Bay Area Air Quality Management District (BAAQMD) and ABAG exercised their lease
purchase options to buy a condominium interest in the Bay Area Metro Center (BAMC) office spaces at 375
Beale Street, San Francisco.
Clipper®, the region's smart card program for public transit, hit a 10-year milestone in November 2016 with
1.79 million active cards in use.
Bay Area Rapid Transit's (BART) extension from Fremont to the new Warm Spring/ South Fremont station
opened for passenger rail service in March 2017.
The construction of MTC's first Express Lane project on I-680 Southbound between Walnut Creek and San
Ramon was completed in March 2017. The Express Lane System is currently undergoing testing and the
lane is scheduled to open in late 2017.
MTC and its operating units continue to provide regional resources for seismic and transportation projects. AllMTC operating units, MTC, BATA and MTC Service Authority for Freeways and Expressways (MTC SAFE)adopted FY 2016-2017 balanced budgets.
B. Overview of the Financial Statements
The government-wide financial statements provide an overview of MTC, as well as its blended and discretelypresented component units. The government-wide financial statements comprise a Statement of Net Position, aStatement of Activities and accompanying notes. The Statement of Net Position presents financial informationon the government-wide net position of MTC at the end of the 2017 and 2016 fiscal years. The differencebetween the assets plus deferred outflows and liabilities plus deferred inflows is reported as “Net Position.”
4

Metropolitan Transportation CommissionFinancial Statements for the years ended June 30, 2017 and 2016Management's Discussion and Analysis (unaudited - $ in thousands)
The Statement of Activities presents government-wide information showing the change in net position resultingfrom revenues earned and expenses incurred during the 2017 and 2016 fiscal years. All changes in net positionare recorded as revenues are earned and expenses are incurred, regardless of the timing of related cash flows.
MTC is composed of governmental and business-type funds and activities as well as two discretely presentedcomponent units. The governmental funds are comprised of the general fund, the special revenue funds and thecapital project funds. The business or proprietary funds are MTC Clipper®, BATA, MTC SAFE, the Bay AreaInfrastructure Authority (BAIFA), and the Bay Area Headquarters Authority (BAHA).
MTC Clipper® is an enterprise fund that oversees the region's smartcard program. BATA and MTC SAFE areblended component units (legally separate) whose transactions are presented as business-type funds. BAIFAand BAHA are discretely presented component units on the government-wide financial statements. There is noactivity for BAIFA in both fiscal years 2017 and 2016, nor assets, liabilities, nor net position at either June 30,2017 or 2016. MTC also holds and administers three fiduciary funds further described in Section C below andin Note 1.B to the financial statements.
The government-wide Statement of Net Position and Statement of Activities are presented on pages 18 - 21 ofthis report with the accompanying notes being presented on pages 38 - 89.
C. Overview of the Fund Financial Statements
i.) Governmental Funds
Governmental funds are used to account for MTC activities and are supported primarily by grants, sales taxes,and intergovernmental revenue sources. Governmental funds financial statements provide additionalinformation not provided in the government-wide statements in that they focus on the annual inflows andoutflows of resources as well as on the balance of resources available to be spent at fiscal year-end rather thanthe longer term focus of governmental activities as seen in the government-wide financial statements. Thegovernmental fund Balance Sheet and the governmental fund Statement of Revenues, Expenditures andChanges in Fund Balance provide a reconciliation to facilitate this comparison of governmental funds togovernmental activities.
MTC’s governmental funds include a general fund, four major special revenue funds and other non-majorfunds. The financial statements of the governmental funds, prepared under the modified accrual basis ofaccounting are on pages 22 - 28 of this report. A schedule detailing the non-major special revenue funds isincluded on pages 100 - 101 of this report.
MTC adopts annual budgets for all funds. However, a comparison of budget-to-actual is required only forcertain governmental funds (major funds) and these are presented on pages 91 - 95 of this report. A comparisonof budget to actual is also presented for non-major funds on pages 102 - 105.
5
Metropolitan Transportation CommissionFinancial Statements for the years ended June 30, 2017 and 2016Management's Discussion and Analysis (unaudited - $ in thousands)
ii.) Proprietary Funds
Proprietary funds are used to report business-type activities. MTC has three proprietary funds: MTC Clipper®,BATA and MTC SAFE. BATA and MTC SAFE are presented as blended component units of MTC asproprietary funds on the government-wide and fund financial statements. MTC administers the Clipper®
program, which handles the implementation and ongoing operations of the Bay Area smart card. This systemallows transit riders to pay fares throughout the Bay Area utilizing a single "smart" fare card when boardingbus, light rail, train or ferry transportation. BATA is responsible for collection and administration of all tollfunds and has funding oversight responsibility for Caltrans maintenance activities for the seven state-ownedbridges in the San Francisco Bay Area. BATA also has funding and administrative oversight responsibilitiesfor the Regional Measure 1 (RM 1) and Regional Measure 2 (RM 2) programs approved by the voters in 1988and 2004, respectively as well as the $8.8 billion seismic retrofit program. MTC SAFE administers a freewaymotorist aid system providing tow truck and call box services to stranded motorists in the nine Bay Areacounties.
The financial statements of the proprietary funds are prepared on an accrual basis and are on pages 29 - 36.
iii.) Fiduciary Funds
Fiduciary funds are used to account for resources held in a trust or agent capacity for the benefit of partiesoutside MTC. These funds are not reflected in the government-wide financial statements, as the resourcescannot be used to support the programs of MTC or those of its component units. The fiduciary funds of MTCuse the economic resources measurement focus and the accrual basis of accounting.
MTC has three fiduciary funds: Transportation Development Act (TDA), BART Half-Cent Sales Tax (AB1107), and the Clipper® funds. Revenue for the first two of these funds is derived from sales tax revenues. Therevenue for the TDA fund is deposited in MTC’s name as fiduciary with the respective treasurer in each of thenine counties in the region. Revenue for the AB 1107 fund is deposited with the State of California. MTC hasadministrative oversight for the allocation of these funds. The Clipper® fiduciary fund, used for the Clipper®
smart card program, tracks the cash balances and receivables held on behalf of the Clipper® program, as well asthe patron liability for the prepaid card balance.
The fiduciary funds financial statements are presented on page 37 of this report.
iv.) Discretely Presented Component Unit
The Bay Area Headquarters Authority (BAHA) was established in September 2011 as a separate public entitypursuant to the California Joint Exercise of Powers Act, to plan, acquire, and develop the new MTC/BATAoffice space and facilities and undertake related activities on behalf of MTC and BATA.
BAHA is presented as a proprietary fund in the discretely presented component unit column of the government-wide financial statements because BAHA does not meet the criteria for blending under the provisions ofGovernmental Accounting Standards Board (GASB) Statement No. 61.
6

Metropolitan Transportation CommissionFinancial Statements for the years ended June 30, 2017 and 2016Management's Discussion and Analysis (unaudited - $ in thousands)
D. Notes to the Financial Statements
The notes to the financial statements provide additional information that is essential to a full understanding ofthe data provided in the government-wide and fund financial statements.
E. Government-Wide Financial Analysis
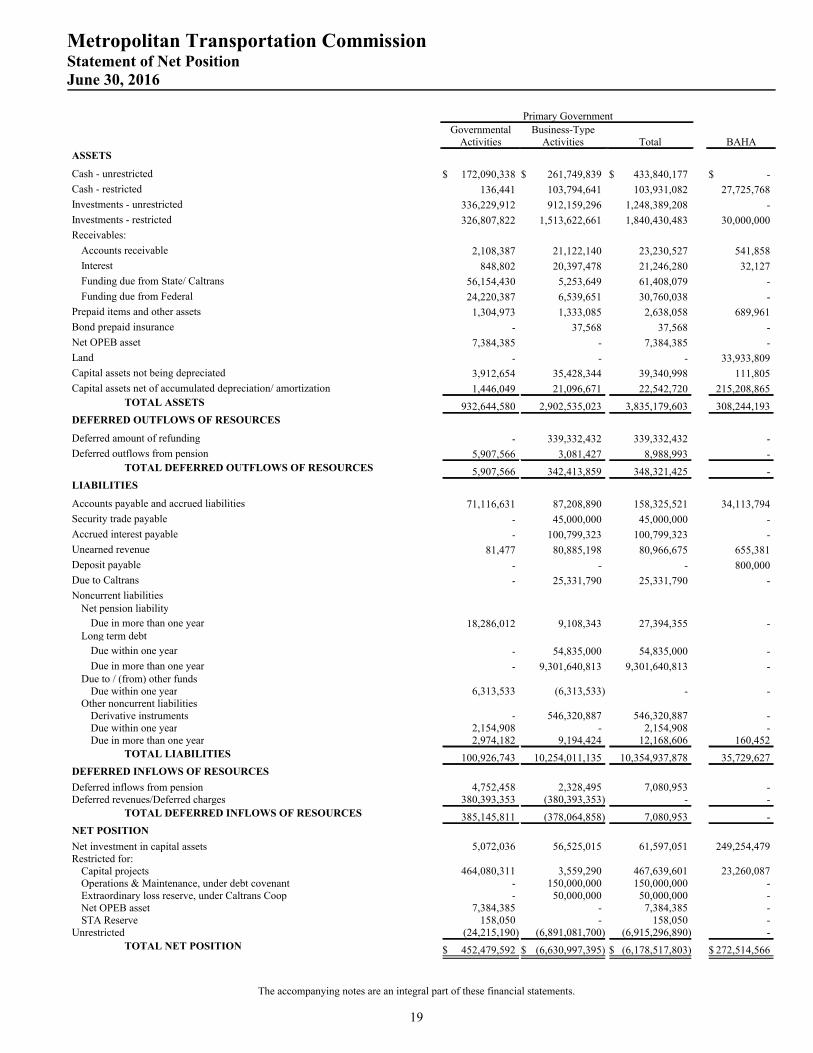
Total government-wide liabilities and deferred inflows of resources exceeded total assets and deferred outflowsof resources for fiscal year 2017 by $6,192,472 and for fiscal year 2016 by $6,178,517 as illustrated in thefollowing table. This represents decreases in net position for fiscal year 2017 of $13,955 and $237,369 forfiscal year 2016. The cause of the net position deficit for both years is mainly from the impact of BATAfinancing of the bridges' toll projects while Caltrans and the State of California own title to the bridges. Assuch, the asset value of the bridges is recorded at the State of California and not on BATA's books. In fiscalyear 2016, the implementation of GASB Statement No. 72, Fair Value Measurement and Application, resultedin a decrease in the government-wide, business-type activities beginning net position by $57,193. Refer to Note5 to the financial statements for further information.
7
Metropolitan Transportation CommissionFinancial Statements for the years ended June 30, 2017 and 2016Management's Discussion and Analysis (unaudited - $ in thousands)
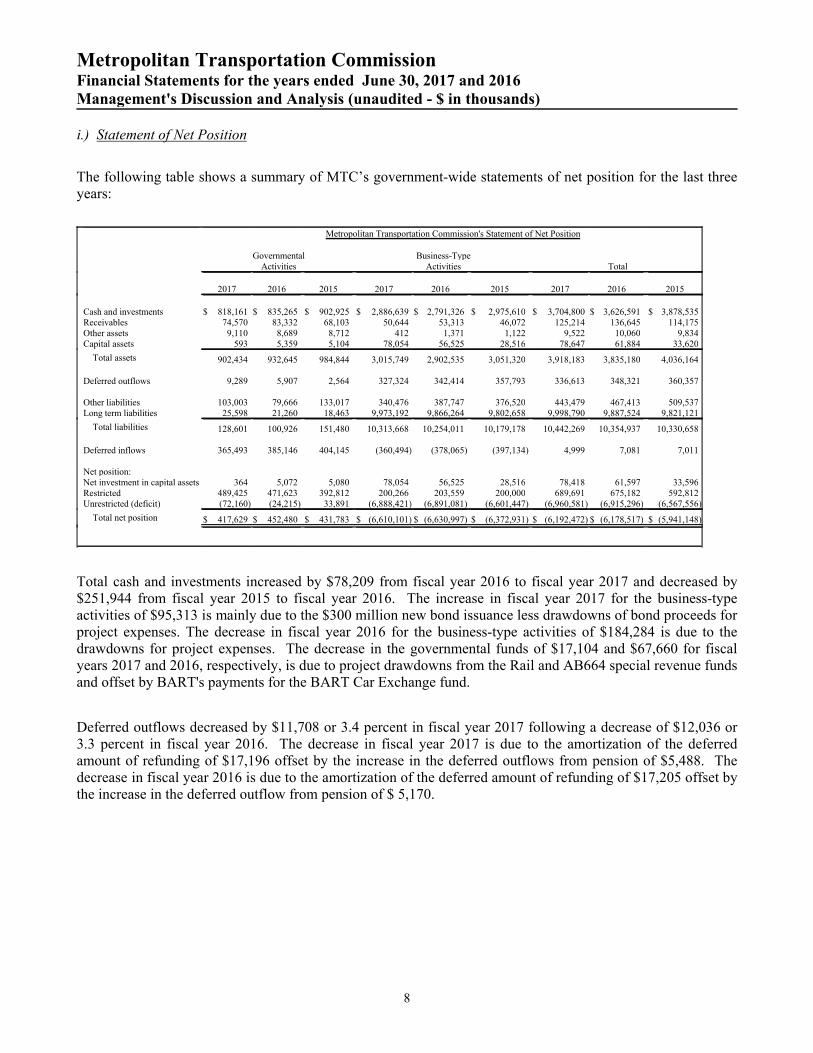
i.) Statement of Net Position
The following table shows a summary of MTC’s government-wide statements of net position for the last threeyears:
Metropolitan Transportation Commission's Statement of Net Position
GovernmentalActivities
Business-TypeActivities Total
2017 2016 2015 2017 2016 2015 2017 2016 2015
Cash and investments $ 818,161 $ 835,265 $ 902,925 $ 2,886,639 $ 2,791,326 $ 2,975,610 $ 3,704,800 $ 3,626,591 $ 3,878,535Receivables 74,570 83,332 68,103 50,644 53,313 46,072 125,214 136,645 114,175Other assets 9,110 8,689 8,712 412 1,371 1,122 9,522 10,060 9,834Capital assets 593 5,359 5,104 78,054 56,525 28,516 78,647 61,884 33,620
Total assets 902,434 932,645 984,844 3,015,749 2,902,535 3,051,320 3,918,183 3,835,180 4,036,164
Deferred outflows 9,289 5,907 2,564 327,324 342,414 357,793 336,613 348,321 360,357
Other liabilities 103,003 79,666 133,017 340,476 387,747 376,520 443,479 467,413 509,537Long term liabilities 25,598 21,260 18,463 9,973,192 9,866,264 9,802,658 9,998,790 9,887,524 9,821,121
Total liabilities 128,601 100,926 151,480 10,313,668 10,254,011 10,179,178 10,442,269 10,354,937 10,330,658
Deferred inflows 365,493 385,146 404,145 (360,494) (378,065) (397,134) 4,999 7,081 7,011
Net position:Net investment in capital assets 364 5,072 5,080 78,054 56,525 28,516 78,418 61,597 33,596Restricted 489,425 471,623 392,812 200,266 203,559 200,000 689,691 675,182 592,812Unrestricted (deficit) (72,160) (24,215) 33,891 (6,888,421) (6,891,081) (6,601,447) (6,960,581) (6,915,296) (6,567,556)
Total net position $ 417,629 $ 452,480 $ 431,783 $ (6,610,101) $ (6,630,997) $ (6,372,931) $ (6,192,472) $ (6,178,517) $ (5,941,148)
Total cash and investments increased by $78,209 from fiscal year 2016 to fiscal year 2017 and decreased by$251,944 from fiscal year 2015 to fiscal year 2016. The increase in fiscal year 2017 for the business-typeactivities of $95,313 is mainly due to the $300 million new bond issuance less drawdowns of bond proceeds forproject expenses. The decrease in fiscal year 2016 for the business-type activities of $184,284 is due to thedrawdowns for project expenses. The decrease in the governmental funds of $17,104 and $67,660 for fiscalyears 2017 and 2016, respectively, is due to project drawdowns from the Rail and AB664 special revenue fundsand offset by BART's payments for the BART Car Exchange fund.
Deferred outflows decreased by $11,708 or 3.4 percent in fiscal year 2017 following a decrease of $12,036 or3.3 percent in fiscal year 2016. The decrease in fiscal year 2017 is due to the amortization of the deferredamount of refunding of $17,196 offset by the increase in the deferred outflows from pension of $5,488. Thedecrease in fiscal year 2016 is due to the amortization of the deferred amount of refunding of $17,205 offset bythe increase in the deferred outflow from pension of $ 5,170.
8

Metropolitan Transportation CommissionFinancial Statements for the years ended June 30, 2017 and 2016Management's Discussion and Analysis (unaudited - $ in thousands)
Long-term liabilities increased by $111,266 or 1.1 percent in fiscal year 2017 after an increase of $66,403 or0.7 percent in fiscal year 2016. The increase in fiscal year 2017 is due to the increase in the long-term bondpayable of $260,238 (new bonds issuance) and pension liability of $6,885 offset by a decrease in the valuationof derivative instruments liability of $155,539 and patron deposits of $370. The increase in fiscal year 2016 isdue to an increase in the valuation of derivative instruments liability of $130,193, pension liability of $3,544,compensated absences of $522 and patron deposits of $1,800 offset by the decrease in long-term bonds payableof $69,656.
Other liabilities decreased by $23,934 and $42,124 in fiscal years 2017 and 2016 respectively. Both fiscal yearshad a timing difference in securities payable, that is the timing between the purchase and settlement of asecurity that crosses over year end. The remaining difference for both years was mainly an increase in accountspayable and decrease in accounts payable for both fiscal 2017 and 2016 years, respectively.
The total net position decreased by $13,955 or 0.2 percent in fiscal year 2017 following a decrease of $237,369or 4.0 percent in fiscal year 2016. The net position of the business-type activities increased by $20,896 in fiscalyear 2017 mainly due to the $300,000 new bonds issuance offset by the drawdowns of bond proceeds forproject expenses and the decrease in fiscal year 2016 by $258,066 is mainly due to the drawdowns of fundsrelated to the Seismic Retrofit, Regional Measure 2 (RM 2) and rehabilitation capital programs. BATA is thefinancing arm for the RM 2, Seismic Retrofit and rehabilitation programs. The bond proceeds from BATA'sdebt obligations are used to reimburse Caltrans for capital construction costs on the seven state-owned tollbridges. Since the bridges are not capitalized under BATA and title remains with Caltrans, the combination ofdistributions to Caltrans and increased debt to pay for project expenditures creates a negative asset, or deficit.The deficit will be eliminated by future toll revenues as projects are completed and debt service payments retirethe outstanding bonds. The net position of governmental activities decreased by $34,851 in 2017 is mainly dueto the reduction of STA receivables as only the fourth quarter payment is due from the State at the end of thefiscal year. The increase in the net position in fiscal year 2016 of $20,697 is mainly due to an increase in STAreceivables as both the third and fourth quarter were due at the end of the fiscal year.
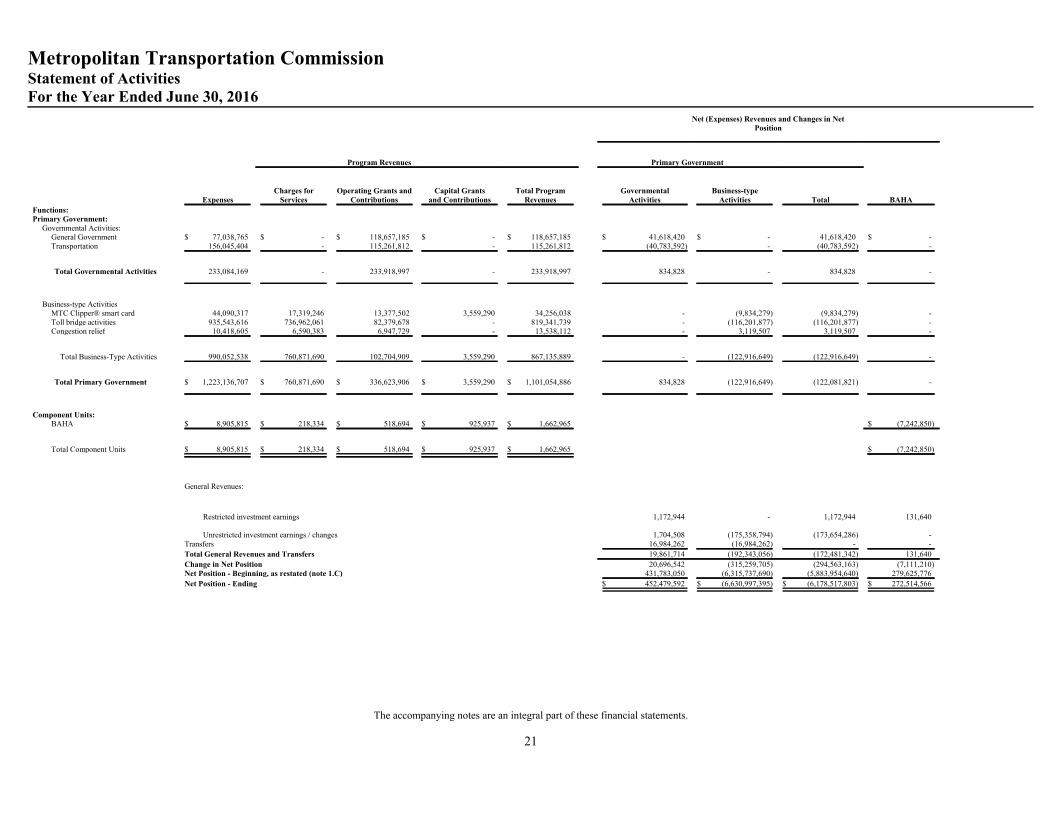
ii.) Statement of Activities
The net position for governmental activities decreased in fiscal year 2017 and increased in fiscal year 2016, andthe net position for business-type activities increased in fiscal year 2017 and decreased in fiscal year 2016. Thedecrease in net position in governmental activities in 2017 is due to an increase in allocation to other agenciesexpenses offset by the gain on sale of capital assets and an increase in operating grants from local agencies.The increase in net position for governmental activities in 2016 is due to the decrease in expenditures resultingfrom a decrease in STA Allocations, a decrease in rail expenditures and additional payments from BART forthe BART Car Replacement project.
9
Metropolitan Transportation CommissionFinancial Statements for the years ended June 30, 2017 and 2016Management's Discussion and Analysis (unaudited - $ in thousands)
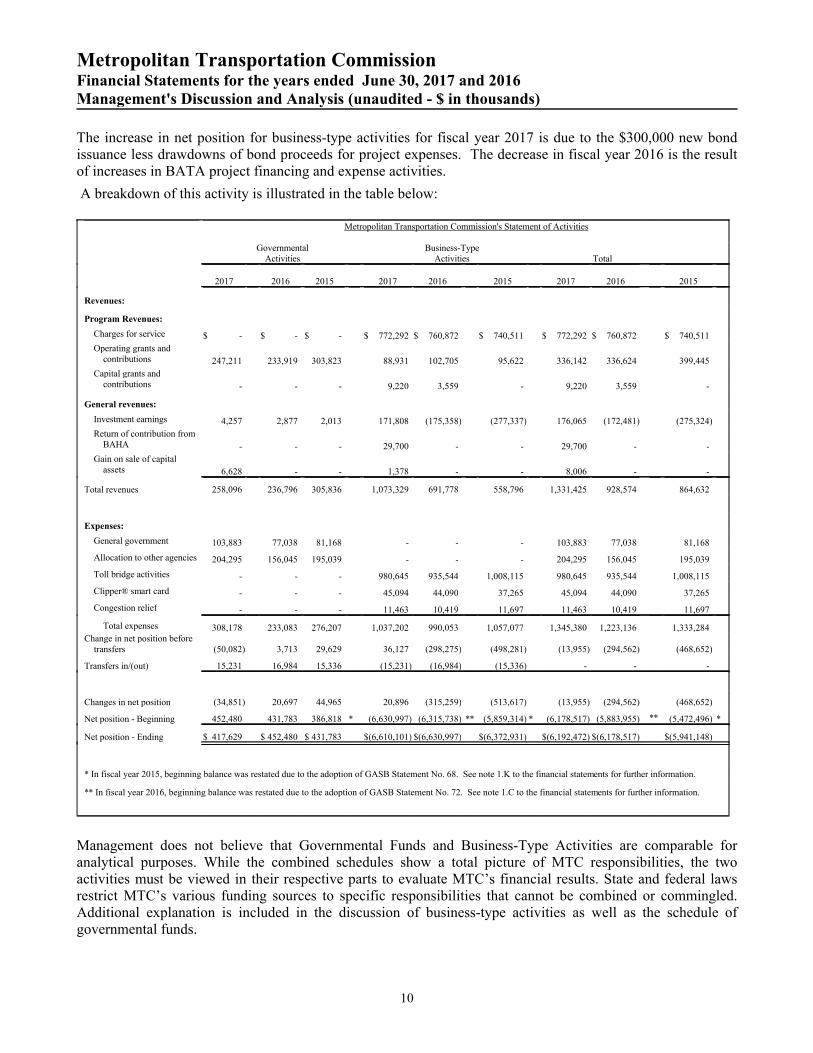
The increase in net position for business-type activities for fiscal year 2017 is due to the $300,000 new bondissuance less drawdowns of bond proceeds for project expenses. The decrease in fiscal year 2016 is the resultof increases in BATA project financing and expense activities.
A breakdown of this activity is illustrated in the table below:
Metropolitan Transportation Commission's Statement of Activities
GovernmentalActivities
Business-TypeActivities Total
2017 2016 2015 2017 2016 2015 2017 2016 2015
Revenues:
Program Revenues:
Charges for service $ - $ - $ - $ 772,292 $ 760,872 $ 740,511 $ 772,292 $ 760,872 $ 740,511
Operating grants andcontributions 247,211 233,919 303,823 88,931 102,705 95,622 336,142 336,624 399,445
Capital grants andcontributions - - - 9,220 3,559 - 9,220 3,559 -
General revenues:
Investment earnings 4,257 2,877 2,013 171,808 (175,358) (277,337) 176,065 (172,481) (275,324)
Return of contribution fromBAHA - - - 29,700 - - 29,700 - -
Gain on sale of capitalassets 6,628 - - 1,378 - - 8,006 - -
Total revenues 258,096 236,796 305,836 1,073,329 691,778 558,796 1,331,425 928,574 864,632
Expenses:
General government 103,883 77,038 81,168 - - - 103,883 77,038 81,168
Allocation to other agencies 204,295 156,045 195,039 - - - 204,295 156,045 195,039
Toll bridge activities - - - 980,645 935,544 1,008,115 980,645 935,544 1,008,115
Clipper® smart card - - - 45,094 44,090 37,265 45,094 44,090 37,265
Congestion relief - - - 11,463 10,419 11,697 11,463 10,419 11,697
Total expenses 308,178 233,083 276,207 1,037,202 990,053 1,057,077 1,345,380 1,223,136 1,333,284Change in net position before
transfers (50,082) 3,713 29,629 36,127 (298,275) (498,281) (13,955) (294,562) (468,652)
Transfers in/(out) 15,231 16,984 15,336 (15,231) (16,984) (15,336) - - -
Changes in net position (34,851) 20,697 44,965 20,896 (315,259) (513,617) (13,955) (294,562) (468,652)
Net position - Beginning 452,480 431,783 386,818 * (6,630,997) (6,315,738) ** (5,859,314) * (6,178,517) (5,883,955) ** (5,472,496) *
Net position - Ending $ 417,629 $ 452,480 $ 431,783 $(6,610,101) $(6,630,997) $(6,372,931) $(6,192,472) $(6,178,517) $(5,941,148)
* In fiscal year 2015, beginning balance was restated due to the adoption of GASB Statement No. 68. See note 1.K to the financial statements for further information.
** In fiscal year 2016, beginning balance was restated due to the adoption of GASB Statement No. 72. See note 1.C to the financial statements for further information.
Management does not believe that Governmental Funds and Business-Type Activities are comparable foranalytical purposes. While the combined schedules show a total picture of MTC responsibilities, the twoactivities must be viewed in their respective parts to evaluate MTC’s financial results. State and federal lawsrestrict MTC’s various funding sources to specific responsibilities that cannot be combined or commingled.Additional explanation is included in the discussion of business-type activities as well as the schedule ofgovernmental funds.
10
Metropolitan Transportation CommissionFinancial Statements for the years ended June 30, 2017 and 2016Management's Discussion and Analysis (unaudited - $ in thousands)
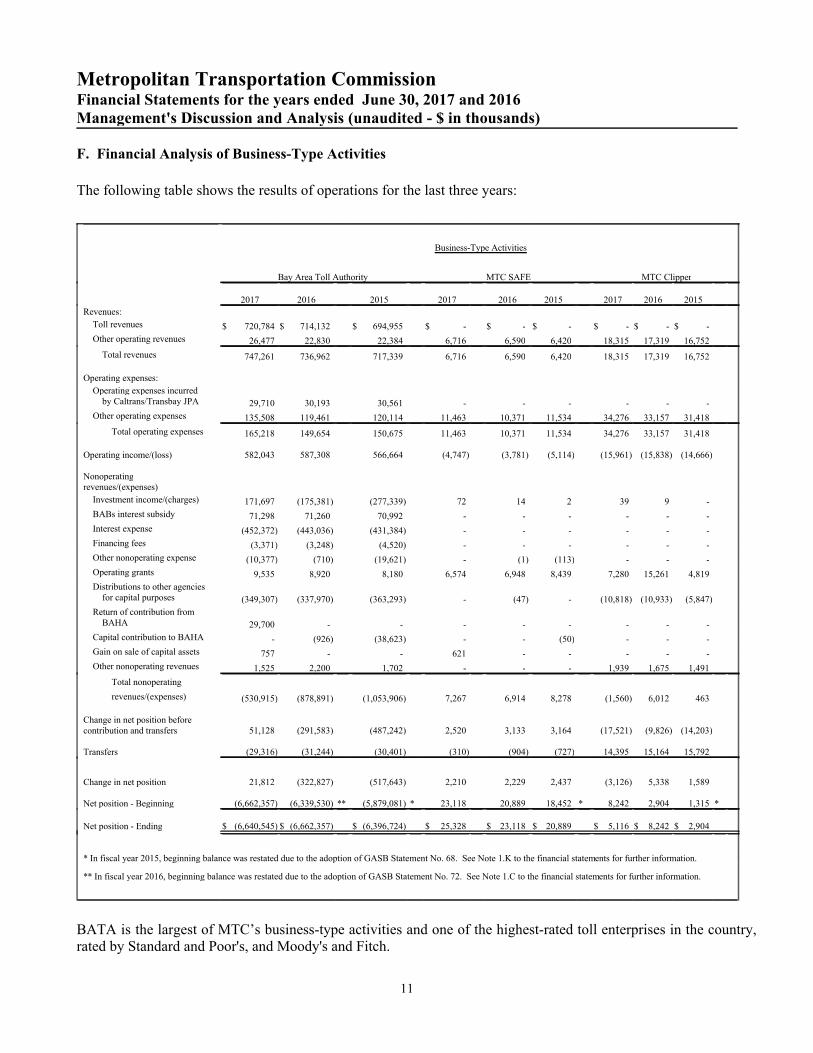
F. Financial Analysis of Business-Type Activities
The following table shows the results of operations for the last three years:
Business-Type Activities
Bay Area Toll Authority MTC SAFE MTC Clipper
2017 2016 2015 2017 2016 2015 2017 2016 2015
Revenues:
Toll revenues $ 720,784 $ 714,132 $ 694,955 $ - $ - $ - $ - $ - $ -
Other operating revenues 26,477 22,830 22,384 6,716 6,590 6,420 18,315 17,319 16,752
Total revenues 747,261 736,962 717,339 6,716 6,590 6,420 18,315 17,319 16,752
Operating expenses:
Operating expenses incurredby Caltrans/Transbay JPA 29,710 30,193 30,561 - - - - - -
Other operating expenses 135,508 119,461 120,114 11,463 10,371 11,534 34,276 33,157 31,418
Total operating expenses 165,218 149,654 150,675 11,463 10,371 11,534 34,276 33,157 31,418
Operating income/(loss) 582,043 587,308 566,664 (4,747) (3,781) (5,114) (15,961) (15,838) (14,666)
Nonoperatingrevenues/(expenses)
Investment income/(charges) 171,697 (175,381) (277,339) 72 14 2 39 9 -
BABs interest subsidy 71,298 71,260 70,992 - - - - - -
Interest expense (452,372) (443,036) (431,384) - - - - - -
Financing fees (3,371) (3,248) (4,520) - - - - - -
Other nonoperating expense (10,377) (710) (19,621) - (1) (113) - - -
Operating grants 9,535 8,920 8,180 6,574 6,948 8,439 7,280 15,261 4,819
Distributions to other agenciesfor capital purposes (349,307) (337,970) (363,293) - (47) - (10,818) (10,933) (5,847)
Return of contribution fromBAHA 29,700 - - - - - - - -
Capital contribution to BAHA - (926) (38,623) - - (50) - - -
Gain on sale of capital assets 757 - - 621 - - - - -
Other nonoperating revenues 1,525 2,200 1,702 - - - 1,939 1,675 1,491
Total nonoperating
revenues/(expenses) (530,915) (878,891) (1,053,906) 7,267 6,914 8,278 (1,560) 6,012 463
Change in net position beforecontribution and transfers 51,128 (291,583) (487,242) 2,520 3,133 3,164 (17,521) (9,826) (14,203)
Transfers (29,316) (31,244) (30,401) (310) (904) (727) 14,395 15,164 15,792
Change in net position 21,812 (322,827) (517,643) 2,210 2,229 2,437 (3,126) 5,338 1,589
Net position - Beginning (6,662,357) (6,339,530) ** (5,879,081) * 23,118 20,889 18,452 * 8,242 2,904 1,315 *
Net position - Ending $ (6,640,545) $ (6,662,357) $ (6,396,724) $ 25,328 $ 23,118 $ 20,889 $ 5,116 $ 8,242 $ 2,904
* In fiscal year 2015, beginning balance was restated due to the adoption of GASB Statement No. 68. See Note 1.K to the financial statements for further information.
** In fiscal year 2016, beginning balance was restated due to the adoption of GASB Statement No. 72. See Note 1.C to the financial statements for further information.
BATA is the largest of MTC’s business-type activities and one of the highest-rated toll enterprises in the country,rated by Standard and Poor's, and Moody's and Fitch.
11

Metropolitan Transportation CommissionFinancial Statements for the years ended June 30, 2017 and 2016Management's Discussion and Analysis (unaudited - $ in thousands)
BATA’s toll revenue increased by $6,652 or 0.9 percent and $19,177 or 2.8 percent in fiscal years 2017 and 2016respectively. The total number of paid toll vehicles for all bridges increased by 1.2 percent in fiscal year 2017 and3.1 percent in fiscal year 2016. Paid traffic increased on all bridges except for San Francisco Oakland Bay Bridge,which had a decrease of 0.13 percent. The revenues increased for both fiscal years mainly as a result of increasedpaid traffic from two-axle vehicles of 0.82 percent and 2.7 percent and the vehicles that used the carpool lanes of6.6 percent and 10.9 percent for fiscal years 2017 and 2016, respectively. Detailed traffic count is available in theStatistical Section, Table 8.
BATA’s other operating revenues, consisting primarily of toll violation payments, increased by $3,647 in fiscalyear 2017 compared to an increase of $446 in fiscal year 2016. The violation revenues increase for fiscal year 2017was due to increased traffic and a new and more efficient toll collection system.
BATA’s total operating expenses rose by $15,564 or 10.4 percent in fiscal year 2017 and fell by $1,021 or 0.7percent for fiscal year 2016. The increase in fiscal year 2017 includes reimbursements for project costs to otheragencies of $7,787, increases in purchase of toll tags for the express lanes and the bridges and additional demandof $3,979, and $1,384 for assessments for the new building.
BATA’s net investment income increased by $347,078 in fiscal year 2017, and net investment charges decreasedby $101,958 in fiscal year 2016. In fiscal year 2017, net investment income was comprised of $16,159 ofinvestment earnings and $155,539 of unrealized gain on derivative instruments. In fiscal year 2016, net investmentcharges were comprised of $12,005 of investment income and $187,387 of unrealized loss on derivativeinstruments. The $155,539 gain and $187,387 loss on derivative instruments in fiscal years 2017 and 2016respectively, represents a change in the market valuation of certain interest rate swaps that do not qualify for hedgeaccounting. The investment income increased in fiscal year 2017 from fiscal year 2016 mainly due to slightlyhigher interest rates.
BATA's Build America Bonds interest subsidy is the federal subsidy from the U. S. Government. The increase of$38 in fiscal year 2017 is due to a lower subsidy rate reduction compared to fiscal year 2016. As a result of thefederal budget sequestration, the subsidy payments were reduced by 6.8% for the first quarter and 6.9% for the lastthree quarters in fiscal year 2017 compared to a reduction of 7.3% in the first quarter and 6.8% for the last threequarters in fiscal year 2016.
BATA’s interest expense increased by $9,336 and by $11,652 in both fiscal year 2017 and 2016 respectively. Theincrease in fiscal year 2017 is due to higher bond and swap interest payments of $12,535, bond premiumamortization of $518, offset by higher interest payments received from counterparty of $3,712 and deferred amountof refunding amortization of $5. The increase in fiscal year 2016 is mainly due to the interest payments from thefour cancellable fixed-receiver interest rate swaps being temporarily suspended through April 1, 2018. See Note 5to the financial statements for more information.
BATA’s financing fees and other nonoperating expenses increased by $9,790 in fiscal year 2017 and decreased by$20,183 in fiscal year 2016. The increase in fiscal year 2017 is primarily due to the cost of issuance of the newbonds. The decrease in fiscal year 2016 is because BATA did not issue or refinance any bonds during the year.The financing fees in fiscal year 2016 were for remarketing fees, trustees' fees, and rating agency fees related toinvestments.
12
Metropolitan Transportation CommissionFinancial Statements for the years ended June 30, 2017 and 2016Management's Discussion and Analysis (unaudited - $ in thousands)
BATA's operating grants increased by $615 in fiscal year 2017 and $740 in fiscal year 2016, respectively. Theincrease in both fiscal years is due to the increase in the revenue from Alameda County TransportationCommission from the reimbursement of maintenance fees, monthly direct fees, banking fees, and transactioncosts for their express lanes.
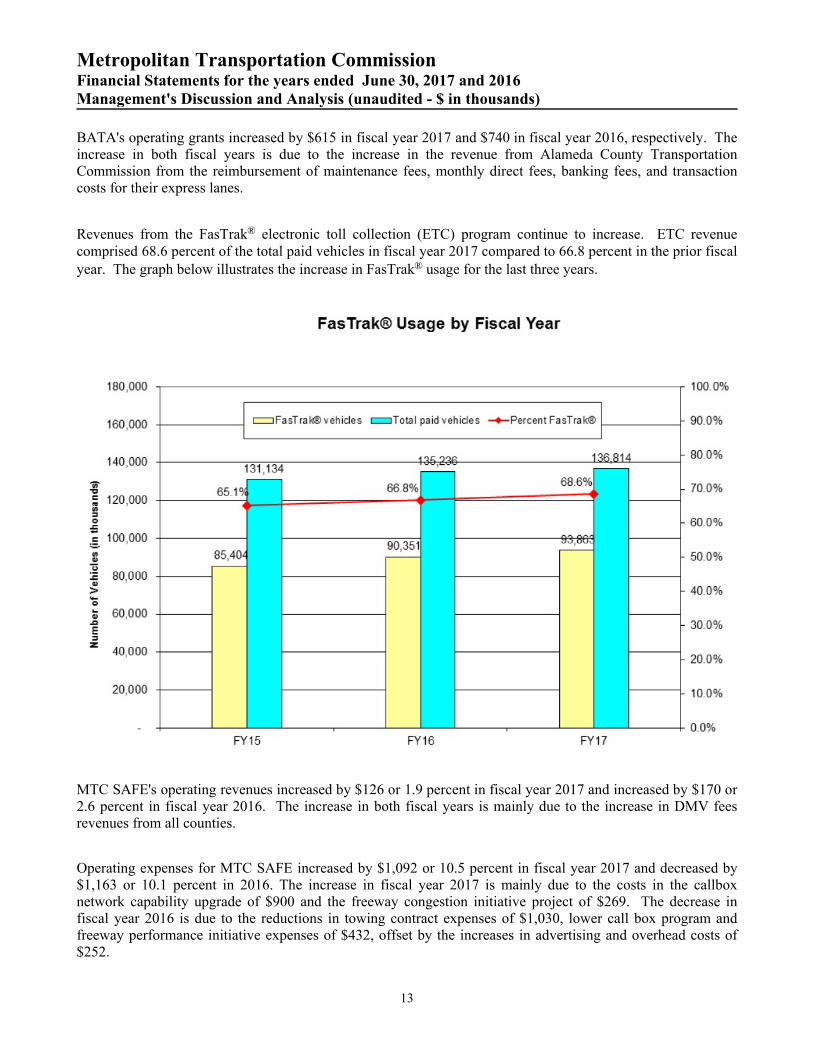
Revenues from the FasTrak® electronic toll collection (ETC) program continue to increase. ETC revenuecomprised 68.6 percent of the total paid vehicles in fiscal year 2017 compared to 66.8 percent in the prior fiscalyear. The graph below illustrates the increase in FasTrak® usage for the last three years.
MTC SAFE's operating revenues increased by $126 or 1.9 percent in fiscal year 2017 and increased by $170 or2.6 percent in fiscal year 2016. The increase in both fiscal years is mainly due to the increase in DMV feesrevenues from all counties.
Operating expenses for MTC SAFE increased by $1,092 or 10.5 percent in fiscal year 2017 and decreased by$1,163 or 10.1 percent in 2016. The increase in fiscal year 2017 is mainly due to the costs in the callboxnetwork capability upgrade of $900 and the freeway congestion initiative project of $269. The decrease infiscal year 2016 is due to the reductions in towing contract expenses of $1,030, lower call box program andfreeway performance initiative expenses of $432, offset by the increases in advertising and overhead costs of$252.
13

Metropolitan Transportation CommissionFinancial Statements for the years ended June 30, 2017 and 2016Management's Discussion and Analysis (unaudited - $ in thousands)
MTC SAFE's interest income increased by $58 in fiscal year 2017 and increased by $12 in fiscal year 2016.The increase in both fiscal years is due to a higher cash balance and slightly higher interest rates from theprevious years.
MTC Clipper® operating revenues increased slightly by $996 in fiscal year 2017 and increased by $567 in fiscalyear 2016. Operating revenues consist of reimbursements provided by transportation operators to offsetClipper® operations. Operating expenditures increased by $1,119 in fiscal year 2017 and increased by $1,739in fiscal year 2016. The increase in fiscal year 2017 was largely due to increases in professional fees of $930and salaries and benefits of $316 offset by decrease in other expenses by $127. The increase in fiscal year 2016was largely due to an increase in professional fees of $1,054 and salaries and benefits of $369. Nonoperatingrevenues consist of federal, state and local grants. Nonoperating revenues decreased by $7,717 in fiscal year2017 largely due to a decrease in federal grants of $4,533 and state grants of $3,447. Nonoperating revenuesincreased by $10,626 in fiscal year 2016 largely due to an increase in federal grants of $7,405. Transfersdecreased by $769 in fiscal year 2017 and decreased by $628 in fiscal year 2016.
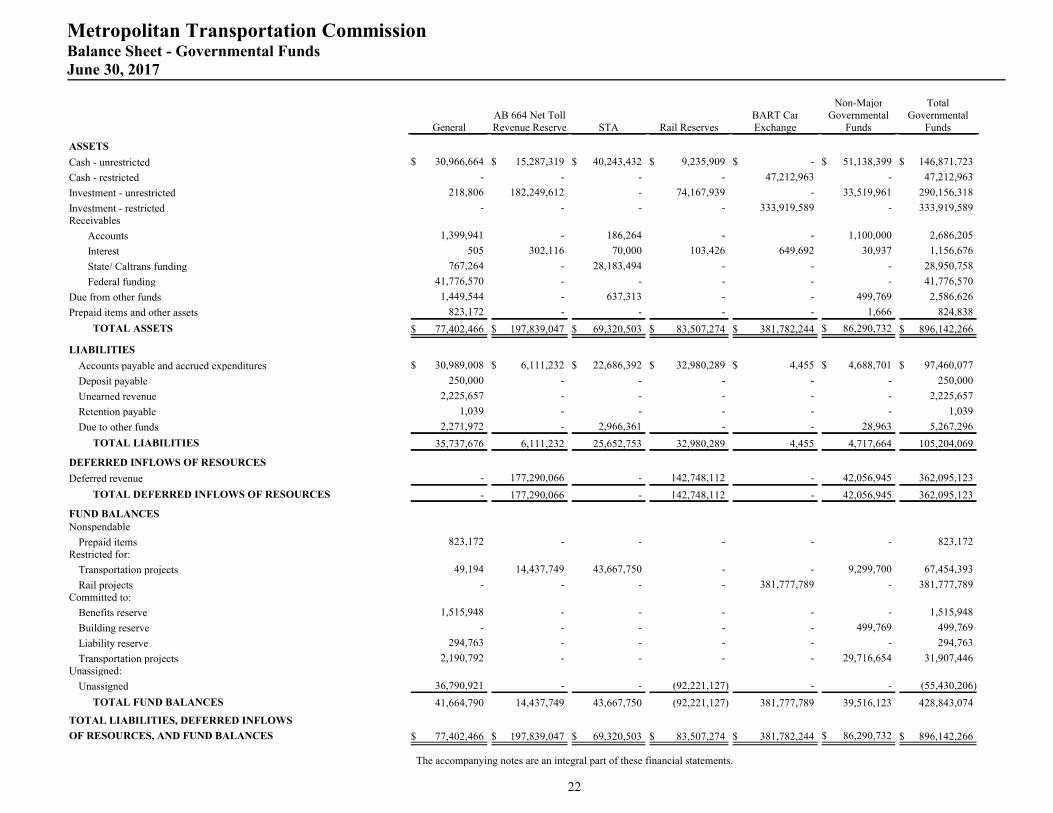
G. Financial Analysis of Governmental Funds
The fund balance of the MTC governmental funds was $428,843 and $460,371 as of June 30, 2017 and 2016,respectively, as reported under the modified accrual basis of accounting. The fund balance includesnonspendable amounts of $823 and $1,305 for prepaid items in fiscal years 2017 and 2016, respectively as wellas amounts of $449,232 and $432,172 restricted for transportation and rail projects for fiscal years 2017 and2016, respectively. The committed amounts of $34,218 and $34,999 for fiscal years 2017 and 2016,respectively, represent amounts designated by the Commission for specific purposes. The unassigned fundbalances were $(55,430) and $(8,105) for fiscal years 2017 and 2016, respectively.
The fund balance of the STA fund decreased by $10,986 and $12,005 in fiscal years 2017 and 2016,respectively. The decrease in fund balance in fiscal year 2017 is primarily due to a decrease in STA revenuesof $5,525. The fund balance for the Rail Reserves fund decreased by $51,223 in fiscal year 2017 and decreasedby $30,553 in fiscal year 2016. The decrease in fund balance from fiscal year 2016 is due to an increase inproject expenditures for the eBART capital project and the decrease in fund balance from fiscal year 2015 isdue to an increase in project expenditures for the BART Warm Springs Extension project. The fund balancefor the AB 664 fund decreased by $25,443 and increased by $5,132 in fiscal years 2017 and 2016, respectively.The decrease in fund balance is due to an increase in expenditures for replacement buses while the increase infund balance in the prior year is due to a decrease in expenditures for BART capital projects. The fund balancefor the BART Car Exchange fund increased by $54,428 and $51,343 in fiscal years 2017 and 2016,respectively. The increase in fund balance for fiscal year 2017 is due to an increase in revenue resulting fromfunding from BART for the BART Car Replacement capital project. The fund balance of the Non-Major fundsincreased by $400 and $3,590 in fiscal years 2017 and 2016, respectively. The non-major funds increase of$400 is due to an increase in Exchange Fund of $1,231 offset by a decrease of $464 from the Transit Reserveand $185 for Prop 1B funds.
14
Metropolitan Transportation CommissionFinancial Statements for the years ended June 30, 2017 and 2016Management's Discussion and Analysis (unaudited - $ in thousands)
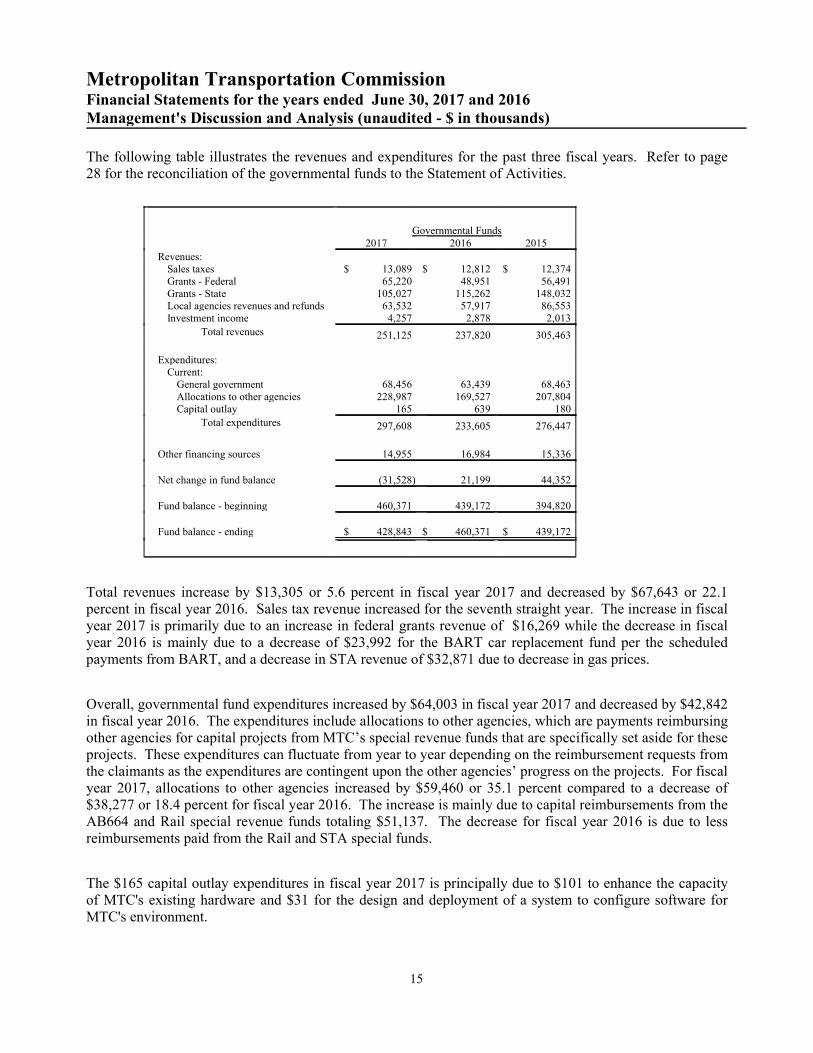
The following table illustrates the revenues and expenditures for the past three fiscal years. Refer to page28 for the reconciliation of the governmental funds to the Statement of Activities.
Governmental Funds2017 2016 2015
Revenues:Sales taxes $ 13,089 $ 12,812 $ 12,374Grants - Federal 65,220 48,951 56,491Grants - State 105,027 115,262 148,032Local agencies revenues and refunds 63,532 57,917 86,553Investment income 4,257 2,878 2,013
Total revenues 251,125 237,820 305,463
Expenditures:Current:
General government 68,456 63,439 68,463Allocations to other agencies 228,987 169,527 207,804Capital outlay 165 639 180
Total expenditures 297,608 233,605 276,447
Other financing sources 14,955 16,984 15,336
Net change in fund balance (31,528) 21,199 44,352
Fund balance - beginning 460,371 439,172 394,820
Fund balance - ending $ 428,843 $ 460,371 $ 439,172
Total revenues increase by $13,305 or 5.6 percent in fiscal year 2017 and decreased by $67,643 or 22.1percent in fiscal year 2016. Sales tax revenue increased for the seventh straight year. The increase in fiscalyear 2017 is primarily due to an increase in federal grants revenue of $16,269 while the decrease in fiscalyear 2016 is mainly due to a decrease of $23,992 for the BART car replacement fund per the scheduledpayments from BART, and a decrease in STA revenue of $32,871 due to decrease in gas prices.
Overall, governmental fund expenditures increased by $64,003 in fiscal year 2017 and decreased by $42,842in fiscal year 2016. The expenditures include allocations to other agencies, which are payments reimbursingother agencies for capital projects from MTC’s special revenue funds that are specifically set aside for theseprojects. These expenditures can fluctuate from year to year depending on the reimbursement requests fromthe claimants as the expenditures are contingent upon the other agencies’ progress on the projects. For fiscalyear 2017, allocations to other agencies increased by $59,460 or 35.1 percent compared to a decrease of$38,277 or 18.4 percent for fiscal year 2016. The increase is mainly due to capital reimbursements from theAB664 and Rail special revenue funds totaling $51,137. The decrease for fiscal year 2016 is due to lessreimbursements paid from the Rail and STA special funds.
The $165 capital outlay expenditures in fiscal year 2017 is principally due to $101 to enhance the capacityof MTC's existing hardware and $31 for the design and deployment of a system to configure software forMTC's environment.
15
Metropolitan Transportation CommissionFinancial Statements for the years ended June 30, 2017 and 2016Management's Discussion and Analysis (unaudited - $ in thousands)
Other financing sources decreased by $2,029 in fiscal year 2017 and increased by $1,648 in fiscal year 2016.
The change in net position presented in the Statement of Activities for governmental activities decreased by$34,851 in fiscal year 2017 and increased by $20,697 in fiscal year 2016. Net position for governmental fundswas $417,629 and $452,480 for fiscal years 2017 and 2016, respectively. Program revenues increased by$13,292 or 5.69 percent in fiscal year 2017, and decreased by $69,904 or 23.01 percent in fiscal year 2016. Theincrease in fiscal year 2017 was due to an increase from federal programs revenues of $16,269 and an increasein local agencies revenues of $5,615 while the STA revenue decreased by $10,447. The decrease in fiscal year2016 was due to a decrease in General Fund revenue from federal programs of $7,541, a decrease in STArevenue of $32,870 and decrease in BART Car Exchange and Exchange Fund revenue of $23,992 and $5,443,respectively.
H. General Fund Budget
The MTC general fund budget for fiscal year 2017 was amended from the adopted budget by $3,600 inincreased revenues, $360 in increased transfers in and $4,000 in increased expenditures. The actual revenues-to-expenditures balance for fiscal year 2017 reflects a surplus of $1,295. The positive surplus budget varianceof $4,021 is due to several differences in revenues and expenditures, including an underestimate in sales tax by$589, and investment revenues by $57 and the transfer in from BATA by $300 due to increase toll revenues.The expenditures variance includes $3,150 budgeted for contracts.
The deficit in both budget versions reflects encumbrances carried over from the prior fiscal year that werecovered by the prior year's general fund balance.
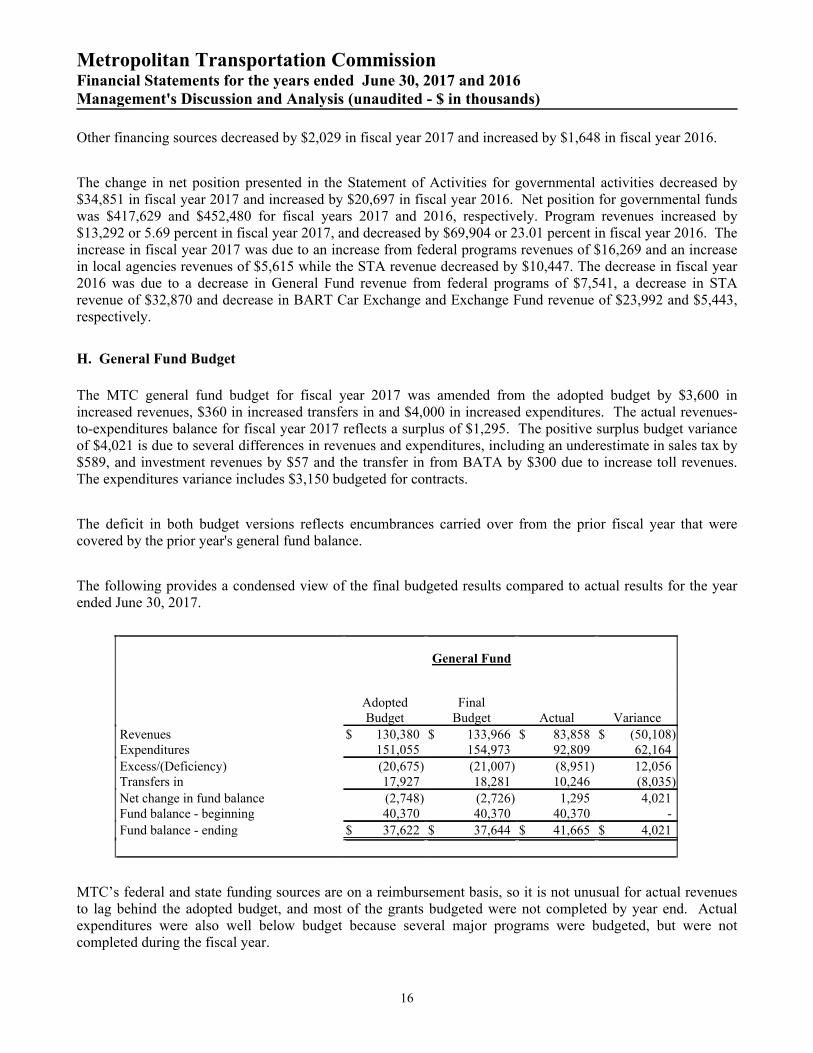
The following provides a condensed view of the final budgeted results compared to actual results for the yearended June 30, 2017.
General Fund
AdoptedBudget
FinalBudget Actual Variance
Revenues $ 130,380 $ 133,966 $ 83,858 $ (50,108)Expenditures 151,055 154,973 92,809 62,164
Excess/(Deficiency) (20,675) (21,007) (8,951) 12,056Transfers in 17,927 18,281 10,246 (8,035)
Net change in fund balance (2,748) (2,726) 1,295 4,021Fund balance - beginning 40,370 40,370 40,370 -
Fund balance - ending $ 37,622 $ 37,644 $ 41,665 $ 4,021
MTC’s federal and state funding sources are on a reimbursement basis, so it is not unusual for actual revenuesto lag behind the adopted budget, and most of the grants budgeted were not completed by year end. Actualexpenditures were also well below budget because several major programs were budgeted, but were notcompleted during the fiscal year.
16
Metropolitan Transportation CommissionFinancial Statements for the years ended June 30, 2017 and 2016Management's Discussion and Analysis (unaudited - $ in thousands)
I. Capital Asset Administration
MTC’s investment in capital assets for all funds, governmental and proprietary, increased to $78,647 infiscal year 2017 from $61,884 in fiscal year 2016 as reported under the accrual basis of accounting. Theincrease for both fiscal years is primarily due to the development costs of the Express Lane project, which isscheduled to open in the fall of 2017. Additional information on MTC’s capital assets is disclosed in Note 4to the financial statements. Assets relating to the seven state-owned bridges administered by BATA areowned by Caltrans.
J. Long-Term Debt Administration
During fiscal year 2017, BATA completed an advance refunding of $559,015 and issued $300,000 of newbonds. BATA administers a debt portfolio of $9,437,830. All of BATA's swaps were ineffective foraccounting purposes in fiscal year 2017 and 2016. Therefore, the changes in fair values of investmentderivative instruments are reported within the investment income classification in the Statement of Revenue,Expenses and Changes in Net Position. The fair value of swaps increased by $155,539 in fiscal year 2017.BATA's interest expense on the $3,275,000 of federally taxable Build America Bonds was $218,747 and thefederal subsidy was $71,298 for a net interest expense of $147,449.
Additional information on MTC’s long-term debt can be found in Note 5 to the financial statements.
K. Economic Factors Impacting MTC
The Bay Area economy continues to recover. The unemployment rate continues to decrease, and sales taxescontinue to increase from prior years. These impacts include:
Sales tax revenues increased for the seventh straight fiscal year, increasing at a slower rate by 2.2 percent
and 3.5 percent for fiscal years 2017 and 2016 respectively, after declining from fiscal years 2008 to
2010. Sales tax revenues for fiscal year 2018 are also projected to be slightly higher than fiscal year
2017.
Unemployment in the Bay Area was 3.6 percent as of June 2017.
Building construction and housing is up, and demand for consumer goods is also up.
Requests for information
This financial report is designed to provide a general overview of the Metropolitan TransportationCommission’s financial position for all those with an interest in the government’s finances. Questionsconcerning any of the information provided in this report or requests for additional financial informationshould be addressed to the Chief Financial Officer, Metropolitan Transportation Commission, 375 BealeStreet, Suite 800, San Francisco, CA 94105.
17

Metropolitan Transportation CommissionStatement of Net PositionJune 30, 2017
Primary Government
GovernmentalActivities
Business-TypeActivities Total BAHA
ASSETS
Cash - unrestricted $ 146,871,723 $ 144,058,952 $ 290,930,675 $ 13,395,450
Cash - restricted 47,212,963 118,504,555 165,717,518 13,398,808
Investments - unrestricted 290,156,318 1,108,570,249 1,398,726,567 -
Investments - restricted 333,919,589 1,515,505,943 1,849,425,532 -
Receivables:
Accounts receivable 2,686,205 21,062,485 23,748,690 1,650,397
Interest 1,156,676 22,318,779 23,475,455 4,062
Funding due from State/ Caltrans 28,950,758 3,724,344 32,675,102 -
Funding due from Federal 41,776,570 3,538,175 45,314,745 -
Prepaid items and other assets 824,838 395,872 1,220,710 685,495
Bond prepaid insurance/ interest - 16,100 16,100 -
Net OPEB asset 8,285,618 - 8,285,618 -
Land - - - 33,933,809
Capital assets not being depreciated 12,000 63,007,711 63,019,711 559,985
Capital assets net of accumulated depreciation/ amortization 580,813 15,046,446 15,627,259 182,763,079
TOTAL ASSETS 902,434,071 3,015,749,611 3,918,183,682 246,391,085
DEFERRED OUTFLOWS OF RESOURCES
Deferred amount of refunding - 322,136,090 322,136,090 -
Deferred outflows from pension 9,289,356 5,187,730 14,477,086 410,011
TOTAL DEFERRED OUTFLOWS OF RESOURCES 9,289,356 327,323,820 336,613,176 410,011
LIABILITIES
Accounts payable and accrued liabilities 97,711,116 80,584,107 178,295,223 2,491,653
Accrued interest payable - 107,040,282 107,040,282 -
Unearned revenue 256,773 88,371,606 88,628,379 415,992
Due to Caltrans - 11,400,898 11,400,898 -
Noncurrent liabilitiesNet pension liability
Due in more than one year 22,572,445 11,707,271 34,279,716 415,579Long term debt
Due within one year - 55,760,000 55,760,000 -
Due in more than one year - 9,561,878,394 9,561,878,394 -
Due to / (from) other funds
Due within one year 2,680,670 (2,680,670) - -
Other noncurrent liabilities
Derivative instruments - 390,781,957 390,781,957 -
Due within one year 2,354,613 - 2,354,613 -
Due in more than one year 3,025,287 8,824,550 11,849,837 160,452
TOTAL LIABILITIES 128,600,904 10,313,668,395 10,442,269,299 3,483,676
DEFERRED INFLOWS OF RESOURCES
Deferred inflows from pension 3,398,330 1,600,738 4,999,068 9,766
Deferred revenues/Deferred charges 362,095,123 (362,095,123) - -
TOTAL DEFERRED INFLOWS OF RESOURCES 365,493,453 (360,494,385) 4,999,068 9,766
NET POSITION
Net investment in capital assets 364,206 78,054,157 78,418,363 217,256,873
Restricted for:
Capital projects 481,090,437 266,482 481,356,919 13,398,808
Operations & Maintenance, under debt covenant - 150,000,000 150,000,000 -
Extraordinary loss reserve, under Caltrans Coop - 50,000,000 50,000,000 -
Net OPEB asset 8,285,618 - 8,285,618 -
STA reserve 49,194 - 49,194 -
Unrestricted (72,160,385) (6,888,421,218) (6,960,581,603) 12,651,973
TOTAL NET POSITION $ 417,629,070 $ (6,610,100,579) $ (6,192,471,509) $ 243,307,654
The accompanying notes are an integral part of these financial statements.
18
Metropolitan Transportation CommissionStatement of Net PositionJune 30, 2016
Primary Government
GovernmentalActivities
Business-TypeActivities Total BAHA
ASSETS
Cash - unrestricted $ 172,090,338 $ 261,749,839 $ 433,840,177 $ -
Cash - restricted 136,441 103,794,641 103,931,082 27,725,768
Investments - unrestricted 336,229,912 912,159,296 1,248,389,208 -
Investments - restricted 326,807,822 1,513,622,661 1,840,430,483 30,000,000
Receivables:
Accounts receivable 2,108,387 21,122,140 23,230,527 541,858
Interest 848,802 20,397,478 21,246,280 32,127
Funding due from State/ Caltrans 56,154,430 5,253,649 61,408,079 -
Funding due from Federal 24,220,387 6,539,651 30,760,038 -
Prepaid items and other assets 1,304,973 1,333,085 2,638,058 689,961
Bond prepaid insurance - 37,568 37,568 -
Net OPEB asset 7,384,385 - 7,384,385 -
Land - - - 33,933,809
Capital assets not being depreciated 3,912,654 35,428,344 39,340,998 111,805
Capital assets net of accumulated depreciation/ amortization 1,446,049 21,096,671 22,542,720 215,208,865
TOTAL ASSETS 932,644,580 2,902,535,023 3,835,179,603 308,244,193
DEFERRED OUTFLOWS OF RESOURCES
Deferred amount of refunding - 339,332,432 339,332,432 -
Deferred outflows from pension 5,907,566 3,081,427 8,988,993 -
TOTAL DEFERRED OUTFLOWS OF RESOURCES 5,907,566 342,413,859 348,321,425 -
LIABILITIES
Accounts payable and accrued liabilities 71,116,631 87,208,890 158,325,521 34,113,794
Security trade payable - 45,000,000 45,000,000 -
Accrued interest payable - 100,799,323 100,799,323 -
Unearned revenue 81,477 80,885,198 80,966,675 655,381
Deposit payable - - - 800,000
Due to Caltrans - 25,331,790 25,331,790 -
Noncurrent liabilitiesNet pension liability
Due in more than one year 18,286,012 9,108,343 27,394,355 -Long term debt
Due within one year - 54,835,000 54,835,000 -
Due in more than one year - 9,301,640,813 9,301,640,813 -Due to / (from) other funds
Due within one year 6,313,533 (6,313,533) - -Other noncurrent liabilities
Derivative instruments - 546,320,887 546,320,887 -Due within one year 2,154,908 - 2,154,908 -Due in more than one year 2,974,182 9,194,424 12,168,606 160,452
TOTAL LIABILITIES 100,926,743 10,254,011,135 10,354,937,878 35,729,627
DEFERRED INFLOWS OF RESOURCES
Deferred inflows from pension 4,752,458 2,328,495 7,080,953 -Deferred revenues/Deferred charges 380,393,353 (380,393,353) - -
TOTAL DEFERRED INFLOWS OF RESOURCES 385,145,811 (378,064,858) 7,080,953 -
NET POSITION
Net investment in capital assets 5,072,036 56,525,015 61,597,051 249,254,479Restricted for:
Capital projects 464,080,311 3,559,290 467,639,601 23,260,087Operations & Maintenance, under debt covenant - 150,000,000 150,000,000 -Extraordinary loss reserve, under Caltrans Coop - 50,000,000 50,000,000 -Net OPEB asset 7,384,385 - 7,384,385 -STA Reserve 158,050 - 158,050 -
Unrestricted (24,215,190) (6,891,081,700) (6,915,296,890) -
TOTAL NET POSITION $ 452,479,592 $ (6,630,997,395) $ (6,178,517,803) $ 272,514,566
The accompanying notes are an integral part of these financial statements.
19

Metropolitan Transportation CommissionStatement of ActivitiesFor the Year Ended June 30, 2017
Net (Expenses) Revenues and Changes in NetPosition
Program Revenues Primary Government
ExpensesCharges for
ServicesOperating Grants and
ContributionsCapital Grants
and ContributionsTotal Program
RevenuesGovernmental
ActivitiesBusiness-type
Activities Total BAHA
Functions:Primary Government:
Governmental Activities:General Government $ 103,883,046 $ - $ 142,184,036 $ - $ 142,184,036 $ 38,300,990 $ - 38,300,990 $ -Transportation 204,294,737 - 105,027,322 - 105,027,322 (99,267,415) - (99,267,415) -
Total Governmental Activities 308,177,783 - 247,211,358 - 247,211,358 (60,966,425) - (60,966,425) -
Business-type ActivitiesMTC Clipper® smart card 45,093,517 18,314,715 - 9,219,623 27,534,338 - (17,559,179) (17,559,179) -Toll bridge activities 980,644,892 747,261,356 82,357,269 - 829,618,625 - (151,026,267) (151,026,267) -Congestion relief 11,463,126 6,716,397 6,573,706 - 13,290,103 - 1,826,977 1,826,977 -
Total Business-Type Activities 1,037,201,535 772,292,468 88,930,975 9,219,623 870,443,066 - (166,758,469) (166,758,469) -
Total Primary Government $ 1,345,379,318 $ 772,292,468 $ 336,142,333 $ 9,219,623 $ 1,117,654,424 (60,966,425) (166,758,469) (227,724,894) -
Component Units:BAHA $ 48,449,852 $ 10,458,012 $ 12,838,052 - $ 23,296,064 $ (25,153,788)
Total Component Units $ 48,449,852 $ 10,458,012 $ 12,838,052 $ - $ 23,296,064 $ (25,153,788)
General Revenues:
Restricted investment earnings 1,885,154 - 1,885,154 178,745Unrestricted investment earnings 2,371,696 171,808,360 174,180,056 -Return of contribution from Bay Area Headquarters Authority - 29,700,000 29,700,000 -Gain (loss) on sale of capital assets 6,628,042 1,377,936 8,005,978 (4,231,869)
Transfers 15,231,011 (15,231,011) - -
Total General Revenues and Transfers 26,115,903 187,655,285 213,771,188 (4,053,124)
Change in Net Position (34,850,522) 20,896,816 (13,953,706) (29,206,912)Net Position - Beginning 452,479,592 (6,630,997,395) (6,178,517,803) 272,514,566
Net Position - Ending $ 417,629,070 $ (6,610,100,579) $ (6,192,471,509) $ 243,307,654
The accompanying notes are an integral part of these financial statements.
20
��������� ���� �������� ���������� !������ �����$���7�����"����+��?����/ ������ ����������
-���2/<� ���4�#�7� ����� ���+� %���� �-��0������
0��%����#�7� ��� 0����� �9�7�� �� �
/<� ����+��%������!��7����
*����� %�9�� ���� ��� �������� �
������9�� ��� ���� �������� �
�����0��%���#�7� ���
9�7�� �� ��$���7�����
(��� ���.� �$���7����� ���� ($6$
"� ���� �;0����� �9�7�� �� �;
$��������������������� H$�������$��������� O 00.+!#.0/3 O � O #./30. #3 O � O #./30. #3 O " ./ #."*+ O � " ./ #."*+ O ���� ��������� 3/.+"3."+" � 3.*/ .# * � 3.*/ .# * ;"+.0#!.3)*< � ;"+.0#!.3)*< �
�����9�7�� �� ���$���7����� *!!.+#". /) � *!!.) #.))0 � *!!.) #.))0 #!".#*# � #!".#*# �
-, ��� ��1������������ 9���������A� ��������� "".+)+.! 0 0.! ).*"/ !.!00.3+* !.33).*)+ !".*3/.+!# � ;).#!".*0)< ;).#!".*0)< �����2��������������� )!3.3"!./ / 0!/.)/*.+/ #*.!0)./0# � # ).!" .0!) � ; /.*+ .#00< ; /.*+ .#00< ������ ���������� +." #./+3 /.3)+.!#! /.)"0.0*) � !.3!#. * � !. ).3+0 !. ).3+0 �
�����-, ��� �1������������ ))+.+3*.3!# 0/+.#0 ./)+ +*.0+".)+) !.33).*)+ #/0. !3.##) � ; **.) /./")< ; **.) /./")< �
�����0����� �9�7�� �� � O .**!. !/.0+0 O 0/+.#0 ./)+ O !!/./*!.)+/ O !.33).*)+ O . + .+3".##/ #!".#*# ; **.) /./")< ; **.+# .#* < �
���� � ��> ���;-�7� O #.)+3.# 3 O * #.!!" O 3 #./)" O )*3.)!0 O .//*.)/3 O ;0.*"*.#3+<
���������������F��� O #.)+3.# 3 O * #.!!" O 3 #./)" O )*3.)!0 O .//*.)/3 O ;0.*"*.#3+<
$������������,� H
�� ������������ ������������� . 0*.)"" � . 0*.)"" ! ./"+
F��� ������������ ������������� �@������� .0+".3+# ; 03.!3#.0)"< ; 0!./3".*#/< ���� �� /.)#".*/* ; /.)#".*/*< � �
�����9� ����#�7� ����� ����� ����� ).#/ .0 " ; )*.!"!.+3/< ; 0*."# .!"*< ! ./"+
�+� %��� �-���0������ *+./)/.3"* ;! 3.*3).0+3< ;*)".3/!. /!< ;0. .* +<-���0������ �.�(�%� � %��������������2 �����5�4 "! .0#!.+3+ ;/.! 3.0!0./)+< ;3.##!.)3"./"+< *0)./*3.00/
-���0������ �.�/ �� % O "3*."0).3)* O ;/./!+.))0.!)3< O ;/. 0#.3 0.#+!< O *0*.3 ".3//
�����������1�������� ��������������������������� ����������� �������� D
*
Metropolitan Transportation CommissionBalance Sheet - Governmental FundsJune 30, 2017
GeneralAB 664 Net TollRevenue Reserve STA Rail Reserves
BART CarExchange
Non-MajorGovernmental
Funds
TotalGovernmental
Funds
ASSETS
Cash - unrestricted $ 30,966,664 $ 15,287,319 $ 40,243,432 $ 9,235,909 $ - $ 51,138,399 $ 146,871,723
Cash - restricted - - - - 47,212,963 - 47,212,963
Investment - unrestricted 218,806 182,249,612 - 74,167,939 - 33,519,961 290,156,318
Investment - restricted - - - - 333,919,589 - 333,919,589Receivables
Accounts 1,399,941 - 186,264 - - 1,100,000 2,686,205
Interest 505 302,116 70,000 103,426 649,692 30,937 1,156,676
State/ Caltrans funding 767,264 - 28,183,494 - - - 28,950,758
Federal funding 41,776,570 - - - - - 41,776,570
Due from other funds 1,449,544 - 637,313 - - 499,769 2,586,626
Prepaid items and other assets 823,172 - - - - 1,666 824,838
TOTAL ASSETS $ 77,402,466 $ 197,839,047 $ 69,320,503 $ 83,507,274 $ 381,782,244 $ 86,290,732 $ 896,142,266
LIABILITIES
Accounts payable and accrued expenditures $ 30,989,008 $ 6,111,232 $ 22,686,392 $ 32,980,289 $ 4,455 $ 4,688,701 $ 97,460,077
Deposit payable 250,000 - - - - - 250,000
Unearned revenue 2,225,657 - - - - - 2,225,657
Retention payable 1,039 - - - - - 1,039
Due to other funds 2,271,972 - 2,966,361 - - 28,963 5,267,296
TOTAL LIABILITIES 35,737,676 6,111,232 25,652,753 32,980,289 4,455 4,717,664 105,204,069
DEFERRED INFLOWS OF RESOURCES
Deferred revenue - 177,290,066 - 142,748,112 - 42,056,945 362,095,123
TOTAL DEFERRED INFLOWS OF RESOURCES - 177,290,066 - 142,748,112 - 42,056,945 362,095,123
FUND BALANCESNonspendable
Prepaid items 823,172 - - - - - 823,172Restricted for:
Transportation projects 49,194 14,437,749 43,667,750 - - 9,299,700 67,454,393
Rail projects - - - - 381,777,789 - 381,777,789Committed to:
Benefits reserve 1,515,948 - - - - - 1,515,948
Building reserve - - - - - 499,769 499,769
Liability reserve 294,763 - - - - - 294,763
Transportation projects 2,190,792 - - - - 29,716,654 31,907,446Unassigned:
Unassigned 36,790,921 - - (92,221,127) - - (55,430,206)
TOTAL FUND BALANCES 41,664,790 14,437,749 43,667,750 (92,221,127) 381,777,789 39,516,123 428,843,074
TOTAL LIABILITIES, DEFERRED INFLOWS
OF RESOURCES, AND FUND BALANCES $ 77,402,466 $ 197,839,047 $ 69,320,503 $ 83,507,274 $ 381,782,244 $ 86,290,732 $ 896,142,266
The accompanying notes are an integral part of these financial statements.
22
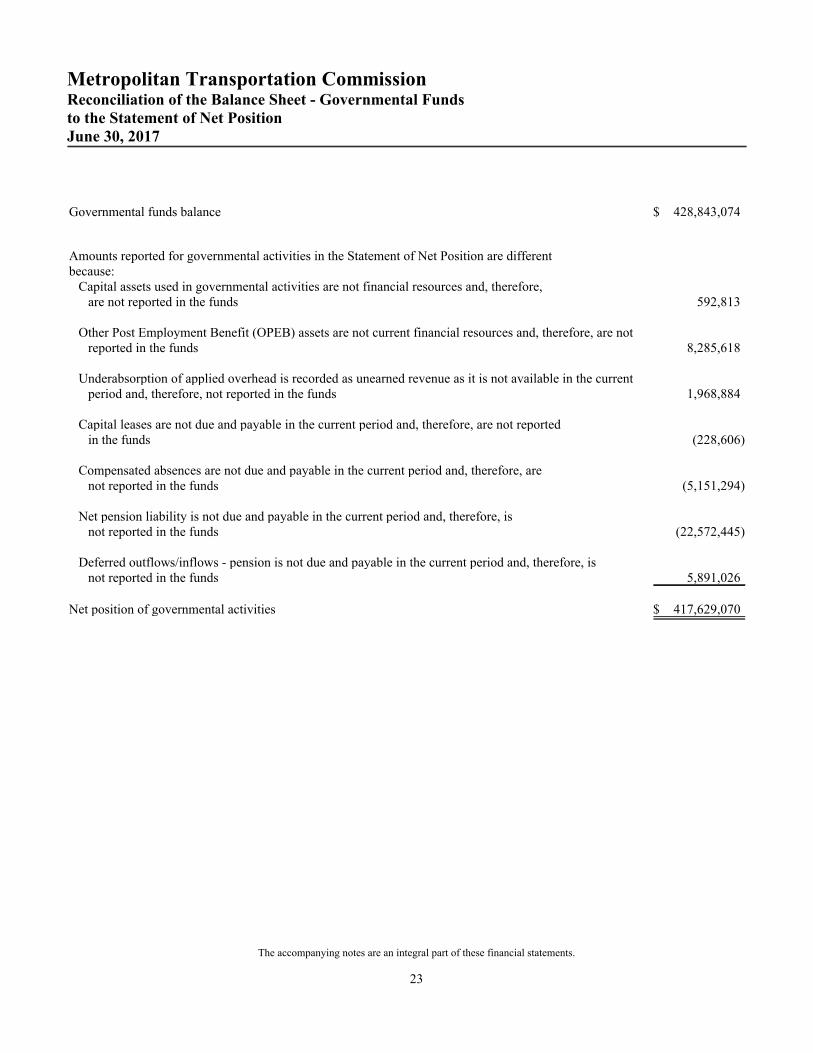
Metropolitan Transportation CommissionReconciliation of the Balance Sheet - Governmental Fundsto the Statement of Net PositionJune 30, 2017
Governmental funds balance $ 428,843,074
Amounts reported for governmental activities in the Statement of Net Position are differentbecause:
Capital assets used in governmental activities are not financial resources and, therefore,are not reported in the funds 592,813
Other Post Employment Benefit (OPEB) assets are not current financial resources and, therefore, are notreported in the funds 8,285,618
Underabsorption of applied overhead is recorded as unearned revenue as it is not available in the currentperiod and, therefore, not reported in the funds 1,968,884
Capital leases are not due and payable in the current period and, therefore, are not reportedin the funds (228,606)
Compensated absences are not due and payable in the current period and, therefore, arenot reported in the funds (5,151,294)
Net pension liability is not due and payable in the current period and, therefore, isnot reported in the funds (22,572,445)
Deferred outflows/inflows - pension is not due and payable in the current period and, therefore, isnot reported in the funds 5,891,026
Net position of governmental activities $ 417,629,070
The accompanying notes are an integral part of these financial statements.
23
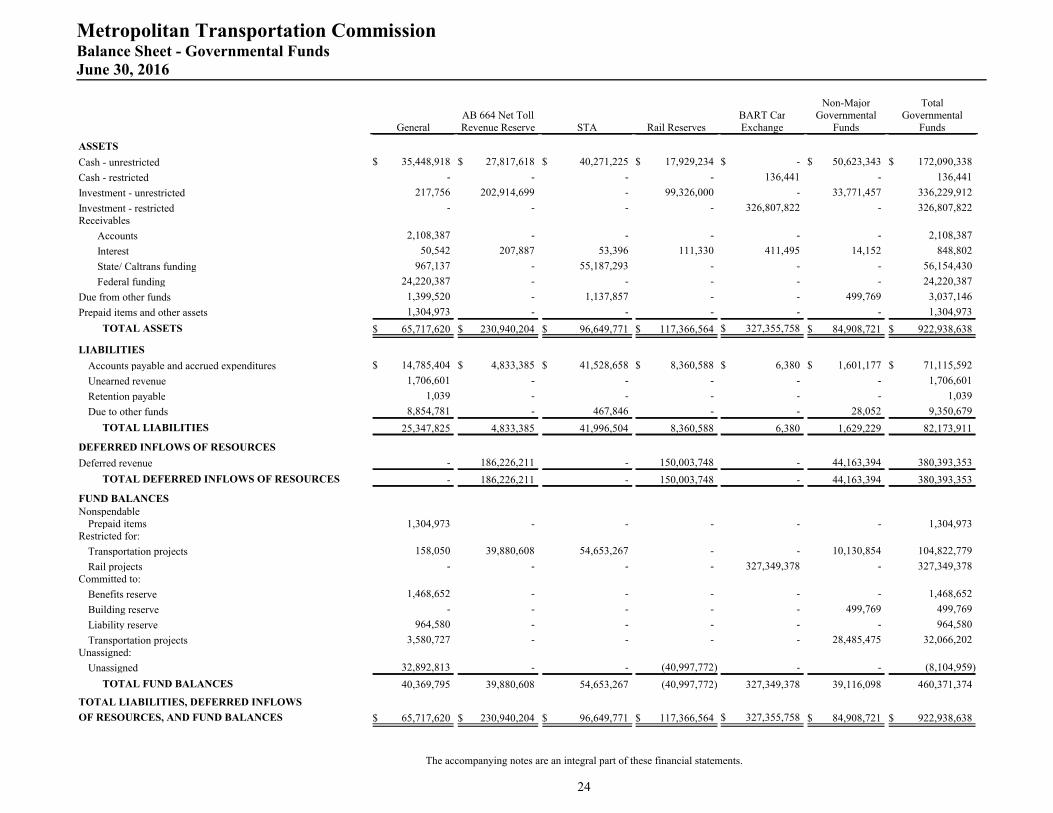
Metropolitan Transportation CommissionBalance Sheet - Governmental FundsJune 30, 2016
GeneralAB 664 Net TollRevenue Reserve STA Rail Reserves
BART CarExchange
Non-MajorGovernmental
Funds
TotalGovernmental
Funds
ASSETS
Cash - unrestricted $ 35,448,918 $ 27,817,618 $ 40,271,225 $ 17,929,234 $ - $ 50,623,343 $ 172,090,338
Cash - restricted - - - - 136,441 - 136,441
Investment - unrestricted 217,756 202,914,699 - 99,326,000 - 33,771,457 336,229,912
Investment - restricted - - - - 326,807,822 - 326,807,822Receivables
Accounts 2,108,387 - - - - - 2,108,387
Interest 50,542 207,887 53,396 111,330 411,495 14,152 848,802
State/ Caltrans funding 967,137 - 55,187,293 - - - 56,154,430
Federal funding 24,220,387 - - - - - 24,220,387
Due from other funds 1,399,520 - 1,137,857 - - 499,769 3,037,146
Prepaid items and other assets 1,304,973 - - - - - 1,304,973
TOTAL ASSETS $ 65,717,620 $ 230,940,204 $ 96,649,771 $ 117,366,564 $ 327,355,758 $ 84,908,721 $ 922,938,638
LIABILITIES
Accounts payable and accrued expenditures $ 14,785,404 $ 4,833,385 $ 41,528,658 $ 8,360,588 $ 6,380 $ 1,601,177 $ 71,115,592
Unearned revenue 1,706,601 - - - - - 1,706,601
Retention payable 1,039 - - - - - 1,039
Due to other funds 8,854,781 - 467,846 - - 28,052 9,350,679
TOTAL LIABILITIES 25,347,825 4,833,385 41,996,504 8,360,588 6,380 1,629,229 82,173,911
DEFERRED INFLOWS OF RESOURCES
Deferred revenue - 186,226,211 - 150,003,748 - 44,163,394 380,393,353
TOTAL DEFERRED INFLOWS OF RESOURCES - 186,226,211 - 150,003,748 - 44,163,394 380,393,353
FUND BALANCESNonspendable
Prepaid items 1,304,973 - - - - - 1,304,973Restricted for:
Transportation projects 158,050 39,880,608 54,653,267 - - 10,130,854 104,822,779
Rail projects - - - - 327,349,378 - 327,349,378Committed to:
Benefits reserve 1,468,652 - - - - - 1,468,652
Building reserve - - - - - 499,769 499,769
Liability reserve 964,580 - - - - - 964,580
Transportation projects 3,580,727 - - - - 28,485,475 32,066,202Unassigned:
Unassigned 32,892,813 - - (40,997,772) - - (8,104,959)
TOTAL FUND BALANCES 40,369,795 39,880,608 54,653,267 (40,997,772) 327,349,378 39,116,098 460,371,374
TOTAL LIABILITIES, DEFERRED INFLOWS
OF RESOURCES, AND FUND BALANCES $ 65,717,620 $ 230,940,204 $ 96,649,771 $ 117,366,564 $ 327,355,758 $ 84,908,721 $ 922,938,638
The accompanying notes are an integral part of these financial statements.
24
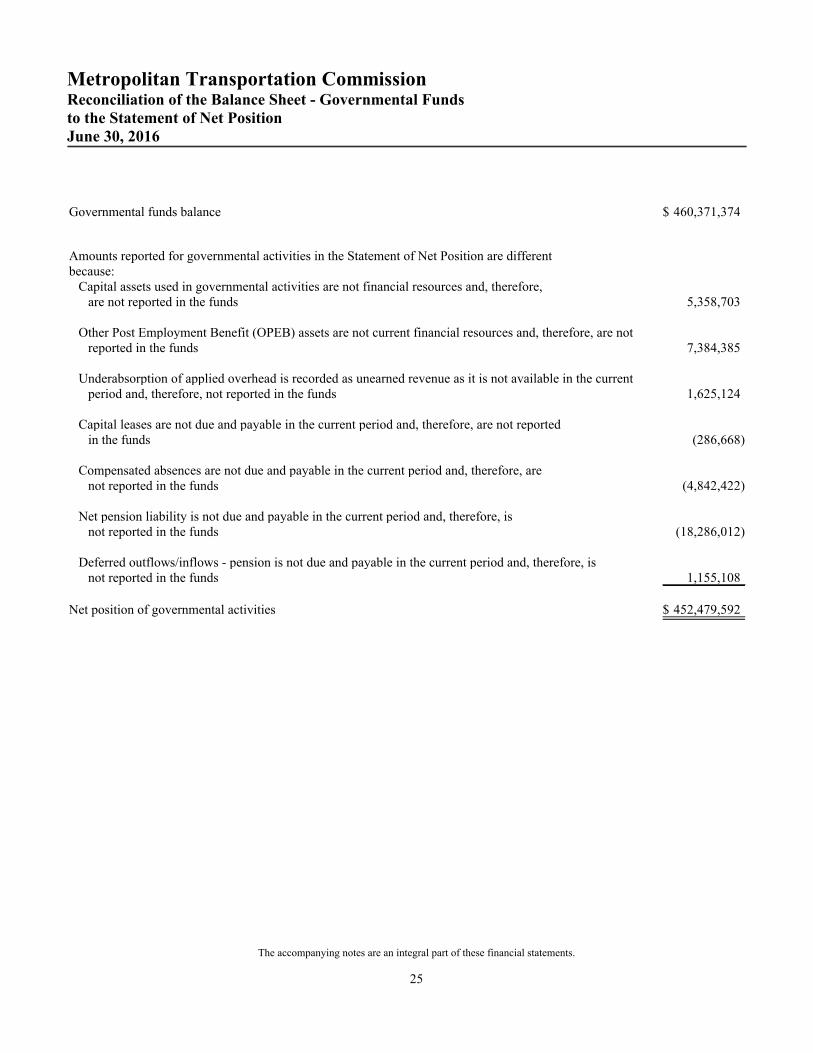
Metropolitan Transportation CommissionReconciliation of the Balance Sheet - Governmental Fundsto the Statement of Net PositionJune 30, 2016
Governmental funds balance $ 460,371,374
Amounts reported for governmental activities in the Statement of Net Position are differentbecause:
Capital assets used in governmental activities are not financial resources and, therefore,are not reported in the funds 5,358,703
Other Post Employment Benefit (OPEB) assets are not current financial resources and, therefore, are notreported in the funds 7,384,385
Underabsorption of applied overhead is recorded as unearned revenue as it is not available in the currentperiod and, therefore, not reported in the funds 1,625,124
Capital leases are not due and payable in the current period and, therefore, are not reportedin the funds (286,668)
Compensated absences are not due and payable in the current period and, therefore, arenot reported in the funds (4,842,422)
Net pension liability is not due and payable in the current period and, therefore, isnot reported in the funds (18,286,012)
Deferred outflows/inflows - pension is not due and payable in the current period and, therefore, isnot reported in the funds 1,155,108
Net position of governmental activities $ 452,479,592
The accompanying notes are an integral part of these financial statements.
25

Metropolitan Transportation CommissionStatement of Revenues, Expenditures and Changes in Fund Balances -Governmental FundsFor the Year Ended June 30, 2017
GeneralAB 664 Net TollRevenue Reserve STA Rail Reserves
BART CarExchange
Non-MajorGovernmental
Funds
TotalGovernmental
Funds
REVENUES
Sales tax $ 13,088,720 $ - $ - $ - $ - $ - $ 13,088,720
Grants - Federal 65,219,640 - - - - - 65,219,640
Grants - State 616,561 - 101,167,760 - - 3,243,001 105,027,322
Local agencies revenues and refunds 4,856,377 - 5,027,828 - 52,547,712 1,100,000 63,531,917
Investment income - unrestricted 76,643 1,172,891 187,426 532,506 - 402,230 2,371,696
Investment income - restricted - - - - 1,885,154 - 1,885,154
TOTAL REVENUES 83,857,941 1,172,891 106,383,014 532,506 54,432,866 4,745,231 251,124,449
EXPENDITURESCurrent:
General government 67,951,367 19,694 - 11,468 4,455 468,788 68,455,772
Allocations to other agencies 24,692,348 35,532,201 103,737,392 59,000,029 - 6,025,115 228,987,085
Capital outlay 164,855 - - - - - 164,855
TOTAL EXPENDITURES 92,808,570 35,551,895 103,737,392 59,011,497 4,455 6,493,903 297,607,712
EXCESS/(DEFICIENCY) OF REVENUES
OVER/(UNDER) EXPENDITURES (8,950,629) (34,379,004) 2,645,622 (58,478,991) 54,428,411 (1,748,672) (46,483,263)
OTHER FINANCING SOURCES (USES)
Transfers in 10,566,300 8,936,145 637,313 7,255,636 - 2,201,449 29,596,843
Transfers out (44,628) - (14,268,452) - - (52,752) (14,365,832)
Sale of capital assets 11,146,656 - - - - - 11,146,656
Contribution to Bay Area Headquarters Authority (11,422,704) - - - - - (11,422,704)
TOTAL OTHER FINANCINGSOURCES (USES) 10,245,624 8,936,145 (13,631,139) 7,255,636 - 2,148,697 14,954,963
NET CHANGE IN FUND BALANCES 1,294,995 (25,442,859) (10,985,517) (51,223,355) 54,428,411 400,025 (31,528,300)
Fund balances - beginning 40,369,795 39,880,608 54,653,267 (40,997,772) 327,349,378 39,116,098 460,371,374
Fund balances - ending $ 41,664,790 $ 14,437,749 $ 43,667,750 $ (92,221,127) $ 381,777,789 $ 39,516,123 $ 428,843,074
The accompanying notes are an integral part of these financial statements.
26
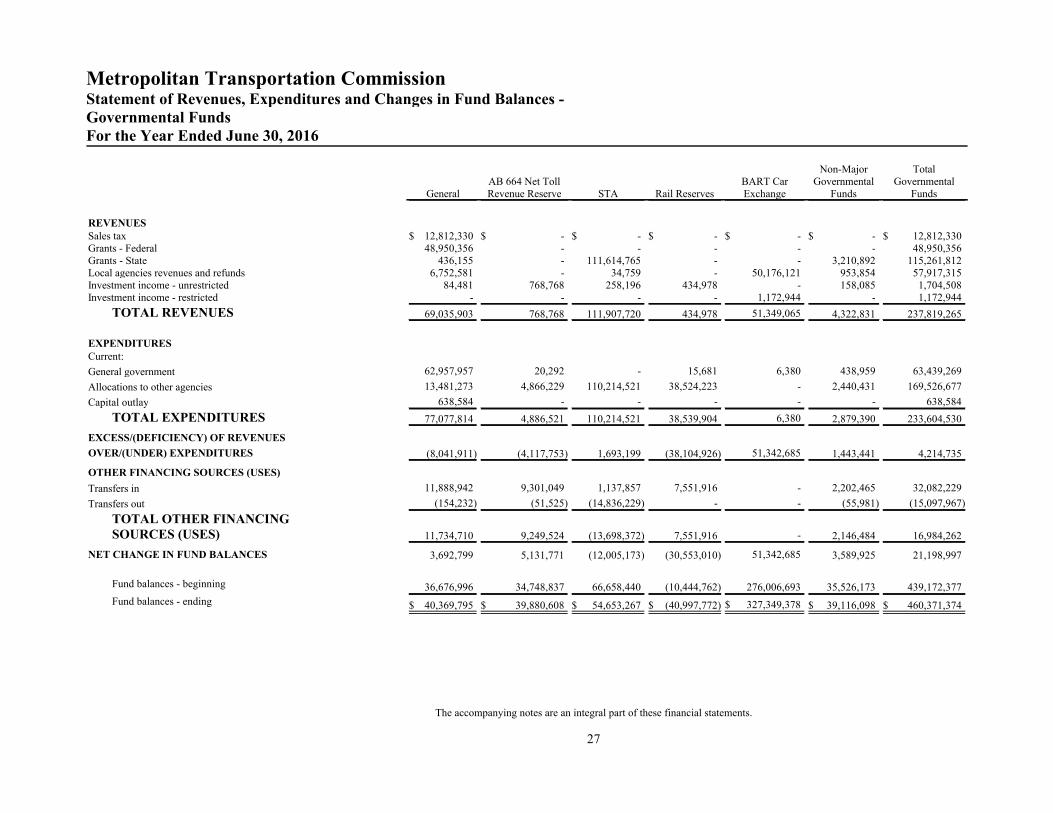
Metropolitan Transportation CommissionStatement of Revenues, Expenditures and Changes in Fund Balances -Governmental FundsFor the Year Ended June 30, 2016
GeneralAB 664 Net TollRevenue Reserve STA Rail Reserves
BART CarExchange
Non-MajorGovernmental
Funds
TotalGovernmental
Funds
REVENUESSales tax $ 12,812,330 $ - $ - $ - $ - $ - $ 12,812,330Grants - Federal 48,950,356 - - - - - 48,950,356Grants - State 436,155 - 111,614,765 - - 3,210,892 115,261,812Local agencies revenues and refunds 6,752,581 - 34,759 - 50,176,121 953,854 57,917,315Investment income - unrestricted 84,481 768,768 258,196 434,978 - 158,085 1,704,508Investment income - restricted - - - - 1,172,944 - 1,172,944
TOTAL REVENUES 69,035,903 768,768 111,907,720 434,978 51,349,065 4,322,831 237,819,265
EXPENDITURESCurrent:
General government 62,957,957 20,292 - 15,681 6,380 438,959 63,439,269
Allocations to other agencies 13,481,273 4,866,229 110,214,521 38,524,223 - 2,440,431 169,526,677
Capital outlay 638,584 - - - - - 638,584
TOTAL EXPENDITURES 77,077,814 4,886,521 110,214,521 38,539,904 6,380 2,879,390 233,604,530
EXCESS/(DEFICIENCY) OF REVENUES
OVER/(UNDER) EXPENDITURES (8,041,911) (4,117,753) 1,693,199 (38,104,926) 51,342,685 1,443,441 4,214,735
OTHER FINANCING SOURCES (USES)
Transfers in 11,888,942 9,301,049 1,137,857 7,551,916 - 2,202,465 32,082,229
Transfers out (154,232) (51,525) (14,836,229) - - (55,981) (15,097,967)
TOTAL OTHER FINANCINGSOURCES (USES) 11,734,710 9,249,524 (13,698,372) 7,551,916 - 2,146,484 16,984,262
NET CHANGE IN FUND BALANCES 3,692,799 5,131,771 (12,005,173) (30,553,010) 51,342,685 3,589,925 21,198,997
Fund balances - beginning 36,676,996 34,748,837 66,658,440 (10,444,762) 276,006,693 35,526,173 439,172,377
Fund balances - ending $ 40,369,795 $ 39,880,608 $ 54,653,267 $ (40,997,772) $ 327,349,378 $ 39,116,098 $ 460,371,374
The accompanying notes are an integral part of these financial statements.
27
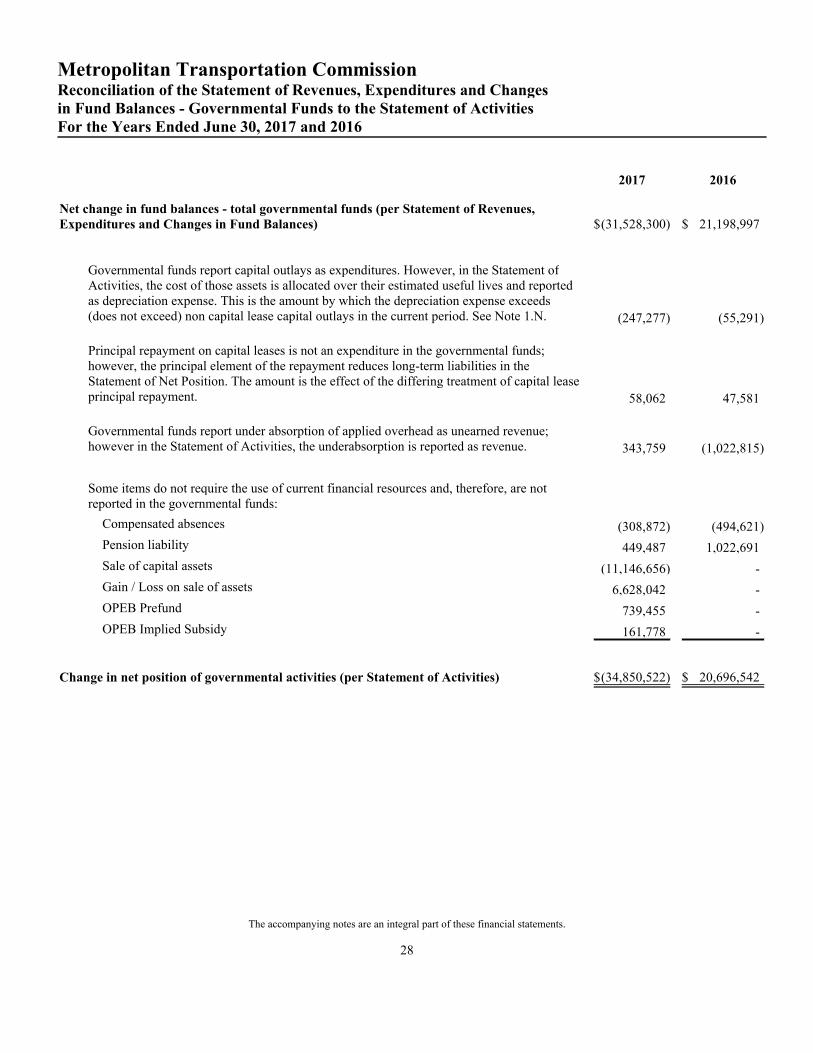
Metropolitan Transportation CommissionReconciliation of the Statement of Revenues, Expenditures and Changesin Fund Balances - Governmental Funds to the Statement of ActivitiesFor the Years Ended June 30, 2017 and 2016
2017 2016
Net change in fund balances - total governmental funds (per Statement of Revenues,Expenditures and Changes in Fund Balances) $(31,528,300) $ 21,198,997
Governmental funds report capital outlays as expenditures. However, in the Statement ofActivities, the cost of those assets is allocated over their estimated useful lives and reportedas depreciation expense. This is the amount by which the depreciation expense exceeds(does not exceed) non capital lease capital outlays in the current period. See Note 1.N. (247,277) (55,291)
Principal repayment on capital leases is not an expenditure in the governmental funds;however, the principal element of the repayment reduces long-term liabilities in theStatement of Net Position. The amount is the effect of the differing treatment of capital leaseprincipal repayment. 58,062 47,581
Governmental funds report under absorption of applied overhead as unearned revenue;however in the Statement of Activities, the underabsorption is reported as revenue. 343,759 (1,022,815)
Some items do not require the use of current financial resources and, therefore, are notreported in the governmental funds:
Compensated absences (308,872) (494,621)
Pension liability 449,487 1,022,691
Sale of capital assets (11,146,656) -
Gain / Loss on sale of assets 6,628,042 -
OPEB Prefund 739,455 -
OPEB Implied Subsidy 161,778 -
Change in net position of governmental activities (per Statement of Activities) $(34,850,522) $ 20,696,542
The accompanying notes are an integral part of these financial statements.
28
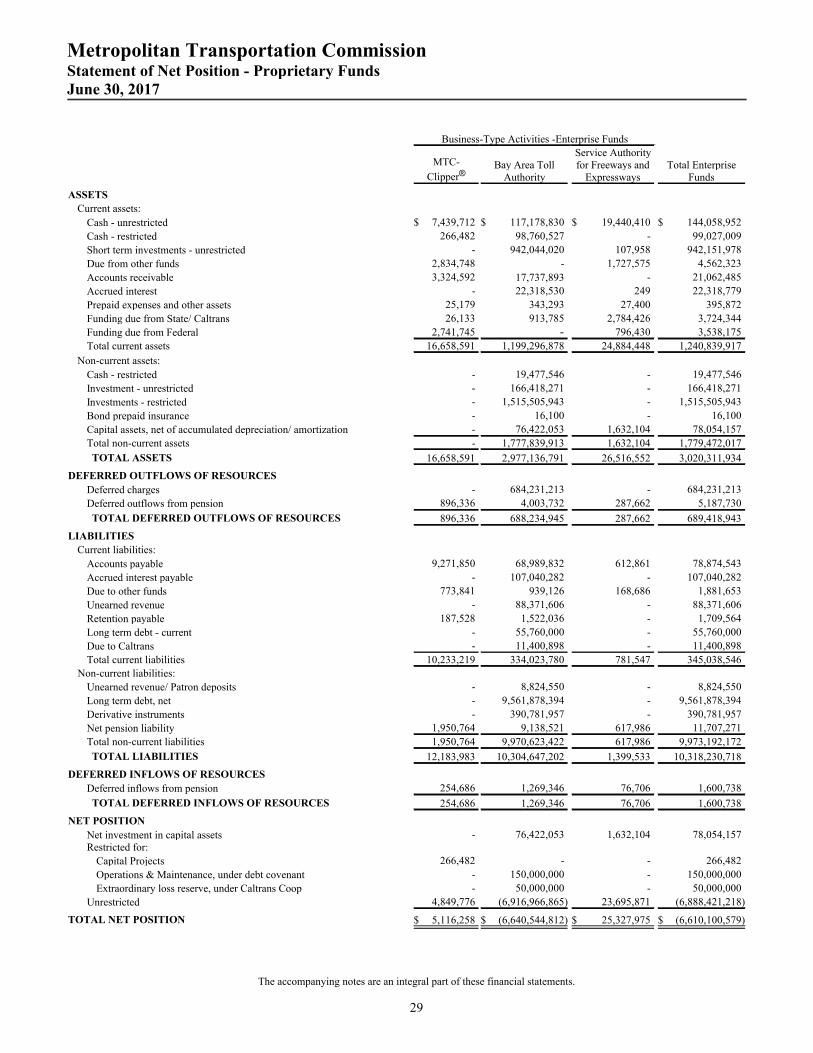
Metropolitan Transportation CommissionStatement of Net Position - Proprietary FundsJune 30, 2017
Business-Type Activities -Enterprise Funds
MTC-
Clipper®Bay Area Toll
Authority
Service Authorityfor Freeways and
ExpresswaysTotal Enterprise
Funds
ASSETS
Current assets:
Cash - unrestricted $ 7,439,712 $ 117,178,830 $ 19,440,410 $ 144,058,952
Cash - restricted 266,482 98,760,527 - 99,027,009
Short term investments - unrestricted - 942,044,020 107,958 942,151,978
Due from other funds 2,834,748 - 1,727,575 4,562,323
Accounts receivable 3,324,592 17,737,893 - 21,062,485
Accrued interest - 22,318,530 249 22,318,779
Prepaid expenses and other assets 25,179 343,293 27,400 395,872
Funding due from State/ Caltrans 26,133 913,785 2,784,426 3,724,344
Funding due from Federal 2,741,745 - 796,430 3,538,175
Total current assets 16,658,591 1,199,296,878 24,884,448 1,240,839,917
Non-current assets:
Cash - restricted - 19,477,546 - 19,477,546
Investment - unrestricted - 166,418,271 - 166,418,271
Investments - restricted - 1,515,505,943 - 1,515,505,943
Bond prepaid insurance - 16,100 - 16,100
Capital assets, net of accumulated depreciation/ amortization - 76,422,053 1,632,104 78,054,157
Total non-current assets - 1,777,839,913 1,632,104 1,779,472,017
TOTAL ASSETS 16,658,591 2,977,136,791 26,516,552 3,020,311,934
DEFERRED OUTFLOWS OF RESOURCES
Deferred charges - 684,231,213 - 684,231,213
Deferred outflows from pension 896,336 4,003,732 287,662 5,187,730
TOTAL DEFERRED OUTFLOWS OF RESOURCES 896,336 688,234,945 287,662 689,418,943
LIABILITIES
Current liabilities:
Accounts payable 9,271,850 68,989,832 612,861 78,874,543
Accrued interest payable - 107,040,282 - 107,040,282
Due to other funds 773,841 939,126 168,686 1,881,653
Unearned revenue - 88,371,606 - 88,371,606
Retention payable 187,528 1,522,036 - 1,709,564
Long term debt - current - 55,760,000 - 55,760,000
Due to Caltrans - 11,400,898 - 11,400,898
Total current liabilities 10,233,219 334,023,780 781,547 345,038,546
Non-current liabilities:
Unearned revenue/ Patron deposits - 8,824,550 - 8,824,550
Long term debt, net - 9,561,878,394 - 9,561,878,394
Derivative instruments - 390,781,957 - 390,781,957
Net pension liability 1,950,764 9,138,521 617,986 11,707,271
Total non-current liabilities 1,950,764 9,970,623,422 617,986 9,973,192,172
TOTAL LIABILITIES 12,183,983 10,304,647,202 1,399,533 10,318,230,718
DEFERRED INFLOWS OF RESOURCES
Deferred inflows from pension 254,686 1,269,346 76,706 1,600,738
TOTAL DEFERRED INFLOWS OF RESOURCES 254,686 1,269,346 76,706 1,600,738
NET POSITION
Net investment in capital assets - 76,422,053 1,632,104 78,054,157Restricted for:
Capital Projects 266,482 - - 266,482
Operations & Maintenance, under debt covenant - 150,000,000 - 150,000,000
Extraordinary loss reserve, under Caltrans Coop - 50,000,000 - 50,000,000
Unrestricted 4,849,776 (6,916,966,865) 23,695,871 (6,888,421,218)
TOTAL NET POSITION $ 5,116,258 $ (6,640,544,812) $ 25,327,975 $ (6,610,100,579)
The accompanying notes are an integral part of these financial statements.
29

Metropolitan Transportation CommissionStatement of Net Position - Proprietary FundsJune 30, 2016
Business-Type Activities -Enterprise Funds
MTC-
Clipper®Bay Area Toll
Authority
Service Authorityfor Freeways and
ExpresswaysTotal Enterprise
Funds
ASSETS
Current assets:
Cash - unrestricted $ 1,557,870 $ 247,624,637 $ 12,567,332 $ 261,749,839
Cash - restricted 3,559,290 90,623,403 - 94,182,693
Short term investments - unrestricted - 912,051,856 107,440 912,159,296
Due from other funds 5,491,114 - 4,015,495 9,506,609
Accounts receivable 4,547,408 16,574,732 - 21,122,140
Accrued interest - 20,397,332 146 20,397,478
Prepaid expenses and other assets 70,350 727,183 535,552 1,333,085
Funding due from State/ Caltrans 51,346 1,413,232 3,789,071 5,253,649
Funding due from Federal 5,997,049 - 542,602 6,539,651
Total current assets 21,274,427 1,289,412,375 21,557,638 1,332,244,440
Non-current assets:
Cash - restricted - 9,611,948 - 9,611,948
Investments - restricted - 1,513,622,661 - 1,513,622,661
Bond prepaid insurance - 37,568 - 37,568
Capital assets, net of accumulated depreciation/ amortization - 53,581,222 2,943,793 56,525,015
Total non-current assets - 1,576,853,399 2,943,793 1,579,797,192
TOTAL ASSETS 21,274,427 2,866,265,774 24,501,431 2,912,041,632
DEFERRED OUTFLOWS OF RESOURCES
Deferred charges - 719,725,785 - 719,725,785
Deferred outflows from pension 548,328 2,367,701 165,398 3,081,427
TOTAL DEFERRED OUTFLOWS OF RESOURCES 548,328 722,093,486 165,398 722,807,212
LIABILITIES
Current liabilities:
Accounts payable 10,638,474 74,190,439 927,510 85,756,423
Accrued interest payable - 100,799,323 - 100,799,323
Security trade payable - 45,000,000 - 45,000,000
Due to other funds 979,807 2,177,339 35,930 3,193,076
Unearned revenue - 80,885,198 - 80,885,198
Retention payable 65,140 1,387,327 - 1,452,467
Long term debt - current - 54,835,000 - 54,835,000
Due to Caltrans - 25,331,790 - 25,331,790
Total current liabilities 11,683,421 384,606,416 963,440 397,253,277
Non-current liabilities:
Unearned revenue/ Patron deposits - 9,194,424 - 9,194,424
Long term debt, net - 9,301,640,813 - 9,301,640,813
Derivative instruments - 546,320,887 - 546,320,887
Net pension liability 1,518,818 7,121,526 467,999 9,108,343
Total non-current liabilities 1,518,818 9,864,277,650 467,999 9,866,264,467
TOTAL LIABILITIES 13,202,239 10,248,884,066 1,431,439 10,263,517,744
DEFERRED INFLOWS OF RESOURCES
Deferred inflows from pension 378,654 1,832,171 117,670 2,328,495
TOTAL DEFERRED INFLOWS OF RESOURCES 378,654 1,832,171 117,670 2,328,495
NET POSITION
Net investment in capital assets - 53,581,222 2,943,793 56,525,015Restricted for:
Capital projects 3,559,290 - - 3,559,290
Operations & Maintenance, under debt covenant - 150,000,000 - 150,000,000
Extraordinary loss reserve, under Caltrans Coop - 50,000,000 - 50,000,000
Unrestricted 4,682,572 (6,915,938,199) 20,173,927 (6,891,081,700)
TOTAL NET POSITION $ 8,241,862 $ (6,662,356,977) $ 23,117,720 $ (6,630,997,395)
The accompanying notes are an integral part of these financial statements.
30
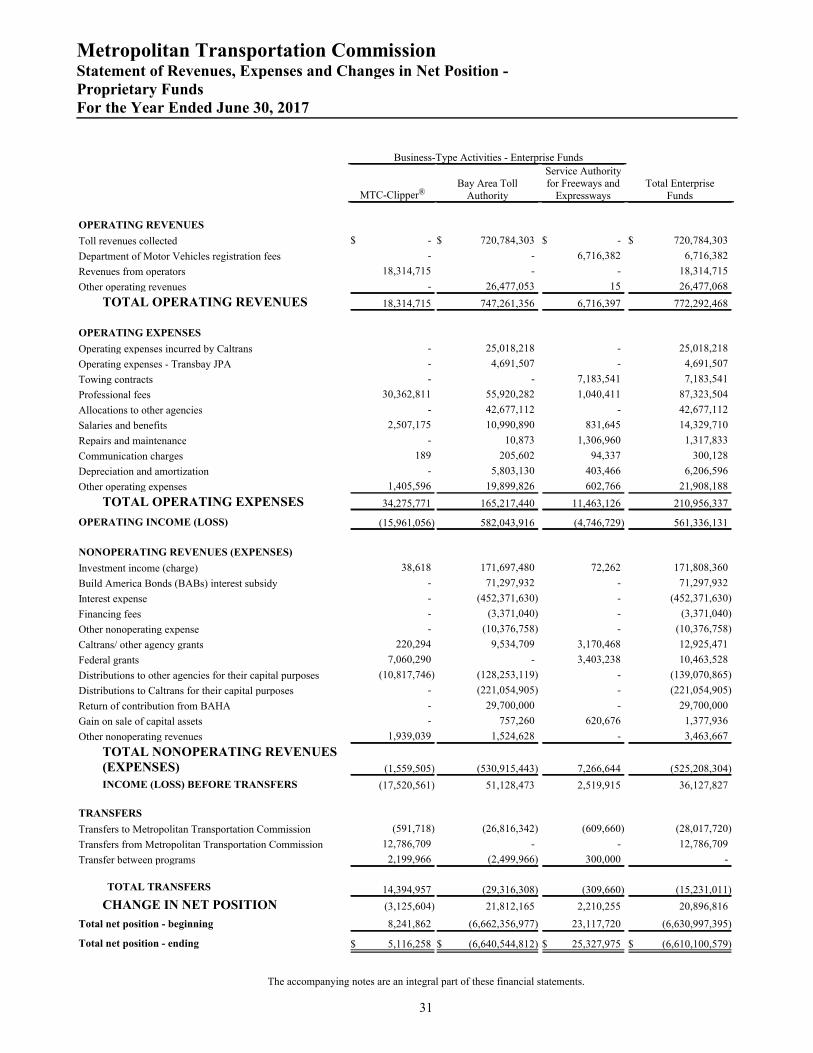
Metropolitan Transportation CommissionStatement of Revenues, Expenses and Changes in Net Position -Proprietary FundsFor the Year Ended June 30, 2017
Business-Type Activities - Enterprise Funds
MTC-Clipper®Bay Area Toll
Authority
Service Authorityfor Freeways and
ExpresswaysTotal Enterprise
Funds
OPERATING REVENUES
Toll revenues collected $ - $ 720,784,303 $ - $ 720,784,303
Department of Motor Vehicles registration fees - - 6,716,382 6,716,382
Revenues from operators 18,314,715 - - 18,314,715
Other operating revenues - 26,477,053 15 26,477,068
TOTAL OPERATING REVENUES 18,314,715 747,261,356 6,716,397 772,292,468
OPERATING EXPENSES
Operating expenses incurred by Caltrans - 25,018,218 - 25,018,218
Operating expenses - Transbay JPA - 4,691,507 - 4,691,507
Towing contracts - - 7,183,541 7,183,541
Professional fees 30,362,811 55,920,282 1,040,411 87,323,504
Allocations to other agencies - 42,677,112 - 42,677,112
Salaries and benefits 2,507,175 10,990,890 831,645 14,329,710
Repairs and maintenance - 10,873 1,306,960 1,317,833
Communication charges 189 205,602 94,337 300,128
Depreciation and amortization - 5,803,130 403,466 6,206,596
Other operating expenses 1,405,596 19,899,826 602,766 21,908,188
TOTAL OPERATING EXPENSES 34,275,771 165,217,440 11,463,126 210,956,337
OPERATING INCOME (LOSS) (15,961,056) 582,043,916 (4,746,729) 561,336,131
NONOPERATING REVENUES (EXPENSES)
Investment income (charge) 38,618 171,697,480 72,262 171,808,360
Build America Bonds (BABs) interest subsidy - 71,297,932 - 71,297,932
Interest expense - (452,371,630) - (452,371,630)
Financing fees - (3,371,040) - (3,371,040)
Other nonoperating expense - (10,376,758) - (10,376,758)
Caltrans/ other agency grants 220,294 9,534,709 3,170,468 12,925,471
Federal grants 7,060,290 - 3,403,238 10,463,528
Distributions to other agencies for their capital purposes (10,817,746) (128,253,119) - (139,070,865)
Distributions to Caltrans for their capital purposes - (221,054,905) - (221,054,905)
Return of contribution from BAHA - 29,700,000 - 29,700,000
Gain on sale of capital assets - 757,260 620,676 1,377,936
Other nonoperating revenues 1,939,039 1,524,628 - 3,463,667
TOTAL NONOPERATING REVENUES(EXPENSES) (1,559,505) (530,915,443) 7,266,644 (525,208,304)
INCOME (LOSS) BEFORE TRANSFERS (17,520,561) 51,128,473 2,519,915 36,127,827
TRANSFERS
Transfers to Metropolitan Transportation Commission (591,718) (26,816,342) (609,660) (28,017,720)
Transfers from Metropolitan Transportation Commission 12,786,709 - - 12,786,709
Transfer between programs 2,199,966 (2,499,966) 300,000 -
TOTAL TRANSFERS 14,394,957 (29,316,308) (309,660) (15,231,011)
CHANGE IN NET POSITION (3,125,604) 21,812,165 2,210,255 20,896,816
Total net position - beginning 8,241,862 (6,662,356,977) 23,117,720 (6,630,997,395)
Total net position - ending $ 5,116,258 $ (6,640,544,812) $ 25,327,975 $ (6,610,100,579)
The accompanying notes are an integral part of these financial statements.
31

Metropolitan Transportation CommissionStatement of Revenues, Expenses and Changes in Net Position-Proprietary FundsFor the Year Ended June 30, 2016
Business-Type Activities - Enterprise Funds
MTC-Clipper®Bay Area Toll
Authority
Service Authorityfor Freeways and
ExpresswaysTotal Enterprise
Funds
OPERATING REVENUES
Toll revenues collected $ - $ 714,132,356 $ - $ 714,132,356
Department of Motor Vehicles registration fees - - 6,582,736 6,582,736
Revenues from operators 17,319,246 - - 17,319,246
Other operating revenues - 22,829,705 7,647 22,837,352
TOTAL OPERATING REVENUES 17,319,246 736,962,061 6,590,383 760,871,690
OPERATING EXPENSES
Operating expenses incurred by Caltrans - 26,375,592 - 26,375,592
Operating expenses - Transbay JPA - 3,817,607 - 3,817,607
Towing contracts - - 7,240,168 7,240,168
Professional fees 29,432,812 49,823,753 509,702 79,766,267
Allocations to other agencies - 36,522,647 - 36,522,647
Salaries and benefits 2,191,202 9,909,270 894,820 12,995,292
Repairs and maintenance - 12,928 406,776 419,704
Communication charges 60 211,250 110,949 322,259
Depreciation and amortization - 4,978,533 459,750 5,438,283
Other operating expenses 1,533,418 18,002,480 748,533 20,284,431
TOTAL OPERATING EXPENSES 33,157,492 149,654,060 10,370,698 193,182,250
OPERATING INCOME (LOSS) (15,838,246) 587,308,001 (3,780,315) 567,689,440
NONOPERATING REVENUES (EXPENSES)
Investment income (charge) 8,526 (175,381,004) 13,684 (175,358,794)
Build America Bonds (BABs) interest subsidy - 71,259,651 - 71,259,651
Interest expense - (443,036,331) - (443,036,331)
Financing fees - (3,248,348) - (3,248,348)
Other nonoperating expense - (709,614) (752) (710,366)
Caltrans/ other agency operating grants 3,667,493 8,919,824 4,900,462 17,487,779
Federal grants 11,594,115 - 2,047,267 13,641,382
Distributions to other agencies for their capital purposes (10,932,825) (154,895,786) (47,155) (165,875,766)
Distributions to Caltrans for their capital purposes - (183,073,540) - (183,073,540)
Capital contribution to Bay Area Headquarters Authority - (925,937) - (925,937)
Other nonoperating revenues 1,675,184 2,200,203 - 3,875,387
TOTAL NONOPERATING REVENUES(EXPENSES) 6,012,493 (878,890,882) 6,913,506 (865,964,883)
INCOME (LOSS) BEFORE TRANSFERS (9,825,753) (291,582,881) 3,133,191 (298,275,443)
TRANSFERS
Transfers to Metropolitan Transportation Commission (979,807) (28,438,660) (1,204,196) (30,622,663)
Transfers from Metropolitan Transportation Commission 13,638,401 - - 13,638,401
Transfer between programs 2,505,083 (2,805,083) 300,000 -
TOTAL TRANSFERS 15,163,677 (31,243,743) (904,196) (16,984,262)
CHANGE IN NET POSITION 5,337,924 (322,826,624) 2,228,995 (315,259,705)
Total net position - beginning, as restated (note 1.C) 2,903,938 (6,339,530,353) 20,888,725 (6,315,737,690)
Total net position - ending $ 8,241,862 $ (6,662,356,977) $ 23,117,720 $ (6,630,997,395)
The accompanying notes are an integral part of these financial statements.
32

Metropolitan Transportation CommissionStatement of Cash Flows - Proprietary FundsFor the Year Ended June 30, 2017
Business-Type Activities - Enterprise Funds
MTC-Clipper®Bay Area Toll
Authority
Service Authorityfor Freeways and
Expressways Total
Cash flows from operating activitiesCash receipts from users and others $ 21,701,937 $ 754,648,104 $ 6,689,213 $ 783,039,254Cash payments to suppliers and employees for services (36,513,253) (139,464,786) (8,768,028) (184,746,067)
Net cash provided by/(used in)operating activities (14,811,316) 615,183,318 (2,078,815) 598,293,187
Cash flows from non-capital financing activitiesCaltrans and other state and local agency grants 20,140 10,737,898 4,161,334 14,919,372Proceeds from issuance of revenue bonds - 320,745,358 - 320,745,358Build America Bonds interest subsidy - 71,317,072 - 71,317,072Interest paid on bonds - (443,168,331) - (443,168,331)Financing fees - (3,360,555) - (3,360,555)Federal grants 10,315,594 - 3,149,410 13,465,004Transfers (to)/from MTC and SAFE 17,051,323 (12,256,291) (212,235) 4,582,797Cost of issuance of revenue bonds - (2,244,960) - (2,244,960)Bond principal payments - (54,835,000) - (54,835,000)Payment for refunding of bonds - 1,513,942 - 1,513,942Distributions to Caltrans - (232,500,771) - (232,500,771)Distributions to other agencies (10,025,325) (154,645,209) (47,155) (164,717,689)Due from BATA - - 300,000 300,000Return of contribution from BAHA - 10,400,000 - 10,400,000
Net cash provided by/(used in)non-capital financing activities 17,361,732 (488,296,847) 7,351,354 (463,583,761)
Cash flows from capital and related financingactivitiesSale of capital assets - 1,634,760 1,528,898 3,163,658Acquisition of capital assets - (31,188,811) - (31,188,811)
Net cash provided by/(used in)capital and related financing activities - (29,554,051) 1,528,898 (28,025,153)
Cash flows from investing activitiesProceeds from maturities of investments - 4,876,107,423 - 4,876,107,423Purchase of investments - (5,100,523,851) - (5,100,523,851)Interest and dividends received 38,618 14,640,923 71,641 14,751,182
Net cash provided by/(used in)investing activities 38,618 (209,775,505) 71,641 (209,665,246)
Net increase/(decrease) in cash 2,589,034 (112,443,085) 6,873,078 (102,980,973)
Balances - beginning of year 5,117,160 347,859,988 12,567,332 365,544,480
Balances - end of year $ 7,706,194 $ 235,416,903 $ 19,440,410 $ 262,563,507
The accompanying notes are an integral part of these financial statements.
33
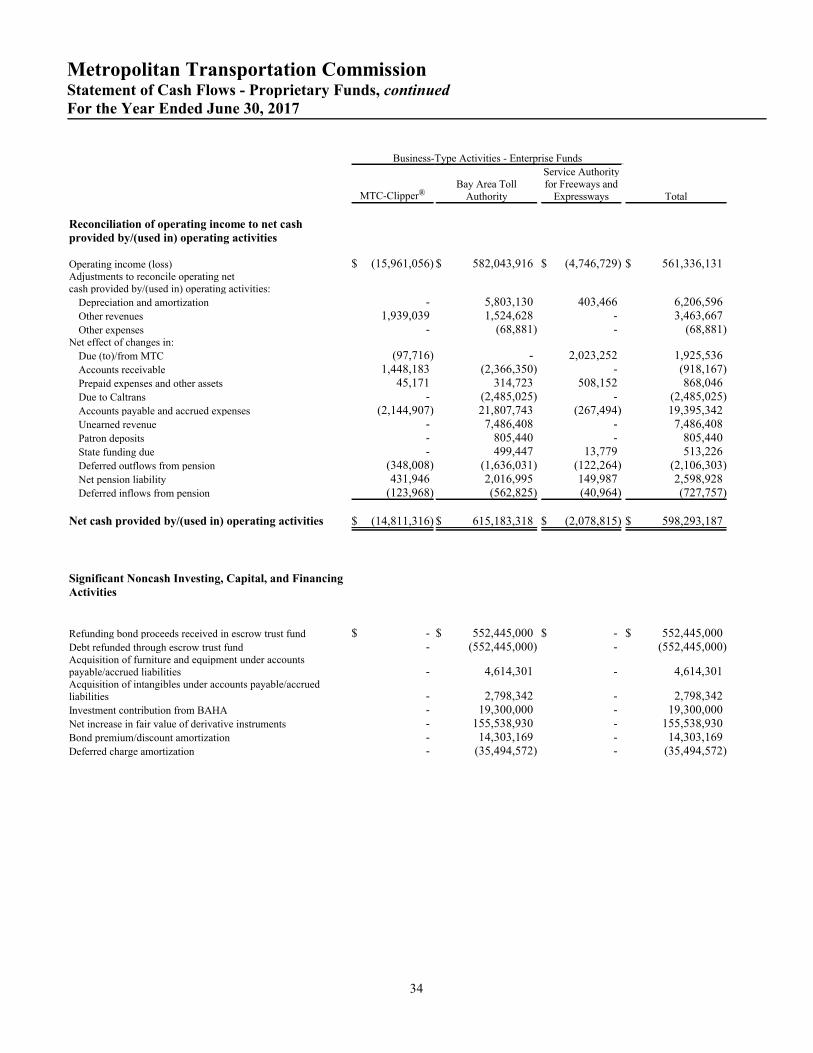
Metropolitan Transportation CommissionStatement of Cash Flows - Proprietary Funds, continuedFor the Year Ended June 30, 2017
Business-Type Activities - Enterprise Funds
MTC-Clipper®Bay Area Toll
Authority
Service Authorityfor Freeways and
Expressways Total
Reconciliation of operating income to net cashprovided by/(used in) operating activities
Operating income (loss) $ (15,961,056) $ 582,043,916 $ (4,746,729) $ 561,336,131Adjustments to reconcile operating netcash provided by/(used in) operating activities:
Depreciation and amortization - 5,803,130 403,466 6,206,596Other revenues 1,939,039 1,524,628 - 3,463,667Other expenses - (68,881) - (68,881)
Net effect of changes in:
Due (to)/from MTC (97,716) - 2,023,252 1,925,536Accounts receivable 1,448,183 (2,366,350) - (918,167)Prepaid expenses and other assets 45,171 314,723 508,152 868,046Due to Caltrans - (2,485,025) - (2,485,025)Accounts payable and accrued expenses (2,144,907) 21,807,743 (267,494) 19,395,342Unearned revenue - 7,486,408 - 7,486,408Patron deposits - 805,440 - 805,440State funding due - 499,447 13,779 513,226Deferred outflows from pension (348,008) (1,636,031) (122,264) (2,106,303)Net pension liability 431,946 2,016,995 149,987 2,598,928Deferred inflows from pension (123,968) (562,825) (40,964) (727,757)
Net cash provided by/(used in) operating activities $ (14,811,316) $ 615,183,318 $ (2,078,815) $ 598,293,187
Significant Noncash Investing, Capital, and FinancingActivities
Refunding bond proceeds received in escrow trust fund $ - $ 552,445,000 $ - $ 552,445,000Debt refunded through escrow trust fund - (552,445,000) - (552,445,000)Acquisition of furniture and equipment under accountspayable/accrued liabilities - 4,614,301 - 4,614,301Acquisition of intangibles under accounts payable/accruedliabilities - 2,798,342 - 2,798,342Investment contribution from BAHA - 19,300,000 - 19,300,000Net increase in fair value of derivative instruments - 155,538,930 - 155,538,930Bond premium/discount amortization - 14,303,169 - 14,303,169Deferred charge amortization - (35,494,572) - (35,494,572)
34
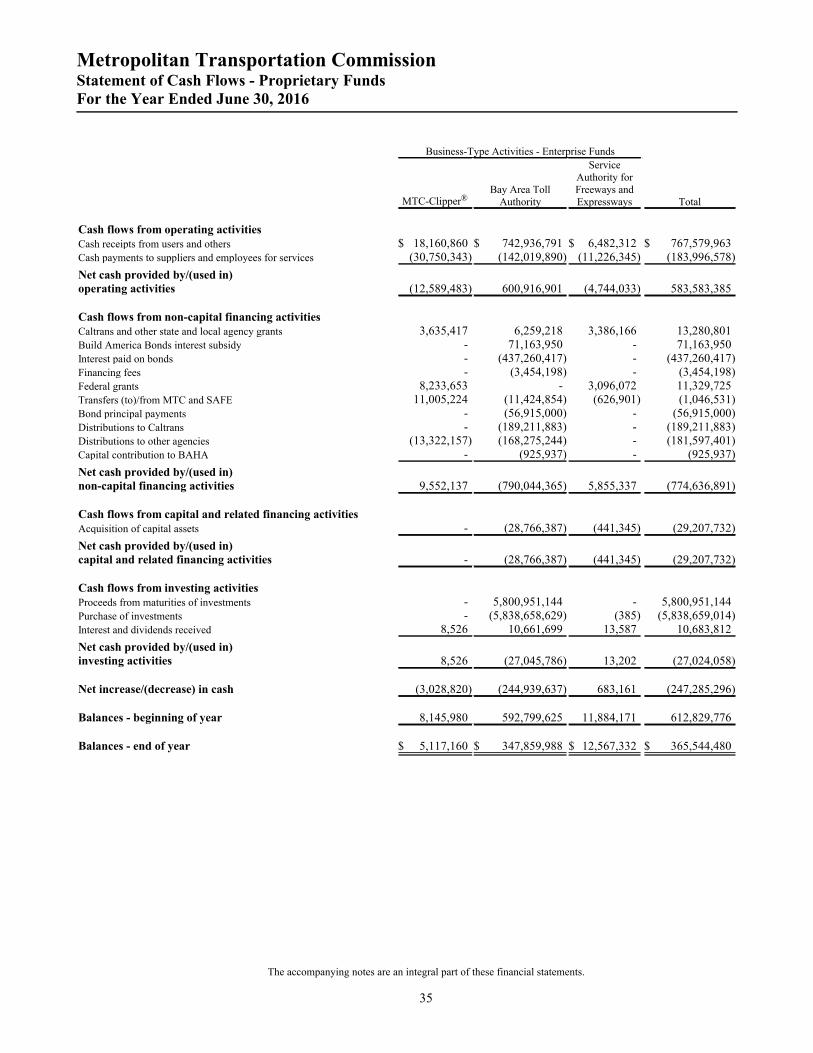
Metropolitan Transportation CommissionStatement of Cash Flows - Proprietary FundsFor the Year Ended June 30, 2016
Business-Type Activities - Enterprise Funds
MTC-Clipper®Bay Area Toll
Authority
ServiceAuthority forFreeways andExpressways Total
Cash flows from operating activitiesCash receipts from users and others $ 18,160,860 $ 742,936,791 $ 6,482,312 $ 767,579,963Cash payments to suppliers and employees for services (30,750,343) (142,019,890) (11,226,345) (183,996,578)
Net cash provided by/(used in)operating activities (12,589,483) 600,916,901 (4,744,033) 583,583,385
Cash flows from non-capital financing activitiesCaltrans and other state and local agency grants 3,635,417 6,259,218 3,386,166 13,280,801Build America Bonds interest subsidy - 71,163,950 - 71,163,950Interest paid on bonds - (437,260,417) - (437,260,417)Financing fees - (3,454,198) - (3,454,198)Federal grants 8,233,653 - 3,096,072 11,329,725Transfers (to)/from MTC and SAFE 11,005,224 (11,424,854) (626,901) (1,046,531)Bond principal payments - (56,915,000) - (56,915,000)Distributions to Caltrans - (189,211,883) - (189,211,883)Distributions to other agencies (13,322,157) (168,275,244) - (181,597,401)Capital contribution to BAHA - (925,937) - (925,937)
Net cash provided by/(used in)non-capital financing activities 9,552,137 (790,044,365) 5,855,337 (774,636,891)
Cash flows from capital and related financing activitiesAcquisition of capital assets - (28,766,387) (441,345) (29,207,732)
Net cash provided by/(used in)capital and related financing activities - (28,766,387) (441,345) (29,207,732)
Cash flows from investing activitiesProceeds from maturities of investments - 5,800,951,144 - 5,800,951,144Purchase of investments - (5,838,658,629) (385) (5,838,659,014)Interest and dividends received 8,526 10,661,699 13,587 10,683,812
Net cash provided by/(used in)investing activities 8,526 (27,045,786) 13,202 (27,024,058)
Net increase/(decrease) in cash (3,028,820) (244,939,637) 683,161 (247,285,296)
Balances - beginning of year 8,145,980 592,799,625 11,884,171 612,829,776
Balances - end of year $ 5,117,160 $ 347,859,988 $ 12,567,332 $ 365,544,480
The accompanying notes are an integral part of these financial statements.
35

Metropolitan Transportation CommissionStatement of Cash Flows - Proprietary Funds, continuedFor the Year Ended June 30, 2016
Business-Type Activities - Enterprise Funds
MTC-Clipper®Bay Area Toll
Authority
ServiceAuthority forFreeways andExpressways Total
Reconciliation of operating income to net cashprovided by/(used in) operating activities
Operating income/(loss) $ (15,838,246) $ 587,308,001 $ (3,780,315) $ 567,689,440Adjustments to reconcile operating income to netcash provided by/(used in) operating activities:
Depreciation and amortization - 4,978,533 459,750 5,438,283Other revenues 1,675,184 2,775,242 - 4,450,426Other expenses - (667,773) - (667,773)
Net effect of changes in:
Due (to)/from MTC 97,716 - (1,100,351) (1,002,635)Accounts receivable (833,570) (2,261,396) 524 (3,094,442)Prepaid expenses and other assets (70,350) (45,684) (13,114) (129,148)Due to Caltrans - 2,475,466 - 2,475,466Accounts payable and accrued expenses 2,474,707 1,303,514 (173,824) 3,604,397Unearned revenue - 5,712,127 - 5,712,127Patron deposits - 627,090 - 627,090State funding due - (878,332) (108,070) (986,402)Deferred outflows from pension (344,393) (1,379,721) (102,002) (1,826,116)Net pension liability 245,205 951,421 72,082 1,268,708Deferred inflows from pension 4,264 18,413 1,287 23,964
Net cash provided by/(used in) operating activities $ (12,589,483) $ 600,916,901 $ (4,744,033) $ 583,583,385
Significant Noncash Investing, Capital, and FinancingActivities
Acquisition of furniture and equipment under accounts payable/accruedliabilities $ - $ 6,737,439 $ - $ 6,737,439Acquisition of intangibles under accounts payable/accrued liabilities - 2,417,796 - 2,417,796Net decrease in fair value of derivative instruments - (187,386,795) - (187,386,795)Bond premium/discount amortization - 14,820,913 - 14,820,913Deferred charge amortization - (36,251,068) - (36,251,068)
The accompanying notes are an integral part of these financial statements.
36

Metropolitan Transportation CommissionStatement of Fiduciary Assets and Liabilities - Agency FundsJune 30, 2017 and 2016
2017 2016
ASSETSCash and investments $ 184,460,544 $ 181,034,595Accounts receivable 7,300,417 8,366,348Interest receivable 60,609 18,499
TOTAL ASSETS $ 191,821,570 $ 189,419,442
LIABILITIESAccounts payable and accrued liabilities $ 99,222,029 $ 88,033,891Due to other governments 92,599,541 101,385,551
TOTAL LIABILITIES $ 191,821,570 $ 189,419,442
See Schedule 13, Combining Statement of Changes in Assets and Liabilities by Participant - Agency Funds in OtherSupplementary Information section for details.
The accompanying notes are an integral part of these financial statements.
37

Metropolitan Transportation CommissionFinancial Statements for the years ended June 30, 2017 and 2016Notes to Financial Statements
1. SUMMARY OF SIGNIFICANT ACCOUNTING POLICIES
A. Reporting Entity
The Metropolitan Transportation Commission (MTC) was established under the laws of the State ofCalifornia in Government Code Section 66500 et seq. in 1970 to provide comprehensive regionaltransportation planning for the nine counties that comprise the San Francisco Bay Area, which includes theCity and County of San Francisco and the counties of Alameda, Contra Costa, Marin, Napa, San Mateo,Santa Clara, Solano and Sonoma.
MTC’s principal sources of revenue to fund its governmental operations include state grants, a percentageof the sales tax revenues collected in the nine Bay Area counties under the State TransportationDevelopment Act of 1971 (TDA) and grants from the U.S. Department of Transportation, Office of theSecretary of Transportation (U.S. DOT), including the Federal Highway Administration (FHWA), FederalTransit Administration (FTA) and other federal, state and local agencies. These are the principal sources ofrevenues susceptible to accrual under the modified accrual method described later within this note. Feesare the primary source of revenue for the proprietary funds described in this note.
The accompanying financial statements present MTC, its blended component units, and its discretelypresented component unit. MTC is the primary government as defined in Governmental AccountingStandards Board (GASB) Statement No. 14, The Financial Reporting Entity, as amended. Its governingboard is separately appointed, and it is fiscally independent of other governments. The blended componentunits discussed below are included as part of the reporting entity because their boards are substantially thesame as the primary government’s board, and the management of the primary government has theoperational responsibility for the component units. The blended component units, although legallyseparate entities are, in substance, part of MTC’s operations, and financial data from these units arecombined with financial data of MTC in preparing the government-wide financial statements. The MTCboard also serves as the governing body for all its blended component units.
MTC has two discretely presented component units – Bay Area Infrastructure Financing Authority(BAIFA) and Bay Area Headquarters Authority (BAHA). There was no activity in BAIFA for fiscal years2017, 2016, and 2015, nor assets, liabilities, nor net position at June 30, 2017, 2016, and 2015.Accordingly, only BAHA is presented in a separate column on the face of the government-wide financialstatements in the far right column.
Blended componet units
i.) Bay Area Toll Authority
The Bay Area Toll Authority (BATA) is a public agency created by Senate Bill 226 effective January 1,1998 with responsibilities for the disposition of toll revenues collected from the seven State owned tollbridges in the San Francisco Bay Area. The bridges are the Antioch Bridge, Benicia-Martinez Bridge,Carquinez Bridge, Dumbarton Bridge, Richmond-San Rafael Bridge, San Francisco-Oakland BayBridge and San Mateo-Hayward Bridge. BATA is a proprietary fund as it generates revenue from tollbridge receipts and its debt is collateralized solely by toll revenue as more fully described in Note 5,Long-Term Debt.
38
Metropolitan Transportation CommissionFinancial Statements for the years ended June 30, 2017 and 2016Notes to Financial Statements
Pursuant to Senate Bill 226, a five year Cooperative Agreement was signed on March 2, 1998 definingthe roles and responsibilities of BATA and Caltrans with respect to the collection and disposition of tollbridge revenues. The current ten-year agreement was signed in 2006 and amended and restated in June2011 with an expiration of July, 2020.
Under the terms of the Cooperative Agreement, BATA has responsibility for cash management andelectronic toll collection while Caltrans’ responsibilities include the ownership, operation andmaintenance of the bridges. See Note 1S for information on Caltrans' operating expenditures.
ii.) MTC Service Authority for Freeways and Expressways (MTC SAFE)
In June 1988, MTC SAFE was created to receive fees collected by the Department of Motor Vehiclespursuant to Streets and Highways Code Section 2555 et seq., which permits the collection of up to $1per registered vehicle in participating counties. These fees represent charges for services rendered toexternal users. MTC SAFE is responsible for administering a freeway motorist aid system in theparticipating counties, referred to as the Call Box program. The following counties are participants inthe MTC SAFE: Alameda, Contra Costa, Marin, Napa, San Francisco, San Mateo, Santa Clara, Solanoand Sonoma.
In 1993, MTC SAFE’s responsibilities were expanded, pursuant to a jointly adopted Memorandum ofUnderstanding between MTC SAFE, Caltrans, and the California Highway Patrol (CHP), to participatein the development and implementation of a Freeway Service Patrol (FSP) program in the SanFrancisco Bay Area. The three principal sources of funding for the FSP program are state-legislatedgrants, federal grants, and funding from federal traffic mitigation programs.
Discretely presented component units
A component unit is a legally separate organization for which elected officials of the primarygovernment are financially accountable. It can also be an organization whose relationship with theprimary government is such that exclusion would cause the reporting entity’s financial statements to bemisleading or incomplete. MTC has two discretely presented component units, BAIFA and BAHA.
iii.) Bay Area Infrastructure Financing Authority (BAIFA)
BAIFA was established in August 2006 pursuant to the California Joint Exercise of Powers Act (Act),consisting of Sections 6500 through 6599.2 of the California Government Code which authorizes toBAIFA the joint exercise powers common to MTC and BATA. There are six Commissioners on thegoverning board for BAIFA. BAIFA's board consists of MTC and BATA Oversight Committee chairsand four Commissioners. BAIFA is authorized to plan, obtain funding, issue debt and apply fundsreceived to pay debt service on bonds issued by BAIFA to finance or refinance public transportationand related capital improvements projects. There was no activity in BAIFA for fiscal years 2017, 2016,and 2015, nor assets, liabilities, nor net position at June 30, 2017, 2016, and 2015.
39

Metropolitan Transportation CommissionFinancial Statements for the years ended June 30, 2017 and 2016Notes to Financial Statements
iv.) Bay Area Headquarters Authority (BAHA)
BAHA was established in September 2011 pursuant to the California Joint Exercise of Powers Act,consisting of Sections 6500 through 6599.2 of the California Government Code, which authorizesBAHA to exercise powers common to MTC and BATA. There are six Commissioners on thegoverning board for BAHA. BAHA's board consists of four MTC Commissioners and two BATACommissioners. BAHA is authorized to plan, acquire, and develop its office space and facilitiesdirectly or through contract. On October 14, 2011 BAHA acquired property located at 375 Beale Street,in San Francisco, California for the purpose of establishing a Bay Area Regional Headquarters forMTC, the Bay Area Air Quality Management District, and the Association of Bay Area Governments.The three agencies moved to the new building, Bay Area Metro Center (BAMC), in fiscal year 2016.BAHA is presented as a proprietary fund in the discretely presented component unit column of thegovernment-wide financial statements because it does not meet the criteria for blending under theprovisions of GASB Statement No. 61, The Financial Reporting Entity: Omnibus- an amendment ofGASB Statements No. 14 and No. 39. Requests for separately issued financial statements for BAHAshould be addressed to the Treasurer and Auditor, Bay Area Headquarters Authority, 375 Beale Street,Suite 800, San Francisco, CA 94105.
B. Government-Wide and Fund Financial Statements
Basis of presentation - government-wide statements
The government-wide financial statements (i.e. Statement of Net Position and Statement of Activities)report information on all non-fiduciary activities of MTC and its component units. The effect of interfundactivity has been eliminated from the government-wide financial statements. However, interfund servicesprovided and used are not eliminated in the process of consolidation. Governmental activities, whichnormally are supported by taxes and intergovernmental revenue, are reported separately from business-typeactivities which rely to a significant extent on fees and charges for support.
Basis of presentation - fund financial statements
Separate financial statements are provided for governmental funds, proprietary funds and fiduciary fundseven though the latter are excluded from the government-wide financial statements. Individualgovernmental funds and individual enterprise funds are reported as separate columns in the fund financialstatements.
The government reports the following funds:
i.) MTC General Fund
MTC General Fund is used to account for financial resources not accounted for or reported in anotherfund.
ii.) MTC Special Revenue Funds
Special revenue funds are used to account for specific revenue sources that are restricted or committedto expenditures for specified purposes other than debt service or capital projects. MTC maintainsvarious special revenue funds as follows:
40
Metropolitan Transportation CommissionFinancial Statements for the years ended June 30, 2017 and 2016Notes to Financial Statements
Major Funds
AB 664 Net Toll Revenue Reserve Fund – Under Section 30884 (a) of the Streets and HighwaysCode, the AB 664 Net Toll Revenue Fund receives 16 percent of the base toll revenues collected on thethree southern bridges, San Francisco-Oakland Bay Bridge, Dumbarton Bridge and San Mateo-Hayward Bridge. These funds are allocated by policy, 70 percent to East Bay and 30 percent to WestBay, to agency capital projects that further the development of public transit in the vicinity of the threesouthern bridges.
State Transit Assistance (STA) Fund – State Transit Assistance Funds are used for transit andparatransit operating assistance, transit capital projects, and regional transit coordination. STA fundsare derived from the state sales tax on fuel and apportioned by state statute between population-basedand revenue-based accounts. PUC Section 99313 defines population-based funds and PUC Section99314 defines revenue-based funds.
Rail Reserves Fund – Under Section 30914 (a.4) of the Streets and Highways Code, the Rail ReservesFund receives 21 percent of base toll revenues collected on the San Francisco-Oakland Bay Bridge.These funds are allocated exclusively for rail transit capital extension and improvement projects thatare designed to reduce vehicular traffic congestion on the San Francisco-Oakland Bay Bridge. 70percent of the Rail Reserves are allocated for East Bay rail improvements and the remaining 30 percentfor West Bay rail improvements.
BART Car Exchange Fund – Funds deposited are restricted to the purpose of BART car replacementprojects. MTC and BART established the funding exchange program whereby MTC will programFederal Funds for current BART projects with BART depositing an equal amount of local funds into anaccount set aside for the BART car fleet replacement. The project began in fiscal year 2013.
Non-major Funds
Transit Reserve Fund – MTC maintains a Transit Reserve Fund pursuant to Regional Measure 1. Thecalculation of the transit reserves is set forth in Section 30913 (b) of the Streets and Highways Code asone third of two percent of base toll revenues collected on all seven Bay Area state-owned bridges.
Caltrans also has a Cooperative Agreement with BATA and MTC whereby Caltrans transfers statefunding to MTC for ferry operations and other transit/bicycle projects.
Exchange Fund – Exchange Funds are used for MTC projects adopted as part of its SurfaceTransportation Program (STP) and Congestion Mitigation and Air Quality Improvement (CMAQ)program. The restriction is established by Commission resolution.
Feeder Bus Fund – Funds from local agencies are used to reimburse various transit operators foroperating the BART Express Bus Program.
Proposition 1B Fund – This fund includes revenue from the Caltrans Public TransportationModernization Improvement and Service Enhancement Account (PTMISEA) grant. This is a grantfunded by Proposition 1B Regional Transit Connectivity Program funds. MTC’s Hub Signage Project,which improves signage at major transportation hubs, is the only project in this fund for fiscal years2017 and 2016.
MTC Capital Projects Fund – MTC Capital Projects Fund, which includes the buildingimprovement reserve, is used to account for and report the financial resources that are restricted,committed, or assigned to expenditures for capital outlays, including the acquisition and developmentof capital facilities and other capital assets.
41

Metropolitan Transportation CommissionFinancial Statements for the years ended June 30, 2017 and 2016Notes to Financial Statements
In fiscal years 2017 and 2016, the following funds are considered non-major: Transit Reserve Fund,Exchange Fund, Feeder Bus Fund, Proposition 1B Fund and Capital Projects Fund. The followingfunds are considered major governmental funds: MTC General Fund, STA Fund, Rail Reserves Fund,AB 664 Net Toll Revenue Reserve Fund, and BART Car Exchange Fund. The balance sheet andstatements of revenues, expenditures and changes in fund balances and budget to actual statements ofrevenues and change in fund balances are presented for these funds.
iii.) MTC Enterprise Fund - Clipper®
In July 2010, MTC assumed responsibility for operating the Clipper® smart card program under theMemorandum of Understanding with seven Bay Area transit organizations. Clipper® smart cardoperating and capital costs are incurred by MTC's Clipper® fund. MTC Clipper® seeks payment fromparticipating transit operators for service provided related to the operations and capital expenditures ofthis program. The cash account and patron liability is held as an agency fund. See Note 1.B (iv) forinformation on the Clipper® program agency fund.
iv.) MTC Fiduciary Funds
MTC reports the following fiduciary funds to account for assets held by MTC in a trustee capacity or asan agent. These agency funds are custodial in nature, do not have a measurement of results ofoperations and they are on the accrual basis of accounting.
AB 1107 Fund – BART Half-Cent Sales Tax (AB 1107) funds are used to account for the activities ofthe AB 1107 Program. AB 1107 funds are sales tax revenue collected under the ordinance adoptedpursuant to Section 29140 of the Public Utilities Code. These funds are administered by MTC forallocation to the Alameda-Contra Costa Transit District (AC Transit) and the City and County of SanFrancisco for its municipal railway system (MUNI) on the basis of regional priorities established byMTC.
Transportation Development Act (TDA) Program Fund – Funds are used to account for theactivities of the TDA Program. In accordance with state regulations and memoranda of understandingwith operators and local municipalities, MTC is responsible for the administration of sales tax revenuederived from the TDA.
Clipper® Program Fund – These agency funds are used to reimburse transit operators for rides taken
by patrons using the Clipper® smart card.
C. Measurement Focus, Basis of Accounting and Financial Statements Presentation
The government-wide and proprietary financial statements are reported using the economicresources measurement focus and the accrual basis of accounting. Revenues are recorded when earnedand expenses are recorded when incurred, regardless of the timing of related cash flows.
Governmental fund financial statements are reported using the current financial resources measurementfocus and the modified accrual basis of accounting. Under the modified accrual basis of accounting,revenues are recognized as soon as they are both measurable and available. Revenues are considered to beavailable when they are collectable within the current period or soon enough afterwards to pay liabilitiesof the current period. All revenue sources included in the governmental funds, namely federal, state andlocal grants as well as sales tax revenue, utilize this revenue recognition methodology.
42

Metropolitan Transportation CommissionFinancial Statements for the years ended June 30, 2017 and 2016Notes to Financial Statements
New Accounting Pronouncements
GASB Statement No. 72, Fair Value Measurement and Application, provides guidance for determining afair value measurement for financial reporting purposes and applying fair value to certain investments anddisclosures related to all fair value measurements. This standard was issued in February 2015 and iseffective for reporting periods beginning after June 15, 2015. The standard was adopted by MTC for fiscalyear ended June 30, 2016. The adoption of this standard by MTC resulted in a change to the methodologyused by management to calculate the fair value of investments derivatives to incorporate a credit valuationadjustment at June 30, 2016 and additional disclosures. GASB Statement No. 72 provides an exceptionnot to restate prior year information if it is impractical to do so. Given the difficulty in obtaining relevantdata as of earlier dates, investment derivatives as of June 30, 2015 were not restated in accordance withGASB Statement No. 72, but the cumulative effect of applying GASB Statement No. 72 was reported asrestatement of beginning net position on July 1, 2015. For additional information on the impact ofadoption of GASB Statement No. 72 on the financial statements, see Note 3.B.
GASB Statement No. 73, Accounting and Financial Reporting for Pensions and Related Assets That AreNot within the Scope of GASB Statement 68, and Amendments to Certain Provisions of GASB Statements67 and 68, extends the approach to accounting and financial reporting established in Statement 68 to allpensions, with modifications as necessary to reflect that for accounting and financial reporting purposes,any assets accumulated for pensions that are provided through pension plans that are not administeredthrough trusts that meet the criteria specified in Statement No. 68 should not be considered pension planassets. It also clarifies the application of certain provisions of Statements No. 67 and 68. This standardwas issued in June 2015 and is effective for reporting periods beginning after June 15, 2015. This standarddid not have any impact on MTC's financial statements.
GASB Statement No. 74, Financial Reporting for Postemployment Benefit Plans Other Than PensionPlans, replaces Statement No. 43, Financial Reporting for Postemployment Benefit Plans Other ThanPension Plans, as amended, and Statement No. 57, Other Post Employment Benefit (OPEB) Measurementsby Agent Employers and Agent Multiple-Employer Plans. It also includes requirements for those OPEBplans in Statement No. 25, Financial Reporting for Defined Benefit Pension Plans and Note Disclosuresfor Defined Contribution Plans, as amended, Statement No. 43, Financial Reporting for PostemploymentBenefit Plans Other Than Pension Plans, and Statement No. 50, Pension Disclosures. This standardestablishes new accounting and financial reporting requirements for OPEB plans. This standard wasissued in June 2015 and is effective for reporting periods beginning after June 15, 2016. This standard didnot have any impact on MTC's financial statements.
GASB Statement No. 75, Accounting and Financial Reporting for Postemployment Benefits Other ThanPensions, replaces the requirements of Statements No. 45, Accounting and Financial Reporting byEmployers for Postemployment Benefits Other than Pensions, as amended, and No. 57, OPEBMeasurements by Agent Employers and Agent Multiple-Employer Plans. This standard establishes newaccounting and financial reporting requirements for those governments whose employees are providedwith other post employment benefits (OPEB), as well as for certain nonemployer governments that have alegal obligation to provide financial support for OPEB provided to the employees of other entities. Thisstandard was issued in June 2015 and is effective for reporting periods beginning after June 15, 2017.Management is currently evaluating the effect of this standard on MTC's financial statements.
GASB Statement No. 76, The Hierarchy of Generally Accepted Accounting Principles for State and LocalGovernments, reduces the GAAP hierarchy to two categories of authoritative GAAP and addresses the useof authoritative and nonauthoritative literature in the event that the accounting treatment for a transaction
43

Metropolitan Transportation CommissionFinancial Statements for the years ended June 30, 2017 and 2016Notes to Financial Statements
or other event is not specified within a source of authoritative GAAP. This standard was issued in June2015 and is effective for reporting periods beginning after June 15, 2015 and should be appliedretroactively. The standard was adopted by MTC for fiscal year ended June 30, 2016. The adoption ofthis standard did not have any impact on MTC's financial statements.
GASB Statement No. 77, Tax Abatement Disclosures, defines a tax abatement as resulting from anagreement between a government and an individual or entity in which the government promises to forgotax revenues and the individual or entity promises to subsequently take a specific action that contributes toeconomic development or otherwise benefits the government or its citizens. This statement requiresgovernments that enter into tax abatement agreements to disclose the following information about theagreements: 1) brief descriptive information, such as the tax being abated, the authority under which taxabatements are provided, eligibility criteria, the mechanism by which taxes are abated, provisions forrecapturing abated taxes, and the types of commitments made by abatement recipients, 2) the gross dollaramount of taxes abated during the period, and 3) commitments made by a government, other than to abatetaxes, as part of a tax abatement agreement. The requirements of this Statement are effective for fiscalyears beginning after December 15, 2015. This standard did not have any impact on MTC's financialstatements.
GASB Statement No. 78, Pensions Provided Through Certain Multiple-employer Defined Benefit PensionPlans, amends the scope and applicability of GASB Statement No. 68 to exclude pensions provided toemployees of state or local governmental employers through a cost-sharing multiple-employer definedbenefit pension plan that: 1) is not a state or local governmental pension plan, 2) is used to provide definedbenefit pensions both to employees of state or local governmental employers and to employees ofemployers that are not state or local governmental employers, and 3) has no predominant state or localgovernmental employer (either individual or collectively with other states or local governmental employersthat provide pensions through the pension plan). This statement establishes requirements for recognitionand measurement of pension expense, expenditures, and liabilities; note disclosures; and requiredsupplementary information for pensions that have the characteristics described above. The requirements ofthis statement are effective for fiscal years beginning after December 15, 2015. This standard did not haveany impact on MTC's financial statements.
GASB Statement No. 79, Certain External Investment Pools and Pool Participants, establishes criteria foran external investment pool to qualify for making the election to measure all of its investments atamortized cost for financial reporting purposes. An external investment pool qualifies for that reporting ifit meets all of the applicable criteria established in this statement. This statement establishes additionalnote disclosure requirements for qualifying external investment pools that measure all of their investmentsat amortized cost for financial reporting purposes and for governments that participate in those pools. Therequirements of this statement are effective for reporting periods beginning after June 15, 2015, except forcertain provisions on portfolio quality, custodial credit risk, and shadow pricing. Those provisions areeffective for reporting periods beginning after December 15, 2015. This standard did not have any impacton MTC's financial statements.
GASB Statement No. 80, Blending Requirements for Certain Component Units - An Amendment of GASBStatement No. 14, amends the blending requirements for the financial statement presentation of componentunits of all state and local governments. The additional criterion requires blending of a component unitincorporated as a not-for-profit corporation in which the primary government is the sole corporate member.The requirements of this statement are effective for reporting periods beginning after June 15, 2016. Thisstandard did not have any impact on MTC's financial statements.
44

Metropolitan Transportation CommissionFinancial Statements for the years ended June 30, 2017 and 2016Notes to Financial Statements
GASB Statement No. 82, Pension Issues - An Amendment of GASB Statement No. 67, No. 68, and No. 73,addresses issues regarding (1) the presentation of payroll-related measures in required supplementaryinformation (RSI), (2) the selection of assumptions and the treatment of deviations from the guidance in anActuarial Standard of Practice for financial reporting purposes, and (3) the classification of payments madeby employers to satisfy employee (plan member) contribution requirements. The requirements of thisstatement are effective for reporting periods beginning after June 15, 2016, except for the requirements ofthis statement for the selection of assumptions in a circumstance in which an employer's pension liability ismeasured as of a date other than the employer's most recent fiscal year-end. In that circumstance, therequirements for the selection of assumptions are effective for that employer in the first reporting period inwhich the measurement date of the pension liability is on or after June 15, 2017. This standard wasadopted early by MTC for fiscal year ended June 30, 2016. The adoption of this standard changed thepresentation of payroll-related measures from covered-employee payroll to covered payroll in the requiredsupplementary information (RSI).
GASB Statement No. 83, Certain Asset Retirement Obligations, addresses requirements regarding theretirement of certain tangible assets for all state and local governments. The requirements of this statementare effective for reporting periods beginning after June 15, 2018. Management is currently evaluating theeffect of this standard on MTC's financial statements.
GASB Statement No. 84, Fiduciary Activities, establishes criteria for identifying fiduciary activities of allstate and local governments. The requirements of this statement are effective for reporting periodsbeginning after December 15, 2018. Management is currently evaluating the effect of this standard onMTC's financial statements.
GASB Statement No. 85, Omnibus 2017, addresses various practice issues including related blendingcomponent units, goodwill, fair value measurement and application, and postemployment benefits (OPEB).The requirements of this statement are effective for reporting periods beginning after June 15, 2017.Management is currently evaluating the effect of this standard on MTC's financial statements.
GASB Statement No. 86, Certain Debt Extinguishment Issues, provides guidance to improve consistencyin accounting and financial reporting for in-substance defeasance of debt. The requirements of thisstatement are effective for reporting periods beginning after June 15, 2017. Management is currentlyevaluating the effect of this standard on MTC's financial statements.
GASB Statement No. 87, Leases, is to better meet the information needs of financial statement users byimproving accounting and financial reporting for leases by governments. It requires recognition of certainlease assets and liabilities for leases that previously were classified as operating leases and recognized asinflows of resources or outflows of resources based on the payment provisions of the contract. Therequirements of this statement are effective for reporting periods beginning after December 15, 2019.Management is currently evaluating the effect of this standard on MTC's financial statements.
45

Metropolitan Transportation CommissionFinancial Statements for the years ended June 30, 2017 and 2016Notes to Financial Statements
D. Budgetary Accounting
Enabling legislation and adopted policies and procedures provide that MTC and its operating entitiesapprove an annual budget by June 30 of each year. Annual budgets are adopted on a basis consistent withaccounting principles generally accepted in the United States of America for all governmental andproprietary funds. MTC also approves a life-to-date project budget whenever new projects are approved.MTC presents a preliminary budget in May and a final budget in June. MTC conducts hearings fordiscussion of the proposed annual budget and at the conclusion of the hearings, but not later than June 30,adopts the final budget for the following fiscal year. The appropriated budget is prepared by fund, projectand expense type. The legal level of control is at the fund level and the governing body must approveadditional appropriations. Budget amendments are recommended when needed. Operating appropriationslapse at fiscal year-end.
MTC employs the following practices and procedures in establishing budgetary data as reflected in thebasic financial statements:
Annual budgets are adopted on the modified accrual basis of accounting for governmental fund types.
These include the general fund, plus major and non-major special revenue funds. Capital budgets are
adopted on a project life-to-date basis.
Annual budgets are adopted on the accrual basis for the proprietary fund types.
E. Encumbrances
Encumbrance accounting is employed in the general, capital project and special revenue funds. Under thismethod, purchase orders, contracts, memoranda of understanding and other commitments outstanding atyear-end do not constitute expenditures or liabilities. GASB Statement No. 54, Fund Balance Reportingand Governmental Fund Type Definitions, provides additional guidance on the classification within thefund balances section of amounts that have been encumbered. Encumbrances of balances within thegeneral and capital project funds are classified as committed and are included in the "transportationprojects" category. These encumbrances, along with encumbrances of balances in funds that are restricted,committed or assigned, are not separately classified in the financial statements, and are summarized asfollows:
2017 2016
General Fund $ 2,190,792 $ 3,580,727AB 664 Net Toll Revenue 25,417,180 56,906,468State Transit Assistance Funds 5,081,046 3,520,065Rail Reserves 44,889,597 80,694,418Non-major Governmental Funds 3,283,004 3,125,722
46

Metropolitan Transportation CommissionFinancial Statements for the years ended June 30, 2017 and 2016Notes to Financial Statements
F. Net Position
Net position, presented in the government-wide financial statements, represents the residual interest inassets plus deferred outflows after liabilities and deferred inflows are deducted. MTC's net positionconsists of three sections: Net investment in capital assets, as well as restricted and unrestricted. Netposition is reported as restricted when constraints are imposed by creditors, grantors, contributors, laws orregulations or other governments or enabling legislation.
Restricted net position consists of amounts restricted for capital projects and other purposes as follows:
2017 2016
Capital Projects $481,090,437 $467,639,601
Other Purposes:Operations & Maintenance reserve, under debt covenant $150,000,000 $150,000,000Extraordinary loss reserve, under Caltrans Cooperative Agreement 50,000,000 50,000,000Net OPEB asset 8,285,618 7,384,385STA reserve 49,194 158,050
Total Other Purposes $208,334,812 $207,542,435
G. Fund Balances
Fund balances, presented in the governmental fund financial statements, represent the difference betweenassets, liabilities and deferred inflows and outflows reported in a governmental fund. GASB Statement No.54, Fund Balance Reporting and Governmental Fund Type Definitions, establishes criteria for classifyingfund balances into specifically defined classifications and clarifies definitions for governmental funds.GASB Statement No. 54 requires that the fund balances be classified into categories based upon the typeof restrictions imposed on the use of funds.
MTC evaluated each of its funds at June 30, 2017 and 2016 and classified fund balances into the followingfive categories:
Nonspendable – Items that cannot be spent because they are not in spendable form, such as prepaid
items, are reported in the general fund.
Restricted – Items that are restricted by external parties such as creditors or imposed by grants, law or
legislation. MTC has legislative restrictions on amounts collected for various transportation and rail
projects included in the AB 664 Toll Revenue, STA, BART Car Exchange, Transit Reserve, Feeder
Bus, Rail Reserves, Proposition 1B and Capital Projects funds.
Committed – Items that have been committed by formal action by the entity's highest level of decision-
making authority, which MTC considers to be Commission resolutions. This level of approval has been
reported in the general fund, capital projects fund and the exchange fund.
Assigned – Items that have been allocated by committee action where the government's intent is to use
the funds for a specific purpose. MTC considers this level of authority to be the Administration
Committee. This restriction is currently not used on MTC's fund balances.
47

Metropolitan Transportation CommissionFinancial Statements for the years ended June 30, 2017 and 2016Notes to Financial Statements
Unassigned – This category is the residual classification for the general fund. This category represents
fund balance that has not been assigned to other funds and that has not been restricted, committed or
assigned to specific purposes within the general fund. The general fund is the only fund that reports a
positive unassigned fund balance. In other governmental funds, if expenditures exceed amounts
restricted, committed, or assigned, it may be necessary to report a negative unassigned fund balance.
MTC reduces restricted amounts first when expenditures are incurred for purposes for which bothrestricted and unrestricted (committed, assigned, or unassigned) amounts are available. MTC reducescommitted amounts first, followed by assigned amounts, and then unassigned amounts when expendituresare incurred for purposes for which amounts in any of those unrestricted fund balance classifications couldbe used.
GASB Statement No. 54 also clarifies definitions for governmental fund types. MTC evaluated each of itsfunds at June 30, 2017 and 2016 and provides additional disclosure information with respect to the purposeof each fund (see Note 1.B.).
H. Cash and Investments
MTC applies the provisions of GASB Statement No. 31, Accounting and Financial Reporting for CertainInvestments and External Investment Pools, as amended (including by GASB Statement No. 72), whichgenerally requires investments to be recorded at fair value with the difference between cost and fair valuerecorded as an unrealized gain or loss. Investments are stated at fair value based upon quoted marketprices. MTC reports its money market securities and cash equivalents at amortized cost. This ispermissible under this standard provided those investments have a remaining maturity at the time ofpurchase of one year or less and that the fair value of those investments is not significantly affected by thecredit standing of the issuer or other factors. Net increases or decreases in the fair value of investments areshown in the Statements of Revenues, Expenditures and Changes in Fund Balance for all governmentalfund types and in the Statements of Revenues, Expenses and Changes in Net Position for the proprietaryfunds. Accounting for derivative investments is described in Note 1.T. Investments purchased, but not yetsettled in cash, are included in security trade payables in the statement of net position.
MTC invests its available cash under the prudent investor rule. The prudent investor rule states, inessence, that “in investing … property for the benefit of another, a trustee shall exercise the judgment andcare, under the circumstance then prevailing, which people of prudence, discretion, and intelligenceexercise in the management of their own affairs.” This policy affords MTC a broad spectrum of investmentopportunities as long as the investment is deemed prudent and is authorized under the CaliforniaGovernment Code Sections 53600, et seq. Investments allowed under MTC investment policy include thefollowing:
Securities of the U.S. Government or its agencies
Securities of the State of California or its agencies
Certificates of deposit issued by a nationally or state chartered bank
Authorized pooled investment programs
Commercial paper – Rated “A1” or “P1”
Corporate notes – Rated “A” or better
Municipal bonds
48
Metropolitan Transportation CommissionFinancial Statements for the years ended June 30, 2017 and 2016Notes to Financial Statements
Mutual funds – Rated “AAA”
Other investment types authorized by state law and not prohibited in MTC's investment policy.
Cash
MTC considers all balances in demand deposit accounts to be cash. Deposits in the cash management poolof the County of Alameda are presented as cash as they are available for immediate withdrawal or depositat any time without prior notice or penalty and there is no significant risk of principal. MTC classifies allother highly liquid cash equivalents as short-term investments.
Restricted Cash
Certain cash is restricted as these assets are either for a specific purpose, escrow accounts with the balancebeing refunded upon project completion, prepaid customer deposits for the FasTrak® program or fundsrestricted for debt service, or other legal restrictions.
Restricted Investments
Certain investments are classified as restricted on the Statement of Net Position because they are either fora specific purpose, or their use is limited externally by applicable bond covenants, laws or regulations orthere exists an imposed restriction through enabling legislation.
Non-current Cash and Investments
Certain cash and investments are non-current as these funds are not available to be expended for currentoperations with the next fiscal year.
I. Prepaid Items
Certain payments to vendors applicable to future accounting periods are recorded as prepaid items basedon the consumption method.
J. Capital Assets
Capital assets, which include buildings and improvements, office furniture and equipment, leasedequipment, automobiles and call boxes and software, are reported in the applicable governmental orbusiness-type activities columns in the government-wide financial statements. Capital asset acquisitionsare recorded at historical cost. MTC’s intangible assets consist of purchased and licensed commerciallyavailable computer software and internally developed software. Depreciation and amortization expensesfor the governmental activities are charged against general government function.
Capital assets are defined by MTC as assets with an initial, individual cost of more than $5,000 and anestimated useful life in excess of three years. However, capital assets that do not meet the threshold on anindividual basis but are material collectively are capitalized. MTC follows the guidance in GASBStatement No. 34, Basic Financial Statements - and Management's Discussion & Analysis - for State andLocal Governments and GASB Statement No. 51, Accounting and Financial Reporting for IntangibleAssets for recording capital assets.
49
Metropolitan Transportation CommissionFinancial Statements for the years ended June 30, 2017 and 2016Notes to Financial Statements
The costs of normal maintenance and repairs that do not add to the value of the asset or materially extendasset service lives are not capitalized.
Depreciation and amortization are computed using the straight-line method that is based upon theestimated useful lives of individual capital assets. The estimated useful lives of capital assets are asfollows:
Years
Buildings and improvements 7-45Office furniture and equipment 3-15Intangible assets 5-7Leased equipment 5Automobiles 3Call boxes 10
Depreciation and amortization ceases when the use of capital assets is discontinued or a decision has beenmade to sell assets and the assets are not continuing to be used. Such assets are also evaluated forimpairment.
K. Retirement Plans
MTC provides a defined benefit pension plan, the Miscellaneous Plan of Metropolitan TransportationCommission (the “Plan”), which provides retirement and disability benefits, annual cost-of-livingadjustments and death benefits to Plan members and beneficiaries. The Plan is part of the Public Agencyportion of the California Public Employees’ Retirement System (CalPERS).
GASB Statement No. 68 requires that reported results must pertain to liability and asset information withincertain defined timeframes. For this report, the following timeframes are used.
Valuation Date (VD) June 30, 2015
Measurement Date (MD) June 30, 2016
Measurement Period (MP) July 1, 2015 to June 30, 2016
GASB Statement No. 68 allows use of a measurement date up to 12 months before the employer's fiscalyear end. Accordingly, for financial reporting purposes, MTC's total pension liability was determined byCalPERS using a valuation date of June 30, 2015. CalPERS then rolled forward the total pension liabilityto June 30, 2016, and this is the basis for measuring MTC's net pension liability at June 30, 2017.
For additional information on the Plan, refer to Note 8.
50

Metropolitan Transportation CommissionFinancial Statements for the years ended June 30, 2017 and 2016Notes to Financial Statements
L. Post Employment Healthcare Benefits
MTC pays certain health care insurance premiums for retired employees. These costs are not recorded in afiduciary fund by MTC as the assets underlying these future benefits are not managed by MTC. Fundshave been deposited into an irrevocable trust currently administered by Public Agency Retirement Services(PARS). The annual required contribution is recorded in salaries and benefits expense. See Note 9 forfurther detail on the cost and obligations associated with these other post employment benefits (OPEB).
M. Compensated Absences
MTC’s regular staff employees accumulate vacation pay and sick leave pay based on the agreement withthe Committee for Staff Representation pursuant to the Meyers–Milias–Brown Act. A liability exists foraccumulated vacation and sick leave. The compensated absences liability presented in government-widegovernmental activities accounts payable and accrued liabilities, totals $5,151,294 and $4,842,422 at June30, 2017 and 2016, respectively. Unused accumulated sick and vacation leave is paid at the time ofemployment termination up to a maximum of 240 hours for sick leave as well as the total accumulatedvacation leave (a maximum of 500 hours) per employee. Sick and vacation leave payments are recorded inthe General Fund. A summary of changes in compensated absences for the year ended June 30, 2017 is asfollows:
BeginningBalance
July 1, 2016 Additions Reductions
EndingBalance
June 30, 2017
DueWithin
One Year
Compensated Absences $ 4,842,422 $ 3,328,591 $ (3,019,719) $ 5,151,294 $ 2,294,225
A summary of changes in compensated absences for the year ended June 30, 2016 is as follows:BeginningBalance
July 1, 2015 Additions Reductions
EndingBalance
June 30, 2016
DueWithin
One Year
Compensated Absences $ 4,347,801 $ 3,102,966 $ (2,608,345) $ 4,842,422 $ 2,096,847
N. Reconciliation of Government-Wide and Fund Financial Statements
The governmental fund Statement of Revenues, Expenditures, and Changes in Fund Balances includes areconciliation between net change in fund balance – total governmental funds and changes in net positionof governmental activities. One element of that reconciliation explains that “Governmental funds reportcapital outlays as expenditures.” However, in the Statement of Activities the cost of those assets isallocated over their estimated useful life and reported as depreciation expense.
The details of the fiscal years 2017 and 2016 reconciling items are as follows:
2017 2016
Capital outlay $ 164,855 $ 638,583Depreciation expense (412,132) (693,874)
Net adjustment to increase net changes in fundbalances-total governmental funds to arrive atchange in net position of governmental activities $ (247,277) $ (55,291)
51

Metropolitan Transportation CommissionFinancial Statements for the years ended June 30, 2017 and 2016Notes to Financial Statements
O. Unearned Revenue
The unearned revenue in BATA consists of the funds collected by the Regional Customer Service Center(RCSC). The funds collected by RCSC are prepayments for tolls or represent a deposit from patrons. Thepatrons are issued transponders with the prepaid amounts for usage against tolls on the California SanFrancisco Bay Area bridges.
P. Deferred inflows/outflows - revenue, charges and refundings
Deferred revenue includes the unamortized portion of a lump sum payment from BATA to MTC. Detailsof the transaction are described below.
Streets and Highways codes sections 30890, 30911 and 30914 require BATA to transfer a specificpercentage of the net base toll collection to MTC annually. The transfers are called AB 664 Net TollRevenue Reserve, Transit Reserve and Rail Reserves transfers. In April 2010, MTC entered into a fundingagreement with BATA, whereby BATA would make a lump sum payment of $506,986,537 equal to thepresent value of the next 50 years of these funds transfers. The funds were transferred on September 30,2010. MTC and BATA agreed that the payment would fulfill BATA's entire responsibility to make AB664 Net Toll Reserve, Transit Reserve, and Rail Reserves fund transfers for the next 50 years. MTC isusing the payment to fund the planned essential regional transportation projects.
GASB Statement No. 48, Sales and Pledges of Receivables and Intra-Entity Transfers of Assets andFuture Revenues, as amended by GASB Statement No. 65, Items Previously Reported as Assets andLiabilities, establishes the criteria to account for the above transactions. The lump sum payment fromBATA to MTC met the criteria of the intra-entity sale of future revenues for fiscal year June 30, 2011.GASB Statement No. 48 requires the intra-entity sale of future revenue to be accounted for as a deferredcharge and deferred revenue and amortized over the life of the agreement. The balances in the deferredrevenue and deferred charge are reported under Deferred Inflows of Resources in accordance with GASBStatement No. 65. The amortization charges were $18,298,230 and $19,045,430 for fiscal years 2017 and2016, respectively.
Deferred charge includes deferred amounts from bond refundings.
52

Metropolitan Transportation CommissionFinancial Statements for the years ended June 30, 2017 and 2016Notes to Financial Statements
Q. Deferred Outflows/Inflows on Pensions
Deferred outflows of resources and deferred inflows of resources are recognized for:
Changes in the total pension liability arising from differences between expected and actual
experience with regard to economic or demographic factors.*
The effects of changes of assumptions about future economic or demographic factors or of other
inputs.*
Difference between projected and actual investment earnings on defined benefit pension plan
investments.**
*The balances on these accounts are recognized in pension expense using a systematic and rational methodover a closed period equal to the average of the expected remaining service lives of employees determinedas of the beginning of the measurement period.
**This amount is recognized in pension expense using a systematic and rational method over a closed five-year period.
Deferred outflows of resources are also used to report MTC's contribution to CalPERS subsequent to themeasurement date of the net pension liability and before the end of the reporting period. See Note 8 foradditional information.
R. Toll Revenues Collected
BATA accounts for the electronic tolls and cash collected from the operation of the bridges as revenue.BATA recognizes toll revenue as amounts are earned from vehicle utilization of the toll bridges.
S. Operating Expenditures Incurred by Caltrans
In accordance with the Cooperative Agreement between BATA and Caltrans, BATA reimburses Caltransfor certain costs incurred for bridge operating expenditures. These expenses include maintenance,administration, operations and overhead costs.
T. Investment Income and Derivative Instruments
Investment income (charge) is comprised of interest income from investments and the changes in the fairvalue of investment derivative instruments. The investment derivative instrument component is inaccordance with GASB Statement No. 53, Accounting and Financial Reporting for Derivative Instruments,as amended, which requires the change in fair value of derivative instruments which are not an effectivehedge, for accounting purposes, to be reported in investment income. The following table shows thebreakdown of investment income and changes in fair values for the fiscal years ended June 30, 2017 and2016:
53
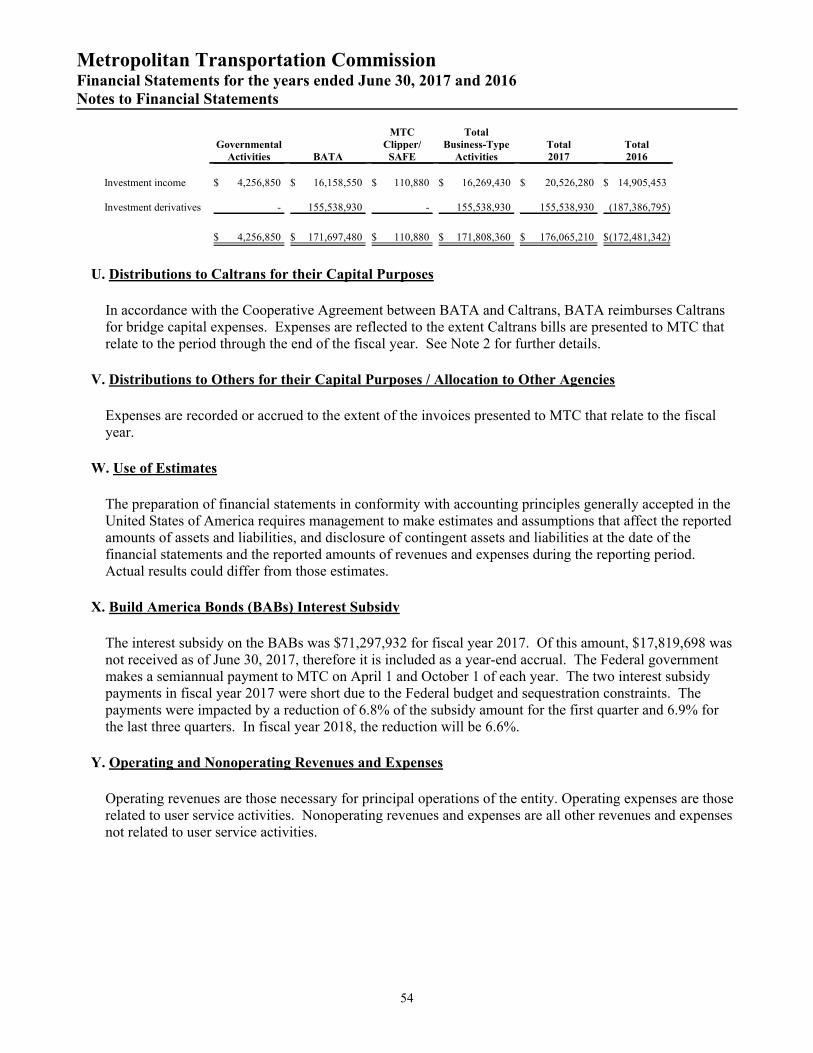
Metropolitan Transportation CommissionFinancial Statements for the years ended June 30, 2017 and 2016Notes to Financial Statements
GovernmentalActivities BATA
MTCClipper/
SAFE
TotalBusiness-Type
ActivitiesTotal2017
Total2016
Investment income $ 4,256,850 $ 16,158,550 $ 110,880 $ 16,269,430 $ 20,526,280 $ 14,905,453
Investment derivatives - 155,538,930 - 155,538,930 155,538,930 (187,386,795)
$ 4,256,850 $ 171,697,480 $ 110,880 $ 171,808,360 $ 176,065,210 $(172,481,342)
U. Distributions to Caltrans for their Capital Purposes
In accordance with the Cooperative Agreement between BATA and Caltrans, BATA reimburses Caltransfor bridge capital expenses. Expenses are reflected to the extent Caltrans bills are presented to MTC thatrelate to the period through the end of the fiscal year. See Note 2 for further details.
V. Distributions to Others for their Capital Purposes / Allocation to Other Agencies
Expenses are recorded or accrued to the extent of the invoices presented to MTC that relate to the fiscalyear.
W. Use of Estimates
The preparation of financial statements in conformity with accounting principles generally accepted in theUnited States of America requires management to make estimates and assumptions that affect the reportedamounts of assets and liabilities, and disclosure of contingent assets and liabilities at the date of thefinancial statements and the reported amounts of revenues and expenses during the reporting period.Actual results could differ from those estimates.
X. Build America Bonds (BABs) Interest Subsidy
The interest subsidy on the BABs was $71,297,932 for fiscal year 2017. Of this amount, $17,819,698 wasnot received as of June 30, 2017, therefore it is included as a year-end accrual. The Federal governmentmakes a semiannual payment to MTC on April 1 and October 1 of each year. The two interest subsidypayments in fiscal year 2017 were short due to the Federal budget and sequestration constraints. Thepayments were impacted by a reduction of 6.8% of the subsidy amount for the first quarter and 6.9% forthe last three quarters. In fiscal year 2018, the reduction will be 6.6%.
Y. Operating and Nonoperating Revenues and Expenses
Operating revenues are those necessary for principal operations of the entity. Operating expenses are thoserelated to user service activities. Nonoperating revenues and expenses are all other revenues and expensesnot related to user service activities.
54

Metropolitan Transportation CommissionFinancial Statements for the years ended June 30, 2017 and 2016Notes to Financial Statements
2. NET POSITION
MTC’s negative net position arises from its business-type activities. For the business-type activities,BATA is responsible for providing Caltrans funding for bridge construction and repairs related to theseven state-owned bridges in the San Francisco Bay Area. Expenses related to these payments to Caltransare treated as expenses since BATA does not own or maintain title to the bridges. This deficit will bereduced through operating income earned in the future as the toll revenue debt is retired and projects arecompleted.
3. CASH AND INVESTMENTS
A. A summary of Cash and Investments as shown on the Statement of Net Position for all funds at June 30,2017 and 2016 is as follows:
2017 2016
Unrestricted cash $ 290,930,675 $ 433,840,177Unrestricted investments 1,398,726,567 1,248,389,208
Total unrestricted cash and investments 1,689,657,242 1,682,229,385
Restricted cash 165,717,518 103,931,082Restricted investments 1,849,425,532 1,840,430,483
Total restricted cash and investments 2,015,143,050 1,944,361,565
Total cash and investments $ 3,704,800,292 $ 3,626,590,950
The details of restricted cash and investments are as follows:2017 2016
FasTrak® program $ 98,992,689 $ 90,087,971Escrow account 228,108 606,893Bond proceeds for capital projects 8,299,349 7,870,952Debt service reserve 526,223,870 515,292,195Operations & maintenance reserve 150,000,000 150,000,000Extraordinary loss reserve 50,000,000 50,000,000Rehabilitation reserve 120,000,000 120,000,000Projects/ self insurance reserves 580,000,000 580,000,000Variable rate risk reserve 100,000,000 100,000,000Capital projects 266,482 3,559,290BART car exchange project 381,132,552 326,944,264
Total restricted cash and investments $ 2,015,143,050 $ 1,944,361,565
Restricted cash on the FasTrak® program consists of customer prepaid tolls and deposits from patrons. Thepatrons are issued transponders with the prepaid amounts for usage against tolls on the California SanFrancisco Bay Area bridges. Tolls are deducted from customers' prepaid toll accounts as customers cross abridge. Operations & maintenance reserve, Debt service reserve, Extraordinary loss reserve, Rehabilitationreserve, Projects/Operating reserve as well as the Variable rate risk reserve are described in Note 5. TheBART car exchange project is described in Note 1.B.ii.
55
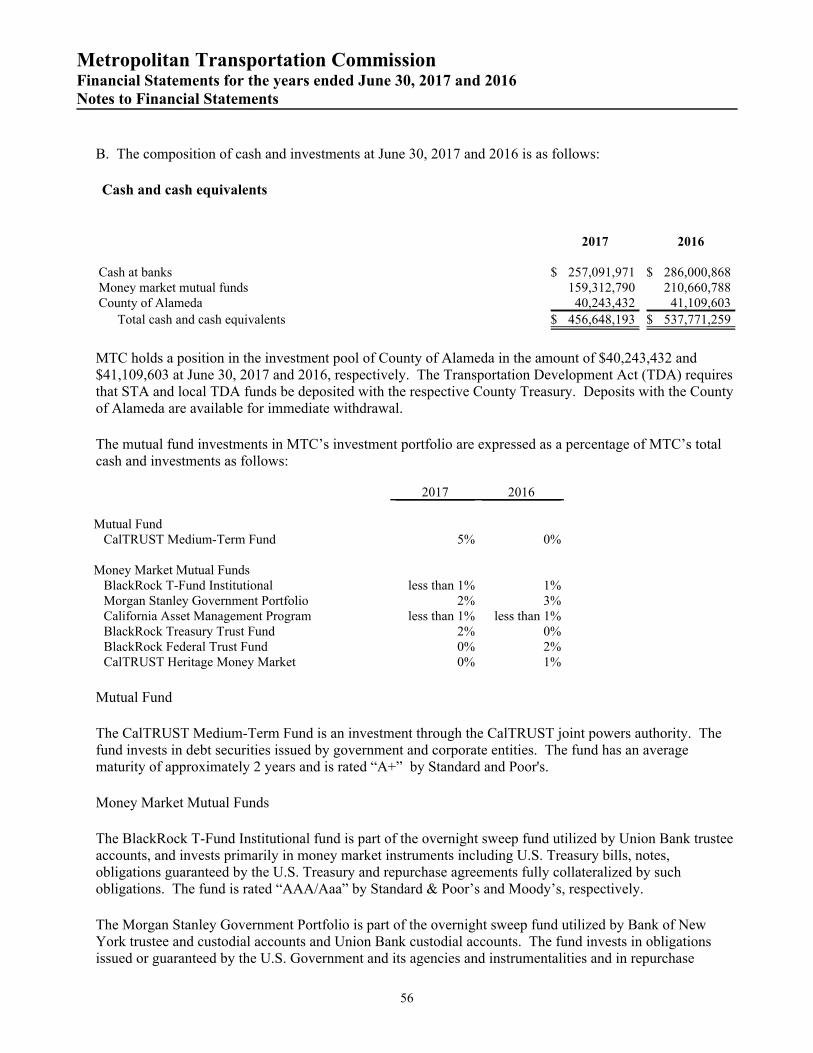
Metropolitan Transportation CommissionFinancial Statements for the years ended June 30, 2017 and 2016Notes to Financial Statements
B. The composition of cash and investments at June 30, 2017 and 2016 is as follows:
Cash and cash equivalents
2017 2016
Cash at banks $ 257,091,971 $ 286,000,868Money market mutual funds 159,312,790 210,660,788County of Alameda 40,243,432 41,109,603
Total cash and cash equivalents $ 456,648,193 $ 537,771,259
MTC holds a position in the investment pool of County of Alameda in the amount of $40,243,432 and$41,109,603 at June 30, 2017 and 2016, respectively. The Transportation Development Act (TDA) requiresthat STA and local TDA funds be deposited with the respective County Treasury. Deposits with the Countyof Alameda are available for immediate withdrawal.
The mutual fund investments in MTC’s investment portfolio are expressed as a percentage of MTC’s totalcash and investments as follows:
2017 2016
Mutual Fund CalTRUST Medium-Term Fund 5% 0%
Money Market Mutual Funds BlackRock T-Fund Institutional less than 1% 1% Morgan Stanley Government Portfolio 2% 3% California Asset Management Program less than 1% less than 1% BlackRock Treasury Trust Fund 2% 0% BlackRock Federal Trust Fund 0% 2% CalTRUST Heritage Money Market 0% 1%
Mutual Fund
The CalTRUST Medium-Term Fund is an investment through the CalTRUST joint powers authority. Thefund invests in debt securities issued by government and corporate entities. The fund has an averagematurity of approximately 2 years and is rated “A+” by Standard and Poor's.
Money Market Mutual Funds
The BlackRock T-Fund Institutional fund is part of the overnight sweep fund utilized by Union Bank trusteeaccounts, and invests primarily in money market instruments including U.S. Treasury bills, notes,obligations guaranteed by the U.S. Treasury and repurchase agreements fully collateralized by suchobligations. The fund is rated “AAA/Aaa” by Standard & Poor’s and Moody’s, respectively.
The Morgan Stanley Government Portfolio is part of the overnight sweep fund utilized by Bank of NewYork trustee and custodial accounts and Union Bank custodial accounts. The fund invests in obligationsissued or guaranteed by the U.S. Government and its agencies and instrumentalities and in repurchase
56
Metropolitan Transportation CommissionFinancial Statements for the years ended June 30, 2017 and 2016Notes to Financial Statements
agreements collateralized by such securities. The fund is rated "AAA/Aaa" by Standard and Poor's andMoody's, respectively.
The California Asset Management Program (CAMP) fund is a joint powers authority and common law trust.The Trust’s Cash Reserve Portfolio is a short-term money market portfolio, which seeks to preserveprincipal, provide daily liquidity and earn a high level of income consistent with its objectives of preservingprincipal. CAMP’s money market portfolio is rated “AAA” by Standard & Poor’s.
The BlackRock Treasury Trust Fund is part of the overnight sweep fund utilized by Bank of Americachecking accounts and invests 100% of its total assets in cash, U.S. Treasury bills, notes and otherobligations issued or guaranteed as to principal and interest by the U.S. Treasury. The fund is rated“AAA/Aaa” by Standard and Poor's and Moody's, respectively.
The BlackRock Federal Trust Fund is part of the overnight sweep fund utilized by Bank of Americachecking accounts and invests in cash, U.S. Treasury bills, notes and other obligations issued or guaranteedby the U.S. Government or by its agencies or instrumentalities. The fund is rated "AAA/Aaa" by Standardand Poor's and Moody's, respectively.
The CalTRUST Heritage Money Market Fund is an investment through the CalTRUST joint powersauthority. The Heritage Money Market Fund seeks current income while preserving capital and liquidity byinvesting in high-quality, short-term, U.S. dollar-denominated money market instruments of domestic andforeign issuers. The fund is rated "AAA/Aaa" by Standard and Poor's and Moody's respectively.
State law and MTC policy limit mutual fund investments to 20 percent of the portfolio, with no more than10 percent of the portfolio in any single fund. All the mutual fund holdings are highly rated by Standard &Poor’s and Moody’s.
Investments
GASB Statement No. 72 sets forth the framework for measuring fair value. That framework provides a fairvalue hierarchy that prioritizes the inputs to valuation techniques used to measure fair value. The hierarchygives the highest priority to unadjusted quoted prices in active markets for identical assets or liabilities(Level 1), and the lowest priority to unobservable inputs (Level 3). The three levels of the fair valuehierarchy are described as follows:
Level 1: Inputs to the valuation methodology are unadjusted quoted prices for identical assets or liabilities inactive markets.
Level 2: Inputs to the valuation methodology include:
Quoted prices for similar assets or liabilities in active markets;
Quoted prices for identical or similar assets or liabilities in markets that are not active;
Inputs other than quoted prices that are observable for the asset or liability;
Inputs that are derived principally from or corroborated by observable market data by correlation or
other means.
If the asset has a specified (contractual) term, the level 2 input must be observable for substantially the fullterm of the asset or liability.
57
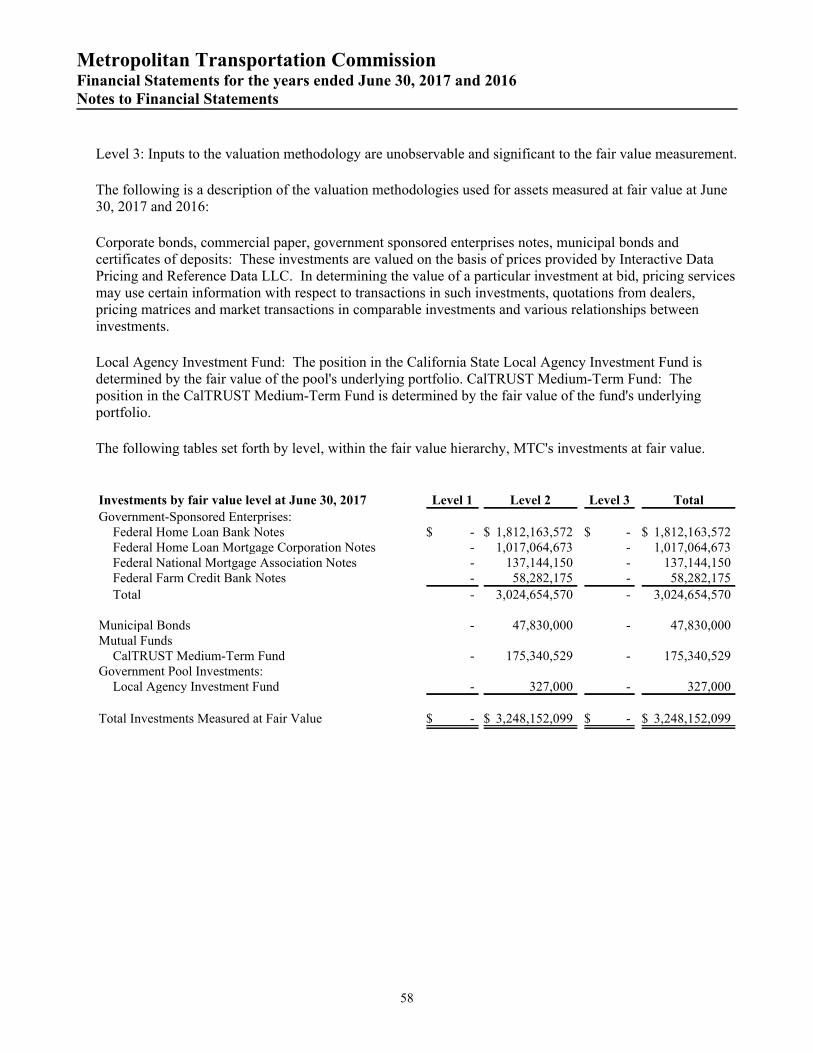
Metropolitan Transportation CommissionFinancial Statements for the years ended June 30, 2017 and 2016Notes to Financial Statements
Level 3: Inputs to the valuation methodology are unobservable and significant to the fair value measurement.
The following is a description of the valuation methodologies used for assets measured at fair value at June30, 2017 and 2016:
Corporate bonds, commercial paper, government sponsored enterprises notes, municipal bonds andcertificates of deposits: These investments are valued on the basis of prices provided by Interactive DataPricing and Reference Data LLC. In determining the value of a particular investment at bid, pricing servicesmay use certain information with respect to transactions in such investments, quotations from dealers,pricing matrices and market transactions in comparable investments and various relationships betweeninvestments.
Local Agency Investment Fund: The position in the California State Local Agency Investment Fund isdetermined by the fair value of the pool's underlying portfolio. CalTRUST Medium-Term Fund: Theposition in the CalTRUST Medium-Term Fund is determined by the fair value of the fund's underlyingportfolio.
The following tables set forth by level, within the fair value hierarchy, MTC's investments at fair value.
Investments by fair value level at June 30, 2017 Level 1 Level 2 Level 3 Total
Government-Sponsored Enterprises:Federal Home Loan Bank Notes $ - $ 1,812,163,572 $ - $ 1,812,163,572Federal Home Loan Mortgage Corporation Notes - 1,017,064,673 - 1,017,064,673Federal National Mortgage Association Notes - 137,144,150 - 137,144,150Federal Farm Credit Bank Notes - 58,282,175 - 58,282,175
Total - 3,024,654,570 - 3,024,654,570
Municipal Bonds - 47,830,000 - 47,830,000Mutual Funds
CalTRUST Medium-Term Fund - 175,340,529 - 175,340,529Government Pool Investments:
Local Agency Investment Fund - 327,000 - 327,000
Total Investments Measured at Fair Value $ - $ 3,248,152,099 $ - $ 3,248,152,099
58
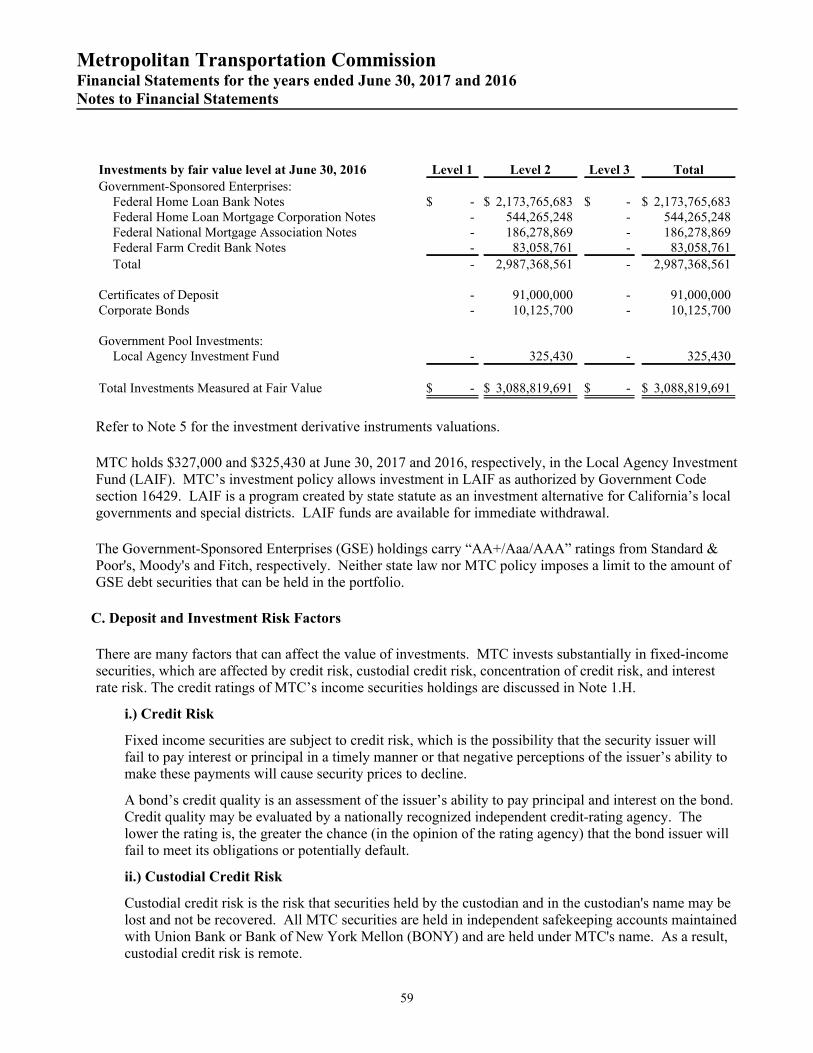
Metropolitan Transportation CommissionFinancial Statements for the years ended June 30, 2017 and 2016Notes to Financial Statements
Investments by fair value level at June 30, 2016 Level 1 Level 2 Level 3 Total
Government-Sponsored Enterprises:Federal Home Loan Bank Notes $ - $ 2,173,765,683 $ - $ 2,173,765,683Federal Home Loan Mortgage Corporation Notes - 544,265,248 - 544,265,248Federal National Mortgage Association Notes - 186,278,869 - 186,278,869Federal Farm Credit Bank Notes - 83,058,761 - 83,058,761
Total - 2,987,368,561 - 2,987,368,561
Certificates of Deposit - 91,000,000 - 91,000,000Corporate Bonds - 10,125,700 - 10,125,700
Government Pool Investments:Local Agency Investment Fund - 325,430 - 325,430
Total Investments Measured at Fair Value $ - $ 3,088,819,691 $ - $ 3,088,819,691
Refer to Note 5 for the investment derivative instruments valuations.
MTC holds $327,000 and $325,430 at June 30, 2017 and 2016, respectively, in the Local Agency InvestmentFund (LAIF). MTC’s investment policy allows investment in LAIF as authorized by Government Codesection 16429. LAIF is a program created by state statute as an investment alternative for California’s localgovernments and special districts. LAIF funds are available for immediate withdrawal.
The Government-Sponsored Enterprises (GSE) holdings carry “AA+/Aaa/AAA” ratings from Standard &Poor's, Moody's and Fitch, respectively. Neither state law nor MTC policy imposes a limit to the amount ofGSE debt securities that can be held in the portfolio.
C. Deposit and Investment Risk Factors
There are many factors that can affect the value of investments. MTC invests substantially in fixed-incomesecurities, which are affected by credit risk, custodial credit risk, concentration of credit risk, and interestrate risk. The credit ratings of MTC’s income securities holdings are discussed in Note 1.H.
i.) Credit Risk
Fixed income securities are subject to credit risk, which is the possibility that the security issuer willfail to pay interest or principal in a timely manner or that negative perceptions of the issuer’s ability tomake these payments will cause security prices to decline.
A bond’s credit quality is an assessment of the issuer’s ability to pay principal and interest on the bond.Credit quality may be evaluated by a nationally recognized independent credit-rating agency. Thelower the rating is, the greater the chance (in the opinion of the rating agency) that the bond issuer willfail to meet its obligations or potentially default.
ii.) Custodial Credit Risk
Custodial credit risk is the risk that securities held by the custodian and in the custodian's name may belost and not be recovered. All MTC securities are held in independent safekeeping accounts maintainedwith Union Bank or Bank of New York Mellon (BONY) and are held under MTC's name. As a result,custodial credit risk is remote.
59
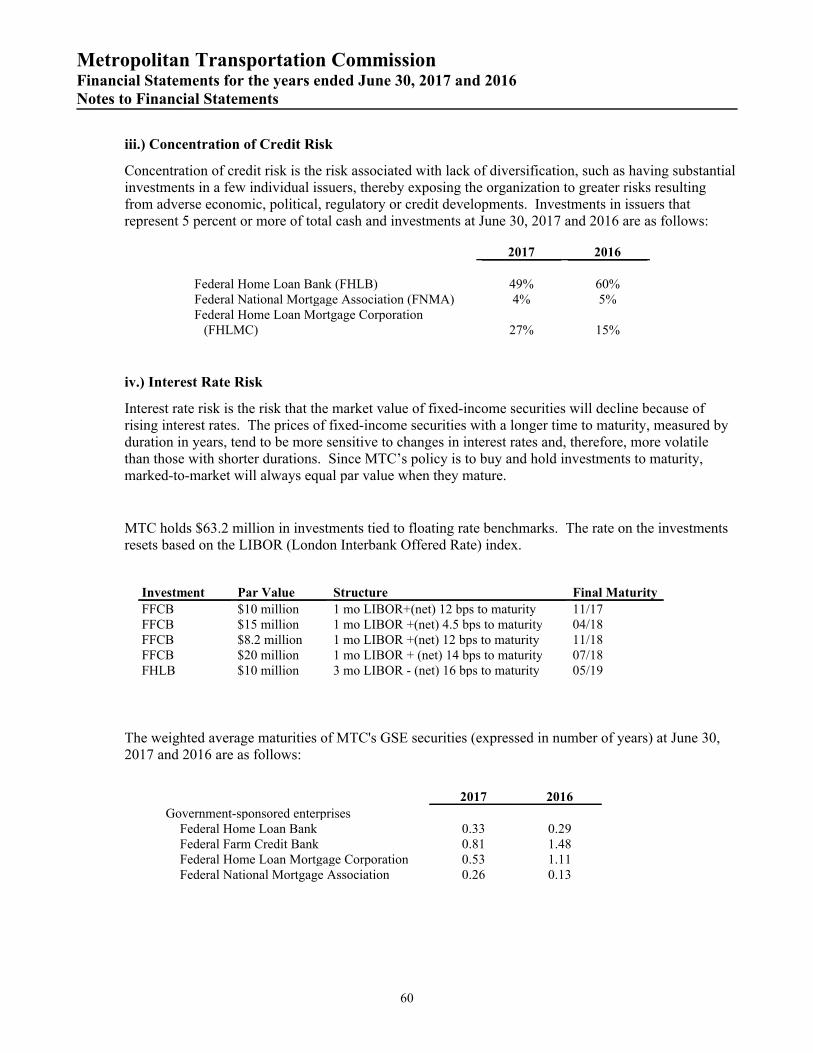
Metropolitan Transportation CommissionFinancial Statements for the years ended June 30, 2017 and 2016Notes to Financial Statements
iii.) Concentration of Credit Risk
Concentration of credit risk is the risk associated with lack of diversification, such as having substantialinvestments in a few individual issuers, thereby exposing the organization to greater risks resultingfrom adverse economic, political, regulatory or credit developments. Investments in issuers thatrepresent 5 percent or more of total cash and investments at June 30, 2017 and 2016 are as follows:
2017 2016
Federal Home Loan Bank (FHLB) 49% 60%Federal National Mortgage Association (FNMA) 4% 5%Federal Home Loan Mortgage Corporation
(FHLMC) 27% 15%
iv.) Interest Rate Risk
Interest rate risk is the risk that the market value of fixed-income securities will decline because ofrising interest rates. The prices of fixed-income securities with a longer time to maturity, measured byduration in years, tend to be more sensitive to changes in interest rates and, therefore, more volatilethan those with shorter durations. Since MTC’s policy is to buy and hold investments to maturity,marked-to-market will always equal par value when they mature.
MTC holds $63.2 million in investments tied to floating rate benchmarks. The rate on the investmentsresets based on the LIBOR (London Interbank Offered Rate) index.
Investment Par Value Structure Final Maturity
FFCB $10 million 1 mo LIBOR+(net) 12 bps to maturity 11/17FFCB $15 million 1 mo LIBOR +(net) 4.5 bps to maturity 04/18FFCB $8.2 million 1 mo LIBOR +(net) 12 bps to maturity 11/18FFCB $20 million 1 mo LIBOR + (net) 14 bps to maturity 07/18FHLB $10 million 3 mo LIBOR - (net) 16 bps to maturity 05/19
The weighted average maturities of MTC's GSE securities (expressed in number of years) at June 30,2017 and 2016 are as follows:
2017 2016
Government-sponsored enterprisesFederal Home Loan Bank 0.33 0.29Federal Farm Credit Bank 0.81 1.48Federal Home Loan Mortgage Corporation 0.53 1.11Federal National Mortgage Association 0.26 0.13
60

Metropolitan Transportation CommissionFinancial Statements for the years ended June 30, 2017 and 2016Notes to Financial Statements
4. CAPITAL ASSETS
A summary of changes in capital assets for the year ended June 30, 2017 is as follows:
Governmental activities
BeginningBalance
July 1, 2016 Increases Decreases
EndingBalance
June 30, 2017Capital assets, not being depreciated:Building and improvements $ 3,871,334 $ - $ (3,871,334) * $ -Intangible assets 41,320 12,000 (41,320) 12,000
Total capital assets, not being depreciated 3,912,654 12,000 (3,912,654) 12,000
Capital assets, being depreciated:Building and improvements 9,455,198 - (9,345,783) * 109,415Office furniture and equipment 1,696,351 122,022 (452,015) 1,366,358Intangible assets 14,272 72,154 - 86,426Leased equipment 309,560 - - 309,560Automobiles 58,037 - (27,151) 30,886
Total capital assets being depreciated 11,533,418 194,176 (9,824,949) 1,902,645
Less accumulated depreciation for:
Building and improvements 8,719,279 147,202 (8,762,162) 104,319
Office furniture and equipment 1,284,727 188,138 (388,356) 1,084,509
Intangible assets 238 14,880 - 15,118
Leased equipment 25,088 61,912 - 87,000
Automobiles 58,037 - (27,151) 30,886
Total accumulated depreciation 10,087,369 412,132 (9,177,669) 1,321,832
Total capital assets, being depreciated, net 1,446,049 (217,956) (647,280) 580,813
Governmental activities capital assets, net $ 5,358,703 $ (205,956) $ (4,559,934) $ 592,813
Business-type activities
BeginningBalance
July 1, 2016 Increases Decreases
EndingBalance
June 30, 2017Capital assets, not being depreciated:Office furniture and equipment $ 24,235,309 $ 21,692,187 $ - $ 45,927,496Building and improvements 1,755,000 - (1,755,000) * -Construction in progress - 632,593 - 632,593Intangible assets 9,438,035 7,009,587 - 16,447,622
Total capital assets, not being depreciated 35,428,344 29,334,367 (1,755,000) 63,007,711
Capital assets, being depreciated:Office furniture and equipment 14,805,257 187,095 (162,394) 14,829,958Building/Tenant improvements 5,938,936 - (1,379,200) 4,559,736Automobiles 147,431 - (59,489) 87,942Intangible assets 22,779,130 - - 22,779,130Call boxes 10,067,964 - (1,273,113) 8,794,851
Total capital assets being depreciated 53,738,718 187,095 (2,874,196) 51,051,617
Less accumulated depreciation for:Office furniture and equipment 9,297,592 1,768,313 (162,394) 10,903,511Building/Tenant improvements 1,586,461 1,243,564 (1,379,200) 1,450,825Automobiles 147,431 - (59,489) 87,942Intangible assets 13,042,348 2,884,384 - 15,926,732Call boxes 8,568,215 310,335 (1,242,389) 7,636,161
Total accumulated depreciation 32,642,047 6,206,596 (2,843,472) 36,005,171
Total capital assets, being depreciated, net 21,096,671 (6,019,501) (30,724) 15,046,446
Business-type activities capital assets, net $ 56,525,015 $ 23,314,866 $ (1,785,724) $ 78,054,157
61
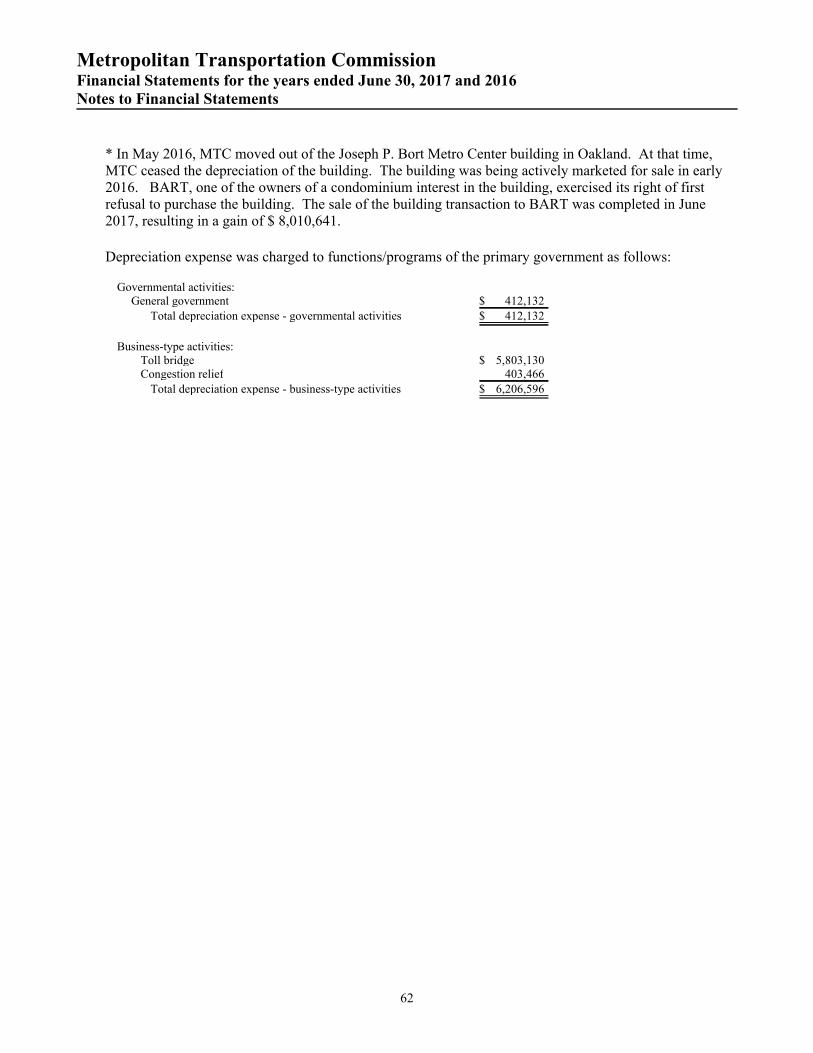
Metropolitan Transportation CommissionFinancial Statements for the years ended June 30, 2017 and 2016Notes to Financial Statements
* In May 2016, MTC moved out of the Joseph P. Bort Metro Center building in Oakland. At that time,MTC ceased the depreciation of the building. The building was being actively marketed for sale in early2016. BART, one of the owners of a condominium interest in the building, exercised its right of firstrefusal to purchase the building. The sale of the building transaction to BART was completed in June2017, resulting in a gain of $ 8,010,641.
Depreciation expense was charged to functions/programs of the primary government as follows:
Governmental activities:General government $ 412,132
Total depreciation expense - governmental activities $ 412,132
Business-type activities:Toll bridge $ 5,803,130Congestion relief 403,466
Total depreciation expense - business-type activities $ 6,206,596
62

Metropolitan Transportation CommissionFinancial Statements for the years ended June 30, 2017 and 2016Notes to Financial Statements
A summary of changes in capital assets for the year ended June 30, 2016 is as follows:
Governmental activities
BeginningBalance
July, 1 2015 Increases Decreases
EndingBalance
June 30, 2016Capital assets, not being depreciated:Building and improvements $ - $ 3,871,334 $ - $ 3,871,334Intangible assets - 41,320 - 41,320
Total capital assets, not being depreciated - 3,912,654 - 3,912,654
Capital assets, being depreciated:Buildings and improvements $ 12,774,203 $ 552,329 $ (3,871,334) $ 9,455,198Office furniture and equipment 3,002,824 30,662 (1,337,135) 1,696,351Intangible assets - 14,272 - 14,272Leased equipment 266,638 309,560 (266,638) 309,560Automobiles 58,037 - - 58,037
Total capital assets being depreciated 16,101,702 906,823 (5,475,107) 11,533,418
Less accumulated depreciation for:Buildings and improvements 8,303,846 415,433 - 8,719,279Office furniture and equipment 2,390,967 230,895 (1,337,135) 1,284,727Intangible assets - 238 - 238Leased equipment 244,418 47,308 (266,638) 25,088Automobiles 58,037 - - 58,037
Total accumulated depreciation 10,997,268 693,874 (1,603,773) 10,087,369
Total capital assets being depreciated, net 5,104,434 212,949 (3,871,334) 1,446,049
Governmental activities capital assets, net $ 5,104,434 $ 4,125,603 $ (3,871,334) $ 5,358,703
Business-type activities
BeginningBalance
July, 1 2015 Increases Decreases
EndingBalance
June 30, 2016Capital assets, not being depreciated:Office furniture and equipment $ - $ 24,235,309 $ - $ 24,235,309Building and improvements - 1,755,000 - 1,755,000Intangible assets 4,287,213 5,631,821 (480,999) 9,438,035Call boxes 15,730 - (15,730) -
Total capital assets, not being depreciated 4,302,943 31,622,130 (496,729) 35,428,344
Capital assets, being depreciated:Office furniture and equipment 17,640,945 691,891 (3,527,579) 14,805,257Building and improvements 3,134,200 4,559,736 (1,755,000) 5,938,936Automobiles 147,431 - - 147,431Intangible assets 22,309,897 475,972 (6,739) 22,779,130Call boxes 10,860,202 - (792,238) 10,067,964
Total capital assets being depreciated 54,092,675 5,727,599 (6,081,556) 53,738,718
Less accumulated depreciation for:Office furniture and equipment 9,471,513 1,703,658 (1,877,579) 9,297,592Building and improvements 1,261,052 325,409 - 1,586,461Automobiles 147,431 - - 147,431Intangible assets 9,958,334 3,090,753 (6,739) 13,042,348Call boxes 9,041,239 318,463 (791,487) 8,568,215
Total accumulated depreciation 29,879,569 5,438,283 (2,675,805) 32,642,047
Total capital assets, being depreciated, net 24,213,106 289,316 (3,405,751) 21,096,671
Business-type activities capital assets, net $ 28,516,049 $ 31,911,446 $ (3,902,480) $ 56,525,015
63
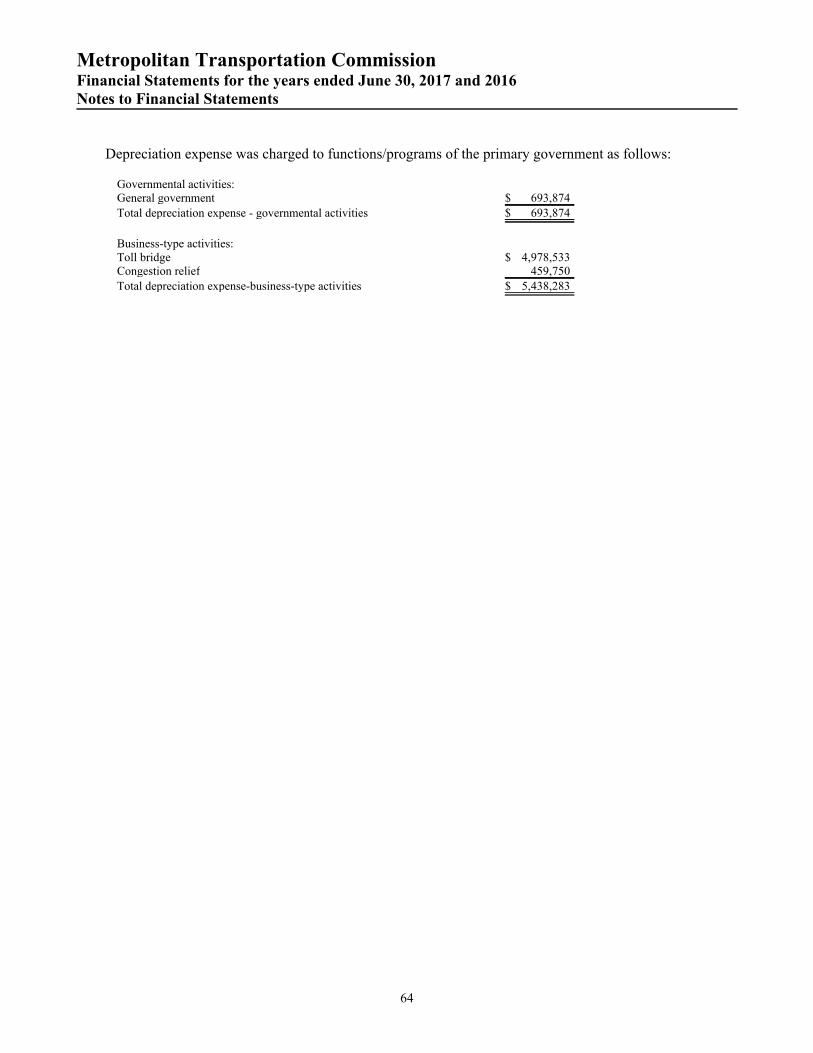
Metropolitan Transportation CommissionFinancial Statements for the years ended June 30, 2017 and 2016Notes to Financial Statements
Depreciation expense was charged to functions/programs of the primary government as follows:
Governmental activities:General government $ 693,874
Total depreciation expense - governmental activities $ 693,874
Business-type activities:Toll bridge $ 4,978,533Congestion relief 459,750
Total depreciation expense-business-type activities $ 5,438,283
64

Metropolitan Transportation CommissionFinancial Statements for the years ended June 30, 2017 and 2016Notes to Financial Statements
5. LONG-TERM DEBT
BATA issued Toll Revenue Bonds in February 2017 to (i) fund capital projects, (ii) make a cash depositto the Reserve Fund, (iii) pay costs incurred with the issuance of the bonds, and (iv) defease or refundbonds.
In February 2017, BATA completed an advance refunding of $559,015,000. The 2017 Series A, B, Cand D bond transaction consisted of a defeasance of $150,000,000 of the 2006 Series C2-C4 Bonds, adefeasance of $155,000,000 of the 2008 Series D-1 Bonds and a defeasance of $247,445,000 of the 2014Series A Bonds. The majority of the proceeds from the newly issued bonds were deposited into theEscrow fund held by a Trustee. The Trustee used the funds on deposit to purchase certain non-callablesenior Government Obligations to be used to pay the interest and redemption of the refunded bonds onor prior to the redemption dates. Because the refunding consisted of the rollover of index and termbonds, there was no economic gain from the transaction.
Each of the 2017 Series A, B, and C bonds has a Term Rate Period of April 2026, April 2025, and April2022, respectively, and bears interest at the stated Term Rate. The 2017 Series D bonds has an IndexRate Period of April 2021 and bears interest based on a percentage of the 3-month LIBOR Index Rateplus a spread. At the end of each respective Term Rate or Index Rate Period, BATA can change theInterest Rate Mode associated with the bonds. Depending on the interest rate environment when thebonds are remarketed, the interest rate on the bonds may be higher than the initial Term Rate.
The 2017 Series A, B, C, and D bonds refunding transactions were recorded as an advance refunding in-substance defeasance in accordance with GASB Statement No. 23, Accounting and Financial Reportingfor Refundings of Debt Reported by Proprietary Activities, as amended by paragraph 5 and 6 ofStatement No. 65, Items Previously Reported as Assets and Liabilities.
In February 2017, BATA also issued $300,000,000 of senior bonds, the 2017 Series F. The majority ofthe bond proceeds were used to fund capital projects, including certain costs relating to demolition ofthe former east span of the San Francisco-Oakland Bay Bridge. The 2017 Series F bond has a finalmaturity of April 2056 and bears interest at a stated fixed rate ranging from 4% to 5%.
In April 2017, BATA appointed Goldman, Sachs & Co as the Remarketing Agent for the remarketing ofthe 2007 Series C-2 Bonds and Citigroup Global Markets Inc. as the Remarketing Agent for theremarketing of the 2008 Series C-1 Bonds.
In June 2017, BATA completed a Letter of Credit Substitution and Remarketing of the 2007 Series G-1Bonds. Bank of America, N.A. replaced U.S. Bank National Association as the LOC provider. TheLetter of Credit with Bank of America, N.A. expires in June 2022.
65

Metropolitan Transportation CommissionFinancial Statements for the years ended June 30, 2017 and 2016Notes to Financial Statements
Term/ Index Rate Bonds:
BATA has a principal balance of $2,689,305,000 in term/index rate bonds. The term/index rate bond seriesare detailed as follows:
Series Par Term/ Index RateEffective
DateMaturity
Date2007 Series A1 $50,000,000 SIFMA Swap Index plus 0.70% 12/20/2012 10/1/20192007 Series E3 $100,000,000 SIFMA Swap Index plus 0.70% 12/20/2012 10/1/20192008 Series B1 $110,000,000 SIFMA Swap Index plus 1.10% 12/20/2012 4/1/20242008 Series G1 $50,000,000 SIFMA Swap Index plus 1.10% 12/20/2012 4/1/20242001 Series A $150,000,000 SIFMA Swap Index plus 1.25% 1/10/2013 4/1/20272006 Series C1 $125,000,000 SIFMA Swap Index plus 0.90% 5/1/2013 5/1/20232008 Series A1 $110,000,000 SIFMA Swap Index plus 0.90% 5/1/2013 5/1/20232007 Series C1 $50,000,000 SIFMA Swap Index plus 0.90% 6/3/2013 5/1/20232014 Series B $552,085,000 1.50% 8/5/2014 4/2/20182014 Series C $402,105,000 1.875% 8/5/2014 4/1/20192014 Series D $143,730,000 1.875% 12/18/2014 4/1/20202014 Series E $143,675,000 2.00% 12/18/2014 4/1/20212014 Series G $71,865,000 SIFMA Swap Index plus 0.60% 12/18/2014 4/1/20202014 Series H $71,830,000 SIFMA Swap Index plus 0.70% 12/18/2014 4/1/20212017 Series A 125,225,000 2.95% 02/23/2017 4/1/20262017 Series B 125,225,000 2.85% 02/23/2017 4/1/20252017 Series C 151,715,000 2.10% 02/23/2017 4/1/20222017 Series D 156,850,000 70% of 3-month LIBOR plus 0.55% 02/23/2017 4/1/2021
Variable Rate Demand Bonds:
BATA has a principal balance of $400,000,000 in Variable Rate Demand Bonds. The Variable RateDemand Bonds are backed by various Letter of Credit providers and are reset at a Weekly Rate by variousremarketing agents. The Variable Rate Demand Bonds series are detailed as follows:
Series Par Amount Letter of Credit Providers
Short Term
Rating
(S&P/Moody's
/Fitch)
Letter of Credit
Expiration
Date
Remarketing Agents
2007 Series A2 $75,000,000 The Bank of Tokyo-Mitsubishi UFJ, Ltd. A1/P1/F1 10/16/2019 (1) JP Morgan Securities, LLC
2007 Series B2 $75,000,000 Sumitomo Mitsui Banking Corporation A1/P1/F1 10/16/2019 (1) Citigroup Global Markets Inc.
2007 Series C2 $25,000,000 The Bank of Tokyo-Mitsubishi UFJ, Ltd A1/P1/F1 10/16/2019 (1) Goldman Sachs & Co.
2007 Series D2 $100,000,000 Bank of America, N.A. A1/P1/F1+ 10/16/2019 (1) Merrill Lynch, Pierce, Fenner &
Smith Inc.
2007 Series G1 $50,000,000 Bank of America. N.A A1/P1/F1+ 06/15/2022 Barclays Capital Inc.
2008 Series C1 $25,000,000 Sumitomo Mitsui Banking Corporation A1/P1/F1 10/16/2019 (1) Citigroup Global Markets Inc
2008 Series E1 $50,000,000 The Bank of Tokyo-Mitsubishi UFJ, Ltd A1/P1/F1 10/16/2019 (1) Morgan Stanley & Co. LLC.
(1) on 07/14/2017, BATA extended the Letter of Credits from 10/16/2019 to 06/15/2022.
As of June 30, 2017, there were no outstanding draws. Commitment fees are paid quarterly to the Letter ofCredit Providers. In the event the bonds covered under the Reimbursement Agreement become bank bonds,the maximum interest rate on the bonds would be 15%.
66

Metropolitan Transportation CommissionFinancial Statements for the years ended June 30, 2017 and 2016Notes to Financial Statements
A summary of changes in long-term debt for the year ended June 30, 2017 is as follows:
Business-type activities
IssueDate
InterestRate
CalendarYear
MaturityOriginalAmount
BeginningBalance
July 1, 2016 Additions Reductions
EndingBalance
June 30, 2017Due WithinOne Year
2001 Revenue Bond Series A 5/24/2001 3.69% (2) 2036 $ 150,000,000 $ 150,000,000 $ - $ - $ 150,000,000 $ -2006 Revenue Bond Series C 2/8/2006 3.60% (2) 2045 275,000,000 275,000,000 - (150,000,000) (4) 125,000,000 -2007 Revenue Bond Series F 5/15/2007 4.99% (1) 2018 310,950,000 30,500,000 - (20,565,000) (7) 9,935,000 9,935,0002007 Revenue Bond Series (A1, C1, G1) 5/15/2007 3.60% (2) 2047 150,000,000 150,000,000 - - 150,000,000 -2007 Revenue Bond Series (A2-D2, E3) 10/25/2007 3.60% (2) 2047 375,000,000 375,000,000 - - 375,000,000 -2008 Revenue Bond Series (A1- E1, G1) 6/5/2008 3.60% (2) 2045 507,760,000 500,000,000 - (155,000,000) (5) 345,000,000 -2009 Revenue Bond Series F2 (BABs) 11/5/2009 4.07% (1,3) 2049 1,300,000,000 1,300,000,000 - - 1,300,000,000 -2010 Revenue Bond Series S1 (BABs) 7/1/2010 4.53% (1,3) 2050 1,500,000,000 1,500,000,000 - - 1,500,000,000 -2010 Revenue Bond Series S2 11/4/2010 4.98% (1) 2050 410,000,000 410,000,000 - - 410,000,000 -2010 Revenue Bond Series S3 (BABs) 11/4/2010 4.49% (1,3) 2050 475,000,000 475,000,000 - - 475,000,000 -2012 Revenue Bond Series F1 10/23/2012 4.65% (1) 2031 907,525,000 907,525,000 - (34,270,000) (7) 873,255,000 45,825,0002013 Revenue Bond Series S4 8/6/2013 5.11% (1) 2053 900,000,000 900,000,000 - - 900,000,000 -2014 Revenue Bond Series (A, B, C) 8/5/2014 1.66% (1) 2047 1,201,635,000 1,201,635,000 - (247,445,000) (4) 954,190,000 -2014 Revenue Bond Series F1 8/5/2014 5.00% (1) 2054 200,000,000 200,000,000 - - 200,000,000 -2014 Revenue Bond Series (D, E) 12/18/2014 1.94% (1) 2034 287,405,000 287,405,000 - - 287,405,000 -2014 Revenue Bond Series (G, H) 12/18/2014 3.60% (2) 2034 143,695,000 143,695,000 - - 143,695,000 -2014 Revenue Bond Series F2 12/18/2014 3.93% (1) 2021 80,335,000 80,335,000 - - 80,335,000 -2014 Revenue Bond Series (S5, S6) 12/18/2014 4.79% (1) 2054 300,000,000 300,000,000 - - 300,000,000 -2017 Revenue Bond Series (A, B, C) 2/23/2017 2.60% (1) 2047 402,165,000 - 402,165,000 (4) - 402,165,000 -2017 Revenue Bond Series D 2/23/2017 3.60% (2) 2045 156,850,000 - 156,850,000 (5) - 156,850,000 -2017 Revenue Bond Series F1 2/23/2017 4.75% (1) 2056 300,000,000 - 300,000,000 (6) - 300,000,000 -
$ 10,333,320,000 $ 9,186,095,000 $ 859,015,000 $ (607,280,000) $ 9,437,830,000 $ 55,760,000
Net unamortized bond premium /(discount) $ 170,380,813 $ 23,730,750 $ (14,303,169) $ 179,808,394
Net long-term debt as of June 30, 2017 $ 9,356,475,813 $ 882,745,750 $ (621,583,169) $ 9,617,638,394
(1) Interest rates on fixed rate bonds/term rate bonds are calculated on weighted outstanding coupon rates.(2) Weighted swap rate is presented for variable rate bonds that are hedged with a swap. Variable rate bonds are presented as long term debt in accordance with GASB Interpretation No. 1 because MTC has liquidity commitments.(3) Federal Taxable Build America Bonds.(4) The 2017 Series A, B, C bonds were issued as senior term rate bonds to fully refund $150,000,000 of the 2006 Series C2-C4 bonds and $247,445,000 of the 2014 Series A bonds.(5) The 2017 Series D bonds were issued as index rate bonds to fully refund $155,000,000 of the 2008 Series D1 bonds.(6) The 2017 Series F1 bonds were issued as senior fixed rate bonds.(7) Scheduled payments.
67
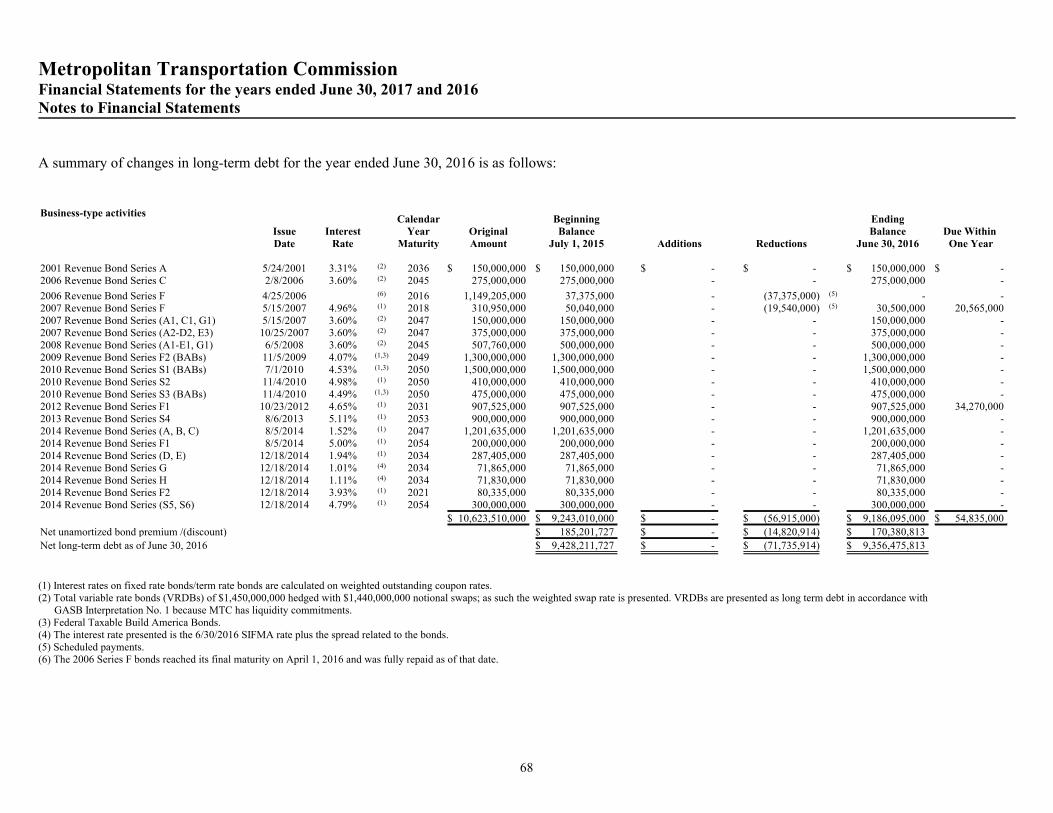
Metropolitan Transportation CommissionFinancial Statements for the years ended June 30, 2017 and 2016Notes to Financial Statements
A summary of changes in long-term debt for the year ended June 30, 2016 is as follows:
Business-type activities
IssueDate
InterestRate
CalendarYear
MaturityOriginalAmount
BeginningBalance
July 1, 2015 Additions Reductions
EndingBalance
June 30, 2016Due Within
One Year
2001 Revenue Bond Series A 5/24/2001 3.31% (2) 2036 $ 150,000,000 $ 150,000,000 $ - $ - $ 150,000,000 $ -2006 Revenue Bond Series C 2/8/2006 3.60% (2) 2045 275,000,000 275,000,000 - - 275,000,000 -
2006 Revenue Bond Series F 4/25/2006 (6) 2016 1,149,205,000 37,375,000 - (37,375,000) (5) - -2007 Revenue Bond Series F 5/15/2007 4.96% (1) 2018 310,950,000 50,040,000 - (19,540,000) (5) 30,500,000 20,565,0002007 Revenue Bond Series (A1, C1, G1) 5/15/2007 3.60% (2) 2047 150,000,000 150,000,000 - - 150,000,000 -2007 Revenue Bond Series (A2-D2, E3) 10/25/2007 3.60% (2) 2047 375,000,000 375,000,000 - - 375,000,000 -2008 Revenue Bond Series (A1-E1, G1) 6/5/2008 3.60% (2) 2045 507,760,000 500,000,000 - - 500,000,000 -2009 Revenue Bond Series F2 (BABs) 11/5/2009 4.07% (1,3) 2049 1,300,000,000 1,300,000,000 - - 1,300,000,000 -2010 Revenue Bond Series S1 (BABs) 7/1/2010 4.53% (1,3) 2050 1,500,000,000 1,500,000,000 - - 1,500,000,000 -2010 Revenue Bond Series S2 11/4/2010 4.98% (1) 2050 410,000,000 410,000,000 - - 410,000,000 -2010 Revenue Bond Series S3 (BABs) 11/4/2010 4.49% (1,3) 2050 475,000,000 475,000,000 - - 475,000,000 -2012 Revenue Bond Series F1 10/23/2012 4.65% (1) 2031 907,525,000 907,525,000 - - 907,525,000 34,270,0002013 Revenue Bond Series S4 8/6/2013 5.11% (1) 2053 900,000,000 900,000,000 - - 900,000,000 -2014 Revenue Bond Series (A, B, C) 8/5/2014 1.52% (1) 2047 1,201,635,000 1,201,635,000 - - 1,201,635,000 -2014 Revenue Bond Series F1 8/5/2014 5.00% (1) 2054 200,000,000 200,000,000 - - 200,000,000 -2014 Revenue Bond Series (D, E) 12/18/2014 1.94% (1) 2034 287,405,000 287,405,000 - - 287,405,000 -2014 Revenue Bond Series G 12/18/2014 1.01% (4) 2034 71,865,000 71,865,000 - - 71,865,000 -2014 Revenue Bond Series H 12/18/2014 1.11% (4) 2034 71,830,000 71,830,000 - - 71,830,000 -2014 Revenue Bond Series F2 12/18/2014 3.93% (1) 2021 80,335,000 80,335,000 - - 80,335,000 -2014 Revenue Bond Series (S5, S6) 12/18/2014 4.79% (1) 2054 300,000,000 300,000,000 - - 300,000,000 -
$ 10,623,510,000 $ 9,243,010,000 $ - $ (56,915,000) $ 9,186,095,000 $ 54,835,000
Net unamortized bond premium /(discount) $ 185,201,727 $ - $ (14,820,914) $ 170,380,813
Net long-term debt as of June 30, 2016 $ 9,428,211,727 $ - $ (71,735,914) $ 9,356,475,813
(1) Interest rates on fixed rate bonds/term rate bonds are calculated on weighted outstanding coupon rates.(2) Total variable rate bonds (VRDBs) of $1,450,000,000 hedged with $1,440,000,000 notional swaps; as such the weighted swap rate is presented. VRDBs are presented as long term debt in accordance with GASB Interpretation No. 1 because MTC has liquidity commitments.(3) Federal Taxable Build America Bonds.(4) The interest rate presented is the 6/30/2016 SIFMA rate plus the spread related to the bonds.(5) Scheduled payments.(6) The 2006 Series F bonds reached its final maturity on April 1, 2016 and was fully repaid as of that date.
68

Metropolitan Transportation CommissionFinancial Statements for the years ended June 30, 2017 and 2016Notes to Financial Statements
Annual funding requirements
The annual funding requirements for the debt and swap outstanding of the business-type activities at June30, 2017 are as follows:
Business-type activities
Fiscal Year EndingPrincipalPayments
InterestPayments
TotalPayments
2018 $ 55,760,000 $ 404,505,808 $ 460,265,8082019 53,280,000 397,974,992 451,254,9922020 107,265,000 392,545,101 499,810,1012021 108,425,000 387,298,953 495,723,9532022 116,435,000 382,124,692 498,559,6922023-2027 704,360,000 1,820,657,129 2,525,017,1292028-2032 1,041,585,000 1,630,633,848 2,672,218,8482033-2037 1,300,340,000 1,409,932,865 2,710,272,8652038-2042 1,582,195,000 1,155,876,313 2,738,071,3132043-2047 1,889,080,000 810,569,080 2,699,649,0802048-2052 1,758,195,000 383,813,058 2,142,008,0582053-2056 720,910,000 89,026,173 809,936,173
$ 9,437,830,000 $ 9,264,958,012 $ 18,702,788,012
Bond Covenants – BATA
The Bay Area Toll Authority Senior Toll Bridge Revenue Bonds are payable solely from pledged"Revenue” and all amounts held by the trustee in each fund and account (with exclusions) establishedunder the Master Indenture dated as of May 1, 2001 (the 2001 "Master Indenture"). Pledged "Revenue"and exclusions to the trustee funds and accounts are defined within the Master Indenture. BATAestablished a Reserve fund under the 2001 Master Indenture.
BATA covenanted in the Master Indenture that no additional bonds shall be issued, unless Net Revenue isgreater than 1.5 times of the combined Maximum Annual Debt Service of all outstanding parity bonds.Parity bonds have the same priority of claim or lien against pledged Revenue.
In the fifth supplemental indenture dated February 2006, BATA covenanted to maintain toll revenue atlevels that result in Net Revenue greater than 1.2 times Annual Debt Service costs as defined in the MasterIndenture. In addition, BATA agreed to maintain tolls at a level where Net Revenue plus the balance inthe Operations and Maintenance Fund is at least 1.25 times total “Fixed Costs”. BATA also has the legalrequirement of maintaining tolls at a level exceeding 1.0 times all fixed costs. See Schedule 11.
69

Metropolitan Transportation CommissionFinancial Statements for the years ended June 30, 2017 and 2016Notes to Financial Statements
The senior lien bonds issued by BATA are secured by a first lien on all toll revenue.
The Bay Area Toll Authority's Subordinate Toll Bridge Revenue Bonds are payable solely from pledged"Revenue" and all amounts held by the trustee in each fund and account (with exclusions) establishedunder the Subordinate Indenture dated June 1, 2010 (the "2010 Subordinate Indenture"). "PledgedRevenue" and exclusions to the trustee funds and accounts are defined within the 2010 SubordinateIndenture. BATA has established a Reserve fund account under the 2010 Subordinate Indenture.
BATA covenanted in the 2010 Subordinate Indenture that no additional bonds shall be issued unless theAvailable Revenue equates to greater than 1.2 times of the combined Maximum Annual Debt Service costsof all outstanding parity bonds.
In the first supplemental indenture dated June 2010, BATA covenanted to maintain toll revenue at levelsthat result in Available Revenue greater than 1.2 times Annual Debt Service costs.
As of June 30, 2017, the current Reserve Requirement and the market valuation of the investmentsecurities in the Debt Service reserves are as follows:
Reserve Requirement Market Valuation of Cash & Securities
Senior Debt $347,651,106 $349,933,682Subordinate Debt $170,835,039 $176,290,188
BATA maintains certain designated reserves:
Designation RequirementRequiredAmount June 30, 2017
External Designation:O & M 2x Caltrans budgeted O&M costs $63 million $150 millionExtraordinary loss BATA/Caltrans Coop Agreement $50 million $50 million
BATA designation:Rehab reserve 2x Rehab budget ($60m/yr) $120 million $120 millionVariable rate risk reserve BATA designation $100 million $100 millionProject/ Self Insurance Reserves BATA designation $580 million $580 million
Derivative Instruments
Investment derivatives fair value in a payable to the counterparty position was $390,781,957 and$546,320,887 at June 30, 2017 and June 30, 2016 respectively, and recorded in the Statement of NetPosition as a liability. The increase in fair value of investment derivatives of $155,538,930 in fiscal year2017, and the decrease of $187,386,795 in fiscal year 2016 were recorded to investment income. See Note1.T for further details.
70
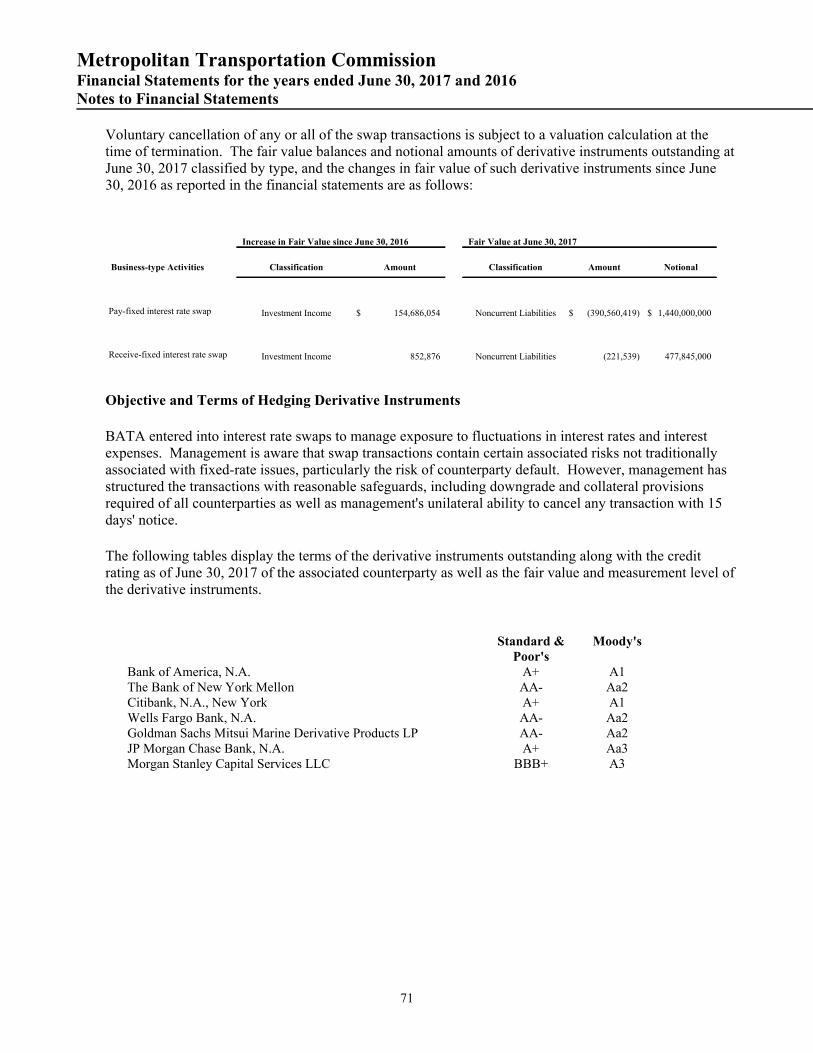
Metropolitan Transportation CommissionFinancial Statements for the years ended June 30, 2017 and 2016Notes to Financial Statements
Voluntary cancellation of any or all of the swap transactions is subject to a valuation calculation at thetime of termination. The fair value balances and notional amounts of derivative instruments outstanding atJune 30, 2017 classified by type, and the changes in fair value of such derivative instruments since June30, 2016 as reported in the financial statements are as follows:
Increase in Fair Value since June 30, 2016 Fair Value at June 30, 2017
Business-type Activities Classification Amount Classification Amount Notional
Pay-fixed interest rate swap Investment Income $ 154,686,054 Noncurrent Liabilities $ (390,560,419) $ 1,440,000,000
Receive-fixed interest rate swap Investment Income 852,876 Noncurrent Liabilities (221,539) 477,845,000
Objective and Terms of Hedging Derivative Instruments
BATA entered into interest rate swaps to manage exposure to fluctuations in interest rates and interestexpenses. Management is aware that swap transactions contain certain associated risks not traditionallyassociated with fixed-rate issues, particularly the risk of counterparty default. However, management hasstructured the transactions with reasonable safeguards, including downgrade and collateral provisionsrequired of all counterparties as well as management's unilateral ability to cancel any transaction with 15days' notice.
The following tables display the terms of the derivative instruments outstanding along with the creditrating as of June 30, 2017 of the associated counterparty as well as the fair value and measurement level ofthe derivative instruments.
Standard &Poor's
Moody's
Bank of America, N.A. A+ A1The Bank of New York Mellon AA- Aa2Citibank, N.A., New York A+ A1Wells Fargo Bank, N.A. AA- Aa2Goldman Sachs Mitsui Marine Derivative Products LP AA- Aa2JP Morgan Chase Bank, N.A. A+ Aa3Morgan Stanley Capital Services LLC BBB+ A3
71

Metropolitan Transportation CommissionFinancial Statements for the years ended June 30, 2017 and 2016Notes to Financial Statements
Investment Derivative Instruments at June 30, 2017:
Fair Value due from / (to) Counterparty
AmortizedNotional Value Counterparty
Fixed PayerRate(A) Level 1 Level 2 Level 3 Total
$75 million Wells Fargo Bank, N.A. 3.29% $ - $ (16,785,588) $ - $ (16,785,588)$75 million Morgan Stanley Capital Services LLC 4.09%(C) - (24,396,275) - (24,396,275)$110 million Wells Fargo Bank, N.A. 3.64% - (26,421,016) - (26,421,016)$30 million Bank of America, N.A. 3.63% - (9,036,536) - (9,036,536)$115 million Citibank Bank, N.A., New York 3.64% - (27,621,890) - (27,621,890)$245 million JP Morgan Chase Bank, N.A. 4.00% - (81,056,781) - (81,056,781)$50 million Bank of America, N.A. 3.63% - (15,397,735) - (15,397,735)$260 million Citibank Bank, N.A. New York 3.64% - (64,021,457) - (64,021,457)$125 million Bank of America, N.A. 2.96% - (25,023,577) - (25,023,577)$60 million Goldman Sachs Mitsui Marine Derivative Products, L.P. 3.64% - (18,153,980) - (18,153,980)$85 million Goldman Sachs Mitsui Marine Derivative Products, L.P. 3.64% - (26,313,312) - (26,313,312)$170 million The Bank of New York Mellon 3.64% - (52,626,241) - (52,626,241)$40 million The Bank of New York Mellon 2.22% - (3,706,030) - (3,706,030)
Total Fixed Payer Swaps - (390,560,418) - (390,560,418)
Fixed ReceiverRate(B)
$131.4 million(D) Wells Fargo Bank, N.A. 3.10%(E) - (107,502) - (107,502)$146.4 million The Bank of New York Mellon 3.25%(E) - (79,846) - (79,846)$40 million Bank of America, N.A. 3.55%(E) - (5,608) - (5,608)$160 million Bank of America, N.A. 3.40%(E) - (28,583) - (28,583)
Total Fixed Receiver Swaps - (221,539) - (221,539)
Total Derivative Instrument - Fair Value $ - $ (390,781,957) $ - $ (390,781,957)
Inputs to the valuation methodology are observable pursuant to the fair value hierarchy under GASB 72. Refer to Note 3B for the description ofhierarchy levels.
72

Metropolitan Transportation CommissionFinancial Statements for the years ended June 30, 2017 and 2016Notes to Financial Statements
Investment Derivative Instruments at June 30, 2016:
Fair Value due from / (to) Counterparty
Amortized NotionalValue Counterparty
Fixed PayerRate(A) Level 1 Level 2 Level 3 Total
$75 million Wells Fargo Bank, N.A. 3.29% $ - $ (23,774,342) $ - $ (23,774,342)$75 million Morgan Stanley Capital Services LLC 3.34%(C) - (31,717,433) - (31,717,433)$110 million Wells Fargo Bank, N.A. 3.64% - (36,498,997) - (36,498,997)$30 million Bank of America, N.A. 3.63% - (12,503,996) - (12,503,996)$115 million Citibank, N.A., New York 3.64% - (38,157,924) - (38,157,924)$245 million JP Morgan Chase Bank, N.A. 4.00% - (112,291,501) - (112,291,501)$50 million Bank of America, N.A. 3.63% - (21,344,391) - (21,344,391)$260 million Citibank, N.A., New York 3.64% - (88,550,875) - (88,550,875)$125 million Bank of America, N.A. 2.96% - (38,333,889) - (38,333,889)$60 million Goldman Sachs Mitsui Marine Derivative Products, L.P. 3.64% - (25,095,981) - (25,095,981)$85 million Goldman Sachs Mitsui Marine Derivative Products, L.P. 3.64% - (36,435,281) - (36,435,281)$170 million The Bank of New York Mellon 3.64% - (72,870,023) - (72,870,023)$40 million The Bank of New York Mellon 2.22% - (7,671,839) - (7,671,839)
Total Fixed Payer Swaps - (545,246,472) - (545,246,472)
Fixed ReceiverRate(B)
$131.4 million(D) Wells Fargo Bank, N.A. 3.10%(E) - (349,657) - (349,657)$146.4 million The Bank of New York Mellon 3.25%(E) - (351,656) - (351,656)$40 million Bank of America, N.A. 3.55%(E) - (58,806) - (58,806)$160 million Bank of America, N.A. 3.40%(E) - (314,296) - (314,296)
Total Fixed Receiver Swaps - (1,074,415) - (1,074,415)
Total Derivative Instrument - Fair Value $ - $ (546,320,887) $ - $ (546,320,887)
Inputs to the valuation methodology are observable pursuant to the fair value hierarchy under GASB 72. Refer to Note 3B for the description of hierarchy levels.
(A) Authority paying fixed rate receiving variable rate based on LIBOR index.(B) Authority receiving fixed rate paying variable rate based on SIFMA index.(C) Fixed rate is 3.34% effective from 1/1/2014 thru 12/31/2016. Fixed rate changed to 4.09% thereafter thru maturity.(D) Wells Fargo notional reflects amortized balance as of 4/1/2018.(E) Swap amended on 6/26/2015 to temporarily suspend payments until 4/1/2018. Rate indicated will be effective 4/1/2018.
73

Metropolitan Transportation CommissionFinancial Statements for the years ended June 30, 2017 and 2016Notes to Financial Statements
The termination value, or fair market value, BATA would pay to terminate all swaps on a voluntary basisis $391 million and $546 million on June 30, 2017 and June 30, 2016, respectively. The fair value wasdetermined by an independent outside pricing service. BATA’s intent, however, is to maintain the swaptransactions for the life of the related financings, notwithstanding market opportunities to restructure.
A ratings-related termination was triggered in June 2012 when Morgan Stanley Capital Services LLC's(MSCS) long term rating was downgraded to Baa1 by Moody. In January 2014, BATA entered into anagreement with MSCS to revise the ratings trigger for termination to a reduction in MSCS rating below"BBB-/Baa3" as determined by S&P/ Moody's respectively, in exchange for a fixed reduction in theinterest payment payable by BATA. The reduced rate of 3.34% from 4.09% is effective for a three-yearperiod from January 1, 2014 to, but excluding, January 1, 2017. Effective January 1, 2017, the fixed ratereverted to 4.09% for the remainder of the term.
Swaps are subject to credit risk, which is the possibility that the counterparty will fail to make interestpayment in a timely manner or that there are negative perceptions of the issuer's ability to make theseinterest payments.
A swap's credit quality is an assessment of the counterparty's ability to pay the interest on the swap. Creditquality may be evaluated by a national recognized independent credit-rating agency. The lower the ratingis, the greater the chance (in the opinion of the rating agency) that the counterparty will fail to meet itsobligations or potentially default.
The swap contracts address credit risk by requiring the counterparties to post collateral if: 1) acounterparty’s credit rating is equal to “A-”, "A", or “A+” as determined by S&P or is equal to "A3","A2", or “A1” by Moody’s and the termination value of its swaps exceeds $10 million, payable toBATA; or 2) a counterparty’s credit rating is below “A-” as determined by S&P or “A3” as determinedby Moody’s and the termination value of its swaps is greater than $0, payable to BATA.
As of June 30, 2017, none of the counterparties was required to post collateral with a third partysafekeeping agent.
74
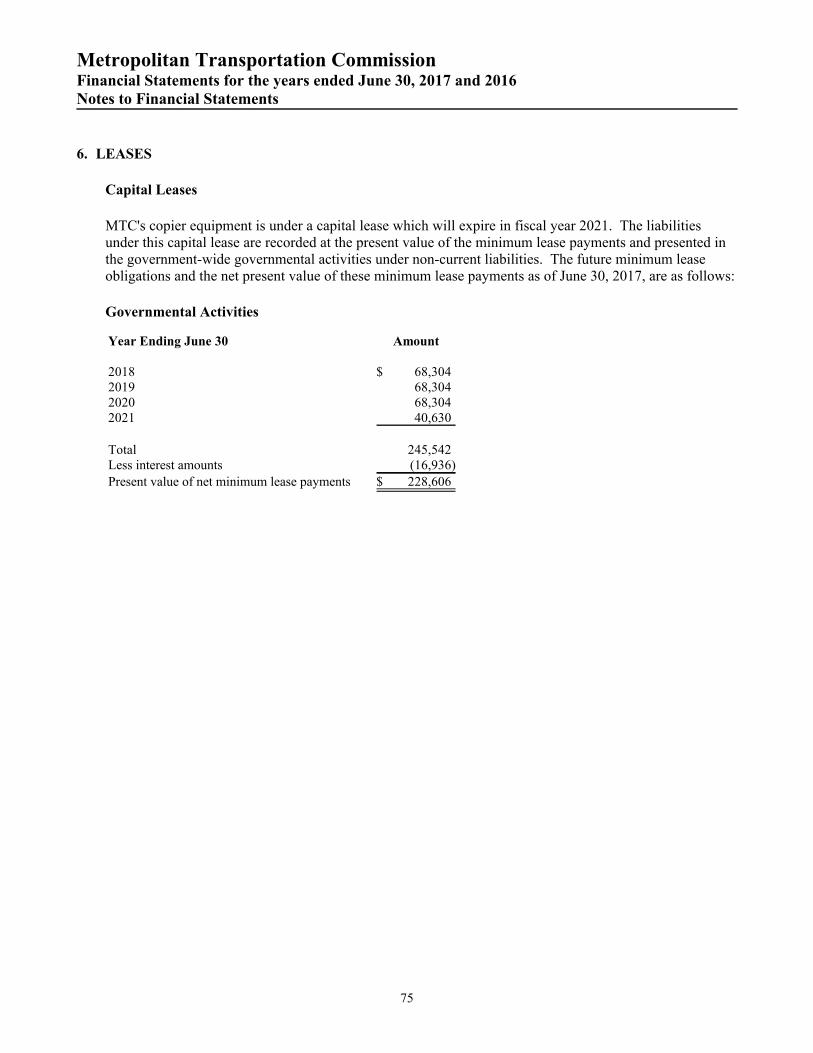
Metropolitan Transportation CommissionFinancial Statements for the years ended June 30, 2017 and 2016Notes to Financial Statements
6. LEASES
Capital Leases
MTC's copier equipment is under a capital lease which will expire in fiscal year 2021. The liabilitiesunder this capital lease are recorded at the present value of the minimum lease payments and presented inthe government-wide governmental activities under non-current liabilities. The future minimum leaseobligations and the net present value of these minimum lease payments as of June 30, 2017, are as follows:
Governmental Activities
Year Ending June 30 Amount
2018 $ 68,3042019 68,3042020 68,3042021 40,630
Total 245,542Less interest amounts (16,936)
Present value of net minimum lease payments $ 228,606
75

Metropolitan Transportation CommissionFinancial Statements for the years ended June 30, 2017 and 2016Notes to Financial Statements
7. INTERFUND RECEIVABLES, PAYABLES AND TRANSFERS
The composition of interfund transfers as of June 30, 2017, is as follows:
Transfer In:
Transfer Out:General
AB 664 NetToll
RevenueReserve STA
RailReserves
Non-MajorGovernmental
FundsMTC
Clipper® SAFE Total
Non-Major $ 51,785 $ - $ 967 $ - $ - $ - $ - $ 52,752STA 1,386,743 - - - 95,000 12,786,709 - 14,268,452General - - 44,628 - - - - 44,628
MTC Clipper® - - 591,718 - - - - 591,718BATA 8,518,112 8,936,145 - 7,255,636 2,106,449 2,199,966 300,000 29,316,308SAFE 609,660 - - - - - - 609,660
Total $ 10,566,300 $ 8,936,145 $ 637,313 $ 7,255,636 $ 2,201,449 $ 14,986,675 $ 300,000 $ 44,883,518
Transfers are used to move revenues from the fund with collection authority to the program fund that accountsfor the various projects. These interfund transfers have been eliminated in the government-wide financialstatements. The significant transfers are described below:
An amount of $12,786,709 was transferred from STA to MTC-Clipper® to support their operations. An amountof $7,614,780 transferred from BATA to the General fund represents an annual 1% transfer for administrationexpenditures. The transfer amount from BATA to AB 664, Rail Reserves and Non-Major funds totaling$18,298,230 is the amortization of the deferred revenue for these funds. See Note 1.P for further details.
Due to/from other funds
Receivable Fund Payable Fund Amount
General MTC Clipper® $ 182,123General SAFE 168,686General STA 627,183General Non-Major 27,996General BATA 443,556STA General 44,628STA Non-Major 967
STA MTC Clipper® 591,718Non-Major General 499,769
MTC Clipper® STA 2,339,178
MTC Clipper® BATA 495,570SAFE General 1,727,575
Interfund receivables and payables between funds are due to timing differences resulting from whenexpenditures are incurred and payments are made. These interfund balances have been eliminated in thegovernment-wide financial statements. The significant interfund balances at June 30, 2017 are as follows: anamount of $2,339,178 represents expenses incurred for the MTC-Clipper® project, but not yet reimbursed fromSTA; and $1,727,575 represents an advance the General fund received from SAFE to support the RegionalTraveler Information, Emergency Response Operations, Incident Management and Freeway Initiative projects.
76
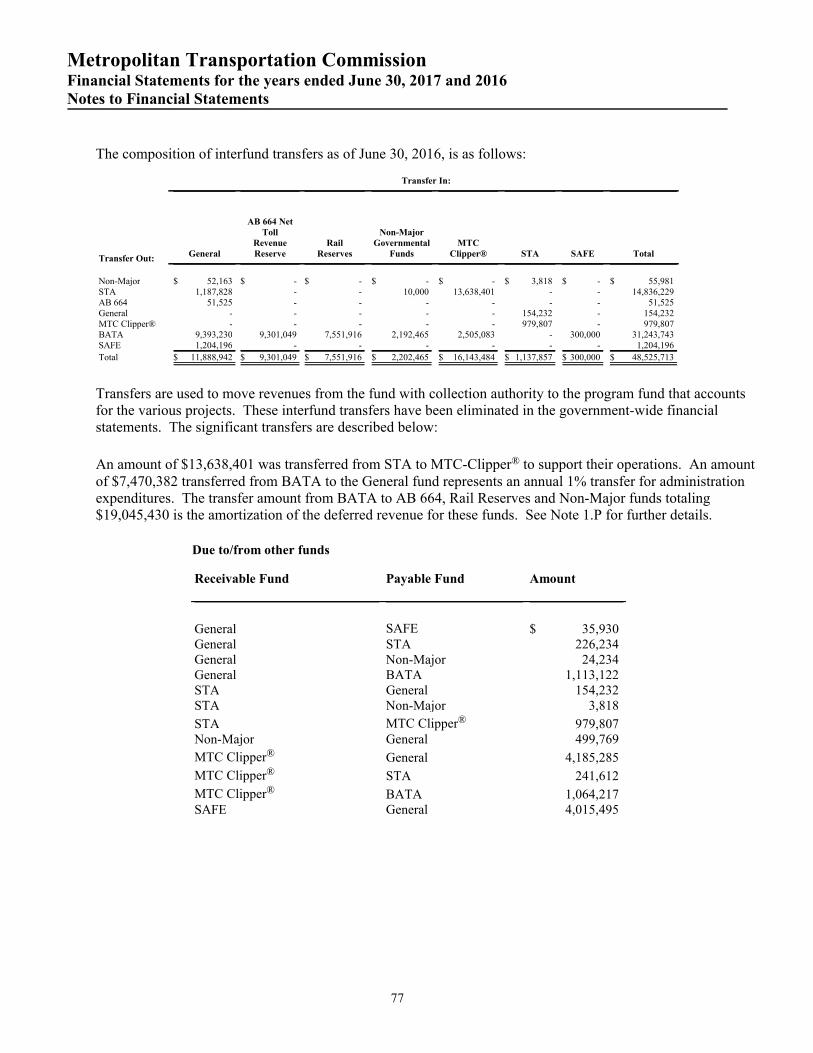
Metropolitan Transportation CommissionFinancial Statements for the years ended June 30, 2017 and 2016Notes to Financial Statements
The composition of interfund transfers as of June 30, 2016, is as follows:
Transfer In:
Transfer Out:General
AB 664 NetToll
RevenueReserve
RailReserves
Non-MajorGovernmental
FundsMTC
Clipper® STA SAFE Total
Non-Major $ 52,163 $ - $ - $ - $ - $ 3,818 $ - $ 55,981STA 1,187,828 - - 10,000 13,638,401 - - 14,836,229AB 664 51,525 - - - - - - 51,525General - - - - - 154,232 - 154,232MTC Clipper® - - - - - 979,807 - 979,807BATA 9,393,230 9,301,049 7,551,916 2,192,465 2,505,083 - 300,000 31,243,743SAFE 1,204,196 - - - - - - 1,204,196
Total $ 11,888,942 $ 9,301,049 $ 7,551,916 $ 2,202,465 $ 16,143,484 $ 1,137,857 $ 300,000 $ 48,525,713
Transfers are used to move revenues from the fund with collection authority to the program fund that accountsfor the various projects. These interfund transfers have been eliminated in the government-wide financialstatements. The significant transfers are described below:
An amount of $13,638,401 was transferred from STA to MTC-Clipper® to support their operations. An amountof $7,470,382 transferred from BATA to the General fund represents an annual 1% transfer for administrationexpenditures. The transfer amount from BATA to AB 664, Rail Reserves and Non-Major funds totaling$19,045,430 is the amortization of the deferred revenue for these funds. See Note 1.P for further details.
Due to/from other funds
Receivable Fund Payable Fund Amount
General SAFE $ 35,930General STA 226,234General Non-Major 24,234General BATA 1,113,122STA General 154,232STA Non-Major 3,818
STA MTC Clipper® 979,807Non-Major General 499,769
MTC Clipper® General 4,185,285
MTC Clipper® STA 241,612
MTC Clipper® BATA 1,064,217SAFE General 4,015,495
77

Metropolitan Transportation CommissionFinancial Statements for the years ended June 30, 2017 and 2016Notes to Financial Statements
Interfund receivables and payables between funds are due to timing differences resulting from whenexpenditures are incurred and payments are made. These interfund balances have been eliminated in thegovernment-wide financial statement. The significant interfund balances at June 30, 2016 are as follows:an amount of $4,015,495 represents an advance the General fund received from SAFE to support the 511,Emergency Operations, Traffic Management System and Freeway Initiative projects; $4,185,285represents an advance from General to MTC-Clipper® until the project gets reimbursed for its expenses;$1,113,122 represents expenses incurred for the 511 and rideshare projects, but not yet reimbursed fromBATA; and $1,064,217 represents expenses incurred for MTC-Clipper® capital projects, but not yetreimbursed from BATA.
8. EMPLOYEES' RETIREMENT PLAN
A. General Information about the Pension Plan
Plan Description
The Plan is part of the Public Agency portion of the California Public Employees’ Retirement System(CalPERS), an agent multiple-employer plan administered by CalPERS, which acts as a commoninvestment and administrative agent for participating public employers within the State of California. Anagent multiple-employer plan is one in which the assets of multiple employers are pooled for investmentpurposes, but separate accounts are maintained for each individual employer. A menu of benefitprovisions as well as other requirements are established by state statutes within the Public Employees’Retirement Law. MTC selects optional benefit provisions from the benefit menu by contract withCalPERS and adopts those benefits through local ordinance. CalPERS issues a separate comprehensiveannual financial report. Copies of the CalPERS annual financial report may be obtained from theCalPERS website or by writing to CalPERS Fiscal Services Division, PO Box 942703, Sacramento,California 94229.
Benefits Provided
MTC’s defined benefit pension plan, the Miscellaneous Plan of Metropolitan Transportation Commission(“the Plan”), provides retirement and disability benefits, annual cost-of-living adjustments, and deathbenefits to plan members and beneficiaries. Benefits are based on years of credited service, equal to oneyear of full-time employment. Classic members (hired before January 1, 2013) with five years of totalservice are eligible to retire at age 50 with statutory reduced benefits. New members (hired after January1, 2013) with five years of total service are eligible to retire at age 52 with statutory reduced benefits. Allmembers are eligible for non-duty disability benefits after five years of service. The death benefit is one ofthe following: the Basic Death Benefit, the third Level, 1959 Survivor Benefit, or the Optional Settlement2W Death Benefit. The cost of living adjustments for each plan are applied as specified by the PublicEmployees’ Retirement Law.
78
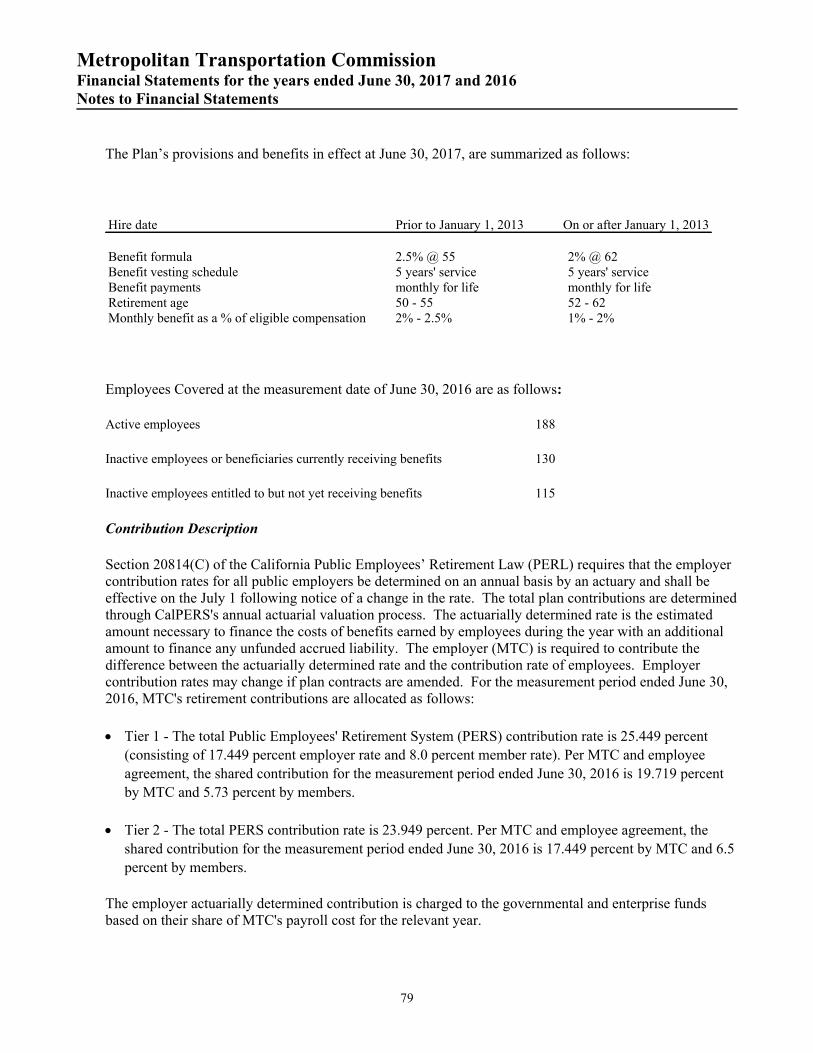
Metropolitan Transportation CommissionFinancial Statements for the years ended June 30, 2017 and 2016Notes to Financial Statements
The Plan’s provisions and benefits in effect at June 30, 2017, are summarized as follows:
Hire date Prior to January 1, 2013 On or after January 1, 2013
Benefit formula 2.5% @ 55 2% @ 62Benefit vesting schedule 5 years' service 5 years' serviceBenefit payments monthly for life monthly for lifeRetirement age 50 - 55 52 - 62Monthly benefit as a % of eligible compensation 2% - 2.5% 1% - 2%
Employees Covered at the measurement date of June 30, 2016 are as follows:
Active employees 188
Inactive employees or beneficiaries currently receiving benefits 130
Inactive employees entitled to but not yet receiving benefits 115
Contribution Description
Section 20814(C) of the California Public Employees’ Retirement Law (PERL) requires that the employercontribution rates for all public employers be determined on an annual basis by an actuary and shall beeffective on the July 1 following notice of a change in the rate. The total plan contributions are determinedthrough CalPERS's annual actuarial valuation process. The actuarially determined rate is the estimatedamount necessary to finance the costs of benefits earned by employees during the year with an additionalamount to finance any unfunded accrued liability. The employer (MTC) is required to contribute thedifference between the actuarially determined rate and the contribution rate of employees. Employercontribution rates may change if plan contracts are amended. For the measurement period ended June 30,2016, MTC's retirement contributions are allocated as follows:
Tier 1 - The total Public Employees' Retirement System (PERS) contribution rate is 25.449 percent
(consisting of 17.449 percent employer rate and 8.0 percent member rate). Per MTC and employee
agreement, the shared contribution for the measurement period ended June 30, 2016 is 19.719 percent
by MTC and 5.73 percent by members.
Tier 2 - The total PERS contribution rate is 23.949 percent. Per MTC and employee agreement, the
shared contribution for the measurement period ended June 30, 2016 is 17.449 percent by MTC and 6.5
percent by members.
The employer actuarially determined contribution is charged to the governmental and enterprise fundsbased on their share of MTC's payroll cost for the relevant year.
79

Metropolitan Transportation CommissionFinancial Statements for the years ended June 30, 2017 and 2016Notes to Financial Statements
B. Net Pension Liability
Actuarial Methods and Assumptions Used to Determine Total Pension Liability
MTC's net pension liability is measured as the total pension liability, less the Plan's fiduciary net position.For the measurement period ended June 30, 2016, the total pension liability was determined using theannual actuarial valuation as of June 30, 2015 rolled forward to June 30, 2016 using standard updateprocedures. The June 30, 2015 pension liabilities were based on the following actuarial methods andassumptions:
Actuarial Cost Method Entry Age Normal Cost MethodActuarial Assumptions:
Discount Rate 7.65%Inflation 2.75%Salary Increases Varies by Entry Age and ServiceMortality Rate Table1 Derived using CalPERS' membership data for all fundsPost Retirement Benefit Increase Contract COLA up to 2.75% until Purchasing Power
Protection Allowance Floor on Purchasing Power applies,2.75% thereafter
1The mortality table used was developed based on CalPERS specific data. The table includes 20 years ofmortality improvements using Society of Actuaries Scale BB. For more details on this table, please referto CalPERS Experience Study 2014 report, which can be obtained at CalPERS' website under Forms andPublications.
All other actuarial assumptions used in the June 30, 2015 valuation were based on the results of anactuarial experience study for the period from 1997 to 2011, including updates to salary increase, mortalityand retirement rates. The experience Study report can be obtained at CalPERS' website under Forms andPublications.
Change of Assumptions
There were no changes in assumptions from June 30, 2015 to June 30, 2016.
Discount Rate
The discount rate used to measure the total pension liability was 7.65 percent. To determine whether themunicipal bond rate should be used in the calculation of a discount rate for each plan as required by GASB68, CalPERS stress tested plans that would most likely result in a discount rate that would be differentfrom the actuarially assumed discount rate. Based on the testing of the plans, the tests revealed the assetswould not run out. Therefore, the current 7.65 percent discount rate is appropriate and the use of themunicipal bond rate calculation is not deemed necessary. The long-term expected discount rate of 7.65percent is applied to all plans in the Public Employees' Retirement Fund (PERF). The cash flow used inthe testing was developed assuming that both members and employers will make their requiredcontributions on time as scheduled in all future years. The stress test results are presented in a detailedreport called "GASB Crossover Testing Report" that can be obtained at CalPERS' website under the GASB68 section.
80
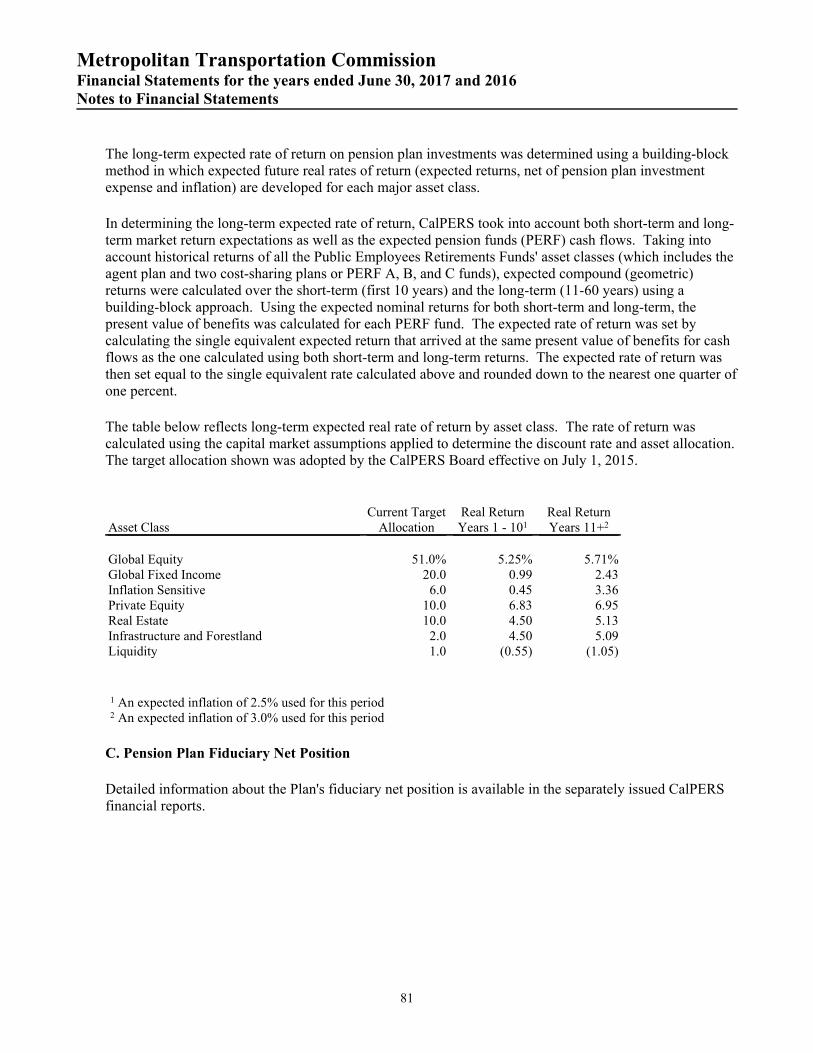
Metropolitan Transportation CommissionFinancial Statements for the years ended June 30, 2017 and 2016Notes to Financial Statements
The long-term expected rate of return on pension plan investments was determined using a building-blockmethod in which expected future real rates of return (expected returns, net of pension plan investmentexpense and inflation) are developed for each major asset class.
In determining the long-term expected rate of return, CalPERS took into account both short-term and long-term market return expectations as well as the expected pension funds (PERF) cash flows. Taking intoaccount historical returns of all the Public Employees Retirements Funds' asset classes (which includes theagent plan and two cost-sharing plans or PERF A, B, and C funds), expected compound (geometric)returns were calculated over the short-term (first 10 years) and the long-term (11-60 years) using abuilding-block approach. Using the expected nominal returns for both short-term and long-term, thepresent value of benefits was calculated for each PERF fund. The expected rate of return was set bycalculating the single equivalent expected return that arrived at the same present value of benefits for cashflows as the one calculated using both short-term and long-term returns. The expected rate of return wasthen set equal to the single equivalent rate calculated above and rounded down to the nearest one quarter ofone percent.
The table below reflects long-term expected real rate of return by asset class. The rate of return wascalculated using the capital market assumptions applied to determine the discount rate and asset allocation.The target allocation shown was adopted by the CalPERS Board effective on July 1, 2015.
Asset ClassCurrent Target
AllocationReal ReturnYears 1 - 101
Real ReturnYears 11+2
Global Equity 51.0% 5.25% 5.71%Global Fixed Income 20.0 0.99 2.43Inflation Sensitive 6.0 0.45 3.36Private Equity 10.0 6.83 6.95Real Estate 10.0 4.50 5.13Infrastructure and Forestland 2.0 4.50 5.09Liquidity 1.0 (0.55) (1.05)
1 An expected inflation of 2.5% used for this period2 An expected inflation of 3.0% used for this period
C. Pension Plan Fiduciary Net Position
Detailed information about the Plan's fiduciary net position is available in the separately issued CalPERSfinancial reports.
81

Metropolitan Transportation CommissionFinancial Statements for the years ended June 30, 2017 and 2016Notes to Financial Statements
D. Changes in the Net Pension Liability
The following table shows the changes in net pension liability recognized over the measurement period.
Increase (Decrease)
Total PensionLiability
Plan FiduciaryNet Position
Net PensionLiability
Balance at June 30, 2015 $ 133,192,515 $ 105,798,160 $ 27,394,355
Changes Recognized for the Measurement Period:Service Cost 3,969,969 - 3,969,969Interest on Total Pension Liability 10,131,304 - 10,131,304Difference between Expected and Actual Experience (352,537) - (352,537)Contributions from Employers - 4,128,694 (4,128,694)Contributions from Employees - 1,848,104 (1,848,104)Net Investment Income - 535,476 (535,476)Benefit Payments, incl. Refunds of Employee
Contributions (4,779,280) (4,779,280) -Administrative Expense - (64,478) 64,478
Net changes during 2015-16 8,969,456 1,668,516 7,300,940
Balance at June 30, 2016 $ 142,161,971 $ 107,466,676 $ 34,695,295
Sensitivity of the Net Pension Liability to Changes in the Discount Rate
The following presents the net pension liability of the Plan as of the measurement date, calculated usingthe discount rate of 7.65 percent, as well as what the net pension liability would be if it were calculatedusing a discount rate that is 1 percentage-point lower (6.65 percent) or 1 percentage-point higher (8.65percent) than the current rate.
Discount Rate - 1%(6.65%)
Current Discount Rate(7.65%)
Discount Rate + 1%(8.65%)
Plan's Net Pension Liability/ (Asset) $ 54,409,080 $ 34,695,295 $ 18,401,159
Amortization of Deferred Outflows and Deferred Inflows of Resources
Under GASB Statement 68, gains and losses related to changes in total pension liability and fiduciary netposition are recognized in pension expense systematically over time.
The first amortized amounts are recognized in pension expense for the year the gain or loss occurs. Theremaining amounts are categorized as deferred outflows and deferred inflows of resources related topensions and are to be recognized in future pension expense.
82

Metropolitan Transportation CommissionFinancial Statements for the years ended June 30, 2017 and 2016Notes to Financial Statements
The amortization period differs depending on the source of the gain or loss:
Net difference between projected and actual Five year straight-line amortizationearnings on pension plan investments
All other amounts Straight-line amortization over the average expectedaverage remaining service lifetime (EARSL) of allmembers that are provided with benefits (active andretired) as of beginning of the measurement period
Expected Average Remaining Service Lifetime (EARSL)
The EARSL for the Plan for the measurement period ended June 30, 2016 is 4.2 years which was obtainedby dividing the total service years of 1,758 (the sum of remaining service lifetimes of the activeemployees) by 423 (the total number participants: active, inactive, and retired). Inactive employees andretirees have remaining service lifetimes equal to zero years. Total future service is based on the members'probability of decrementing due to an event other than receiving a cash refund.
E. Pension Expenses and Deferred Outflows and Deferred Inflows of Resources Related to Pensions
MTC incurred a pension expense of $4,520,718 for fiscal year 2017 based on the measurement periodended June 30, 2016. The pension expense is allocated to the governmental and enterprise funds asfollows:
Enterprise Funds
GovernmentalFunds
Bay Area TollAuthority MTC SAFE
MTCClipper BAHA Total
Pension expense for fiscal year 2017 $ 2,728,631 $ 1,227,908 $ 89,372 $ 270,460 $ 204,347 $ 4,520,718
As of June 30, 2017, MTC has deferred outflows and inflows of resources related to pensions as follows:
Deferred Outflows ofResources
Deferred Inflows ofResources
Changes in assumptions $ - $ (1,234,710)Difference between expected and actual experience 264,168 (268,600)Net difference between projected and actual earnings
on pension plan investments 9,424,522 (3,505,524)Employer contributions for fiscal year 2017 5,198,407 -
Total $ 14,887,097 $ (5,008,834)
83

Metropolitan Transportation CommissionFinancial Statements for the years ended June 30, 2017 and 2016Notes to Financial Statements
The $5,198,407 in the preceding table is reported as deferred outflows of resources related to contributionssubsequent to the measurement date and will be recognized as a reduction of the net pension liability in theyear ended June 30, 2018.
The deferred outflows and deferred inflows of resources related to pensions will be recognized as areduction of future pension expense in the following years and amounts:
Year endedDeferred Outflows/
(Inflows) of Resources
2018 $ 336,1402019 336,1382020 2,504,8482021 1,502,7302022 -Thereafter $ -
9. POST EMPLOYMENT HEALTHCARE BENEFITS
Plan Description
MTC’s defined-benefit other post employment benefits (OPEB) healthcare plan provides health plancoverage through the CalPERS Health Plan to eligible retired employees and their eligible dependents.MTC maintains the same medical plans for its retirees as for its active employees, with the generalexception that once a retiree becomes eligible for Medicare, he or she must join a Medicare HMO or aMedicare Supplement plan, with Medicare becoming the primary payer. Employees become eligible toretire and receive healthcare benefits upon reaching the age of 50 with 5 years of service to MTC. Benefitsare paid for the lifetime of the retiree, spouse or surviving spouse, and dependents up to the age of 26. Thenumber of participants eligible to receive benefits was 85 for the year ended June 30, 2017.
MTC is a contracting agency under the Public Employees’ Medical and Hospital Care Act (PEMHCA),which is administered by CalPERS for provision of healthcare insurance programs for both active andretired employees. CalPERS issues a separate comprehensive annual financial report. Copies of theCalPERS annual financial report may be obtained from the CalPERS website or by writing to CalPERSFiscal Services Division, PO Box 942703, Sacramento, California 94229.
Funding Policy
MTC contributions are based on the annual required contribution (ARC) of the employer, an amountactuarially determined in accordance with the parameters of GASB Statement No. 45, Accounting andFinancial Reporting of Post Employment Benefits Other Than Pensions. The ARC represents a level offunding that, if paid on an ongoing basis, is projected to cover normal cost each year and amortize anyunfunded accrued actuarial liabilities (UAAL) (or funding excess) over a period not to exceed thirty years.The ARC is based on separate actuarial computations for the active and retiree employee groups. MTC’spayments of monthly retiree premiums of $776,100 and $763,647 for the fiscal years ended 2017 and2016, respectively, were applied toward the required annual employer contribution of $3,060,157 and
84

Metropolitan Transportation CommissionFinancial Statements for the years ended June 30, 2017 and 2016Notes to Financial Statements
$3,084,567 for the fiscal years ended 2017 and 2016, respectively. Since 2008, MTC has fully funded theARC and the net OPEB Cost. The net OPEB asset at June 30, 2017 increased by $901,235 to $8,285,620from $7,384,385 at June 30, 2016 as MTC recorded an implied subsidy of $161,778 and prefunded itsOPEB obligation by $739,455 in fiscal year 2017.
Annual OPEB Cost, Funded Status and Funding Progress
MTC’s annual OPEB cost is based on the ARC of the employer less healthcare costs paid on behalf of itsretirees as well as any other contributions made to the plan during the year. The OPEB cost is based on abi-annual actuarial valuation. The following table represents the annual OPEB cost for the year, thepercentage of costs contributed to the plan, and changes in the net OPEB obligation. Governmental andBusiness-Type Activities funded 100 percent of the ARC attributable to them. Any net OPEB assetresulted solely from Governmental Activities.
FiscalYear Ended
AnnualOPEB Cost
Percentage ofAnnual OPEB
Cost ContributedNet OPEB
Asset
June 30, 2015 $ 3,084,567 100% $ 7,384,385June 30, 2016 3,084,567 100% 7,384,385June 30, 2017 3,060,157 129% 8,285,620
The funded status of the plan as of July 1, 2017 was as follows:
Annual required contribution (ARC) $ 2,970,342Interest on net OPEB obligation (332,297)Adjustment to ARC 422,112
Annual OPEB Cost 3,060,157Less contributions made (3,961,392)
Change in net OPEB asset (901,235)Net OPEB asset - beginning of year (7,384,385)
Net OPEB asset - end of year $ (8,285,620)
85
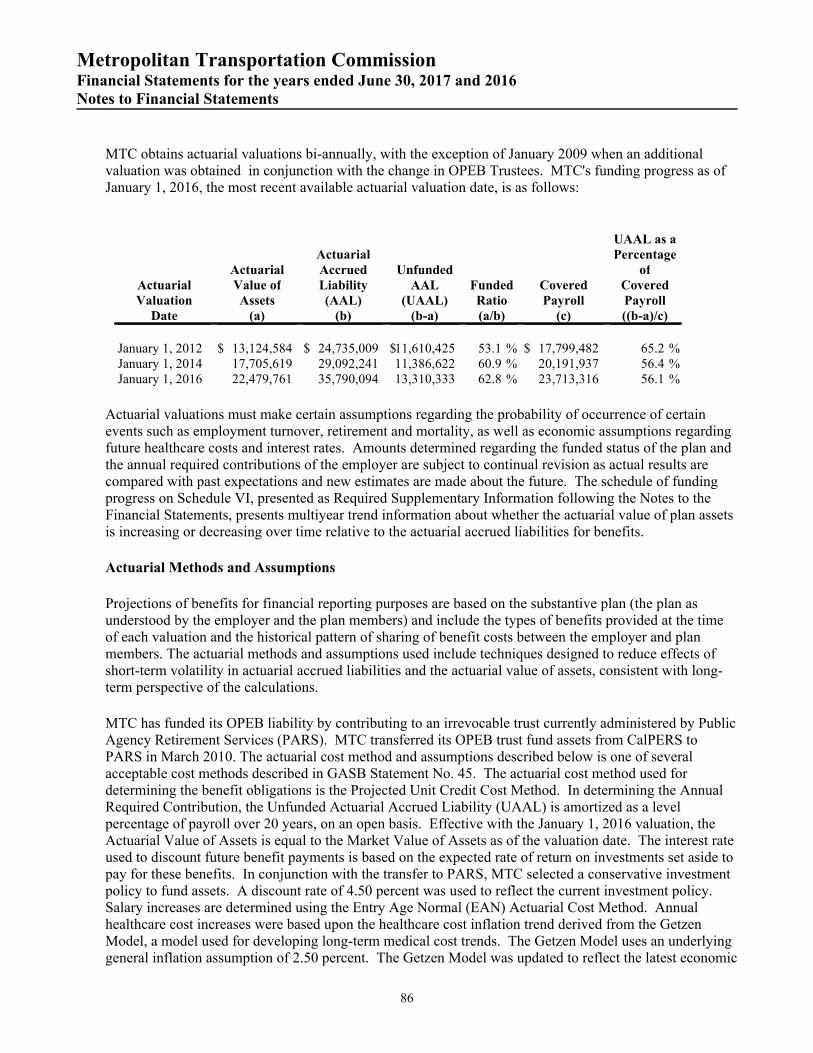
Metropolitan Transportation CommissionFinancial Statements for the years ended June 30, 2017 and 2016Notes to Financial Statements
MTC obtains actuarial valuations bi-annually, with the exception of January 2009 when an additionalvaluation was obtained in conjunction with the change in OPEB Trustees. MTC's funding progress as ofJanuary 1, 2016, the most recent available actuarial valuation date, is as follows:
ActuarialValuation
Date
ActuarialValue ofAssets
(a)
ActuarialAccruedLiability(AAL)
(b)
UnfundedAAL
(UAAL)(b-a)
FundedRatio(a/b)
CoveredPayroll
(c)
UAAL as aPercentage
ofCoveredPayroll((b-a)/c)
January 1, 2012 $ 13,124,584 $ 24,735,009 $11,610,425 %53.1 $ 17,799,482 %65.2January 1, 2014 17,705,619 29,092,241 11,386,622 %60.9 20,191,937 %56.4January 1, 2016 22,479,761 35,790,094 13,310,333 %62.8 23,713,316 %56.1
Actuarial valuations must make certain assumptions regarding the probability of occurrence of certainevents such as employment turnover, retirement and mortality, as well as economic assumptions regardingfuture healthcare costs and interest rates. Amounts determined regarding the funded status of the plan andthe annual required contributions of the employer are subject to continual revision as actual results arecompared with past expectations and new estimates are made about the future. The schedule of fundingprogress on Schedule VI, presented as Required Supplementary Information following the Notes to theFinancial Statements, presents multiyear trend information about whether the actuarial value of plan assetsis increasing or decreasing over time relative to the actuarial accrued liabilities for benefits.
Actuarial Methods and Assumptions
Projections of benefits for financial reporting purposes are based on the substantive plan (the plan asunderstood by the employer and the plan members) and include the types of benefits provided at the timeof each valuation and the historical pattern of sharing of benefit costs between the employer and planmembers. The actuarial methods and assumptions used include techniques designed to reduce effects ofshort-term volatility in actuarial accrued liabilities and the actuarial value of assets, consistent with long-term perspective of the calculations.
MTC has funded its OPEB liability by contributing to an irrevocable trust currently administered by PublicAgency Retirement Services (PARS). MTC transferred its OPEB trust fund assets from CalPERS toPARS in March 2010. The actuarial cost method and assumptions described below is one of severalacceptable cost methods described in GASB Statement No. 45. The actuarial cost method used fordetermining the benefit obligations is the Projected Unit Credit Cost Method. In determining the AnnualRequired Contribution, the Unfunded Actuarial Accrued Liability (UAAL) is amortized as a levelpercentage of payroll over 20 years, on an open basis. Effective with the January 1, 2016 valuation, theActuarial Value of Assets is equal to the Market Value of Assets as of the valuation date. The interest rateused to discount future benefit payments is based on the expected rate of return on investments set aside topay for these benefits. In conjunction with the transfer to PARS, MTC selected a conservative investmentpolicy to fund assets. A discount rate of 4.50 percent was used to reflect the current investment policy.Salary increases are determined using the Entry Age Normal (EAN) Actuarial Cost Method. Annualhealthcare cost increases were based upon the healthcare cost inflation trend derived from the GetzenModel, a model used for developing long-term medical cost trends. The Getzen Model uses an underlyinggeneral inflation assumption of 2.50 percent. The Getzen Model was updated to reflect the latest economic
86
Metropolitan Transportation CommissionFinancial Statements for the years ended June 30, 2017 and 2016Notes to Financial Statements
growth factors and adjusted to reflect the value of an expected excise tax payable in 2018. Starting 2018,medical premiums above a certain threshold will be subject to an excise tax of 40 percent on the amountabove the threshold. The tax will be charged to insurers and is expected to be included in medicalpremiums.
Actuarial standards require measurement of an implicit rate subsidy for all community rated health plans.This includes all health plans sponsored by CalPERS. Public Employees Medical and Hospital Care Act(PEMHCA) health plans charge the same premiums for retirees who are not yet eligible for Medicare asfor active employees. Therefore, the retiree premium rates are being subsidized by the inclusion of activelives in setting rates. Premiums calculated only based on retiree health claims experience would haveresulted in higher retiree premiums. GASB Statement No. 45 requires that the value of this subsidy berecognized as a liability in valuation of OPEB costs.
Demographic assumptions regarding retirement and withdrawal are based on statistics taken from theCalPERS Pension for MTC. Retirement rates for employees hired prior to January 1, 2013, are based on a2.5 percent @ 55 formula and on a 2.0 percent @ 62 formula for those hired on or after January 1, 2013.MTC employees participate in CalPERS and accrue post employment healthcare benefits under theseformulas. Termination rates were updated to reflect MTC's recent experience and the mortality rates werebased upon the latest CalPERS experience and reflect an improvement in future mortality.
The Actuarial Accrued Liability (AAL) presented in the January 1, 2016 valuation, MTC's most recentvaluation, increased by approximately $6,700,000 over the previous valuation dated January 1, 2014. Thecost of benefit accruals less benefit payments made since the last valuation date contributed to the changein the AAL of $2,900,000. The inclusion of the implicit rate subsidy increased the AAL by $3,800,000.The combined impact of these factors was an increase in the AAL of approximately $6,700,000. Copies ofPARS' annual financial report may be obtained by writing to PARS, 4350 Von Karman Avenue, Suite 100,Newport Beach, California 92660.
10. COMMITMENTS AND CONTINGENCIES
MTC’s grant funded projects are subject to audit by the respective grantors. The final determination ofallowable project costs can be made only after the grantors' audits are completed and final rulings by thegrantors' administrative departments are obtained. Disallowed expenditures, if any, must be borne bynonfederal funds. In the opinion of MTC’s management, such disallowances, if any, would not have amaterial adverse effect on the accompanying government-wide financial statements.
MTC is involved in various claims and litigation that are considered normal to MTC’s regional planningactivities. MTC's Board has committed $1,250,000 for both fiscal years ended June 30, 2017 and 2016,respectively, for future expenses for these contingencies. In the opinion of MTC’s management, theultimate resolution of these matters will not have a material adverse effect on MTC’s government-widefinancial position.
BAHA - Discretely Presented Component Unit
BAHA has entered into contracts with multiple external parties to perform the building and tenantimprovements construction and working space furnishing in the Bay Area Metro Center (BAMC).As of June 30, 2017, there are approximately $6,000,000 in future capital expenditurecommitments, which includes $560,000 for the construction of the sidewalks abutting BAMC(expected to be completed in fall 2017), approximately $3,000,000 for BAMC 5th floor tenant
87
Metropolitan Transportation CommissionFinancial Statements for the years ended June 30, 2017 and 2016Notes to Financial Statements
improvements, $1,000,000 for furniture expenditure commitments, and $1,450,000 for BAMCcapital improvements.
11. RISK MANAGEMENT
MTC is exposed to various risks of loss related to torts; theft of, damage to, and destruction of assets;errors and omissions; and natural disasters. MTC purchases commercial insurance through an insuranceagent, who obtains the appropriate insurance coverage needed by MTC from insurance companies. Todate, there have been no significant reductions in any of MTC’s insurance coverage, and no settlementamounts have exceeded commercial insurance coverage for the past three years.
12. RELATED PARTY TRANSACTIONS
The Regional Administrative Facility Corporation (RAFC) was incorporated in the State of California onMarch 23, 1983, for the purpose of administering, operating and maintaining common areas and certaineasements of the property which consists solely of the Joseph P. Bort Metro Center facility.
The RAFC Condominium Plan established the following three owner occupants: BART, MTC and ABAG.RAFC exercised a custodial responsibility on behalf of the owner occupants and assessed sufficientamounts to meet all required expenditures of the common areas and easements. MTC providedmanagement and other staff functions to RAFC through management fees. Fees billed to RAFC were$296,518 and $531,769 for fiscal years ended June 30, 2017 and 2016, respectively.
In May 2016, MTC and ABAG, two of the owner occupants, moved out from the Joseph P. Bort MetroCenter facility. The facility was offered for sale and BART, the third owner occupant, exercised its firstright of refusal to purchase the facility.
BAHA - Discretely Presented Component Unit
In 2012, BAHA entered into an office lease agreement with the BAAQMD to occupy space in BAMC.The lease agreement granted BAAQMD the option to purchase office space (in the form of a condominiuminterest) in BAMC (the "Purchase Option").
On November 7, 2013, BAAQMD issued a Certificate of Participation (COP) in the amount of $30 millionto secure an ownership interest in BAMC. BAHA purchased the COP and entered into a site and facilitieslease and sublease agreement with BAAQMD in relation to the condominium interest. The lease term was30 years. The effective date of these leases commenced from the date BAAQMD exercised its PurchaseOption for the premises. The proceeds of the COP were held by a trustee in escrow on behalf ofBAAQMD, and were released to BAHA at the time the Purchase Option was exercised. Rental paymentsunder the site and facilities lease and sublease had been assigned to a trustee which was used to payprincipal and interest to BAHA under the COP.
On June 2, 2017, BAAQMD exercised its purchase option to buy the condominium interest. The trusteereleased to BAHA the proceeds of the COP of $29,707,755 held in escrow to pay for the purchase of thecondominium interest, and the rental payment of the site and facilities lease and sublease in the amount of$1,700,000 to pay down the COP principal. In addition, BAAQMD made $9,000,000 in COP prepaymentto BAHA.
88

Metropolitan Transportation CommissionFinancial Statements for the years ended June 30, 2017 and 2016Notes to Financial Statements
In 2013, BAHA and ABAG signed a Memorandum of Understanding (MOU), under which ABAGintended to enter into a purchase and sale agreement with BAHA to purchase a condominium interest inBAMC from BAHA. ABAG's purchase price for the condominium interest was the transfer of ABAG'scondominium ownership interest in its previous headquarters, the Joseph P. Bort Metro Center ("OaklandMetro Center"), located at 101 Eighth Street, Oakland, CA 94607. In addition, ABAG paid BAHA$800,000 for capital tenant improvements to BAMC. ABAG's budget funding for the capital tenantimprovements was provided by MTC.
On May 19, 2016, BAHA entered into an office lease agreement with ABAG. The agreement allowedABAG to take occupancy of ABAG's condominium interest in BAMC prior to the purchase of BAMC'sagency space. The agreement stipulated that ABAG paid no base rent, but a portion of the operatingexpenses of BAMC as an additional rent starting July 2016.
In May 2016, BAAQMD and ABAG moved their offices to BAMC. BAAQMD's monthly lease paymentbegan in July 2016, which was applied toward the payment of the purchase price option. BAAQMD paid aportion of BAMC's operating expenses starting July 2016.
On June 22, 2017, MTC and the San Francisco Bay Area Rapid District (BART) completed the sale of theOakland Metro Center. MTC's share of the net proceeds was $11,422,704 which was contributed toBAHA. ABAG's share of the net proceeds was $5,015,496. Per the MOU signed in 2013 by ABAG andBAHA, ABAG would exchange its ownership interest in the Oakland Metro Center for the condominiumunit at 375 Beale Street. The transaction was also executed on June 22, 2017.
The sales of BAHA's condominium interest to BAAQMD and ABAG resulted in a loss of $4,231,869.
On June 22, 2017, 375 Beale Condominium Corporation (“375 Beale Condo”) was incorporated inthe State of California. The 375 Beale Condo started to exercise its custodial responsibility onbehalf of the three owner occupants, BAHA, BAAQMD, and ABAG on July 1, 2017. The 375Beale Condo assessed both facility common and agency common assessment fees to meet allrequired expenditures of the common area and joint used space.
13. SUBSEQUENT EVENTS
In May 2016, MTC's board approved the policy support for consolidation of MTC and ABAG stafffunctions. On May 30, 2017 MTC and ABAG signed a Contract for Services agreement for theconsolidation of ABAG's staff and function to MTC with an effective date of July 1, 2017.
In August 2017, BATA issued 2017 Series E, G, and H toll revenue variable rate bonds in the total amountof $552,000,000 and 2017 Series S-7 subordinate fixed rate bonds in the amount of $1.403,000,000. Thebonds were issued to (i) refund the 2014 Series B, portion of 2010 Series S-2, and 2013 Series S-4 bonds,(ii) make deposit to the Reserve account for the benefit of subordinate bonds, and (iii) pay the costs ofissuing the 2017 Series subordinate Bonds.
89

REQUIRED SUPPLEMENTARYINFORMATION
90

Metropolitan Transportation CommissionSchedule of Revenues, Expenditures and Changes in Fund Balances - Budget andActual - General Fund (unaudited)For the Year Ended June 30, 2017 Schedule I
Original Budget (1) Final Budget (1) Actual
Variance fromFinal Budget
Favorable (Unfavorable)
REVENUES
Sales tax $ 12,500,000 $ 12,500,000 $ 13,088,720 $ 588,720Grants - Federal 112,638,208 115,475,147 65,219,640 (50,255,507)Grants - State 742,776 742,776 616,561 (126,215)Local agencies revenues and refunds 4,479,171 5,227,466 4,856,377 (371,089)Investment income - unrestricted 20,000 20,000 76,643 56,643
TOTAL REVENUES 130,380,155 133,965,389 83,857,941 (50,107,448)
EXPENDITURES
General government 134,514,173 138,248,978 67,951,367 70,297,611Allocations to other agencies 15,867,260 16,049,987 24,692,348 (8,642,361)Capital outlay 674,032 674,032 164,855 509,177
TOTAL EXPENDITURES 151,055,465 154,972,997 92,808,570 62,164,427
REVENUES OVER (UNDER) EXPENDITURES (20,675,310) (21,007,608) (8,950,629) 12,056,979
OTHER FINANCING SOURCES (USES)
Transfers in 17,927,458 18,281,458 10,566,300 (7,715,158)Transfers out - - (44,628) (44,628)Sale of capital assets - - 11,146,656 11,146,656Capital contribution to Bay Area HeadquartersAuthority - - (11,422,704) (11,422,704)
TOTAL OTHER FINANCING SOURCES (USES) 17,927,458 18,281,458 10,245,624 (8,035,834)
NET CHANGE IN FUND BALANCES (2,747,852) (2,726,150) 1,294,995 4,021,145
Fund balances - beginning 40,369,795 40,369,795 40,369,795 -
Fund balances - ending $ 37,621,943 $ 37,643,645 $ 41,664,790 $ 4,021,145
(1) Budget prepared in accordance with GAAP.
See accompanying Report of Independent Auditors.
91

Metropolitan Transportation CommissionSchedule of Revenues, Expenditures and Changes in Fund Balances - Budget andActual - AB 664 Net Toll Revenue Reserve Fund (unaudited)For the Year Ended June 30, 2017 Schedule II
Original Budget (1) Final Budget (1) Actual
Variance fromFinal Budget
Favorable(Unfavorable)
REVENUES
Investment income - unrestricted $ - $ - $ 1,172,891 $ 1,172,891
TOTAL REVENUES - - 1,172,891 1,172,891
EXPENDITURES
General government - - 19,694 (19,694)Allocations to other agencies 43,547,076 64,847,076 35,532,201 29,314,875
TOTAL EXPENDITURES 43,547,076 64,847,076 35,551,895 29,295,181
REVENUES UNDER EXPENDITURES (43,547,076) (64,847,076) (34,379,004) 30,468,072
OTHER FINANCING SOURCES
Transfers in 43,547,075 64,847,075 8,936,145 (55,910,930)
TOTAL OTHER FINANCING SOURCES 43,547,075 64,847,075 8,936,145 (55,910,930)
NET CHANGE IN FUND BALANCES - - (25,442,859) (25,442,858)
Fund balances - beginning 39,880,608 39,880,608 39,880,608 -
Fund balances - ending $ 39,880,607 $ 39,880,607 $ 14,437,749 $ (25,442,858)
(1) Budget prepared in accordance with GAAP.
See accompanying Report of Independent Auditors.
92

Metropolitan Transportation CommissionSchedule of Revenues, Expenditures and Changes in Fund Balances - Budget andActual - State Transit Assistance Fund (unaudited)For the Year Ended June 30, 2017 Schedule III
Original Budget (1) Final Budget (1) Actual
Variance fromFinal Budget
Favorable (Unfavorable)
REVENUES
Grants - State $ 100,049,409 $ 100,376,183 $101,167,760 $ 791,577Local agencies revenues and refunds - - 5,027,828 5,027,828Investment income - unrestricted - - 187,426 187,426
TOTAL REVENUES 100,049,409 100,376,183 106,383,014 6,006,831
EXPENDITURES
Allocations to other agencies 154,594,241 154,921,015 103,737,392 51,183,623
TOTAL EXPENDITURES 154,594,241 154,921,015 103,737,392 51,183,623
REVENUES OVER (UNDER) EXPENDITURES (54,544,832) (54,544,832) 2,645,622 57,190,454
OTHER FINANCING SOURCES (USES)
Transfers in 54,544,832 54,544,832 637,313 (53,907,519)Transfers out - - (14,268,452) (14,268,452)
TOTAL OTHER FINANCING SOURCES (USES) 54,544,832 54,544,832 (13,631,139) (68,175,971)
NET CHANGE IN FUND BALANCES - - (10,985,517) (10,985,517)
Fund balances - beginning 54,653,267 54,653,267 54,653,267 -
Fund balances - ending $ 54,653,267 $ 54,653,267 $ 43,667,750 $ (10,985,517)
(1) Budget prepared in accordance with GAAP.
See accompanying Report of Independent Auditors.
93

Metropolitan Transportation CommissionSchedule of Revenues, Expenditures and Changes in Fund Balances - Budget andActual - Rail Reserves Fund (unaudited)For the Year Ended June 30, 2017 Schedule IV
Original Budget (1) Final Budget (1) Actual
Variance fromFinal Budget
Favorable (Unfavorable)
REVENUESInvestment income - unrestricted $ - $ - $ 532,506 $ 532,506
TOTAL REVENUES - - 532,506 532,506
EXPENDITURES
General government - - 11,468 (11,468)Allocations to other agencies 7,255,636 7,255,636 59,000,029 (51,744,393)
TOTAL EXPENDITURES 7,255,636 7,255,636 59,011,497 (51,755,861)
REVENUES UNDER EXPENDITURES (7,255,636) (7,255,636) (58,478,991) (51,223,355)
OTHER FINANCING SOURCES (USES)
Transfers in 7,255,636 7,255,636 7,255,636 -
NET CHANGE IN FUND BALANCES - - (51,223,355) (51,223,355)
Fund balances - beginning (40,997,772) (40,997,772) (40,997,772) -
Fund balances - ending $ (40,997,772) $ (40,997,772) $ (92,221,127) $ (51,223,355)
(1) Budget prepared in accordance with GAAP.
See accompanying Report of Independent Auditors.
94
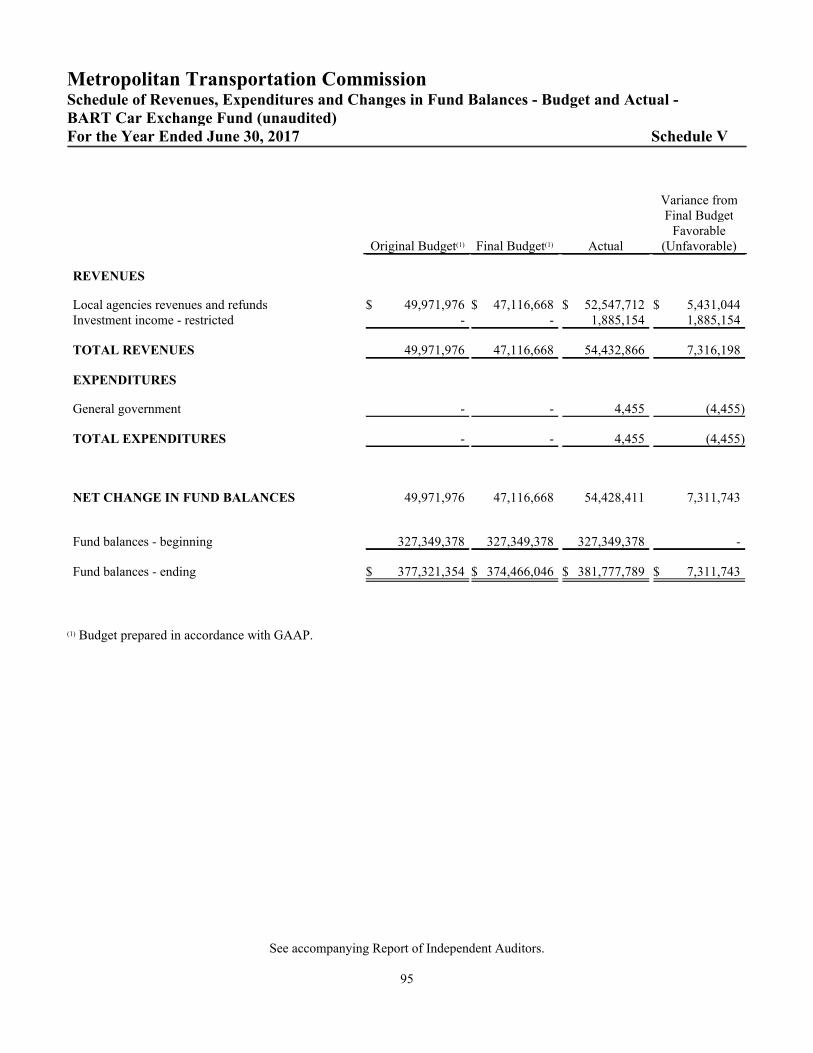
Metropolitan Transportation CommissionSchedule of Revenues, Expenditures and Changes in Fund Balances - Budget and Actual - BART Car Exchange Fund (unaudited)For the Year Ended June 30, 2017 Schedule V
Original Budget(1) Final Budget(1) Actual
Variance fromFinal Budget
Favorable(Unfavorable)
REVENUES
Local agencies revenues and refunds $ 49,971,976 $ 47,116,668 $ 52,547,712 $ 5,431,044Investment income - restricted - - 1,885,154 1,885,154
TOTAL REVENUES 49,971,976 47,116,668 54,432,866 7,316,198
EXPENDITURES
General government - - 4,455 (4,455)
TOTAL EXPENDITURES - - 4,455 (4,455)
NET CHANGE IN FUND BALANCES 49,971,976 47,116,668 54,428,411 7,311,743
Fund balances - beginning 327,349,378 327,349,378 327,349,378 -
Fund balances - ending $ 377,321,354 $ 374,466,046 $ 381,777,789 $ 7,311,743
(1) Budget prepared in accordance with GAAP.
See accompanying Report of Independent Auditors.
95

Metropolitan Transportation CommissionSchedules of Funding Progress (unaudited)For the Year Ended June 30, 2017 Schedule VI
Other Post Employment Benefits
ActuarialValuation
Date
ActuarialValue ofAssets
(a)
ActuarialAccruedLiability(AAL)
Entry Age(b)
UnfundedAAL
(UAAL)(b-a)
FundedRatio(a/b)
CoveredPayroll
(c)
UAAL as aPercentageof Covered
Payroll((b-a)/c)
January 1, 2013 $ 13,124,584 $ 24,735,009 $ 11,610,425 %53.1 $ 17,799,482 %65.2January 1, 2015 17,705,619 29,092,241 11,386,622 %60.9 20,191,937 %56.4January 1, 2017 22,479,761 35,790,094 13,310,333 %62.8 23,713,136 %56.1
96
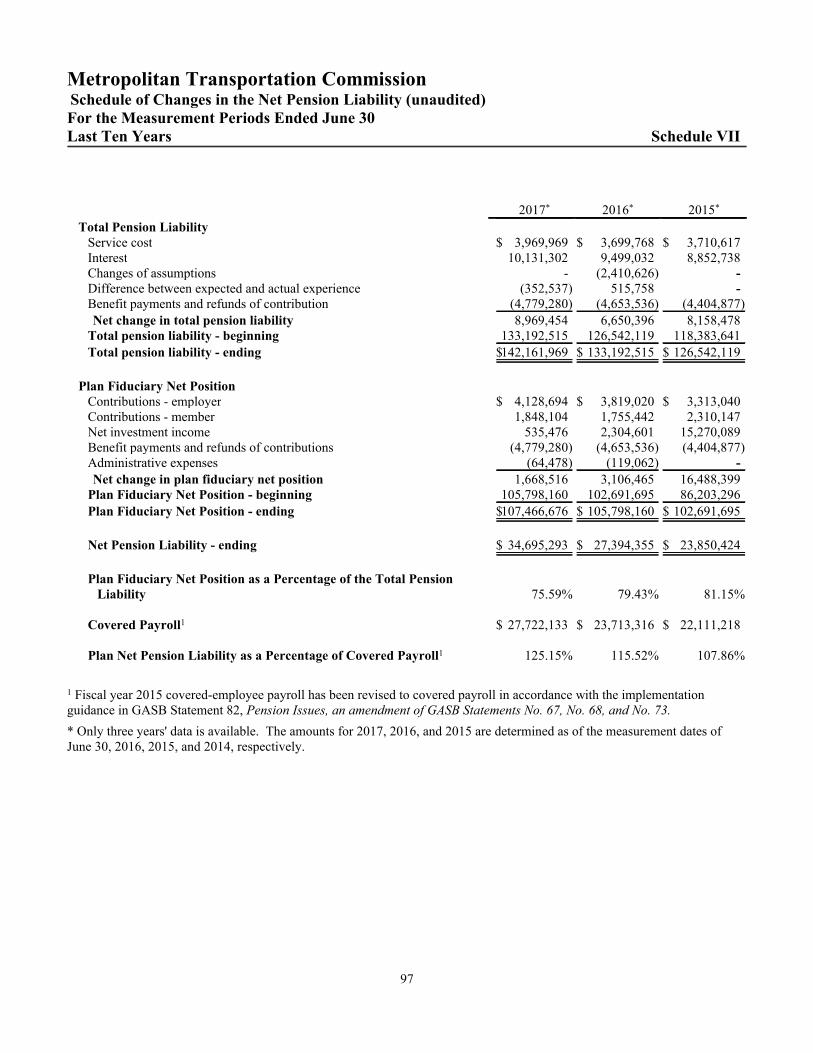
Metropolitan Transportation CommissionSchedule of Changes in the Net Pension Liability (unaudited)For the Measurement Periods Ended June 30Last Ten Years Schedule VII
2017* 2016* 2015*
Total Pension LiabilityService cost $ 3,969,969 $ 3,699,768 $ 3,710,617Interest 10,131,302 9,499,032 8,852,738Changes of assumptions - (2,410,626) -Difference between expected and actual experience (352,537) 515,758 -Benefit payments and refunds of contribution (4,779,280) (4,653,536) (4,404,877)
Net change in total pension liability 8,969,454 6,650,396 8,158,478Total pension liability - beginning 133,192,515 126,542,119 118,383,641
Total pension liability - ending $142,161,969 $ 133,192,515 $ 126,542,119
Plan Fiduciary Net PositionContributions - employer $ 4,128,694 $ 3,819,020 $ 3,313,040Contributions - member 1,848,104 1,755,442 2,310,147Net investment income 535,476 2,304,601 15,270,089Benefit payments and refunds of contributions (4,779,280) (4,653,536) (4,404,877)Administrative expenses (64,478) (119,062) -
Net change in plan fiduciary net position 1,668,516 3,106,465 16,488,399Plan Fiduciary Net Position - beginning 105,798,160 102,691,695 86,203,296
Plan Fiduciary Net Position - ending $107,466,676 $ 105,798,160 $ 102,691,695
Net Pension Liability - ending $ 34,695,293 $ 27,394,355 $ 23,850,424
Plan Fiduciary Net Position as a Percentage of the Total PensionLiability 75.59% 79.43% 81.15%
Covered Payroll1 $ 27,722,133 $ 23,713,316 $ 22,111,218
Plan Net Pension Liability as a Percentage of Covered Payroll1 125.15% 115.52% 107.86%
1 Fiscal year 2015 covered-employee payroll has been revised to covered payroll in accordance with the implementationguidance in GASB Statement 82, Pension Issues, an amendment of GASB Statements No. 67, No. 68, and No. 73.
* Only three years' data is available. The amounts for 2017, 2016, and 2015 are determined as of the measurement dates ofJune 30, 2016, 2015, and 2014, respectively.
97
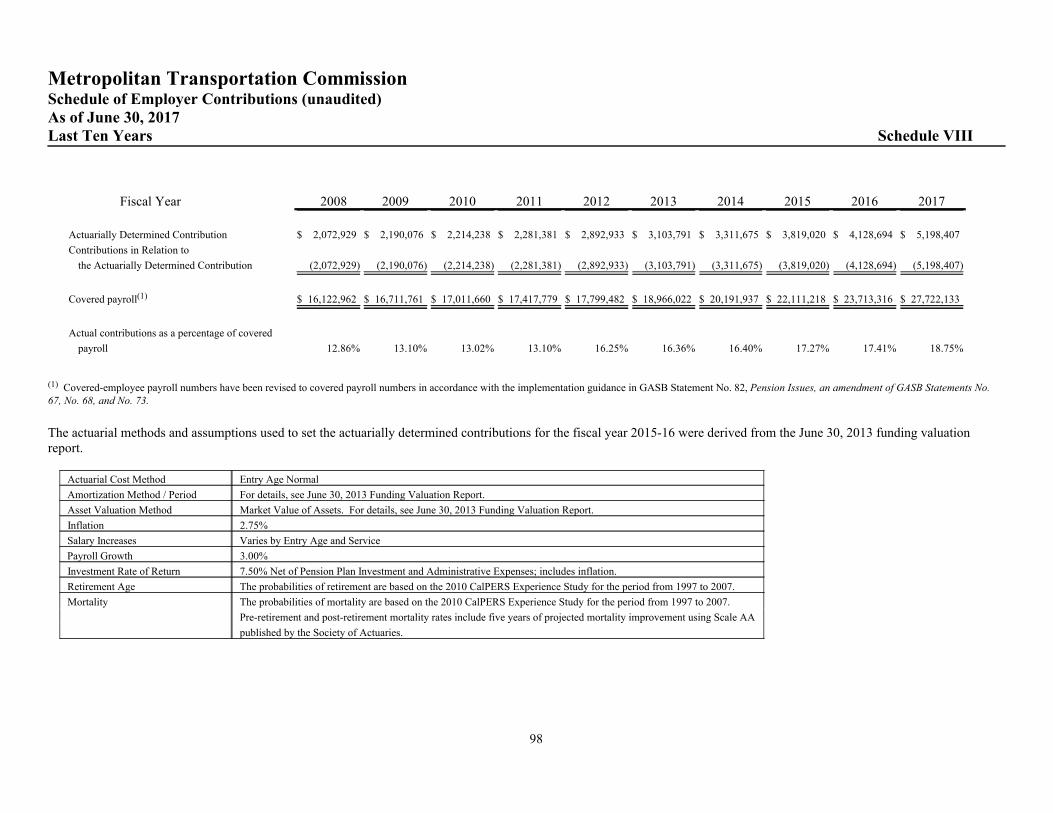
Metropolitan Transportation CommissionSchedule of Employer Contributions (unaudited)As of June 30, 2017Last Ten Years Schedule VIII
Fiscal Year 2008 2009 2010 2011 2012 2013 2014 2015 2016 2017
Actuarially Determined Contribution $ 2,072,929 $ 2,190,076 $ 2,214,238 $ 2,281,381 $ 2,892,933 $ 3,103,791 $ 3,311,675 $ 3,819,020 $ 4,128,694 $ 5,198,407
Contributions in Relation to
the Actuarially Determined Contribution (2,072,929) (2,190,076) (2,214,238) (2,281,381) (2,892,933) (3,103,791) (3,311,675) (3,819,020) (4,128,694) (5,198,407)
Covered payroll(1) $ 16,122,962 $ 16,711,761 $ 17,011,660 $ 17,417,779 $ 17,799,482 $ 18,966,022 $ 20,191,937 $ 22,111,218 $ 23,713,316 $ 27,722,133
Actual contributions as a percentage of covered
payroll 12.86% 13.10% 13.02% 13.10% 16.25% 16.36% 16.40% 17.27% 17.41% 18.75%
(1) Covered-employee payroll numbers have been revised to covered payroll numbers in accordance with the implementation guidance in GASB Statement No. 82, Pension Issues, an amendment of GASB Statements No.67, No. 68, and No. 73.
The actuarial methods and assumptions used to set the actuarially determined contributions for the fiscal year 2015-16 were derived from the June 30, 2013 funding valuationreport.
Actuarial Cost Method Entry Age Normal
Amortization Method / Period For details, see June 30, 2013 Funding Valuation Report.
Asset Valuation Method Market Value of Assets. For details, see June 30, 2013 Funding Valuation Report.
Inflation 2.75%
Salary Increases Varies by Entry Age and Service
Payroll Growth 3.00%
Investment Rate of Return 7.50% Net of Pension Plan Investment and Administrative Expenses; includes inflation.
Retirement Age The probabilities of retirement are based on the 2010 CalPERS Experience Study for the period from 1997 to 2007.
Mortality The probabilities of mortality are based on the 2010 CalPERS Experience Study for the period from 1997 to 2007.
Pre-retirement and post-retirement mortality rates include five years of projected mortality improvement using Scale AA
published by the Society of Actuaries.
98

OTHER SUPPLEMENTARY INFORMATION
99

Metropolitan Transportation CommissionCombining Balance Sheet - Non-Major Governmental FundsJune 30, 2017 Schedule 1
Transit Reserves Exchange Feeder Bus Prop 1B Fund Capital Projects
Total Non-MajorGovernmental
Funds
ASSETSCash - unrestricted $ 21,026,112 $ 28,616,654 $ 169,178 $ 1,326,455 $ - $ 51,138,399Investment - unrestricted 33,519,961 - - - - 33,519,961Receivables
Accounts - 1,100,000 - - - 1,100,000Interest 30,937 - - - - 30,937
Due from other funds - - - - 499,769 499,769Prepaid items - - - 1,666 - 1,666
TOTAL ASSETS $ 54,577,010 $ 29,716,654 $ 169,178 $ 1,328,121 $ 499,769 $ 86,290,732
LIABILITIESAccounts payable and accrued expenditures $ 4,505,768 $ - $ - $ 182,933 $ - $ 4,688,701Due to other funds 27,996 - - 967 - 28,963
TOTAL LIABILITIES 4,533,764 - - 183,900 - 4,717,664
DEFERRED INFLOWS OF RESOURCESDeferred revenues 42,056,945 - - - - 42,056,945
TOTAL DEFERRED INFLOWS OFRESOURCES 42,056,945 - - - - 42,056,945
FUND BALANCESRestricted for:
Transportation projects 7,986,301 - 169,178 1,144,221 - 9,299,700
Committed to:Building reserve - - - - 499,769 499,769Transportation projects - 29,716,654 - - - 29,716,654
TOTAL FUND BALANCES 7,986,301 29,716,654 169,178 1,144,221 499,769 39,516,123
TOTAL LIABILITIES, DEFERRED INFLOWS OFRESOURCES, AND FUND BALANCES $ 54,577,010 $ 29,716,654 $ 169,178 $ 1,328,121 $ 499,769 $ 86,290,732
100

Metropolitan Transportation CommissionCombining Statement of Revenues, Expenditures and Changes in Fund Balances -Non-Major Governmental FundsFor the Year Ended June 30, 2017 Schedule 2
TransitReserves Exchange Feeder Bus Prop 1B Fund
CapitalProjects
Total Non-MajorGovernmental
Funds
REVENUESGrants - State $ 3,243,001 $ - $ - $ - $ - $ 3,243,001Local agencies revenues and refunds - 1,100,000 - - - 1,100,000Investment income - unrestricted 263,545 131,179 775 6,731 - 402,230
TOTAL REVENUES 3,506,546 1,231,179 775 6,731 - 4,745,231
ExpendituresCurrent:
General government - - - 468,788 - 468,788Allocations to other agencies 6,025,115 - - - - 6,025,115
TOTAL EXPENDITURES 6,025,115 - - 468,788 - 6,493,903
EXCESS/(DEFICIENCY) OF REVENUES OVER/(UNDER) EXPENDITURES (2,518,569) 1,231,179 775 (462,057) - (1,748,672)
OTHER FINANCING SOURCES (USES)Transfers in 2,106,449 - - 95,000 - 2,201,449Transfers out (51,785) - - (967) - (52,752)
TOTAL OTHER FINANCING SOURCES 2,054,664 - - 94,033 - 2,148,697
NET CHANGE IN FUND BALANCES (463,905) 1,231,179 775 (368,024) - 400,025
Fund balances - beginning 8,450,206 28,485,475 168,403 1,512,245 499,769 39,116,098
Fund balances - ending $ 7,986,301 $ 29,716,654 $ 169,178 $ 1,144,221 $ 499,769 $ 39,516,123
101
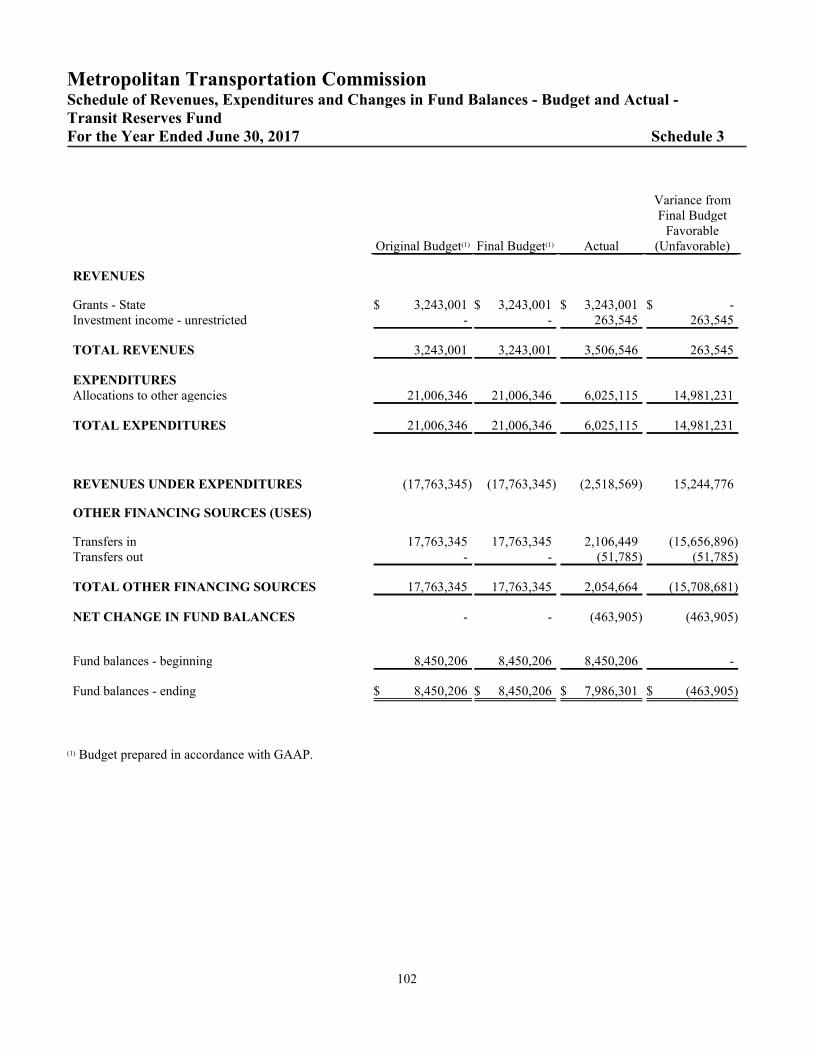
Metropolitan Transportation CommissionSchedule of Revenues, Expenditures and Changes in Fund Balances - Budget and Actual - Transit Reserves Fund For the Year Ended June 30, 2017 Schedule 3
Original Budget(1) Final Budget(1) Actual
Variance fromFinal Budget
Favorable(Unfavorable)
REVENUES
Grants - State $ 3,243,001 $ 3,243,001 $ 3,243,001 $ -Investment income - unrestricted - - 263,545 263,545
TOTAL REVENUES 3,243,001 3,243,001 3,506,546 263,545
EXPENDITURESAllocations to other agencies 21,006,346 21,006,346 6,025,115 14,981,231
TOTAL EXPENDITURES 21,006,346 21,006,346 6,025,115 14,981,231
REVENUES UNDER EXPENDITURES (17,763,345) (17,763,345) (2,518,569) 15,244,776
OTHER FINANCING SOURCES (USES)
Transfers in 17,763,345 17,763,345 2,106,449 (15,656,896)Transfers out - - (51,785) (51,785)
TOTAL OTHER FINANCING SOURCES 17,763,345 17,763,345 2,054,664 (15,708,681)
NET CHANGE IN FUND BALANCES - - (463,905) (463,905)
Fund balances - beginning 8,450,206 8,450,206 8,450,206 -
Fund balances - ending $ 8,450,206 $ 8,450,206 $ 7,986,301 $ (463,905)
(1) Budget prepared in accordance with GAAP.
102
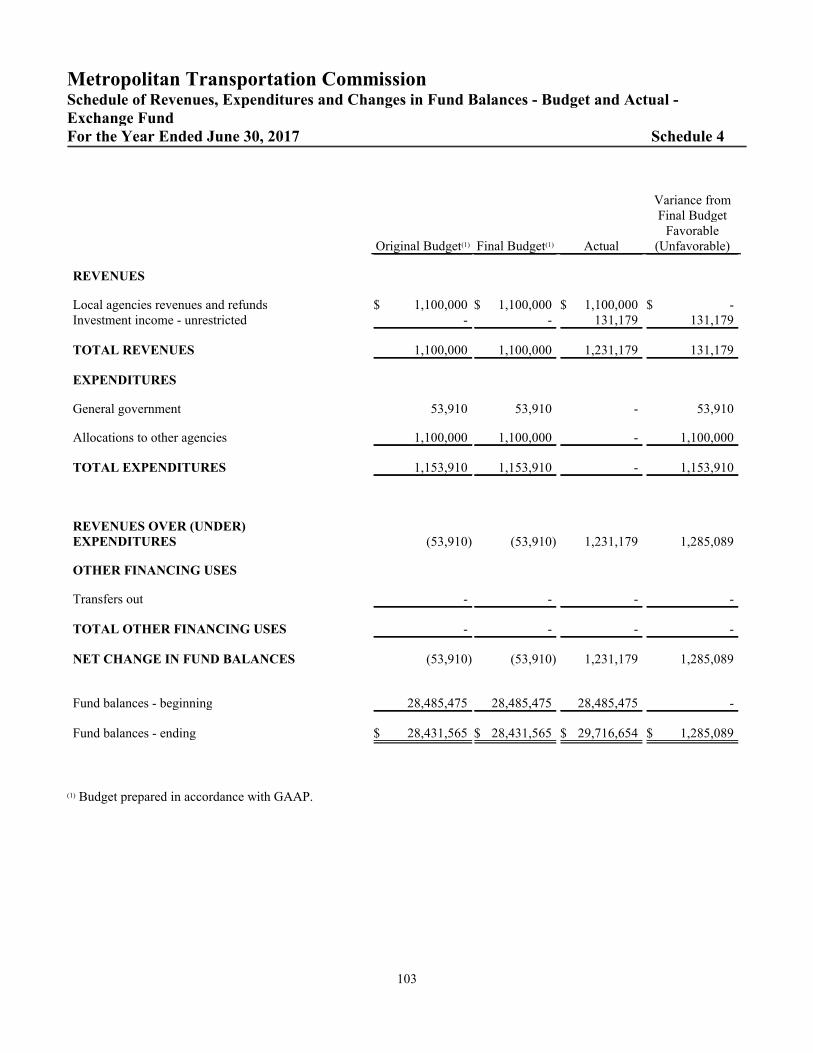
Metropolitan Transportation CommissionSchedule of Revenues, Expenditures and Changes in Fund Balances - Budget and Actual - Exchange Fund For the Year Ended June 30, 2017 Schedule 4
Original Budget(1) Final Budget(1) Actual
Variance fromFinal Budget
Favorable(Unfavorable)
REVENUES
Local agencies revenues and refunds $ 1,100,000 $ 1,100,000 $ 1,100,000 $ -Investment income - unrestricted - - 131,179 131,179
TOTAL REVENUES 1,100,000 1,100,000 1,231,179 131,179
EXPENDITURES
General government 53,910 53,910 - 53,910
Allocations to other agencies 1,100,000 1,100,000 - 1,100,000
TOTAL EXPENDITURES 1,153,910 1,153,910 - 1,153,910
REVENUES OVER (UNDER)EXPENDITURES (53,910) (53,910) 1,231,179 1,285,089
OTHER FINANCING USES
Transfers out - - - -
TOTAL OTHER FINANCING USES - - - -
NET CHANGE IN FUND BALANCES (53,910) (53,910) 1,231,179 1,285,089
Fund balances - beginning 28,485,475 28,485,475 28,485,475 -
Fund balances - ending $ 28,431,565 $ 28,431,565 $ 29,716,654 $ 1,285,089
(1) Budget prepared in accordance with GAAP.
103

Metropolitan Transportation CommissionSchedule of Revenues, Expenditures and Changes in Fund Balances - Budget and Actual - Feeder Bus Fund For the Year Ended June 30, 2017 Schedule 5
Original Budget(1) Final Budget(1) Actual
Variance fromFinal Budget
Favorable(Unfavorable)
REVENUES
Investment income - unrestricted $ - $ - $ 775 $ 775
TOTAL REVENUES - - 775 775
NET CHANGE IN FUND BALANCES - - 775 775
Fund balances - beginning 168,403 168,403 168,403 -
Fund balances - ending $ 168,403 $ 168,403 $ 169,178 $ 775
(1) Budget prepared in accordance with GAAP.
104

Metropolitan Transportation CommissionSchedule of Revenues, Expenditures and Changes in Fund Balances - Budget and Actual -Prop 1B FundFor the Year Ended June 30, 2017 Schedule 6
Original Budget(1) Final Budget(1) Actual
Variance fromFinal Budget
Favorable(Unfavorable)
REVENUES
Investment income - unrestricted $ - $ - $ 6,731 $ 6,731
TOTAL REVENUES - - 6,731 6,731
EXPENDITURES
General government 1,512,245 1,512,245 468,788 1,043,457
TOTAL EXPENDITURES 1,512,245 1,512,245 468,788 1,043,457
REVENUES UNDER EXPENDITURES (1,512,245) (1,512,245) (462,057) 1,050,188
OTHER FINANCING SOURCES
Transfers in - - 95,000 95,000
Transfers out - - (967) (967)
TOTAL OTHER FINANCING SOURCES - - 94,033 94,033
NET CHANGE IN FUND BALANCES (1,512,245) (1,512,245) (368,024) 1,144,221
Fund balances - beginning 1,512,245 1,512,245 1,512,245 -
Fund balances - ending $ - $ - $ 1,144,221 $ 1,144,221
(1) Budget prepared in accordance with GAAP.
105
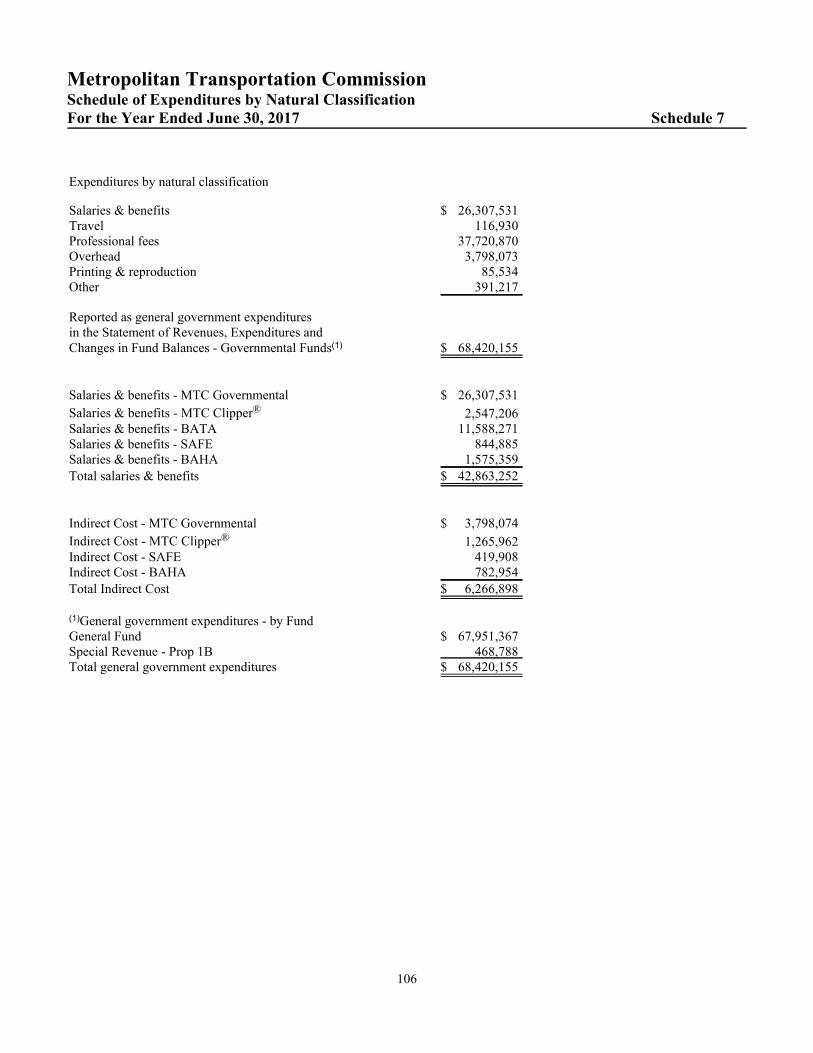
Metropolitan Transportation CommissionSchedule of Expenditures by Natural ClassificationFor the Year Ended June 30, 2017 Schedule 7
Expenditures by natural classification
Salaries & benefits $ 26,307,531Travel 116,930Professional fees 37,720,870Overhead 3,798,073Printing & reproduction 85,534Other 391,217
Reported as general government expendituresin the Statement of Revenues, Expenditures andChanges in Fund Balances - Governmental Funds(1) $ 68,420,155
Salaries & benefits - MTC Governmental $ 26,307,531
Salaries & benefits - MTC Clipper® 2,547,206Salaries & benefits - BATA 11,588,271Salaries & benefits - SAFE 844,885Salaries & benefits - BAHA 1,575,359
Total salaries & benefits $ 42,863,252
Indirect Cost - MTC Governmental $ 3,798,074
Indirect Cost - MTC Clipper® 1,265,962Indirect Cost - SAFE 419,908Indirect Cost - BAHA 782,954
Total Indirect Cost $ 6,266,898
(1)General government expenditures - by FundGeneral Fund $ 67,951,367Special Revenue - Prop 1B 468,788Total general government expenditures $ 68,420,155
106
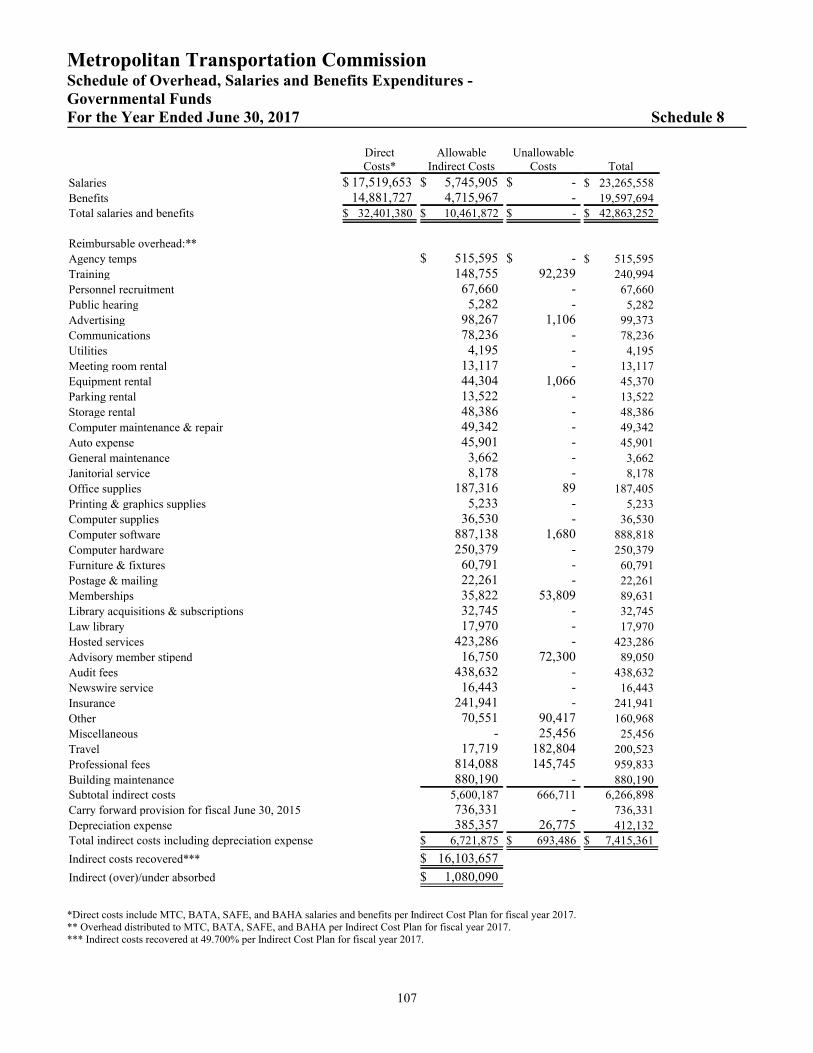
Metropolitan Transportation CommissionSchedule of Overhead, Salaries and Benefits Expenditures -Governmental FundsFor the Year Ended June 30, 2017 Schedule 8
DirectCosts*
AllowableIndirect Costs
UnallowableCosts Total
Salaries $ 17,519,653 $ 5,745,905 $ - $ 23,265,558
Benefits 14,881,727 4,715,967 - 19,597,694
Total salaries and benefits $ 32,401,380 $ 10,461,872 $ - $ 42,863,252
Reimbursable overhead:**
Agency temps $ 515,595 $ - $ 515,595
Training 148,755 92,239 240,994
Personnel recruitment 67,660 - 67,660
Public hearing 5,282 - 5,282
Advertising 98,267 1,106 99,373
Communications 78,236 - 78,236
Utilities 4,195 - 4,195
Meeting room rental 13,117 - 13,117
Equipment rental 44,304 1,066 45,370
Parking rental 13,522 - 13,522
Storage rental 48,386 - 48,386
Computer maintenance & repair 49,342 - 49,342
Auto expense 45,901 - 45,901
General maintenance 3,662 - 3,662
Janitorial service 8,178 - 8,178
Office supplies 187,316 89 187,405
Printing & graphics supplies 5,233 - 5,233
Computer supplies 36,530 - 36,530
Computer software 887,138 1,680 888,818
Computer hardware 250,379 - 250,379
Furniture & fixtures 60,791 - 60,791
Postage & mailing 22,261 - 22,261
Memberships 35,822 53,809 89,631
Library acquisitions & subscriptions 32,745 - 32,745
Law library 17,970 - 17,970
Hosted services 423,286 - 423,286
Advisory member stipend 16,750 72,300 89,050
Audit fees 438,632 - 438,632
Newswire service 16,443 - 16,443
Insurance 241,941 - 241,941
Other 70,551 90,417 160,968
Miscellaneous - 25,456 25,456
Travel 17,719 182,804 200,523
Professional fees 814,088 145,745 959,833
Building maintenance 880,190 - 880,190
Subtotal indirect costs 5,600,187 666,711 6,266,898
Carry forward provision for fiscal June 30, 2015 736,331 - 736,331
Depreciation expense 385,357 26,775 412,132
Total indirect costs including depreciation expense $ 6,721,875 $ 693,486 $ 7,415,361
Indirect costs recovered*** $ 16,103,657
Indirect (over)/under absorbed $ 1,080,090
*Direct costs include MTC, BATA, SAFE, and BAHA salaries and benefits per Indirect Cost Plan for fiscal year 2017.** Overhead distributed to MTC, BATA, SAFE, and BAHA per Indirect Cost Plan for fiscal year 2017.*** Indirect costs recovered at 49.700% per Indirect Cost Plan for fiscal year 2017.
107

Metropolitan Transportation CommissionSchedule of Expenditures - Federal Highway Administration GrantFY2017 OWPMTCFor the Year Ended June 30, 2017 Schedule 9
ABAG MTC Total
Authorized ExpendituresFederal $ 1,115,587 $ 7,465,753 $ 8,581,340
Total authorized expenditures 1,115,587 7,465,753 8,581,340
Actual Expenditures *
Program No. Program Name
Association of Bay Area Governments (ABAG)
1611 Develop Community Projects 1,115,587 - 1,115,587
MTC
1112 Public Information Program - 1,843,757 1,843,7571113 Support Partnership Board - 135,000 135,0001114 Support Advisory Committees - 180,000 180,0001121 Develop/Produce the 2001 RTP - 1,340,000 1,340,0001122 Dev/Anlyz Travel Models & Data - 2,163,421 2,163,4211125 Non-Motorized Transportation - 67,292 67,2921156 Library Services - 147,913 147,9131212 Dev MTS Performance Measures - 180,000 180,0001311 Dev/Imp Welfare to Work Prgrms - 80,000 80,0001511 Conduct Fin Analy of RTP/Plng - 299,639 299,6391512 Implement Federal Transp Legisln - 953,457 953,457
Total Expenditures 1,115,587 7,390,479 8,506,066
Balance of Federal Highway Administration Grant $ - $ 75,274 $ 75,274
*Toll credit match rate (88.53%)
108

Metropolitan Transportation CommissionToll Bridge Rate ScheduleBy Fiscal Year Schedule 10
Number of Toll Rate for Fiscal Year Ending June 30,Axles Per
Vehicle 2015 2016 2017
2 axles $ 5.00 * $ 5.00 * $ 5.00 *
3 axles 15.00 15.00 15.00
4 axles 20.00 20.00 20.00
5 axles 25.00 25.00 25.00
6 axles 30.00 30.00 30.00
7 axles or more 35.00 35.00 35.00
* During peak hours on all bridges, a reduced-rate toll of $2.50 is collected on high-occupancy and inherently-low-emissiontwo-axle vehicles. On the San Francisco-Oakland Bay Bridge, a weekday toll of $6.00 is collected on all other two-axlevehicles during peak hours, and a weekday toll of $4.00 is collected on all two-axle vehicles during non-peak hours.
109

Metropolitan Transportation CommissionSchedule of Computations DemonstratingBond Covenant Compliance - BATA Proprietary FundFor the Year Ended June 30, 2017 Schedule 11
2017Revenues
Toll revenues collected $ 720,784,303Investment income 16,158,550Other operating revenues 26,477,053
Revenues subtotal 763,419,906Build America Bonds (BABs) interest subsidy 71,297,932Derivative investment charge 155,538,930
Total revenues 990,256,768
Operating expensesOperating expenses incurred by Caltrans 25,018,218Services and charges - BATA 52,202,341Transbay Terminal JPA operations 4,691,507
Total operating expenses before depreciation and amortization 81,912,066Depreciation and amortization 5,803,130
Total operating expenses 87,715,196
Net operating income 902,541,572
Nonoperating expenses (revenues)Interest expense 452,371,630Financing fees and bond issuance costs 13,678,917Other nonoperating expenses 68,881Caltrans/other agency operating grants (9,534,709)Other nonoperating revenues (1,524,628)Return of contribution from BAHA (29,700,000)
Total nonoperating expenses 425,360,091
Income before operating transfers 477,181,481
Operating transfersMTC/ SAFE/ CLIPPER administrative & operating transfers 10,637,082MTC transit transfers:
AB 664 expenses 8,936,14590% rail expenses 7,255,6362% transit expenses 2,106,449
Allocations to other agencies (RM2) 42,677,112
Total operating transfers 71,612,424
Net income before capital transfers 405,569,057
Capital project expenses (revenues)Capital expenses 34,825,132Distribution to Caltrans for their capital purposes 221,054,905Distributions to other agencies for their capital purposes 128,253,119Distributions to MTC 380,996Gain on sale of capital assets (757,260)
Total capital project expenses 383,756,892
Change in net position 21,812,165Total net position - beginning (6,662,356,977)
Total net position - ending $ (6,640,544,812)
110

Metropolitan Transportation CommissionSchedule of Computations DemonstratingBond Covenant Compliance - BATA Proprietary Fund, continuedJune 30, 2017 Schedule 11
2017
Senior Bond - Debt Service CovenantNet revenue1 $ 738,401,688Debt service2 262,813,777Debt service coverage4 2.81Debt service coverage - bond covenant requirement 1.20
Net revenue1plus operations & maintenance reserve $ 888,401,688Fixed charges5, operating transfer and costs7 320,819,478Fixed charges coverage 2.77Fixed charges coverage - bond covenant requirement 1.25
Combined Bonds - Debt Service CovenantNet revenue1 $ 738,401,688Debt service3,10, operating transfer and costs7,11 514,312,820Sum sufficient coverage 1.44Sum sufficient coverage - bond covenant requirement 1.00
Net revenue1,6 $ 689,014,553Debt service3 435,908,698Subordinate debt service coverage 1.58Subordinate debt service coverage - bond covenant requirement 1.20
Self insurance reserve - Caltrans Cooperative Agreement9 $ 50,000,000Operations & maintenance reserve8,9 150,000,000Rehabilitation reserve9 120,000,000Project/operating reserves & variable rate risk reserve9 $ 680,000,000
1 Revenues subtotal less Caltrans operating expenses.2 Senior debt service expense less BABs interest subsidy on senior bonds plus principal retirement of $54,835,000..3 Total debt service expense less BABs interest subsidy plus principal retirement of $54,835,000.4 Based on debt outstanding from May 24, 2001 to February 23, 2017.5 Fixed charges comprise debt service and operating transfers.6 Net revenues less Maintenance A transfer and net of BATA service charges against other agency operating grants.7 Operating transfer and costs include RM 2 operating costs less amortization of Transit Transfer to MTC (Transit Transfer obligation for the next 44 years was fulfilled in early September 2010).8 Minimum required operation & maintenance reserve is $63 million, but currently maintained at $150 million.9 Designated reserves through BATA resolution.10 Debt service includes Maintenance A transfer.11 Financing costs.
111

Metropolitan Transportation CommissionSchedule of Operating Revenues and Expenses - BATA Proprietary Fund - By BridgeFor the Year Ended June 30, 2017 Schedule 12
CarquinezBridge
Benicia -Martinez
BridgeAntiochBridge
Richmond - SanRafael Bridge
San Francisco -Oakland Bay
Bridge
San Mateo -Hayward
BridgeDumbarton
Bridge Total
Operating revenuesToll revenues collected $123,022,648 $116,977,648 $15,425,397 $ 78,142,955 $ 227,403,833 $100,495,035 $59,316,787 $ 720,784,303 *
Other operating revenues 4,300,587 4,708,673 453,538 3,059,858 8,853,319 3,280,314 1,820,764 26,477,053
Total operating revenues 127,323,235 121,686,321 15,878,935 81,202,813 236,257,152 103,775,349 61,137,551 747,261,356
Operating expenses
Operating expenditures-by Caltrans &Transbay JPA 3,752,653 4,019,371 1,638,073 2,370,737 12,782,579 2,939,072 2,207,240 29,709,725Services and charges 14,853,751 14,123,877 1,862,462 9,434,978 27,456,731 12,133,767 7,161,907 87,027,473Allocations to other agencies 7,284,081 6,926,161 913,326 4,626,787 13,464,415 5,950,238 3,512,104 42,677,112Depreciation 988,775 944,999 123,314 630,610 1,834,741 805,905 474,786 5,803,130
Total operating expenses 26,879,260 26,014,408 4,537,175 17,063,112 55,538,466 21,828,982 13,356,037 165,217,440
Operating income $100,443,975 $ 95,671,913 $11,341,760 $ 64,139,701 $ 180,718,686 $ 81,946,367 $47,781,514 $ 582,043,916
*Toll revenues by ProgramRegional Measure 1 (RM 1) 27,369,390 25,191,454 3,462,517 16,758,677 49,306,384 21,887,603 12,642,373 156,618,398Regional Measure 2 (RM 2) 20,856,015 20,701,465 2,523,833 14,022,473 42,251,169 17,730,219 10,791,960 128,877,134Seismic Program 74,797,242 71,084,729 9,439,047 47,361,805 135,846,280 60,877,213 35,882,455 435,288,771
Total toll revenues $123,022,647 $116,977,648 $15,425,397 $ 78,142,955 $ 227,403,833 $100,495,035 $59,316,788 $ 720,784,303
112

Metropolitan Transportation CommissionCombining Statement of Changes in Assets and Liabilities by Participant -Agency FundsFor the Year Ended June 30, 2017 Schedule 13
BalanceJuly 1, 2016 Additions Deductions
BalanceJune 30, 2017
County of AlamedaAssetsCash and investments $ 25,644,165 $ 86,317,029 $ 87,115,918 $ 24,845,276Interest receivables 16,974 33,000 16,974 33,000
Total Assets $ 25,661,139 $ 86,350,029 $ 87,132,892 $ 24,878,276
LiabilitiesAccounts payable and accrued liabilities $ 1,101,196 $ 77,745,493 $ 76,968,237 $ 1,878,452Due to other governments 24,559,943 8,604,536 10,164,655 22,999,824
Total Liabilities $ 25,661,139 $ 86,350,029 $ 87,132,892 $ 24,878,276
County of Contra CostaAssetsCash and investments $ 18,558,116 $ 46,915,022 $ 47,344,589 $ 18,128,549Accounts receivable - 67,527 - 67,527
Total Assets $ 18,558,116 $ 46,982,549 $ 47,344,589 $ 18,196,076
LiabilitiesAccounts payable and accrued liabilities $ 522,700 $ 42,042,037 $ 41,989,589 $ 575,148Due to other governments 18,035,416 4,940,512 5,355,000 17,620,928
Total Liabilities $ 18,558,116 $ 46,982,549 $ 47,344,589 $ 18,196,076
County of MarinAssetsCash and investments $ 841,182 $ 13,991,961 $ 14,194,555 $ 638,588Interest receivables 1,525 2,030 1,525 2,030
Total Assets $ 842,707 $ 13,993,991 $ 14,196,080 $ 640,618
LiabilitiesAccounts payable and accrued liabilities $ 453,237 $ 12,084,525 $ 12,488,116 $ 49,646Due to other governments 389,470 1,909,466 1,707,964 590,972
Total Liabilities $ 842,707 $ 13,993,991 $ 14,196,080 $ 640,618
County of NapaAssetsCash and investments $ 8,109,432 $ 11,958,329 $ 14,355,810 $ 5,711,951
Total Assets $ 8,109,432 $ 11,958,329 $ 14,355,810 $ 5,711,951
LiabilitiesAccounts payable and accrued liabilities $ 296,788 $ 12,976,500 $ 13,223,678 $ 49,610Due to other governments 7,812,644 (1,018,171) 1,132,132 5,662,341
Total Liabilities $ 8,109,432 $ 11,958,329 $ 14,355,810 $ 5,711,951
113

Metropolitan Transportation CommissionCombining Statement of Changes in Assets and Liabilities by Participant -Agency Funds, continuedFor the Year Ended June 30, 2017 Schedule 13
BalanceJuly 1, 2016 Additions Deductions
BalanceJune 30, 2017
County of San FranciscoAssetsCash and investments $ 1,240,697 $ 55,003,718 $ 55,228,304 $ 1,016,111Interest receivables - 3,436 - 3,436
Total Assets $ 1,240,697 $ 55,007,154 $ 55,228,304 $ 1,019,547
LiabilitiesAccounts payable and accrued liabilities $ 358,321 $ 47,113,595 $ 47,051,628 $ 420,288Due to other governments 882,376 7,893,559 8,176,676 599,259
Total Liabilities $ 1,240,697 $ 55,007,154 $ 55,228,304 $ 1,019,547
County of San MateoAssetsCash and investments $ 8,542,156 $ 43,778,426 $ 45,836,743 $ 6,483,839Interest receivables - 22,143 - 22,143
Total Assets $ 8,542,156 $ 43,800,569 $ 45,836,743 $ 6,505,982
LiabilitiesAccounts payable and accrued liabilities $ 1,077,550 $ 40,093,716 $ 41,097,886 $ 73,380Due to other governments 7,464,606 3,706,853 4,738,857 6,432,602
Total Liabilities $ 8,542,156 $ 43,800,569 $ 45,836,743 $ 6,505,982
County of Santa ClaraAssetsCash and investments $ 10,144,044 $ 121,793,154 $ 124,860,730 $ 7,076,468
Total Assets $ 10,144,044 $ 121,793,154 $ 124,860,730 $ 7,076,468
LiabilitiesAccounts payable and accrued liabilities $ 713,226 $ 104,639,850 $ 104,064,839 $ 1,288,237Due to other governments 9,430,818 17,153,304 20,795,891 5,788,231
Total Liabilities $ 10,144,044 $ 121,793,154 $ 124,860,730 $ 7,076,468
County of SolanoAssetsCash and investments $ 22,941,526 $ 20,220,416 $ 18,302,162 $ 24,859,780
Total Assets $ 22,941,526 $ 20,220,416 $ 18,302,162 $ 24,859,780
LiabilitiesAccounts payable and accrued liabilities $ 1,873,503 $ 14,841,748 $ 15,924,759 $ 790,492Due to other governments 21,068,023 5,378,668 2,377,403 24,069,288
Total Liabilities $ 22,941,526 $ 20,220,416 $ 18,302,162 $ 24,859,780
114
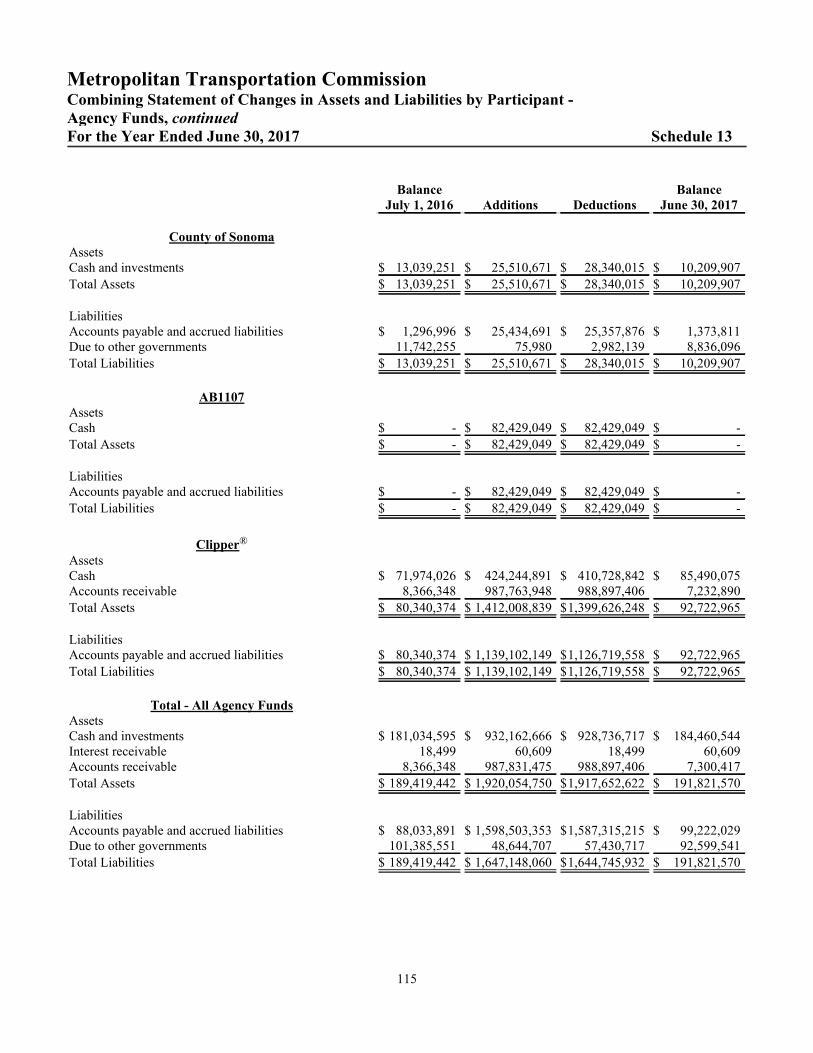
Metropolitan Transportation CommissionCombining Statement of Changes in Assets and Liabilities by Participant -Agency Funds, continuedFor the Year Ended June 30, 2017 Schedule 13
BalanceJuly 1, 2016 Additions Deductions
BalanceJune 30, 2017
County of SonomaAssetsCash and investments $ 13,039,251 $ 25,510,671 $ 28,340,015 $ 10,209,907
Total Assets $ 13,039,251 $ 25,510,671 $ 28,340,015 $ 10,209,907
LiabilitiesAccounts payable and accrued liabilities $ 1,296,996 $ 25,434,691 $ 25,357,876 $ 1,373,811Due to other governments 11,742,255 75,980 2,982,139 8,836,096
Total Liabilities $ 13,039,251 $ 25,510,671 $ 28,340,015 $ 10,209,907
AB1107AssetsCash $ - $ 82,429,049 $ 82,429,049 $ -
Total Assets $ - $ 82,429,049 $ 82,429,049 $ -
LiabilitiesAccounts payable and accrued liabilities $ - $ 82,429,049 $ 82,429,049 $ -
Total Liabilities $ - $ 82,429,049 $ 82,429,049 $ -
Clipper®
AssetsCash $ 71,974,026 $ 424,244,891 $ 410,728,842 $ 85,490,075Accounts receivable 8,366,348 987,763,948 988,897,406 7,232,890
Total Assets $ 80,340,374 $ 1,412,008,839 $1,399,626,248 $ 92,722,965
LiabilitiesAccounts payable and accrued liabilities $ 80,340,374 $ 1,139,102,149 $1,126,719,558 $ 92,722,965
Total Liabilities $ 80,340,374 $ 1,139,102,149 $1,126,719,558 $ 92,722,965
Total - All Agency FundsAssetsCash and investments $ 181,034,595 $ 932,162,666 $ 928,736,717 $ 184,460,544Interest receivable 18,499 60,609 18,499 60,609Accounts receivable 8,366,348 987,831,475 988,897,406 7,300,417
Total Assets $ 189,419,442 $ 1,920,054,750 $1,917,652,622 $ 191,821,570
LiabilitiesAccounts payable and accrued liabilities $ 88,033,891 $ 1,598,503,353 $1,587,315,215 $ 99,222,029Due to other governments 101,385,551 48,644,707 57,430,717 92,599,541
Total Liabilities $ 189,419,442 $ 1,647,148,060 $1,644,745,932 $ 191,821,570
115
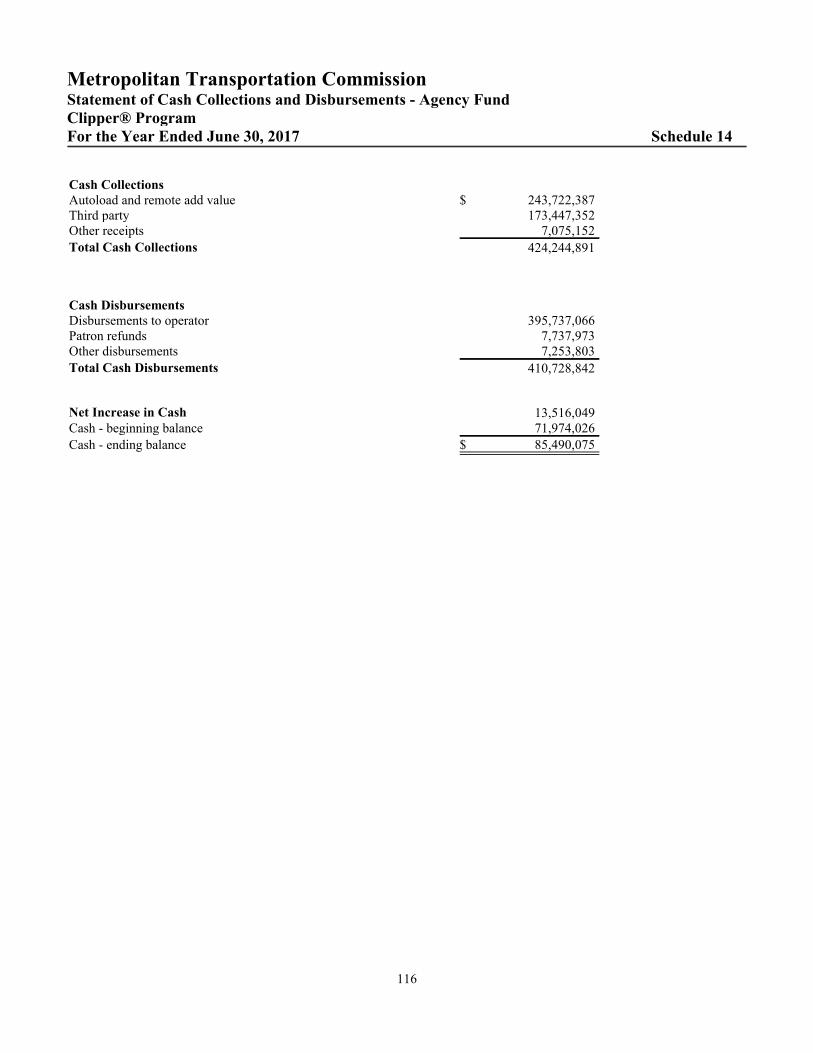
Metropolitan Transportation CommissionStatement of Cash Collections and Disbursements - Agency FundClipper® ProgramFor the Year Ended June 30, 2017 Schedule 14
Cash CollectionsAutoload and remote add value $ 243,722,387Third party 173,447,352Other receipts 7,075,152
Total Cash Collections 424,244,891
Cash DisbursementsDisbursements to operator 395,737,066Patron refunds 7,737,973Other disbursements 7,253,803
Total Cash Disbursements 410,728,842
Net Increase in Cash 13,516,049Cash - beginning balance 71,974,026
Cash - ending balance $ 85,490,075
116
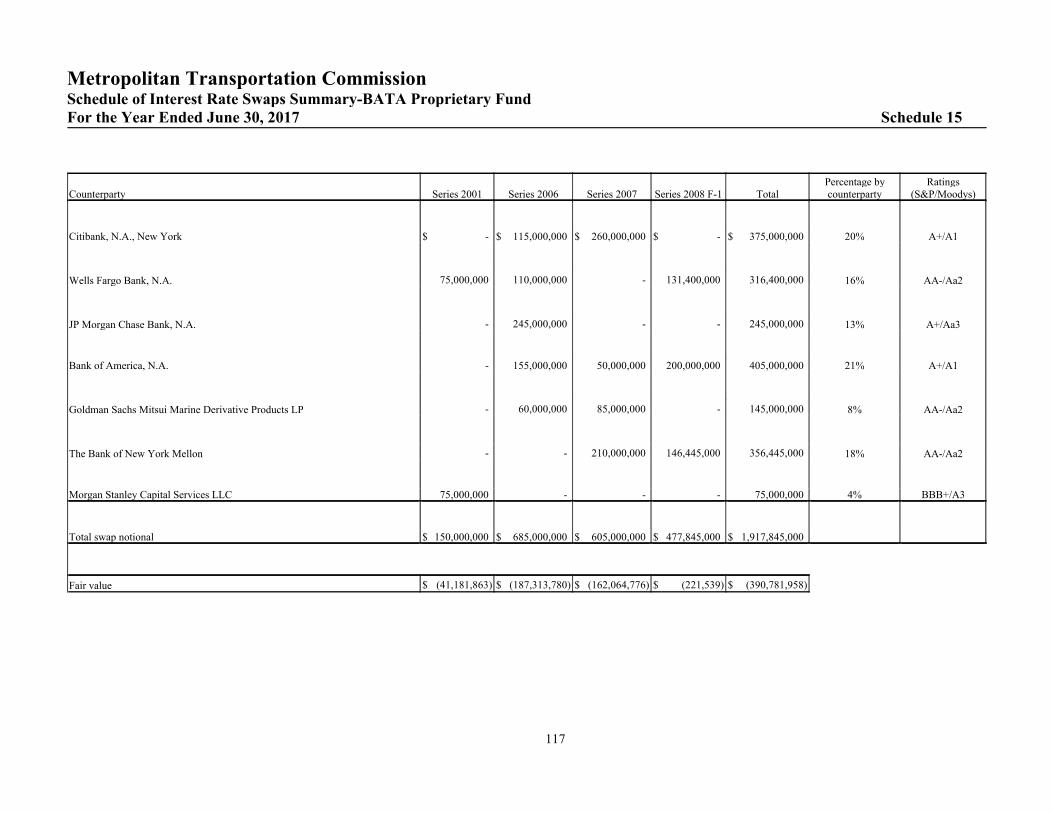
Metropolitan Transportation CommissionSchedule of Interest Rate Swaps Summary-BATA Proprietary FundFor the Year Ended June 30, 2017 Schedule 15
Counterparty Series 2001 Series 2006 Series 2007 Series 2008 F-1 TotalPercentage bycounterparty
Ratings(S&P/Moodys)
Citibank, N.A., New York $ - $ 115,000,000 $ 260,000,000 $ - $ 375,000,000 20% A+/A1
Wells Fargo Bank, N.A. 75,000,000 110,000,000 - 131,400,000 316,400,000 16% AA-/Aa2
JP Morgan Chase Bank, N.A. - 245,000,000 - - 245,000,000 13% A+/Aa3
Bank of America, N.A. - 155,000,000 50,000,000 200,000,000 405,000,000 21% A+/A1
Goldman Sachs Mitsui Marine Derivative Products LP - 60,000,000 85,000,000 - 145,000,000 8% AA-/Aa2
The Bank of New York Mellon - - 210,000,000 146,445,000 356,445,000 18% AA-/Aa2
Morgan Stanley Capital Services LLC 75,000,000 - - - 75,000,000 4% BBB+/A3
Total swap notional $ 150,000,000 $ 685,000,000 $ 605,000,000 $ 477,845,000 $ 1,917,845,000
Fair value $ (41,181,863) $ (187,313,780) $ (162,064,776) $ (221,539) $ (390,781,958)
117

Metropolitan Transportation CommissionSchedule of Interest Rate Swaps for Series 2001 - BATA Proprietary FundFor the Year Ended June 30, 2017 Schedule 16
Series 2001 A Series 2001 A Total
Notional amount $75,000,000 $75,000,000 $150,000,000
Trade date 1/22/2014(4) 6/26/2015(6)
Effective date 1/1/2014 7/1/2015Swap mode 65% One Mth LIBOR 65% One Mth LIBORMaturity 4/1/2036 4/1/2036
Swap rate 4.09%(5) 3.29%Counterparty (CP) Morgan Stanley Capital Services LLC Wells Fargo Bank, N.A.S&P/Moody's ratings BBB+/A3 AA-/Aa2Ratings outlook Stable/Stable Negative/Stable
Fair value due from/ (to) CP(1) $(24,396,275) $(16,785,588) $(41,181,863)
Credit risk
CP Collateral Posting(2)
1a) CP = "A-", "A", or "A+" (S&P) No Noor
1b) CP = "A3", "A2", or "A1" (Moody's) Yes Noand
2) Termination value >$10 million No No
or
CP Collateral Posting(2)
1c) CP < A- (S&P) Yes Noor
1d) CP < A3 (Moody's) No Noand
2) Termination value > $0 No No
Ratings termination risk(3)
CP can terminate if BATA's Sr bond ratings(S&P or Moody's) is below BBB-/Baa3 BBB+/Baa1
(1)Fair value is presented in accordance with GASB Statement No. 72.(2) Unilateral collateral posting by counterparty.(3) Unilateral termination at BATA's discretion unless ratings fall below the levels as listed in the table above.(4) Amended and restated on 1/22/14. Original trade date was 01/10/2002.(5) Fixed rate of 3.34% effective from 01/01/2014 through 12/31/2016. Fixed rate changed to 4.09% effective from 01/01/2017 through maturity.(6) Amended and restated on 06/26/2015. Original trade date was 05/20/2011.
118

Metropolitan Transportation CommissionSchedule of Interest Rate Swaps for Series 2006 - BATA Proprietary FundFor the Year Ended June 30, 2017 Schedule 17
Series 2006 Series 2006 Series 2006 Series 2006 Series 2006 Series2006 Total
Notional amount $245,000,000 $115,000,000 $30,000,000 $110,000,000 $60,000,000 $125,000,000 $685,000,000
Trade date 4/1/2011(4) 3/20/2012 (5) 5/25/2006(6) 3/20/2012 8/28/2008 6/26/2015(7)
Effective date 4/1/2011 2/8/2006 2/8/2006 3/1/2012 8/1/2008 7/1/2015Swap mode 75.105% One Mth
LIBOR53.8% One MthLIBOR+0.74%
68% One MthLIBOR
53.8% One MthLIBOR+0.74%
68% One MthLIBOR
68% One MthLIBOR
Maturity 4/1/2045 4/1/2045 4/1/2045 4/1/2045 4/1/2045 4/1/2045
Swap rate 4.00% 3.64% 3.63% 3.64% 3.64% 2.96%Counterparty (CP) JP Morgan Chase
Bank, N.A.Citibank, N.A.,
New YorkBank of America, N.A. Wells Fargo Bank,
N.A.Goldman SachsMitsui Marine
Bank of America,N.A.
Derivative ProductsLP
S&P/Moody's ratings A+/Aa3 A+/A1 A+/A1 AA-/Aa2 AA-/Aa2 A+/A1Ratings outlook Stable/Stable Stable/Stable Stable/Positive Negative/ Stable Stable/No outlook
providedStable/Positive
Fair value due from/ (to) CP(1) $(81,056,781) $(27,621,890) $(9,036,536) $(26,421,016) $(18,153,980) $(25,023,577) $(187,313,780)
Credit risk
CP Collateral Posting(2)
1a) CP = "A-", "A", or "A+" (S&P) Yes Yes Yes No No Yesor
1b) CP = "A3", "A2", or "A1" (Moody's) No Yes Yes No No Yesand
2) Termination value>$10 million No No No No No No
or
CP Collateral Posting(2)
1c) CP < A- (S&P) No No No No No Noor
1d) CP < A3 (Moody's) No No No No No Noand
2) Termination value >$0 No No No No No No
Ratings termination risk (3)
CP can terminate if BATA'sSr bond ratings (S&P or Moody's) is below BBB-/Baa3 BBB-/Baa3 BBB/Baa2(Insured) BBB+/Baal BBB+/Baa1 BBB+/Baa1
(1) Fair value is presented in accordance with GASB Statement No. 72.(2) Unilateral collateral posting by counterparty.(3) Unilateral termination at BATA's discretion unless ratings fall below the levels as listed in the table above. (4) Amended and restated on 04/01/2011. Original trade date was 11/15/2005.(5) Amended and restated for novation. Original trade date was 11/15/2005.(6) Amended and restated on 05/25/2006. Original trade date was 11/15/2005.(7) Amended and restated on 06/26/2015. Original trade date was 09/02/2008.
119

Metropolitan Transportation CommissionSchedule of Interest Rate Swaps for Series 2007 - BATA Proprietary FundFor the Year Ended June 30, 2017 Schedule 18
Series 2007 Series 2007 Series 2007 Series 2007 Series 2007 Total
Notional amount $260,000,000 $50,000,000 $85,000,000 $170,000,000 $40,000,000 $605,000,000
Trade date 1/2/2009(4) 5/25/2006(5) 8/28/2008 9/2/2008 6/26/2015(6)
Effective date 11/1/2007 11/1/2007 8/1/2008 9/2/2008 7/1/2015Swap mode 53.8% One Mth Libor +
0.74%68% One Mth
LIBOR68% One Mth
LIBOR68% One Mth
LIBOR68% One Mth
LIBOR
Maturity 4/1/2047 4/1/2047 4/1/2047 4/1/2047 4/1/2047
Swap rate 3.64% 3.63% 3.64% 3.64% 2.22%
Counterparty (CP) Citibank, N.A., Bank of America, N.A. Goldman Sachs Mitsui Marine The Bank of New York The Bank of New York
New York Derivative Products LP Mellon Mellon
S&P/Moody's ratings A+/A1 A+/A1 AA-/Aa2 AA-/Aa2 AA-/Aa2
Ratings outlook Stable/Stable Stable/Positive Stable/No outlook provided Stable/Stable Stable/Stable
Fair value due from/(to) CP(1) $(64,021,457) $(15,397,735) $(26,313,312) $(52,626,242) $(3,706,030) $ (162,064,776)
Credit risk
CP Collateral Posting(2)
1a) CP = "A-", "A", or "A+" (S&P) Yes Yes No No No
or
1b) CP = "A3", "A2", or "A1" (Moody's) Yes Yes No No No
and
2) Termination value > $10 million No No No No No
or
CP Collateral Posting (2)
1c) CP <A- (S&P) No No No No No
or
1d) CP <A3 (Moody's) No No No No No
and
2) Termination value >$0 No No No No No
Ratings termination risk(3)
CP can terminate if BATA's Sr bond ratings
(S&P or Moody's) is below BBB-/Baa3 BBB/Baa2 (Insured) BBB+/Baa1 BBB+/Baa1 BBB+/Baa1
(1) Fair value is presented in accordance with GASB Statement No. 72.(2) Unilateral collateral posting by counterparty.(3) Unilateral termination at BATA's discretion unless ratings fall below the levels as listed in the table above.(4) Amended and restated on 1/2/2009. Original trade date was 11/30/2005.(5) Amended and restated on 5/25/2006. Original trade date was 11/30/2005.(6) Amended and restated on 6/26/2015. Original trade date was 9/2/2008.
120

Metropolitan Transportation CommissionSchedule of SIFMA Rate Swaps for Series 2008 F-1 - BATA Proprietary FundFor the Year Ended June 30, 2017 Schedule 19
Series 2008 F-1 Series 2008 F-1 Series 2008 F-1 Series 2008 F-1 Total
Notional amount $131,400,000(4) $146,445,000 $40,000,000 $160,000,000 $477,845,000
Trade date 6/26/2015(5) 6/26/2015(6) 6/26/2015(7) 6/26/2015(8)
Effective date 7/1/2015(5) 7/1/2015(6) 7/1/2015(7) 7/1/2015(8)
Swap fix receiver rate 3.10% 3.25% 3.55% 3.40%Maturity 4/1/2047 4/1/2047 4/1/2047 4/1/2045Swap payer index SIFMA SIFMA SIFMA SIFMACounterparty (CP) Wells Fargo Bank, N.A. The Bank of New York
MellonBank of America, N.A. Bank of America, N.A.
S&P/Moody's ratings AA-/Aa2 AA-/Aa2 A+/A1 A+/A1Ratings outlook Negative/Stable Stable/Stable Stable/Positive Stable/Positive
Fair value due from/(to) CP(1) $(107,502) $(79,846) $(5,608) $(28,583) $(221,539)
Credit risk
CP Collateral Posting(2)
1a) CP = "A-", "A", or "A+" (S&P) No No Yes Yesor
1b) CP = "A3", "A2", or "A1" (Moody's) No No Yes Yesand
2) Termination value > $10 million No No No No
or
CP Collateral Posting(2)
1c) CP <A- (S&P) No No No Noor
1d) CP <A3 (Moody's) No No No Noand
2) Termination value > $0 No No No No
Ratings termination risk(3)
CP can terminate if BATA's Sr bond ratings(S&P or Moody's) is below BBB+/Baa1 BBB+/Baa1 BBB+/Baa1 BBB+/Baa1
(1) Fair value is presented in accordance with GASB Statement No. 72.(2) Unilateral collateral posting by counterparty.(3) Unilateral termination at BATA's discretion with 15 days notice unless ratings fall below the levels as listed in the table above; CP has one time termination option on 4/1/2018.(4) Wells Fargo notional reflects amortized balance as of 4/1/2018.(5) Amended and restated on 6/26/2015. Original trade date was 3/31/2014. Effective on 7/1/2015, trade is suspended until 4/1/2018.(6) Amended and restated on 6/26/2015. Original trade date was 8/28/2008. Effective on 7/1/2015, trade is suspended until 4/1/2018.(7) Amended and restated on 6/26/2015. Original trade date was 3/30/2011. Effective on 7/1/2015, trade is suspended until 4/1/2018.(8) Amended and restated on 6/26/2015. Original trade date was 8/28/2008. Effective on 7/1/2015, trade is suspended until 4/1/2018.
121

STATISTICAL SECTION
This part of MTC's comprehensive annual financial report presents detailed information to aid in understanding informationcontained in the financial statements, note disclosures, and required supplementary information. Some tables are not presentedwith ten years of data as the information was not available for these periods.
Contents Page
Financial Trends 123
These schedules provide trend information to assist the reader in understanding the change in MTC'sfinancial performance over time.
Revenue Capacity 128
These schedules include information to help the reader assess MTC's most significant local revenuesource, toll bridge revenues.
Debt Capacity 133
These schedules provide information to help the reader assess the affordability of MTC's current levels ofoutstanding debt and its ability to issue additional debt in the future.
Demographic and Economic Information 135
These schedules offer demographic and economic indicators to help the reader understand theenvironment in which MTC's financial activities take place.
Operating Information 138
These schedules contain service and infrastructure data to help the reader understand how theinformation in MTC's financial report relates to the services provided and the activities performed.
122

Metropolitan Transportation CommissionNet Position by Component ($000) (unaudited)By Fiscal Year Table 1
FISCAL YEAR
2008 2009 2010* 2011* 2012 2013 2014 2015 2016 2017Governmental activities
Net investment in capital assets $ 8,768 $ 8,393 $ 7,936 $ 7,277 $ 6,712 $ 6,134 $ 5,737 $ 5,080 $ 5,072 $ 364Restricted 337,420 329,243 467,544 332,378 406,868 376,343 372,455 392,812 471,623 489,425Unrestricted (33,269) (29,911) (21,259) (6,534) (3,388) 23,983 28,005 33,891 (24,215) (72,160)
Total governmental activities net position 312,919 307,725 454,221 333,121 410,192 406,460 406,197 431,783 452,480 417,629
Business-type activitiesNet investment in capital assets $ 8,206 $ 12,779 $ 18,199 $ 17,825 $ 19,192 $ 23,112 $ 27,033 $ 28,516 $ 56,525 $ 78,054Restricted 338,458 293,873 200,000 200,000 200,000 200,000 200,000 200,000 203,559 200,266Unrestricted (2,549,520) (3,304,407) (4,014,079) (4,744,006) (5,329,066) (5,585,985) (6,076,858) (6,601,447) (6,891,081) (6,888,421)
Total business-type activities net position (2,202,856) (2,997,755) (3,795,880) (4,526,181) (5,109,874) (5,362,873) (5,849,825) (6,372,931) (6,630,997) (6,610,101)
Total primary governmentNet investment in capital assets $ 16,974 $ 21,172 $ 26,135 $ 25,102 $ 25,904 $ 29,246 $ 32,770 $ 33,596 $ 61,597 $ 78,418Restricted 675,878 623,116 667,544 532,378 606,868 576,343 572,455 592,812 675,182 689,691Unrestricted (2,582,789) (3,334,318) (4,035,338) (4,750,540) (5,332,454) (5,562,002) (6,048,853) (6,567,556) (6,915,296) (6,960,581)
Total primary government net position $ (1,889,937) $ (2,690,030) $ (3,341,659) $ (4,193,060) $ (4,699,682) $ (4,956,413) $ (5,443,628) $ (5,941,148) $ (6,178,517) $ (6,192,472)
*Fiscal years 2010 and 2011 have been revised in accordance with the implementation guidance in GASB Statement No. 62, Codifications of Accounting and Financial Reporting Guidance contained in Pre-November 30, 1989 FASB and AICPA Pronouncements and GASB Statement No. 65, Items Previously Reported as Assets and Liabilities. Fiscal years 2008 and 2009 have not been restated as permittedby the standards.
123

Metropolitan Transportation CommissionChanges in Net Position ($000) (unaudited)By Fiscal Year Table 2
FISCAL YEAR
2008 2009 2010* 2011* 2012 2013 2014 2015 2016 2017
ExpensesGovernmental activities:
General government $ 85,203 $ 86,672 $ 97,260 $ 78,611 $ 77,165 $ 69,123 $ 78,763 $ 81,168 $ 77,038 $ 103,883Transportation 152,999 99,154 54,852 149,092 124,269 210,916 237,098 195,039 156,045 204,294
Total governmental activities expenses 238,202 185,826 152,112 227,703 201,434 280,039 315,861 276,207 233,083 308,177
Business-type activities:Clipper smart card - - - 52,048 34,846 38,319 37,393 37,264 44,090 45,094Toll bridge activities 1,234,968 1,299,135 1,300,850 1,569,444 1,352,120 1,189,447 1,586,156 1,008,115 935,544 980,645Congestion relief 13,675 14,363 17,309 17,939 18,693 17,763 12,742 11,697 10,419 11,463
Total business-type activities expenses 1,248,643 1,313,498 1,318,159 1,639,431 1,405,659 1,245,529 1,636,291 1,057,076 990,053 1,037,202
Total primary government expenses $ 1,486,845 $ 1,499,324 $1,470,271 $ 1,867,134 $ 1,607,093 $ 1,525,568 $ 1,952,152 $ 1,333,283 $ 1,223,136 $ 1,345,379
Program RevenuesGovernmental activities:
Charges for servicesOperating grants and contributions $ 207,496 $ 85,048 $ 249,436 $ 74,274 $ 245,171 $ 250,529 $ 301,254 $ 303,823 $ 233,919 $ 247,211Capital grants and contributions 9,858 61,796 10,673 - - - - - - -
Total governmental activities program revenues 217,354 146,844 260,109 74,274 245,171 250,529 301,254 303,823 233,919 247,211
Business-type activities:Charges for services 497,712 492,963 486,889 622,906 660,156 690,181 713,147 740,510 760,872 772,292Operating grants and contributions 110,372 53,490 131,872 281,918 263,080 272,281 393,471 95,622 102,705 88,931Capital grants and contributions - - - 327 - - 81,209 - 3,559 9,220
Total business-type activities program revenues 608,084 546,453 618,761 905,151 923,236 962,462 1,187,827 836,132 867,136 870,443
Total primary government program revenues $ 825,438 $ 693,297 $ 878,870 $ 979,425 $ 1,168,407 $ 1,212,991 $ 1,489,081 $ 1,139,955 $ 1,101,055 $ 1,117,654
Net (expense)/revenueGovernmental activities $ (20,848) $ (38,982) $ 107,997 $ (153,429) $ 43,737 $ (29,510) $ (14,607) $ 27,616 $ 836 $ (60,966)Business-type activities (640,559) (767,045) (699,398) (734,280) (482,423) (283,067) (448,464) (220,944) (122,917) (166,759)
Total primary government net expense $ (661,407) $ (806,027) $ (591,401) $ (887,709) $ (438,686) $ (312,577) $ (463,071) $ (193,328) $ (122,081) $ (227,725)
*Fiscal years 2010 and 2011 have been revised in accordance with the implementation guidance in GASB Statement No. 62, Codifications of Accounting and Financial Reporting Guidance contained in Pre-November 30,1989 FASB and AICPA Pronouncements and GASB Statement No. 65, Items Previously Reported as Assets and Liabilities. Fiscal years 2008 and 2009 have not been restated as permitted by the standards.
124
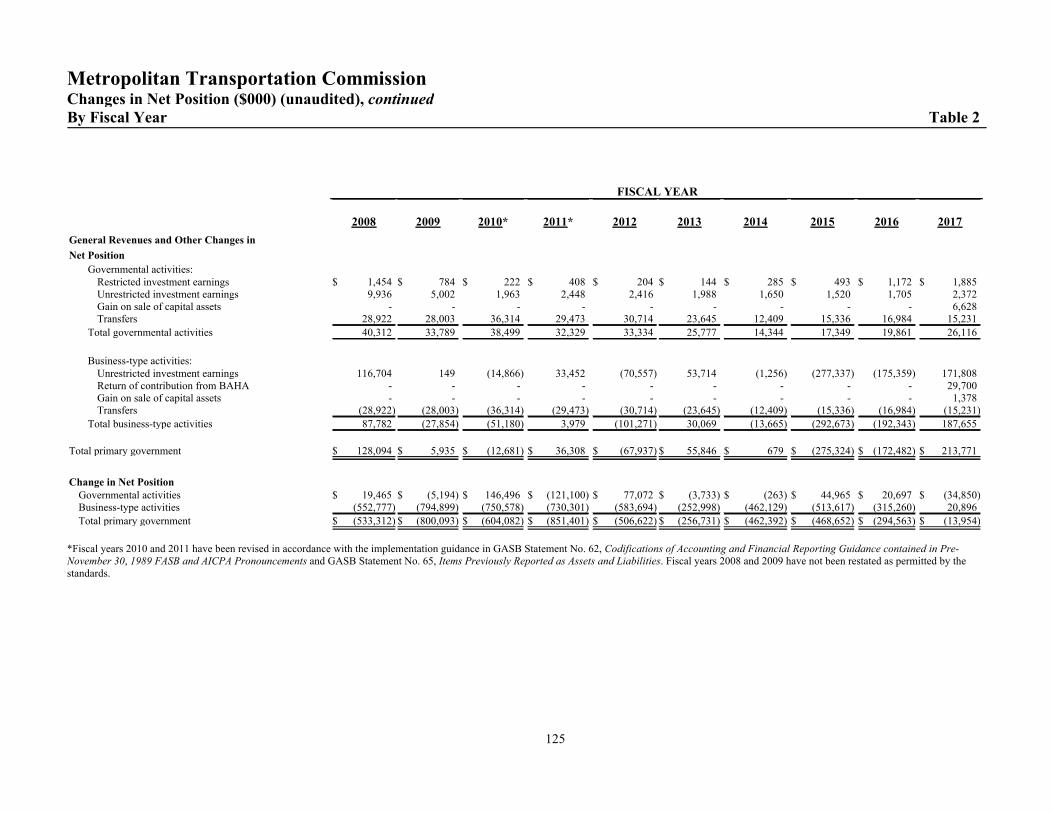
Metropolitan Transportation CommissionChanges in Net Position ($000) (unaudited), continuedBy Fiscal Year Table 2
FISCAL YEAR
2008 2009 2010* 2011* 2012 2013 2014 2015 2016 2017
General Revenues and Other Changes in
Net Position
Governmental activities:Restricted investment earnings $ 1,454 $ 784 $ 222 $ 408 $ 204 $ 144 $ 285 $ 493 $ 1,172 $ 1,885Unrestricted investment earnings 9,936 5,002 1,963 2,448 2,416 1,988 1,650 1,520 1,705 2,372Gain on sale of capital assets - - - - - - - - - 6,628Transfers 28,922 28,003 36,314 29,473 30,714 23,645 12,409 15,336 16,984 15,231
Total governmental activities 40,312 33,789 38,499 32,329 33,334 25,777 14,344 17,349 19,861 26,116
Business-type activities:Unrestricted investment earnings 116,704 149 (14,866) 33,452 (70,557) 53,714 (1,256) (277,337) (175,359) 171,808Return of contribution from BAHA - - - - - - - - - 29,700Gain on sale of capital assets - - - - - - - - - 1,378Transfers (28,922) (28,003) (36,314) (29,473) (30,714) (23,645) (12,409) (15,336) (16,984) (15,231)
Total business-type activities 87,782 (27,854) (51,180) 3,979 (101,271) 30,069 (13,665) (292,673) (192,343) 187,655
Total primary government $ 128,094 $ 5,935 $ (12,681) $ 36,308 $ (67,937) $ 55,846 $ 679 $ (275,324) $ (172,482) $ 213,771
Change in Net PositionGovernmental activities $ 19,465 $ (5,194) $ 146,496 $ (121,100) $ 77,072 $ (3,733) $ (263) $ 44,965 $ 20,697 $ (34,850)Business-type activities (552,777) (794,899) (750,578) (730,301) (583,694) (252,998) (462,129) (513,617) (315,260) 20,896
Total primary government $ (533,312) $ (800,093) $ (604,082) $ (851,401) $ (506,622) $ (256,731) $ (462,392) $ (468,652) $ (294,563) $ (13,954)
*Fiscal years 2010 and 2011 have been revised in accordance with the implementation guidance in GASB Statement No. 62, Codifications of Accounting and Financial Reporting Guidance contained in Pre-November 30, 1989 FASB and AICPA Pronouncements and GASB Statement No. 65, Items Previously Reported as Assets and Liabilities. Fiscal years 2008 and 2009 have not been restated as permitted by thestandards.
125

Metropolitan Transportation CommissionFund Balances of Governmental Funds ($000) (unaudited)By Fiscal Year Table 3
FISCAL YEAR
2008 2009 2010 2011 2012 2013 2014 2015 2016 2017General fund
Nonspendable $ 408 $ 593 $ 763 $ 918 $ 1,037 $ 1,033 $ 1,209 $ 1,328 $ 1,305 $ 823
Restricted for 4,175 5,086 2,734 1,954 2,389 1,254 528 512 158 49
Committed to 3,002 3,836 4,960 2,855 3,992 1,961 2,688 3,132 6,014 4,002
Unassigned 11,676 10,210 11,009 17,834 20,363 26,641 29,750 31,705 32,893 36,791
Total general fund $ 19,261 $ 19,725 $ 19,466 $ 23,561 $ 27,781 $ 30,889 $ 34,175 $ 36,677 $ 40,370 $ 41,665 *
All other governmental funds
Restricted for $ 272,730 $ 268,794 $ 415,129 $ 290,757 $ 362,492 $ 349,615 $ 339,144 $ 384,916 $ 432,015 $ 449,183
Committed to 7,372 6,550 7,573 7,509 8,573 15,096 21,501 28,024 28,985 30,216
Unassigned - - - - - - - (10,445) (40,998) (92,221)
Total all other governmental funds $ 280,102 $ 275,344 $ 422,702 $ 298,266 $ 371,065 $ 364,711 $ 360,645 $ 402,495 $ 420,002 $ 387,178 *
* The decreases in total fund balance of the general fund and the other governmental funds in fiscal year 2017 are explained in Management's Discussion and Analysis.
126

Metropolitan Transportation CommissionChanges in Fund Balances of Governmental Funds ($000) (unaudited)By Fiscal Year Table 4
FISCAL YEAR
2008 2009 2010 2011 2012 2013 2014 2015 2016 2017
RevenuesSales taxes $ 10,800 $ 9,848 $ 8,824 $ 9,644 $ 10,504 $ 11,162 $ 11,735 $ 12,374 $ 12,812 $ 13,089Grants - Federal 50,727 41,426 63,559 48,819 50,022 45,795 52,831 56,491 48,950 65,220Grants - State 127,565 61,796 148,976 5,392 145,788 160,060 151,916 148,032 115,262 105,027Local agencies revenues and refunds 33,039 33,774 46,755 18,419 46,022 41,148 88,712 86,553 57,917 63,532Investment income - unrestricted 11,346 5,002 1,963 2,448 2,416 1,988 1,650 1,520 1,705 2,372Investment income - restricted 1,454 783 222 408 204 144 285 493 1,173 1,885
Total revenues 234,931 152,629 270,299 85,130 254,956 260,297 307,129 305,463 237,819 251,125
ExpendituresGeneral government 74,153 64,358 70,100 72,612 70,376 65,175 70,387 68,463 63,439 68,456Allocation to other agencies 163,201 107,027 66,875 162,266 138,105 221,642 249,434 207,804 169,527 228,987Capital outlay 15,744 13,542 22,538 66 170 372 496 180 639 165
Total expenditures 253,098 184,927 159,513 234,944 208,651 287,189 320,317 276,447 233,605 297,608
Excess of revenuesover (under) expenditures (18,167) (32,298) 110,786 (149,814) 46,305 (26,892) (13,188) 29,016 4,214 (46,483)
Other financing sources (uses)Other financing source 47,000 - - - - - - - - -Transfer in 49,778 57,683 44,195 35,310 34,468 30,666 31,249 33,190 32,082 29,597Transfer out (20,856) (29,680) (7,881) (5,838) (3,754) (7,021) (18,841) (17,854) (15,098) (14,366)Sale of capital assets - - - - - - - - - 11,147Contribution to Bay Area Headquarters Authority - - - - - - - - - (11,423)
Total other financing sources (uses) 75,922 28,003 36,314 29,472 30,714 23,645 12,408 15,336 16,984 14,955
Net change in fund balances $ 57,755 $ (4,295) $ 147,100 $ (120,342) $ 77,019 $ (3,247) $ (780) $ 44,352 $ 21,198 $ (31,528)
127
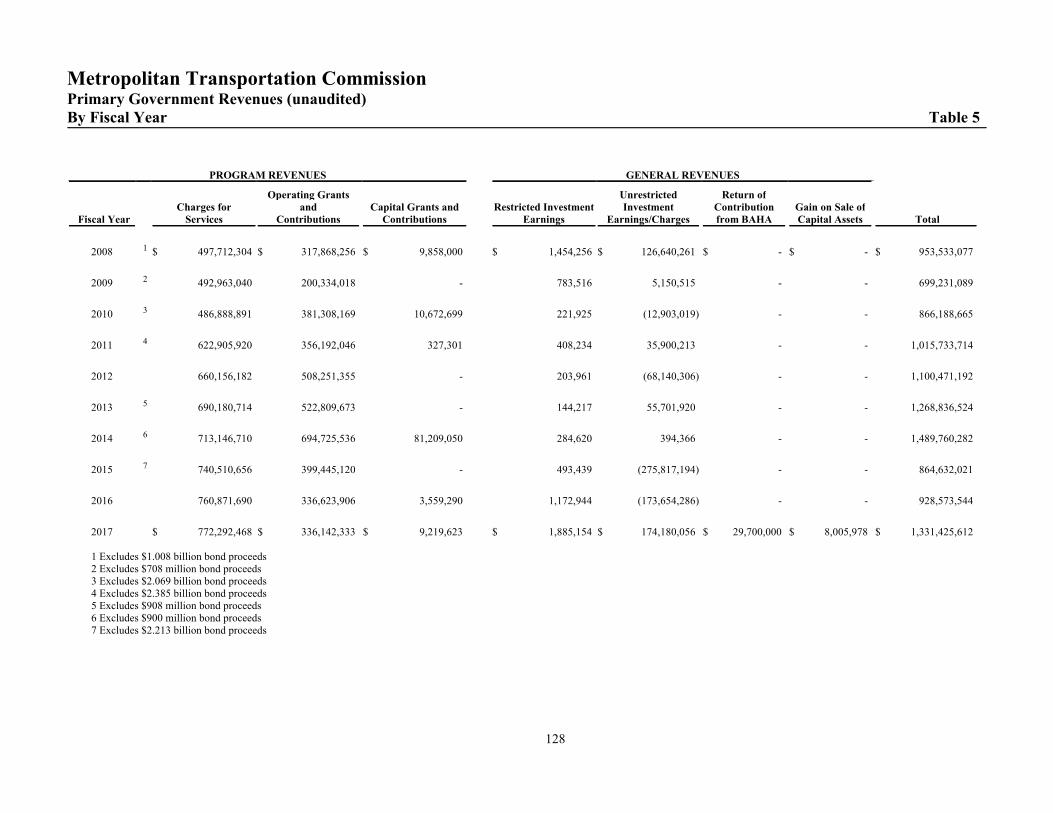
Metropolitan Transportation CommissionPrimary Government Revenues (unaudited)By Fiscal Year Table 5
PROGRAM REVENUES GENERAL REVENUES
Fiscal Year Charges for
Services
Operating Grantsand
ContributionsCapital Grants and
Contributions Restricted Investment
Earnings
UnrestrictedInvestment
Earnings/Charges
Return ofContributionfrom BAHA
Gain on Sale ofCapital Assets Total
2008 1 $ 497,712,304 $ 317,868,256 $ 9,858,000 $ 1,454,256 $ 126,640,261 $ - $ - $ 953,533,077
2009 2 492,963,040 200,334,018 - 783,516 5,150,515 - - 699,231,089
2010 3 486,888,891 381,308,169 10,672,699 221,925 (12,903,019) - - 866,188,665
2011 4 622,905,920 356,192,046 327,301 408,234 35,900,213 - - 1,015,733,714
2012 660,156,182 508,251,355 - 203,961 (68,140,306) - - 1,100,471,192
2013 5 690,180,714 522,809,673 - 144,217 55,701,920 - - 1,268,836,524
2014 6 713,146,710 694,725,536 81,209,050 284,620 394,366 - - 1,489,760,282
2015 7 740,510,656 399,445,120 - 493,439 (275,817,194) - - 864,632,021
2016 760,871,690 336,623,906 3,559,290 1,172,944 (173,654,286) - - 928,573,544
2017 $ 772,292,468 $ 336,142,333 $ 9,219,623 $ 1,885,154 $ 174,180,056 $ 29,700,000 $ 8,005,978 $ 1,331,425,612 1 Excludes $1.008 billion bond proceeds 2 Excludes $708 million bond proceeds 3 Excludes $2.069 billion bond proceeds 4 Excludes $2.385 billion bond proceeds 5 Excludes $908 million bond proceeds 6 Excludes $900 million bond proceeds 7 Excludes $2.213 billion bond proceeds
128
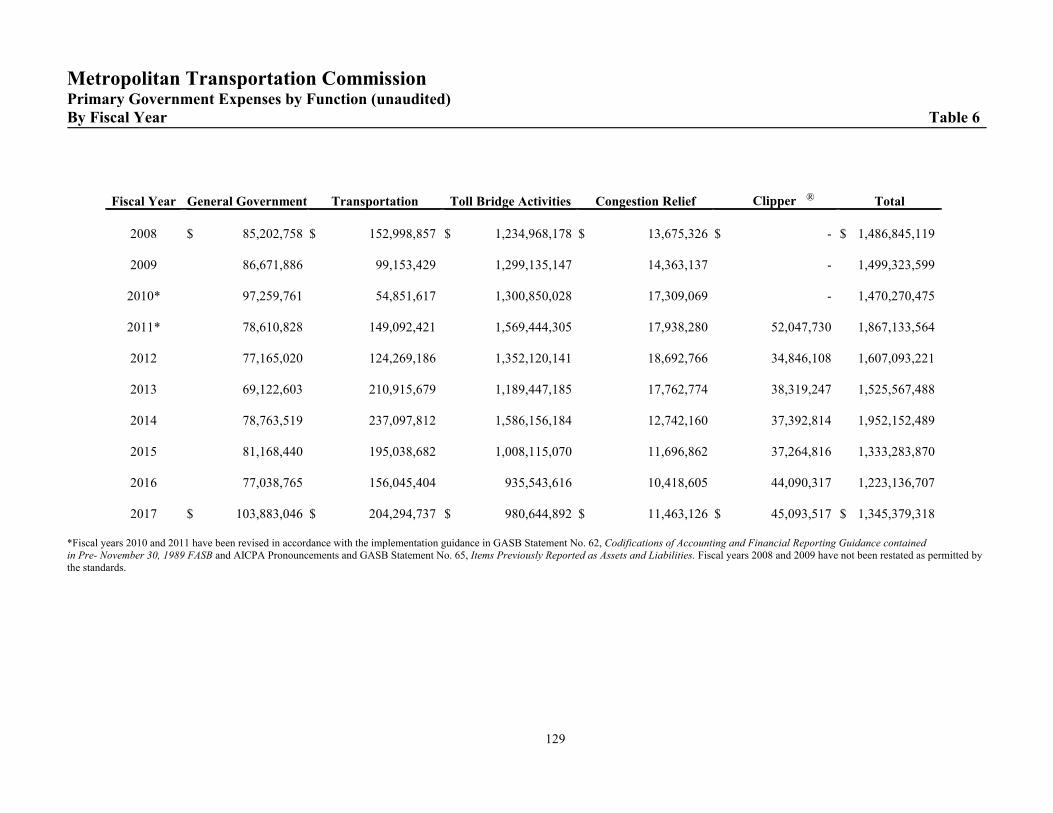
Metropolitan Transportation CommissionPrimary Government Expenses by Function (unaudited)By Fiscal Year Table 6
Fiscal Year General Government Transportation Toll Bridge Activities Congestion Relief Clipper ® Total
2008 $ 85,202,758 $ 152,998,857 $ 1,234,968,178 $ 13,675,326 $ - $ 1,486,845,119
2009 86,671,886 99,153,429 1,299,135,147 14,363,137 - 1,499,323,599
2010* 97,259,761 54,851,617 1,300,850,028 17,309,069 - 1,470,270,475
2011* 78,610,828 149,092,421 1,569,444,305 17,938,280 52,047,730 1,867,133,564
2012 77,165,020 124,269,186 1,352,120,141 18,692,766 34,846,108 1,607,093,221
2013 69,122,603 210,915,679 1,189,447,185 17,762,774 38,319,247 1,525,567,488
2014 78,763,519 237,097,812 1,586,156,184 12,742,160 37,392,814 1,952,152,489
2015 81,168,440 195,038,682 1,008,115,070 11,696,862 37,264,816 1,333,283,870
2016 77,038,765 156,045,404 935,543,616 10,418,605 44,090,317 1,223,136,707
2017 $ 103,883,046 $ 204,294,737 $ 980,644,892 $ 11,463,126 $ 45,093,517 $ 1,345,379,318
*Fiscal years 2010 and 2011 have been revised in accordance with the implementation guidance in GASB Statement No. 62, Codifications of Accounting and Financial Reporting Guidance containedin Pre- November 30, 1989 FASB and AICPA Pronouncements and GASB Statement No. 65, Items Previously Reported as Assets and Liabilities. Fiscal years 2008 and 2009 have not been restated as permitted bythe standards.
129
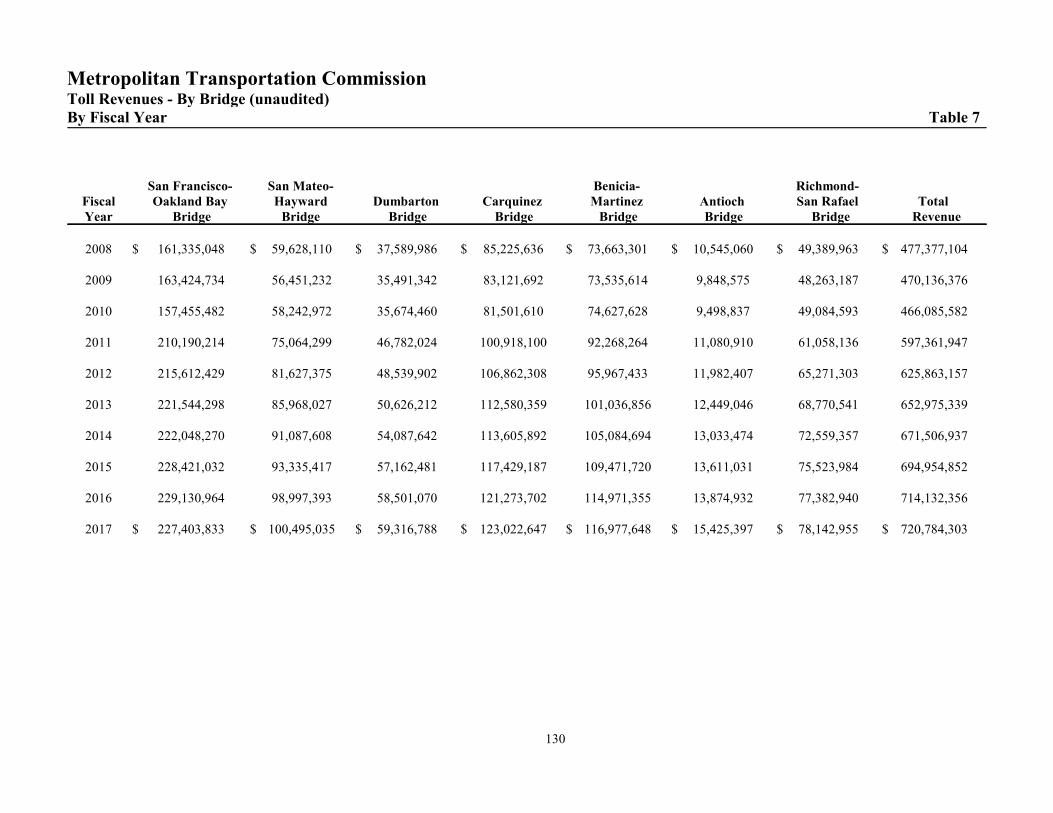
Metropolitan Transportation CommissionToll Revenues - By Bridge (unaudited)By Fiscal Year Table 7
Fiscal Year
San Francisco-Oakland Bay
Bridge
San Mateo-Hayward
Bridge Dumbarton
Bridge Carquinez
Bridge
Benicia-Martinez
Bridge Antioch
Bridge
Richmond-San Rafael
Bridge Total
Revenue
2008 $ 161,335,048 $ 59,628,110 $ 37,589,986 $ 85,225,636 $ 73,663,301 $ 10,545,060 $ 49,389,963 $ 477,377,104
2009 163,424,734 56,451,232 35,491,342 83,121,692 73,535,614 9,848,575 48,263,187 470,136,376
2010 157,455,482 58,242,972 35,674,460 81,501,610 74,627,628 9,498,837 49,084,593 466,085,582
2011 210,190,214 75,064,299 46,782,024 100,918,100 92,268,264 11,080,910 61,058,136 597,361,947
2012 215,612,429 81,627,375 48,539,902 106,862,308 95,967,433 11,982,407 65,271,303 625,863,157
2013 221,544,298 85,968,027 50,626,212 112,580,359 101,036,856 12,449,046 68,770,541 652,975,339
2014 222,048,270 91,087,608 54,087,642 113,605,892 105,084,694 13,033,474 72,559,357 671,506,937
2015 228,421,032 93,335,417 57,162,481 117,429,187 109,471,720 13,611,031 75,523,984 694,954,852
2016 229,130,964 98,997,393 58,501,070 121,273,702 114,971,355 13,874,932 77,382,940 714,132,356
2017 $ 227,403,833 $ 100,495,035 $ 59,316,788 $ 123,022,647 $ 116,977,648 $ 15,425,397 $ 78,142,955 $ 720,784,303
130

Metropolitan Transportation CommissionPaid and Free Vehicles - By Bridge (in Number of Vehicles) (unaudited)By Fiscal Year Table 8
Fiscal Year
San Francisco-Oakland Bay
Bridge
San Mateo-Hayward
Bridge Dumbarton
Bridge Carquinez
Bridge
Benicia-Martinez
Bridge Antioch
Bridge
Richmond-San Rafael
Bridge Total
Traffic
2008 45,139,513 16,376,583 10,767,813 21,795,287 18,508,003 2,559,936 12,528,248 127,675,383
2009 45,568,253 15,466,520 10,214,522 21,091,173 18,295,365 2,345,007 12,215,518 125,196,358
2010 43,579,404 15,808,435 10,135,134 20,517,470 18,581,186 2,263,717 12,383,708 123,269,054
2011 44,317,350 15,407,582 9,777,172 20,026,368 18,308,458 2,168,699 12,177,540 122,183,169
2012 44,460,209 16,241,002 9,929,399 20,065,557 18,266,053 2,181,315 12,523,905 123,667,440
2013 45,071,936 16,692,221 10,205,793 20,176,369 18,531,052 2,128,525 12,785,217 125,591,113
2014 45,332,246 17,758,098 10,909,076 20,397,621 19,237,717 2,193,962 13,561,516 129,390,236
2015 46,994,056 18,240,477 11,591,256 21,123,039 20,055,430 2,347,039 14,201,661 134,552,958
2016 47,754,079 19,502,252 11,889,024 22,002,165 21,210,960 2,411,138 14,606,825 139,376,443
2017 47,996,192 19,918,887 12,046,423 22,457,814 21,784,617 2,735,244 14,849,279 141,788,456
131
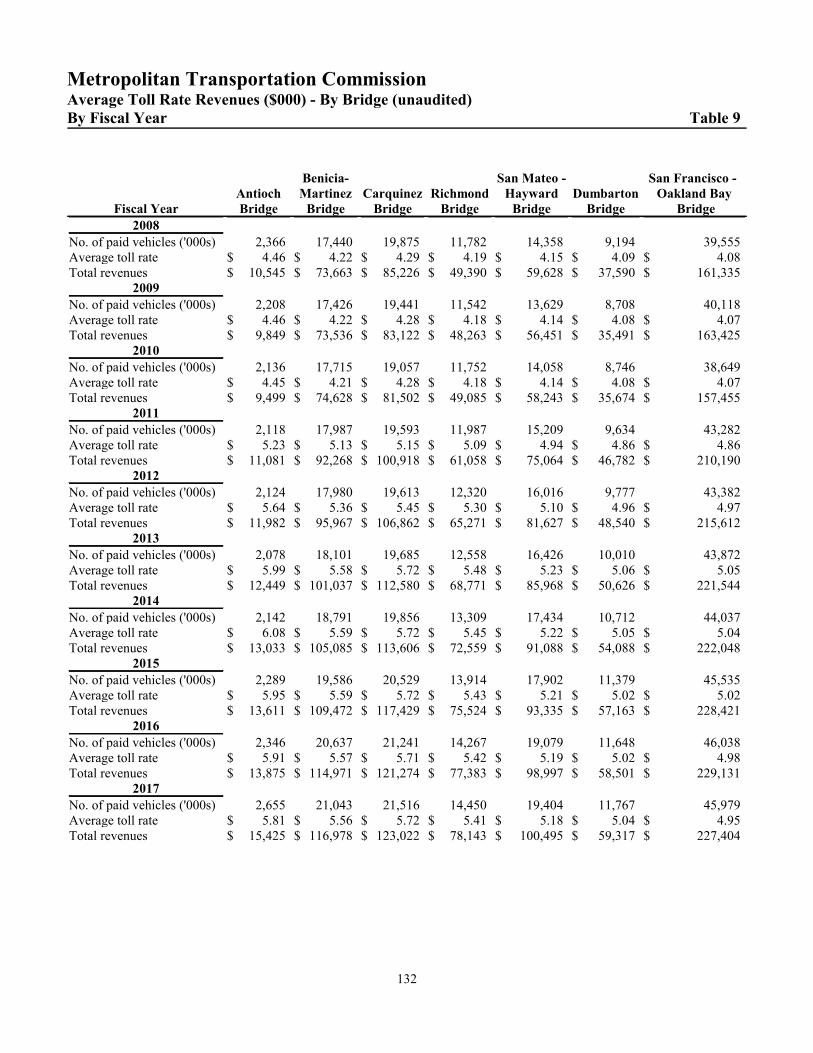
Metropolitan Transportation CommissionAverage Toll Rate Revenues ($000) - By Bridge (unaudited)By Fiscal Year Table 9
Fiscal YearAntioch
Bridge
Benicia-Martinez Bridge
Carquinez Bridge
Richmond Bridge
San Mateo -Hayward Bridge
Dumbarton Bridge
San Francisco -Oakland Bay
Bridge
2008
No. of paid vehicles ('000s) 2,366 17,440 19,875 11,782 14,358 9,194 39,555Average toll rate $ 4.46 $ 4.22 $ 4.29 $ 4.19 $ 4.15 $ 4.09 $ 4.08Total revenues $ 10,545 $ 73,663 $ 85,226 $ 49,390 $ 59,628 $ 37,590 $ 161,335
2009
No. of paid vehicles ('000s) 2,208 17,426 19,441 11,542 13,629 8,708 40,118Average toll rate $ 4.46 $ 4.22 $ 4.28 $ 4.18 $ 4.14 $ 4.08 $ 4.07Total revenues $ 9,849 $ 73,536 $ 83,122 $ 48,263 $ 56,451 $ 35,491 $ 163,425
2010
No. of paid vehicles ('000s) 2,136 17,715 19,057 11,752 14,058 8,746 38,649Average toll rate $ 4.45 $ 4.21 $ 4.28 $ 4.18 $ 4.14 $ 4.08 $ 4.07Total revenues $ 9,499 $ 74,628 $ 81,502 $ 49,085 $ 58,243 $ 35,674 $ 157,455
2011
No. of paid vehicles ('000s) 2,118 17,987 19,593 11,987 15,209 9,634 43,282Average toll rate $ 5.23 $ 5.13 $ 5.15 $ 5.09 $ 4.94 $ 4.86 $ 4.86Total revenues $ 11,081 $ 92,268 $ 100,918 $ 61,058 $ 75,064 $ 46,782 $ 210,190
2012
No. of paid vehicles ('000s) 2,124 17,980 19,613 12,320 16,016 9,777 43,382Average toll rate $ 5.64 $ 5.36 $ 5.45 $ 5.30 $ 5.10 $ 4.96 $ 4.97Total revenues $ 11,982 $ 95,967 $ 106,862 $ 65,271 $ 81,627 $ 48,540 $ 215,612
2013
No. of paid vehicles ('000s) 2,078 18,101 19,685 12,558 16,426 10,010 43,872Average toll rate $ 5.99 $ 5.58 $ 5.72 $ 5.48 $ 5.23 $ 5.06 $ 5.05Total revenues $ 12,449 $ 101,037 $ 112,580 $ 68,771 $ 85,968 $ 50,626 $ 221,544
2014
No. of paid vehicles ('000s) 2,142 18,791 19,856 13,309 17,434 10,712 44,037Average toll rate $ 6.08 $ 5.59 $ 5.72 $ 5.45 $ 5.22 $ 5.05 $ 5.04Total revenues $ 13,033 $ 105,085 $ 113,606 $ 72,559 $ 91,088 $ 54,088 $ 222,048
2015
No. of paid vehicles ('000s) 2,289 19,586 20,529 13,914 17,902 11,379 45,535Average toll rate $ 5.95 $ 5.59 $ 5.72 $ 5.43 $ 5.21 $ 5.02 $ 5.02Total revenues $ 13,611 $ 109,472 $ 117,429 $ 75,524 $ 93,335 $ 57,163 $ 228,421
2016
No. of paid vehicles ('000s) 2,346 20,637 21,241 14,267 19,079 11,648 46,038Average toll rate $ 5.91 $ 5.57 $ 5.71 $ 5.42 $ 5.19 $ 5.02 $ 4.98Total revenues $ 13,875 $ 114,971 $ 121,274 $ 77,383 $ 98,997 $ 58,501 $ 229,131
2017
No. of paid vehicles ('000s) 2,655 21,043 21,516 14,450 19,404 11,767 45,979Average toll rate $ 5.81 $ 5.56 $ 5.72 $ 5.41 $ 5.18 $ 5.04 $ 4.95Total revenues $ 15,425 $ 116,978 $ 123,022 $ 78,143 $ 100,495 $ 59,317 $ 227,404
132

Metropolitan Transportation CommissionRatios of General Bonded Debt Outstanding (unaudited)By Fiscal Year Table 10
Fiscal Year
Toll Revenue Bonds
Less: AmountsAvailable in Debt
Service Fund Total Toll Revenues Per Toll Vehicle
2008 $ 4,328,390,000 $ 238,449,821 $ 4,089,940,179 $ 477,377,104 32
2009 4,338,155,000 282,727,772 4,055,427,228 470,136,376 32
2010 5,595,125,000 358,975,732 5,236,149,268 466,085,582 42
2011 7,943,135,000 456,507,625 7,486,627,375 597,361,947 61
2012 7,904,440,000 455,624,170 7,448,815,830 625,863,157 60
2013 7,700,750,000 427,025,751 7,273,724,249 652,975,339 58
2014 8,554,585,000 475,439,245 8,079,145,755 671,506,937 62
2015 9,243,010,000 510,833,790 8,732,176,210 694,954,852 65
2016 9,186,095,000 515,292,195 8,670,802,805 714,132,356 62
2017 $ 9,437,830,000 $ 526,223,870 $ 8,911,606,130 $ 720,784,303 63
133
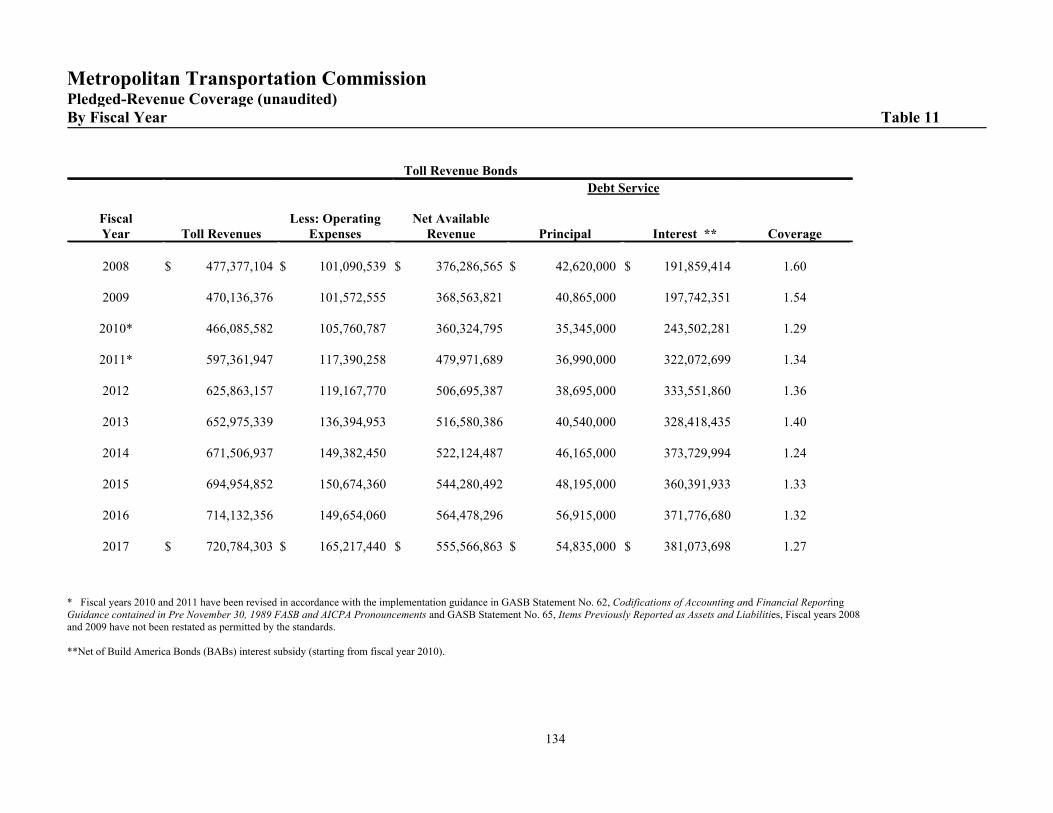
Metropolitan Transportation CommissionPledged-Revenue Coverage (unaudited)By Fiscal Year Table 11
Toll Revenue Bonds
Debt Service
Fiscal Year Toll Revenues
Less: Operating Expenses
Net Available Revenue Principal Interest ** Coverage
2008 $ 477,377,104 $ 101,090,539 $ 376,286,565 $ 42,620,000 $ 191,859,414 1.60
2009 470,136,376 101,572,555 368,563,821 40,865,000 197,742,351 1.54
2010* 466,085,582 105,760,787 360,324,795 35,345,000 243,502,281 1.29
2011* 597,361,947 117,390,258 479,971,689 36,990,000 322,072,699 1.34
2012 625,863,157 119,167,770 506,695,387 38,695,000 333,551,860 1.36
2013 652,975,339 136,394,953 516,580,386 40,540,000 328,418,435 1.40
2014 671,506,937 149,382,450 522,124,487 46,165,000 373,729,994 1.24
2015 694,954,852 150,674,360 544,280,492 48,195,000 360,391,933 1.33
2016 714,132,356 149,654,060 564,478,296 56,915,000 371,776,680 1.32
2017 $ 720,784,303 $ 165,217,440 $ 555,566,863 $ 54,835,000 $ 381,073,698 1.27
* Fiscal years 2010 and 2011 have been revised in accordance with the implementation guidance in GASB Statement No. 62, Codifications of Accounting and Financial ReportingGuidance contained in Pre November 30, 1989 FASB and AICPA Pronouncements and GASB Statement No. 65, Items Previously Reported as Assets and Liabilities, Fiscal years 2008and 2009 have not been restated as permitted by the standards.
**Net of Build America Bonds (BABs) interest subsidy (starting from fiscal year 2010).
134

Metropolitan Transportation CommissionMiscellaneous Statistics (unaudited)June 30, 2017 Table 12
Date of Incorporation 1970
Form of Government Commissioners with Appointed
Executive Director
Number of Commissioners 18 Voting and 3 Non-Voting Members
Number of Employees (Approved Positions) 232
Type of Tax Support 3.5% of TDA Sales Tax
Region in Which Commission Operates San Francisco Bay Area
San Jose, San Francisco & Oakland
Combined Statistical Area including
San Benito & Santa Cruz
Number of Counties in the Region 9
Area of Authority in Square Miles 6,980
Population of Region in Which Commission Operates 7,714,638
Number of Toll Bridges in the Region 8
Traffic for All Toll Bridges - Number of Vehicles 141,788,456
(excluding Golden Gate Bridge, Highway and
Transportation District)
Toll Revenues (excluding Golden Gate Bridge, Highway and $720,784,303
Transportation District)
Number of Call Boxes in the Region 1,024
135

Metropolitan Transportation CommissionDemographic Statistics for Nine San Francisco Bay Area Counties (unaudited)Last Ten Calendar Years Table 13
Year Population 1
Per Capita Income2, 5 Median Age2, 5
School Enrollment3
Unemployment Rate4
2008 7,301,080 N/A N/A 974,089 %5.81
2009 7,375,678 N/A N/A 978,117 %10.58
2010 7,459,858 31,076 39 979,876 %10.77
2011 7,150,739 N/A N/A 985,964 %10.17
2012 7,249,563 N/A N/A 994,207 %8.69
2013 7,327,626 N/A N/A 1,004,436 %6.69
2014 7,420,453 N/A N/A 1,013,055 %5.34
2015 7,510,942 N/A N/A 1,019,853 %4.20
2016 7,649,565 N/A N/A 1,021,840 %4.24
2017 7,714,638 N/A N/A 1,022,684 %3.65
Data Sources1 State of California, Dept. of Finance, Demographic Research Unit2 Bureau of Census
3 California Department of Education
4 State of California, Employment Development Department - every ten years
5 Bureau of Census conducts survey every ten years for the Median Age and Per Capita Income of the
nine-county region as a whole.
N/A - Not Available
136

Metropolitan Transportation CommissionTen Largest Employers (unaudited)Fiscal Years 2017 and 2008 Table 14
20171 20082
Employer Employees Rank Employer Employees Rank
Kaiser Permanente 40,132 1 Kaiser Permanente 28,966 1City and County of San Francisco 28,846 2 City and County of San Francisco 26,656 2University of California, San Francisco 24,304 3 University of California, Berkeley 21,009 3University of California, Berkeley 23,000 4 University of California, San Francisco 18,200 4Safeway Inc. 16,778 5 State of California 18,175 5State of California 15,512 6 Safeway Inc. 16,479 6Wells Fargo Bank 14,986 7 AT&T, Inc. 15,500 7Stanford University 13,634 8 US Postal Service 15,492 8United Airlines, Inc. 10,500 9 Wells Fargo Bank 14,546 9Pacific, Gas and Electric 10,411 10 Stanford University 11,267 10
Data Sources
12017 Book of Lists, San Francisco Business Times
22008 Book of Lists, San Francisco Business Times
137
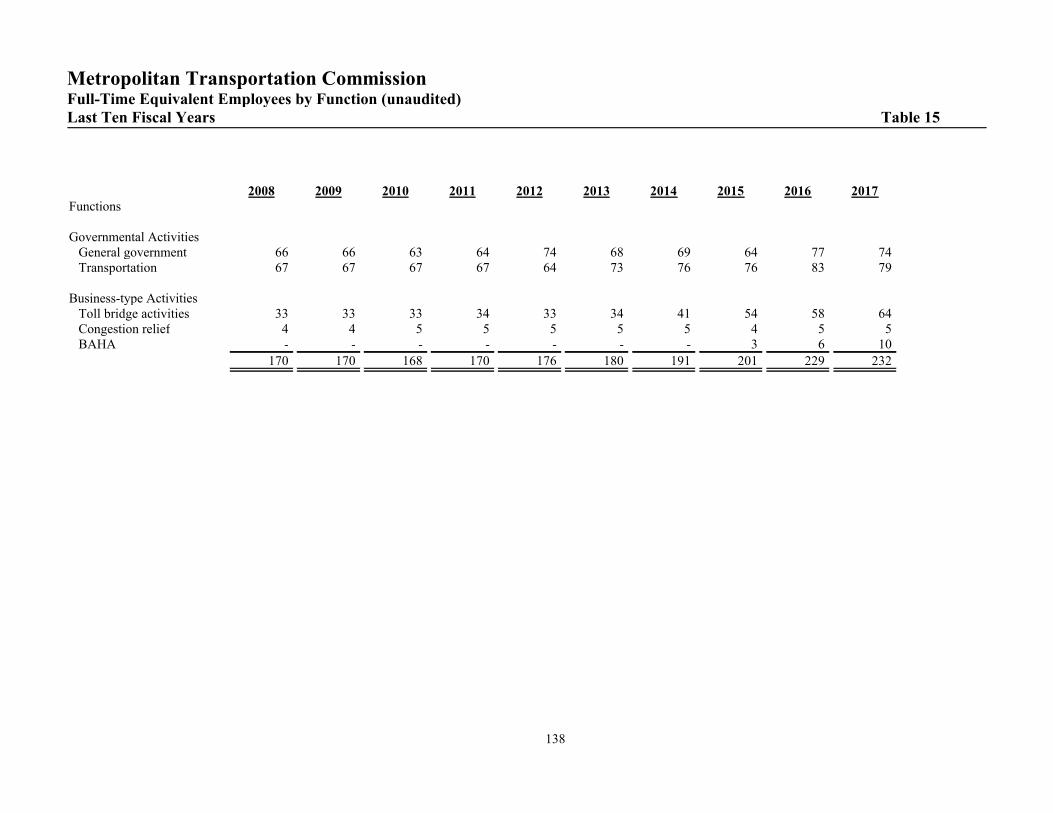
Metropolitan Transportation CommissionFull-Time Equivalent Employees by Function (unaudited)Last Ten Fiscal Years Table 15
2008 2009 2010 2011 2012 2013 2014 2015 2016 2017Functions
Governmental ActivitiesGeneral government 66 66 63 64 74 68 69 64 77 74Transportation 67 67 67 67 64 73 76 76 83 79
Business-type ActivitiesToll bridge activities 33 33 33 34 33 34 41 54 58 64Congestion relief 4 4 5 5 5 5 5 4 5 5BAHA - - - - - - - 3 6 10
170 170 168 170 176 180 191 201 229 232
138
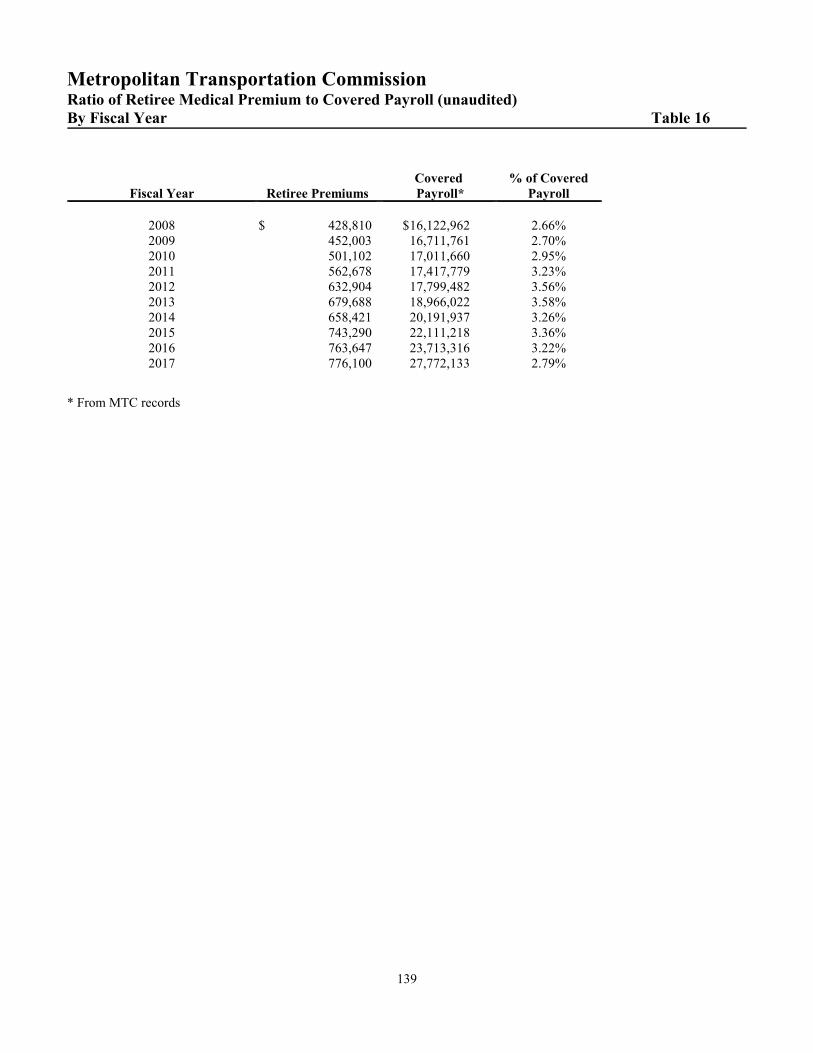
Metropolitan Transportation CommissionRatio of Retiree Medical Premium to Covered Payroll (unaudited)By Fiscal Year Table 16
Fiscal Year Retiree Premiums Covered
Payroll* % of Covered
Payroll
2008 $ 428,810 $16,122,962 2.66%2009 452,003 16,711,761 2.70%2010 501,102 17,011,660 2.95%2011 562,678 17,417,779 3.23%2012 632,904 17,799,482 3.56%2013 679,688 18,966,022 3.58%2014 658,421 20,191,937 3.26%2015 743,290 22,111,218 3.36%2016 763,647 23,713,316 3.22%2017 776,100 27,772,133 2.79%
* From MTC records
139