Embed Size (px)
Citation preview

002477 - State Farm Fire and Casualty Company
Report Revision Date: 06/25/2013
Rating and Commentary 1
Best's Credit Rating: 05/30/2013
Rating Rationale: 05/30/2013
Report Commentary: 06/25/2013
Financial 2
Time Period: 2nd Quarter - 2013
Last Updated: 08/29/2013
Status:Quality Cross Checked
General Information 3
Corporate Structure: N/A
States Licensed: 07/19/2001
Officers and Directors: 06/22/2012
Best's Credit Rating Methodology Disclaimer Best's Rating Guide
Additional Online Resources
Related News Archived AMB Credit Reports
Rating Activity and Announcements Corporate Changes & Retirements
Company Overview AMB Country Risk Reports - United States
1The Rating and Commentary date outlines the most recent updates to the Company's Rating, Rationale, and Report Commentary for key rating and business changes. Reportcommentary may include significant changes to Business Review, Financial Performance/Earnings, Capitalization, Investment/Liquidity, or Reinsurance sections of the report.2The Financial date reflects the current status of the financial tables found within the body of the Report, including whether the data was loaded as received or had been runthrough our quality control cross-check process.3The General Information date covers key areas that may have changed such as corporate structure, states licensed or officers and directors.
Page 1 of 29 Print Date: September 03, 2013

Ultimate Parent: State Farm Mutual Automobile Ins Co
State Farm Fire and Casualty CompanyOne State Farm Plaza, Bloomington, Illinois, United States 61710
Tel.: 309-766-2311 Web: www.statefarm.com Fax: 309-766-4655
AMB #: 002477 Ultimate Parent: 002479 NAIC #: 25143 FEIN#: 37-0533080
Best's Credit RatingsBest's Financial Strength Rating: A+ Outlook: Stable
Best's Issuer Credit Rating: aa- Outlook: Stable
Rating Effective Date: 05/30/2013
Financial Size Category: XV
Report Revision Date: 06/25/2013
Rating RationaleRating Rationale: The ratings and outlooks reflect State Farm Fire and Casualty's (SFFCC) adequate risk-adjustedcapitalization, extensive geographic spread of risk, a superior business profile derived from its strategic role within the StateFarm Group, a comprehensive enterprise risk management program and significant capital and operational support from itsparent. Partially offsetting these positive rating factors are below average operating results, above average common stockleverage, high gross and net exposure to catastrophic loss and strong reliance upon its parent for surplus protection.
Risk-adjusted capitalization is supportive of the ratings. Balance sheet liquidity is adequate and reserves have shown morestable development in recent years. Product line and geographic diversification are excellent. SFFCC is the primary propertywriter in North America for State Farm and a market leader in nearly every state, the District of Columbia and the Canadianprovinces of Alberta, Ontario and New Brunswick. Private passenger and commercial automobile liability and physicaldamage, commercial multi-peril, inland marine, allied lines, other liability, workers compensation and other smaller lines arealso written. SFFCC has more than twice the homeowners' market share in the U.S. than any other homeowners' writer basedon 2012 direct premium written.
The company benefits considerably from the business profile of the State Farm Group with excellent brand-name recognitionand market presence, which provide significant influence over market pricing and regulatory matters. In addition, products aremass marketed and distributed through an exclusive agency force of approximately 18,000 and enhanced by the sale of lifeinsurance products of affiliated life companies. This has helped the company maintain a favorable expense structure. SFFCCalso participates with several affiliates in various corporate-wide programs to manage risks and improve cash flow and liquidity.
Furthermore, surplus is supported through catastrophe per occurrence excess of loss reinsurance, catastrophe aggregateexcess of loss and quota share reinsurance for auto business from State Farm Mutual Automobile Insurance Company(SFMAIC). In 2011, SFFCC issued a surplus note against a line of credit with SFMAIC in the amount of $500 million topartially offset the adverse impact to surplus of catastrophic storm losses.
Moreover, the risk management process within State Farm is sophisticated and appears to be more advanced than theaverage property and casualty insurer in the U.S. It provides a framework to identify, prioritize, designate ownership of,communicate, and manage risks and opportunities. Enterprise Risk Management (ERM) is a strategic and proactive processapplied throughout the organization. It is endorsed by leadership and the board of directors and influenced by associates atevery level.
These positive rating factors are offset in part by below average operating performance over the last five years due primarily tounfavorable underwriting results and declining net investment income. Underwriting losses were reflective of increasedfrequency and severity of catastrophe losses, while declining investment income was attributable to reduced investment yieldsand negative operating cash flows, which hindered reinvestment of capital. Poor underwriting results in 2008 were the result ofthe non-Texas remnants of hurricanes Ike and Gustav. Underwriting for 2009 and 2010 was also adversely impacted by
Page 2 of 29 Print Date: September 03, 2013

Rating Rationale (Continued ...)increased frequency and severity of storm losses in the South and Midwest. In 2011, the company was adversely impacted bya series of severe storm losses across the country, which included the tornado system that went through the South andSoutheast U.S. in April that devastated Tuscaloosa, AL, the tornado system that went through Joplin, MO, in May, andHurricane Irene along the Atlantic seaboard in August. Results for 2012 include catastrophic losses attributed to the wildfires inColorado and Hurricane Sandy. Moreover, gross and net probable maximum loss estimates are high despite recent reductions,exposing it to loss of surplus from catastrophic events or a significant aggregation of loss events.
Net investment income has also been lower in recent years, driven by a gradual decline in investment yields due to lowermarket interest rates and a reduction in the average maturity of the bond portfolio. Investment income was on an increasingtrend earlier in the period due to invested asset growth that was partially offset by gradually declining investment yields.
These concerns are partially mitigated by the company's broad geographic diversification and by SFMAIC's explicit supportand management's actions to improve earnings through rate increases, re-underwriting its property business, reducing itsexposure in higher-risk areas and changes in its reinsurance program. State Farm is also in the process of realigning businessfunctions and upgrading its systems to modernize its operations and increase production through multiple distributionchannels.
The ratings for SFFCC benefit from its relationship with its parent, SFMAIC, as well as its strategic role as the lead personallines property writer in the U.S. The ratings may come under pressure if capitalization weakens, if operating performance doesnot continue to improve or if the company's role or importance within the State Farm organization were to change. The outlookon the ratings would become more stable from a positive earnings trend that leads to capital appreciation without excessivegrowth.
Five Year Rating HistoryBEST'S
Date FSR ICR
05/30/2013 A+ aa-
05/29/2012 A+ aa-
06/08/2011 A+ aa-
04/23/2010 A+ aa-
06/18/2009 A+ aa-
06/12/2008 A+ aa-
View 25 Year Rating History
Key Financial Indicators
Statutory Data ($000)
PeriodEnding
Premiums Written Pre-taxOperatingIncome Net Income
Total AdmittedAssets
Policyholder'sSurplusDirect Net
2012 17,021,683 14,409,506 189,681 317,195 28,999,078 8,805,362
2011 16,435,514 14,161,401 -1,763,979 -1,465,126 27,243,277 7,748,685
2010 16,469,178 13,613,006 -32,576 50,841 27,656,824 8,772,950
2009 15,908,279 13,025,494 -325,326 -206,094 26,422,187 8,540,899
2008 15,245,183 12,421,704 -1,952,431 -1,192,569 25,815,803 8,184,647
06/2013 8,768,463 7,653,040 473,135 399,973 30,307,559 9,242,395
06/2012 8,275,249 7,255,665 242,717 183,417 28,814,849 8,572,643
002477 - State Farm Fire and Casualty Company
Page 3 of 29 Print Date: September 03, 2013

Key Financial Indicators (Continued ...)
Profitability Leverage Liquidity
PeriodEnding
CombinedRatio
InvestmentYield (%)
Pre-TaxROR (%)
Non-AffiliatedInvestmentLeverage
NPW toPHS
NetLeverage
OverallLiquidity(%)
OperatingCash-flow
(%)
2012 104.8 3.7 1.3 52.7 1.6 3.9 143.6 106.1
2011 119.2 3.9 -12.7 54.9 1.8 4.3 139.8 91.0
2010 107.1 3.8 -0.2 48.1 1.6 3.7 146.5 103.4
2009 108.9 4.1 -2.6 47.5 1.5 3.6 147.8 106.1
2008 123.9 4.3 -16.0 43.0 1.5 3.7 146.4 94.9
5-Yr Avg 112.6 4.0 -5.9 ... ... ... ... ...
06/2013 98.3 3.5 6.5 57.7 1.6 3.9 143.9 112.4
06/2012 102.7 3.6 3.4 55.9 1.7 4.0 142.4 112.5
(*) Within several financial tables of this report, this company is compared against the Personal Property Composite.(*) Data reflected within all tables of this report has been compiled from the company-filed statutory statement.
002477 - State Farm Fire and Casualty Company
Page 4 of 29 Print Date: September 03, 2013

Business ProfileThe company was organized on June 12, 1935, under the laws of Illinois and commenced business on June 29, 1935. Thepresent title was adopted on July 1, 1950, when the company absorbed by merger the State Farm Casualty Company. SFFCCis headquartered in Bloomington, IL. Major affiliated property and casualty carriers are: SFMAIC, Illinois, State Farm CountyMutual Insurance Company of Texas (TCM), Texas (affiliated since 1960); State Farm General Insurance Company (SFGIC),Illinois (incorporated in 1962); State Farm Lloyds (SFL), Texas (affiliated since 1983); State Farm Indemnity Company(SFIND), Illinois (incorporated in 1991); State Farm Florida Insurance Company (SFFIC), Florida (incorporated in 1998); andState Farm Guaranty Insurance Company (Guaranty), Illinois (incorporated in 2004). Oglesby Reinsurance Company (ORC),Illinois (U.S. domiciled in 2011), is a wholly-owned reinsurance subsidiary of SFMAIC. Affiliated life insurance carriers are:State Farm Life Insurance Company (SFLIC), Illinois (incorporated in 1929); State Farm Life and Accident AssuranceCompany (SFLAAC), Illinois (incorporated in 1960); State Farm Health Insurance Company (SFHIC), Illinois (incorporated in1982); State Farm International Life Insurance Company Ltd. (SFILIC), Bermuda (incorporated in 2006). SFMAIC has a 50percent equity interest (with 65 percent voting rights) in Top Layer Reinsurance Ltd. (Top Layer Re), a Bermuda domiciledcompany, which provides catastrophe excess of loss reinsurance to non-United States risks.
Scope of Operations
Scope of Operations: SFFCC writes most forms of multiple line fire and casualty insurance and reinsures TCM's non-automobile business through 100 percent quota share reinsurance. Homeowners' insurance is written in all states (with theexception of California, Florida and Texas), the District of Columbia and in the Canadian Provinces of Ontario, Alberta andNew Brunswick. SFFCC also writes automobile business which is reinsured on a 100 percent quota share basis by SFMAIC.
State Farm is currently in a multi-year process of modernizing the organization to meet the needs of its changing markets. Thisis being accomplished by reorganizing its field and home office operations and its twelve zones in the U.S. and Canada into 8market areas, centralizing claims and underwriting and upgrading systems. These changes are designed to promote profitablegrowth by allowing customers multiple access points, while creating more efficient and consistent processes throughout theorganization. Policyholders are primarily serviced by an exclusive independent agency force numbering approximately 18thousand.
Total Premium Composition & Growth Analysis
PeriodEnding
Direct PremiumsWritten
Reinsurance PremiumsAssumed
Reinsurance PremiumsCeded Net Premiums Written
($000) (%Chg) ($000) (%Chg) ($000) (%Chg) ($000) (%Chg)
2012 17,021,683 3.6 81,932 3.4 2,694,109 14.5 14,409,506 1.8
2011 16,435,514 -0.2 79,222 -8.4 2,353,334 -20.0 14,161,401 4.0
2010 16,469,178 3.5 86,470 -16.0 2,942,643 -1.4 13,613,006 4.5
2009 15,908,279 4.3 102,937 -38.1 2,985,722 -0.1 13,025,494 4.9
2008 15,245,183 2.8 166,398 64.9 2,989,877 -4.7 12,421,704 5.4
5-Yr CAGR ... 2.8 ... -4.1 ... -3.0 ... 4.1
06/2013 8,768,463 6.0 42,007 26.5 1,157,430 9.9 7,653,040 5.5
06/2012 8,275,249 2.7 33,208 -6.6 1,052,792 12.0 7,255,665 1.5
Territory
The company is licensed in the District of Columbia and all states. It is also licensed in Canada in the provinces of Alberta,New Brunswick and Ontario.
002477 - State Farm Fire and Casualty Company
Page 5 of 29 Print Date: September 03, 2013

Business Trends
Business Trends: Overall, direct premium written (DPW) increased by 3.6% in 2012 after decreasing by approximately 0.2%in 2011. This was primarily attributed to an increase in policies in force and higher premium rates. Over the last five yearsDPW was up approximately 14.8%, growing at a compound annual growth rate of 2.8%. Premium growth over the period hasprimarily been driven by the homeowners' line of business. This is SFFCC's predominate line representing approximately72.2% of total DPW in 2012. Homeowners' premiums grew by 3.8% in 2012 and by 27.1% over the last five years. Liabilityinsurance premiums as well as premiums for earthquake and farmowners' coverages also showed double digit growth trendsover the last five years. This was partially offset by declining premium primarily on workers' compensation and commercialmulti-peril lines of business. Growth in automobile premiums, which are ceded 100% to SFMAIC, was relatively flat in 2012 butdown 5.3% over the last five years. Automobile premiums accounted for approximately 10.8% of total DPW in 2012.
Net premium written (NPW) was up 1.8% in 2012 and 22.2% over the last five years. The NPW growth rate in 2012 was halfthe growth rate of DPW due to a 14.5% increase in ceded reinsurance premiums written (CPW). However, NPW was up 22.2%over the last five years, in part due to the growth in DPW and an overall decrease in CPW during the period. The majority ofreinsurance premiums are ceded to SFMAIC and changes are primarily reflective of changes in coverage. In 2012, propertycatastrophe retentions were lowered and limits increased. In addition, SFMAIC added a catastrophe aggregate cover.
2012 By-Line Business ($000)
Product Line
Direct PremiumsWritten
ReinsurancePremiumsAssumed
ReinsurancePremiums Ceded
Net PremiumsWritten Business
Retention%($000) (%) ($000) (%) ($000) (%) ($000) (%)
Homeowners 12,286,953 72.2 14,679 17.9 620,927 23.0 11,680,705 81.1 95.0
Com'l MultiPeril 1,075,249 6.3 0 0.0 105,901 3.9 969,348 6.7 90.2
Oth Liab Occur 593,977 3.5 ... ... 4,304 0.2 589,673 4.1 99.3
Inland Marine 490,575 2.9 36,715 44.8 21,960 0.8 505,330 3.5 99.3
All Other 2,574,928 15.1 30,538 37.3 1,941,018 72.0 664,449 4.6 25.5
Total 17,021,683 100.0 81,932 100.0 2,694,109 100.0 14,409,506 100.0 84.5
2012 Top Product Lines of Business (Net Premiums Written)
81.1%
6.7%4.1%
3.5% 4.6%
Homeowners Oth Liab Occur All Other
Com'l MultiPeril Inland Marine
5 Years of Net Premiums Written ($000)
0
3,000,000
6,000,000
9,000,000
12,000,000
15,000,000
2008
2009
2010
2011
2012
12,421,70413,025,494
13,613,00614,161,401 14,409,506
002477 - State Farm Fire and Casualty Company
Page 6 of 29 Print Date: September 03, 2013

Business Trends (Continued ...)By-Line Reserve ($000)
Product Line 2012 2011 2010 2009 2008
Homeowners 4,297,181 4,085,105 3,864,888 3,715,863 3,869,126
Com'l MultiPeril 998,682 991,216 986,910 1,021,765 1,045,624
Oth Liab Occur 853,624 886,274 997,530 964,758 945,755
Inland Marine 164,730 145,947 140,651 134,075 126,114
All Other 1,124,439 1,152,734 1,149,167 1,142,558 1,190,934
Total 7,438,655 7,261,276 7,139,145 6,979,019 7,177,554
Market Share / Market Presence
Market Share/Market Presence: The company's geographic diversification is excellent. SFFCC is licensed and active in all50 states and the District of Columbia as well as Canada where it writes only in Ontario, Alberta and New Brunswick. No onestate or province represented more than 8% to total DPW in 2012.
Based on 2012 DPW, SFFCC was the leading provider of homeowners' insurance in the U.S. with approximately 15.7% of thetotal market. It was at or near the top of the homeowners' market in every state, with the exception of California, Florida andTexas where its sister companies write homeowners.
The company's significant size, market share and exclusive independent agency force give it distinct advantages overcompetitors in terms of setting rates and coverages. The company benefits from tremendous brand-name recognition, cost-efficient exclusive agents, strong customer loyalty and diversified financial service capabilities.
Geographical Breakdown By Direct Premium Writings ($000)
2012 2011 2010 2009 2008
Illinois 1,367,437 1,284,863 1,281,587 1,225,781 1,153,189
New York 1,005,717 1,004,584 1,013,211 985,166 918,565
Georgia 910,082 857,432 818,287 790,132 786,970
Ohio 730,162 706,758 684,526 651,731 612,870
Pennsylvania 717,078 694,865 693,590 668,466 630,537
Louisiana 663,416 637,984 694,161 674,981 634,617
Minnesota 603,902 565,622 542,846 506,158 465,217
Missouri 596,630 576,958 568,338 538,303 501,386
Tennessee 568,897 534,403 509,158 479,719 457,565
Indiana 561,913 526,302 530,280 518,104 479,073
All Other 9,296,450 9,045,744 9,133,194 8,869,737 8,605,193
Total 17,021,683 16,435,514 16,469,178 15,908,279 15,245,183
002477 - State Farm Fire and Casualty Company
Page 7 of 29 Print Date: September 03, 2013

Risk ManagementEnterprise Risk Management within the organization is sophisticated and appears to be more advanced than the averagepersonal lines insurer in the U.S. It provides a framework to identify, prioritize, designate ownership of, communicate, andmanage risks and opportunities. ERM is a strategic and proactive process applied throughout the organization. It is endorsedby leadership and the Board of Directors and influenced by associates at every level.
The objectives of the ERM program are to: promote financial strength and stability to enhance the ability to provide value andsecurity to policyholders; increase risk and opportunity awareness; inform leadership and the Board of key risks, exposures,and opportunities and facilitate leadership, Board, and associate understanding and accountability for managing risk andexploring opportunity; standardize risk and opportunity communication; standardize risk and opportunity documentation andreporting; manage risk appetite; informed decisions using economic capital; explore risk transfer strategies; provide strategicdirection for managing risk and opportunity; and develop people, procedures, and systems support.
Catastrophe Exposure & Management: The most significant exposures to catastrophic loss based on the company'scatastrophe modeling, are from hurricanes in the South and earthquakes in California. These exposures are managed by acorporate risk management team responsible for assessing enterprise wide property catastrophe risk exposure anddeveloping strategies to mitigate the risk. These risks are further segregated through separate legal entities in Florida, Texasand California who specialize in writing property coverage in those states. Also, catastrophe excess of loss reinsurance, and insome cases aggregate excess of loss catastrophe reinsurance, is used to limit losses. SFMAIC uses its significant capitalposition to provide the majority of catastrophe coverage to its subsidiaries.
Several catastrophe models are used to evaluate exposures and determine an appropriate amount of reinsurance protection.Because the company is primarily a personal lines writer with limited commercial risk, most of which are small to mid-sizeaccounts and fairly well diversified by geographic region, management does not believe that it has a material exposure toterrorism risk. As such, State Farm does not perform terrorism modeling analysis nor has is excluded terrorism coverage fromits policies.
Prior to July 1, 2012, SFMAIC provided SFFCC with a $1 billion line of credit that could be used whenever an aggregate ofqualifying catastrophe losses exceeded a $3 billion aggregate retention during the period of the cover that extended from July1 to June 30. During 2011, SFFCC exceeded the aggregate retention from losses due to late winter storms and tornadoesthrough Tuscaloosa Alabama, Joplin Missouri and other Southern and Southeastern States. As a result, SFFCC drew down$500 million against the line of credit. The line of credit was replaced by a catastrophe aggregate excess cover effective July 1,2012.
Investment Risk Management: The investment strategy is a key component to the company's earnings. Management usesits considerable investment base to generate income to competitively price its insurance products and produce a reasonableoverall return. Because of its sizeable investment base, management is willing to maintain above average holdings in equitiesrelative to surplus and accept the volatility in these markets in exchange for potentially higher returns in the long run. Duringthe financial crisis of 2008, unrealized capital losses in the equity portfolio totaled over $1.3 billion or approximately 13.3percent of year end 2007 surplus. These losses were partially offset by unrealized capital gains on other investments;however, the total unrealized loss for 2008 was $881.1 million or approximately 8.7 percent of the prior year end surplus.
The investment portfolio is tested against various economic scenarios to examine a range of possible outcomes in the value ofthe portfolio over the course of a year on a market value basis. Both market and credit risks are included in the evaluation.
SFFCC, SFMAIC, SFGIC, SFIND, Guaranty, SFFIC, SFL, TCM, SFLIC, SFLAAC, SFHIC and ORC participate in a short-terminvestment pooling agreement. Any party may transfer a portion of their cash and short-term investments to the liquidity pool inexchange for proportional membership interests in the pool.
002477 - State Farm Fire and Casualty Company
Page 8 of 29 Print Date: September 03, 2013

Operating PerformanceOperating Results: Operating performance for 2012 was an improvement over the prior year. After-tax net income totalednearly $0.3 billion compared to a net loss of approximately $1.5 billion in 2011. The improvement was mainly attributed to asignificant decrease in underwriting losses partially offset by lower net investment income, lower realized capital gains andlower income tax recoveries.
Underwriting losses were $0.7 billion in 2012 compared to over $2.7 billion in 2011. The improvement in underwritingperformance was primarily attributed to a reduction in loss and loss adjustment expense incurred and a modest increase in netpremium earned. Loss and loss adjustment expenses were down in 2012 as a result of fewer catastrophe and non-catastrophic losses compared to 2011. Net earned premium was up due to overall rate increases. Net investment income wasdown due to a reduction in interest earned on bonds, an increase in investment expenses and an increase in interest expenseon the surplus note partially offset by higher dividend income on unaffiliated stocks.
Significant catastrophes in 2012 included claims from wildfires in Colorado and Superstorm Sandy. However, 2011 includedlosses from the tornado systems that swept through Tennessee, Tuscaloosa Alabama and Joplin Missouri, as well asHurricane Irene and wildfires in Texas.
Overall, five year average profitability ratios fall below the personal property composite averages. After-tax net losses werereported in three of the last five years. This has been attributed to underwriting losses and lower net investment income duringthe period from 2008 through 2011. Underwriting losses in 2008 through 2010 were primarily attributed to the non-Texasremnants of Hurricanes Ike and Gustav and increased frequency and severity of storm losses in the South and Midwest.Results for 2008 were also adversely impacted by the downturn in the investment markets, which highlighted the company'sabove average common stock leverage.
Over the long run, the company's significant geographic diversification and leadership position in most every homeownersmarket throughout the United States should produce more stable underwriting results. However, the company has beenchallenged during the last five years by severe weather losses countrywide which has helped contribute to its below averageearnings performance.
Advancements have been made to improve earnings by rate activity, property exposure management and changes in thereinsurance program. In addition, claims handling and underwriting functions are being centralized throughout theorganization, systems are being upgraded and new technology is being developed to modernize operations and improvecustomer service, sales and efficiency.
Profitability Analysis
PeriodEnding
Company Industry Composite
Pre-taxOperatingIncome
After-taxOperatingIncome Net Income
TotalReturn
Pre-TaxROR
Returnon PHS
OperatingRatio
Pre-TaxROR
Returnon PHS
OperatingRatio
2012 189,681 309,058 317,195 569,287 1.3 6.9 98.7 9.1 7.7 91.4
2011 -1,763,979 -1,495,911 -1,465,126 -1,419,814 -12.7 -17.2 112.6 1.3 1.0 101.8
2010 -32,576 11,592 50,841 163,331 -0.2 1.9 100.4 10.8 9.2 89.7
2009 -325,326 -212,658 -206,094 172,087 -2.6 2.1 101.7 8.3 8.3 92.3
2008 -1,952,431 -1,157,975 -1,192,569 -2,073,631 -16.0 -22.6 115.9 0.3 -4.0 100.5
5-Yr Avg/Tot -3,884,630 -2,545,894 -2,495,754 -2,588,741 -5.9 -6.1 105.7 6.0 4.6 95.1
06/2013 473,135 391,939 399,973 714,910 6.5 10.4 92.4 XX XX XX
06/2012 242,717 177,319 183,417 354,919 3.4 3.0 96.5 XX XX XX
002477 - State Farm Fire and Casualty Company
Page 9 of 29 Print Date: September 03, 2013

Operating Performance (Continued ...)
Pre-Tax ROR Comparison with Industry Composite
-22.5
-15.0
-7.5
0.0
7.5
15.0
2008 2009 2010 2011 2012
-16.0
-2.6-0.2
-12.7
1.3
0.3
8.310.8
1.3
9.1
- Company Pre-Tax ROR - Industry Composite Pre-Tax ROR
* Industry Composite - Personal Property Composite
Return on PHS Comparison with Industry Composite
-30.0
-22.5
-15.0
-7.5
0.0
7.5
2008 2009 2010 2011 2012
-22.6
2.1 1.9
-17.2
6.9
-4.0
8.3 9.2
1.0
7.7
- Company Return on PHS - Industry Composite Return on PHS
* Industry Composite - Personal Property Composite
Underwriting Results
Underwriting Results: Underwriting performance in 2012 was a significant improvement over the prior year. Net underwritinglosses were $0.7 billion for the year compared to over $2.7 billion in 2011. The improvement was mainly due to a reduction inlosses incurred and a modest increase in net premium earned partially offset by higher loss adjustment expenses incurred.
Net premium earned was up approximately 2 percent over the prior year primarily due to the effect of rate increases. Lossesincurred were down $1.8 billion in 2012 compared to 2011. The decrease is primarily attributed to a $1.7 billion decrease incatastrophe losses, which totaled $3.5 billion in 2012 compared to $5.3 billion in 2011. Major catastrophes in 2012 includedthe wildfires in Colorado and Superstorm Sandy while major catastrophes in 2011 included severe tornado and hail storms inApril and May through Tennessee, Alabama, Missouri and other Southern and Southeastern states, as well as winter stormevents earlier in the year and losses from Hurricane Irene in the latter part of the year. The improvement in results reduced thecombined ratio down to 104.8 compared to 119.2 the prior year.
There were fewer significant storm events in 2010 compared to 2011 and 2009, however, the frequency was still aboveaverage. Net underwriting losses totaled just over $1.0 billion after reinsurance in 2010.
Underwriting results for 2008 and 2009 were adversely impacted by claims from the non-Texas remnants of Hurricanes Ike andGustav and an increase in frequency and severity of windstorms in the South and Midwest.
Management has and continues to take action to improve underwriting performance. This includes raising premium ratesprimarily on homeowners' policies, reunderwriting the property book to focus on more profitable accounts, reducing exposurein higher catastrophe risk areas, increasing homeowner deductibles where needed and improving its rate modelingcapabilities. These actions have resulted in improving baseline underwriting performance (loss and loss adjustment expensesincurred excluding catastrophes) each of the last five years.
002477 - State Farm Fire and Casualty Company
Page 10 of 29 Print Date: September 03, 2013

Underwriting Results (Continued ...)Underwriting Experience
YearNet Undrw
Income ($000)
Loss Ratios Expense Ratios
Div. Pol.Comb.Ratio
PureLoss LAE
Loss &LAE
NetComm
OtherExp.
TotalExp.
2012 -743,364 65.1 12.4 77.4 12.7 14.8 27.4 ... 104.8
2011 -2,738,805 79.3 11.9 91.3 12.6 15.3 27.9 ... 119.2
2010 -1,027,484 67.6 11.9 79.5 12.2 15.4 27.6 ... 107.1
2009 -1,233,555 68.2 12.6 80.8 12.5 15.5 28.1 ... 108.9
2008 -2,974,556 81.9 13.7 95.5 12.1 16.2 28.3 ... 123.9
5-Yr Avg -8,717,764 72.3 12.5 84.7 12.4 15.4 27.9 ... 112.6
06/2013 41,328 59.3 12.0 71.3 XX XX 26.9 ... 98.3
06/2012 -239,851 64.0 11.5 75.4 XX XX 27.2 ... 102.7
Loss Ratio By Line
Product Line 2012 2011 2010 2009 2008 5-Yr. Avg.
Homeowners 68.8 85.8 71.7 73.1 87.3 77.1
Com'l MultiPeril 64.2 72.2 57.5 57.5 80.2 66.4
Oth Liab Occur 36.7 27.6 51.9 54.9 65.2 46.6
Inland Marine 45.9 44.4 42.6 43.7 43.7 44.0
All Other 40.2 50.7 46.8 40.0 51.4 45.9
Total 65.1 79.3 67.6 68.2 81.9 72.3
Combined Ratio
0.0
30.0
60.0
90.0
120.0
150.0
2008 2009 2010 2011 2012
95.580.8 79.5
91.377.4
28.3 28.1 27.6 27.9 27.4
123.9108.9 107.1
119.2104.8
- Loss & LAE Ratio - Expense Ratio - Combined Ratio
2012 Pure Loss Ratio by Product Line
0
15
30
45
60
75
Homeo
wners
Com'l M
ultiPeri
l
Oth Lia
b Occ
ur
Inlan
d Mari
ne
All Othe
r
68.8
64.2
36.7
45.9
40.2
002477 - State Farm Fire and Casualty Company
Page 11 of 29 Print Date: September 03, 2013

Underwriting Results (Continued ...)Direct Loss Ratios By State
2012 2011 2010 2009 2008 5-Yr. Avg.
Illinois 65.6 78.9 83.2 67.6 83.7 75.6
New York 81.1 65.9 63.0 55.4 51.0 63.6
Georgia 52.2 73.5 67.1 123.0 101.3 82.4
Ohio 73.9 82.9 79.5 87.9 91.2 82.7
Pennsylvania 67.7 69.5 78.7 61.6 60.2 67.7
Louisiana 44.3 44.2 30.7 24.6 136.1 55.0
Minnesota 49.4 73.6 72.4 61.8 159.6 80.6
Missouri 68.2 106.1 53.4 56.1 82.1 73.4
Tennessee 77.0 167.8 75.0 78.2 72.4 95.1
Indiana 77.6 72.4 49.0 71.1 106.1 74.6
All Other 60.3 71.6 64.0 66.2 71.7 66.7
Total 62.9 75.5 65.2 67.5 80.0 70.0
Investment Results
Investment Results: The preponderance of investment income is derived from interest earned on fixed income securities.These have contributed approximately 87.5 percent of the company's gross investment income (before expenses) over the lastfive years. SFFCC holds a greater percentage of its investments in equities and takes on more investment risk for the potentialof higher returns over the long run. Over the last five years, equities have contributed approximately 12.0 percent to grossinvestment income compared to approximately 8.5 percent on average for the companies that comprise the personal propertycomposite.
Net investment income was down approximately 4.8 percent in 2012 and 10.5 percent below levels from five years ago. Thiswas mainly attributed to lower interest earned on bonds partially offset by higher dividends on non-affiliated stocks. Bondyields have been trending downward over the last five years due to declining interest rates. The gross yield on the bondportfolio was down to 4.3 percent in 2012 compared to 4.4 percent in 2011.
Net investment income growth has been erratic over the last five years. This has been attributed to several factors whichinclude volatility in the equities markets, fluctuations in the level of invested assets and a drop in interest rates. However,growth of invested assets has been flat over the last five years.
Net investment income fell by 6.4 percent in 2009 from lower bond income due to a decrease in invested assets and lowercommon stock dividends as a result of the down turn in the financial markets. Net investment income was down another 2.2percent in 2010, due primarily to a further drop in yields and higher investment expenses. In 2011, net investment income wasup 2.8 percent over the prior year due to an increase in common stock investments and higher yields from common stockspartially offset by a reduction in bond investments.
The average total return on invested assets over the last five years including realized and unrealized capital gains and losseswas 3.9 percent. The five year average was significantly impacted by unrealized capital losses reported in 2008 after thecollapse of the financial markets. This resulted in a total return on invested assets of 0.3 percent for that year.
002477 - State Farm Fire and Casualty Company
Page 12 of 29 Print Date: September 03, 2013

Investment Results (Continued ...)Investment Gains ($000)
Company Industry Composite
Year
NetInvestment
Income($000)
RealizedCapitalGains($000)
UnrealizedCapitalGains($000)
InvestmentIncome
Growth (%)InvestmentYield (%)
Returnon
InvestedAssets
(%)
TotalReturn
(%)
InvestmentIncome
Growth (%)InvestmentYield (%)
2012 872,299 8,136 252,092 -4.8 3.7 3.7 4.8 -6.4 2.4
2011 916,278 30,785 45,312 2.8 3.9 4.1 4.3 4.0 2.7
2010 890,988 39,248 112,490 -2.2 3.8 4.0 4.5 -5.9 2.7
2009 911,147 6,564 378,181 -6.4 4.1 4.1 5.9 -18.9 3.1
2008 973,796 -34,594 -881,062 -0.1 4.3 4.2 0.3 4.4 3.8
5-Yr Avg/Tot 4,564,509 50,139 -92,987 -2.2 4.0 4.0 3.9 -5.0 2.9
06/2013 431,146 8,034 314,937 -1.1 3.5 3.5 5.1 XX XX
06/2012 435,941 6,098 171,502 -5.4 3.6 3.8 4.1 XX XX
Investment Yield vs Industry
0.0
1.0
2.0
3.0
4.0
5.0
2008 2009 2010 2011 2012
4.3 4.13.8 3.9 3.7
3.8
3.12.7 2.7
2.4
- Company Investment Yield (%) - Industry Composite Investment Yield (%)
* Industry Composite - Personal Property Composite
Investment Income Growth vs Industry
-30.0
-22.5
-15.0
-7.5
0.0
7.5
2008 2009 2010 2011 2012
-0.1 -6.4
-2.2 2.8-4.8
4.4
-18.9
-5.9
4.0
-6.4
- Company Investment Income Growth (%) - Industry Composite Investment Income Growth (%)
* Industry Composite - Personal Property Composite
002477 - State Farm Fire and Casualty Company
Page 13 of 29 Print Date: September 03, 2013

Balance Sheet Strength
Capitalization
Capitalization: Risk adjusted capitalization, as measured by its Best's Capital Adequacy Ratio (BCAR), was minimallysupportive of the company's ratings at December 31, 2012. Surplus increased by nearly $1.1 billion or 13.6 percent in 2012after falling by $1.0 billion or 11.7 percent in 2011. Surplus growth in 2012 was primarily due to after-tax net income of $0.3billion, unrealized capital gains of $0.3 billion and other surplus gains of $0.5 billion which were mainly attributed to a changein accounting principles for income taxes. The decrease in surplus in 2011 was due to after-tax net losses of nearly $1.5 billionand other surplus losses of $0.1 billion, partially offset by $0.5 billion of additional capital obtained from SFMAIC through theissuance of a surplus note. The surplus note continued to be outstanding at year end 2012 and matures on March 31, 2017.Capitalization was reflective of the company's elevated underwriting and investment leverage.
The net retention for a single catastrophic loss event was reduced to $1.5 billion in 2012 from $2.0 billion, and representedapproximately 17.0 percent of surplus on a pre-tax basis at year end 2012. When stressed for a 1 in 100 year magnitudehurricane, BCAR falls below the minimum guideline for the current ratings. However; these concerns are partially mitigated bypast support provided by SFMAIC, which in 2011, acquired a surplus note in exchange for cash.
Surplus growth has been erratic over the last five years. Surplus fell by 19.5 percent in 2008 due to substantial underwritingand investment losses. Underwriting losses were the result of a combination of premium rate reductions in prior years andcatastrophe losses. Investment losses were due to declining interest rates and realized and unrealized capital losses from thefinancial crisis in the fourth quarter. Surplus grew modestly in 2009 and 2010 from lower underwriting losses and investmentgains as the financial markets had a partial recovery.
These concerns are partially mitigated by favorable returns in the first quarter of 2013 and by actions taken to improveearnings and manage risk. However; additional reductions in BCAR and unfavorable operating performance may put pressureon the ratings.
Capital Generation Analysis ($000)
Year
Source of Surplus Growth
Pre-taxOperatingIncome
RealizedCapitalGains
IncomeTaxes
UnrealizedCapitalGains
NetContributed
CapitalOther
ChangesChange in
PHS
%Changein PHS
2012 189,681 8,136 -119,378 252,092 ... 487,391 1,056,678 13.6
2011 -1,763,979 30,785 -268,068 45,312 500,000 -104,451 -1,024,265 -11.7
2010 -32,576 39,248 -44,168 112,490 ... 68,720 232,051 2.7
2009 -325,326 6,564 -112,668 378,181 ... 184,165 356,252 4.4
2008 -1,952,431 -34,594 -794,455 -881,062 ... 96,815 -1,976,816 -19.5
5-Yr Total -3,884,630 50,139 -1,338,736 -92,987 500,000 732,640 -1,356,101 -2.8
06/2013 473,135 8,034 81,196 314,937 ... -277,877 437,033 5.0
06/2012 242,717 6,098 65,398 171,502 ... 469,039 823,958 10.6
002477 - State Farm Fire and Casualty Company
Page 14 of 29 Print Date: September 03, 2013

Capitalization (Continued ...)Quality of Surplus ($000)
YearSurplusNotes Other Debt
ContributedCapital
UnassignedSurplus
Year EndPolicyholders
SurplusConditionalReserves
AdjustedPolicyholders
Surplus
2012 500,000 ... 5,524,755 2,780,607 8,805,362 2,470 8,807,833
2011 500,000 ... 5,272,060 1,976,625 7,748,685 2,620 7,751,305
2010 ... ... 5,226,835 3,546,115 8,772,950 2,881 8,775,831
2009 ... ... 5,115,454 3,425,445 8,540,899 1,984 8,542,883
2008 ... ... 4,741,545 3,443,102 8,184,647 1,458 8,186,105
06/2013 500,000 ... 5,839,676 2,902,719 9,242,395 2,931 9,245,326
06/2012 500,000 ... 5,443,549 2,629,093 8,572,643 2,504 8,575,146
Underwriting Leverage
Underwriting Leverage: Underwriting leverage measures are elevated relative to the personal property composite averages.The ratios are indicators of a company's surplus exposure to pricing errors and misstatement of policyholder liabilities on agross and net basis. SFFCC's elevated underwriting leverage is primarily attributed to its higher level of retained risk relative tosurplus combined with significant reductions in surplus in 2008 and 2011. Premium and loss reserve growth have alsoexceeded the overall growth in surplus over the last five years. Net premium written was up 22.2 percent and net loss and lossadjustment expense reserves were up 23.6 percent, compared to a 13.3 percent decrease in surplus over the period. Thisconcern is partially mitigated by SFFCC's favorable reserve development trend and actions being taken to increasehomeowners' rates and other underwriting initiatives being implemented to improve earnings.
Leverage Analysis
Company Industry Composite
YearNPW to
PHSReservesto PHS
NetLeverage
GrossLeverage
NPW toPHS
Reservesto PHS
NetLeverage
GrossLeverage
2012 1.6 0.8 3.9 4.0 0.8 0.4 2.0 2.3
2011 1.8 0.9 4.3 4.4 0.8 0.4 2.0 2.4
2010 1.6 0.8 3.7 3.9 0.9 0.4 2.2 2.5
2009 1.5 0.8 3.6 3.8 0.9 0.4 2.2 2.5
2008 1.5 0.9 3.7 3.8 0.9 0.5 2.3 2.7
06/2013 1.6 0.8 3.9 XX XX XX XX XX
06/2012 1.7 0.9 4.0 XX XX XX XX XX
Current BCAR: 160.3
002477 - State Farm Fire and Casualty Company
Page 15 of 29 Print Date: September 03, 2013

Underwriting Leverage (Continued ...)
Net Leverage vs Industry
0.0
1.0
2.0
3.0
4.0
5.0
2008 2009 2010 2011 2012
3.7 3.6 3.7
4.33.9
2.3 2.2 2.2 2.0 2.0
- Company Net Leverage - Industry Composite Net Leverage
* Industry Composite - Personal Property Composite
Gross Leverage vs Industry
0.0
1.0
2.0
3.0
4.0
5.0
2008 2009 2010 2011 2012
3.8 3.8 3.94.4
4.0
2.7 2.5 2.5 2.4 2.3
- Company Gross Leverage - Industry Composite Gross Leverage
* Industry Composite - Personal Property Composite
Ceded Reinsurance Analysis ($000)
Company Industry Composite
Year
CededReinsurance
Total
BusinessRetention
(%)
ReinsuranceRecoverablesto PHS (%)
CededReinsuranceto PHS (%)
BusinessRetention
(%)
ReinsuranceRecoverablesto PHS (%)
CededReinsuranceto PHS (%)
2012 451,999 84.5 1.7 5.1 68.8 12.8 33.7
2011 465,115 86.0 2.8 6.0 67.5 13.0 37.4
2010 1,379,975 82.5 6.5 15.7 71.3 12.3 33.2
2009 1,425,328 81.7 7.2 16.7 69.5 13.8 36.8
2008 1,440,289 80.9 8.0 17.6 68.0 17.0 42.3
2012 Reinsurance Recoverables ($000)
Paid & UnpaidLosses
Incurred ButNot Reported(IBNR) Losses
UnearnedPremiums
OtherRecoverables *
TotalReinsuranceRecoverables
US Affiliates 1,202,628 335,899 764,622 ... 2,303,150
US Insurers 23,714 16,536 52,686 3,388 96,324
Pools/Associations 7,054 546 11,533 ... 19,132
Other Non-Us 138 266 30,663 227 31,296
Total(ex Us Affils) 30,906 17,348 94,882 3,615 146,752
Grand Total 1,233,535 353,248 859,505 3,615 2,449,903
* Includes Commissions less Funds Withheld
002477 - State Farm Fire and Casualty Company
Page 16 of 29 Print Date: September 03, 2013

Loss Reserves
Loss Reserves: Reserve development in recent years has been relatively stable overall with redundancies on both anaccident and calendar year basis. SFFCC does not discount loss reserves nor anticipate future salvage and subrogationrecoveries in loss reserve estimates. The company appears to have minimal exposure to asbestos and environmental claimswhich arose from the direct sale and reinsurance of personal and commercial multiple peril insurance policies and generalliability insurance policies as well as limited participation in various reinsurance pools.
The majority of loss and loss adjustment expense reserves at year end 2012 were allocated to homeowners'/farmowners' linesof business (58.5 percent), workers' compensation (13.8 percent), commercial multi-peril (13.4 percent) and other liability lines(11.5 percent). Generally longer tail lines and older claims have the greatest potential to develop adversely because initialultimate claims cost estimates are less accurate. However; the majority of claims over 10 years old were workers'compensation claims which are generally well defined.
Loss and ALAE Reserve Development: Calendar Year ($000)
CalendarYear
OriginalLoss
Reserves
DevelopedReservesThru 2012
Developmentto Original (%)
Developmentto PHS (%)
Developmentto NPE (%)
UnpaidReserves @
12/2012
UnpaidReserves toDevelopment
(%)
2012 6,142,775 6,142,775 ... ... 43.3 6,142,775 100.0
2011 6,082,424 5,897,335 -3.0 -2.4 42.4 2,973,280 50.4
2010 5,978,114 5,599,138 -6.3 -4.3 42.0 1,942,767 34.7
2009 5,879,062 5,437,219 -7.5 -5.2 43.0 1,392,745 25.6
2008 6,096,172 5,707,437 -6.4 -4.7 46.7 1,037,112 18.2
2007 5,064,968 5,181,560 2.3 1.1 44.0 799,709 15.4
Loss and ALAE Reserve Development: Accident Year ($000)
AccidentYear
Original LossReserves
DevelopedReserves Thru
2012Development to
Original (%)
UnpaidReserves @
12/2012Accident Year
Loss RatioAccident YearComb. Ratio
2012 3,169,495 3,169,495 ... 3,169,495 82.0 109.4
2011 3,181,839 3,074,969 -3.4 1,030,513 93.6 121.5
2010 2,998,877 2,923,529 -2.5 550,022 79.7 107.3
2009 2,858,644 2,780,211 -2.7 355,633 80.4 108.4
2008 3,103,253 3,007,745 -3.1 237,403 91.0 119.3
2007 2,336,359 2,430,832 4.0 166,054 65.9 93.8
002477 - State Farm Fire and Casualty Company
Page 17 of 29 Print Date: September 03, 2013

Loss Reserves (Continued ...)Asbestos And Environmental Reserves Analysis
Company Industry Composite
Year
Net A&EReserves
($000)
ReserveRetention
(%)
NetIncurredBut Not
Reported(IBNR)Mix (%)
SurvivalRatio (3 Yr)
Comb.Ratio
Impact(1 Yr)
Comb.Ratio
Impact(3 Yr)
SurvivalRatio (3 Yr)
Comb.Ratio
Impact(1 Yr)
Comb.Ratio
Impact(3 Yr)
2012 22,696 100.0 ... 1.3 0.1 0.1 9.1 0.6 0.6
2011 33,085 100.0 48.0 1.6 0.1 0.1 9.1 0.5 0.6
2010 34,985 100.0 53.5 1.7 0.1 0.1 7.2 0.7 0.5
2009 38,948 100.0 55.2 ... 0.2 ... ... 0.6 ...
2008 45,352 100.0 58.2 ... 0.1 ... ... 0.3 ...
Liquidity
Liquidity: Balance sheet liquidity is adequate; however, liquidity ratios fall well below the composite averages. This is due to ahigher level of common stock in the investment portfolio and a higher level of reserves relative to assets. The majority of thecompany's invested assets are in highly liquid bonds, short-term securities, cash and cash equivalents, however,approximately 18.9 percent total invested assets and 16.0 percent of total assets were in less liquid non-affiliated commonstocks.
Operating cash flows were positive in three of the last five years. The exceptions were in 2008 and 2011 when claim paymentsincreased significantly to cover catastrophic losses. In 2011, SFFCC issued a $500 million surplus note to SFMAIC. Despitethe inflow of cash from this transaction, overall net cash flow was negative for the year.
SFFCC participates in a short-term investment pooling agreement with affiliated companies, whereby any party may transfer aportion of its cash and short-term investments to a liquidity pool in exchange for proportional membership interest in the pool.The company is also a party to a common clearing account agreement whereby it may deposit premium payments and othercash receipts, disburse funds and accept electronic payments through a comprehensive cash balance system.
Liquidity Analysis
Company Industry Composite
Year
QuickLiquidity
(%)
CurrentLiquidity
(%)
OverallLiquidity
(%)
GrossAgents
Balancesto PHS(%)
QuickLiquidity
(%)
CurrentLiquidity
(%)
OverallLiquidity
(%)
GrossAgents
Balancesto PHS (%)
2012 39.0 125.5 143.6 2.0 62.6 162.3 179.5 3.5
2011 36.0 122.6 139.8 2.1 68.0 160.3 177.7 4.4
2010 39.7 130.8 146.5 2.1 67.6 157.7 175.0 3.8
2009 38.2 131.4 147.8 1.6 67.1 157.1 175.1 3.7
2008 26.5 125.3 146.4 1.7 60.1 147.7 170.2 4.1
06/2013 XX 124.8 143.9 2.4 XX XX XX XX
06/2012 XX 122.6 142.4 2.3 XX XX XX XX
002477 - State Farm Fire and Casualty Company
Page 18 of 29 Print Date: September 03, 2013

Liquidity (Continued ...)
Quick Liquidity vs Industry
0.0
15.0
30.0
45.0
60.0
75.0
2008 2009 2010 2011 2012
26.5
38.2 39.736.0 39.0
60.167.1 67.6 68.0
62.6
- Company Quick Liquidity (%) - Industry Composite Quick Liquidity (%)
* Industry Composite - Personal Property Composite
Current Liquidity vs Industry
0.0
40.0
80.0
120.0
160.0
200.0
2008 2009 2010 2011 2012
125.3 131.4 130.8 122.6 125.5
147.7157.1 157.7 160.3 162.3
- Company Current Liquidity (%) - Industry Composite Current Liquidity (%)
* Industry Composite - Personal Property Composite
Cash Flow Analysis ($000)
Company Industry Composite
YearUnderwritingCash Flow
OperatingCash Flow
Net CashFlow
UnderwritingCash Flow
(%)
OperatingCash Flow
(%)
UnderwritingCash Flow
(%)
OperatingCash Flow
(%)
2012 -254,249 885,653 19,419 98.3 106.1 106.4 112.8
2011 -2,410,410 -1,498,199 -353,984 85.3 91.0 94.2 101.4
2010 -539,337 484,093 -149,433 96.2 103.4 107.0 112.3
2009 -995,708 847,095 269,851 92.9 106.1 104.1 114.0
2008 -1,552,717 -718,016 -573,404 88.8 94.9 94.6 99.7
5-Yr Total -5,752,421 626 -787,552 ... ... ... ...
06/2013 186,256 896,354 188,496 102.6 112.4 XX XX
06/2012 184,719 868,304 158,275 102.7 112.5 XX XX
Investments
Investments: Invested assets totaled approximately $24.5 billion as of December 31, 2012, which was up 5.4 percent fromthe prior year. Fixed income securities (bonds and short-term investments), which totaled $19.9 billion were 81.2 percent of theinvestment portfolio and were up approximately 4.4 percent for the year. The remainder of the portfolio included non-affiliatedcommon stock (18.9 percent of total invested assets) and cash, cash equivalents and other invested assets (-0.1 percent).
The bond portfolio consisted of a diversified mix of tax-exempt and taxable municipal bonds, U.S. Treasuries, mortgage backedobligations and investment grade corporate and foreign denominated securities. Similarly, common stock investments includeda broad array of industrial and miscellaneous corporate stocks and mutual funds. No one investment by issuer representedmore than 4.7 percent of year end 2012 surplus. However; the common stock portfolio in total was greater than 50 percent of
002477 - State Farm Fire and Casualty Company
Page 19 of 29 Print Date: September 03, 2013

Investments (Continued ...)
year end 2012 surplus and presented a greater degree of risk from equity market fluctuations than the average of the personalproperty composite.
Investment Leverage Analysis (% of PHS)
Company Industry Composite
YearClass 3-6Bonds
Real Estate /Mortgages
OtherInvestedAssets
CommonStock
Non -Affiliated
InvestmentLeverage
AffiliatedInvestments
Class 3-6Bonds
CommonStock
2012 0.2 ... ... 52.6 52.7 ... 1.1 19.9
2011 0.3 ... ... 54.6 54.9 ... 1.1 19.8
2010 0.3 ... ... 47.8 48.1 ... 1.4 19.8
2009 0.3 ... ... 47.2 47.5 ... 1.2 19.1
2008 0.5 ... ... 42.4 43.0 ... 1.7 17.6
Investments - Bond Portfolio
2012 Distribution By Maturity
Years
0-1 1-5 5-10 10-20 20+
YearsAverageMaturity
Government 3.3 11.2 2.8 0.4 ... 3.5
Government Agencies & Muni. 6.7 36.8 21.1 6.7 0.9 5.5
Industrial & Misc. 1.3 5.3 3.4 0.1 ... 4.0
Total 11.2 53.3 27.4 7.2 0.9 5.0
002477 - State Farm Fire and Casualty Company
Page 20 of 29 Print Date: September 03, 2013
Investments - Bond Portfolio (Continued ...)
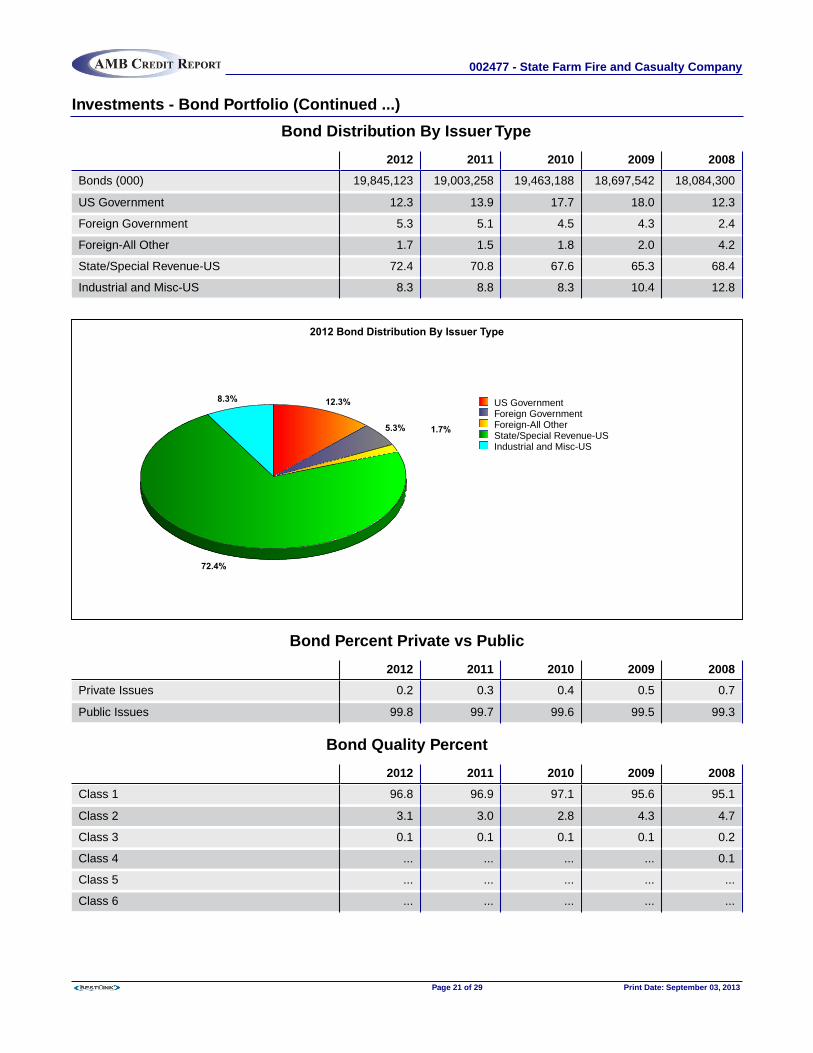
Bond Distribution By Issuer Type
2012 2011 2010 2009 2008
Bonds (000) 19,845,123 19,003,258 19,463,188 18,697,542 18,084,300
US Government 12.3 13.9 17.7 18.0 12.3
Foreign Government 5.3 5.1 4.5 4.3 2.4
Foreign-All Other 1.7 1.5 1.8 2.0 4.2
State/Special Revenue-US 72.4 70.8 67.6 65.3 68.4
Industrial and Misc-US 8.3 8.8 8.3 10.4 12.8
2012 Bond Distribution By Issuer Type
12.3%
5.3% 1.7%
72.4%
8.3% US GovernmentForeign GovernmentForeign-All OtherState/Special Revenue-USIndustrial and Misc-US
Bond Percent Private vs Public
2012 2011 2010 2009 2008
Private Issues 0.2 0.3 0.4 0.5 0.7
Public Issues 99.8 99.7 99.6 99.5 99.3
Bond Quality Percent
2012 2011 2010 2009 2008
Class 1 96.8 96.9 97.1 95.6 95.1
Class 2 3.1 3.0 2.8 4.3 4.7
Class 3 0.1 0.1 0.1 0.1 0.2
Class 4 ... ... ... ... 0.1
Class 5 ... ... ... ... ...
Class 6 ... ... ... ... ...
002477 - State Farm Fire and Casualty Company
Page 21 of 29 Print Date: September 03, 2013

Investments - Equity Portfolio
2012 2011 2010 2009 2008
Total Stocks(000) 4,627,902 4,234,386 4,195,798 4,034,836 3,473,495
Unaffiliated Common 100.0 100.0 100.0 100.0 100.0
Investments - Other Invested Assets
2012 2011 2010 2009 2008
Other Invested Assets(000) -2,495 -21,913 332,073 481,734 212,192
Cash 645.4 154.3 70.8 86.6 29.1
Short-Term -99.9 -54.0 29.2 13.4 70.6
All Other -2.3 -0.3 ... 0.1 0.3
002477 - State Farm Fire and Casualty Company
Page 22 of 29 Print Date: September 03, 2013

HistoryThe company was organized on June 12, 1935, under the laws of Illinois and commenced business on June 29, 1935. Thepresent title was adopted on July 1, 1950, when the company absorbed by merger the State Farm Casualty Company.
Capital paid up is $10,000,000. Authorized capital comprises 250,000 shares of $100 par value each, 100,000 of which areissued and outstanding. All of the common stock of the company is held by State Farm Mutual Automobile InsuranceCompany.
ManagementThe company's operations are under the direction of Edward B. Rust, Jr., Chairman, President and Chief Executive Officer,who began his career with State Farm in 1975.
Officers And Directors
OfficersChairman of the Board, President and CEO Edward B.Rust, Jr.EVP and COO Michael L. TipsordEVP Brian V. BoydenSVP, Treasurer and CFO Paul J. SmithSVP and General Counsel Jeffrey W. Jackson
SVP Randall H. HarbertVice President and Controller Mark E. SchwambergerVice President Susan Q. Hood (Claims)Vice President Angela K. Sparks (Underwriting)Secretary Lynne M. Yowell
DirectorsBrian V. BoydenGerald M. CzarneckiRandall H. HarbertWilliam H. Knight, Jr.Edward B. Rust, Jr.
Paul J. SmithPaul T. SteckoMichael L. TipsordMichael S. Wey
Regulatory
An examination of the financial condition was made as of December 31, 2010, by the insurance department of Illinois. The2012 annual independent audit of the company was conducted by PricewaterhouseCoopers, LLP. The annual statement ofactuarial opinion is provided by Christopher Walker, P&C Actuarial Partner, PricewaterhouseCoopers, LLP.
Reinsurance
The following text is derived from A.M. Best's Credit Report on State Farm Group (AMB# 000088).
Catastrophe excess of loss per occurrence reinsurance is provided for the non-automobile property lines written by SFFCC,SFGIC, SFL, TCM and SFFIC. SFMAIC is the primary reinsurer on these contracts, however, non-affiliated reinsurers alsoparticipate in the coverage.
SFMAIC further provides aggregate excess of loss catastrophe reinsurance for qualifying events in excess of contractretentions to SFFCC, SFGIC, SFL, and SFFIC. Contract retentions and limits vary by company and year. There is one
002477 - State Farm Fire and Casualty Company
Page 23 of 29 Print Date: September 03, 2013

Reinsurance (Continued ...)
reinstatement of the limits on the catastrophe excess of loss per occurrence reinsurance and no reinstatement of the limits onthe aggregate excess of loss contracts.
In 2012, SFL entered into a wildfire aggregate excess of loss catastrophe reinsurance contract with SFMAIC. Reinsurance isprovided for non-automobile property lines written by SFL in the state of Texas.
Recovery under the catastrophe excess of loss per occurrence, aggregate excess of loss catastrophe and wildfire aggregateexcess of loss catastrophe treaties is net of other available reinsurance recoveries. The contracts are effective July 1 throughthe following June 30 of each year.
TCM cedes 100 percent of its non-automobile premiums and losses to SFFCC and 90 percent of its automobile premiums andlosses to SFMAIC.
Effective in 2013, SFFCC entered into a three-year catastrophe excess of loss reinsurance contract with Merna Re IV Ltd., anunrelated party. The reinsurance agreement provides coverage for the SFFCC's Central U.S. earthquake risk with noreinstatement of coverage limits.
SFMAIC has an excess of loss catastrophe reinsurance contract with ORC, which provides reinsurance coverage for a portionof the exposure SFMAIC assumed through catastrophe reinsurance treaties with SFFCC, TCM, SFGIC, SFL, and SFFIC.
SFMAIC also assumes 100 percent of automobile business written by subsidiaries other than SFIND, Guaranty, and TCMthrough quota share reinsurance. SFFCC assumes 100 percent of the non-automobile business written by SFGIC outside ofthe State of California. SFMAIC also assumes property per risk excess of loss reinsurance from its subsidiaries. Property perrisk is used to protect against large single risk losses from commercial and homeowners/farmowners exposures. Boiler andmachinery (equipment breakdown) coverage written on commercial risks is 100 percent reinsured with Hartford Steam Boiler.
The Canadian branch of SFFCC has boiler and machinery reinsurance, homeowners identity restoration reinsurance andcommercial data compromise/identity restoration reinsurance through 100 percent quota share reinsurance contracts withBoiler Inspection & Insurance Co. of Canada.
002477 - State Farm Fire and Casualty Company
Page 24 of 29 Print Date: September 03, 2013

Balance Sheet ($000)
Admitted Assets 12/31/2012 12/31/2011 2012 % 2011 %
Bonds 19,845,123 19,003,258 68.4 69.8
Preferred Stock ... ... ... ...
Common Stock 4,627,902 4,234,386 16.0 15.5
Cash & Short-Term Invest -2,552 -21,971 ... -0.1
Real estate, investment ... ... ... ...
Derivatives ... ... ... ...
Other Non-Affil Inv Asset 57 59 ... ...
Investments in Affiliates ... ... ... ...
Real Estate, Offices ... ... ... ...
Total Invested Assets 24,470,530 23,215,731 84.4 85.2
Premium Balances 2,571,867 2,404,999 8.9 8.8
Accrued Interest 222,789 226,828 0.8 0.8
Life department ... ... ... ...
All Other Assets 1,733,892 1,395,718 6.0 5.1
Total Assets 28,999,078 27,243,277 100.0 100.0
Liabilities & Surplus 12/31/2012 12/31/2011 2012 % 2011 %
Loss & LAE Reserves 7,438,655 7,261,276 25.7 26.7
Unearned Premiums 7,507,208 7,293,004 25.9 26.8
Conditional Reserve Funds 2,470 2,620 ... ...
Derivatives ... ... ... ...
Life department ... ... ... ...
All Other Liabilities 5,245,382 4,937,690 18.1 18.1
Total Liabilities 20,193,716 19,494,592 69.6 71.6
Surplus notes 500,000 500,000 1.7 1.8
Capital & Assigned Surplus 5,524,755 5,272,060 19.1 19.4
Unassigned Surplus 2,780,607 1,976,625 9.6 7.3
Total Policyholders' Surplus 8,805,362 7,748,685 30.4 28.4
Total Liabilities & Surplus 28,999,078 27,243,277 100.0 100.0
002477 - State Farm Fire and Casualty Company
Page 25 of 29 Print Date: September 03, 2013

Interim Balance Sheet ($000)
Admitted Assets 03/31/2013 06/30/2013
Bonds 20,076,546 20,771,604
Preferred Stock ... ...
Common Stock 5,098,621 5,083,272
Cash & Short-Term Invest 726,935 185,944
Other Investments ... 3,063
Total Invested Assets 25,902,102 26,043,883
Premium Balances 2,570,063 2,708,027
Accrued Interest 218,914 231,714
Reinsurance Funds 125,322 121,391
All Other Assets 997,160 1,202,545
Total Assets 29,813,560 30,307,559
Liabilities & Surplus 03/31/2013 06/30/2013
Loss & LAE Reserves 7,172,187 7,590,148
Unearned Premiums 7,169,628 7,832,314
Conditional Reserve Funds 2,345 2,931
All Other Liabilities 5,848,247 5,639,771
Total Liabilities 20,192,407 21,065,164
Capital & Assigned Surp 6,358,224 6,339,676
Unassigned Surplus 3,262,930 2,902,719
Total Policyholders' Surplus 9,621,154 9,242,395
Total Liabilities & Surplus 29,813,560 30,307,559
002477 - State Farm Fire and Casualty Company
Page 26 of 29 Print Date: September 03, 2013

Summary Of 2012 Operations ($000)
Statement of Income 12/31/2012 Funds Provided from Operations 12/31/2012
Premiums earned 14,195,494 Premiums collected 14,381,103
Losses incurred 9,234,900 Benefit & loss-related pmts 9,153,634
LAE incurred 1,753,953
Undwr expenses incurred 3,950,004 LAE & undwr expenses paid 5,481,719
Other expenses incurred ... Other income / expense ...
Dividends to policyholders ... Dividends to policyholders ...
Net underwriting income -743,364 Underwriting cash flow -254,249
Net transfer ...
Net investment income 872,299 Investment income 935,851
Other income/expense 60,745 Other income/expense 60,745
Pre-tax operating income 189,681 Pre-tax cash operations 742,347
Realized capital gains 8,136
Income taxes incurred -119,378 Income taxes pd (recov) -143,306
Net income 317,195 Net oper cash flow 885,653
002477 - State Farm Fire and Casualty Company
Page 27 of 29 Print Date: September 03, 2013

Interim Income Statement ($000)
Period Ended06/30/2013
Period Ended06/30/2012
Increase /Decrease
Premiums earned 7,333,298 7,063,763 269,535
Losses incurred 4,349,095 4,519,193 -170,098
LAE incurred 882,259 809,286 72,973
Undwr expenses incurred 2,060,615 1,975,134 85,481
Other expenses incurred ... ... ...
Dividends to policyholders ... ... ...
Net underwriting income 41,328 -239,851 281,179
Net investment income 431,146 435,941 -4,794
Other income/expense 661 46,627 -45,966
Pre-tax operating income 473,135 242,717 230,418
Realized capital gains 8,034 6,098 1,936
Income taxes incurred 81,196 65,398 15,799
Net income 399,973 183,417 216,555
Interim Cash Flow ($000)
Period Ended06/30/2013
Period Ended06/30/2012
Increase /Decrease
Premiums collected 7,408,092 7,121,364 286,727
Benefit & loss-related pmts 4,203,200 4,187,075 16,125
LAE & undwr expenses paid 3,018,636 2,749,571 269,065
Dividends to policyholders ... ... ...
Underwriting cash flow 186,256 184,719 1,537
Net transfer ... ... ...
Investment income 455,050 463,844 -8,795
Other income/expense 661 46,627 -45,966
Pre-tax cash operations 641,966 695,190 -53,224
Income taxes pd (recov) -254,387 -173,113 -81,274
Net oper cash flow 896,354 868,304 28,050
002477 - State Farm Fire and Casualty Company
Page 28 of 29 Print Date: September 03, 2013

A Best's Financial Strength Rating opinion addresses the relative ability of an insurer to meet its ongoing insurance obligations. The ratings are not assigned to specific insurance policies orcontracts and do not address any other risk, including, but not limited to, an insurer's claims-payment policies or procedures; the ability of the insurer to dispute or deny claims payment ongrounds of misrepresentation or fraud; or any specific liability contractually borne by the policy or contract holder. A Financial Strength Rating is not a recommendation to purchase, hold orterminate any insurance policy, contract or any other financial obligation issued by an insurer, nor does it address the suitability of any particular policy or contract for a specific purpose orpurchaser.
A Best's Debt/Issuer Credit Rating is an opinion regarding the relative future credit risk of an entity, a credit commitment or a debt or debt-like security.
Credit risk is the risk that an entity may not meet its contractual, financial obligations as they come due. These credit ratings do not address any other risk, including but not limited to liquidityrisk, market value risk or price volatility of rated securities. The rating is not a recommendation to buy, sell or hold any securities, insurance policies, contracts or any other financialobligations, nor does it address the suitability of any particular financial obligation for a specific purpose or purchaser.
In arriving at a rating decision, A.M. Best relies on third-party audited financial data and/or other information provided to it. While this information is believed to be reliable, A.M. Best does notindependently verify the accuracy or reliability of the information. Any and all ratings, opinions and information contained herein are provided "as is," without any express or implied warranty.
Visit http://www.ambest.com/ratings/notice.asp for additional information or http://www.ambest.com/terms.html for details on the Terms of Use.
Copyright © 2013 A.M. Best Company, Inc. All rights reserved.
No part of this report may be reproduced, distributed, or stored in a database or retrieval system, or transmitted in any form or by any means without the prior written permission of the A.M.Best Company. While the data in this report was obtained from sources believed to be reliable, its accuracy is not guaranteed.
002477 - State Farm Fire and Casualty Company
Page 29 of 29 Print Date: September 03, 2013