Embed Size (px)
Citation preview
7/27/2019 002-121e-07.13
http://slidepdf.com/reader/full/002-121e-0713 1/99

7/27/2019 002-121e-07.13
http://slidepdf.com/reader/full/002-121e-0713 2/99
7/27/2019 002-121e-07.13
http://slidepdf.com/reader/full/002-121e-0713 3/99
7/27/2019 002-121e-07.13
http://slidepdf.com/reader/full/002-121e-0713 4/99
Charge Meter Type 5015A...
Page 2 5015A_002-121e-07.13
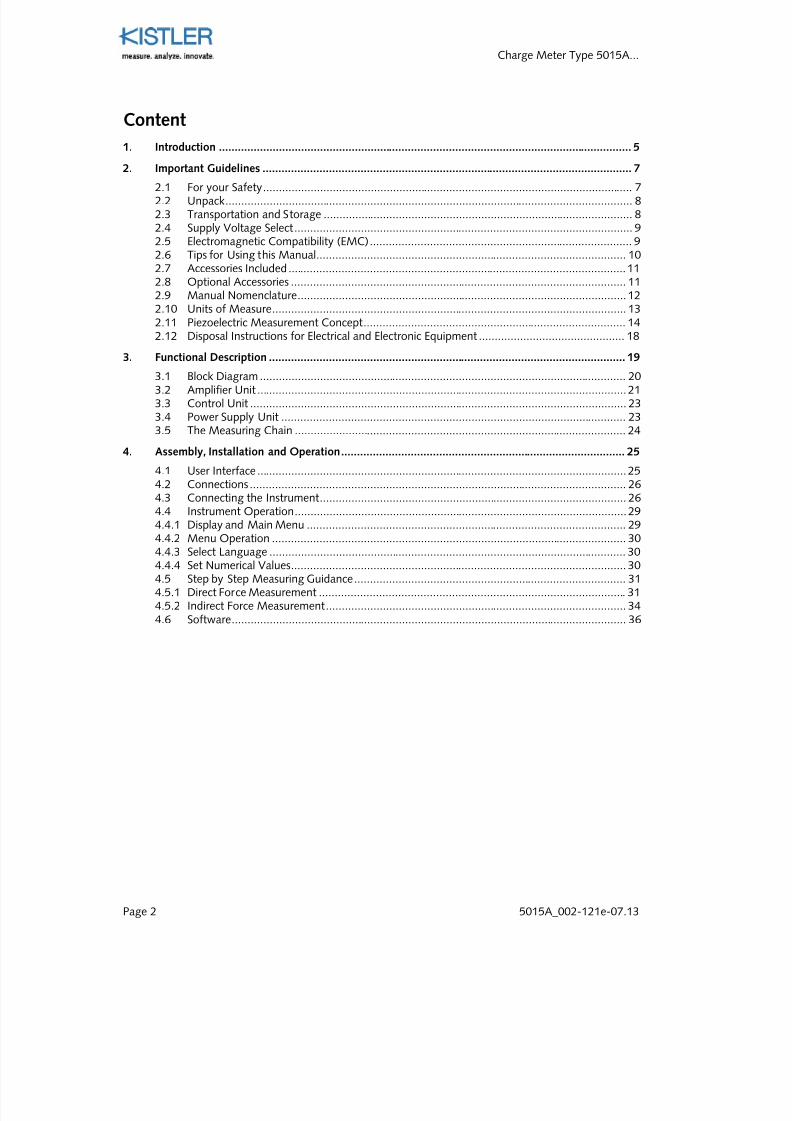
Content
1. Introduction ................................................................................................................................... 5 2. Important Guidelines ..................................................................................................................... 7
2.1 For your Safety ..................................................................................................................... 7 2.2 Unpack ................................................................................................................................. 8 2.3 Transportation and Storage .................................................................................................. 8 2.4 Supply Voltage Select ........................................................................................................... 9 2.5 Electromagnetic Compatibility (EMC) ................................................................................... 9 2.6 Tips for Using this Manual .................................................................................................. 10 2.7 Accessories Included ........................................................................................................... 11 2.8 Optional Accessories .......................................................................................................... 11 2.9 Manual Nomenclature ........................................................................................................ 12 2.10 Units of Measure ................................................................................................................ 13 2.11 Piezoelectric Measurement Concept ................................................................................... 14 2.12 Disposal Instructions for Electrical and Electronic Equipment .............................................. 18
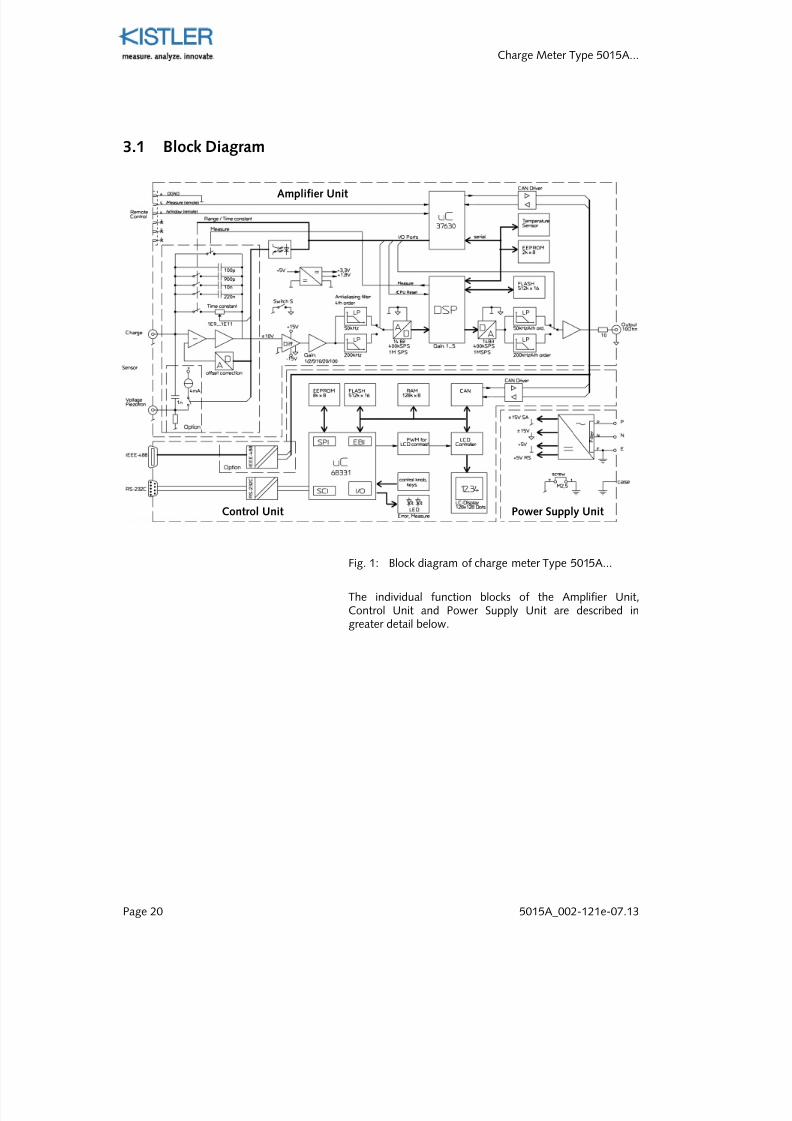
3. Functional Description ................................................................................................................. 19 3.1 Block Diagram .................................................................................................................... 20 3.2 Amplifier Unit ..................................................................................................................... 21 3.3 Control Unit ....................................................................................................................... 23 3.4 Power Supply Unit ............................................................................................................. 23 3.5 The Measuring Chain ......................................................................................................... 24
4. Assembly, Installation and Operation .......................................................................................... 25 4.1 User Interface ..................................................................................................................... 25 4.2 Connections ....................................................................................................................... 26 4.3 Connecting the Instrument ................................................................................................. 26 4.4 Instrument Operation ......................................................................................................... 29 4.4.1 Display and Main Menu ..................................................................................................... 29 4.4.2 Menu Operation ................................................................................................................ 30 4.4.3 Select Language ................................................................................................................. 30 4.4.4 Set Numerical Values .......................................................................................................... 30 4.5 Step by Step Measuring Guidance ...................................................................................... 31 4.5.1 Direct Force Measurement ................................................................................................. 31 4.5.2 Indirect Force Measurement ............................................................................................... 34 4.6 Software ............................................................................................................................. 36
7/27/2019 002-121e-07.13
http://slidepdf.com/reader/full/002-121e-0713 5/99
Introduction
5015A_002-121e-07.13 Page 3
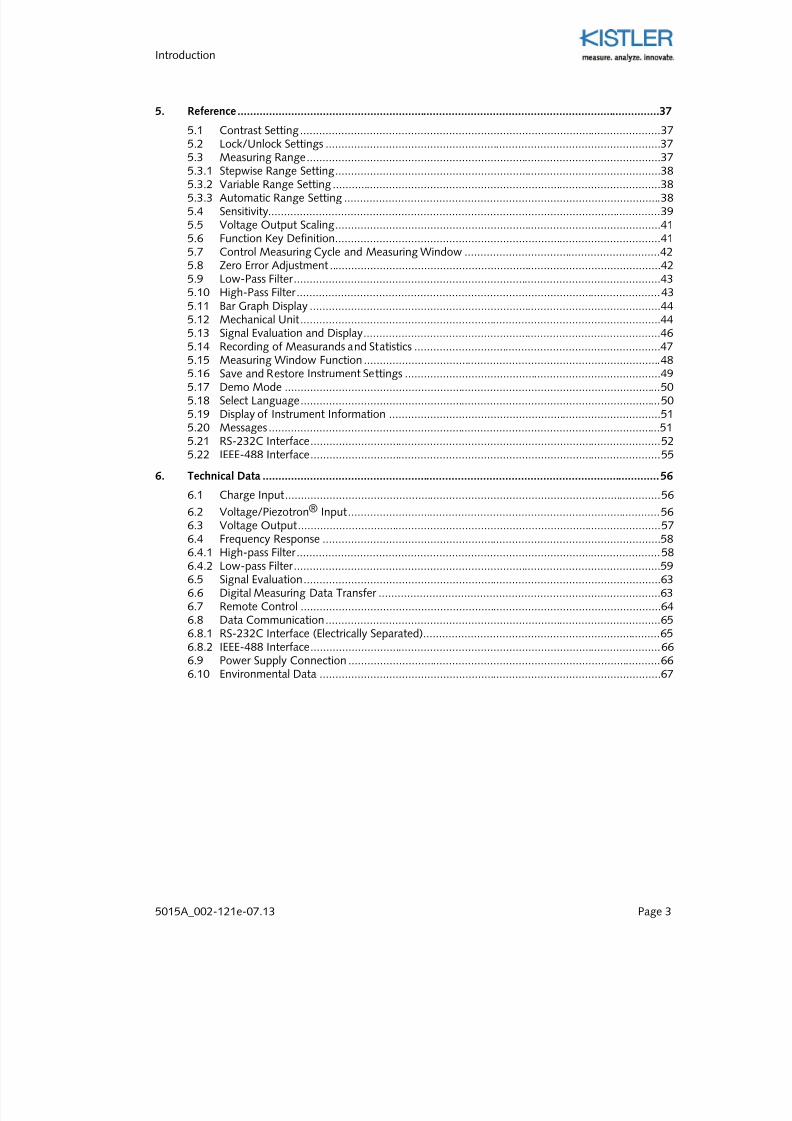
5. Reference ...................................................................................................................................... 37 5.1 Contrast Setting .................................................................................................................. 37 5.2 Lock/Unlock Settings .......................................................................................................... 37 5.3 Measuring Range ................................................................................................................ 37 5.3.1 Stepwise Range Setting ....................................................................................................... 38 5.3.2 Variable Range Setting ........................................................................................................ 38 5.3.3 Automatic Range Setting .................................................................................................... 38 5.4 Sensitivity ............................................................................................................................ 39 5.5 Voltage Output Scaling ....................................................................................................... 41 5.6 Function Key Definition....................................................................................................... 41 5.7 Control Measuring Cycle and Measuring Window .............................................................. 42 5.8 Zero Error Adjustment ......................................................................................................... 42 5.9 Low-Pass Filter .................................................................................................................... 43 5.10 High-Pass Filter ................................................................................................................... 43 5.11 Bar Graph Display ............................................................................................................... 44 5.12 Mechanical Unit .................................................................................................................. 44 5.13
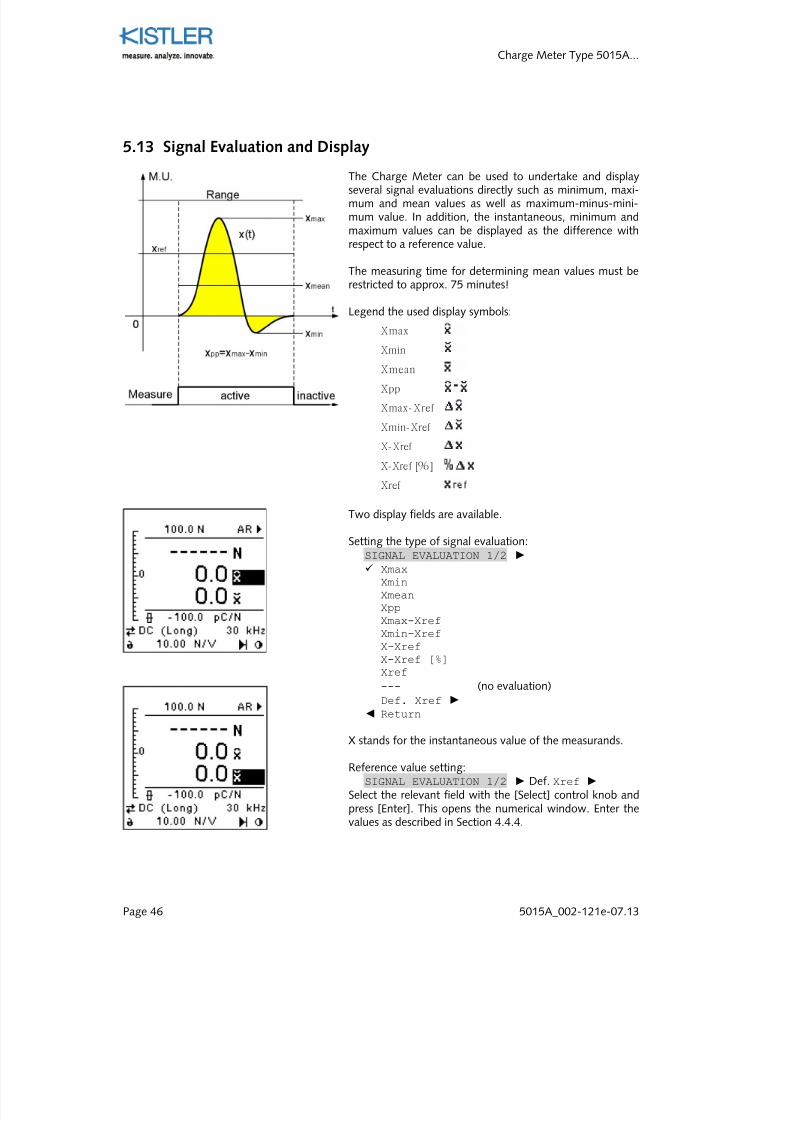
Signal Evaluation and Display .............................................................................................. 46
5.14 Recording of Measurands and Statistics .............................................................................. 47 5.15 Measuring Window Function .............................................................................................. 48 5.16 Save and Restore Instrument Settings ................................................................................. 49 5.17 Demo Mode ....................................................................................................................... 50 5.18 Select Language .................................................................................................................. 50 5.19 Display of Instrument Information ...................................................................................... 51 5.20 Messages ............................................................................................................................ 51 5.21 RS-232C Interface ............................................................................................................... 52 5.22 IEEE-488 Interface ............................................................................................................... 55
6. Technical Data .............................................................................................................................. 56 6.1 Charge Input ....................................................................................................................... 56 6.2 Voltage/Piezotron® Input ................................................................................................... 56 6.3 Voltage Output ................................................................................................................... 57 6.4 Frequency Response ........................................................................................................... 58 6.4.1 High-pass Filter ................................................................................................................... 58 6.4.2 Low-pass Filter .................................................................................................................... 59 6.5 Signal Evaluation ................................................................................................................. 63 6.6 Digital Measuring Data Transfer ......................................................................................... 63 6.7 Remote Control .................................................................................................................. 64 6.8 Data Communication .......................................................................................................... 65 6.8.1 RS-232C Interface (Electrically Separated)........................................................................... 65 6.8.2 IEEE-488 Interface ............................................................................................................... 66 6.9 Power Supply Connection ................................................................................................... 66 6.10 Environmental Data ............................................................................................................ 67
7/27/2019 002-121e-07.13
http://slidepdf.com/reader/full/002-121e-0713 6/99
Charge Meter Type 5015A...
Page 4 5015A_002-121e-07.13
7. Maintenance and Diagnosis ......................................................................................................... 69 7.1 Precautions ......................................................................................................................... 69 7.2 Causes of Drift ................................................................................................................... 69
Cause 2 69 Input signal ........................................................................................................... 69 Output signal ........................................................................................................ 69 Output signal ........................................................................................................ 69 Output signal ........................................................................................................ 69 Input offset ........................................................................................................... 69 Input signal ........................................................................................................... 69 Input signal ........................................................................................................... 69 Output signal ........................................................................................................ 69 Output signal ........................................................................................................ 69 Output signal ........................................................................................................ 69 Output signal ........................................................................................................ 69 Output signal ........................................................................................................ 69
7.3
Testing and Calibration ...................................................................................................... 71
7.3.1 Instrument Test .................................................................................................................. 71 7.3.2 Calibration .......................................................................................................................... 71 7.3.3 Kistler Calibration Service ................................................................................................... 72 7.4 Loading New Firmware ...................................................................................................... 72 7.5 Fuse Replacement .............................................................................................................. 73 7.6 Input Operational Amplifier Replacement .......................................................................... 74
8. Appendix ...................................................................................................................................... 75 8.1 Charge Amplifier Transfer Function .................................................................................... 75 8.1.1 High-pass Filter .................................................................................................................. 75 8.1.2 Low-pass Filter ................................................................................................................... 77 8.2 Remote Control Connection ............................................................................................... 78 8.3 RS-232C Cable ................................................................................................................... 79 8.4 LabView® Driver ................................................................................................................ 80 8.4.1 VI – Virtual Instrument for Charge Meter Type 5015A... .................................................... 80 8.4.2 PC Control Software .......................................................................................................... 88 8.5 Extended Instruction Record of the RS-232C/IEEE-488 Interfaces ...................................... 89 8.6 Fast Digital Data Transfer ................................................................................................... 92
9. Index ............................................................................................................................................ 95 10. Declaration of Conformity ........................................................................................................... 97 Total pages 97
7/27/2019 002-121e-07.13
http://slidepdf.com/reader/full/002-121e-0713 7/99

7/27/2019 002-121e-07.13
http://slidepdf.com/reader/full/002-121e-0713 8/99
7/27/2019 002-121e-07.13
http://slidepdf.com/reader/full/002-121e-0713 9/99
Important Guidelines
5015A_002-121e-07.13 Page 7
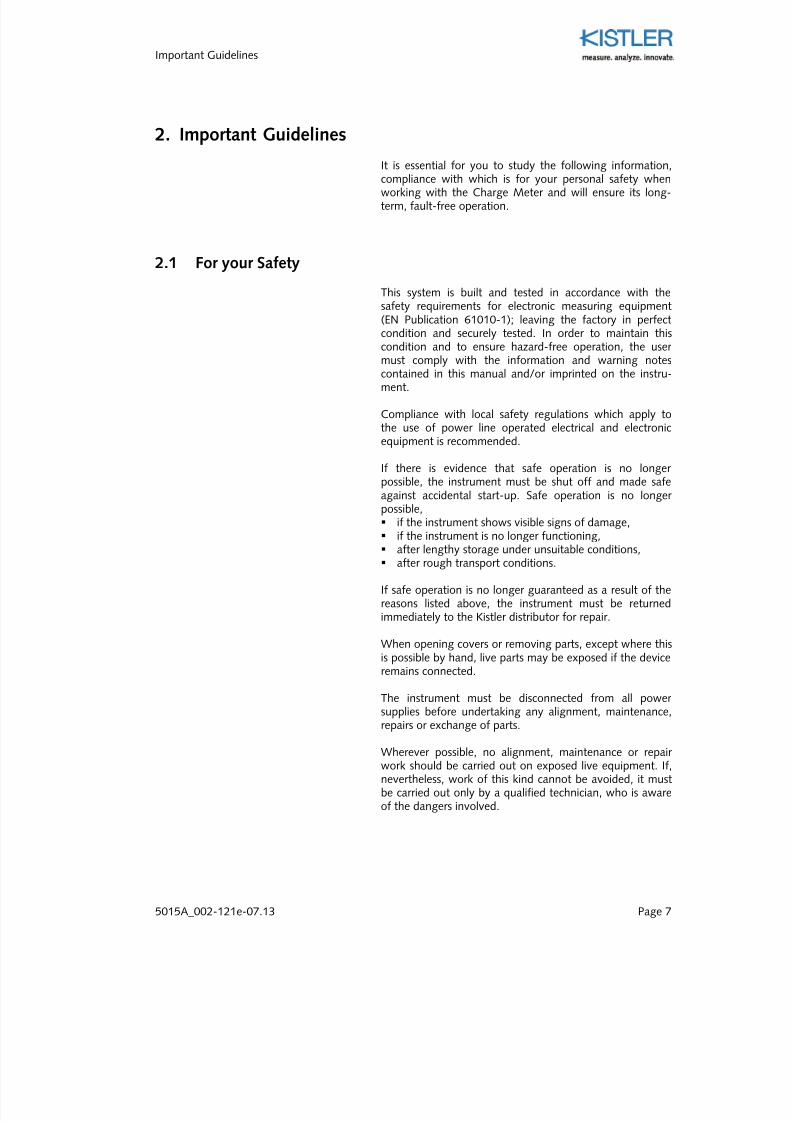
2. Important Guidelines
It is essential for you to study the following information,compliance with which is for your personal safety whenworking with the Charge Meter and will ensure its long-term, fault-free operation.
2.1 For your Safety
This system is built and tested in accordance with thesafety requirements for electronic measuring equipment(EN Publication 61010-1); leaving the factory in perfect
condition and securely tested. In order to maintain thiscondition and to ensure hazard-free operation, the user must comply with the information and warning notescontained in this manual and/or imprinted on the instru-ment.
Compliance with local safety regulations which apply tothe use of power line operated electrical and electronicequipment is recommended.
If there is evidence that safe operation is no longer possible, the instrument must be shut off and made safeagainst accidental start-up. Safe operation is no longer
possible, if the instrument shows visible signs of damage, if the instrument is no longer functioning, after lengthy storage under unsuitable conditions, after rough transport conditions.
If safe operation is no longer guaranteed as a result of thereasons listed above, the instrument must be returnedimmediately to the Kistler distributor for repair.
When opening covers or removing parts, except where thisis possible by hand, live parts may be exposed if the device
remains connected.
The instrument must be disconnected from all power supplies before undertaking any alignment, maintenance,repairs or exchange of parts.
Wherever possible, no alignment, maintenance or repair work should be carried out on exposed live equipment. If,nevertheless, work of this kind cannot be avoided, it mustbe carried out only by a qualified technician, who is awareof the dangers involved.
7/27/2019 002-121e-07.13
http://slidepdf.com/reader/full/002-121e-0713 10/99
7/27/2019 002-121e-07.13
http://slidepdf.com/reader/full/002-121e-0713 11/99
Important Guidelines
5015A_002-121e-07.13 Page 9
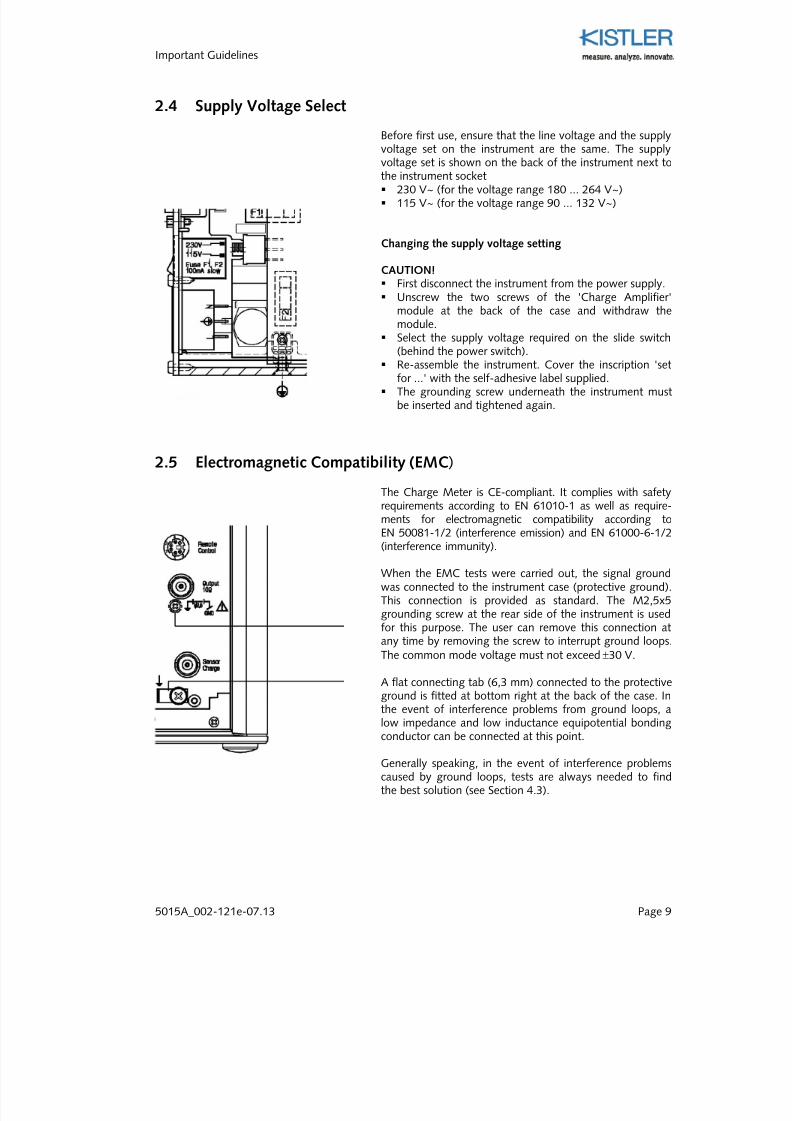
2.4 Supply Voltage Select
Before first use, ensure that the line voltage and the supplyvoltage set on the instrument are the same. The supply
voltage set is shown on the back of the instrument next tothe instrument socket 230 V~ (for the voltage range 180 ... 264 V~) 115 V~ (for the voltage range 90 ... 132 V~)
Changing the supply voltage setting
CAUTION! First disconnect the instrument from the power supply. Unscrew the two screws of the 'Charge Amplifier'
module at the back of the case and withdraw themodule.
Select the supply voltage required on the slide switch(behind the power switch).
Re-assemble the instrument. Cover the inscription 'setfor ...' with the self-adhesive label supplied.
The grounding screw underneath the instrument mustbe inserted and tightened again.
2.5 Electromagnetic Compatibility (EMC)
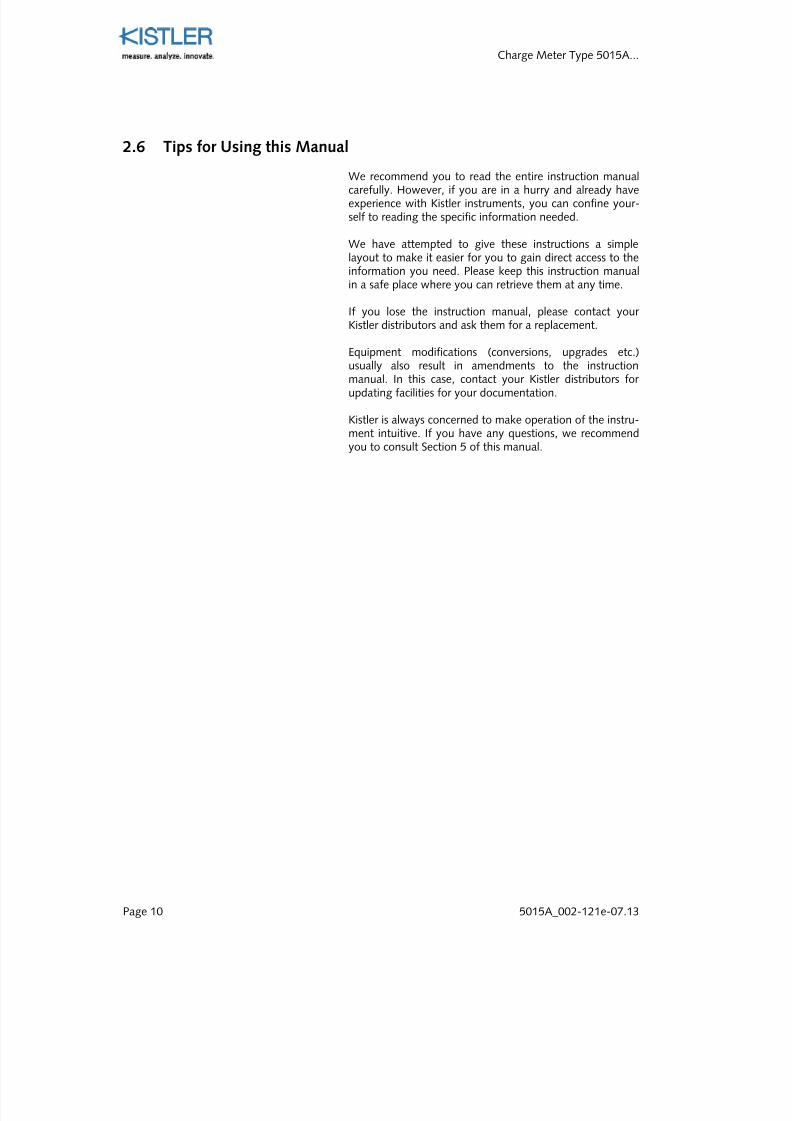
The Charge Meter is CE-compliant. It complies with safety
requirements according to EN 61010-1 as well as require-ments for electromagnetic compatibility according toEN 50081-1/2 (interference emission) and EN 61000-6-1/2(interference immunity).
When the EMC tests were carried out, the signal groundwas connected to the instrument case (protective ground).This connection is provided as standard. The M2,5x5grounding screw at the rear side of the instrument is usedfor this purpose. The user can remove this connection atany time by removing the screw to interrupt ground loops.The common mode voltage must not exceed ±30 V.
A flat connecting tab (6,3 mm) connected to the protectiveground is fitted at bottom right at the back of the case. Inthe event of interference problems from ground loops, alow impedance and low inductance equipotential bondingconductor can be connected at this point.
Generally speaking, in the event of interference problemscaused by ground loops, tests are always needed to findthe best solution (see Section 4.3).
7/27/2019 002-121e-07.13
http://slidepdf.com/reader/full/002-121e-0713 12/99
7/27/2019 002-121e-07.13
http://slidepdf.com/reader/full/002-121e-0713 13/99
7/27/2019 002-121e-07.13
http://slidepdf.com/reader/full/002-121e-0713 14/99
Charge Meter Type 5015A...
Page 12 5015A_002-121e-07.13
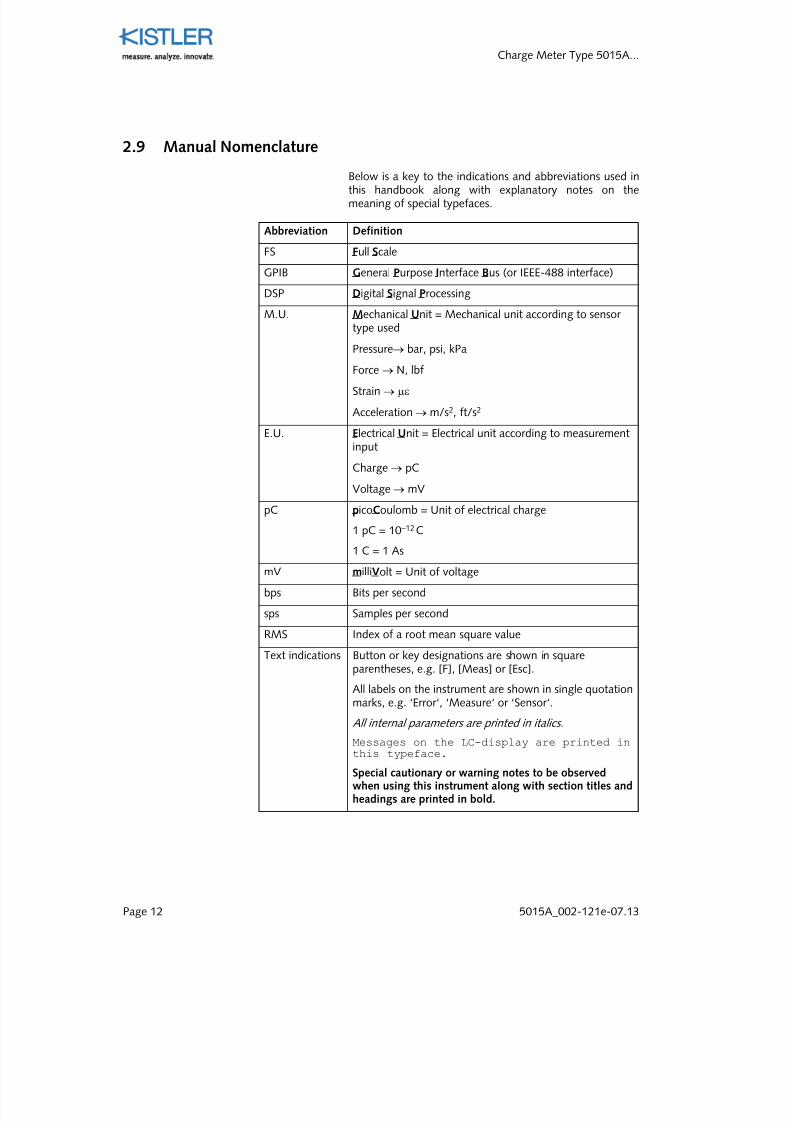
2.9 Manual Nomenclature
Below is a key to the indications and abbreviations used inthis handbook along with explanatory notes on themeaning of special typefaces.
Abbreviation Definition
FS Full Scale
GPIB General Purpose Interface Bus (or IEEE-488 interface)
DSP Digital Signal Processing
M.U. Mechanical Unit = Mechanical unit according to sensor type used
Pressure→ bar, psi, kPa
Force → N, lbf
Strain → µε
Acceleration → m/s2, ft/s2
E.U. Electrical Unit = Electrical unit according to measurementinput
Charge → pC
Voltage → mV
pC picoCoulomb = Unit of electrical charge
1 pC = 10–12 C
1 C = 1 As
mV milliVolt = Unit of voltage
bps Bits per second
sps Samples per second
RMS Index of a root mean square value
Text indications Button or key designations are shown in squareparentheses, e.g. [F], [Meas] or [Esc].
All labels on the instrument are shown in single quotationmarks, e.g. ‘Error‘, ‘Measure‘ or ‘Sensor‘.
All internal parameters are printed in italics.
Messages on the LC-display are printed inthis typeface.
Special cautionary or warning notes to be observedwhen using this instrument along with section titles andheadings are printed in bold.
7/27/2019 002-121e-07.13
http://slidepdf.com/reader/full/002-121e-0713 15/99
Important Guidelines
5015A_002-121e-07.13 Page 13
2.10 Units of Measure
Units of measure are used to assign a value to physicalquantities. A system of units is a set of rules which dictates
how the unit of measure of every quantity used in naturalscience and technology is determined in a consistentmanner. The system of units used worldwide today is theInternational System of Units, in French SystèmeInternational d'Unités (SI). It was officially adopted at the11
thGeneral Conference on Weights and Measures
(CGPM) in 1960. The SI has subsequently released a seriesof standard systems of units, mainly applied in the variousfields of natural science, which has made the, at times,complicated conversions between the different systemssuperfluous.
The International System of Units differentiates between
two classes of units: Base Units and Derived Units.
The Base Units are
Unit Quantity SymbolMeter KilogramSecondAmpereKelvinMoleCandela
LengthMassTimeElectric currentTemperatureAmount of substanceLuminous intensity
mkgsAKmolcd
The derived units are obtained from these base units andthe same algebraic relationships (quantity equations) ashold for the respective quantities in nature. An importantfactor of the SI system of units is coherence, by which ismeant that derived units are defined by the multiplicationand/or division of the base units, without the need for anynumerical factors.
7/27/2019 002-121e-07.13
http://slidepdf.com/reader/full/002-121e-0713 16/99
Charge Meter Type 5015A...
Page 14 5015A_002-121e-07.13
For the measurement of mechanical and electrical quanti-ties the Charge Meter supports the following units:
Quantity Set Unit SI Unit Force 1 N
1 kN1 p1 grf1 kp1 kgf1 lbf
1 N
103 N9,80710–3
N9,80710–3
N9,807 N9,807 N4,448 N
Pressure 1 bar 1 kPa1 MPa1 psi
105 N/m2
103 N/m2 106
N/m2 6,895 N/m2
Acceleration 1 g1 m/s2
1 ft/s2
9,807 m/s2
1 m/s2
0,3048 m/s2 Strain 1 µε 10–6
m/m
Torque 1 N·m1 N·cm1 lbf-in1 lbf-ft
1 N·m0,01 N·m0,1130 N·m1,356 N·m
el. Charge 1 pC 10–12 Asel. Voltage 1 mV 10–3
V
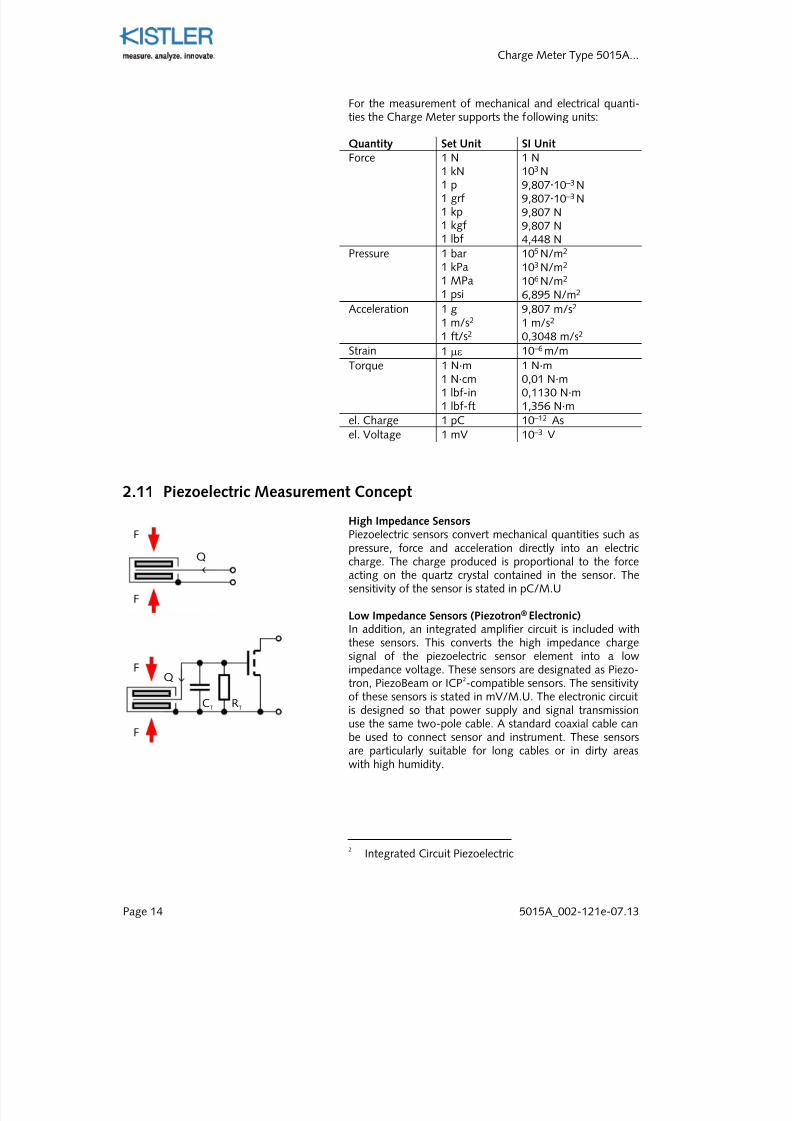
2.11 Piezoelectric Measurement Concept
High Impedance SensorsPiezoelectric sensors convert mechanical quantities such aspressure, force and acceleration directly into an electriccharge. The charge produced is proportional to the forceacting on the quartz crystal contained in the sensor. Thesensitivity of the sensor is stated in pC/M.U
Low Impedance Sensors (Piezotron® Electronic)
In addition, an integrated amplifier circuit is included withthese sensors. This converts the high impedance chargesignal of the piezoelectric sensor element into a low
impedance voltage. These sensors are designated as Piezo-tron, PiezoBeam or ICP2-compatible sensors. The sensitivity
of these sensors is stated in mV/M.U. The electronic circuitis designed so that power supply and signal transmissionuse the same two-pole cable. A standard coaxial cable canbe used to connect sensor and instrument. These sensorsare particularly suitable for long cables or in dirty areaswith high humidity.
2Integrated Circuit Piezoelectric
F
F
F
F
Q
Q
CT RT
7/27/2019 002-121e-07.13
http://slidepdf.com/reader/full/002-121e-0713 17/99
Important Guidelines
5015A_002-121e-07.13 Page 15
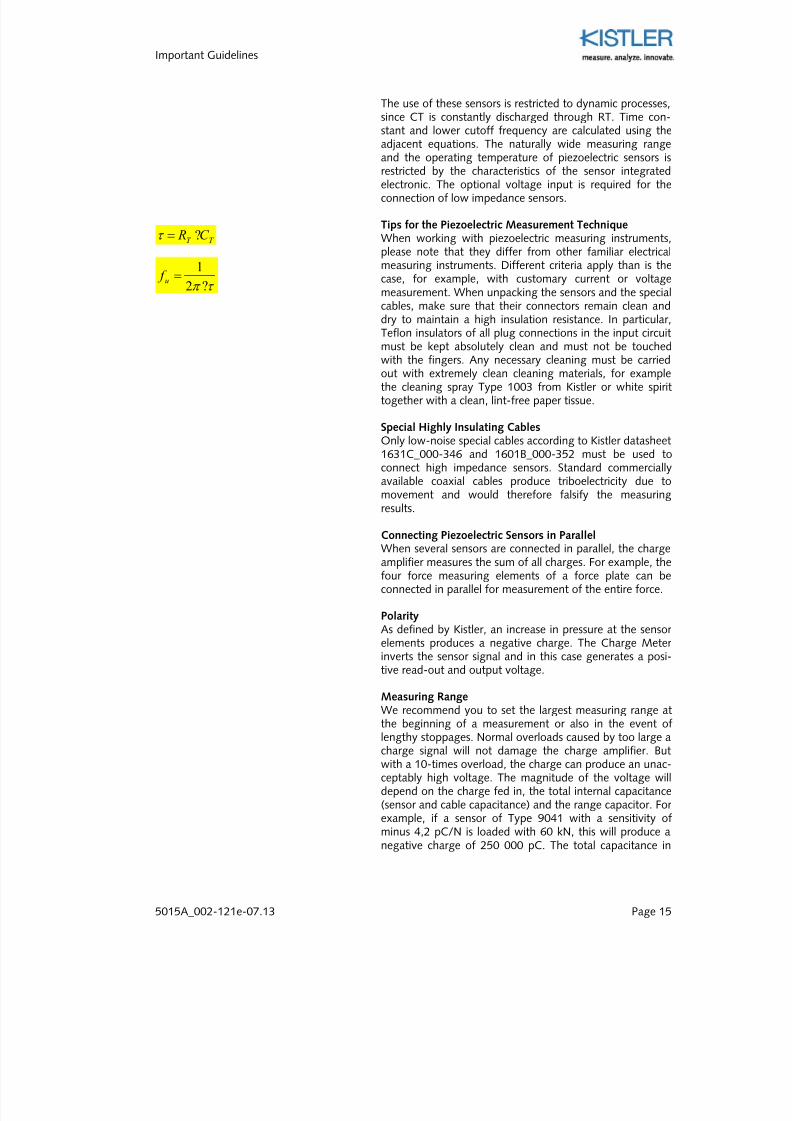
The use of these sensors is restricted to dynamic processes,since CT is constantly discharged through RT. Time con-stant and lower cutoff frequency are calculated using theadjacent equations. The naturally wide measuring rangeand the operating temperature of piezoelectric sensors is
restricted by the characteristics of the sensor integratedelectronic. The optional voltage input is required for theconnection of low impedance sensors.
Tips for the Piezoelectric Measurement Technique When working with piezoelectric measuring instruments,please note that they differ from other familiar electricalmeasuring instruments. Different criteria apply than is thecase, for example, with customary current or voltagemeasurement. When unpacking the sensors and the specialcables, make sure that their connectors remain clean anddry to maintain a high insulation resistance. In particular,
Teflon insulators of all plug connections in the input circuitmust be kept absolutely clean and must not be touchedwith the fingers. Any necessary cleaning must be carriedout with extremely clean cleaning materials, for examplethe cleaning spray Type 1003 from Kistler or white spirittogether with a clean, lint-free paper tissue.
Special Highly Insulating Cables Only low-noise special cables according to Kistler datasheet1631C_000-346 and 1601B_000-352 must be used toconnect high impedance sensors. Standard commerciallyavailable coaxial cables produce triboelectricity due tomovement and would therefore falsify the measuring
results.
Connecting Piezoelectric Sensors in Parallel When several sensors are connected in parallel, the chargeamplifier measures the sum of all charges. For example, thefour force measuring elements of a force plate can beconnected in parallel for measurement of the entire force.
PolarityAs defined by Kistler, an increase in pressure at the sensor elements produces a negative charge. The Charge Meter inverts the sensor signal and in this case generates a posi-
tive read-out and output voltage.
Measuring RangeWe recommend you to set the largest measuring range atthe beginning of a measurement or also in the event oflengthy stoppages. Normal overloads caused by too large acharge signal will not damage the charge amplifier. Butwith a 10-times overload, the charge can produce an unac-ceptably high voltage. The magnitude of the voltage willdepend on the charge fed in, the total internal capacitance(sensor and cable capacitance) and the range capacitor. For example, if a sensor of Type 9041 with a sensitivity ofminus 4,2 pC/N is loaded with 60 kN, this will produce a
negative charge of 250 000 pC. The total capacitance in
T T C R ?=τ
τ π ?=
2
1u f

7/27/2019 002-121e-07.13
http://slidepdf.com/reader/full/002-121e-0713 18/99
7/27/2019 002-121e-07.13
http://slidepdf.com/reader/full/002-121e-0713 19/99
Important Guidelines
5015A_002-121e-07.13 Page 17
0 100 200 300
0
1
1.5
0.5
0.5x(t)
t
280 290 300
0
1
1.5
0.5
0.5x(t)
t0 10 20
0
1
1.5
0.5
0.5x(t)
t
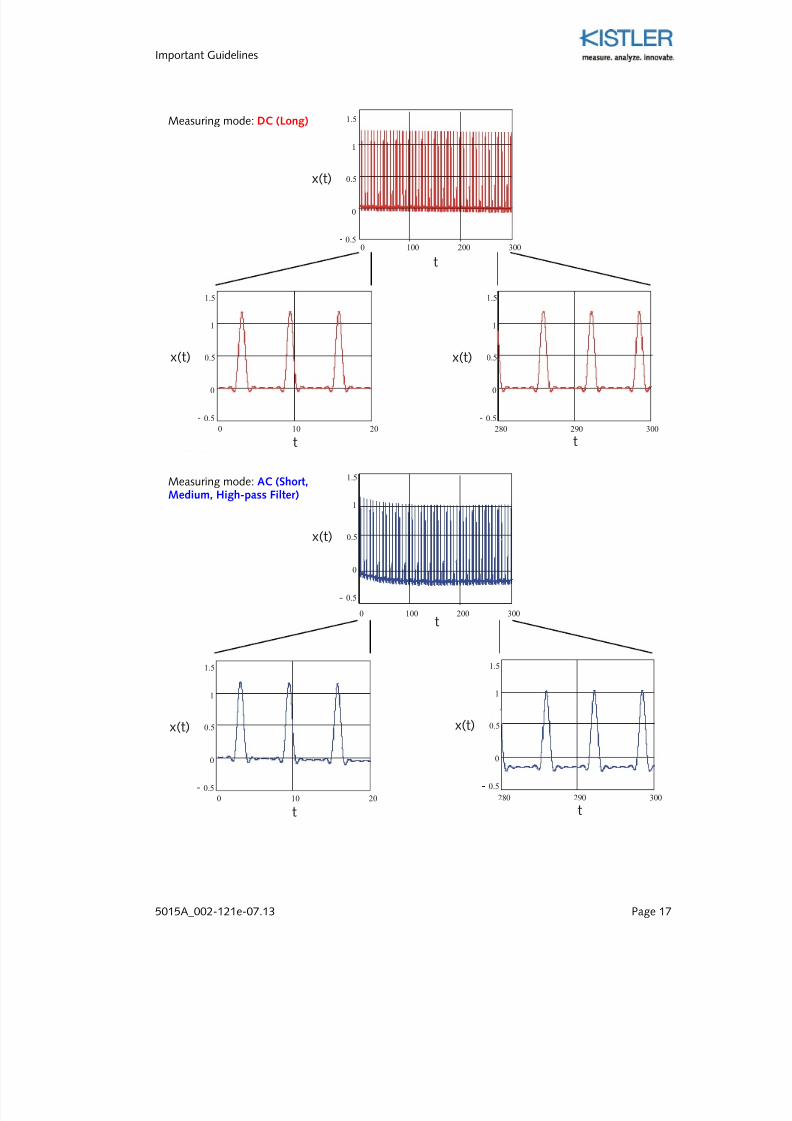
Measuring mode: AC (Short,Medium, High-pass Filter)
0 10 20
0
1
1.5
0.5
0.5x(t)
t
0 100 200 300
t
0
1
1.5
0.5
0.5x(t)
280 290 300
0
1
1.5
0.5
0.5x(t)
t
Measuring mode: DC (Long)
7/27/2019 002-121e-07.13
http://slidepdf.com/reader/full/002-121e-0713 20/99
7/27/2019 002-121e-07.13
http://slidepdf.com/reader/full/002-121e-0713 21/99
Functional Description
5015A_002-121e-07.13 Page 19
3. Functional Description
The Charge Meter is operated from the power line andreceives the charge from the piezoelectric sensor andconverts it into a proportional voltage. The electronicsystem provides clear and simple operating facilities for theinstrument enabling sensitivity, measuring range, filter characteristics etc. to be continuously adjusted betweenwide limits. The instrument can be remote controlled andthe measurands read off via interfaces such as RS-232Cand IEEE-488 (option).
The great advantage of the charge amplifier principle isthat it allows quasi-static measurements as well. Staticmeasurement is limited on the one hand by the finite time
constant in the negative feedback circuit, and on the other hand by drift effects (e.g. input current) at the chargeamplifier. As a result of introducing the latest technology,we have succeeded in keeping these interference levelsvery low. The digital signal processing technique has madeit possible to eliminate the measure-jump
3almost entirely.
3Previously called Reset-Operate-Jump
7/27/2019 002-121e-07.13
http://slidepdf.com/reader/full/002-121e-0713 22/99
7/27/2019 002-121e-07.13
http://slidepdf.com/reader/full/002-121e-0713 23/99
Functional Description
5015A_002-121e-07.13 Page 21
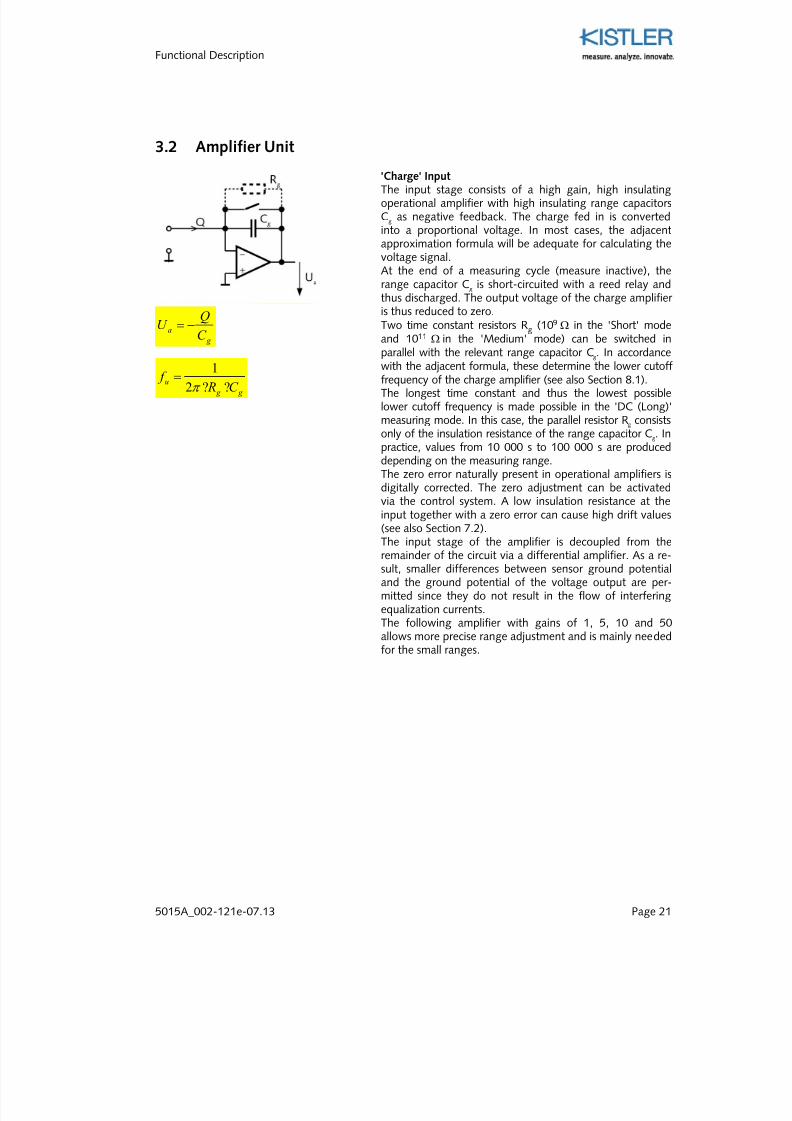
3.2 Amplifier Unit
'Charge' Input The input stage consists of a high gain, high insulatingoperational amplifier with high insulating range capacitorsCg as negative feedback. The charge fed in is convertedinto a proportional voltage. In most cases, the adjacentapproximation formula will be adequate for calculating thevoltage signal.At the end of a measuring cycle (measure inactive), therange capacitor Cg is short-circuited with a reed relay andthus discharged. The output voltage of the charge amplifier is thus reduced to zero.Two time constant resistors Rg (109 Ω in the 'Short' mode
and 1011 Ω in the 'Medium' mode) can be switched inparallel with the relevant range capacitor Cg. In accordancewith the adjacent formula, these determine the lower cutofffrequency of the charge amplifier (see also Section 8.1).The longest time constant and thus the lowest possiblelower cutoff frequency is made possible in the 'DC (Long)'measuring mode. In this case, the parallel resistor Rg consistsonly of the insulation resistance of the range capacitor Cg. Inpractice, values from 10 000 s to 100 000 s are produceddepending on the measuring range.The zero error naturally present in operational amplifiers isdigitally corrected. The zero adjustment can be activated
via the control system. A low insulation resistance at theinput together with a zero error can cause high drift values(see also Section 7.2).The input stage of the amplifier is decoupled from theremainder of the circuit via a differential amplifier. As a re-sult, smaller differences between sensor ground potentialand the ground potential of the voltage output are per-mitted since they do not result in the flow of interferingequalization currents.The following amplifier with gains of 1, 5, 10 and 50allows more precise range adjustment and is mainly neededfor the small ranges.
g
a
C
QU −=
g g
uC R
f ??
=π 2
1
7/27/2019 002-121e-07.13
http://slidepdf.com/reader/full/002-121e-0713 24/99
Charge Meter Type 5015A...
Page 22 5015A_002-121e-07.13
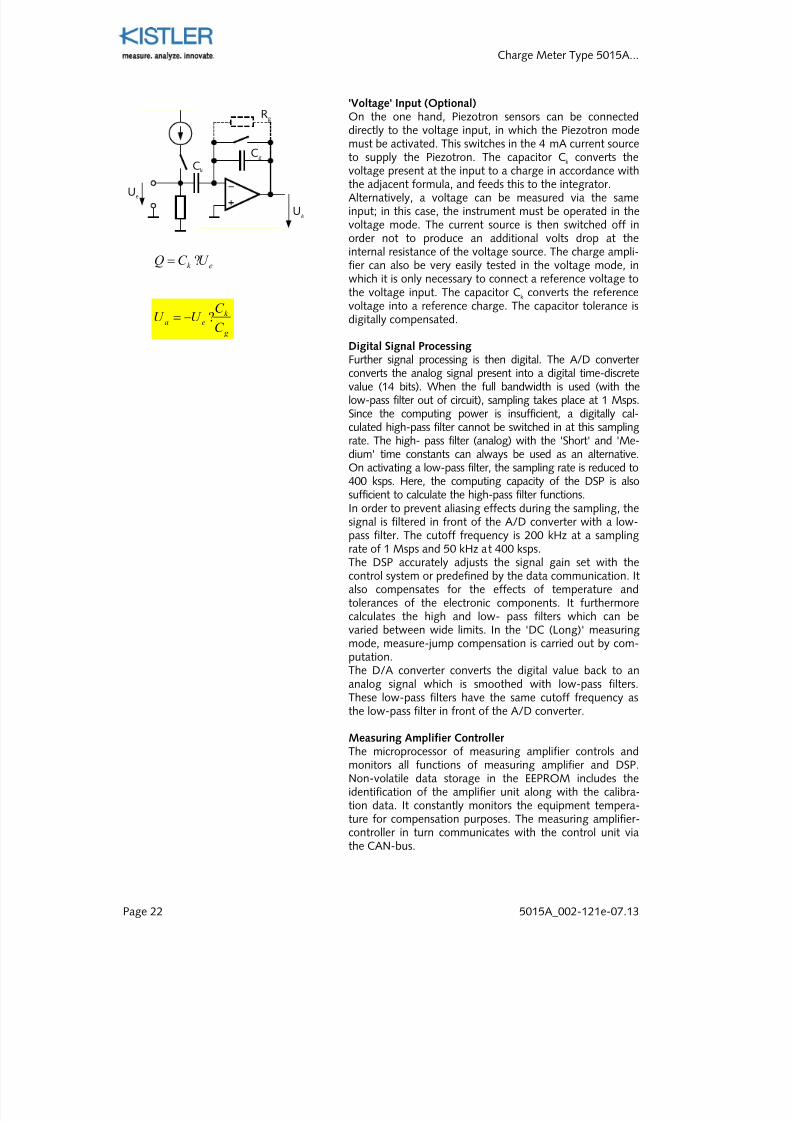
'Voltage' Input (Optional)On the one hand, Piezotron sensors can be connecteddirectly to the voltage input, in which the Piezotron modemust be activated. This switches in the 4 mA current sourceto supply the Piezotron. The capacitor Ck converts the
voltage present at the input to a charge in accordance withthe adjacent formula, and feeds this to the integrator.Alternatively, a voltage can be measured via the sameinput; in this case, the instrument must be operated in thevoltage mode. The current source is then switched off inorder not to produce an additional volts drop at theinternal resistance of the voltage source. The charge ampli-fier can also be very easily tested in the voltage mode, inwhich it is only necessary to connect a reference voltage tothe voltage input. The capacitor Ck converts the referencevoltage into a reference charge. The capacitor tolerance isdigitally compensated.
Digital Signal ProcessingFurther signal processing is then digital. The A/D converter converts the analog signal present into a digital time-discretevalue (14 bits). When the full bandwidth is used (with thelow-pass filter out of circuit), sampling takes place at 1 Msps.Since the computing power is insufficient, a digitally cal-culated high-pass filter cannot be switched in at this samplingrate. The high- pass filter (analog) with the 'Short' and 'Me-dium' time constants can always be used as an alternative.On activating a low-pass filter, the sampling rate is reduced to400 ksps. Here, the computing capacity of the DSP is alsosufficient to calculate the high-pass filter functions.
In order to prevent aliasing effects during the sampling, thesignal is filtered in front of the A/D converter with a low-pass filter. The cutoff frequency is 200 kHz at a samplingrate of 1 Msps and 50 kHz at 400 ksps.The DSP accurately adjusts the signal gain set with thecontrol system or predefined by the data communication. Italso compensates for the effects of temperature andtolerances of the electronic components. It furthermorecalculates the high and low- pass filters which can bevaried between wide limits. In the 'DC (Long)' measuringmode, measure-jump compensation is carried out by com-putation.
The D/A converter converts the digital value back to ananalog signal which is smoothed with low-pass filters.These low-pass filters have the same cutoff frequency asthe low-pass filter in front of the A/D converter.
Measuring Amplifier Controller The microprocessor of measuring amplifier controls andmonitors all functions of measuring amplifier and DSP.Non-volatile data storage in the EEPROM includes theidentification of the amplifier unit along with the calibra-tion data. It constantly monitors the equipment tempera-ture for compensation purposes. The measuring amplifier-controller in turn communicates with the control unit via
the CAN-bus.
ek U C Q ?=
+−
Cg
Rg
Ck
Ua
Ue
g
k eaC
C U U ?−=
7/27/2019 002-121e-07.13
http://slidepdf.com/reader/full/002-121e-0713 25/99
Functional Description
5015A_002-121e-07.13 Page 23
3.3 Control Unit
The microprocessor of the control unit controls the LCDand keypad, the amplifier unit, the communication module
and the serial interface. The program code is stored in theflash memory and if necessary can be downloaded from aPC. The parameters set in the instrument are stored in thenon-volatile EEPROM.
Keypad and LCDThe control unit consists of the graphical LC display withLCD-controller, the keypad and the control buttontogether with the LED status displays.
CAN-BusThe internal data communication between measuringamplifier and control assembly as well as the optional com-
munication module (IEEE-488) is provided via the CAN-bus.
RS-232C InterfaceThe serial interface enables all settings and queries to bemade in the instrument. The baud rate is adjustable. Anormal commercial null-modem cable can be used for theconnection between PC and Charge Meter.The interface is electrically isolated.
IEEE-488 Interface (Optional)The same settings and queries can be undertaken via thisstandardized interface as with the RS-232C interface. Thisinterface is controlled from the operational controller viathe CAN-bus.
The interface is electrically isolated.
3.4 Power Supply Unit
The nominal supply voltage is 230 V~ or 115 V~ respec-tively (selectable). A power line filter at the input is used tosuppress power line interference. Low voltages are pro-duced by the power line transformer; two supply voltages5 V and ±15 V are thereby generated which are electricallyisolated from one another.
7/27/2019 002-121e-07.13
http://slidepdf.com/reader/full/002-121e-0713 26/99
Charge Meter Type 5015A...
Page 24 5015A_002-121e-07.13
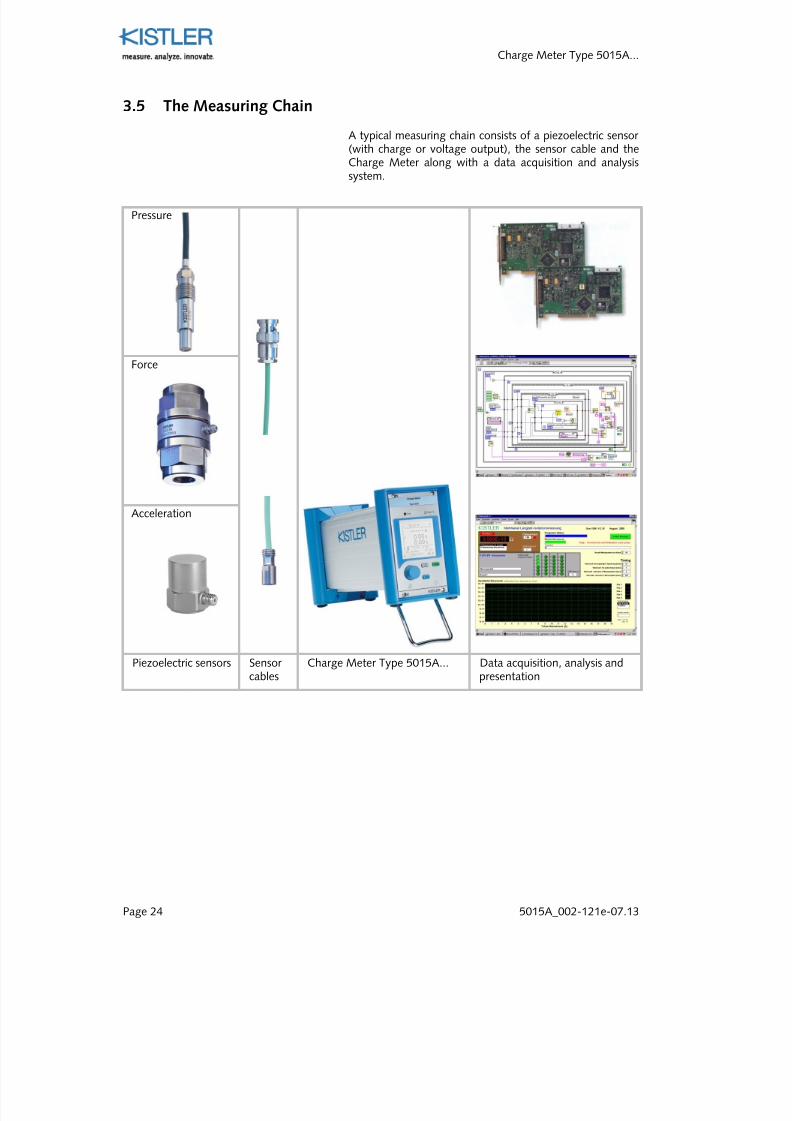
3.5 The Measuring Chain
A typical measuring chain consists of a piezoelectric sensor (with charge or voltage output), the sensor cable and the
Charge Meter along with a data acquisition and analysissystem.
Piezoelectric sensors Sensor
cables
Charge Meter Type 5015A... Data acquisition, analysis and
presentation
Acceleration
Force
Pressure
7/27/2019 002-121e-07.13
http://slidepdf.com/reader/full/002-121e-0713 27/99
Assembly, Installation and Operation
5015A_002-121e-07.13 Page 25
4. Assembly, Installation and Operation
The instrument must be operated only under the specifiedoperating conditions (see Section 6). It must be protectedagainst excessive dust as well as mechanical stress (shock,vibration). High atmospheric humidity, which can lead tocondensation as a result of changes in temperature, mustbe avoided.
Protect the inputs and outputs of the instrument againstcontamination and do not touch the insulation with your fingers. When a connection is not being used, fit the coversprovided for this purpose.
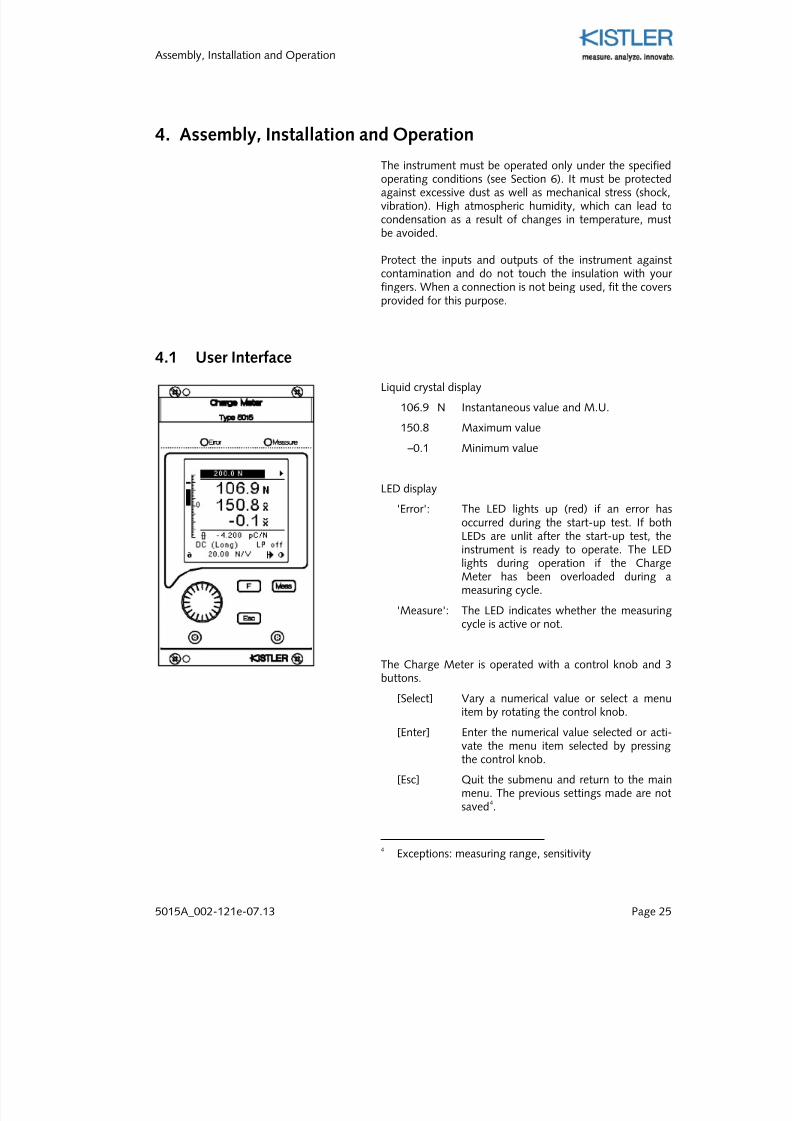
4.1 User Interface
Liquid crystal display
106.9 N Instantaneous value and M.U.
150.8 Maximum value
–0.1 Minimum value
LED display
'Error': The LED lights up (red) if an error hasoccurred during the start-up test. If bothLEDs are unlit after the start-up test, theinstrument is ready to operate. The LEDlights during operation if the ChargeMeter has been overloaded during ameasuring cycle.
'Measure': The LED indicates whether the measuringcycle is active or not.
The Charge Meter is operated with a control knob and 3
buttons.
[Select] Vary a numerical value or select a menuitem by rotating the control knob.
[Enter] Enter the numerical value selected or acti-vate the menu item selected by pressingthe control knob.
[Esc] Quit the submenu and return to the mainmenu. The previous settings made are notsaved
4.
4Exceptions: measuring range, sensitivity
7/27/2019 002-121e-07.13
http://slidepdf.com/reader/full/002-121e-0713 28/99
Charge Meter Type 5015A...
Page 26 5015A_002-121e-07.13
The Charge Meter is controlled with the following twobuttons.
[F] Definable function button (see Section 5.6).
[Meas] This button is used to manually start and stop
the measuring cycle (see also Section 5.7)
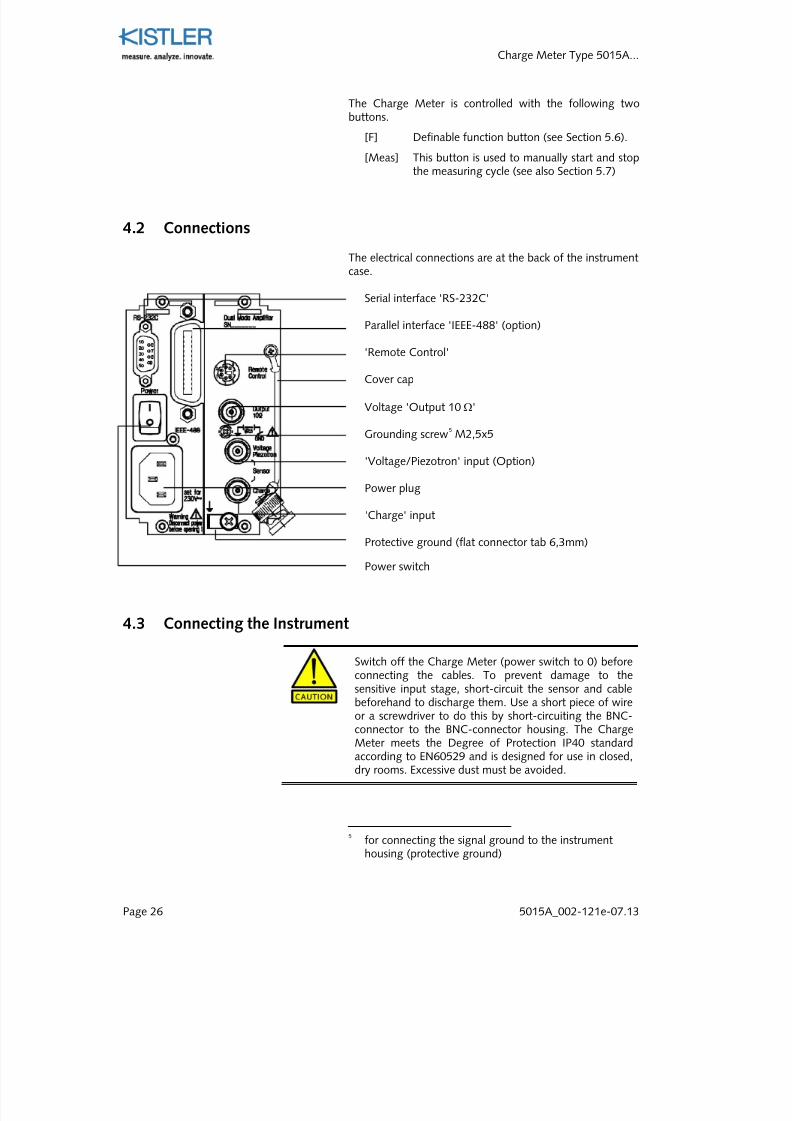
4.2 Connections
The electrical connections are at the back of the instrumentcase.
Serial interface 'RS-232C'
Parallel interface 'IEEE-488' (option)
'Remote Control'
Cover cap
Voltage 'Output 10 Ω'
Grounding screw5M2,5x5
'Voltage/Piezotron' input (Option)
Power plug
'Charge' input
Protective ground (flat connector tab 6,3mm)
Power switch
4.3 Connecting the Instrument
Switch off the Charge Meter (power switch to 0) before
connecting the cables. To prevent damage to thesensitive input stage, short-circuit the sensor and cablebeforehand to discharge them. Use a short piece of wireor a screwdriver to do this by short-circuiting the BNC-connector to the BNC-connector housing. The ChargeMeter meets the Degree of Protection IP40 standardaccording to EN60529 and is designed for use in closed,dry rooms. Excessive dust must be avoided.
5
for connecting the signal ground to the instrumenthousing (protective ground)
7/27/2019 002-121e-07.13
http://slidepdf.com/reader/full/002-121e-0713 29/99
Assembly, Installation and Operation
5015A_002-121e-07.13 Page 27
+−
+−
S
M2,5
DSP
Screw
Correct functioning of the Charge Meter requiresextremely high insulation values at the charge input.Condensing humidity must be avoided. But if this doesoccur on an isolated occasion, it is advisable to leave theinstrument switched on for several hours to ensure that it
dries out. Comply with the specified ambient temperature(see Section 6.10). If the instrument is in frequent use, werecommend you to leave it switched on continuously. Thiswill largely avoid condensating humidity and increasemeasuring stability.
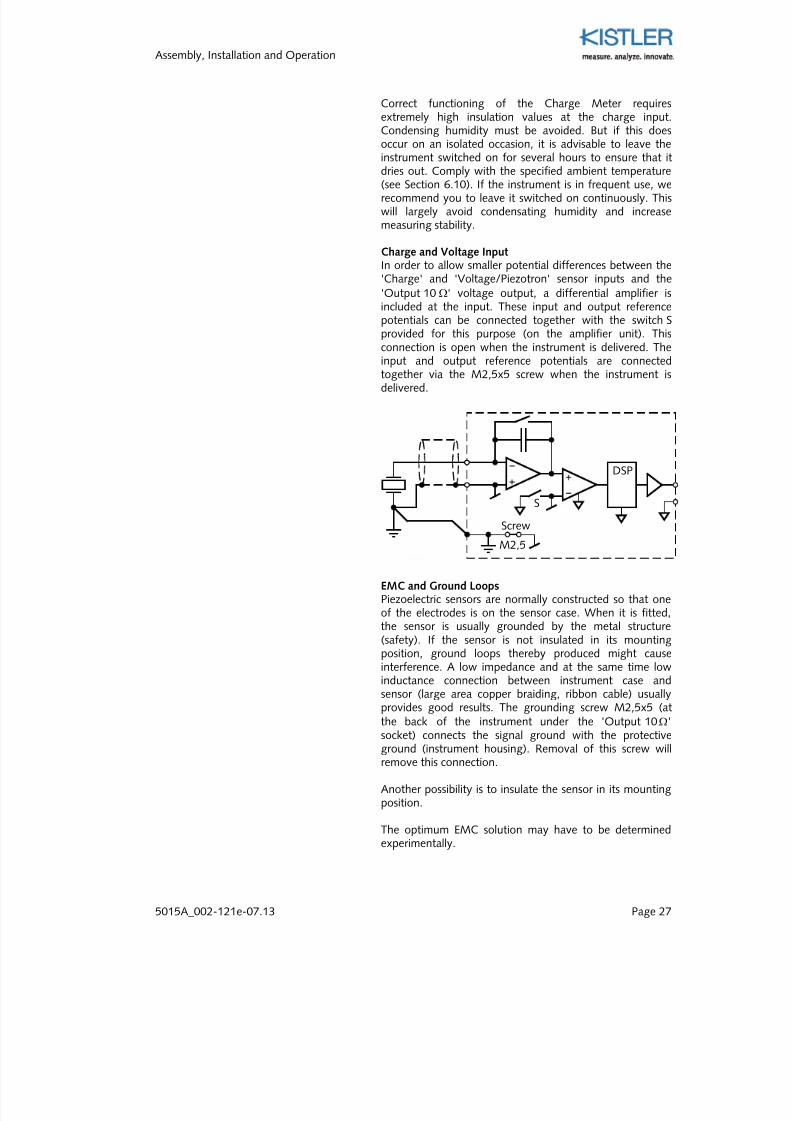
Charge and Voltage Input In order to allow smaller potential differences between the'Charge' and 'Voltage/Piezotron' sensor inputs and the'Output 10 Ω' voltage output, a differential amplifier isincluded at the input. These input and output referencepotentials can be connected together with the switch S
provided for this purpose (on the amplifier unit). Thisconnection is open when the instrument is delivered. Theinput and output reference potentials are connectedtogether via the M2,5x5 screw when the instrument isdelivered.
EMC and Ground Loops Piezoelectric sensors are normally constructed so that oneof the electrodes is on the sensor case. When it is fitted,the sensor is usually grounded by the metal structure(safety). If the sensor is not insulated in its mountingposition, ground loops thereby produced might causeinterference. A low impedance and at the same time lowinductance connection between instrument case andsensor (large area copper braiding, ribbon cable) usuallyprovides good results. The grounding screw M2,5x5 (atthe back of the instrument under the 'Output 10 Ω'socket) connects the signal ground with the protectiveground (instrument housing). Removal of this screw willremove this connection.
Another possibility is to insulate the sensor in its mountingposition.
The optimum EMC solution may have to be determined
experimentally.
7/27/2019 002-121e-07.13
http://slidepdf.com/reader/full/002-121e-0713 30/99
Charge Meter Type 5015A...
Page 28 5015A_002-121e-07.13
'Remote Control' Input The plug for the 'Remote Control' input is included in thescope of delivery and must be fitted before it can beconnected (see Section 6.7).
Voltage Output Normal coaxial cables can be used for the connection. Theoutput is proof against short-circuit.
Serial Interface RS-232CSee Sections 2.8, 6.8.1 and 8.3 for Interface cable.
IEEE-488 InterfaceConnection of standard interface cable.
Power Supply ConnectionBefore connecting the instrument to the power supply,check that the instrument is set to the correct supply voltageand comply with the safety regulations in Section 2.1.
When all necessary cables and equipment have beenconnected, the instrument is ready to be switched on.
7/27/2019 002-121e-07.13
http://slidepdf.com/reader/full/002-121e-0713 31/99
Assembly, Installation and Operation
5015A_002-121e-07.13 Page 29
4.4 Instrument Operation
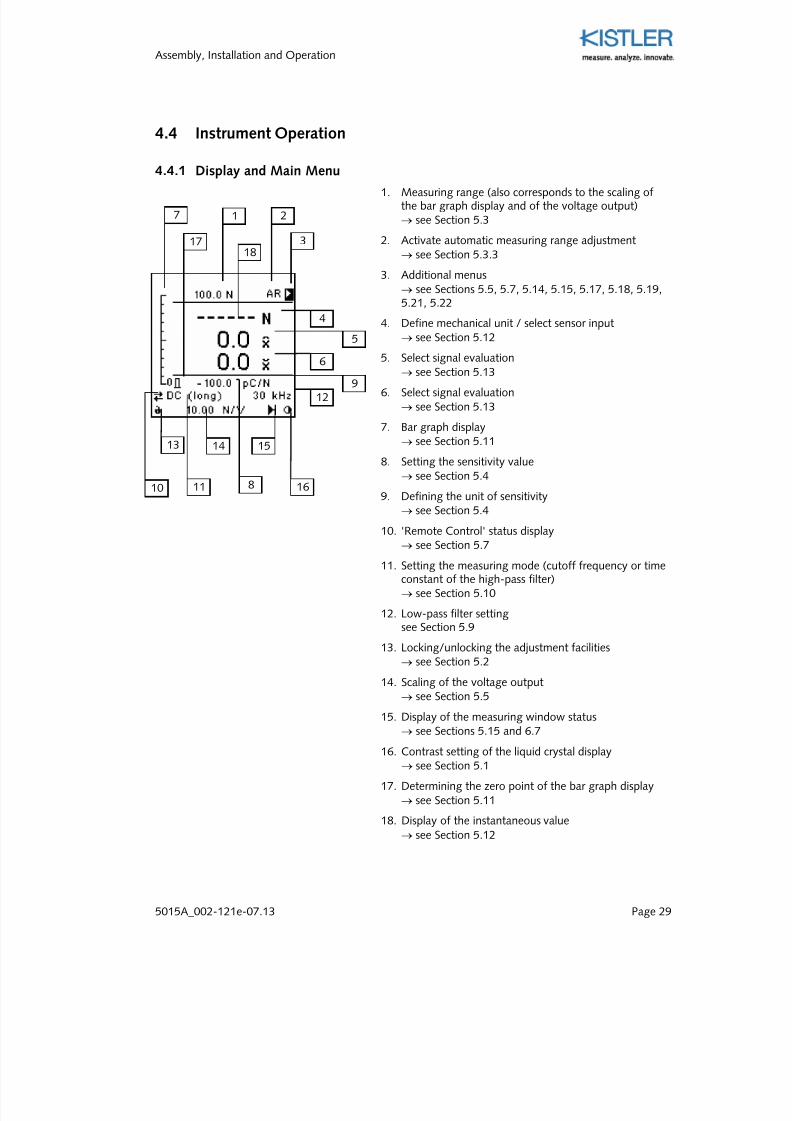
4.4.1 Display and Main Menu1. Measuring range (also corresponds to the scaling of
the bar graph display and of the voltage output)→ see Section 5.3
2. Activate automatic measuring range adjustment→ see Section 5.3.3
3. Additional menus→ see Sections 5.5, 5.7, 5.14, 5.15, 5.17, 5.18, 5.19,5.21, 5.22
4. Define mechanical unit / select sensor input
→ see Section 5.12
5. Select signal evaluation→ see Section 5.13
6. Select signal evaluation→ see Section 5.13
7. Bar graph display→ see Section 5.11
8. Setting the sensitivity value→ see Section 5.4
9. Defining the unit of sensitivity→ see Section 5.4
10. 'Remote Control' status display→ see Section 5.7
11. Setting the measuring mode (cutoff frequency or timeconstant of the high-pass filter)→ see Section 5.10
12. Low-pass filter settingsee Section 5.9
13. Locking/unlocking the adjustment facilities→ see Section 5.2
14. Scaling of the voltage output→ see Section 5.5
15. Display of the measuring window status→ see Sections 5.15 and 6.7
16. Contrast setting of the liquid crystal display→ see Section 5.1
17. Determining the zero point of the bar graph display→ see Section 5.11
18. Display of the instantaneous value→ see Section 5.12
1 2
3
7
4
5
6
9
10
13 14
11 8
15
16
12
1718
7/27/2019 002-121e-07.13
http://slidepdf.com/reader/full/002-121e-0713 32/99
7/27/2019 002-121e-07.13
http://slidepdf.com/reader/full/002-121e-0713 33/99
Assembly, Installation and Operation
5015A_002-121e-07.13 Page 31
4.5 Step by Step Measuring Guidance
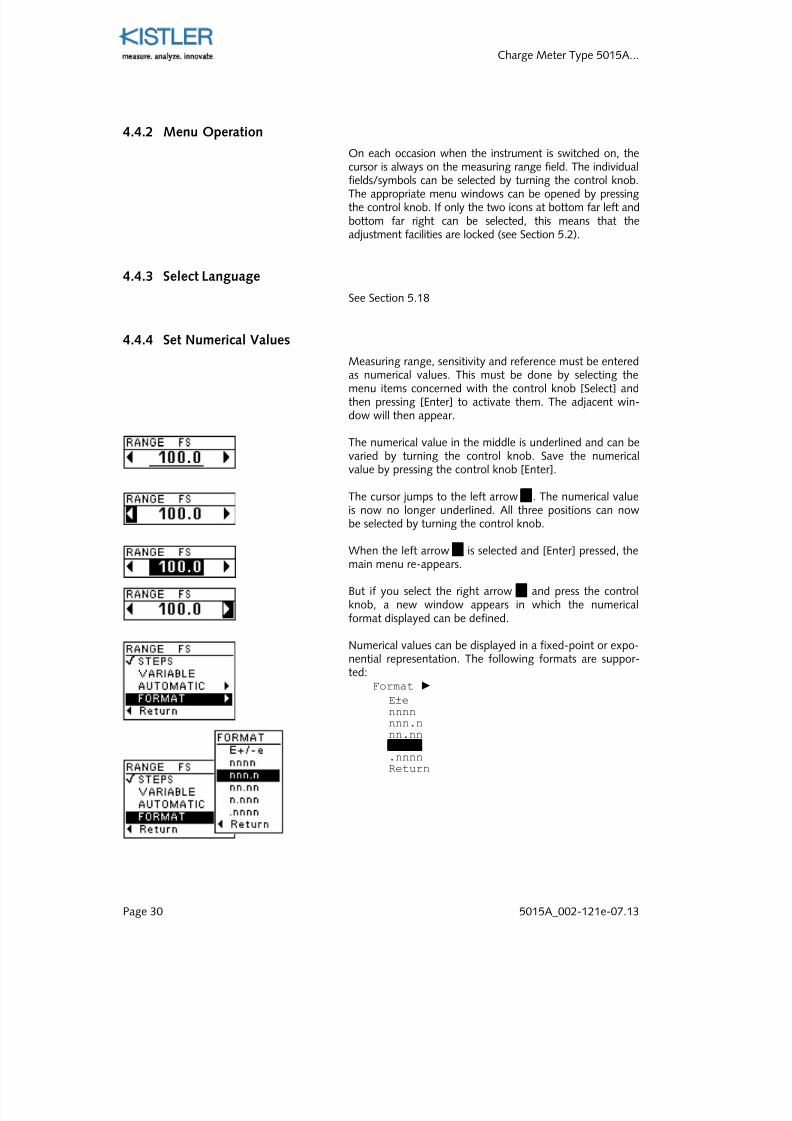
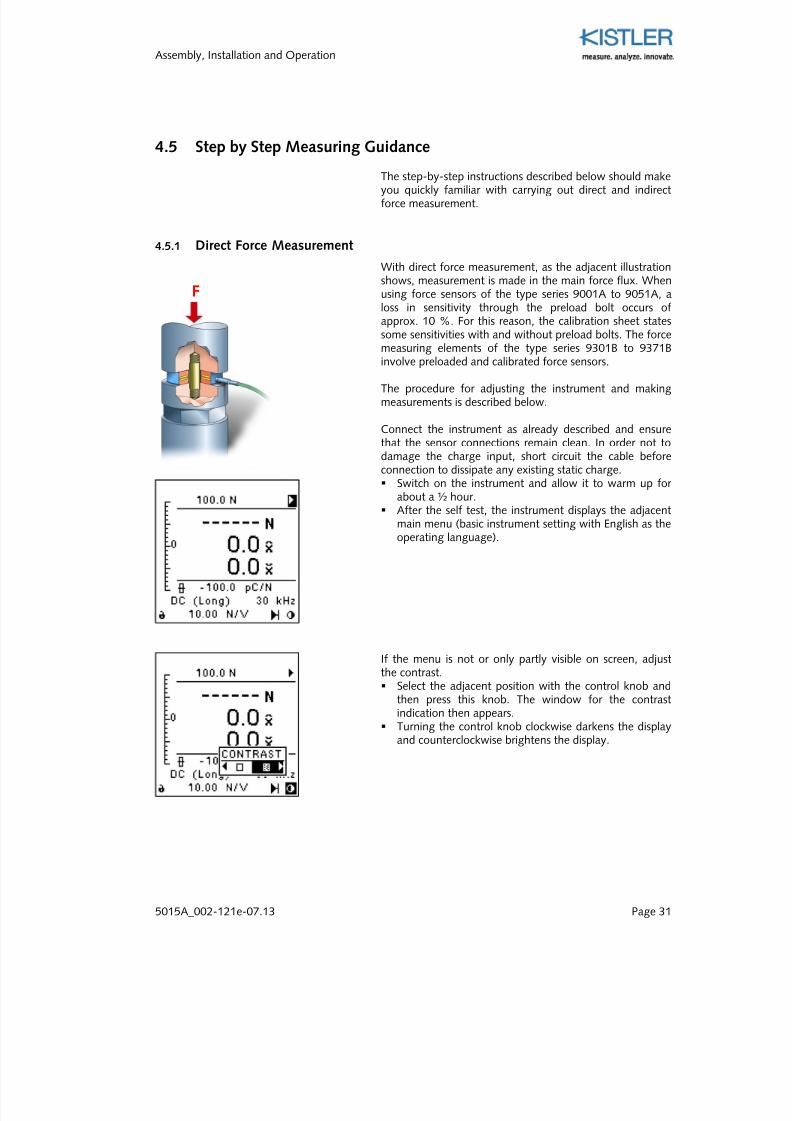
The step-by-step instructions described below should makeyou quickly familiar with carrying out direct and indirectforce measurement.
4.5.1 Direct Force Measurement
With direct force measurement, as the adjacent illustrationshows, measurement is made in the main force flux. Whenusing force sensors of the type series 9001A to 9051A, aloss in sensitivity through the preload bolt occurs ofapprox. 10 %. For this reason, the calibration sheet states
some sensitivities with and without preload bolts. The forcemeasuring elements of the type series 9301B to 9371Binvolve preloaded and calibrated force sensors.
The procedure for adjusting the instrument and makingmeasurements is described below.
Connect the instrument as already described and ensurethat the sensor connections remain clean. In order not todamage the charge input, short circuit the cable beforeconnection to dissipate any existing static charge. Switch on the instrument and allow it to warm up for
about a ½ hour.
After the self test, the instrument displays the adjacentmain menu (basic instrument setting with English as theoperating language).
If the menu is not or only partly visible on screen, adjust
the contrast. Select the adjacent position with the control knob and
then press this knob. The window for the contrastindication then appears.
Turning the control knob clockwise darkens the displayand counterclockwise brightens the display.
F
7/27/2019 002-121e-07.13
http://slidepdf.com/reader/full/002-121e-0713 34/99
Charge Meter Type 5015A...
Page 32 5015A_002-121e-07.13
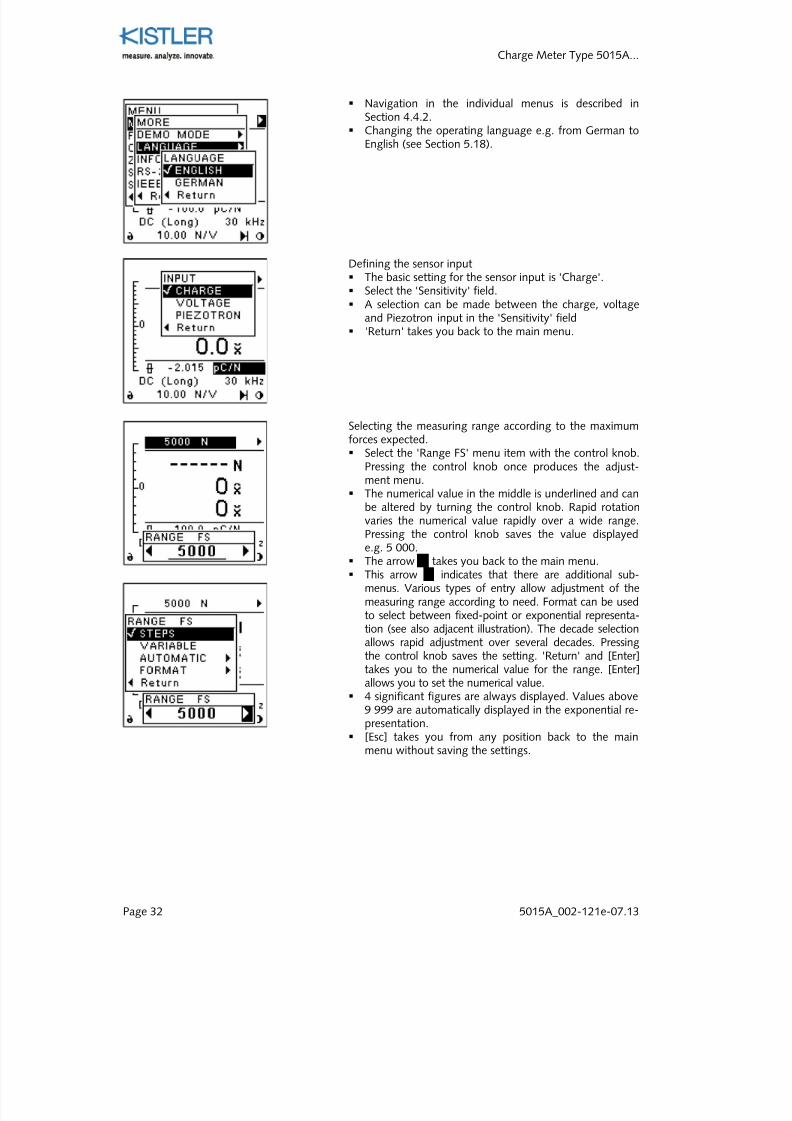
Navigation in the individual menus is described inSection 4.4.2.
Changing the operating language e.g. from German toEnglish (see Section 5.18).
Defining the sensor input The basic setting for the sensor input is 'Charge'. Select the 'Sensitivity' field. A selection can be made between the charge, voltage
and Piezotron input in the 'Sensitivity' field
'Return' takes you back to the main menu.
Selecting the measuring range according to the maximumforces expected. Select the 'Range FS' menu item with the control knob.
Pressing the control knob once produces the adjust-ment menu.
The numerical value in the middle is underlined and can
be altered by turning the control knob. Rapid rotationvaries the numerical value rapidly over a wide range.Pressing the control knob saves the value displayede.g. 5 000.
The arrow takes you back to the main menu. This arrow indicates that there are additional sub-
menus. Various types of entry allow adjustment of themeasuring range according to need. Format can be usedto select between fixed-point or exponential representa-tion (see also adjacent illustration). The decade selectionallows rapid adjustment over several decades. Pressingthe control knob saves the setting. 'Return' and [Enter]
takes you to the numerical value for the range. [Enter]allows you to set the numerical value. 4 significant figures are always displayed. Values above
9 999 are automatically displayed in the exponential re-presentation.
[Esc] takes you from any position back to the mainmenu without saving the settings.
7/27/2019 002-121e-07.13
http://slidepdf.com/reader/full/002-121e-0713 35/99
7/27/2019 002-121e-07.13
http://slidepdf.com/reader/full/002-121e-0713 36/99
Charge Meter Type 5015A...
Page 34 5015A_002-121e-07.13
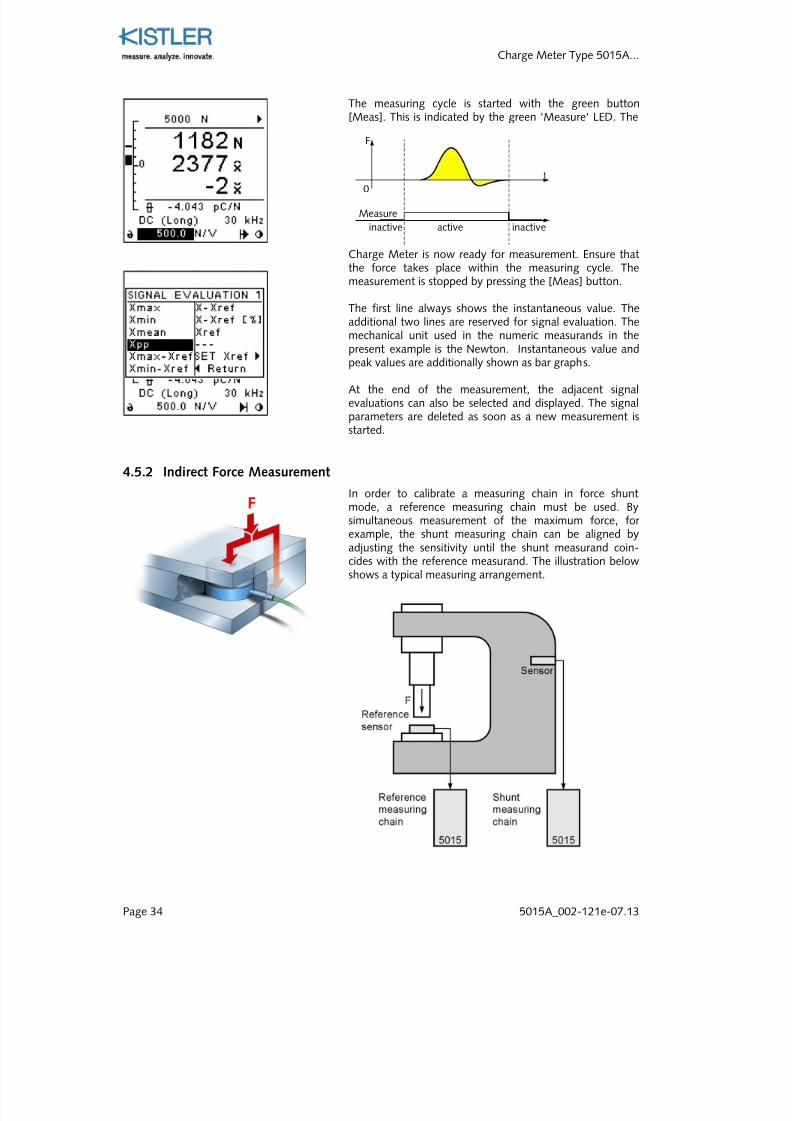
The measuring cycle is started with the green button[Meas]. This is indicated by the green 'Measure' LED. The
Charge Meter is now ready for measurement. Ensure thatthe force takes place within the measuring cycle. Themeasurement is stopped by pressing the [Meas] button.
The first line always shows the instantaneous value. Theadditional two lines are reserved for signal evaluation. The
mechanical unit used in the numeric measurands in thepresent example is the Newton. Instantaneous value andpeak values are additionally shown as bar graphs.
At the end of the measurement, the adjacent signalevaluations can also be selected and displayed. The signalparameters are deleted as soon as a new measurement isstarted.
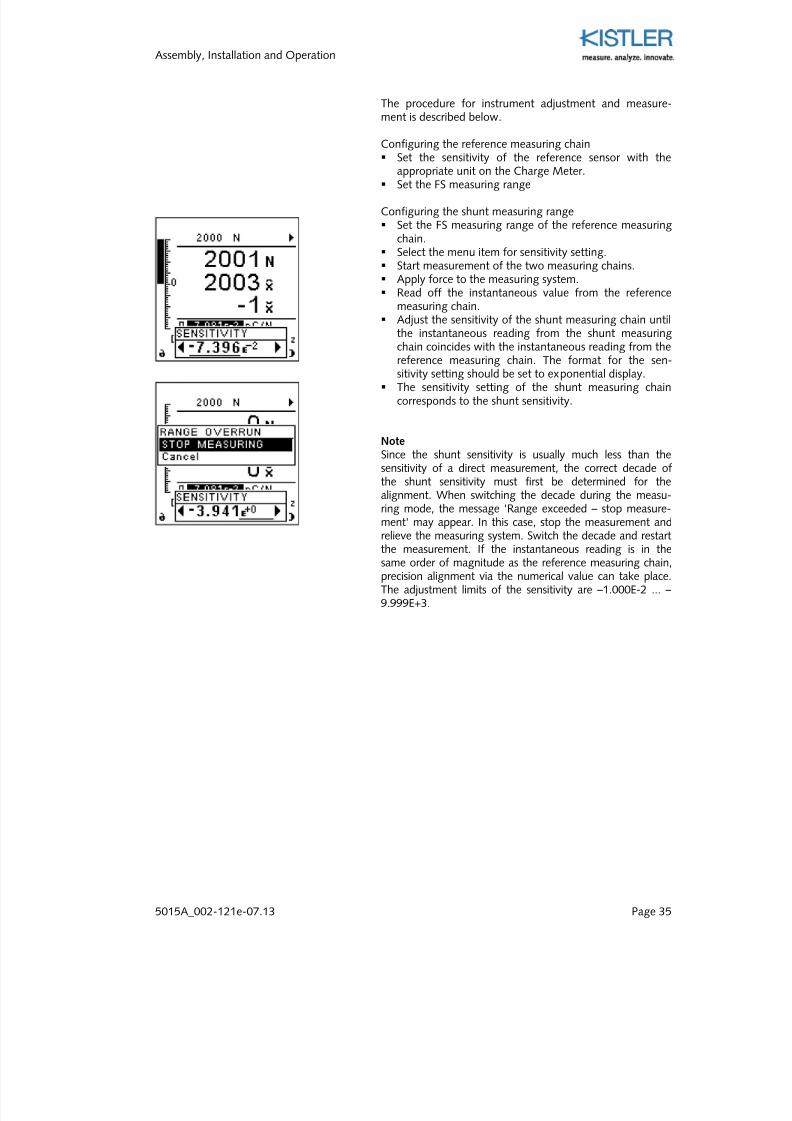
4.5.2 Indirect Force Measurement
In order to calibrate a measuring chain in force shunt
mode, a reference measuring chain must be used. Bysimultaneous measurement of the maximum force, for example, the shunt measuring chain can be aligned byadjusting the sensitivity until the shunt measurand coin-cides with the reference measurand. The illustration belowshows a typical measuring arrangement.
t
F
active
Measure
0
inactive inactive
F
7/27/2019 002-121e-07.13
http://slidepdf.com/reader/full/002-121e-0713 37/99
Assembly, Installation and Operation
5015A_002-121e-07.13 Page 35
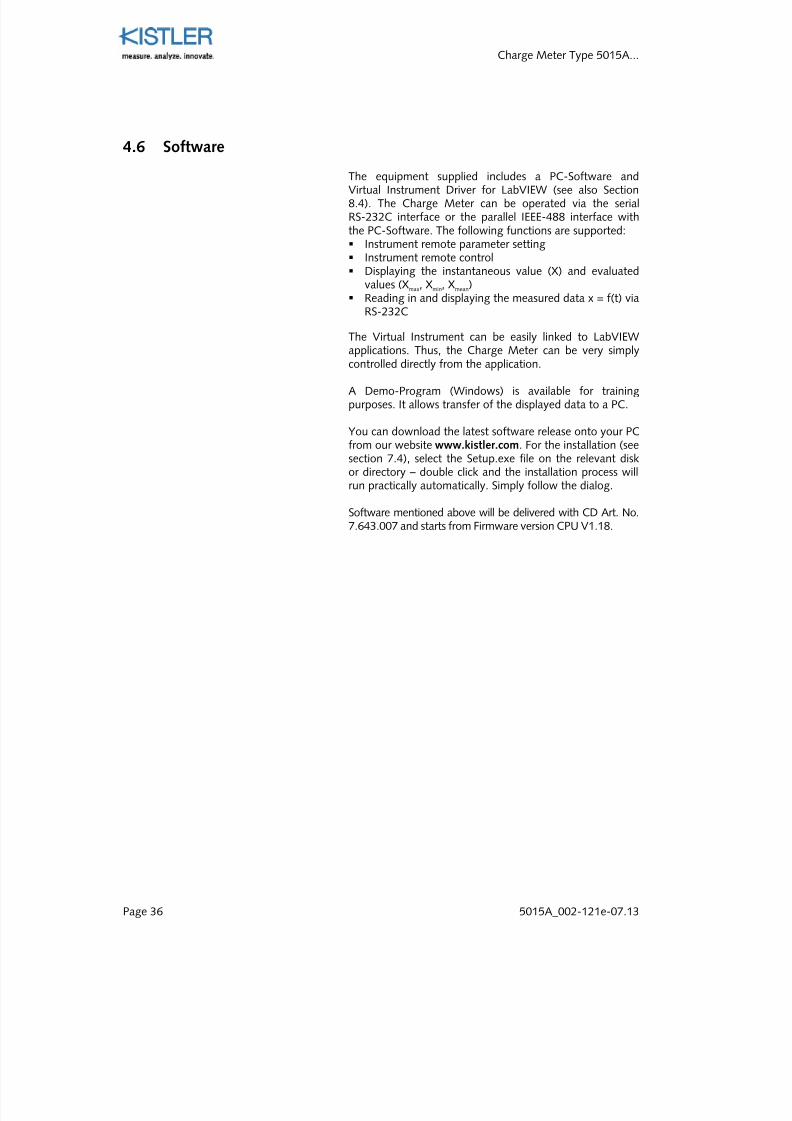
The procedure for instrument adjustment and measure-ment is described below.
Configuring the reference measuring chain Set the sensitivity of the reference sensor with the
appropriate unit on the Charge Meter. Set the FS measuring range
Configuring the shunt measuring range Set the FS measuring range of the reference measuring
chain. Select the menu item for sensitivity setting. Start measurement of the two measuring chains. Apply force to the measuring system. Read off the instantaneous value from the reference
measuring chain. Adjust the sensitivity of the shunt measuring chain until
the instantaneous reading from the shunt measuringchain coincides with the instantaneous reading from thereference measuring chain. The format for the sen-sitivity setting should be set to exponential display.
The sensitivity setting of the shunt measuring chaincorresponds to the shunt sensitivity.
NoteSince the shunt sensitivity is usually much less than thesensitivity of a direct measurement, the correct decade ofthe shunt sensitivity must first be determined for thealignment. When switching the decade during the measu-
ring mode, the message 'Range exceeded – stop measure-ment' may appear. In this case, stop the measurement andrelieve the measuring system. Switch the decade and restartthe measurement. If the instantaneous reading is in thesame order of magnitude as the reference measuring chain,precision alignment via the numerical value can take place.The adjustment limits of the sensitivity are –1.000E-2 ... –9.999E+3.
7/27/2019 002-121e-07.13
http://slidepdf.com/reader/full/002-121e-0713 38/99
7/27/2019 002-121e-07.13
http://slidepdf.com/reader/full/002-121e-0713 39/99
7/27/2019 002-121e-07.13
http://slidepdf.com/reader/full/002-121e-0713 40/99
Charge Meter Type 5015A...
Page 38 5015A_002-121e-07.13
5.3.1 Stepwise Range Setting
Stepwise means that the range can be varied in steps ofe.g. 100.0, 200.0, 500.0, 1 000, 2 000 etc.
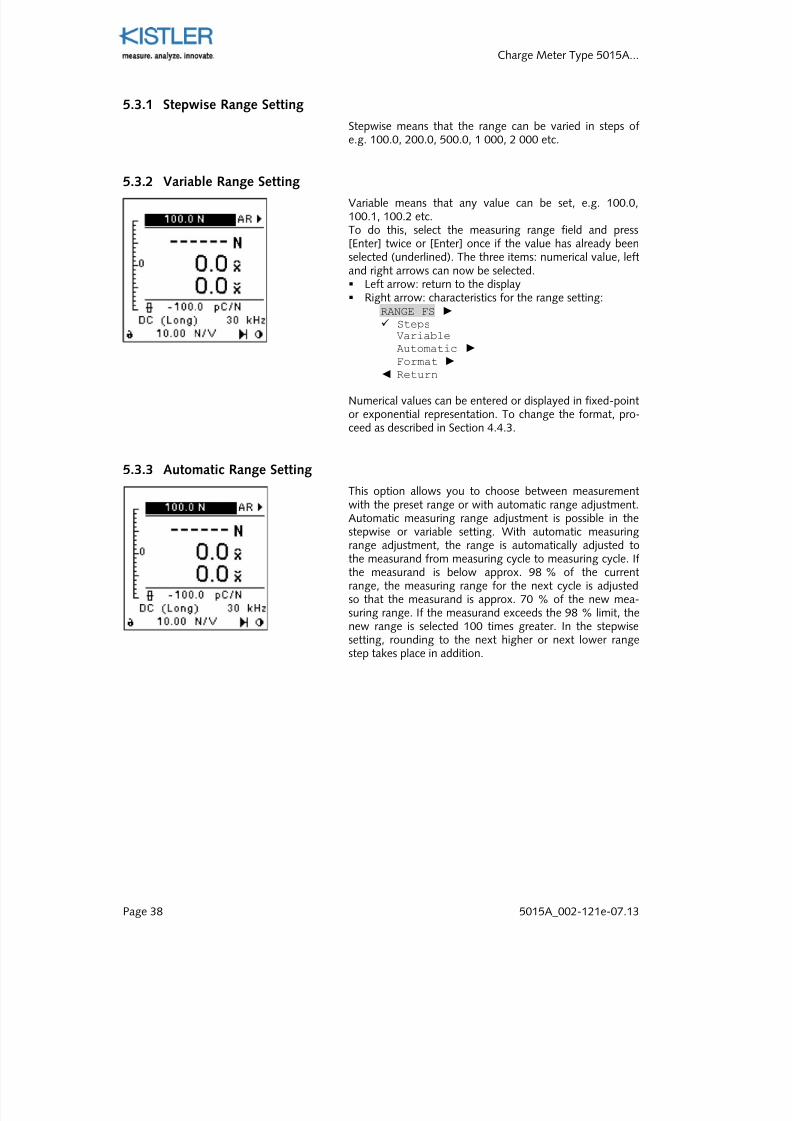
5.3.2 Variable Range Setting
Variable means that any value can be set, e.g. 100.0,100.1, 100.2 etc.To do this, select the measuring range field and press[Enter] twice or [Enter] once if the value has already beenselected (underlined). The three items: numerical value, leftand right arrows can now be selected. Left arrow: return to the display Right arrow: characteristics for the range setting:
RANGE FS
Steps
VariableAutomatic
Format
Return
Numerical values can be entered or displayed in fixed-pointor exponential representation. To change the format, pro-ceed as described in Section 4.4.3.
5.3.3 Automatic Range Setting
This option allows you to choose between measurement
with the preset range or with automatic range adjustment.Automatic measuring range adjustment is possible in thestepwise or variable setting. With automatic measuringrange adjustment, the range is automatically adjusted tothe measurand from measuring cycle to measuring cycle. Ifthe measurand is below approx. 98 % of the currentrange, the measuring range for the next cycle is adjustedso that the measurand is approx. 70 % of the new mea-suring range. If the measurand exceeds the 98 % limit, thenew range is selected 100 times greater. In the stepwisesetting, rounding to the next higher or next lower rangestep takes place in addition.
7/27/2019 002-121e-07.13
http://slidepdf.com/reader/full/002-121e-0713 41/99
7/27/2019 002-121e-07.13
http://slidepdf.com/reader/full/002-121e-0713 42/99
Charge Meter Type 5015A...
Page 40 5015A_002-121e-07.13
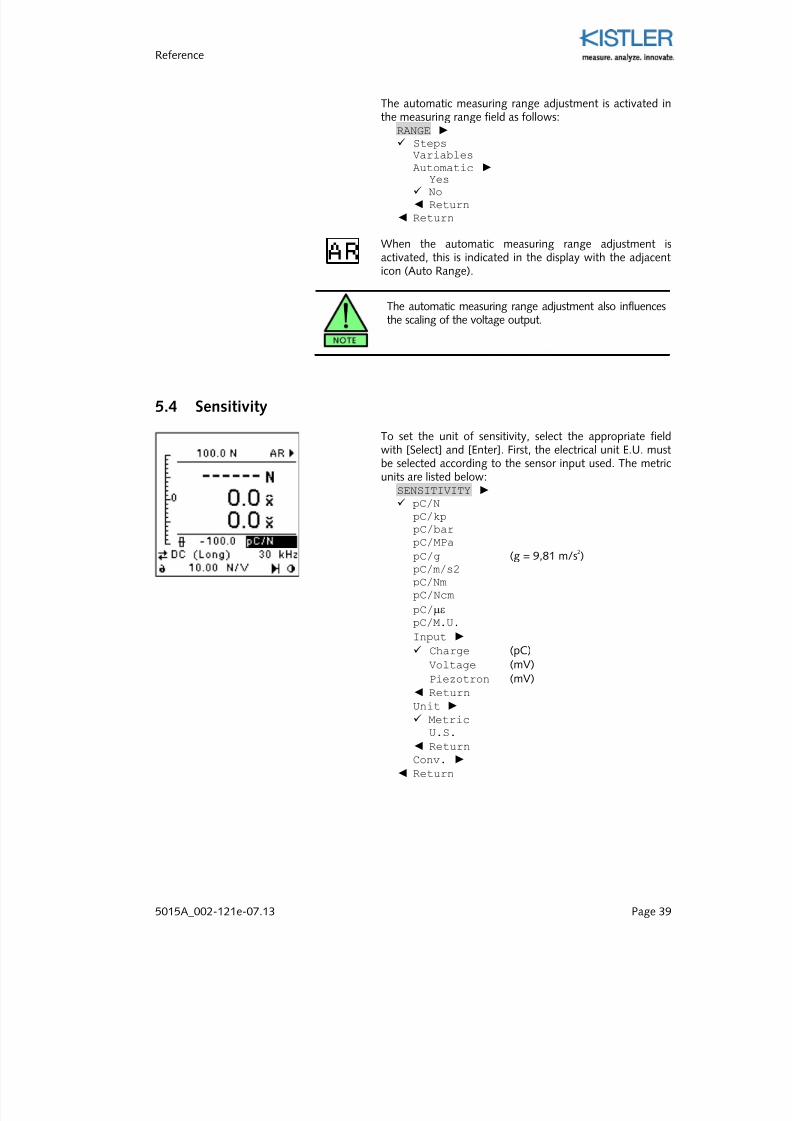
It is also possible to choose between metric and US units.SENSITIVITY
pC/lbf
pC/psi
pC/ft/s2
pC/g (g = 9,81 m/s2) pC/lbf-ft
pC/µε
pC/M.U.
Input
Unit
Conv.
Return
Switching to voltage or Piezotron (mV/M.U.) is only possi-ble when the option is included.
In addition, the sensitivity indicated can be converted asfollows: Force
pC/N
pC/kp
pC/lbf
TorquepC/Nm
pC/Ncm
pC/lbf-ft
PressurepC/bar
pC/MPapC/psi
AccelerationpC/g
pC/m/s2
pC/ft/s2
To set the sensitivity value, select the relevant field andpress [Enter]. The value can then be set as described inSection 4.4.4. The prefix is always negative (–) by defini-tion and cannot be changed.
For a positive output voltage when measuring tensile force,
see section 5.5.
7/27/2019 002-121e-07.13
http://slidepdf.com/reader/full/002-121e-0713 43/99
Reference
5015A_002-121e-07.13 Page 41
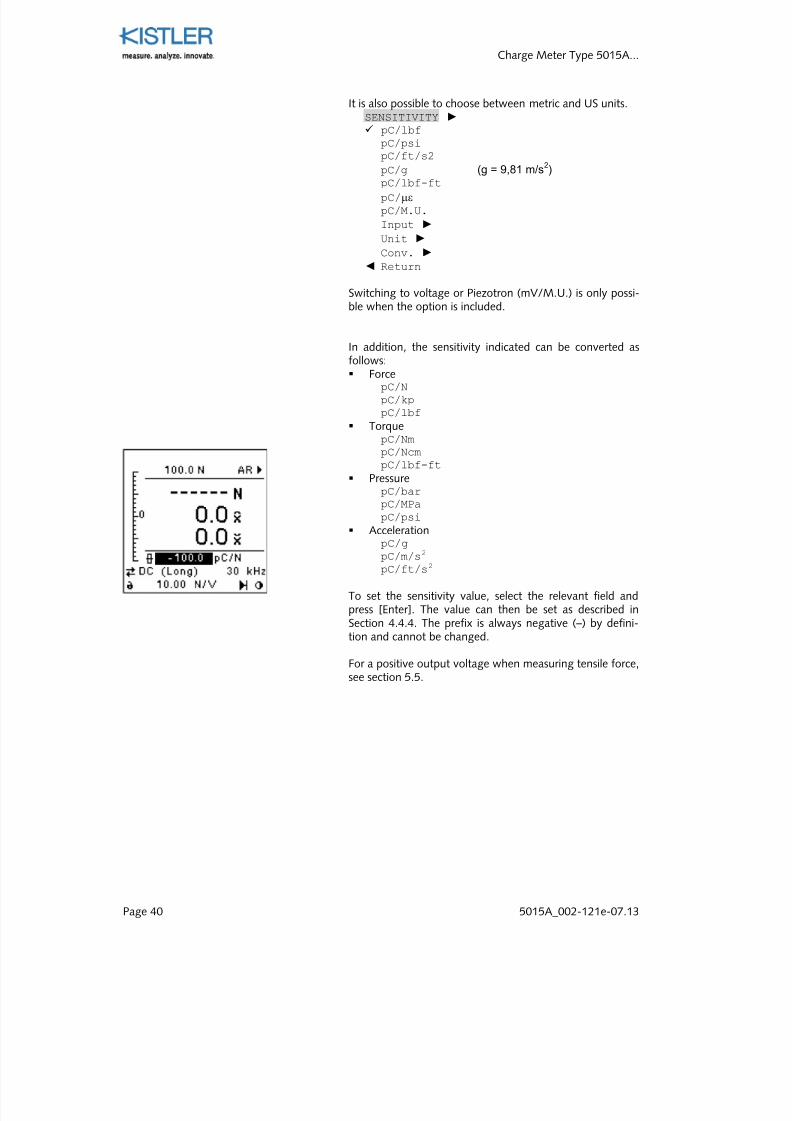
5.5 Voltage Output Scaling
Select the appropriate field with [Select] and press [Enter]
to scale the range of the voltage output. The parametersfor the voltage output range can be set as follows:OUTPUT FS
± 10 V
± 5 V
± 2.5 V
± 2 V
INVERT OFF
ON
Return Return
The output sensitivity shown in the display is calculatedfrom the measuring range set in M.U. and the outputrange in V.
Example: Measuring range = 100 N, output range = ±2,5 Vproduces a scaling of 40 N/V.
INVERT "ON" inverts the analog output signal, i.e. tensileforce (positive charge) now produces a positive outputvoltage. However, the peak indication remains unaffected(compression = positive peak, tension = negative peak).See Section 8.5 for remote control.
If INVERT "ON" is selected, a minus sign is shown in thedisplay (–10 N/V).
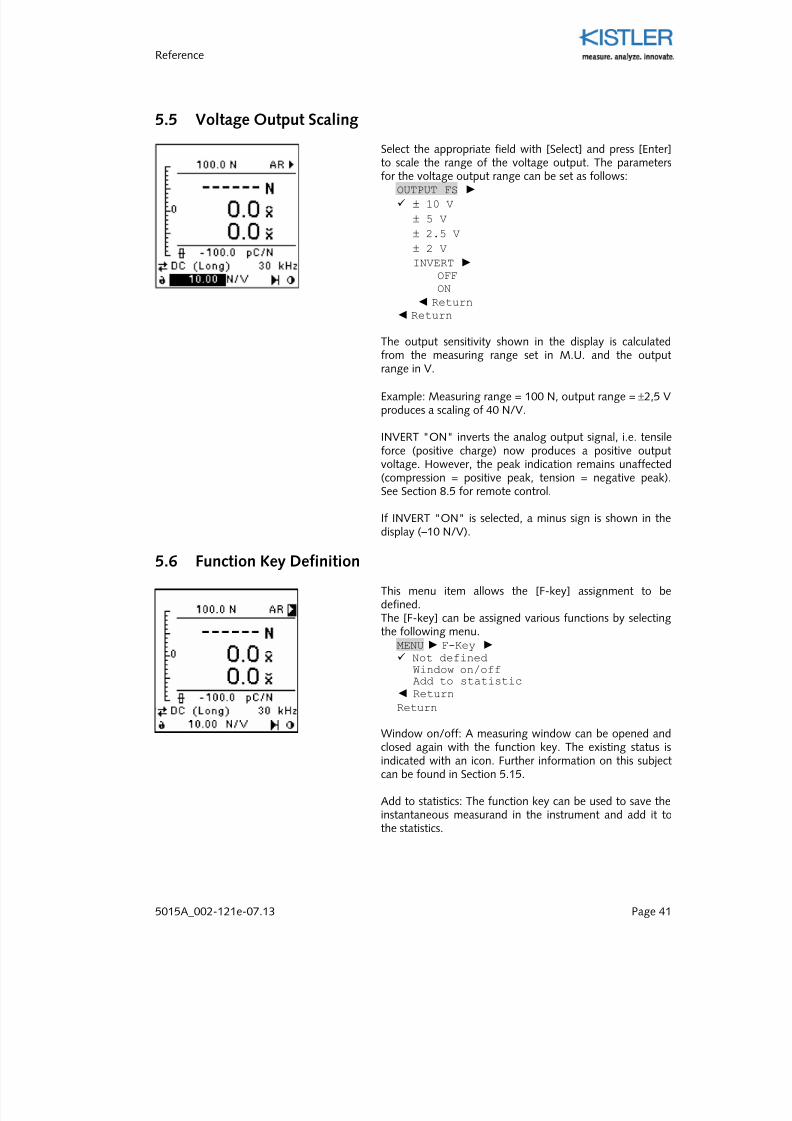
5.6 Function Key Definition
This menu item allows the [F-key] assignment to bedefined.The [F-key] can be assigned various functions by selectingthe following menu.
MENU F-Key Not defined
Window on/offAdd to statistic
Return Return
Window on/off: A measuring window can be opened andclosed again with the function key. The existing status isindicated with an icon. Further information on this subjectcan be found in Section 5.15.
Add to statistics: The function key can be used to save theinstantaneous measurand in the instrument and add it tothe statistics.
7/27/2019 002-121e-07.13
http://slidepdf.com/reader/full/002-121e-0713 44/99
Charge Meter Type 5015A...
Page 42 5015A_002-121e-07.13
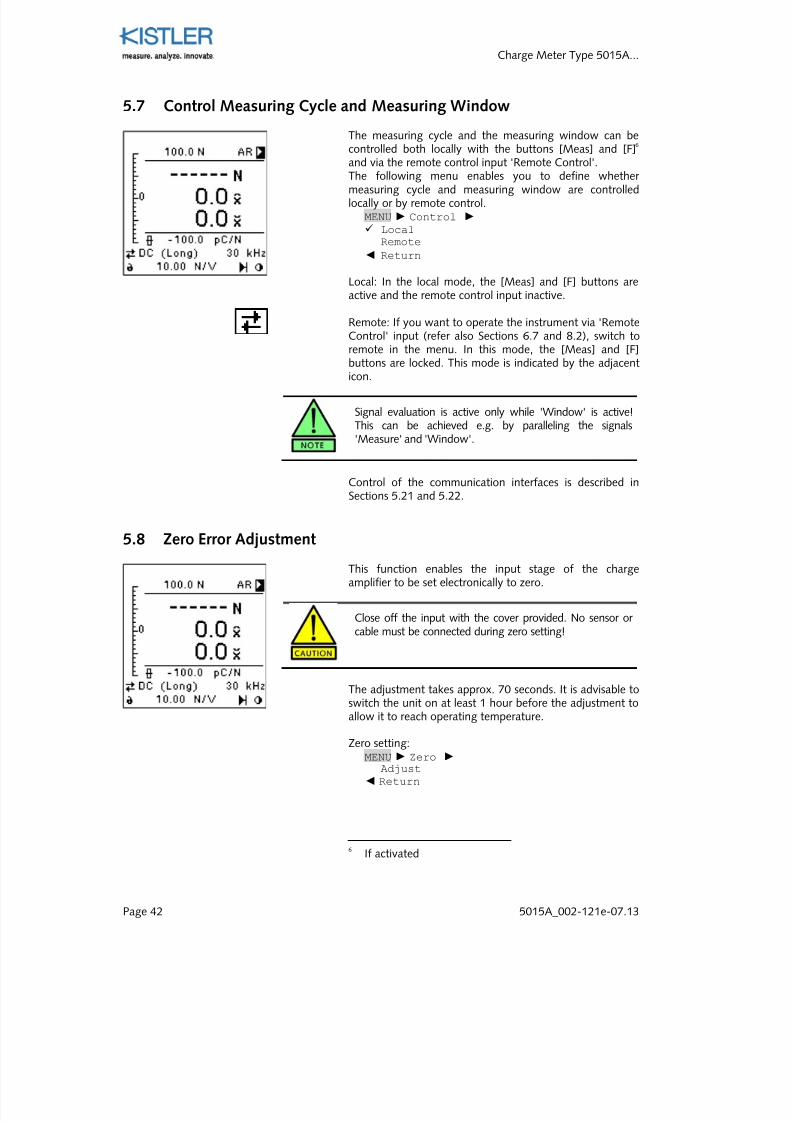
5.7 Control Measuring Cycle and Measuring Window
The measuring cycle and the measuring window can becontrolled both locally with the buttons [Meas] and [F]
6
and via the remote control input 'Remote Control'.The following menu enables you to define whether measuring cycle and measuring window are controlledlocally or by remote control.
MENU Control Local
Remote
Return
Local: In the local mode, the [Meas] and [F] buttons areactive and the remote control input inactive.
Remote: If you want to operate the instrument via 'Remote
Control' input (refer also Sections 6.7 and 8.2), switch toremote in the menu. In this mode, the [Meas] and [F]buttons are locked. This mode is indicated by the adjacenticon.
Signal evaluation is active only while 'Window' is active!This can be achieved e.g. by paralleling the signals'Measure' and 'Window'.
Control of the communication interfaces is described inSections 5.21 and 5.22.
5.8 Zero Error Adjustment
This function enables the input stage of the chargeamplifier to be set electronically to zero.
Close off the input with the cover provided. No sensor or cable must be connected during zero setting!
The adjustment takes approx. 70 seconds. It is advisable toswitch the unit on at least 1 hour before the adjustment toallow it to reach operating temperature.
Zero setting: MENU Zero
Adjust
Return
6If activated
7/27/2019 002-121e-07.13
http://slidepdf.com/reader/full/002-121e-0713 45/99
Reference
5015A_002-121e-07.13 Page 43
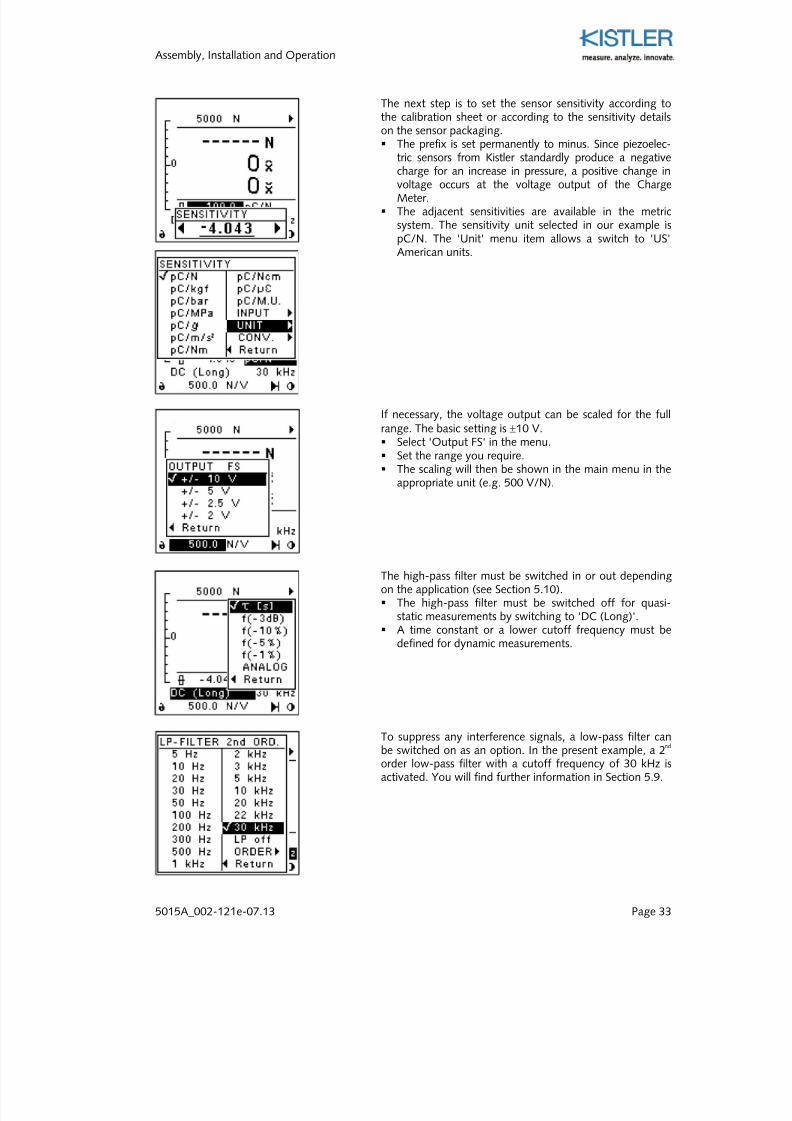
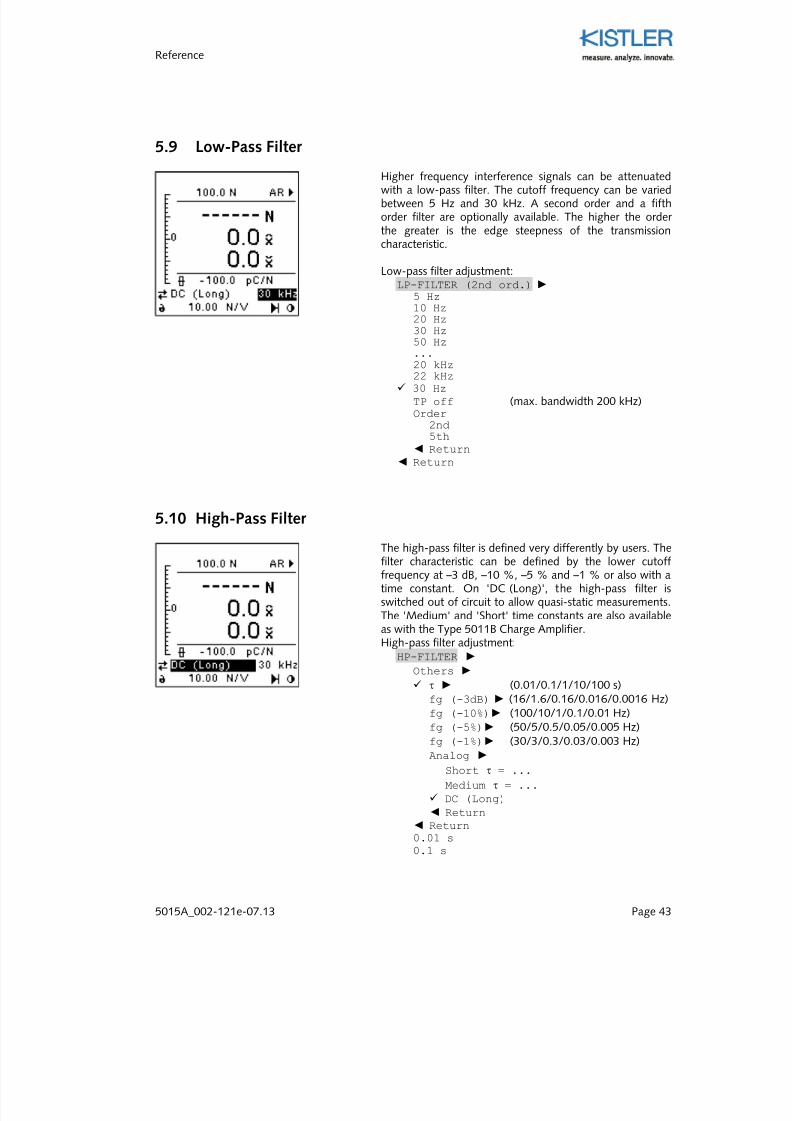
5.9 Low-Pass Filter
Higher frequency interference signals can be attenuatedwith a low-pass filter. The cutoff frequency can be variedbetween 5 Hz and 30 kHz. A second order and a fifthorder filter are optionally available. The higher the order the greater is the edge steepness of the transmissioncharacteristic.
Low-pass filter adjustment: LP-FILTER (2nd ord.)
5 Hz10 Hz20 Hz30 Hz50 Hz...20 kHz22 kHz
30 Hz
TP off (max. bandwidth 200 kHz) Order
2nd5th
Return Return
5.10 High-Pass Filter
The high-pass filter is defined very differently by users. Thefilter characteristic can be defined by the lower cutofffrequency at –3 dB, –10 %, –5 % and –1 % or also with atime constant. On 'DC (Long)', the high-pass filter isswitched out of circuit to allow quasi-static measurements.The 'Medium' and 'Short' time constants are also availableas with the Type 5011B Charge Amplifier.High-pass filter adjustment:
HP-FILTER
Others
τ (0.01/0.1/1/10/100 s) fg (-3dB) (16/1.6/0.16/0.016/0.0016 Hz) fg (-10%) (100/10/1/0.1/0.01 Hz) fg (-5%) (50/5/0.5/0.05/0.005 Hz) fg (-1%) (30/3/0.3/0.03/0.003 Hz) Analog
Short τ = ...
Medium τ = ...
DC (Long)
Return Return0.01 s
0.1 s
7/27/2019 002-121e-07.13
http://slidepdf.com/reader/full/002-121e-0713 46/99
Charge Meter Type 5015A...
Page 44 5015A_002-121e-07.13
1 s
10 s
100 s
DC (Long)
Return
The time constant is determined and displayed in themeasuring modes 'Short' and 'Medium' based on thesettings. The 'Short' and 'Medium' modes involve analogfilters.The high-pass filter calculated with the DSP (fg, τ) can onlybe used when the low-pass filter (e.g. 30 kHz) is switchedon.With the low-pass filter out of circuit, the Charge Meter must be operated on 'DC (Long)', 'Short' or 'Medium'.
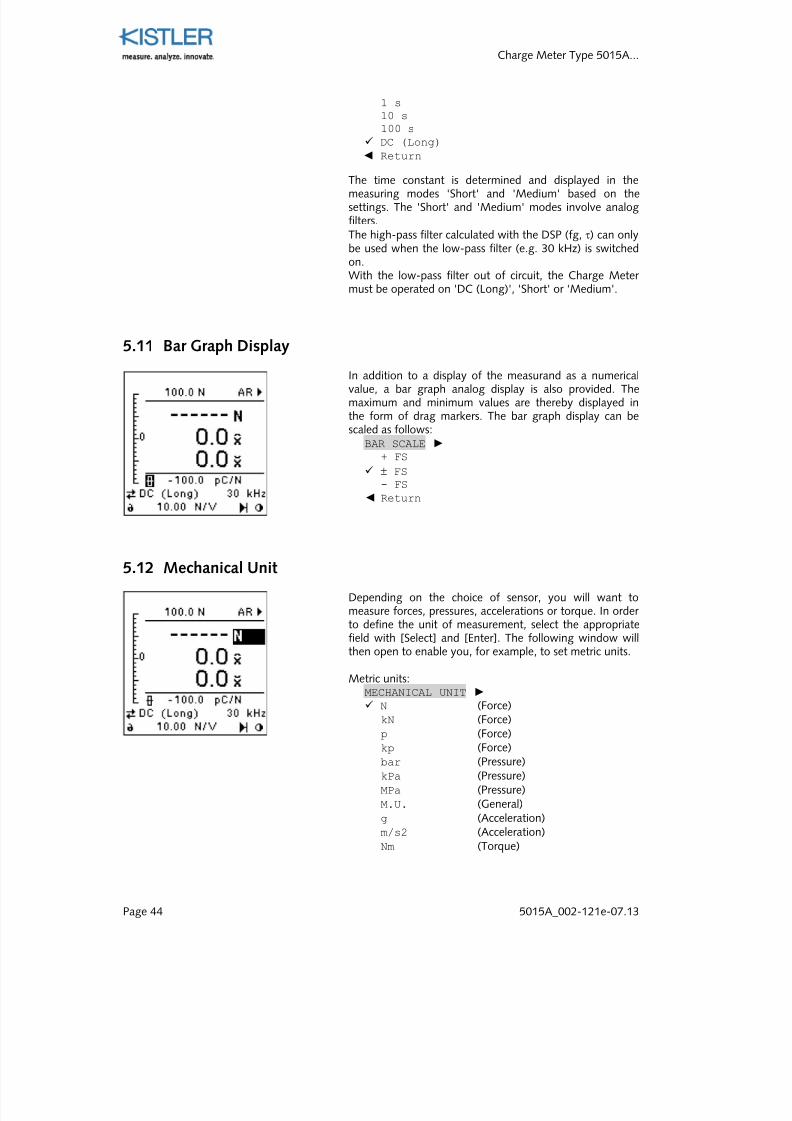
5.11 Bar Graph Display
In addition to a display of the measurand as a numericalvalue, a bar graph analog display is also provided. Themaximum and minimum values are thereby displayed inthe form of drag markers. The bar graph display can bescaled as follows:
BAR SCALE
+ FS
± FS
- FS
Return
5.12 Mechanical Unit
Depending on the choice of sensor, you will want tomeasure forces, pressures, accelerations or torque. In order to define the unit of measurement, select the appropriatefield with [Select] and [Enter]. The following window willthen open to enable you, for example, to set metric units.
Metric units:MECHANICAL UNIT N (Force)
kN (Force) p (Force) kp (Force) bar (Pressure) kPa (Pressure) MPa (Pressure) M.U. (General) g (Acceleration) m/s2 (Acceleration)
Nm (Torque)
7/27/2019 002-121e-07.13
http://slidepdf.com/reader/full/002-121e-0713 47/99
7/27/2019 002-121e-07.13
http://slidepdf.com/reader/full/002-121e-0713 48/99
7/27/2019 002-121e-07.13
http://slidepdf.com/reader/full/002-121e-0713 49/99
Reference
5015A_002-121e-07.13 Page 47
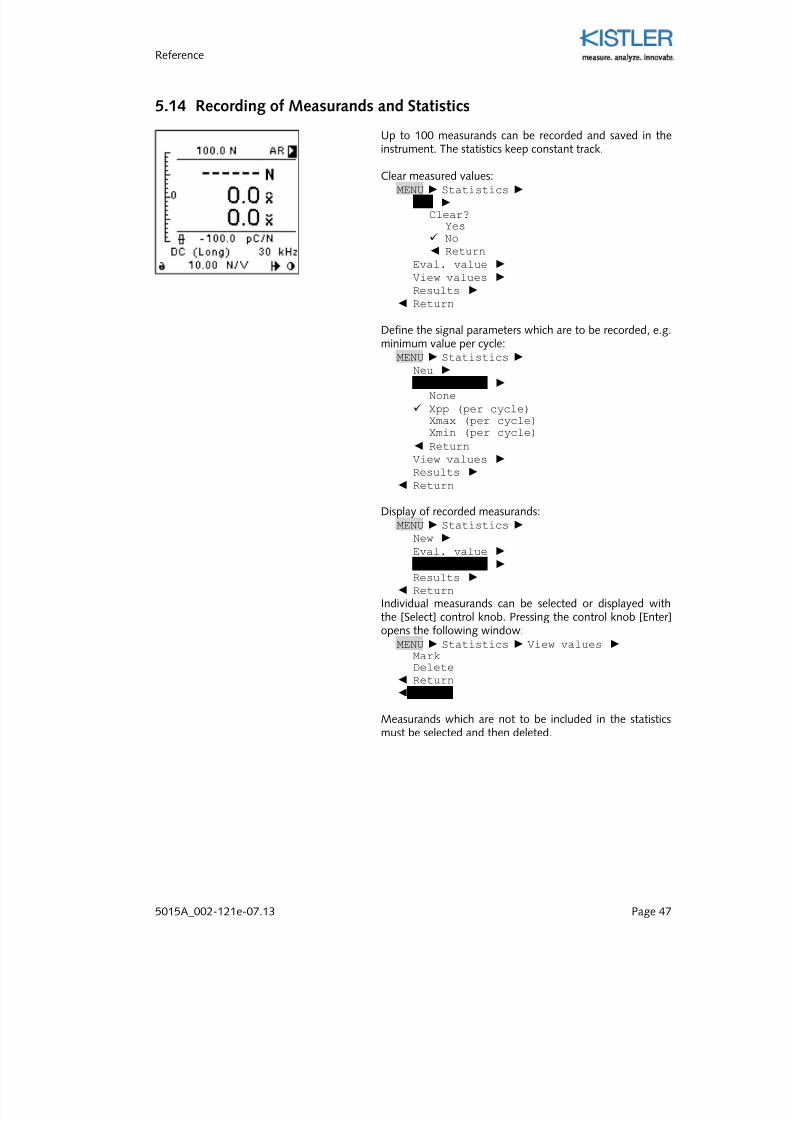
5.14 Recording of Measurands and Statistics
Up to 100 measurands can be recorded and saved in theinstrument. The statistics keep constant track.
Clear measured values:MENU Statistics
New Clear?
Yes No
ReturnEval. value View values Results
Return
Define the signal parameters which are to be recorded, e.g.minimum value per cycle:
MENU Statistics Neu
Eval. value None
Xpp (per cycle)Xmax (per cycle)Xmin (per cycle)
ReturnView values Results
Return
Display of recorded measurands:MENU Statistics
New
Eval. value
View values
Results Return
Individual measurands can be selected or displayed withthe [Select] control knob. Pressing the control knob [Enter]opens the following window:
MENU Statistics View values MarkDelete
Return Escape
Measurands which are not to be included in the statisticsmust be selected and then deleted.
7/27/2019 002-121e-07.13
http://slidepdf.com/reader/full/002-121e-0713 50/99
Charge Meter Type 5015A...
Page 48 5015A_002-121e-07.13
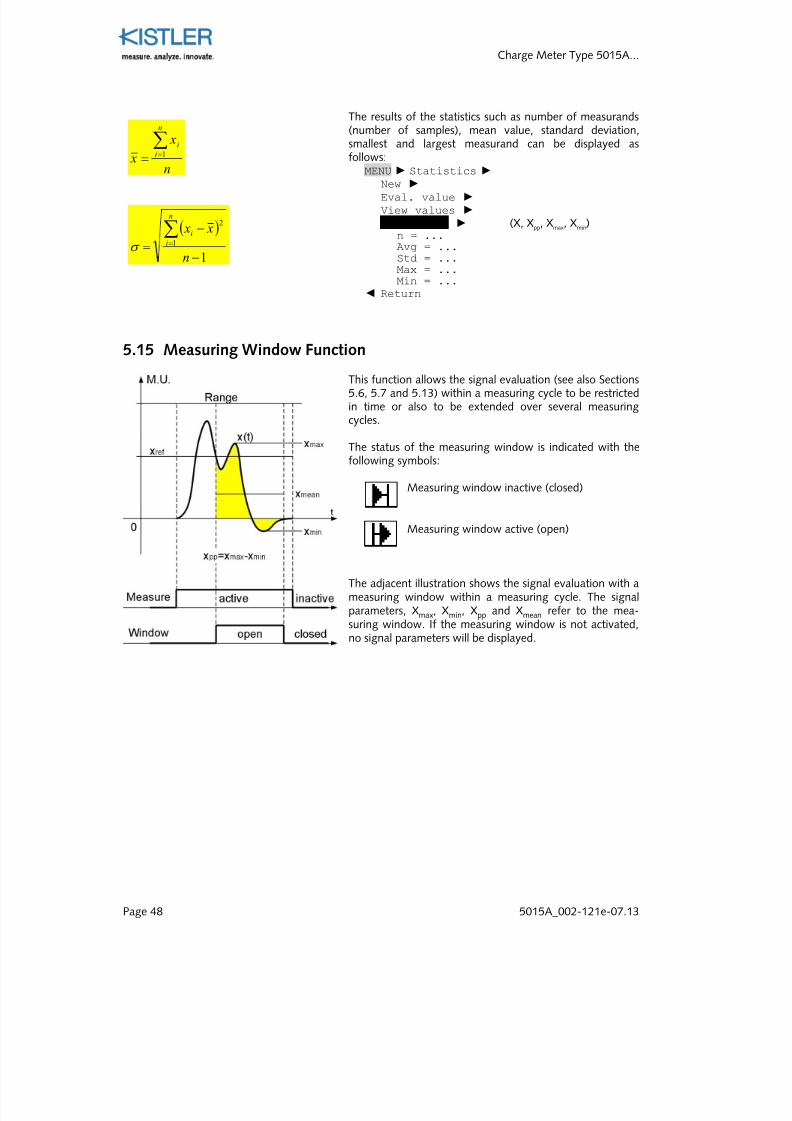
The results of the statistics such as number of measurands(number of samples), mean value, standard deviation,smallest and largest measurand can be displayed asfollows:
MENU Statistics New
Eval. value
View values
Results: X (X, Xpp, Xmax, Xmin)n = ...Avg = ...Std = ...Max = ...Min = ...
Return
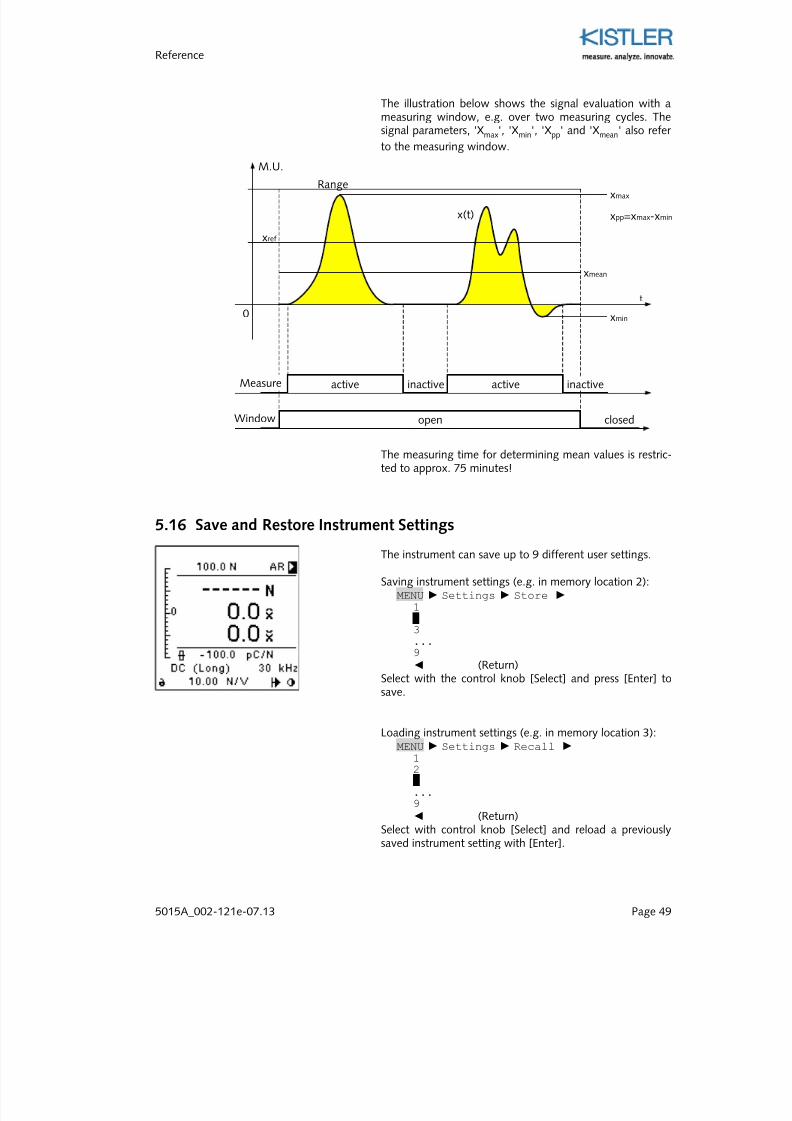
5.15 Measuring Window Function
This function allows the signal evaluation (see also Sections5.6, 5.7 and 5.13) within a measuring cycle to be restrictedin time or also to be extended over several measuringcycles.
The status of the measuring window is indicated with thefollowing symbols:
Measuring window inactive (closed)
Measuring window active (open)
The adjacent illustration shows the signal evaluation with ameasuring window within a measuring cycle. The signalparameters, Xmax, Xmin, Xpp and Xmean refer to the mea-suring window. If the measuring window is not activated,no signal parameters will be displayed.
( )
1
1
2
−
−
=
∑=
n
x xn
i
i
σ
n
x
x
n
i
i∑=
=1
7/27/2019 002-121e-07.13
http://slidepdf.com/reader/full/002-121e-0713 51/99
7/27/2019 002-121e-07.13
http://slidepdf.com/reader/full/002-121e-0713 52/99
Charge Meter Type 5015A...
Page 50 5015A_002-121e-07.13
Resetting to the default settings (factory settings ondelivery):
MENU Settings Defaults. Execute
Return
All settings recorded and measured data saved will bedeleted.
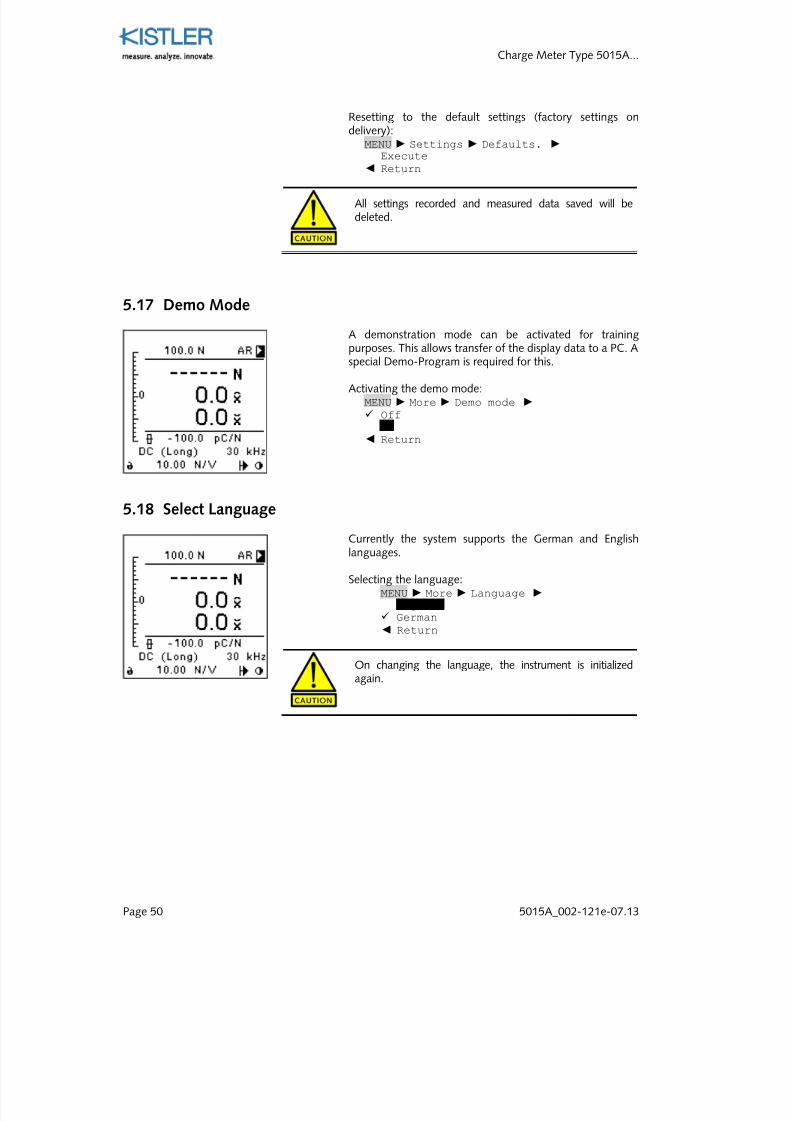
5.17 Demo Mode
A demonstration mode can be activated for trainingpurposes. This allows transfer of the display data to a PC. Aspecial Demo-Program is required for this.
Activating the demo mode:MENU More Demo mode Off
On
Return
5.18 Select Language
Currently the system supports the German and Englishlanguages.
Selecting the language:MENU More Language
English German
Return
On changing the language, the instrument is initialized
again.
7/27/2019 002-121e-07.13
http://slidepdf.com/reader/full/002-121e-0713 53/99
Reference
5015A_002-121e-07.13 Page 51
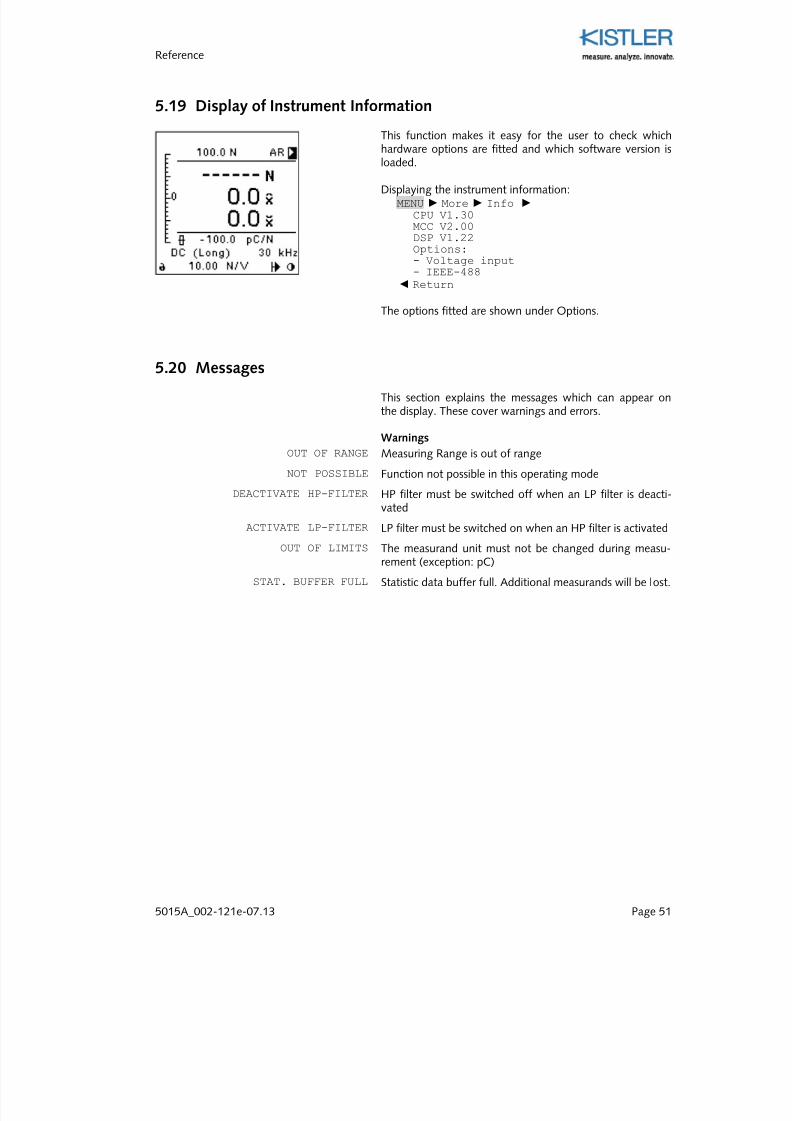
5.19 Display of Instrument Information
This function makes it easy for the user to check whichhardware options are fitted and which software version is
loaded.
Displaying the instrument information:MENU More Info
CPU V1.30MCC V2.00DSP V1.22Options:- Voltage input- IEEE-488
Return
The options fitted are shown under Options.
5.20 Messages
This section explains the messages which can appear onthe display. These cover warnings and errors.
Warnings
OUT OF RANGE Measuring Range is out of range
NOT POSSIBLE Function not possible in this operating mode
DEACTIVATE HP-FILTER HP filter must be switched off when an LP filter is deacti-
vated
ACTIVATE LP-FILTER LP filter must be switched on when an HP filter is activated
OUT OF LIMITS The measurand unit must not be changed during measu-rement (exception: pC)
STAT. BUFFER FULL Statistic data buffer full. Additional measurands will be lost.
7/27/2019 002-121e-07.13
http://slidepdf.com/reader/full/002-121e-0713 54/99
Charge Meter Type 5015A...
Page 52 5015A_002-121e-07.13
Errors
UNKNOWN COMMAND Unknown command on RS-232C or IEEE-488
GENERAL ERROR General error
CARD UNAVAILABLE Plug-in unit (amplifier unit or communication module) notavailable
DSP INVALID MSG DSP received invalid command from the amplifier unit
OUT OF RANGE DSP data out of range
CA OVERLOAD Amplifier input stage overloaded or DSP range overflow
INVALID MESSAGE Invalid message to amplifier unit
UNKN. CARD ERROR General error on amplifier unit
INVALID HEADER DSP. Invalid header from amplifier unit
INPUT OFFSET RANGE Input offset voltage out of range
WRONG CALIB. DATA Invalid calibration data
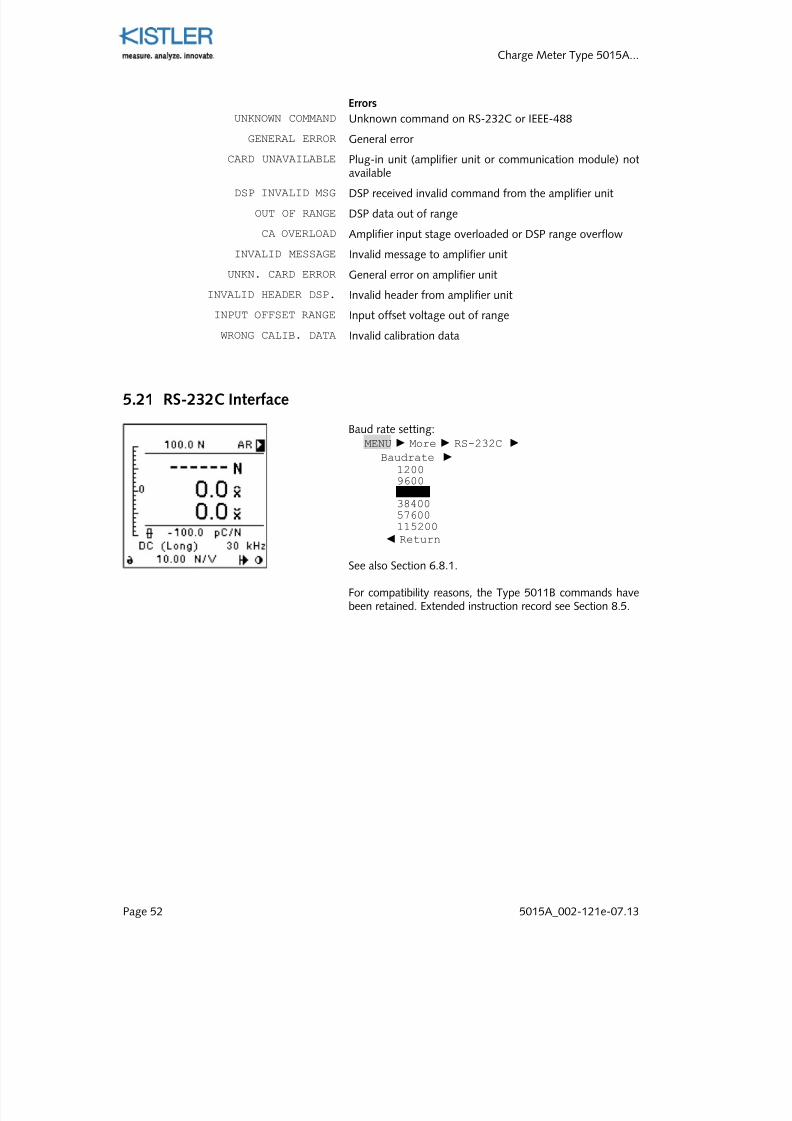
5.21 RS-232C Interface
Baud rate setting:MENU More RS-232C
Baudrate 1200960019200
3840057600115200
Return
See also Section 6.8.1.
For compatibility reasons, the Type 5011B commands havebeen retained. Extended instruction record see Section 8.5.
7/27/2019 002-121e-07.13
http://slidepdf.com/reader/full/002-121e-0713 55/99
Reference
5015A_002-121e-07.13 Page 53
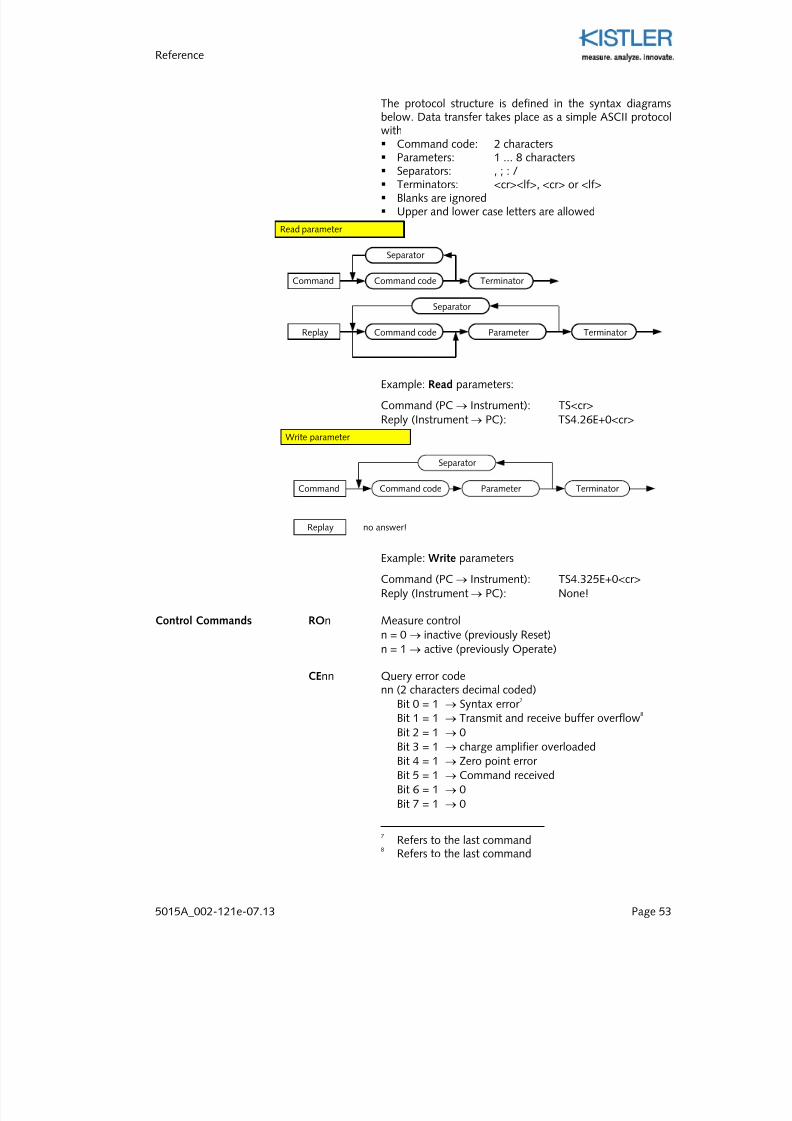
The protocol structure is defined in the syntax diagramsbelow. Data transfer takes place as a simple ASCII protocolwith Command code: 2 characters Parameters: 1 ... 8 characters
Separators: , ; : / Terminators: <cr><lf>, <cr> or <lf> Blanks are ignored Upper and lower case letters are allowed
Example: Read parameters:
Command (PC → Instrument): TS<cr>Reply (Instrument → PC): TS4.26E+0<cr>
Example: Write parameters
Command (PC → Instrument): TS4.325E+0<cr>Reply (Instrument → PC): None!
Control Commands ROn Measure controln = 0 → inactive (previously Reset)n = 1 → active (previously Operate)
CEnn Query error codenn (2 characters decimal coded)
Bit 0 = 1 → Syntax error 7
Bit 1 = 1 → Transmit and receive buffer overflow8
Bit 2 = 1 → 0Bit 3 = 1 → charge amplifier overloadedBit 4 = 1 → Zero point error Bit 5 = 1 → Command receivedBit 6 = 1 → 0Bit 7 = 1 → 0
7
Refers to the last command8Refers to the last command
Command code Terminator
Separator
Write parameter
Parameter
no answer!
Command
Replay
Command code Terminator
Separator
Read parameter
Command code Terminator
Separator
Parameter
Command
Replay
7/27/2019 002-121e-07.13
http://slidepdf.com/reader/full/002-121e-0713 56/99
Charge Meter Type 5015A...
Page 54 5015A_002-121e-07.13
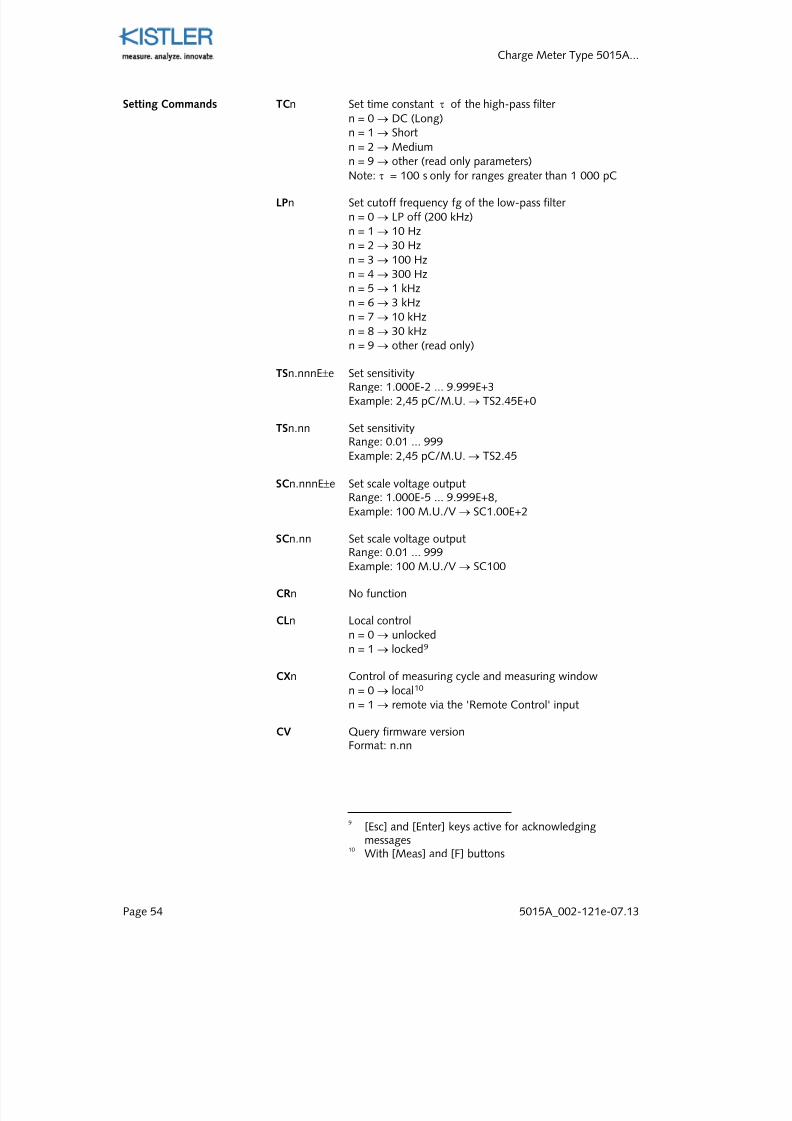
Setting Commands TCn Set time constant τ of the high-pass filter n = 0 → DC (Long)n = 1 → Shortn = 2 → Mediumn = 9 → other (read only parameters)Note: τ = 100 s only for ranges greater than 1 000 pC
LPn Set cutoff frequency fg of the low-pass filter n = 0 → LP off (200 kHz)n = 1 → 10 Hzn = 2 → 30 Hzn = 3 → 100 Hzn = 4 → 300 Hzn = 5 → 1 kHzn = 6 → 3 kHzn = 7 → 10 kHz
n = 8→
30 kHzn = 9 → other (read only)
TSn.nnnE±e Set sensitivityRange: 1.000E-2 ... 9.999E+3Example: 2,45 pC/M.U. → TS2.45E+0
TSn.nn Set sensitivityRange: 0.01 ... 999Example: 2,45 pC/M.U. → TS2.45
SCn.nnnE±e Set scale voltage outputRange: 1.000E-5 ... 9.999E+8,Example: 100 M.U./V → SC1.00E+2
SCn.nn Set scale voltage outputRange: 0.01 ... 999Example: 100 M.U./V → SC100
CRn No function
CLn Local controln = 0 → unlockedn = 1 → locked9
CXn Control of measuring cycle and measuring windown = 0 → local10 n = 1 → remote via the 'Remote Control' input
CV Query firmware versionFormat: n.nn
9[Esc] and [Enter] keys active for acknowledging
messages10With [Meas] and [F] buttons
7/27/2019 002-121e-07.13
http://slidepdf.com/reader/full/002-121e-0713 57/99
Reference
5015A_002-121e-07.13 Page 55
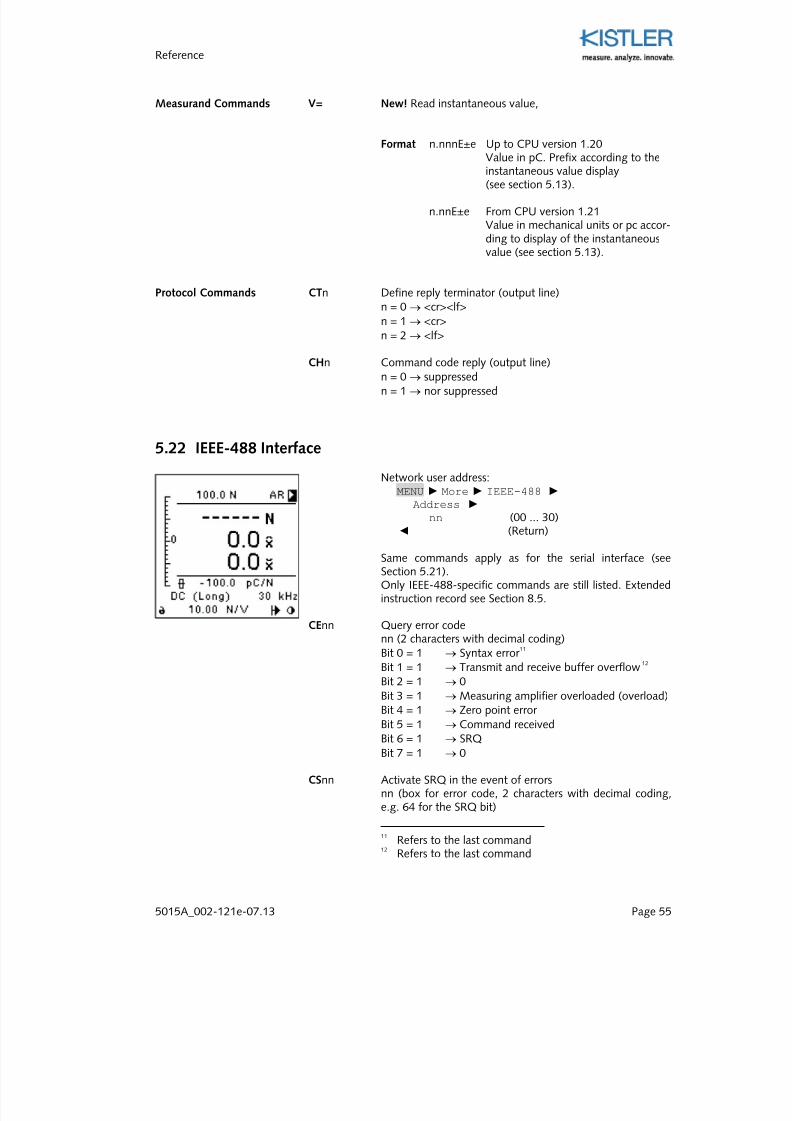
Measurand Commands V= New! Read instantaneous value,
Format n.nnnE±e Up to CPU version 1.20Value in pC. Prefix according to the
instantaneous value display(see section 5.13).
n.nnE±e From CPU version 1.21Value in mechanical units or pc accor-ding to display of the instantaneousvalue (see section 5.13).
Protocol Commands CTn Define reply terminator (output line)n = 0 → <cr><lf>n = 1 → <cr>
n = 2 → <lf>
CHn Command code reply (output line)n = 0 → suppressedn = 1 → nor suppressed
5.22 IEEE-488 Interface
Network user address:MENU More IEEE-488
Address nn (00 ... 30)
(Return)
Same commands apply as for the serial interface (seeSection 5.21).Only IEEE-488-specific commands are still listed. Extendedinstruction record see Section 8.5.
CEnn Query error codenn (2 characters with decimal coding)Bit 0 = 1 → Syntax error
11
Bit 1 = 1 → Transmit and receive buffer overflow 12
Bit 2 = 1 → 0Bit 3 = 1 → Measuring amplifier overloaded (overload)Bit 4 = 1 → Zero point error Bit 5 = 1 → Command receivedBit 6 = 1 → SRQBit 7 = 1 → 0
CSnn Activate SRQ in the event of errorsnn (box for error code, 2 characters with decimal coding,e.g. 64 for the SRQ bit)
11
Refers to the last command12Refers to the last command
7/27/2019 002-121e-07.13
http://slidepdf.com/reader/full/002-121e-0713 58/99
Charge Meter Type 5015A...
Page 56 5015A_002-121e-07.13
6. Technical Data
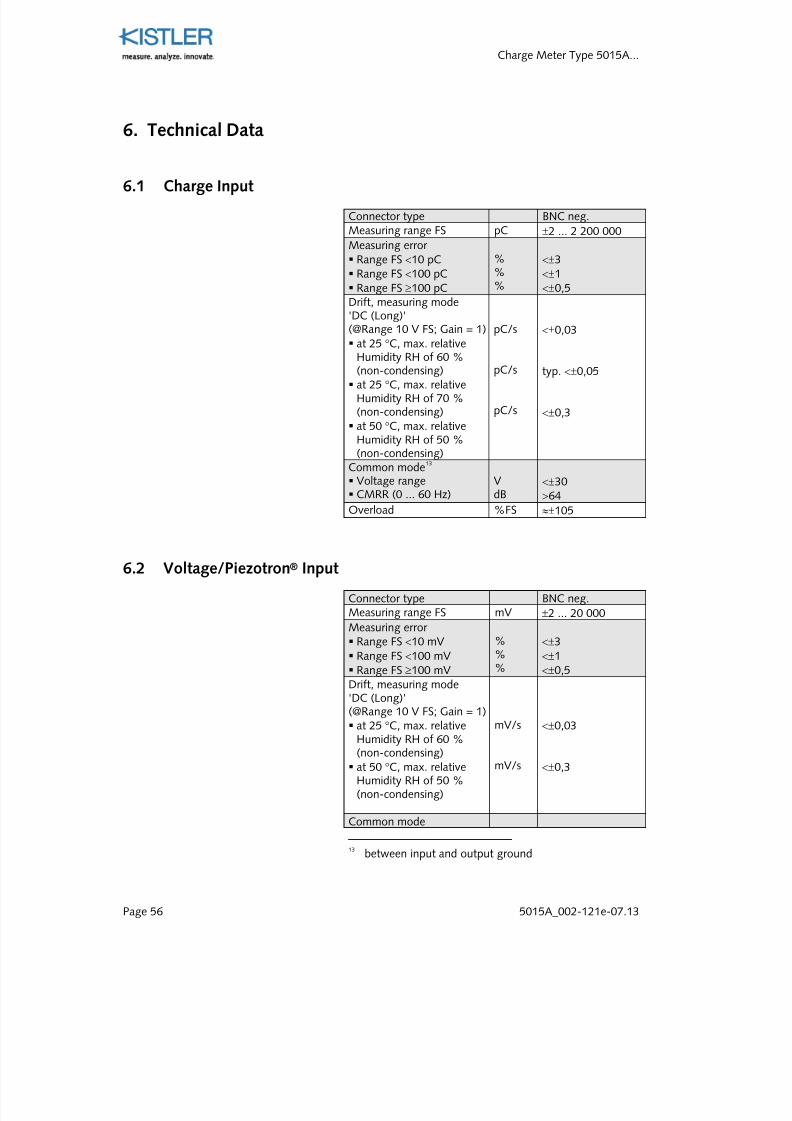
6.1 Charge Input
Connector type BNC neg.Measuring range FS pC ±2 ... 2 200 000Measuring error Range FS <10 pC Range FS <100 pC Range FS ≥100 pC
%%%
<±3<±1<±0,5
Drift, measuring mode'DC (Long)'(@Range 10 V FS; Gain = 1) at 25 °C, max. relative
Humidity RH of 60 %(non-condensing)
at 25 °C, max. relativeHumidity RH of 70 %(non-condensing)
at 50 °C, max. relativeHumidity RH of 50 %(non-condensing)
pC/s
pC/s
pC/s
<±0,03
typ. <±0,05
<±0,3
Common mode13
Voltage range CMRR (0 ... 60 Hz)
VdB
<±30>64
Overload %FS ≈±105
6.2 Voltage/Piezotron® Input
Connector type BNC neg.Measuring range FS mV ±2 ... 20 000Measuring error Range FS <10 mV Range FS <100 mV Range FS ≥100 mV
%%%
<±3<±1
<±0,5Drift, measuring mode'DC (Long)'(@Range 10 V FS; Gain = 1) at 25 °C, max. relative
Humidity RH of 60 %(non-condensing)
at 50 °C, max. relativeHumidity RH of 50 %(non-condensing)
mV/s
mV/s
<±0,03
<±0,3
Common mode
13between input and output ground
7/27/2019 002-121e-07.13
http://slidepdf.com/reader/full/002-121e-0713 59/99
Technical Data
5015A_002-121e-07.13 Page 57
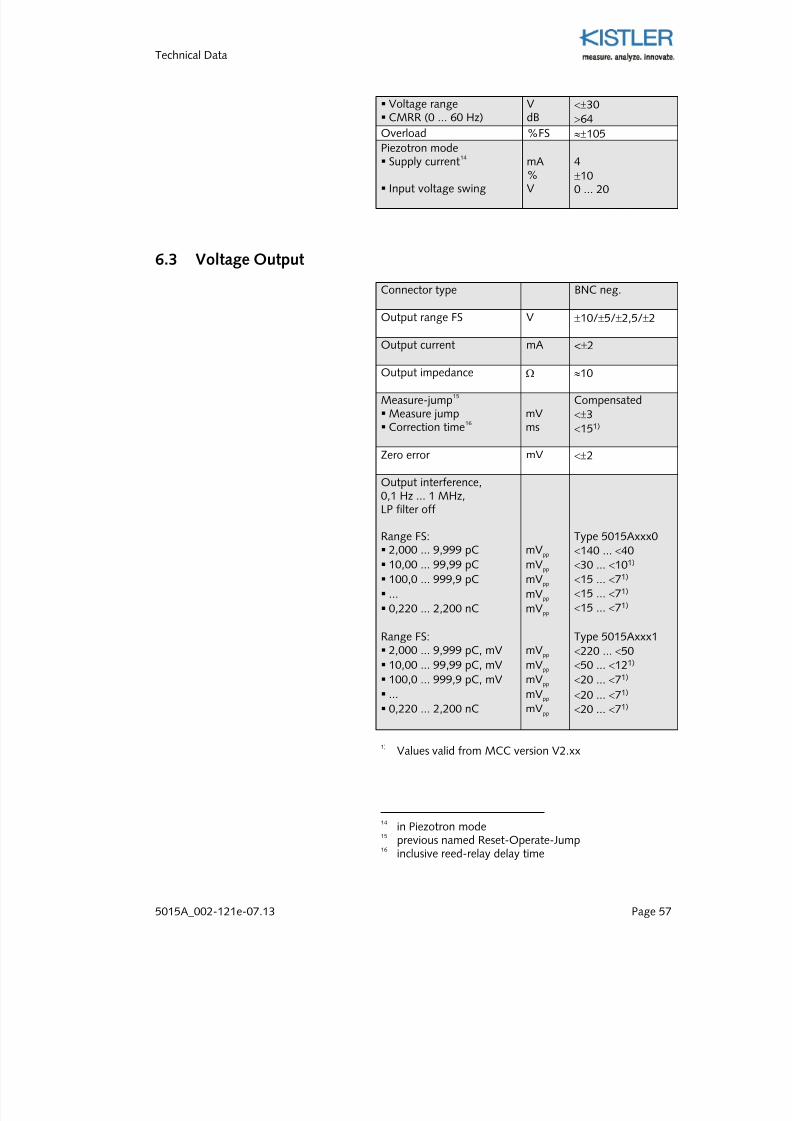
Voltage range CMRR (0 ... 60 Hz)
VdB
<±30>64
Overload %FS ≈±105Piezotron mode Supply current
14
Input voltage swing
mA%V
4±100 ... 20
6.3 Voltage Output
Connector type BNC neg.
Output range FS V ±10/±5/±2,5/±2
Output current mA <±2
Output impedance Ω ≈10
Measure-jump15
Measure jump Correction time
16
mVms
Compensated<±3<151)
Zero error mV <±2
Output interference,0,1 Hz ... 1 MHz,
LP filter off
Range FS: 2,000 ... 9,999 pC
10,00 ... 99,99 pC
100,0 ... 999,9 pC
...
0,220 ... 2,200 nC
mVpp
mVpp
mVpp
mVpp
mVpp
Type 5015Axxx0<140 ... <40<30 ... <101) <15 ... <71) <15 ... <71) <15 ... <71)
Range FS: 2,000 ... 9,999 pC, mV
10,00 ... 99,99 pC, mV
100,0 ... 999,9 pC, mV ...
0,220 ... 2,200 nC
mVpp
mVpp
mVpp mVpp
mVpp
Type 5015Axxx1<220 ... <50<50 ... <121)
<20 ... <71) <20 ... <71) <20 ... <71)
1)Values valid from MCC version V2.xx
14in Piezotron mode
15
previous named Reset-Operate-Jump16inclusive reed-relay delay time
7/27/2019 002-121e-07.13
http://slidepdf.com/reader/full/002-121e-0713 60/99
Charge Meter Type 5015A...
Page 58 5015A_002-121e-07.13
Output interference,0,1 Hz ... 1 MHz,LP filter ≤30 kHz
Range FS:
2,000 ... 9,999 pC 10,00 ... 99,99 pC ... 0,220 ... 2,200 nC
mVpp mVpp mVpp mVpp
Type 5015Axxx0<60 ... <20<20 ... <71) <10 ... <51) <10 ... <51)
Range FS: 2,000 ... 9,999 pC, mV 10,00 ... 99,99 pC, mV 100,0 ... 999,9 pC, mV ... 0,220 ... 2,200 nC
mVpp mVpp mVpp mVpp mVpp
Type 5015Axxx1<180 ... <501) <30 ... <101) <10 ... <51) <10 ... <51) <10 ... <51)
1)Values valid from MCC version V2.xx
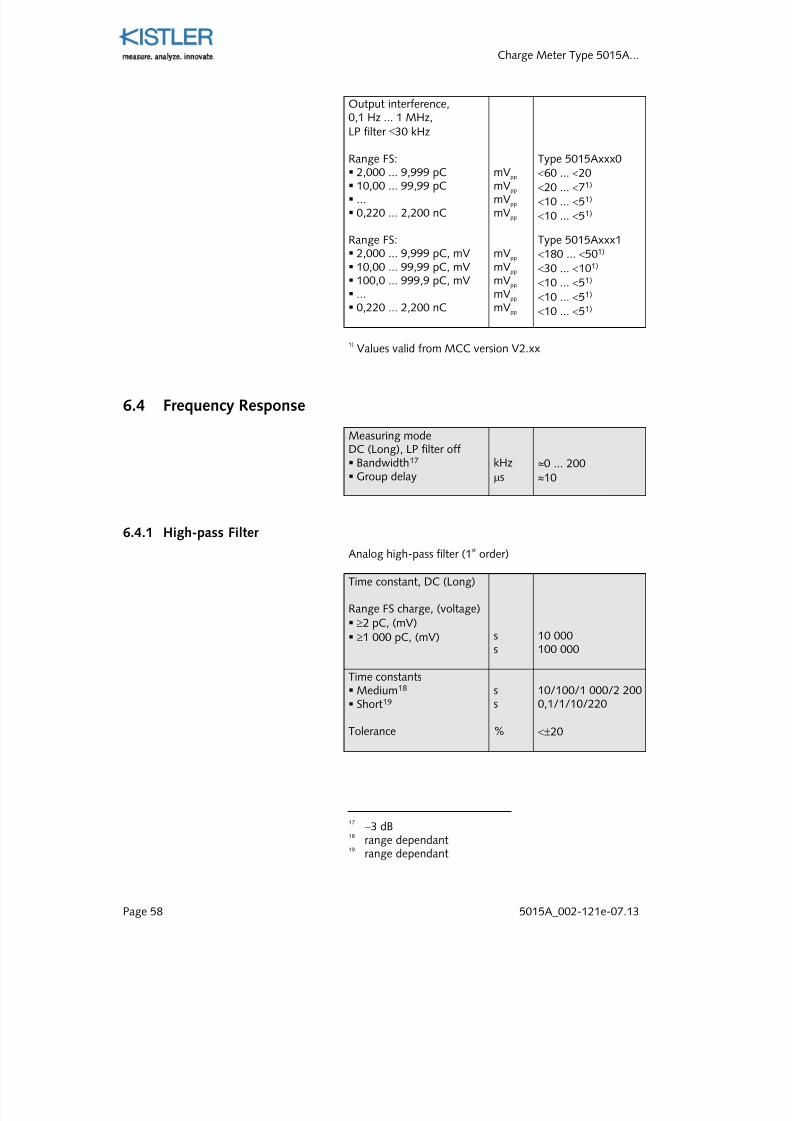
6.4 Frequency Response
Measuring modeDC (Long), LP filter off Bandwidth17
Group delaykHzµs
≈0 ... 200≈10
6.4.1 High-pass Filter
Analog high-pass filter (1st order)
Time constant, DC (Long)
Range FS charge, (voltage) ≥2 pC, (mV) ≥1 000 pC, (mV) s
s10 000100 000
Time constants Medium18 Short19
Tolerance
ss
%
10/100/1 000/2 2000,1/1/10/220
<±20
17 −3 dB
18
range dependant19range dependant
7/27/2019 002-121e-07.13
http://slidepdf.com/reader/full/002-121e-0713 61/99
Technical Data
5015A_002-121e-07.13 Page 59
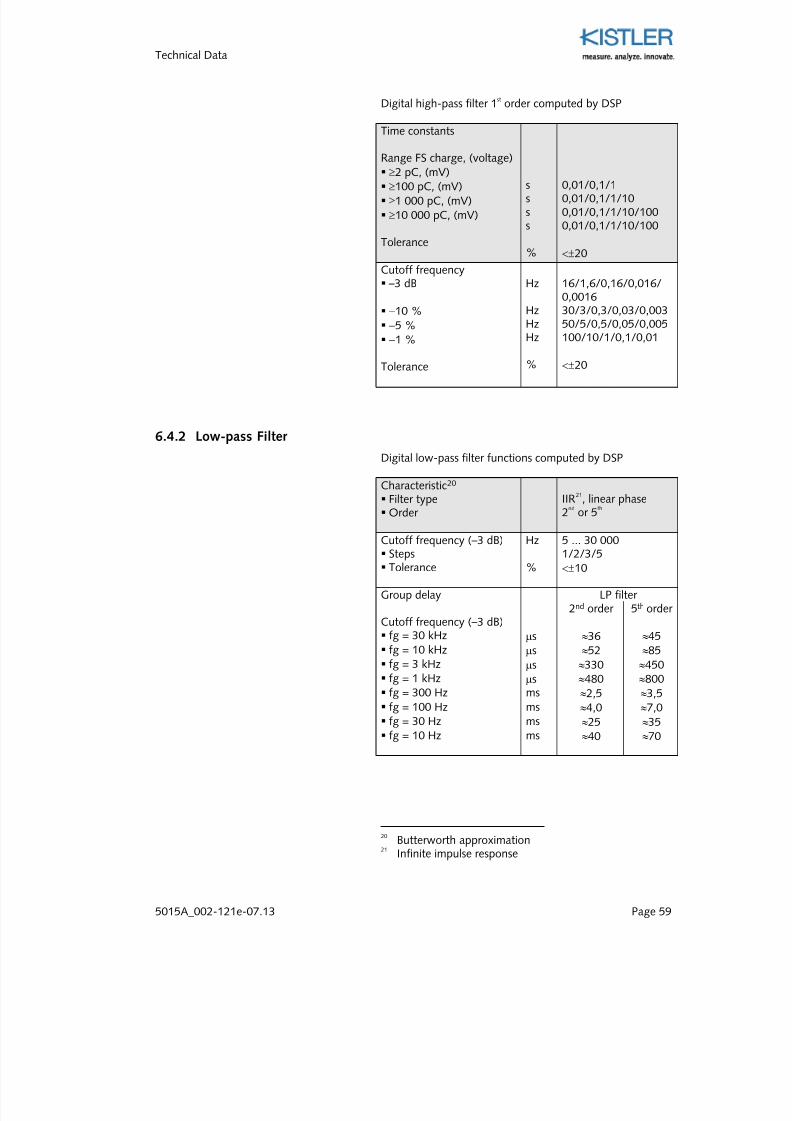
Digital high-pass filter 1st
order computed by DSP
Time constants
Range FS charge, (voltage)
≥2 pC, (mV) ≥100 pC, (mV) ≥1 000 pC, (mV) ≥10 000 pC, (mV)
Tolerance
ssss
%
0,01/0,1/10,01/0,1/1/100,01/0,1/1/10/1000,01/0,1/1/10/100
<±20
Cutoff frequency –3 dB
−10 % −5 %
−1 %
Tolerance
Hz
HzHz
Hz
%
16/1,6/0,16/0,016/0,001630/3/0,3/0,03/0,00350/5/0,5/0,05/0,005
100/10/1/0,1/0,01
<±20
6.4.2 Low-pass Filter
Digital low-pass filter functions computed by DSP
Characteristic20 Filter type Order
IIR21, linear phase
2nd or 5th
Cutoff frequency (–3 dB) Steps Tolerance
Hz
%
5 ... 30 0001/2/3/5<±10
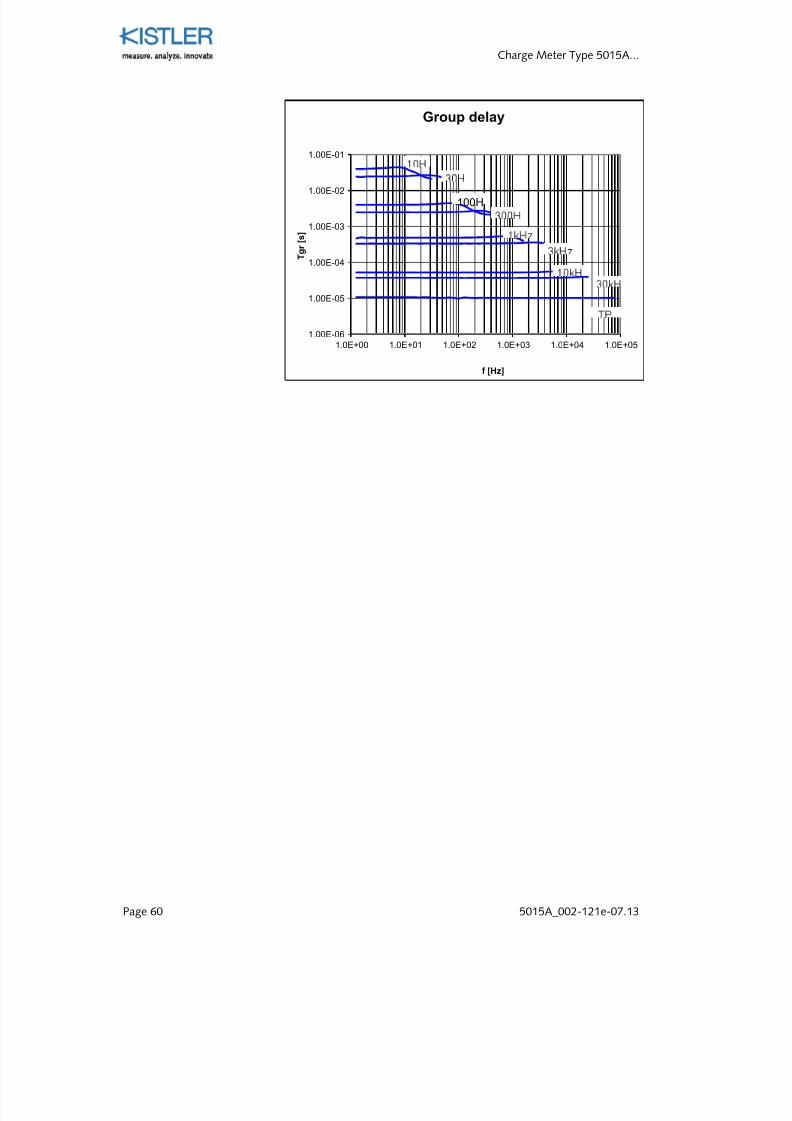
Group delay
Cutoff frequency (–3 dB)
LP filter 2nd order 5th order
fg = 30 kHz µs ≈36 ≈45 fg = 10 kHz µs ≈52 ≈85 fg = 3 kHz µs ≈330 ≈450
fg = 1 kHz µs ≈480 ≈800 fg = 300 Hz ms ≈2,5 ≈3,5 fg = 100 Hz ms ≈4,0 ≈7,0 fg = 30 Hz ms ≈25 ≈35 fg = 10 Hz ms ≈40 ≈70
20
Butterworth approximation21Infinite impulse response
7/27/2019 002-121e-07.13
http://slidepdf.com/reader/full/002-121e-0713 62/99
Charge Meter Type 5015A...
Page 60 5015A_002-121e-07.13
1.00E-06
1.00E-05
1.00E-04
1.00E-03
1.00E-02
1.00E-01
1.0E+00 1.0E+01 1.0E+02 1.0E+03 1.0E+04 1.0E+05
T g r [ s ]
f [Hz]
Group delay
100H
7/27/2019 002-121e-07.13
http://slidepdf.com/reader/full/002-121e-0713 63/99
Technical Data
5015A_002-121e-07.13 Page 61
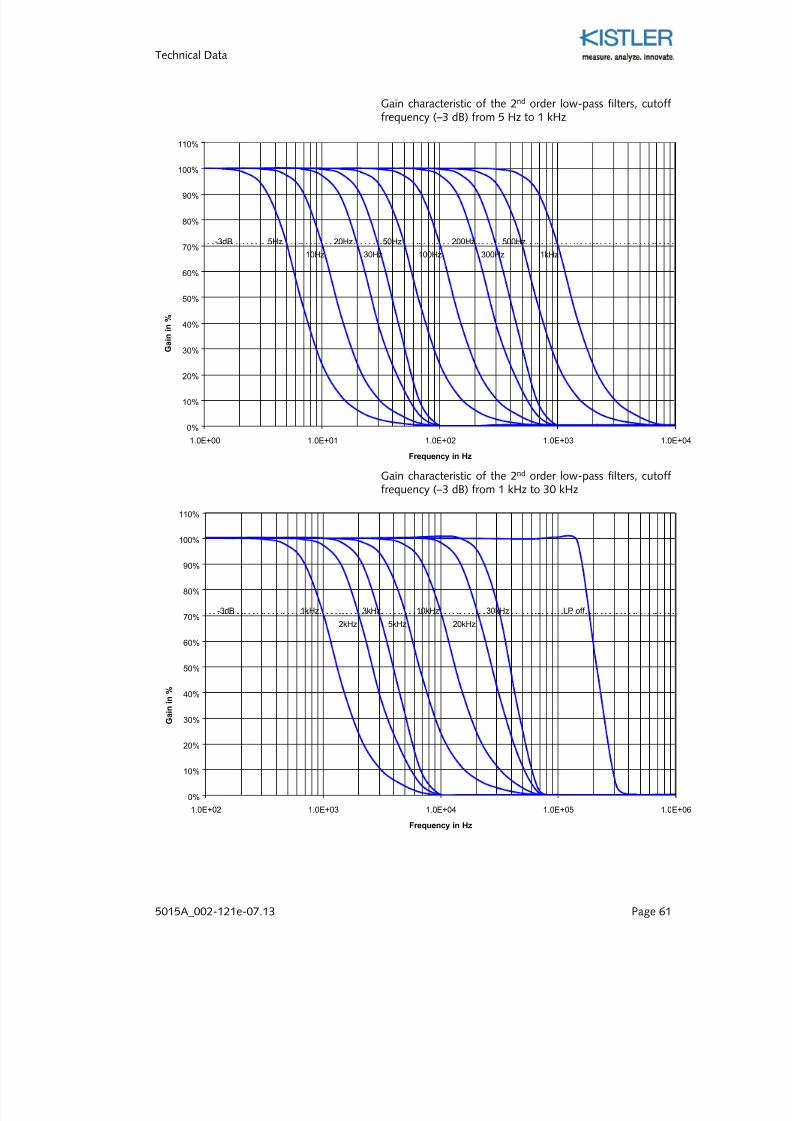
Gain characteristic of the 2nd order low-pass filters, cutofffrequency (–3 dB) from 5 Hz to 1 kHz
Gain characteristic of the 2nd order low-pass filters, cutofffrequency (–3 dB) from 1 kHz to 30 kHz
0%
10%
20%
30%
40%
50%
60%
70%
80%
90%
100%
110%
1.0E+00 1.0E+01 1.0E+02 1.0E+03 1.0E+04
Frequency in Hz
G a i n
i n %
5Hz
10Hz
20Hz
30Hz
50Hz
100Hz
200Hz
300Hz
500Hz
1kHz
-3dB
0%
10%
20%
30%
40%
50%
60%
70%
80%
90%
100%
110%
1.0E+02 1.0E+03 1.0E+04 1.0E+05 1.0E+06
Frequency in Hz
G a i n i n %
-3dB 30kHz
20kHz
10kHz
5kHz
3kHz
2kHz
1kHz LP off
7/27/2019 002-121e-07.13
http://slidepdf.com/reader/full/002-121e-0713 64/99
Charge Meter Type 5015A...
Page 62 5015A_002-121e-07.13
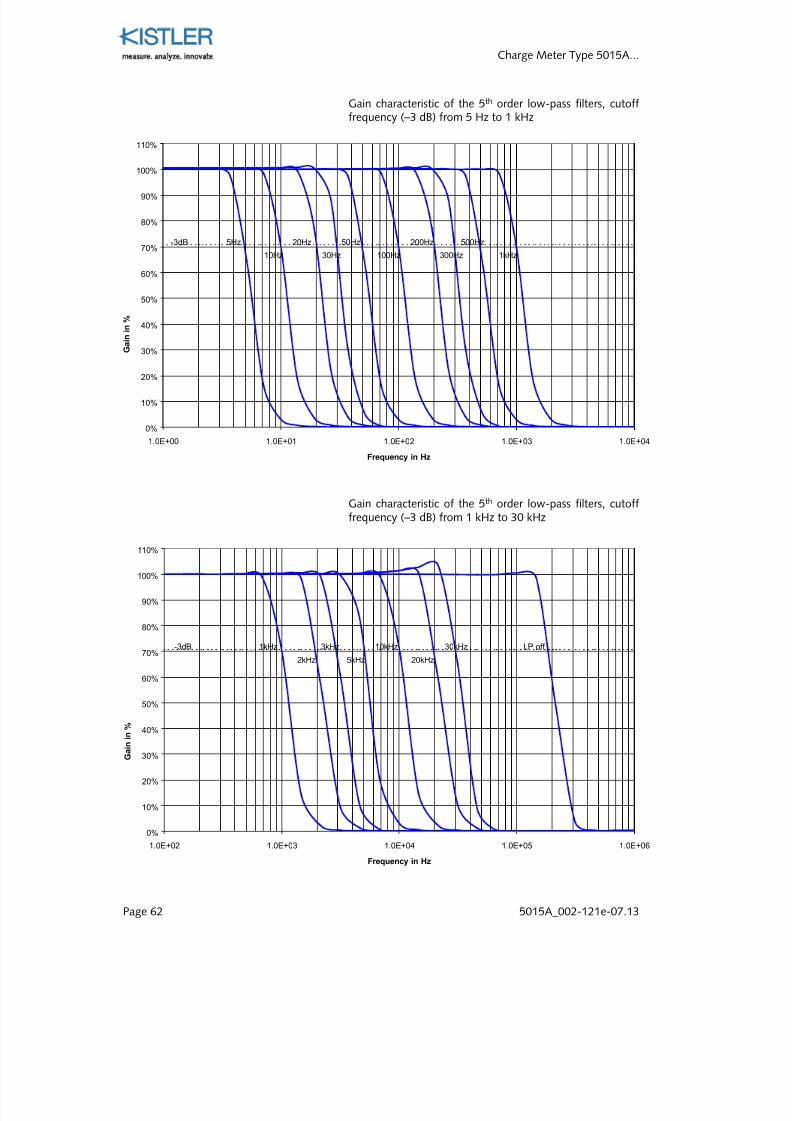
Gain characteristic of the 5th order low-pass filters, cutofffrequency (–3 dB) from 5 Hz to 1 kHz
Gain characteristic of the 5th
order low-pass filters, cutofffrequency (–3 dB) from 1 kHz to 30 kHz
0%
10%
20%
30%
40%
50%
60%
70%
80%
90%
100%
110%
1.0E+02 1.0E+03 1.0E+04 1.0E+05 1.0E+06
Frequency in Hz
G a i n i n %
-3dB 30kHz
20kHz
10kHz
5kHz
3kHz
2kHz
1kHz LP off
0%
10%
20%
30%
40%
50%
60%
70%
80%
90%
100%
110%
1.0E+00 1.0E+01 1.0E+02 1.0E+03 1.0E+04
Frequency in Hz
G a i n
i n %
5Hz
10Hz
20Hz
30Hz
50Hz
100Hz
200Hz
300Hz
500Hz
1kHz
-3dB
7/27/2019 002-121e-07.13
http://slidepdf.com/reader/full/002-121e-0713 65/99
7/27/2019 002-121e-07.13
http://slidepdf.com/reader/full/002-121e-0713 66/99
Charge Meter Type 5015A...
Page 64 5015A_002-121e-07.13
In order to suppress the so called anti alias terms a 5 th order low-pass filter has to be switched on in theinstrument. The cutoff frequency has to be chosen in
accordance with the following table:
Sampling rates fg 0,1 ksps 0,25 ksps 0,5 ksps 1 ksps
<10 Hz<20 Hz<50 Hz
<100 Hz
Depending on baud-rate defines the possible sampling rateaccording the following table:
Data formatMin. baud-
ratebinary
9,6 kbps 0,25 ksps19,2 kbps 0,25 ksps38,4 kbps 0,5 ksps57,6 kbps 0,5 ksps
115,2 kbps 1 ksps
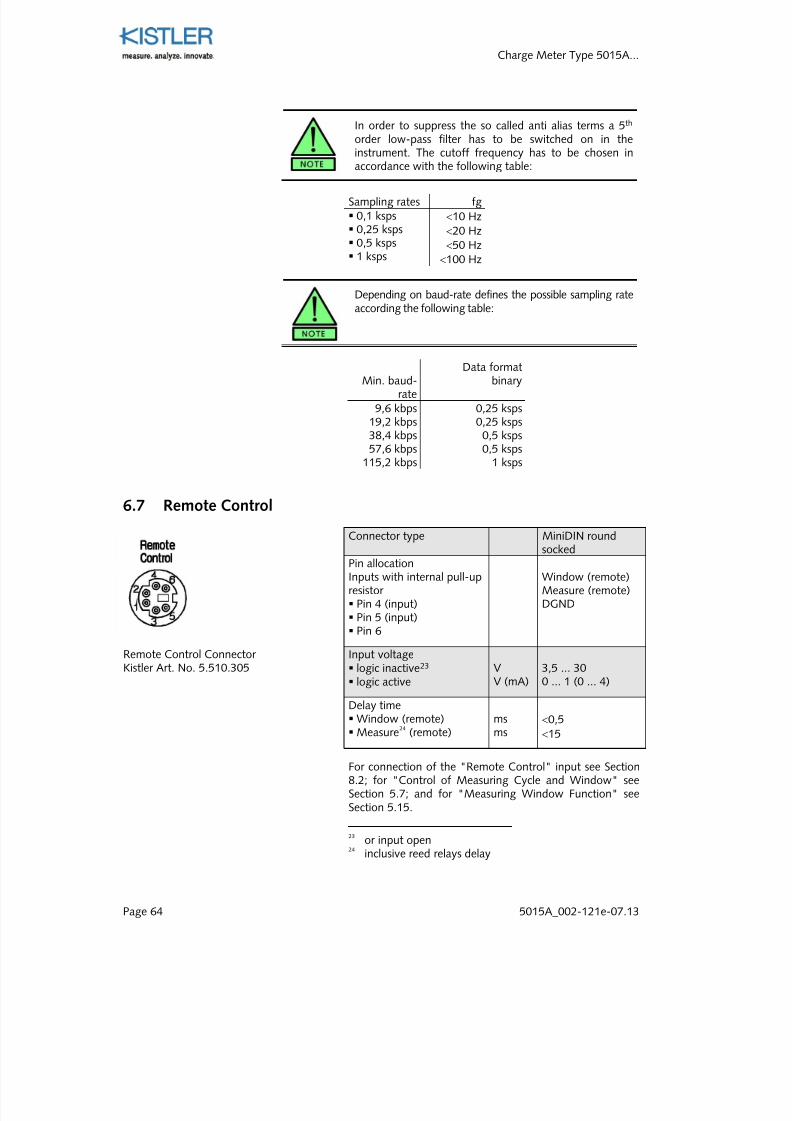
6.7 Remote Control
Connector type MiniDIN roundsocked
Pin allocationInputs with internal pull-upresistor Pin 4 (input) Pin 5 (input) Pin 6
Window (remote)Measure (remote)DGND
Input voltage logic inactive23 logic active
VV (mA)
3,5 ... 300 ... 1 (0 ... 4)
Delay time Window (remote) Measure
24(remote)
msms
<0,5<15
For connection of the "Remote Control" input see Section8.2; for "Control of Measuring Cycle and Window" seeSection 5.7; and for "Measuring Window Function" seeSection 5.15.
23
or input open24inclusive reed relays delay
Remote Control Connector Kistler Art. No. 5.510.305
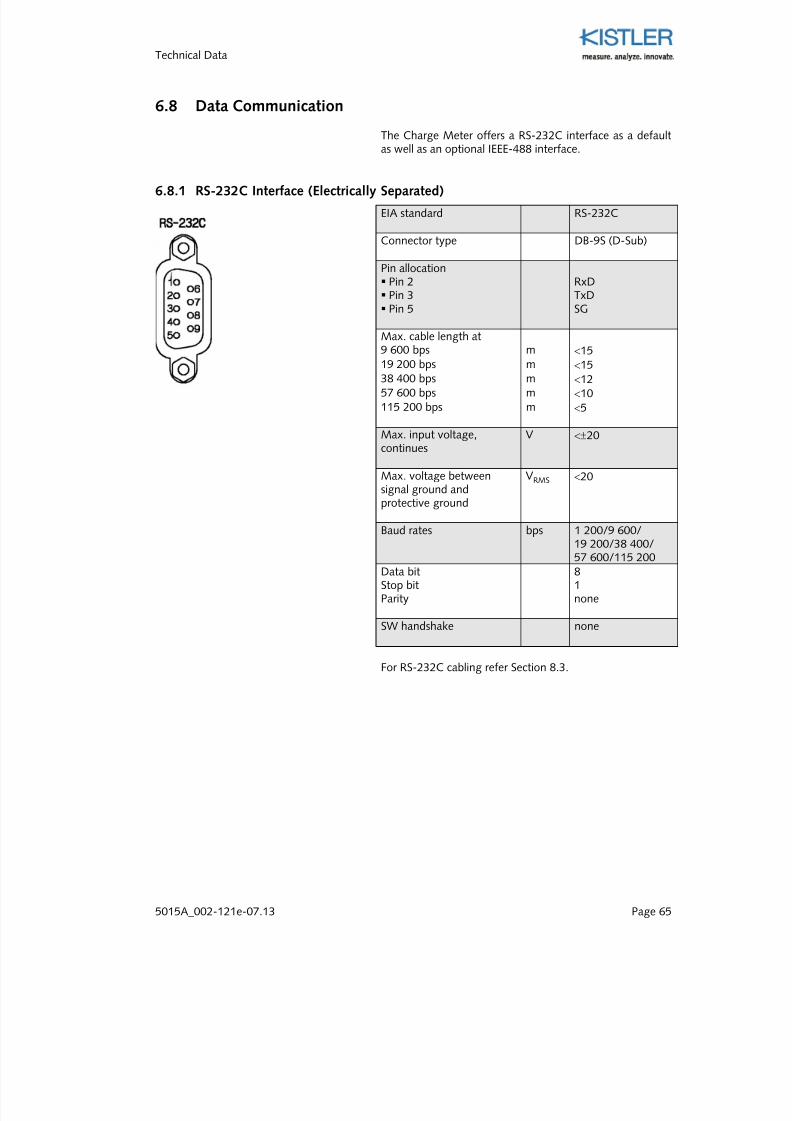
7/27/2019 002-121e-07.13
http://slidepdf.com/reader/full/002-121e-0713 67/99
Technical Data
5015A_002-121e-07.13 Page 65
6.8 Data Communication
The Charge Meter offers a RS-232C interface as a defaultas well as an optional IEEE-488 interface.
6.8.1 RS-232C Interface (Electrically Separated)
EIA standard RS-232C
Connector type DB-9S (D-Sub)
Pin allocation Pin 2 Pin 3 Pin 5
RxDTxDSG
Max. cable length at9 600 bps m <1519 200 bps m <1538 400 bps m <1257 600 bps m <10115 200 bps m <5
Max. input voltage,continues
V <±20
Max. voltage betweensignal ground and
protective ground
VRMS <20
Baud rates bps 1 200/9 600/19 200/38 400/57 600/115 200
Data bitStop bitParity
81none
SW handshake none
For RS-232C cabling refer Section 8.3.
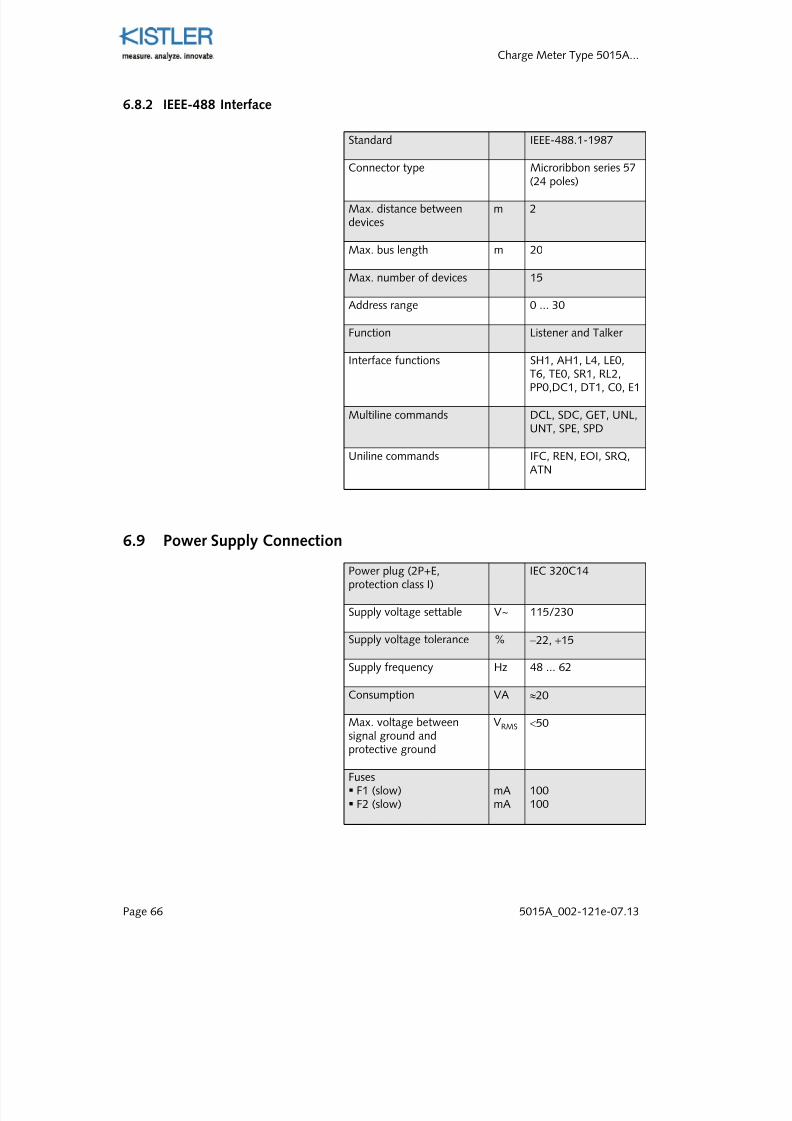
7/27/2019 002-121e-07.13
http://slidepdf.com/reader/full/002-121e-0713 68/99
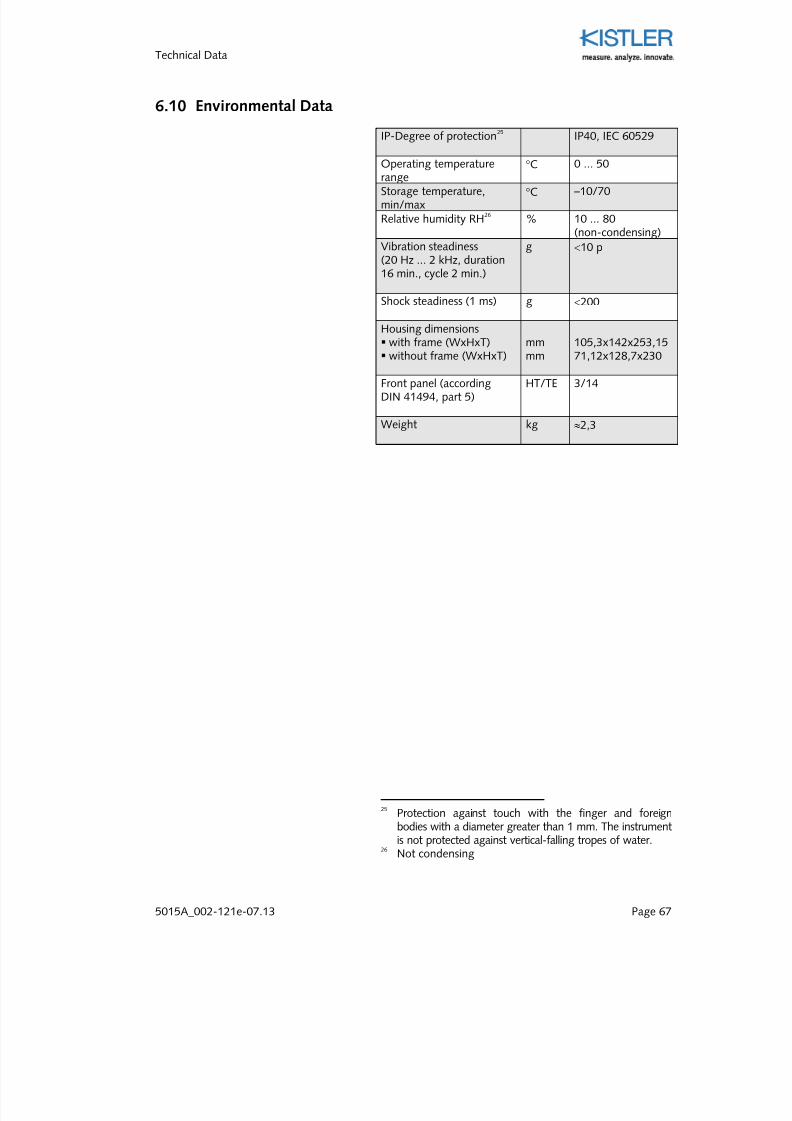
7/27/2019 002-121e-07.13
http://slidepdf.com/reader/full/002-121e-0713 69/99
Technical Data
5015A_002-121e-07.13 Page 67
6.10 Environmental Data
IP-Degree of protection25
IP40, IEC 60529
Operating temperaturerange °C 0 ... 50
Storage temperature,min/max
°C –10/70
Relative humidity RH26
% 10 ... 80(non-condensing)
Vibration steadiness(20 Hz ... 2 kHz, duration16 min., cycle 2 min.)
g <10 p
Shock steadiness (1 ms) g <200
Housing dimensions with frame (WxHxT) without frame (WxHxT)
mmmm
105,3x142x253,1571,12x128,7x230
Front panel (accordingDIN 41494, part 5)
HT/TE 3/14
Weight kg ≈2,3
25Protection against touch with the finger and foreignbodies with a diameter greater than 1 mm. The instrument
is not protected against vertical-falling tropes of water.26Not condensing
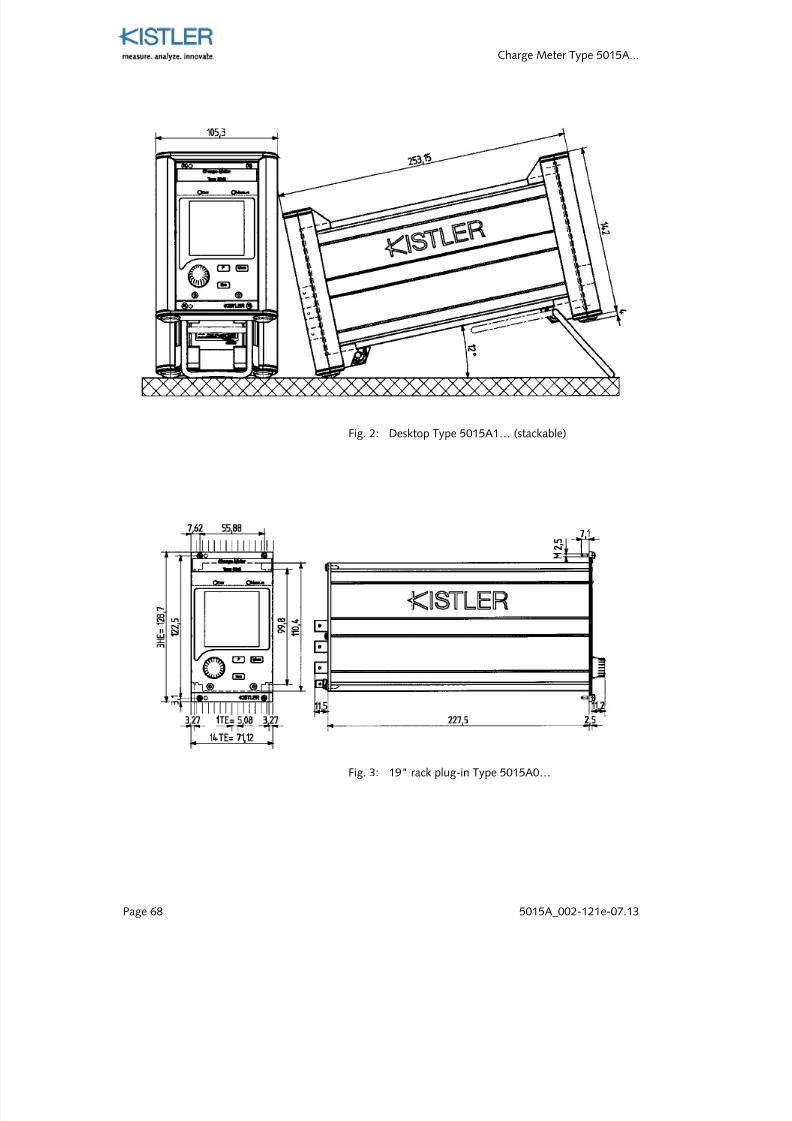
7/27/2019 002-121e-07.13
http://slidepdf.com/reader/full/002-121e-0713 70/99
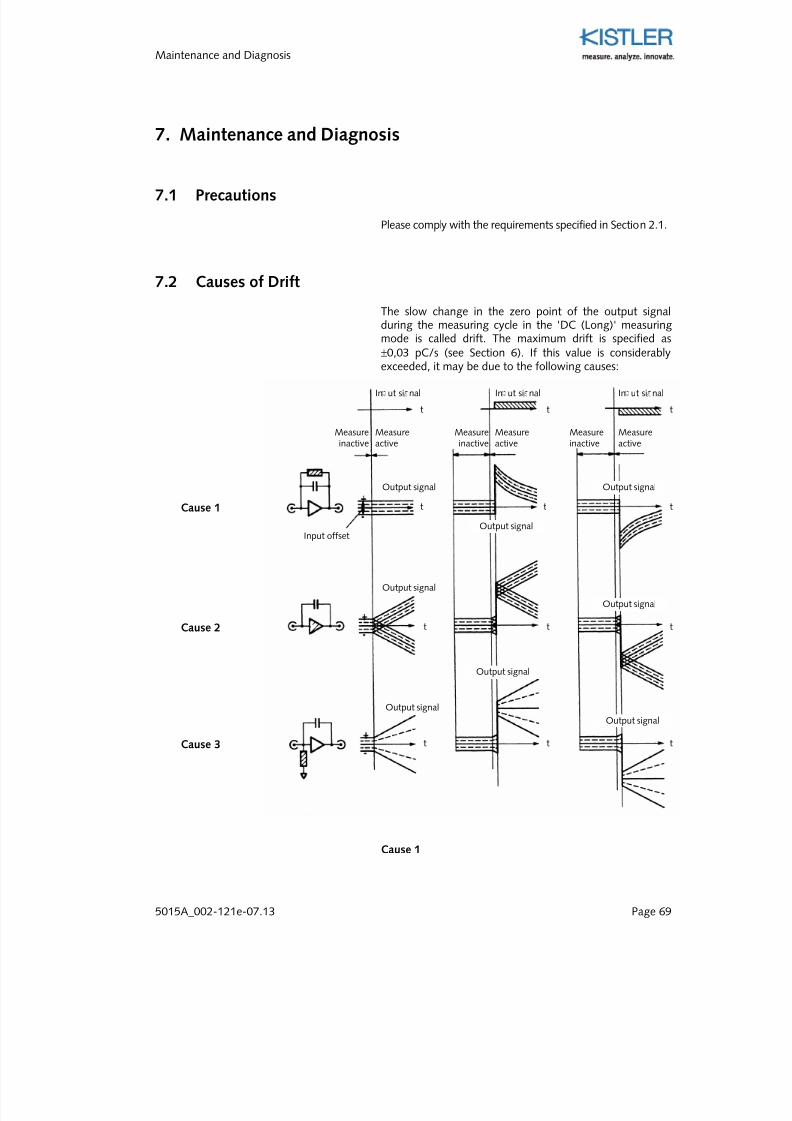
7/27/2019 002-121e-07.13
http://slidepdf.com/reader/full/002-121e-0713 71/99
7/27/2019 002-121e-07.13
http://slidepdf.com/reader/full/002-121e-0713 72/99
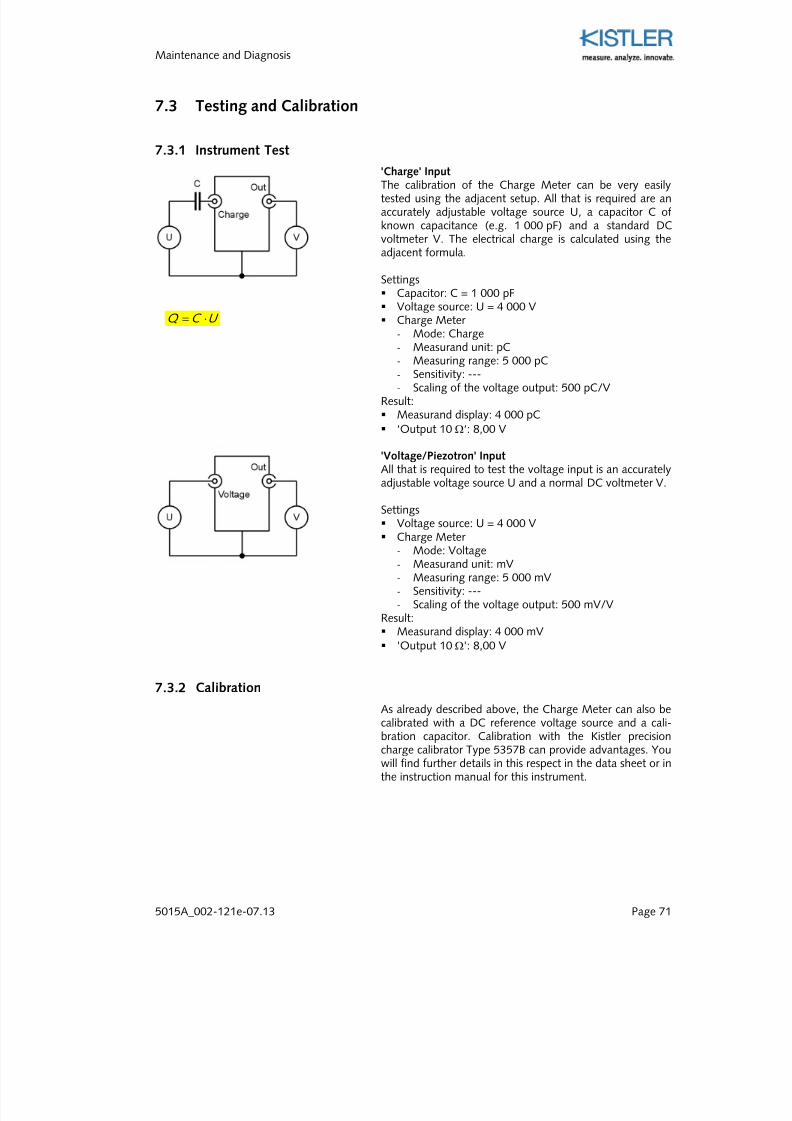
7/27/2019 002-121e-07.13
http://slidepdf.com/reader/full/002-121e-0713 73/99
7/27/2019 002-121e-07.13
http://slidepdf.com/reader/full/002-121e-0713 74/99
Charge Meter Type 5015A...
Page 72 5015A_002-121e-07.13
7.3.3 Kistler Calibration Service
In order to be able to compete on the world market,products must meet the highest quality requirements.ISO9001 requires test instruments to maintain a close and
valid relationship to the accepted national standards.Traceability must be guaranteed. Kistler offers the follow-ing calibration services:
Swiss Calibration Service (SCS)Kistler is accredited as an SCS calibration station (Number 049) for the measurands: pressure, force, acceleration andelectric charge. In order to ensure traceability and provenmeasuring accuracy, calibration devices and methods areregularly checked and updated.
Re-CalibrationOur products can be tested and recalibrated immediately
prior to delivery. All records are archived and are availableto our customers, so that repairs and calibrations can betraced without any omissions.
On Site CalibrationWhere the instruments to be calibrated are not portable,Kistler offers an on-site calibration service.
7.4 Loading New Firmware
The Charge Meter has what is known as a flash loader with which the firmware can, if necessary, be reloaded intothe instrument. This requires a PC and the software withthe firmware data. The most up to date firmware with flashloader can be downloaded at any time from our websitewww.kistler.com.
To install the software, select the Setup.exe file on the diskor in the relevant directory, double click on it and theinstallation process will take place largely automatically.Simply follow the instructions in the dialog.
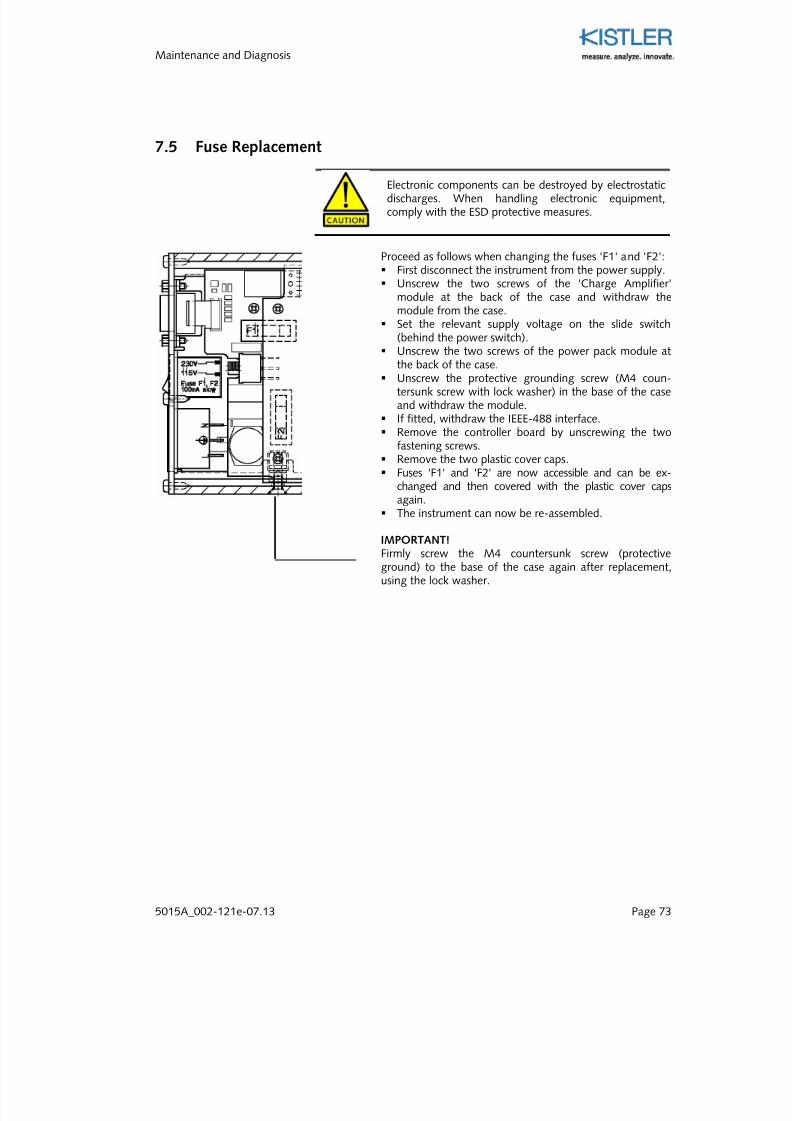
7/27/2019 002-121e-07.13
http://slidepdf.com/reader/full/002-121e-0713 75/99
Maintenance and Diagnosis
5015A_002-121e-07.13 Page 73
7.5 Fuse Replacement
Electronic components can be destroyed by electrostaticdischarges. When handling electronic equipment,comply with the ESD protective measures.
Proceed as follows when changing the fuses 'F1' and 'F2': First disconnect the instrument from the power supply. Unscrew the two screws of the 'Charge Amplifier'
module at the back of the case and withdraw themodule from the case.
Set the relevant supply voltage on the slide switch
(behind the power switch). Unscrew the two screws of the power pack module at
the back of the case. Unscrew the protective grounding screw (M4 coun-
tersunk screw with lock washer) in the base of the caseand withdraw the module.
If fitted, withdraw the IEEE-488 interface. Remove the controller board by unscrewing the two
fastening screws. Remove the two plastic cover caps. Fuses 'F1' and 'F2' are now accessible and can be ex-
changed and then covered with the plastic cover capsagain.
The instrument can now be re-assembled.
IMPORTANT!Firmly screw the M4 countersunk screw (protectiveground) to the base of the case again after replacement,using the lock washer.
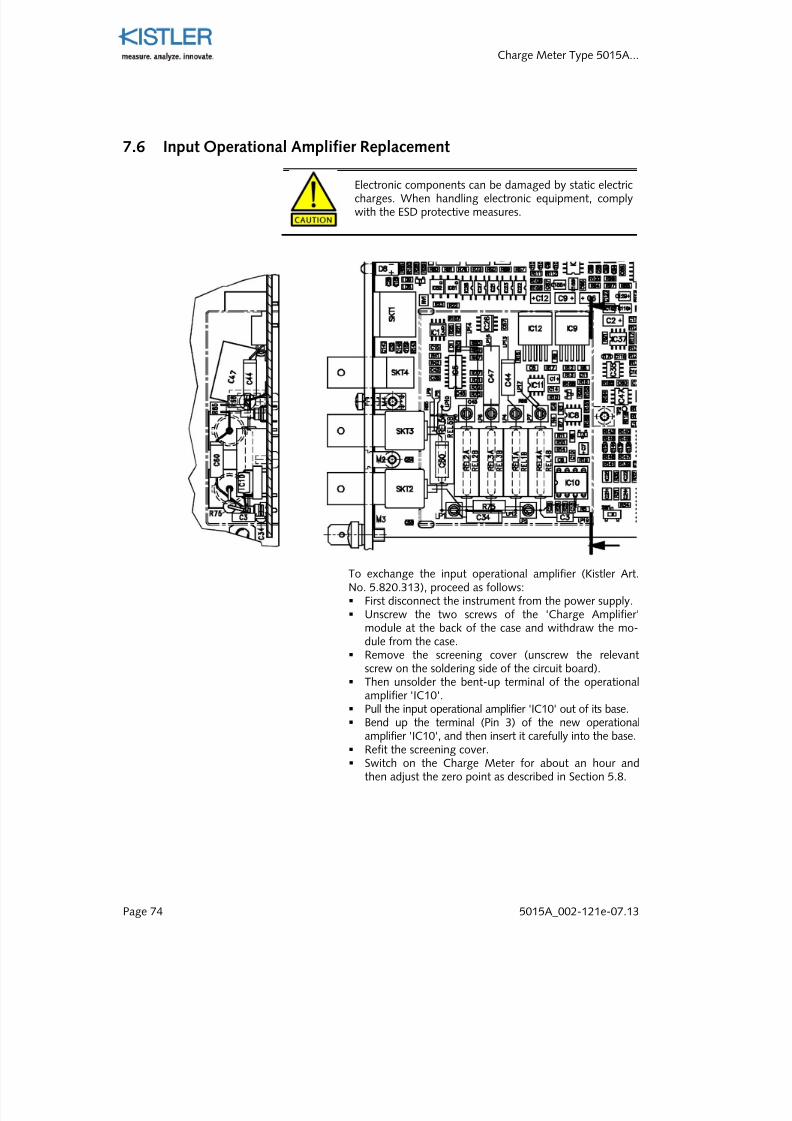
7/27/2019 002-121e-07.13
http://slidepdf.com/reader/full/002-121e-0713 76/99
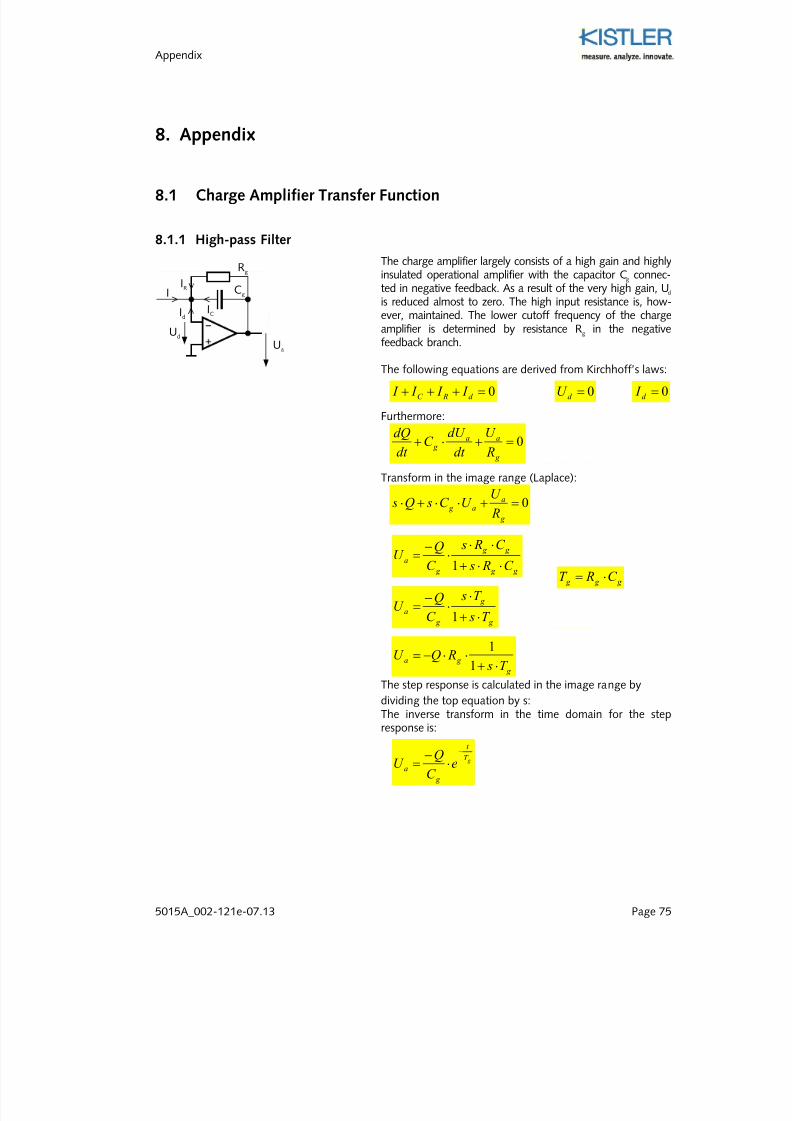
7/27/2019 002-121e-07.13
http://slidepdf.com/reader/full/002-121e-0713 77/99
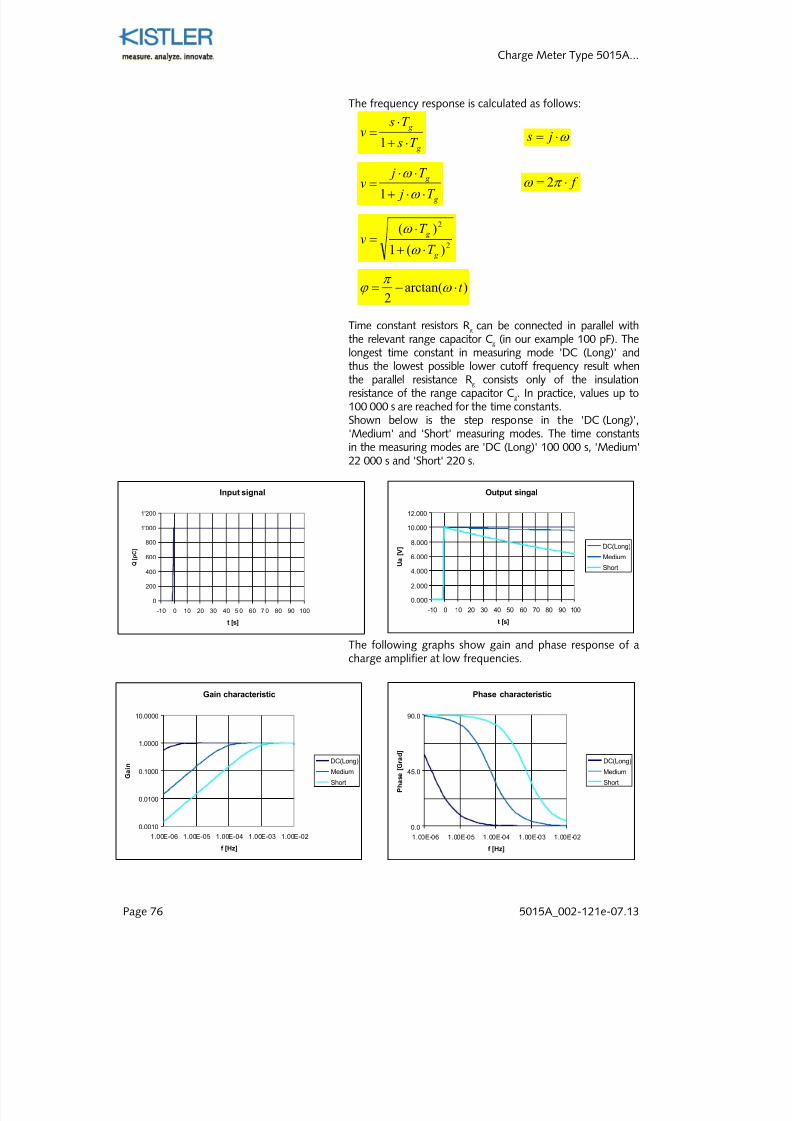
7/27/2019 002-121e-07.13
http://slidepdf.com/reader/full/002-121e-0713 78/99
Charge Meter Type 5015A...
Page 76 5015A_002-121e-07.13
The frequency response is calculated as follows:
Time constant resistors Rg can be connected in parallel with
the relevant range capacitor Cg (in our example 100 pF). Thelongest time constant in measuring mode 'DC (Long)' andthus the lowest possible lower cutoff frequency result whenthe parallel resistance Rg consists only of the insulationresistance of the range capacitor Cg. In practice, values up to100 000 s are reached for the time constants.Shown below is the step response in the 'DC (Long)','Medium' and 'Short' measuring modes. The time constantsin the measuring modes are 'DC (Long)' 100 000 s, 'Medium'22 000 s and 'Short' 220 s.
The following graphs show gain and phase response of acharge amplifier at low frequencies.
g
g
T j
T jv
⋅⋅+
⋅⋅=
ω
ω
1 f ⋅= π ω 2
2
2
)(1
)(
g
g
T
T v
⋅+
⋅=
ω
ω
)arctan(2
t ⋅−= ω π
ϕ
Input signal
0
200
400
600
800
1'000
1'200
-10 0 10 20 30 40 5 0 60 7 0 80 90 100
t [s]
Q [ p C ]
Output singal
0.000
2.000
4.000
6.000
8.000
10.000
12.000
-10 0 10 20 30 40 50 60 70 80 90 100
t [s]
U a [ V ] DC(Long)
Medium
Short
Phase characteristic
0.0
45.0
90.0
1.00E-06 1.00E-05 1.00E-04 1.00E-03 1.00E-02
f [Hz]
P h a s e [ G r a d ]
DC(Long)
Medium
Short
Gain characteristic
0.0010
0.0100
0.1000
1.0000
10.0000
1.00E-06 1.00E-05 1.00E-04 1.00E-03 1.00E-02
f [Hz]
G a i n
DC(Long)
Medium
Short
g
g
T s
T sv
⋅+
⋅=
1 ω ⋅= j s
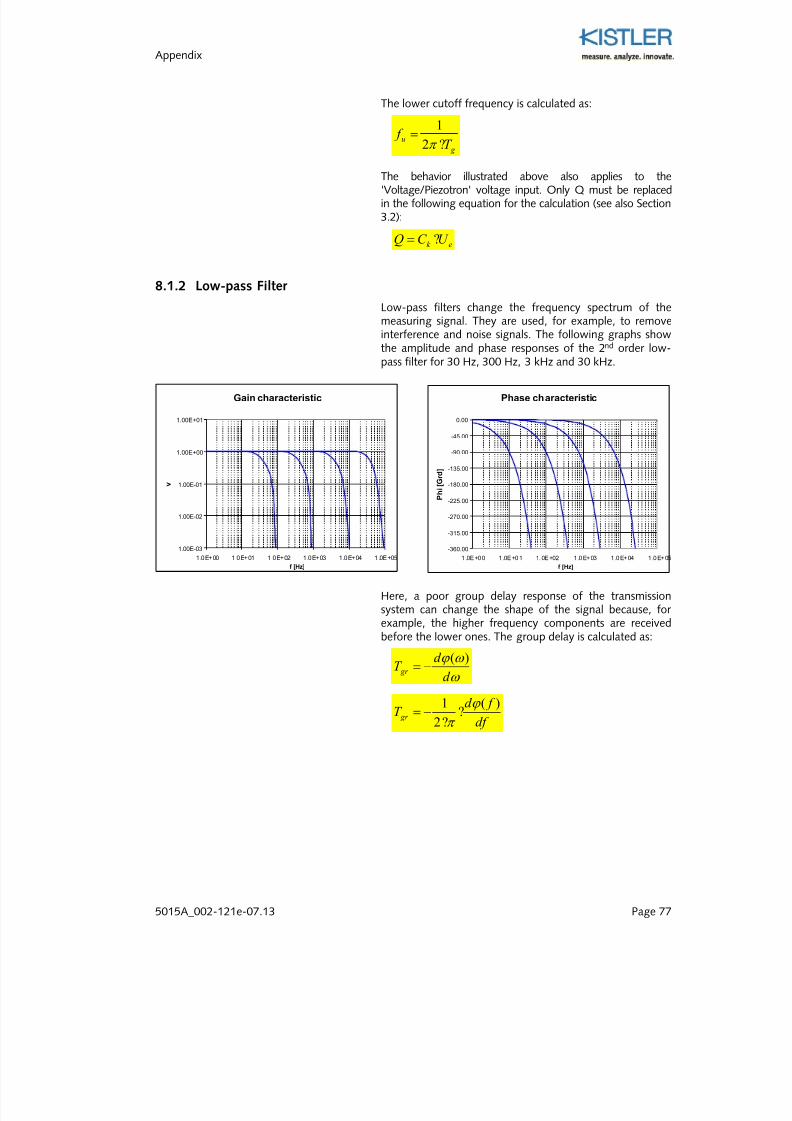
7/27/2019 002-121e-07.13
http://slidepdf.com/reader/full/002-121e-0713 79/99
Appendix
5015A_002-121e-07.13 Page 77
The lower cutoff frequency is calculated as:
The behavior illustrated above also applies to the'Voltage/Piezotron' voltage input. Only Q must be replacedin the following equation for the calculation (see also Section3.2):
8.1.2 Low-pass Filter
Low-pass filters change the frequency spectrum of themeasuring signal. They are used, for example, to remove
interference and noise signals. The following graphs showthe amplitude and phase responses of the 2nd order low-pass filter for 30 Hz, 300 Hz, 3 kHz and 30 kHz.
Here, a poor group delay response of the transmissionsystem can change the shape of the signal because, for example, the higher frequency components are receivedbefore the lower ones. The group delay is calculated as:
ω
ω ϕ
d
d T gr
)(−=
df
f d T gr
)(
2
1 ϕ
π ?
?−=
g
uT
f ?
=π 2
1
ek U C Q ?=
Gain characteristic
1.00E-03
1.00E-02
1.00E-01
1.00E+00
1.00E+01
1.0E+00 1.0E+01 1.0E+02 1.0E+03 1.0E+04 1.0E+05
f [Hz]
v
Phase characteristic
-360.00
-315.00
-270.00
-225.00
-180.00
-135.00
-90.00
-45.00
0.00
1.0E+00 1.0E+01 1.0E+02 1.0E+03 1.0E+04 1.0E+05
f [Hz]
P h i [ G r d ]
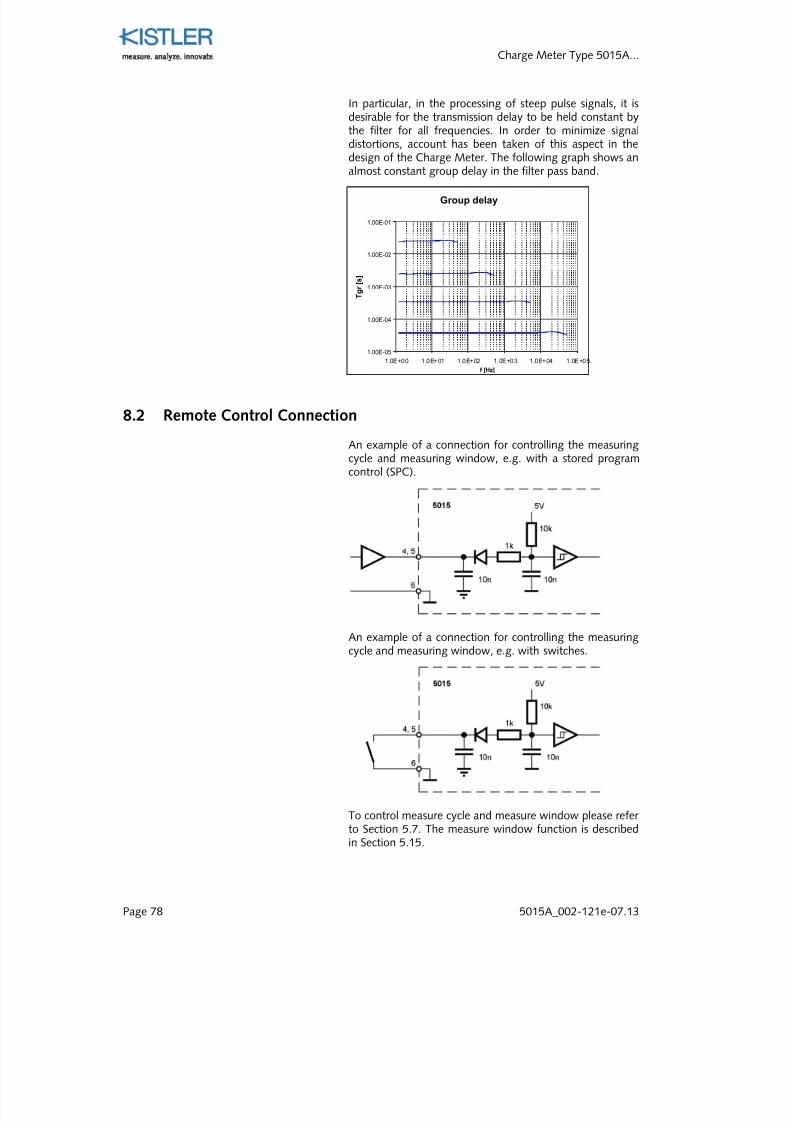
7/27/2019 002-121e-07.13
http://slidepdf.com/reader/full/002-121e-0713 80/99
Charge Meter Type 5015A...
Page 78 5015A_002-121e-07.13
In particular, in the processing of steep pulse signals, it isdesirable for the transmission delay to be held constant bythe filter for all frequencies. In order to minimize signaldistortions, account has been taken of this aspect in thedesign of the Charge Meter. The following graph shows an
almost constant group delay in the filter pass band.
8.2 Remote Control Connection
An example of a connection for controlling the measuringcycle and measuring window, e.g. with a stored programcontrol (SPC).
An example of a connection for controlling the measuringcycle and measuring window, e.g. with switches.
To control measure cycle and measure window please refer to Section 5.7. The measure window function is described
in Section 5.15.
Group delay
1.00E-05
1.00E-04
1.00E-03
1.00E-02
1.00E-01
1.0E+00 1.0E+01 1.0E+02 1.0E+03 1.0E+04 1.0E+05
f [Hz]
T g r [ s ]
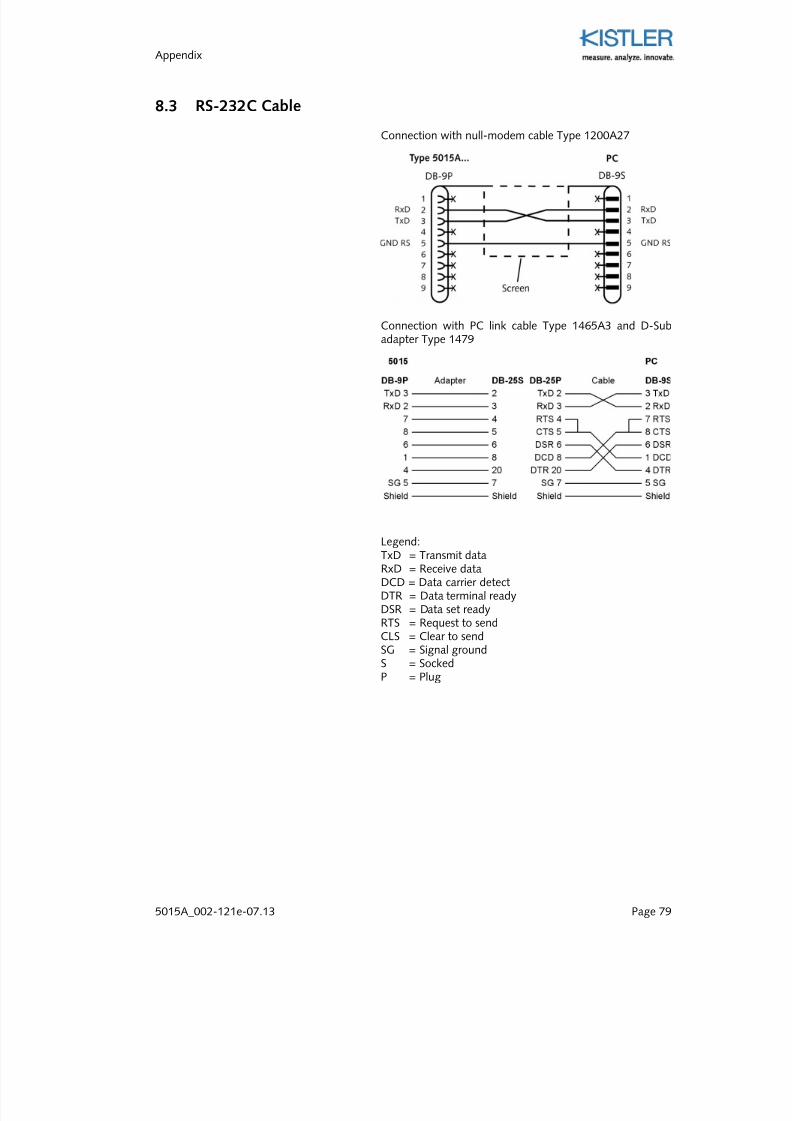
7/27/2019 002-121e-07.13
http://slidepdf.com/reader/full/002-121e-0713 81/99
7/27/2019 002-121e-07.13
http://slidepdf.com/reader/full/002-121e-0713 82/99
Charge Meter Type 5015A...
Page 80 5015A_002-121e-07.13
8.4 LabView® Driver
The program package LabVIEW from National Instrumentsis a well-known graphic programming environment, whichprovides a simple method of creating the widest variety ofapplications and automatic measuring processes. TheLabVIEW driver described below allows operation of thecharge meter Type 5015A... in this environment as a virtualinstrument (VI). The compiled version can be operated as astand-alone PC operating program.
Interfaces Supported for Communication with the ChargeMeter
RS-232C serial interfacePort: COM 1...12Baud rates: 1 200, 9 600, 19 200, 38 400,
57 600, 115 200Cable recommended: Null modem cable Type 1200A27
IEEE-488 (GPIB) parallel interface, cards recommended:
Card Type Bus Manufacturer PCI-GPIBPCMCIA-GPIB
GPIB-PCΙΙ/ΙΙA
PCIPCMCIAISA-8
National InstrumentsNational InstrumentsNational Instruments (not for Windows NT/2000)
AT-GPIB/TNT ISA-16 National InstrumentsAT-GPIB/TNT PnP ISA-16 National InstrumentsKPC 488.2 ISA-8 CEC/KeithleyKPCI 488 PCI CEC/Keithley
Please comply with the manufacturer's installation instruc-tions. Cable according to the IEEE-488 standard.
8.4.1 VI – Virtual Instrument for Charge Meter Type 5015A...
General Configuration of a VI Driver
Front panel represents the user interface on the PC. All control anddisplay elements of the unit are displayed. Control isinteractive. Measurands are displayed on the screenimmediately.
Block diagram contains the graphic source code of the VI with whichthe functionality and the communication with the unitis established. Every control and display element has aconnection in the block diagram.
Icon and connection field
identifies the VI so that it can be used with other VIs.
7/27/2019 002-121e-07.13
http://slidepdf.com/reader/full/002-121e-0713 83/99
Appendix
5015A_002-121e-07.13 Page 81
Requirements for operating the LabVIEW driver 5015_V1-33.llb with
RS-232C
LabView from National Instruments, Version 6.0.2 Serial interface COM 1…12
IEEE-488 LabView from National Instruments, Version 6.0.2 IEEE-488 PC-card, bus standard ISA or PCI
Operation with additional DAQ-cardThe sampling rate of the continuous data transfer via theRS-232C interface is limited to 1 kHz. Very much higher sampling rates can be obtained by using the analogvoltage output and a data acquisition card in the PC.
Requirement: LabVIEW from National Instruments RS-232C or IEEE-488 interface DAQ-card, bus standard ISA or PCI with LabView
instrument driver.
Functions not Supported
Allocation of the function key Statistical functions Signal evaluation
Xpp, Xmax-Xref, Xmin-Xref, X-Xref
Reading back unit settings into the PC High-pass filter (digital), adjustable as
Cut-off frequency –3 dB, –10 %, –5 %, –1 %or Time constant 0,01 s, 0,1 s, 1 s, 10 s, 100 s
Operation with additional DAQ-card
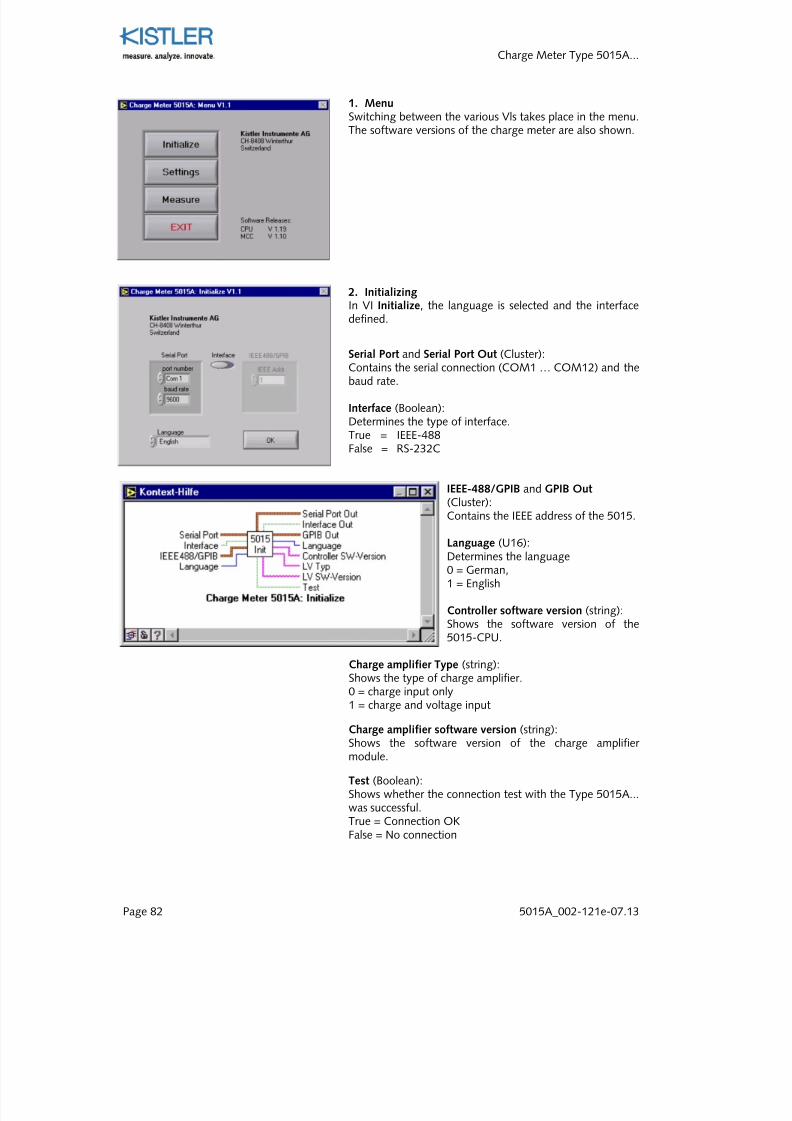
7/27/2019 002-121e-07.13
http://slidepdf.com/reader/full/002-121e-0713 84/99
Charge Meter Type 5015A...
Page 82 5015A_002-121e-07.13
1. MenuSwitching between the various Vls takes place in the menu.The software versions of the charge meter are also shown.
2. InitializingIn VI Initialize, the language is selected and the interfacedefined.
Serial Port and Serial Port Out (Cluster):Contains the serial connection (COM1 … COM12) and thebaud rate.
Interface (Boolean):Determines the type of interface.True = IEEE-488False = RS-232C
IEEE-488/GPIB and GPIB Out
(Cluster):Contains the IEEE address of the 5015.
Language (U16):Determines the language0 = German,1 = English
Controller software version (string):Shows the software version of the5015-CPU.
Charge amplifier Type (string):
Shows the type of charge amplifier.0 = charge input only1 = charge and voltage input
Charge amplifier software version (string):Shows the software version of the charge amplifier module.
Test (Boolean):Shows whether the connection test with the Type 5015A...was successful.True = Connection OKFalse = No connection
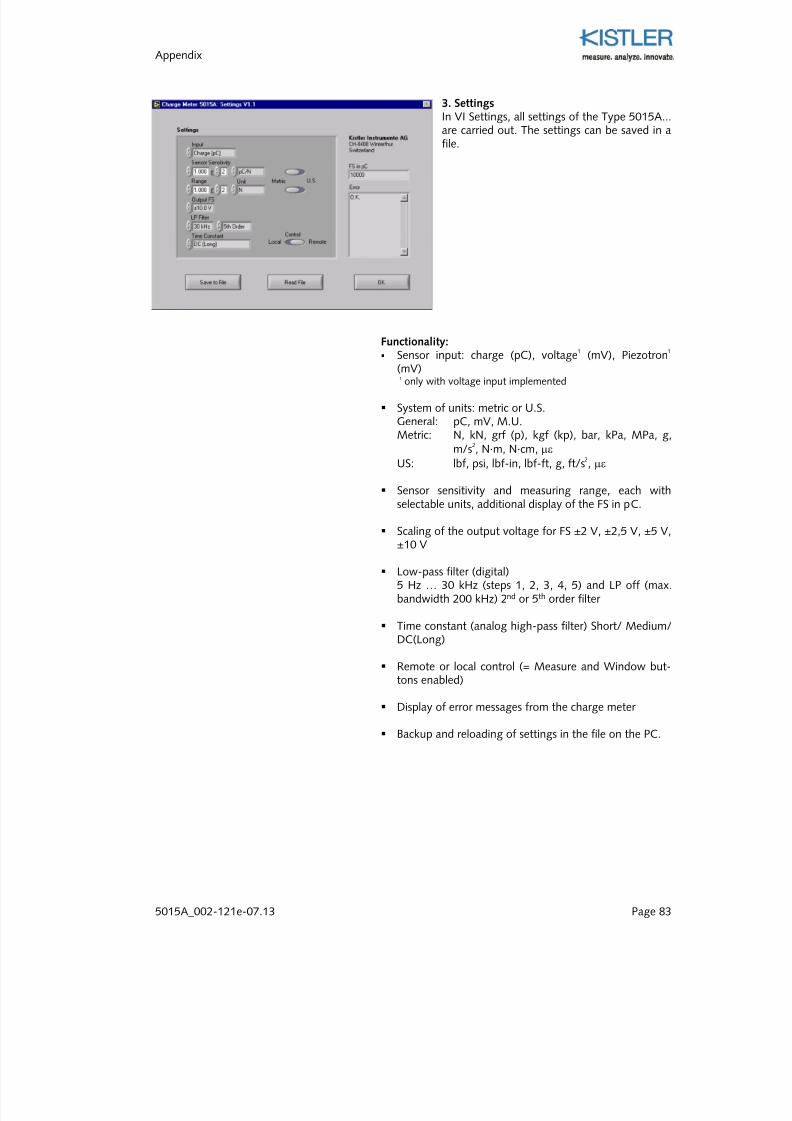
7/27/2019 002-121e-07.13
http://slidepdf.com/reader/full/002-121e-0713 85/99
Appendix
5015A_002-121e-07.13 Page 83
3. SettingsIn VI Settings, all settings of the Type 5015A...are carried out. The settings can be saved in afile.
Functionality: Sensor input: charge (pC), voltage
1(mV), Piezotron
1
(mV) 1 only with voltage input implemented
System of units: metric or U.S.General: pC, mV, M.U.Metric: N, kN, grf (p), kgf (kp), bar, kPa, MPa, g,
m/s2, N·m, N·cm, µε
US: lbf, psi, lbf-in, lbf-ft, g, ft/s2, µε
Sensor sensitivity and measuring range, each with
selectable units, additional display of the FS in pC.
Scaling of the output voltage for FS ±2 V, ±2,5 V, ±5 V,±10 V
Low-pass filter (digital)5 Hz … 30 kHz (steps 1, 2, 3, 4, 5) and LP off (max.bandwidth 200 kHz) 2nd or 5th order filter
Time constant (analog high-pass filter) Short/ Medium/DC(Long)
Remote or local control (= Measure and Window but-tons enabled)
Display of error messages from the charge meter
Backup and reloading of settings in the file on the PC.
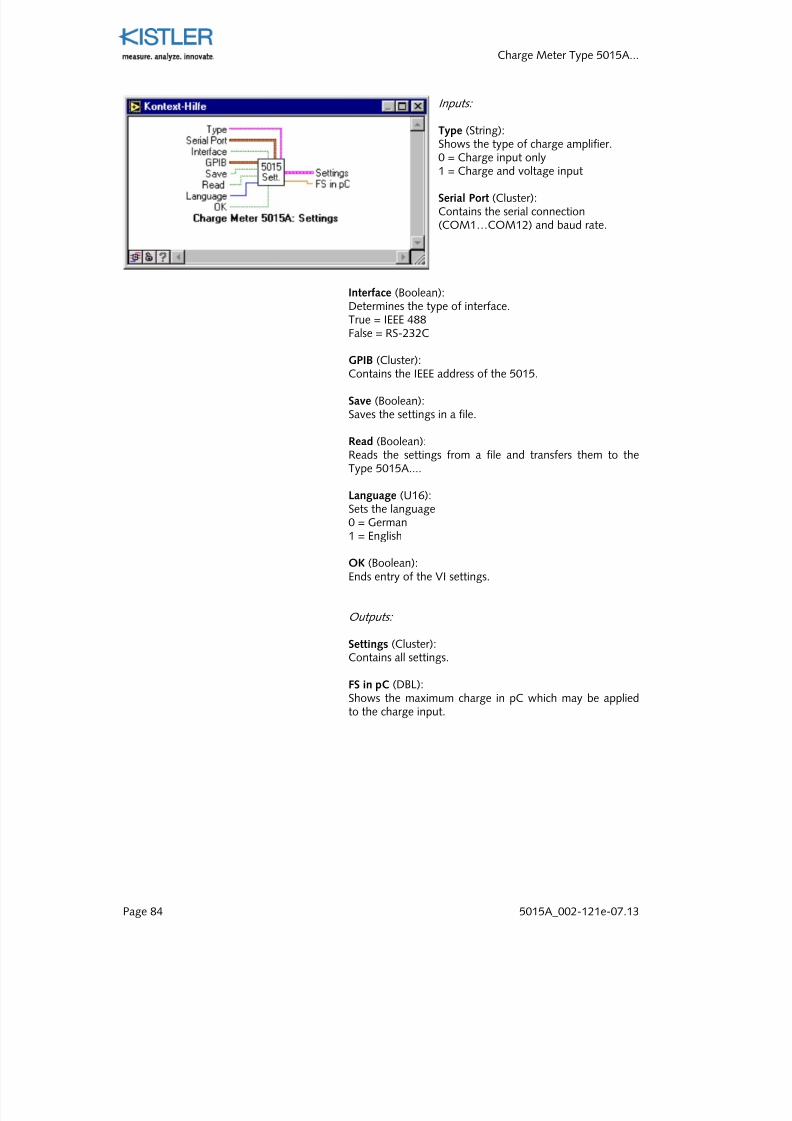
7/27/2019 002-121e-07.13
http://slidepdf.com/reader/full/002-121e-0713 86/99
Charge Meter Type 5015A...
Page 84 5015A_002-121e-07.13
Inputs:
Type (String):Shows the type of charge amplifier.0 = Charge input only
1 = Charge and voltage input
Serial Port (Cluster):Contains the serial connection(COM1…COM12) and baud rate.
Interface (Boolean):Determines the type of interface.True = IEEE 488
False = RS-232C
GPIB (Cluster):Contains the IEEE address of the 5015.
Save (Boolean):Saves the settings in a file.
Read (Boolean):Reads the settings from a file and transfers them to theType 5015A....
Language (U16):
Sets the language0 = German1 = English
OK (Boolean):Ends entry of the VI settings.
Outputs:
Settings (Cluster):Contains all settings.
FS in pC (DBL):Shows the maximum charge in pC which may be appliedto the charge input.
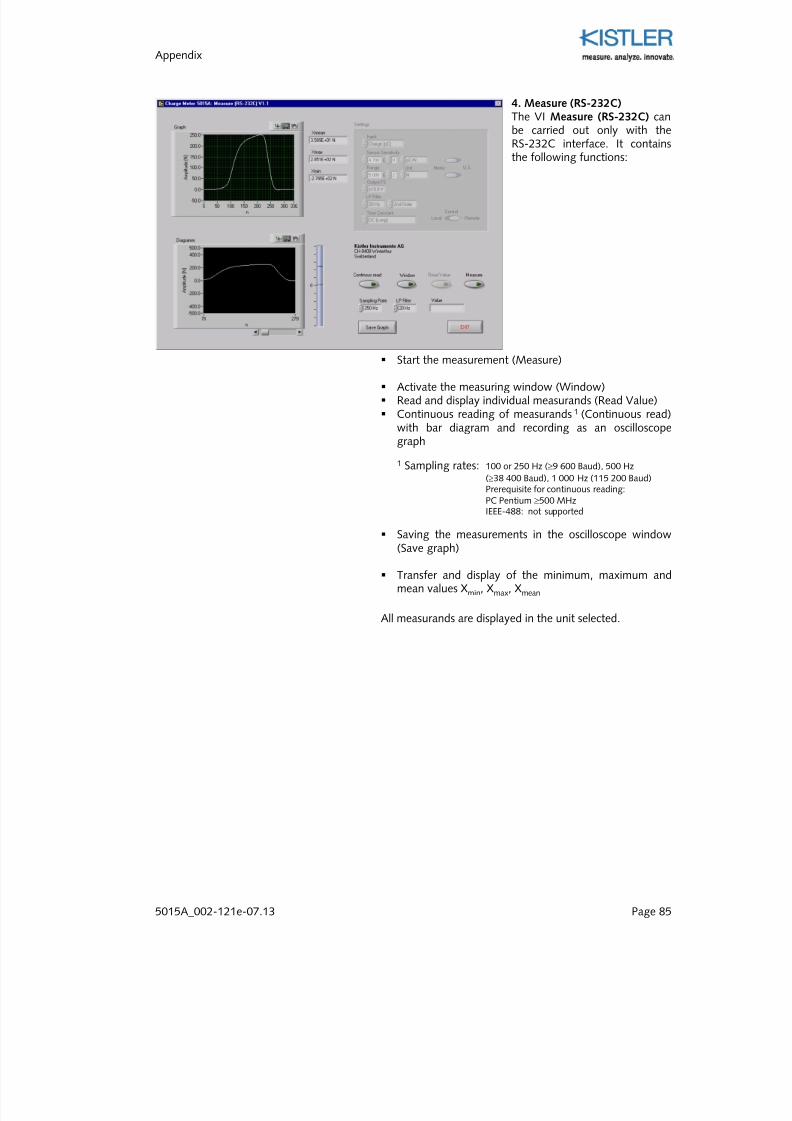
7/27/2019 002-121e-07.13
http://slidepdf.com/reader/full/002-121e-0713 87/99
Appendix
5015A_002-121e-07.13 Page 85
4. Measure (RS-232C)The VI Measure (RS-232C) canbe carried out only with theRS-232C interface. It containsthe following functions:
Start the measurement (Measure)
Activate the measuring window (Window) Read and display individual measurands (Read Value) Continuous reading of measurands 1 (Continuous read)
with bar diagram and recording as an oscilloscopegraph
1 Sampling rates: 100 or 250 Hz (≥9 600 Baud), 500 Hz
(≥38 400 Baud), 1 000 Hz (115 200 Baud)Prerequisite for continuous reading:PC Pentium ≥500 MHzIEEE-488: not supported
Saving the measurements in the oscilloscope window(Save graph)
Transfer and display of the minimum, maximum andmean values Xmin, Xmax, Xmean
All measurands are displayed in the unit selected.
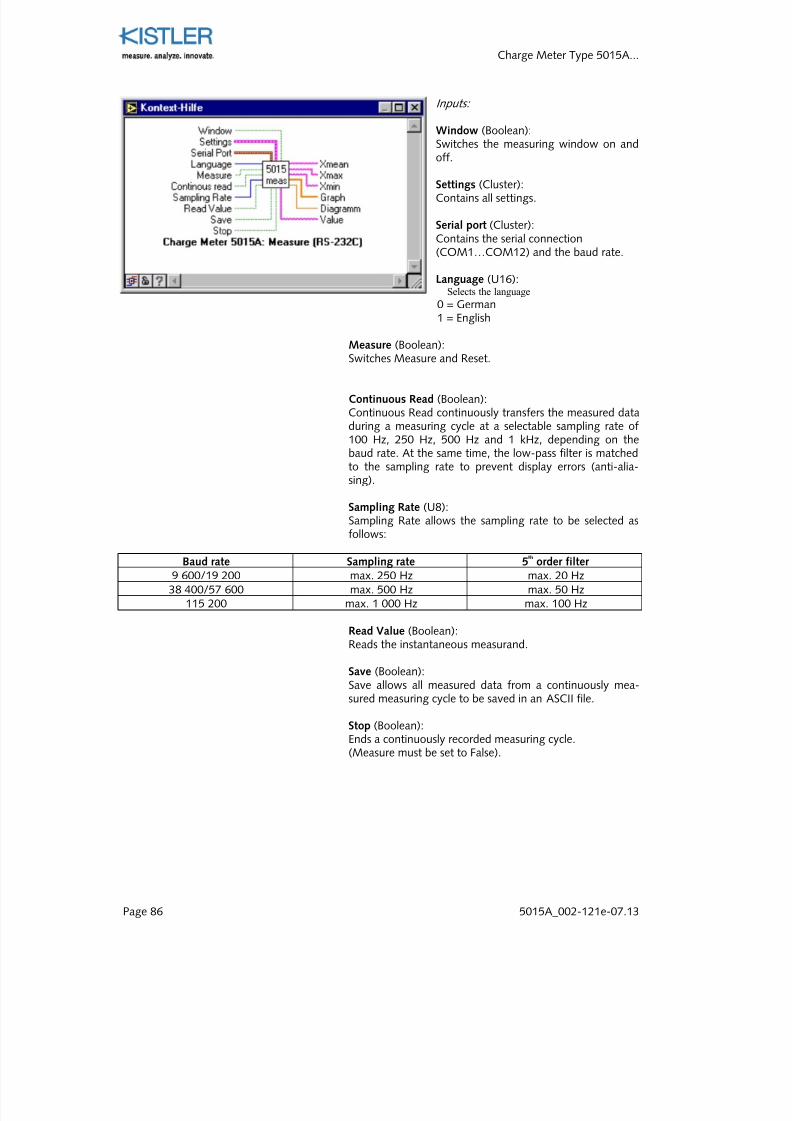
7/27/2019 002-121e-07.13
http://slidepdf.com/reader/full/002-121e-0713 88/99
Charge Meter Type 5015A...
Page 86 5015A_002-121e-07.13
Inputs:
Window (Boolean):Switches the measuring window on andoff.
Settings (Cluster):Contains all settings.
Serial port (Cluster):Contains the serial connection(COM1…COM12) and the baud rate.
Language (U16):Selects the language
0 = German1 = English
Measure (Boolean):Switches Measure and Reset.
Continuous Read (Boolean):Continuous Read continuously transfers the measured dataduring a measuring cycle at a selectable sampling rate of100 Hz, 250 Hz, 500 Hz and 1 kHz, depending on thebaud rate. At the same time, the low-pass filter is matchedto the sampling rate to prevent display errors (anti-alia-sing).
Sampling Rate (U8):Sampling Rate allows the sampling rate to be selected asfollows:
Baud rate Sampling rate 5th
order filter 9 600/19 200 max. 250 Hz max. 20 Hz38 400/57 600 max. 500 Hz max. 50 Hz
115 200 max. 1 000 Hz max. 100 Hz
Read Value (Boolean):Reads the instantaneous measurand.
Save (Boolean):Save allows all measured data from a continuously mea-sured measuring cycle to be saved in an ASCII file.
Stop (Boolean):Ends a continuously recorded measuring cycle.(Measure must be set to False).
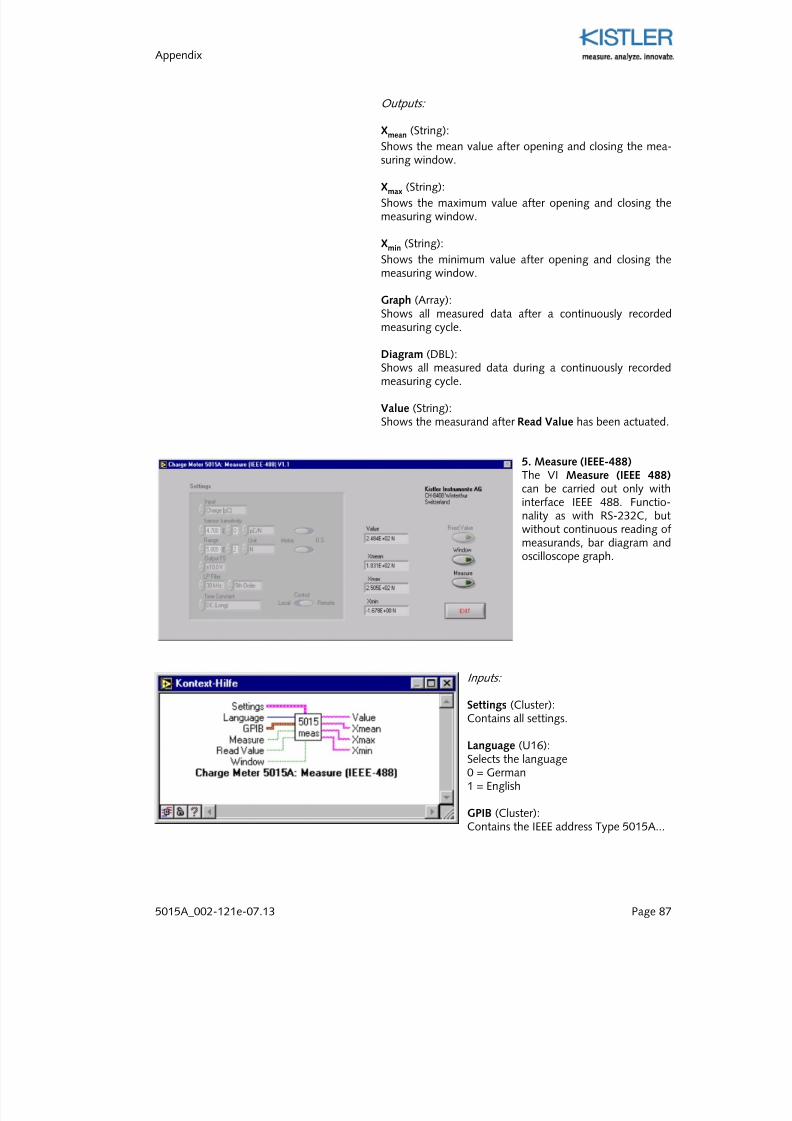
7/27/2019 002-121e-07.13
http://slidepdf.com/reader/full/002-121e-0713 89/99
Appendix
5015A_002-121e-07.13 Page 87
Outputs:
Xmean (String):
Shows the mean value after opening and closing the mea-suring window.
Xmax (String):
Shows the maximum value after opening and closing themeasuring window.
Xmin (String):
Shows the minimum value after opening and closing themeasuring window.
Graph (Array):Shows all measured data after a continuously recordedmeasuring cycle.
Diagram (DBL):Shows all measured data during a continuously recordedmeasuring cycle.
Value (String):Shows the measurand after Read Value has been actuated.
5. Measure (IEEE-488)The VI Measure (IEEE 488) can be carried out only with
interface IEEE 488. Functio-nality as with RS-232C, butwithout continuous reading ofmeasurands, bar diagram andoscilloscope graph.
Inputs:
Settings (Cluster):Contains all settings.
Language (U16):Selects the language0 = German1 = English
GPIB (Cluster):Contains the IEEE address Type 5015A...
7/27/2019 002-121e-07.13
http://slidepdf.com/reader/full/002-121e-0713 90/99
Charge Meter Type 5015A...
Page 88 5015A_002-121e-07.13
Measure (Boolean):Switches Measure and Reset.
Read Value (Boolean):Reads the instantaneous measurand.
Window (Boolean):Switches the measuring window on and off.
Output:
Value (String):Shows the measurand after actuation of Read Value.
Xmean (String):
Shows the mean value after opening and closing the
measuring window.
Xmax (String):
Shows the maximum value after opening and closing themeasuring window.
Xmin (String):
Shows the minimum value after opening and closing themeasuring window.
8.4.2 PC Control Software
The compiled version of the VI driver can be operated asa standalone PC control software. Operation requires a PCwith Microsoft Windows® (NT, XP, Vista, 7). The minimumconfiguration required must be taken from the specifica-tions for operating the LabVIEW software package.Because the PC software is a compiled LabVIEW version,the same conditions apply.
Windows® is a registered trademark of Microsoft Corporation.
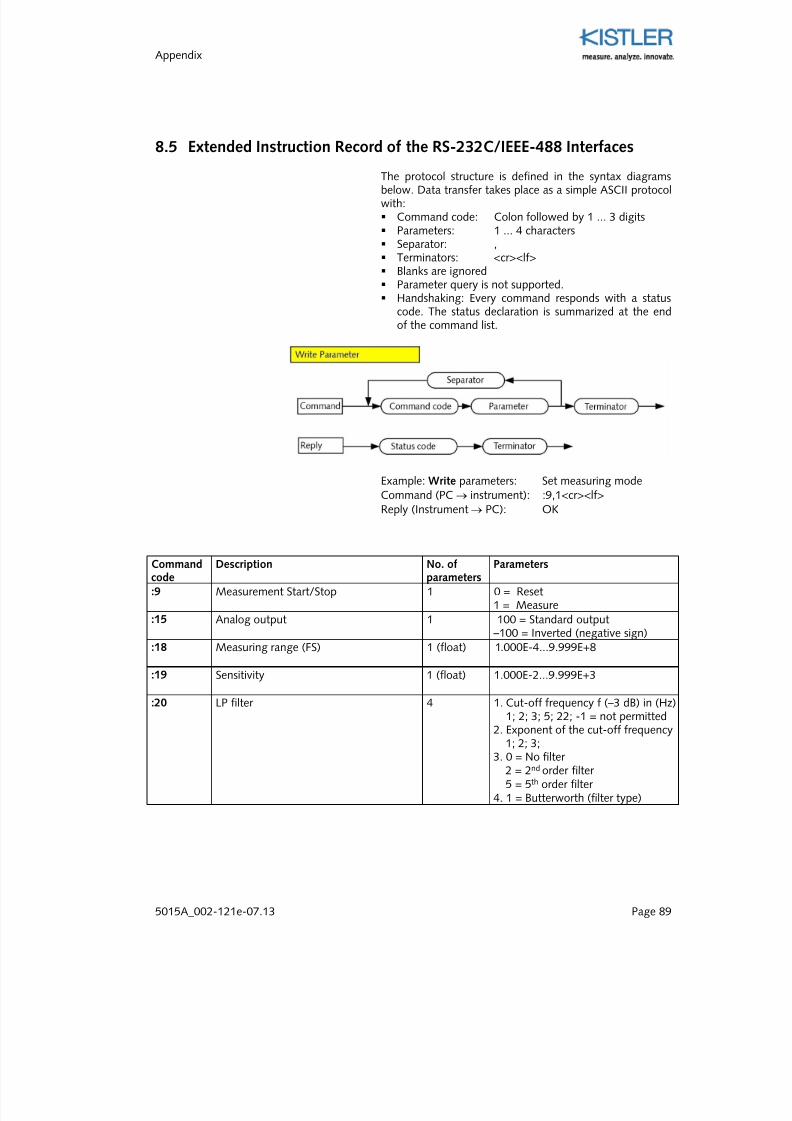
7/27/2019 002-121e-07.13
http://slidepdf.com/reader/full/002-121e-0713 91/99
Appendix
5015A_002-121e-07.13 Page 89
8.5 Extended Instruction Record of the RS-232C/IEEE-488 Interfaces
The protocol structure is defined in the syntax diagramsbelow. Data transfer takes place as a simple ASCII protocolwith: Command code: Colon followed by 1 ... 3 digits Parameters: 1 ... 4 characters Separator: , Terminators: <cr><lf> Blanks are ignored Parameter query is not supported. Handshaking: Every command responds with a status
code. The status declaration is summarized at the endof the command list.
Example: Write parameters: Set measuring modeCommand (PC → instrument): :9,1<cr><lf>
Reply (Instrument → PC): OK
Commandcode
Description No. ofparameters
Parameters
:9 Measurement Start/Stop 1 0 = Reset1 = Measure
:15 Analog output 1 100 = Standard output–100 = Inverted (negative sign)
:18 Measuring range (FS) 1 (float) 1.000E-4...9.999E+8
:19 Sensitivity 1 (float) 1.000E-2...9.999E+3
:20 LP filter 4 1. Cut-off frequency f (–3 dB) in (Hz)1; 2; 3; 5; 22; -1 = not permitted
2. Exponent of the cut-off frequency1; 2; 3;
3. 0 = No filter 2 = 2nd order filter 5 = 5th order filter
4. 1 = Butterworth (filter type)
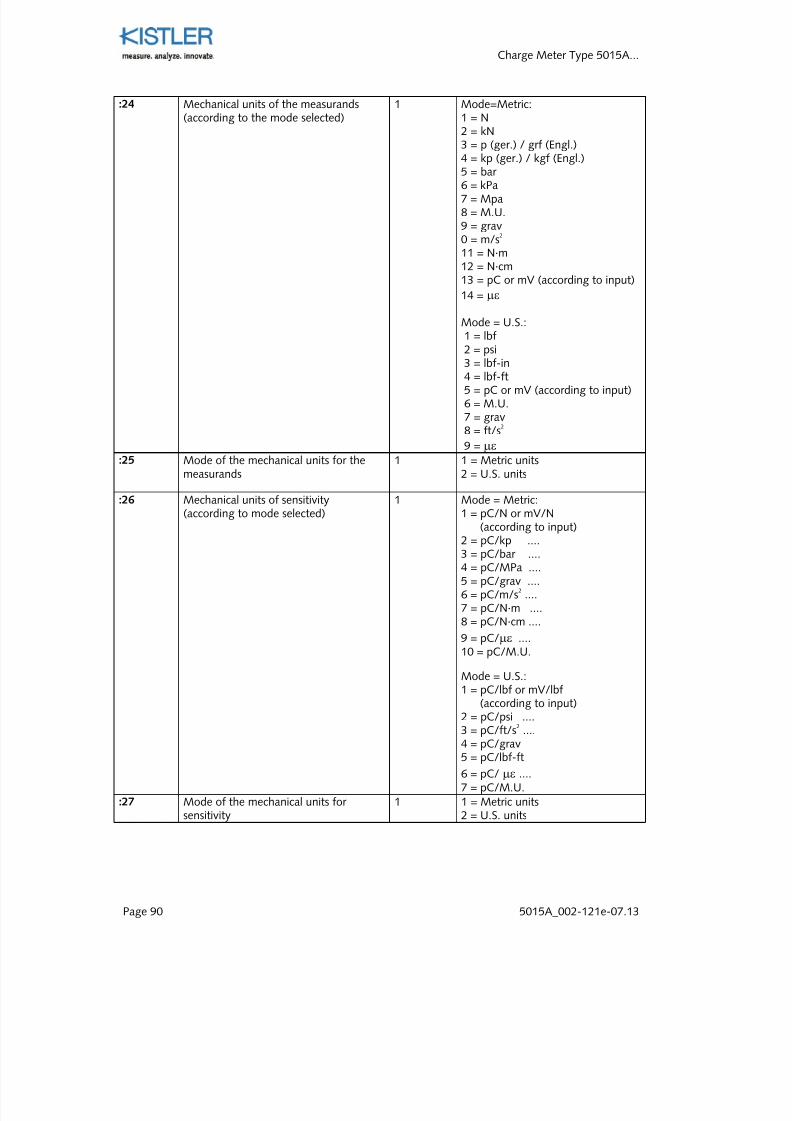
7/27/2019 002-121e-07.13
http://slidepdf.com/reader/full/002-121e-0713 92/99
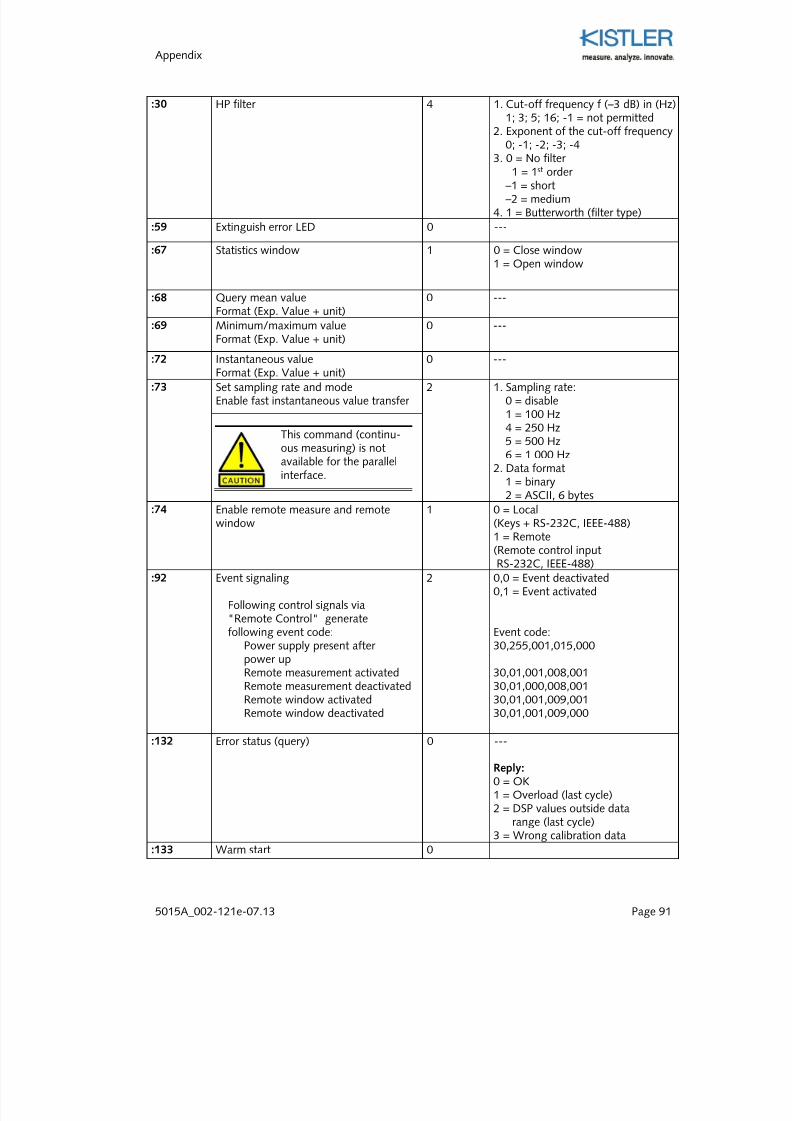
7/27/2019 002-121e-07.13
http://slidepdf.com/reader/full/002-121e-0713 93/99
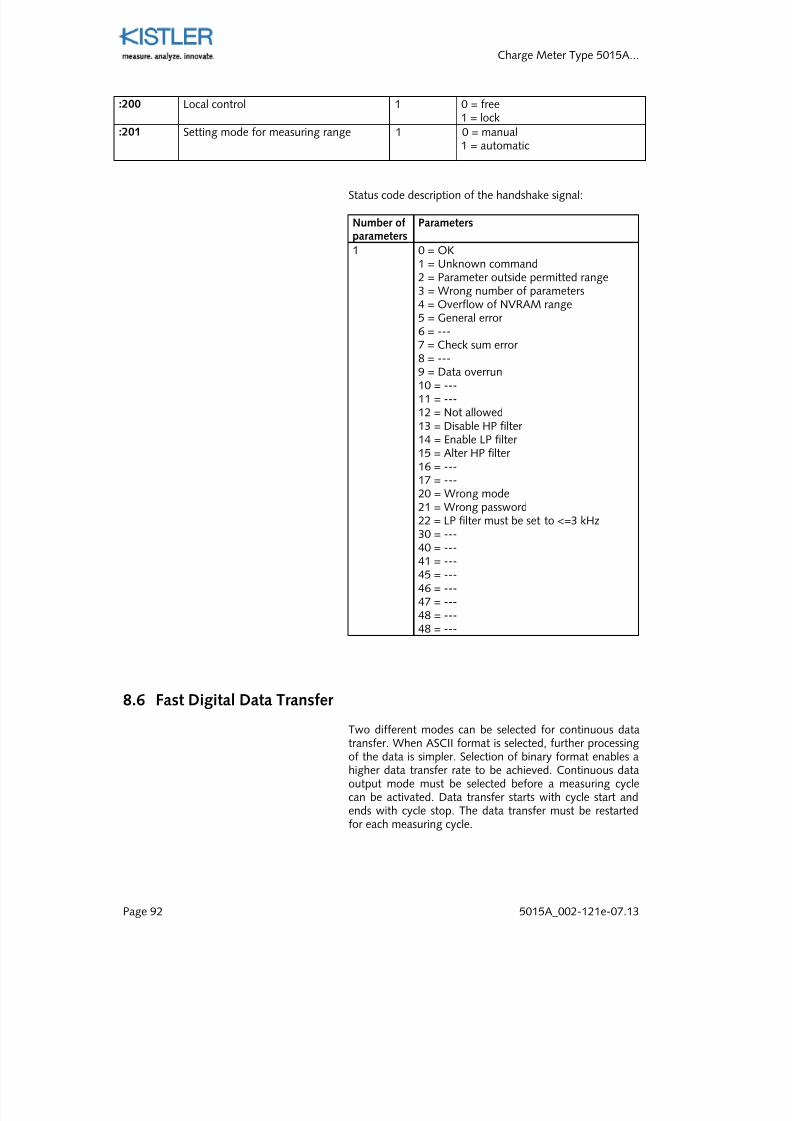
7/27/2019 002-121e-07.13
http://slidepdf.com/reader/full/002-121e-0713 94/99
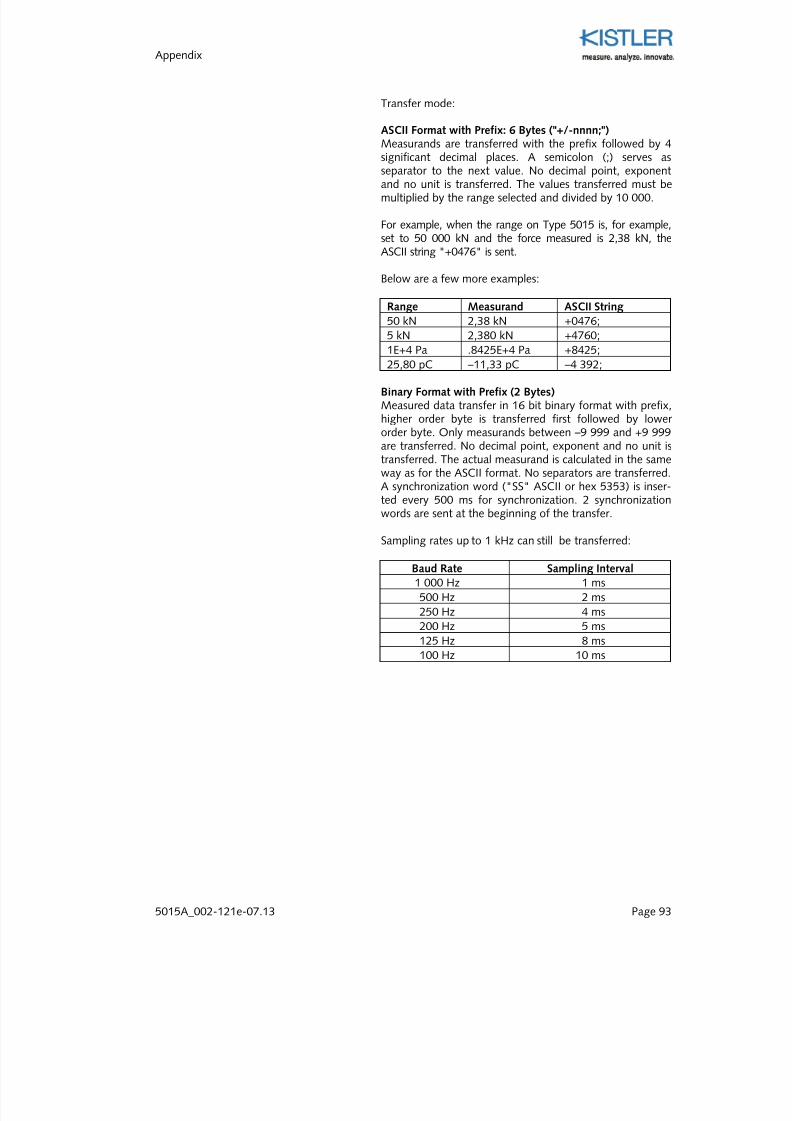
7/27/2019 002-121e-07.13
http://slidepdf.com/reader/full/002-121e-0713 95/99
Appendix
5015A_002-121e-07.13 Page 93
Transfer mode:
ASCII Format with Prefix: 6 Bytes ("+/-nnnn;")Measurands are transferred with the prefix followed by 4significant decimal places. A semicolon (;) serves as
separator to the next value. No decimal point, exponentand no unit is transferred. The values transferred must bemultiplied by the range selected and divided by 10 000.
For example, when the range on Type 5015 is, for example,set to 50 000 kN and the force measured is 2,38 kN, theASCII string "+0476" is sent.
Below are a few more examples:
Range Measurand ASCII String
50 kN 2,38 kN +0476;
5 kN 2,380 kN +4760;1E+4 Pa .8425E+4 Pa +8425;
25,80 pC –11,33 pC –4 392;
Binary Format with Prefix (2 Bytes)Measured data transfer in 16 bit binary format with prefix,higher order byte is transferred first followed by lower order byte. Only measurands between –9 999 and +9 999are transferred. No decimal point, exponent and no unit istransferred. The actual measurand is calculated in the sameway as for the ASCII format. No separators are transferred.A synchronization word ("SS" ASCII or hex 5353) is inser-ted every 500 ms for synchronization. 2 synchronizationwords are sent at the beginning of the transfer.
Sampling rates up to 1 kHz can still be transferred:
Baud Rate Sampling Interval
1 000 Hz 1 ms
500 Hz 2 ms
250 Hz 4 ms200 Hz 5 ms
125 Hz 8 ms100 Hz 10 ms
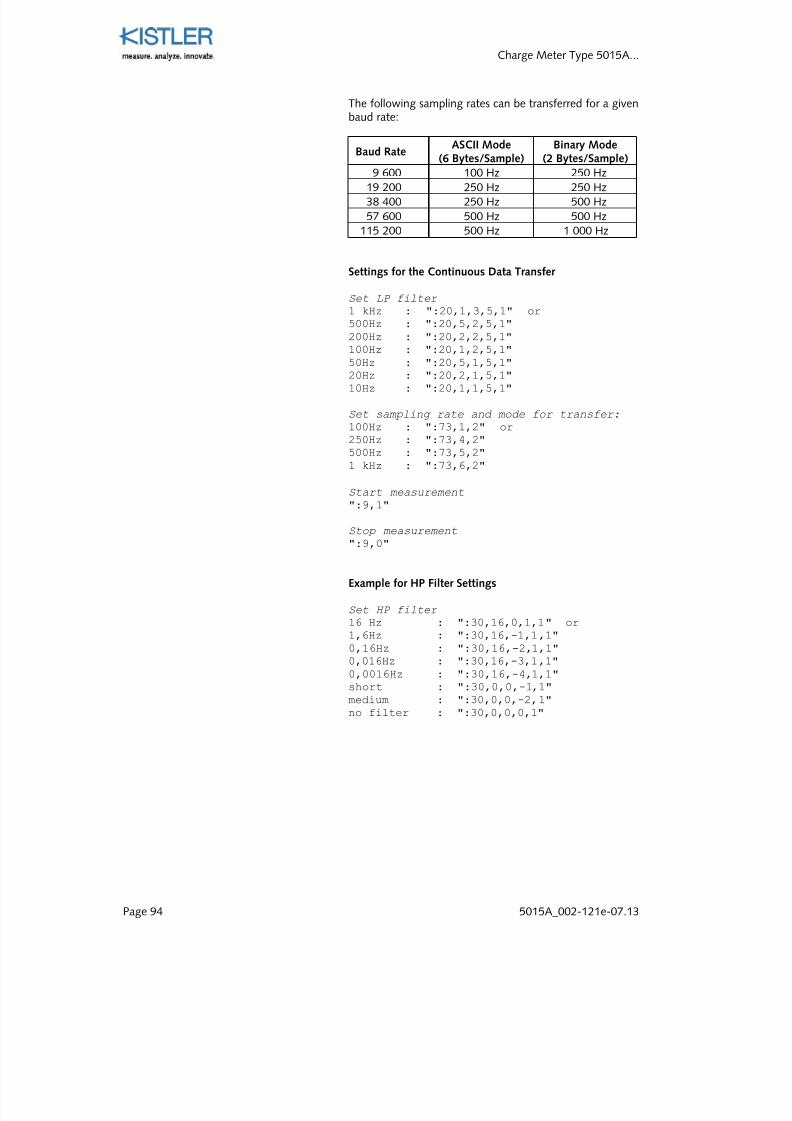
7/27/2019 002-121e-07.13
http://slidepdf.com/reader/full/002-121e-0713 96/99
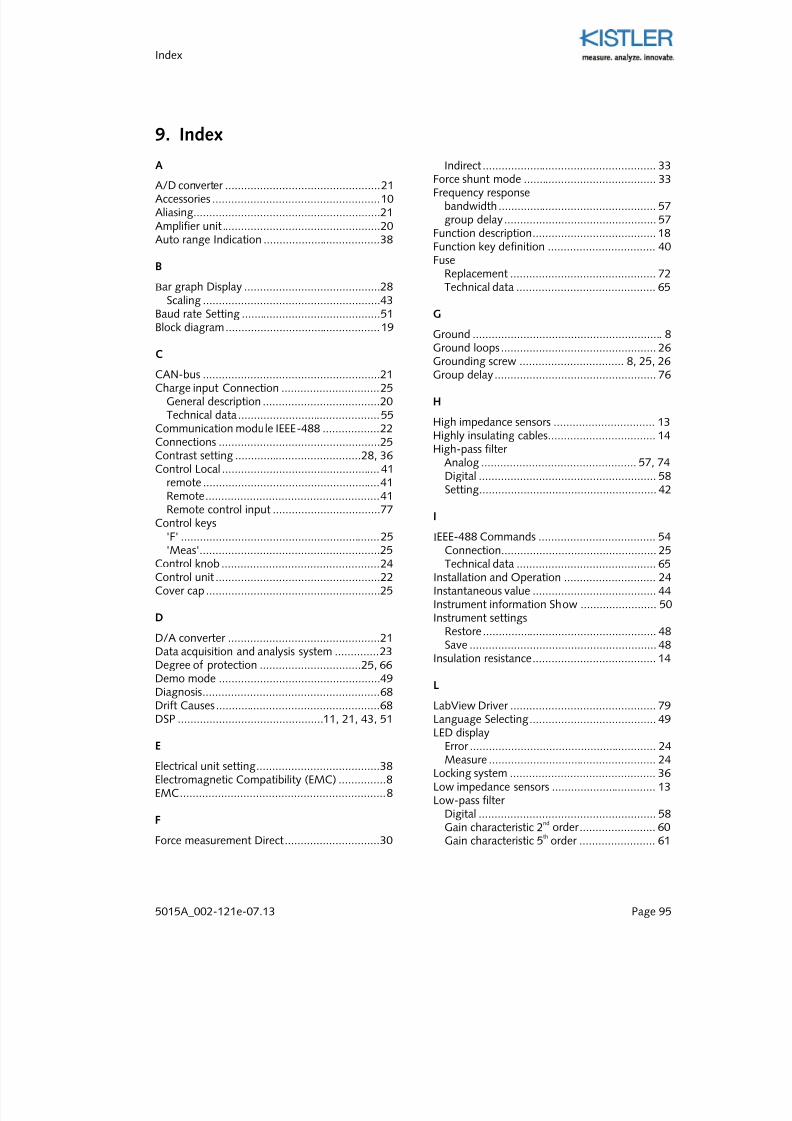
7/27/2019 002-121e-07.13
http://slidepdf.com/reader/full/002-121e-0713 97/99
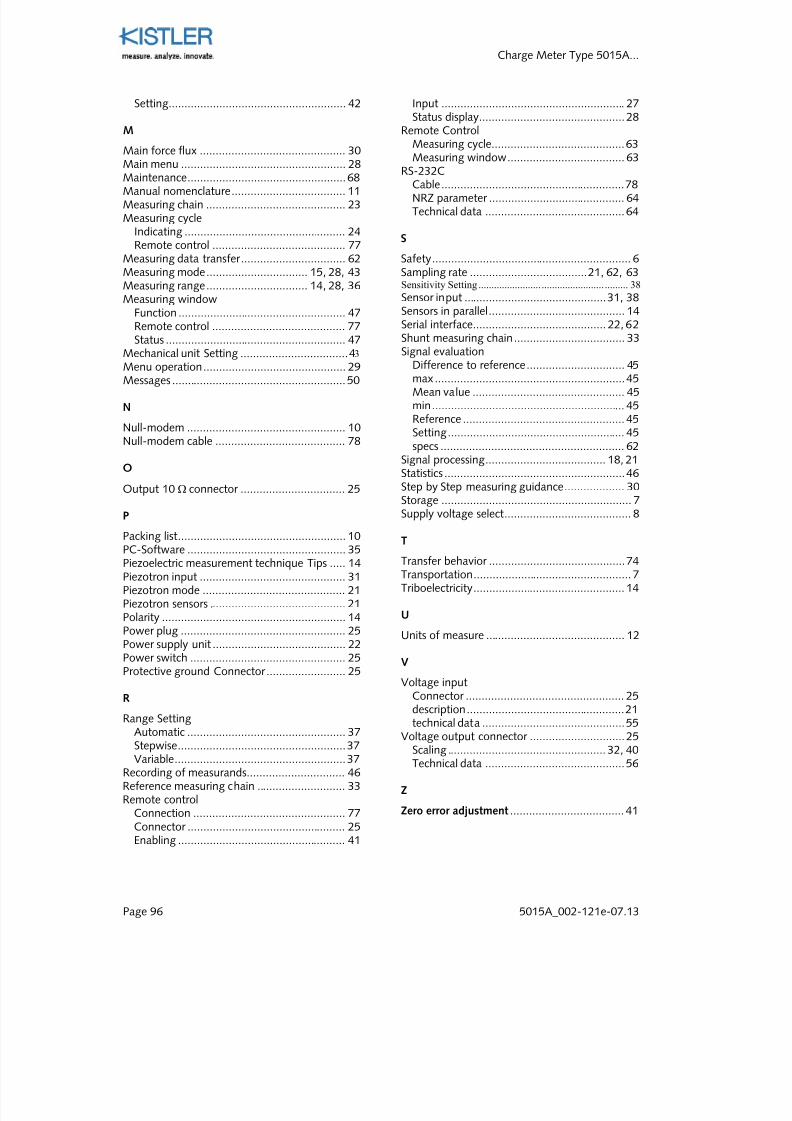
7/27/2019 002-121e-07.13
http://slidepdf.com/reader/full/002-121e-0713 98/99
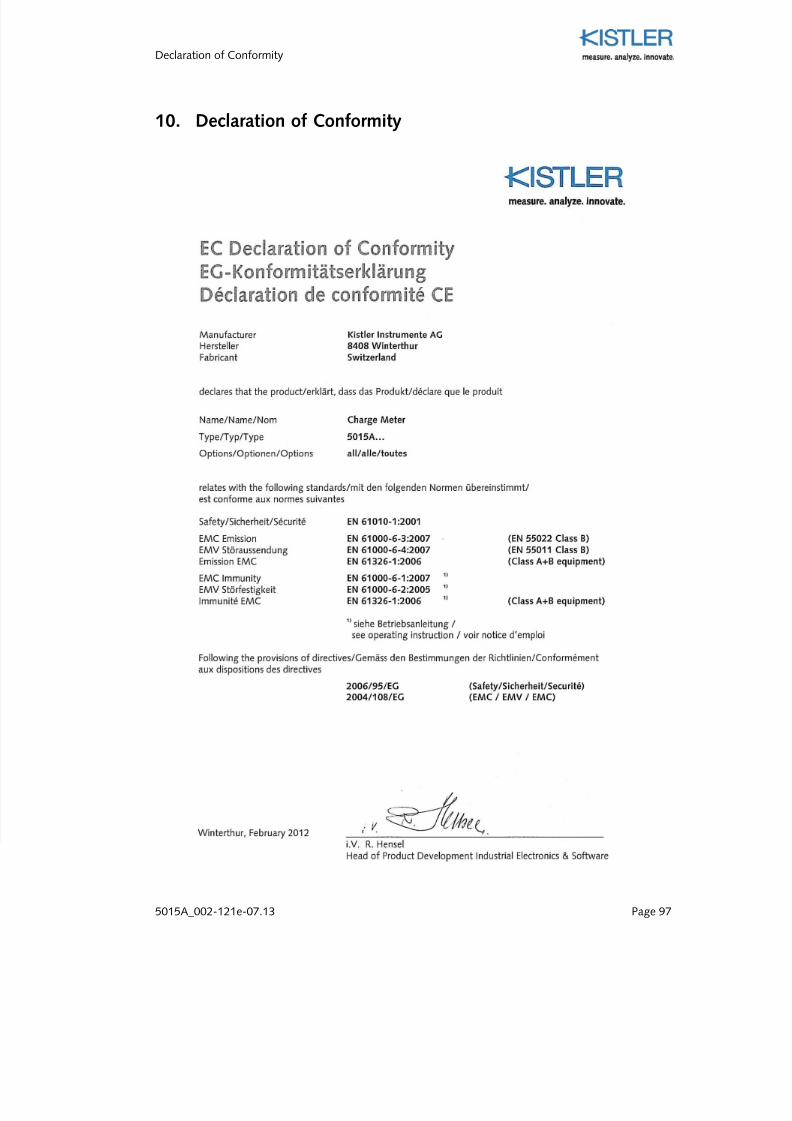
7/27/2019 002-121e-07.13
http://slidepdf.com/reader/full/002-121e-0713 99/99