Embed Size (px)
Citation preview
Strategic Management International Journal of Strategic Management and
Decision Support Systems in Strategic Management
www.ef.uns.ac.rs/sm Publisher University of Novi Sad, Faculty of Economics Subotica Segedinski put 9-11, 24000 Subotica, Serbia Tel: +381 24 628 000 Fax: +381 546 486 http://www.ef.uns.ac.rs For Publisher Nenad Vunjak, University of Novi Sad, Faculty of Economics Subotica, Serbia Editor-in-Chief Jelica Trninić, University of Novi Sad, Faculty of Economics Subotica, Serbia National Editorial Board Esad Ahmetagić, University of Novi Sad, Faculty of Economics Subotica, Serbia Jelena Birovljev, University of Novi Sad, Faculty of Economics Subotica, Serbia Jovica Đurković, University of Novi Sad, Faculty of Economics Subotica, Serbia Nebojša Janićijević, University of Belgrade, Faculty of Economics Belgrade, Serbia Tibor Kiš, University of Novi Sad, Faculty of Economics Subotica, Serbia Božidar Leković, University of Novi Sad, Faculty of Economics Subotica, Serbia Vesna Milićević, University of Belgrade, Faculty of Organizational Sciences, Serbia Aleksandar Živković, University of Belgrade, Faculty of Economics, Serbia International Editorial Board Ilona Bažantova, Charles University in Prague, Faculty of Law, Czech Republic André Boyer, University of Nice Sophia-Antipolis, France Ivan Brezina, University of Economics in Bratislava, Faculty of Economic Informatics, Bratislava, Slovakia Ferenc Farkas, University of Pécs, Faculty of Business and Economy, Hungary Agnes Hofmeister, Corvinus University of Budapest, Faculty of Business Administration, Hungary Pedro Isaias, Open University Lisbon, Portugal Novak Kondić, University of Banja Luka, Faculty of Economics, Banja Luka, Bosnia and Herzegovina Mensura Kudumović, University of Sarajevo, Faculty of Medicine, Bosnia and Herzegovina Vujica Lazović, University of Montenegro, Faculty of Economics, Podgorica, Montenegro Martin Lipičnik, University of Maribor, Faculty of Logistics Celje-Krško, Slovenia Pawel Lula, Cracow University of Economics, Poland Emilija Novak, West University of Timisoara, Timisoara, Romania Elias Pimenidis, University of East London, England Vladimir Polovinko, Omsk State University, Russia Ludovic Ragni, University of Nice Sophia-Antipolis, France Kosta Sotiroski, University „ST Kliment Ohridski“ Bitol, Faculty of Economics Prilep, Macedonia Ioan Talpos, West University of Timisoara, Faculty of Economics, Romania Assistant Editors Marton Sakal, University of Novi Sad, Faculty of Economics Subotica, Serbia Vuk Vuković, University of Novi Sad, Faculty of Economics Subotica, Serbia Lazar Raković, University of Novi Sad, Faculty of Economics Subotica, Serbia English translation Željko Buljovčić Prepress
Print "Printex" Subotica, Serbia Circulation 200 The Journal is published quarterly.

Strategic Management International Journal of Strategic Management and
Decision Support Systems in Strategic Management ISSN 1821-3448, UDC 005.21 Strategic Management is a quarterly journal addressing issues concerned with all aspects of strategic man-agement. It is devoted to the improvement and further development of the theory and practice of strategic management and it is designed to appeal to both practicing managers and academics. Specially, Journal pub-lishes original refereed material in decision support systems in strategic management.
Thematic Fields Mission and Philosophy of the Organization
Culture and Climate of the Organization
Effectiveness and Efficiency of the Organization
Structure and Form of the Organization
Strategic Analysis
Aims and Strategies
Process of Strategic Management
Characteristics of Strategic Management in the New Economy
Contemporary Ontological, Epistemological and Axiological Suppositions on the Organization and its Environment
Analysis of the Organization and its Interaction with the Environment
Structure and Dynamics of the Organizational Environment
Uncertainty and Indistinctiveness of the Organizational Environment
Synchronic and Diachronic Analysis of the Organizational Environment
Analysis Techniques of the Organization
Business Processes, Learning and Development within the Context of Strategic Management
Evaluation and Measuring of the Potential and Realization of the Organization within the Context of Strategic Management
Strategic Control in Contemporary Management
Information Technologies in Strategic Management
Business Intelligence and Strategic Management
Decision Support Systems and Artificial Intelligence in Strategic Management
All scientific articles submitted for publication in Journal are double-blind reviewed by at least two academics appointed by the Editor's Board: one from the Editorial Board and one independent scientist of the language of origin - English. Reviewers stay anonymous. Authors will timely receive written notification of acceptance, re-marks, comments and evaluation of their articles.
Strategic Management International Journal of Strategic Management and
Decision Support Systems in Strategic Management www.ef.uns.ac.rs/sm ISSN 1821-3448 UDC 005.21 2012, Vol. 17, No. 3
Contents Modeling Strategic Customer Behavior in Revenue ManagementPetr Fiala 3-9 The Challenges of Change on the Banking Market in the Conditions of Financial Crisis Nenad Vunjak, Vera Zelenović 10-20 Reflections of the Crisis on the Corporate Operational Performance of Serbian Industrial Companies Mirko Andrić, Bojana Vuković 21-28 Errors in Building and Using Electronic Tables: Financial Consequences and Minimisation Techiques Marton Sakal, Lazar Raković 29-35 Strategic Management of Information Systems in the Function of Efficient Business of Companies Vesna Aleksić Marić, Gordana Ilić 36-46 Management Strategy for Adapting to Process-Oriented OrganizationsEsad Ahmetagić, Pere Tumbas, Blaženka Piuković 47-53 Compatibility of the Romanian Accounting System with the Standard IAS/IFRS System Marian Socoliuc, Dorel Mates, Ionel Bostan, Veronica Grosu, Elena Hlaciuc, Camelia Mihalciuc, Ioana Colbu 54-63
STRATEGIC MANAGEMENT, Vol. 17 (2012), No. 3, pp. 003-009 UDC 659.113.25 ; 005.21:003.346
Received: March 12, 2012
Accepted: July 19, 2012
Modeling Strategic Customer Behavior in Revenue Management
Petr Fiala University of Economics, Prague, Czech Republic
Abstract Revenue management is the art and science of predicting real-time customer demand and optimizing the price and availability of products according to the demand. What is new about revenue management is not the demand-management decisions themselves but rather how these decisions are made. The true innovation ofrevenue management lies in the method of decision making. There is significant opportunity for modeling ap-proaches. The common modeling approaches assume that customers are passive and they do not engage inany decision-making processes. This simplification is often unrealistic for many practical problems. In re-sponse to this, interest has arisen in recent years to incorporate strategic customer behavior. This articlepresents network management models with multiple-product consumer demand and inter-temporal substitu-tions. Models are based on linear programming approximations with Data Envelopment Analysis evaluation methods and a three-layer framework for modeling dynamic selling process. Keywords Revenue management, strategic customer, modeling, discrete choice, substitution.
Introduction
Revenue management (RM) is the art and science of predicting real-time customer demand and optimiz-ing the price and availability of products according to the demand. RM is the process of understanding, anticipating and influencing consumer behavior in order to maximize revenue or profits from fixed, pe-rishable resources. Recent years have seen great successes of revenue management, notably in the air-line, hotel, and car rental business. Currently, an increasing number of industries is exploring the possi-biliy of adopting similar concepts. What is new about revenue management is not the demand-management decisions themselves but rather how these decisions are made. The true innovation of rev-enue management lies in the method of decision making. For the specific problems are proposed many appropriate methods (Talluri & van Ryzin, 2004a).
The quantity-based revenue management of multiple resources is referred to as network revenue management. This class of problems arises for example in airline, hotel, and railway management. In the airline case, the problem is managing capacities of a set of connecting flights across a network, so called a hub-and-spoke network. In the hotel case, the problem is managing room capacity on consecu-tive days when customers stay multiple nights. Network revenue management models attempt to max-imize revenue when customers buy bundles of multiple resources. The dependence among the resources in such cases is created by customer demand.
A significant limitation of the applicability of classical models is the assumption of independent de-mand. In response to this, interest has arisen in recent years to incorporate customer choice into these models, further increasing their complexity. Revenue management pays increasing attention to model-ing the behavior of individual customers. Today’s customers actively evaluate alternatives and make choices. Revenue management pays increasing attention to modeling the behavior of individual custom-
4 Petr Fiala Modeling Strategic Customer Behavior in Revenue Management
STRATEGIC MANAGEMENT, Vol. 17 (2012), No. 3, pp. 003-009
ers. Strategic customer behavior is analyzed. A modeling approach for strategic customer behavior is proposed.
Approaches to strategic customer behavior in revenue management can be divided into two groups:
multiple-product consumer demand, inter-temporal substitutions.
The first group of approaches studies customer choice in multi-product revenue management set-tings. The focus is on how customers choose which product to buy. A common approach is to use dis-crete choice models to capture multi-product consumer demand. Substitution and complementary ef-fects across multiple products are also analyzed. The second group examines the effect of inter-temporal substitution by customers. Customers may choose when to buy a particular product in response to sel-ler’s dynamic pricing practices. In particular, when they anticipate price reductions, customers may choose to wait for the sale. Other relevant issues include capacity rationing, valuation uncertainty, and consumer learning effects. These kinds of behavior imply that the dynamics of customer demand de-pend directly on the seller’s dynamic pricing strategies. This dependence is not captured by convention-al models with exogenous demand arrival processes. The paper presents network management models with multiple-product consumer demand and inter-temporal substitutions. Models are based on linear programming approximations with Data Envelopment Analysis evaluation methods and a three-layer framework for modeling of dynamic selling process.
1. Network revenue management
Network revenue management models attempt to maximize revenue when customers buy bundles of multiple resources. The interdependence of resources, commonly referred to as network effects, creates difficulty in solving the problem. The classical technique of approaching this problem has been to use a deterministic LP solution to derive policies for the network capacity problem. Initial success with this method has triggered considerable research in possible reformulations and extensions, and this method has become widely used in many industrial applications. A significant limitation of the applicability of these classical models is the assumption of independent demand. In response to this, interest has arisen in recent years to incorporate customer choice into these models, further increasing their complexity. This development drives current efforts to design powerful and practical heuristics that still can manage problems of practical scope.
The basic model of the network revenue management problem can be formulated as follows (Talluri & van Ryzin, 2004a). The network has m resources which can be used to provide n products. We define the incidence matrix A = [aij], i = 1, 2, …, m, j = 1, 2, …, n, where
aij = 1, if resource i is used by product j, and aij = 0, otherwise.
The j-th column of A, denoted aj, is the incidence vector for product j. The notation i aj indicates that resource i is used by product j. The state of the network is described by a vector x = (x1, x2, …, xm) of resource capacities. If product j is sold, the state of the network changes to x - aj. Time is discrete, there are T periods and the index t represents the current time, t = 1, 2, …, T. Assuming within each time period t, one request for a product can arrive at most. Demand in time period t is modeled as the realization of a single random vector r(t) = (r1(t), r2(t), …, rn(t)). If rj(t) = rj > 0; this indicates that a re-quest for product j occurred and that its associated revenue is rj. If rj(t) = 0, this indicates that no request for product j occurred. A realization r(t) = 0 (all components equal to zero) indicates that no request from any product occurred at time t. The assumption that one arrival occurs in each time period at most means that one component of r(t) can be positive at most. The sequence r(t), t = 1, 2, …, T is assumed to be independent with known joint distributions in each time period t. When revenues associated with product j are fixed, we will denote these by rj and the revenue vector r = (r1, r2, …, rn).
Given the current time t, the current remaining capacity x and the current request r(t), the decision is to accept or not to accept the current request. We define the decision vector u(t) = (u1(t), u2(t), …, un(t)) where
Petr Fiala Modeling Strategic Customer Behavior in Revenue Management 5
STRATEGIC MANAGEMENT, Vol. 17 (2012), No. 3, pp. 003-009
uj(t) = 1, if a request for product j in time period t is accepted, and uj(t) = 0, otherwise.
The components of the decision vector u(t) are functions of the remaining capacity components of vector x and the components of the revenue vector r, u(t) = u(t, x, r). The decision vector u(t) is restric-ted to the set
U(x) = {u {0, 1}n, Au ≤ x }.
Given remaining capacity x in time period t, the maximum expected revenue cannot be solved exact-ly for most networks of realistic size. Solutions are based on approximations of various types. The DLP was among the first models analyzed for network RM (Talluri & van Ryzin, 2004a). The main advan-tage of the DLP model is that it is computationally very efficient to solve. Due to its simplicity and speed, it is popular in practice. The weakness of the DLP approximation is that it considers only the mean demand and ignores all other distributional information. The performance of the DLP method de-pends on the type of network, the order in which fare products arrive and the frequency of re-optimization.
The DLP method uses the approximation
( ) maxLP TtV x r y
subject to (1) Ay ≤ x
0 ≤ y ≤ E[D] where D = (D1, D2, …, Dn) is the vector of demand over the periods t, t +1, …,T, for product j, j = 1,
2, …, n, and r = (r1, r2, …, rn) is the vector of revenues associated with the n products. The decision vector y = (y1, y2, …, yn) represents partitioned allocation of capacity for each of the n products. The approximation effectively treats demand as if it were deterministic and equal to its mean E[D]. The op-timal dual variables, πLP, associated with the constraints Ay ≤ x, are used as bid prices.
2. Modeling strategic customer choice
Customer behavior modeling has been gaining increasing attention in the revenue management (Shen & Su, 2007). Given that customers will exhibit systematic responses to the selling mechanisms, firms are responsible for anticipating these responses when making their pricing decisions. The focus is on how customers choose which product to buy in multi-product revenue management settings. A common ap-proach is to use discrete choice models to capture multi-product consumer demand. Substitution and complementary effects across multiple products are studied also. Potential customers usually do not come with a predetermined idea of which product to purchase. Rather, they only know some particular features that the product should possess and compare several alternatives that have these features in common before coming to a purchase or non-purchase decision. This issue of customer choice was first investigated by Talluri & van Ryzin (2004b), who studied a revenue management problem under a dis-crete choice model of customer behavior. There are n fare products, each associated with exogenous revenue rj, j = 1,2,…n.. At each point in time, the firm chooses to offer a subset of these fare products. Given the subset of offered products, customers choose an option according to some discrete choice model. Gallego, Iyengar, Phillips, & Dubey (2004) and van Ryzin & Liu (2008) extend this analysis to the network setting. Each product consists of a fare class and an itinerary, which may use up resources on multiple legs of the network. The dynamic program of finding the optimal offer sets becomes com-putationally intractable. The authors adopt a deterministic approximation by reinterpreting the purchase probability as the deterministic sale of a fixed quantity (smaller than one unit) of the product. Under this interpretation, the revenue management problem can be formulated as a linear program, and this is where it is possible to demonstrate that the solution is asymptotically optimal as demand and capacity are scaled up. This is where it is possible to design implementation heuristics to convert the static LP solution into dynamic control policies.
6 Petr Fiala Modeling Strategic Customer Behavior in Revenue Management
STRATEGIC MANAGEMENT, Vol. 17 (2012), No. 3, pp. 003-009
Choice-Based Deterministic LP (CDLP)
The probability that the customer chooses product j given the set of offered fares S (conditioned to arri-val of a customer) is denoted by Pj(S). Time is discrete and partitioned into T times periods that are small enough such that there is at most one customer arrival with probability λ and no arrival with probability 1−λ. The network has m resources which can be used to provide n products. The incidence matrix A = [aij], i = 1, 2, …, m, j = 1, 2, …, n, introduced in network revenue management problems, is used. Demand is treated as known and being equal to its expected value. The problem is then reduced to an allocation problem where we need to decide for how many time periods a certain set of products S shall be offered, denoted by t(S). Denote the expected total revenue from offering S by
j j
j S
R S P S r
(2)
and the expected total consumption of resource i from offering S by
i j ijj S
Q S P S a
, i , (3)
Then the choice-based deterministic linear program is given by
CDLP max ( )S N
V R S t S
,
( )S N
AP S t S x
, (4)
S N
t S T
,
0t S , S N The objective is to maximize total revenue under constraints that consumption is less than capacity
and total time sets offered are less than horizon length. Decision variables are total time subset S is of-fered t(S). There are two basic possibilities how to we use the CDLP solution. The first one is to directly apply time variables t*(S) (Gallego et al., 2004). For certain discrete-choice models it is possible to effi-ciently use column generation to solve the CDLP model to optimality. It returns a vector with as many components as there are possible offer sets, and each component represents the number of time periods out the finite time horizon that the corresponding offer set should be available. The notion of efficient sets introduced by Talluri & van Ryzin (2004b) for the single leg case is translated into the network context and the authors show that CDLP only uses efficient sets in its optimal solution. Second one is to use dual information in a decomposition heuristic (Liu & van Ryzin, 2007; van Ryzin & Liu, 2008). The dual variables of the capacity constraints can be used to construct bid prices.
Searching the efficient frontier
The models of customer choice can be extended by multiple inputs (input resources, costs, probability of choosing, etc.) and multiple outputs (revenue, profit, output resources, etc.). The evaluation of alter-natives can be done by DEA based evaluation methods (Cooper, Seiford, & Tone, 2000). The efficient frontier provides a systematic framework for comparing different policies and highlights the structure of the optimal controls for the problems. Searching the efficient frontier in the DEA model can be formu-lated as a multi-objective linear programming problem. Different multi-objective linear programming methods can be used for solving of the problem. We propose using Aspiration Level Oriented Procedure (Fiala, 1997).
The set of efficient decision making units is called the reference set. The set spanned by the referen-ce set is called the efficient frontier. Searching the efficient frontier in the DEA model can be formula-ted as a multi-objective linear programming problem (Korhonen, 1997). Suppose there are n decision making units each consuming r inputs and producing s outputs and (r, n)-matrix X, (s, n)-matrix Y of
Petr Fiala Modeling Strategic Customer Behavior in Revenue Management 7
STRATEGIC MANAGEMENT, Vol. 17 (2012), No. 3, pp. 003-009
observed input and output measures. The problem is defined as maximization of linear combination of outputs and minimization of linear combination of inputs.
Y ”max” X ”min” (5)
0 A solution 0 is efficient if there does not exist another , so that
Y Y0 , X X0 and (Y, X) (Y0, X0). (6)
3. Modeling dynamic a selling process
The presented approaches can be completed with a three-layer framework for modeling a dynamic sel-ling process in network revenue management problems with strategic customer behavior. The learning process is also involved in the framework. The process modeling of coordination of units in network revenue management problems in general is a complex problem based on several kernel ideas. The framework of the proposed discrete dynamic model is separated into three parts:
deterministic part, logical part, and stochastic part.
According to these three parts, the modeling framework is composed from three inter-related network structures:
basic network model, Petri net, and neural net.
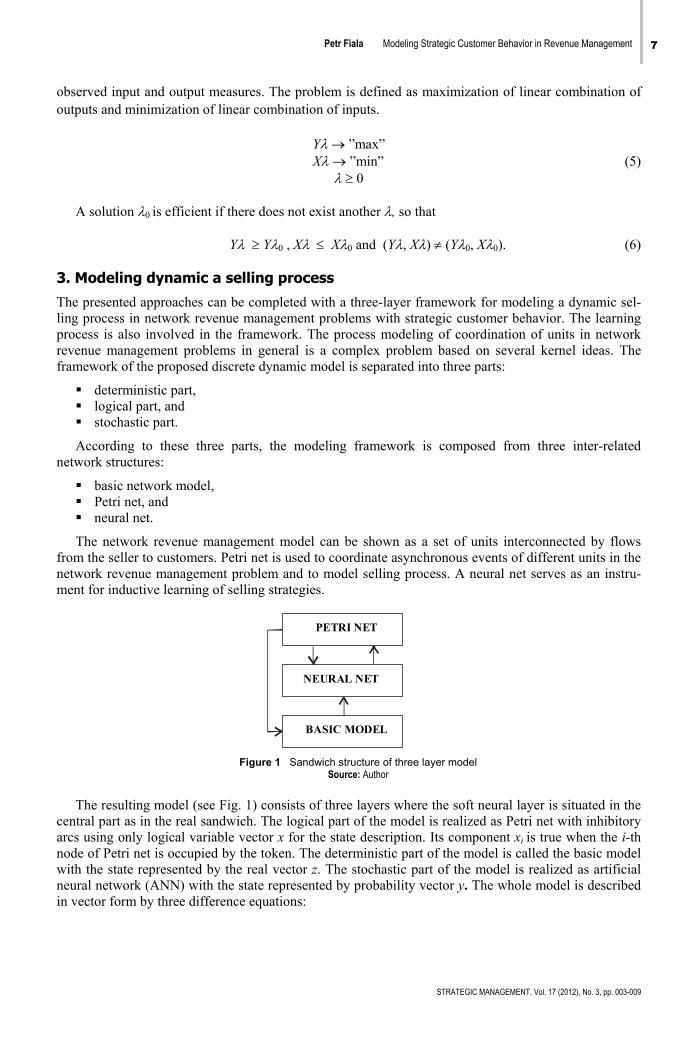
The network revenue management model can be shown as a set of units interconnected by flows from the seller to customers. Petri net is used to coordinate asynchronous events of different units in the network revenue management problem and to model selling process. A neural net serves as an instru-ment for inductive learning of selling strategies.
NEURAL NET
PETRI NET
BASIC MODEL
Figure 1 Sandwich structure of three layer model Source: Author
The resulting model (see Fig. 1) consists of three layers where the soft neural layer is situated in the
central part as in the real sandwich. The logical part of the model is realized as Petri net with inhibitory arcs using only logical variable vector x for the state description. Its component xi is true when the i-th node of Petri net is occupied by the token. The deterministic part of the model is called the basic model with the state represented by the real vector z. The stochastic part of the model is realized as artificial neural network (ANN) with the state represented by probability vector y. The whole model is described in vector form by three difference equations:
8 Petr Fiala Modeling Strategic Customer Behavior in Revenue Management
STRATEGIC MANAGEMENT, Vol. 17 (2012), No. 3, pp. 003-009
xt+1 = f(xt, yt) yt = g(xt, zt) (7)
zt+1 = h(xt, zt) The main characteristic of the model is the partial inter-connectivity. Petri net cannot use the state of
the basic network model, and the basic network model cannot use the state of artificial neural network. Then the Petri net changes its state by internal parallel process. The tokens can be set by the artificial neural network with probability y. The basic model has its own deterministic dynamics and uses the Petri net state as input signal. The artificial neural network layer plays role of soft and learnable coordi-nator. Using the states of Petri net and the basic network model, the artificial neural network changes its own state without any internal dynamics. According to state y, the i-th token of Petri net is set with the probability yi. The main advantage of the ANN is the ability of learning its own coordinator role.
Conclusions
Revenue management is the process of understanding, anticipating and influencing customer behavior in order to maximize revenue. Revenue management systems are affected by many drivers. The paper proposes an approach for strategic customer behavior. Network revenue management models attempt to maximize revenue when customers buy bundles of multiple resources. The basic model of the network revenue management problem is formulated as a stochastic dynamic programming problem whose exact solution is computationally intractable. The Deterministic Linear Programming (DLP) method is a pop-ular in practice. The DLP method is based on an assumption that demand is deterministic and static. The common modeling approaches assume that customers are passive and they do not engage in any deci-sion-making processes. This simplification is often unrealistic for many practical problems. In response to this, interest has arisen in recent years to incorporate customer choice into these models, further in-creasing their complexity. strategic customer behavior was analyzed in this article. The customer’s choice depends critically on the set of available products. A modeling approach for strategic customer behavior based on deterministic linear programming (CDLP) was investigated. The article introduces DEA based model and methods for a generalized problem. Dynamic selling process is modeled by a three-layer framework. Combination of the methods for searching the efficient frontier and approaches for modeling dynamic selling process gives a powerful instrument for capturing revenue management problems with strategic customer behavior.
Acknowledgement
The research project was supported by Grant No. P402/10/0197 „Revenue management – models and analyses“ from the Grant Agency of Czech Republic and Grant No. IGA F4/16 /2011 from Faculty of Informatics and Statistics, University of Economics, Prague. SM
Petr Fiala Modeling Strategic Customer Behavior in Revenue Management 9
STRATEGIC MANAGEMENT, Vol. 17 (2012), No. 3, pp. 003-009
References
Cooper, W. W., Seiford, L. M., & Tone, K. (2000). Data Envelopment Analysis. Boston: Kluwer Publ. Fiala, P. (1997). Models of Cooperative Decision Making. In T. Gal, & G. Fandel (Eds.), Multiple Criteria Decision Making
1995 (pp. 128-136). Berlin: Springer. Gallego, G., Iyengar, G., Phillips, R., & Dubey, A. (2004). Managing flexible products on a network. Tech. Rep. TR-2004-01.
New York: Columbia University. Korhonen, P. (1997). Searching the Efficient Frontier in Data Envelopment Analysis. IIASA Report IR-97-79. Laxenburg:
IIASA. Liu, Q., & van Ryzin, G. J. (2007). Strategic capacity rationing to induce early purchases. Working papr. New York:
Columbia University. Shen, Z. J., & Su, X. (2007). Customer Behavior Modeling in Revenue Management and Auctions. Production and
Operations Management, 16 (6), 713-728. Talluri, K. T., & van Ryzin, G. J. (2004a). The Theory and Practice of Revenue Management. Boston: Kluwer Academic
Publishers. Talluri, K., & van Ryzin, G. J. (2004b). Revenue management under a general discrete choice model of consumer behavior.
Management Science, 50 (1), 15-33. van Ryzin, G. J., & Liu, Q. (2008). On the choice-based linear programming model for network revenue management.
Manufacturing & Service Operations Management, 10 (2), 288-311. Correspondence
Petr Fiala
University of Economics Prague Prague 3, Prague, Czech Republic
E-mail: [email protected]
STRATEGIC MANAGEMENT, Vol. 17 (2012), No. 3, pp. 010-020 UDC 336.717 ; 339.747(100)
Received: January 15, 2012
Accepted: June 12, 2012
The Challenges of Change on the Banking Market in the Conditions of Financial Crisis
Nenad Vunjak, Vera Zelenović University of Novi Sad, Faculty of Economics Subotica, Serbia
Abstract The first consequences of the financial crisis were felt Serbia in early 2009, with decline in economic activity, rise in the inflation rate, decrease in the collection of public and other revenues and fall in employment rate.The prime movers and carriers of the economic crisis were investment banks, whose bankruptcy spelled theend of neoliberalism and debacle of the myth of the market capable od independently regulating all relation-ships at the national economy level. The presence of the economic crisis confirmed the fact that external factors influence banking operations sig-nificantly. These factors include globalisation, deregulation, information technologies and financial innovation.Structural change on the banking market included consolidation, amalgamation and competition amongbanks. Bank management strategy implies achieving the bank’s primary and partial objectives. The bank manage-ment strategy is the bank’s vision of (a) what a bank wants to be, (b) how it operates and (c) which path it is tofollow to arrive at the desired destination. Understanding a bank’s mission includes (a) the history of its goals and business policies, (b) the characteristics of the bank management and owners, (c) the environment’sopionion of the bank, (d) the bank’s resources and (e) the bank’s personal competence. Change management strategy in banks starts from identifying and diagnosing the need for changes, and overcoming resistance to change. The causes of resistance to change in banks are related to (a) the staff’spersonal interest, (b) lack of trust in the bank’s management team, (c) different assessments by the bank staf, and (d) low tolerance to change among bank staff and the management team. The negative impact of the global economic crisis is also present in the national economy, due to the exis-tence of negative trade balance in the exchange with the countries in Europe and worldwide. The financial crisis has caused decline in foreign capital inflow, lower employment levels, fall in foreign currency inflow anddevaluation of the national curency. Keywords Financial crisis, banks, financial innovation, strategy, change management.
Introduction
The global financial crisis started in the USA in 2008, as a mortgage crisis, expanding rapidly to a smaller or greater extent across all the countries worldwide. This global financial crisis is the second largest since the Great Economic Crisis of 1929-1933. It must be pointed out that the global financial crisis emerged as a debt crisis, with a negative impact on both the industry and public sector of Serbia. The first consequences of the financial crises were felt in early 1929, as slower growth in economic ac-tivities, rising inflation rates, reduced collection rates of public and other revenues, and fall in employ-ment rates. The emergence of this crisis spelt the demise of the neoliberal capitalism concept, and gave rise to introducing stricter state regulation rather than the “free” liberal market. The global financial cri-sis began on Wall Street, with the bankruptcy of several major American banks and plunge in the value
Nenad Vunjak et al. The Challenges of Change on the Banking Market in the Conditions of Financial Crisis 11
STRATEGIC MANAGEMENT, Vol. 17 (2012), No. 3, pp. 010-020
of their shares. The most notable cases were Lehman Brothers, Merril Lynch, American International Group, etc. As the market could neither foresee nor prevent this incredible crash, the bankruptcy of these investment banks marked the end of neo-liberalism, and debacle of the myth of a market that can independently regulate all relationships at the national economy level.
The causes of emergence of the financial crisis are associated with banks that granted mortgage loans, undervaluing them unrealistically and oversaturated the market with mortgages, at the moment of the debtor’s default. Growth in the supply of real estate resulted in decline in property prices, which had been overvalued by investment banks’ management at the moment of loan disbursement. When granting these loans, banks borrowed funds from one another, and when faced with the clients’ default, they be-came property owners instead of regular collection of loan instalments. Based on the pool of approved loans and ownership of mortgaged property, banks issued collateral short-term bonds with high interest rates. This approach “infested” all national economies, which, amid their banks’ greed for high return rates, bought collateral bonds or other forms of short-term securities.
The way out was seen in applying the tools of global economy in order to overcome the financial crisis. The world’s most developed countries started from the assumption that the crisis can be stopped if states nationalise parts of the global financial systems and borrow funds mutually. This idea did not yield fruit due to lack of trust between states, as one country’s banks were unwilling to lend funds to another country’s banks. A realistic doubt existed that worthless papers (collateralised securities) would be given in exchange for disbursed funds. The next solution was sought in the fact that national econo-mies (each state separately) act as guarantors for loans, which was done by state intervention in saving large investment banks and well known corporations worldwide.
It is a fact that that each national economy can make a precise calculation of the cost of the impact of the global economic crisis so far. The answer is in funds invested in alleviation of and recovery from the crisis. According to the data available, the USA has invested 700 billion dollars, Germany 500 billion, Ireland 400 billion, France 360 billion, the Netherlands 200 billion, and Spain 100 billion US dollars. As market mechanisms have been replaced with state regulations, it is only possible to point to possible avenues to resolving the crisis, without defining specific and generally accepted solutions.
The emergence of the global economic crisis confirmed the fact of the impact of external factors on bank operations. The term “external factor” in this article refers to globalisation of financial and bank-ing markets, deregulation of banking operations, changing technologies in bank operations, financial innovation in the regulative area, instruments and tactics of banking operation management. It must me pointed out that the strategic management of banks is inconceivable without a clearly set bank’s strate-gic vision and mission.
1. The factors of change on the banking market
The presence of the global financial crisis in the recent years has shown that external factors make a significant impact on bank operations. Banks should therefore not only adapt to changes in the envi-ronment, but also predict these changes, so that they can adapt to these changes in time. It is characteris-tic that, as a rule, banks in market-oriented operative environment are characterised by: (1) great and absolute independence in business operations; (2) strategic marketing approach in decision making; and (3) dynamic organisational structure. Owing to the above characteristics, banks in the changing condi-tions mostly tend to face up to high competition levels, undertake large operations and accept high risk levels, and fully rely on IT-based business. The external factors affecting banking operations include (1) globalisation, (2) deregulation, (3) technology and (4) financial innovation.
Globalisation of financial and banking markets implies the existence of (a) a high level of competi-tion between banks and non-banking institutions; (b) convergence specialised in terms of universal business operations; (c) financial innovation; (d) consolidation, diversification and restructuring finan-cial institutions and markets; (e) creation of non-banking financial institutions involved in banking and other financial operations; (f) a national monetary system where banks are not under the influence of strict legislation; (f) disintermediation in the operation of banks, which are forced to take higher risk, increase their client base though untraditional operations (especially in the area of investment banking, insurance, off-balance-sheet operations, developing product and service channel development, etc.). These factors changed the business environment on the banking market to such an extent that the banks themselves have developed “fears” (a) that the overall business risks will rise significantly in a short
12 Nenad Vunjak et al. The Challenges of Change on the Banking Market in the Conditions of Financial Crisis
STRATEGIC MANAGEMENT, Vol. 17 (2012), No. 3, pp. 010-020
time; (b) that banks will lose the traditional role of credit and deposit institutions; (c) that the difference between banks and other financial institutions will be eroded to the point of disappearance, thus jeop-ardising the survival of banks.
Deregulation of banking operations is contrary to the principles on which banks do their business. In other words, banks are highest-regulated business entities, the most secure and conservative financial transactors. (Koch & Macdonald, 2003, p. 19) Regulation in banking has always existed, so that they are inevitable on the banking market for participants in banking transactions. Regulations stipulate; (a) maximum interest rates that banks may pay on deposits; (b) minimum capital to total assets ratio; (c) minimum statutory reserve; (d) degree of banks’ territorial expansion; (e) integration of banks with other institutions; (f) restriction of the range of services that banks may offer, etc.
Technological changes are present in bank operations on a daily basis. Nowadays, using modern technology, banks can change balance from day to day, from hour to hour, buy and sell parts of their assets, change the liability financing structure, monitor performance changes, etc. (Krstić, 2004) The development of information and communication technologies in the banking industry, created condi-tions for the development of e-banking (Vunjak & Kovačević, 2006, p. 263). Contemporary telecom-munication and information systems create a technical basis for instant information transfer and data processing (e.g. fast evaluation of clients’ creditworthiness, etc.).
Technological progress has integrated e-business, e-banking and internet banking, and enabled banks:
1. to increase economy of scale and economy of scope, 2. to carry out consolidations, acquisitions and mergers more easily, 3. to create new financial products and services combined with innovation in financial engineering
(Mishkin & Strahan, 1999, pp. 249-287) (risk management), 4. to distribute information, marketing activities and product and services to users faster and more
efficiently (Hawkins & Mihaljak, 2001, p. 3) (by means of direct mailshots or telemarketing in offering standardised products and substitutig the traditional product and service distribution channels with electronic ones),
5. perform complex transactions efficiently, especially with regard to payments and approving loans to qualified clients,
6. to link the non-financial and financial sectors (e.g. large department stores and other companes can develop and offer financial services to their customers),
7. to develop trade in securities and conversion into commodities of high standardisation and com-petitiveness level,
8. to downsize and reduce fixed costs, i.e. raise efficiency, 9. to organise virtual banks, operating online only, etc.
Innovation within the payment system (ATMs, charge cards etc.) has provided comfort in banking transaction management, security and reliability of the payment and financial systems, promotion of competitive market, adequate user protection levels, etc. It has also contributed to standardising banking products and enabled more efficient offer through electronic distribution channels. The most common forms include: (a) traditional forms of electronic services (telephone banking, credit cards, ATMs etc.); (b) electronic products and services with due dates (debit cards and retail overheads payment); and (c) deveoloping electronic services (charge cards, internet banking and online investment).
A special significance in the segment of new banking technologies belongs to Internet banking, which has enabled:
1. perfect information availability to users, 2. cost-cutting in banking transactions and delivery of financial products, 3. maintaining and developing customer relationships (Ćurčić, 2003), 4. availability of information on cash balance in all accounts at any moment, 5. “free” domestic postal transfers, 6. records of charged cheques, 7. autorisation of automatic payment, 8. computer application data storage etc.
Nenad Vunjak et al. The Challenges of Change on the Banking Market in the Conditions of Financial Crisis 13
STRATEGIC MANAGEMENT, Vol. 17 (2012), No. 3, pp. 010-020
Financial innovation (Vunjak, Ćurčić, & Kovačević, 2011, p. 16)has emerged as a result of changes in regulations, instruments, institutions and tactics of conducting banking operations. They feature as the catalyst of the evolution of financial services and restructuring financial markets. The most common forms are new securities, new services, organisanion forms and distribution channels. They were created with the objectives to (a) be traded publically and create new financial markets, raising liquidity levels; (b) change the contents of bank balance sheets and combine cross-servicing, thus reducing deposit drain; (c) enter new financial markets and create more cost-effective and efficient distribution channels; (d) change the tax position; (e) reduce the risk or costs of banking; (f) improve the bank’s competitive position; (g) change the structure of offered assets or funds through new banking products and services; (h) develop risk protection instruments (futures, options, etc.), ATMs, internet banking, etc.; and (i) cre-ate structural changes in banking (financial conglomerates through mergers with and acquisitons of other business entities).
The modern-day banking of highly developed market economies has seen significant changes in the structure, characteristics and types of banking products and services offered by financial service provid-ers. The most notable changes have occurred in the areas of:
1. consolidation of banks and financial institutions, 2. amalgamations of banks, non-banking and financial institutions and 3. competition between banks, non-banking and financial institutions.
Amid world economic crises, banks on the banking market are also faced with numerous new chal-lenges arising from changes present in information technology, deregulation, geographic and product expansion, globalised operations, changing regulations, accounting standards, the banking market and market tendencies towards business combinations.
Modern-day banking services are offered by banks, insurance companies and consolidated funds to-gether, amid a new trend of combinations of banks and financial service organisations, thus rendering the processes of evaluation, merging and annexing timely and relevant. From the traditional viewpoint, the roles of banks, insurance companies and consolidated funds were separate, and their financial ser-vices were different. Nowadays, differences betweeen these finance providers are becoming blurred, as legislation allows combinations of services between banks, insurance services and consolidated funds. Implementation of the new legislation has created numerous challenges financial service providers, in-cluding the possibility to restructure their business operations end enter the realms of investment man-agement, insurance and various other forms of financial services.
Consolidation and amalgamation stem from deregulation, technological advances and more favour-able prospects for more profitable, productive and cost-effective survival on the financial market. Pro-ductive and profitable conslidations and amalgamations make an impact on cost efficiency, which in turn creates a higher competitive intensity and lower prices of banking services. Consolidation and amalgamation in the finance service industry can be expected to make a direct impact on creating more competitive prices aimed at a higher supply of financial products and services.
Increased competitiveness in the financial services industry, both at national and worldwide scale, is regarded as a significant factor in shaping this financial industry. Global competition in providing fi-nancial services could be achieved by lowering financial services providers’ costs or developing a niche of differentiated financial products and services. To become low-cost providers, banks should be large enough to generate the effects of economies of scale. Differentiation is hard to achieve in banking, as financial products and services are relatively homogenous (current accounts, savings accounts, loans etc.).
Cumulative effects of consolidation and amalgamation are present at the local banking market, and shift towards universal banking and convenience of banking products and services. Banks and banking organisations shift towards offering retail services, insurance and asset management service (property, securities etc.) In this manner, the banking services market becomes realatively homogenous. Global competition and easy access to banking services through the internet influence financial institutions to provide a variety of banking products and services. Banking products and services will be provided at comparatively competitive and similar interest rates, through an extensive network of business units. Banking products will mostly be seen as commodities available to any buyer via Internet services.
14 Nenad Vunjak et al. The Challenges of Change on the Banking Market in the Conditions of Financial Crisis
STRATEGIC MANAGEMENT, Vol. 17 (2012), No. 3, pp. 010-020
Amid the global financial crises, banks defined a new management philosophy, through which they were oriented more towards markets than towards regulators, in order to be able to “struggle” on a highly competitive global market. In the early 1990s (like in the conditions of the financial crisis), banks that were strong and well capitalised acquired other banks and grew stronger, whereas weaker banks grew even weaker. Strong banks and banking organisations with effective and efficient performance and high capital coefficients were often regarded to enjoy the preference of the financial market and regula-tory institutions.
Consolidation, amalgamation and competition made an impact on deep changes in financial institu-tions. It must be pointed out that financial institutions help their clients to maintain and manage highly diversified portfolios of marketable securities (with pension funds and consolidated funds) with low maintenance costs. This is what differentiates financial institutions from most other industries and busi-nesses.
On the modern-day banking market, consolidation refers to integrating and consolidating the re-sources of banks and financial instituions into larger and fewer insitutions by means of mergers and ac-quistions. Intense process of mergers and acquisitions of banks in late twentieth-back was intended: a) the creation of a larger volume of business, b) increase the range of banking products and services, c) the conquest of new financial markets d) the establishment of development banks repositioning strategy in the long term (Vunjak, Ćurčić, & Kovačević, 2009, p. 284). Especially among financial institutions, the driving forces of current consolidations are: (1) deregulation of geographic and product-related re-strictions; (2) technological progress; (3) healthy financial position and profit-making financial financial conditions; and (5) rising stock prices. The use of derivatives has become a common bank risk man-agement tool. The wave of mega-mergers has essentially reduced the number of financial instutions, as the financial services industry consolidatied. Banks were consolidated with regulatory restrictions, and therefore transferred their commercial operations towards investing in securities and insurance opera-tions. The recent wave of merging financial services started with the emergence of technologies that made the financial services industry more competitive and efficient. There is no evidence that new mergers were motivated by planned monopolisation of banking services and increasing fees for per-forming financial services. It must be pointed that the financial services industry, especially banking, has remained far less concentrated than many other competing industries (e.g. automotive industry, communication etc.).
Amalgamation within the financial services industry is defined as integration of banks and financial services (insurance companies, consolidated funds, brokerages etc.) through a combination and expan-sion of their products and services. Amalgamations (associations) may occur through
1. mergers and acquisitions of banks and other financial organisations, 2. creating banking holding companies and 3. establishing financial holding companies (Gramm-Leach-Bliley Act, 1999).
In the period before the global financial crisis, the services of banks, banking services, consolidated funds and brokerages were distinguishable and separated. Banks were involved in ofering traditional services, such as deposits, loans and transaction-related activities. Insurance companies provided the services of automotive, property and personal insurance. In the period of the global financial crisis, the differences between the functions of these financial providers have become less noticeable, as all pro-viders offer all, or similar, or even identical services and products.
Certain regulations in the USA and other developed countries have allowed banks, brokerages, in-surance companies and consolidated funds to freely enter any other business, consolidate, associate and affiliate. Such an approach enabled the creation of financial holding companies able to manage a broad spectrum of financial services including insurance, issuing securities, commercial banking, investment banking, bank asset management, trading in real estate, brokerage and dealership operations, etc.
2. Bank management strategy in the conditions of financial crisis
Bank management strategy in the conditions of financial crisis can be defined as a planned decision di-recting the bank’s business activity towards achieving the set goals. The bank management strategy may refer to achieving the bank’s primary goals and achieving the bank’s partial, i.e. individual business goals. Typical examples of such strategy are (a) the bank’s marketing strategy; (b) pricing strategy; (c)
Nenad Vunjak et al. The Challenges of Change on the Banking Market in the Conditions of Financial Crisis 15
STRATEGIC MANAGEMENT, Vol. 17 (2012), No. 3, pp. 010-020
the strategy of banking products and services; (d) human resource utilisation strategy, etc. All of them should have their outcome in a bank strategy that represents the bank’s basic direction in the future time, all with the aim of overcoming the global financial crisis.
The bank management strategy is a vision, i.e. a framework determining the directions of a given bank’s lines of action. A strategy is usually what a bank wants to be, how it operates and which path it is to follow to arrive at the desired destination. A bank’s strategy needs to have two key dimensions, i.e. (1) operative dimension and (2) strategic dimension. The operative dimension refers to internal efficiency, i.e. the bank “doing things the right way”, and conducting its operations rationally. The strategic dimension refers to the bank “doing the right things” and being effective on the financial market (offering banking products and services negotiable on the financial market and profitable for the bank). For these reasons, what is essential for a bank in the global financial crisis is the correlation between strategy and operations. Banking strategy is the activity of “what” is done in the bank, whereas operativ strategy focuses on “how” things are done at the bank. (Vunjak, Zelenovic, Birovljev, & Milenkovic, 2012)
To define a bank’s strategic vision, it is necessary to formulate answers to the following questions:
1. What is the bank’s basic commitment? 2. What is the bank’s driving force? 3. What is creates the momentum of the bank’s new business development? 4. What is the bank’s future horizon (the range of banking products, and services, market and mix),
and what did the bank place focus on? 5. What key capabilities are required from the bank management? 6. What are the guidelines for the bank’s future growth and return on invested capital?
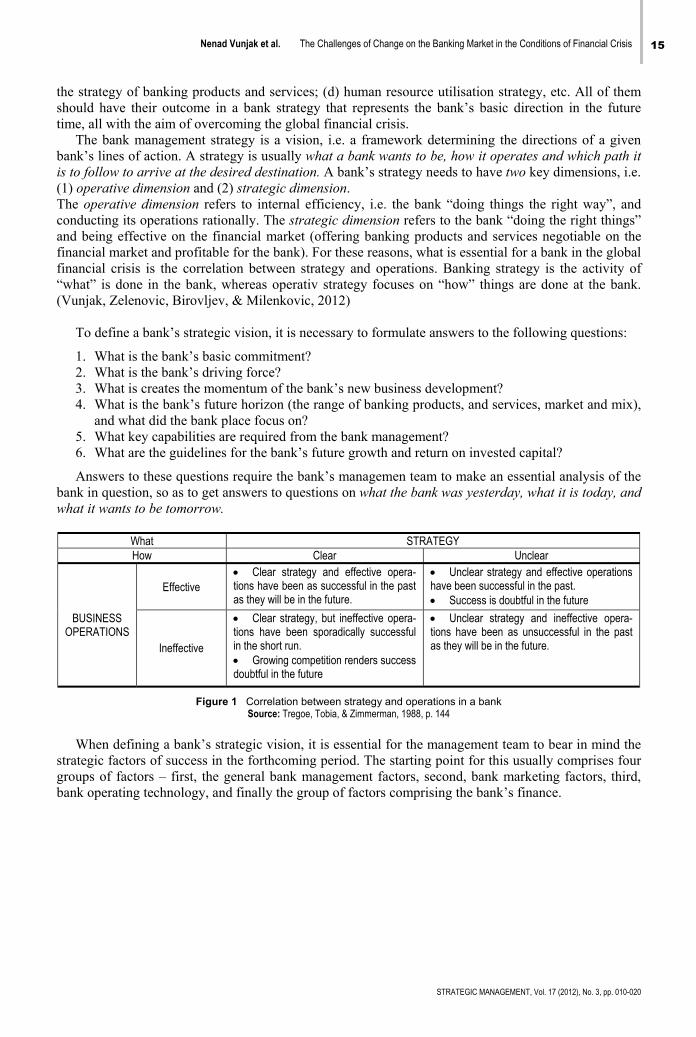
Answers to these questions require the bank’s managemen team to make an essential analysis of the bank in question, so as to get answers to questions on what the bank was yesterday, what it is today, and what it wants to be tomorrow.
What STRATEGY How Clear Unclear
BUSINESS OPERATIONS
Effective Clear strategy and effective opera-tions have been as successful in the past as they will be in the future.
Unclear strategy and effective operations have been successful in the past. Success is doubtful in the future
Ineffective
Clear strategy, but ineffective opera-tions have been sporadically successful in the short run. Growing competition renders success doubtful in the future
Unclear strategy and ineffective opera-tions have been as unsuccessful in the past as they will be in the future.
Figure 1 Correlation between strategy and operations in a bank Source: Tregoe, Tobia, & Zimmerman, 1988, p. 144
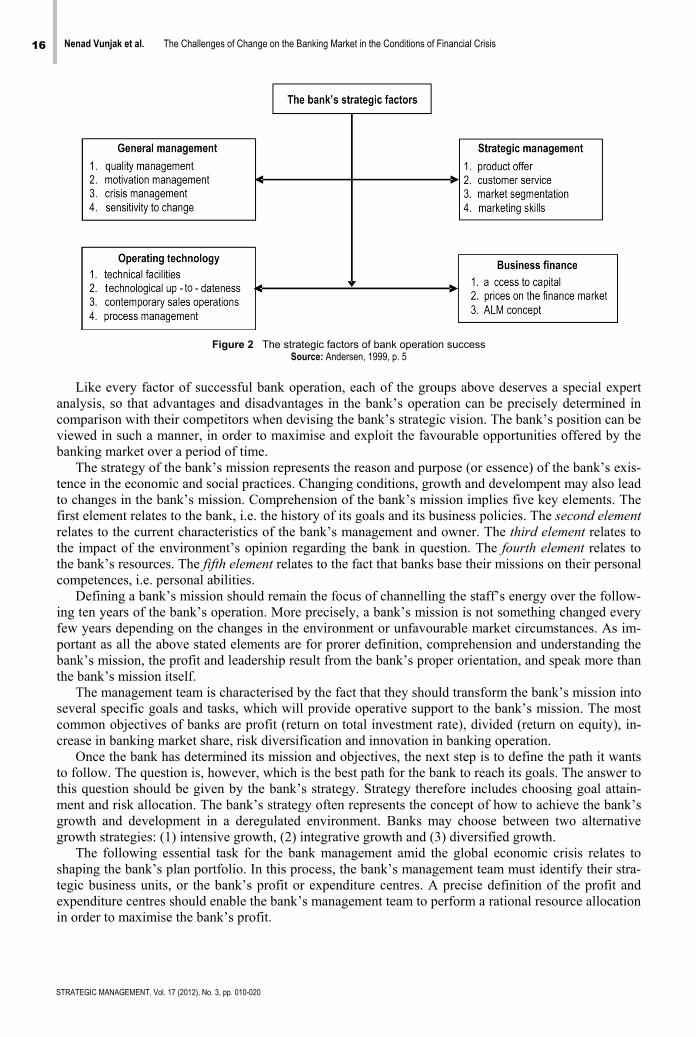
When defining a bank’s strategic vision, it is essential for the management team to bear in mind the
strategic factors of success in the forthcoming period. The starting point for this usually comprises four groups of factors – first, the general bank management factors, second, bank marketing factors, third, bank operating technology, and finally the group of factors comprising the bank’s finance.
16 Nenad Vunjak et al. The Challenges of Change on the Banking Market in the Conditions of Financial Crisis
STRATEGIC MANAGEMENT, Vol. 17 (2012), No. 3, pp. 010-020
Figure 2 The strategic factors of bank operation success Source: Andersen, 1999, p. 5
Like every factor of successful bank operation, each of the groups above deserves a special expert
analysis, so that advantages and disadvantages in the bank’s operation can be precisely determined in comparison with their competitors when devising the bank’s strategic vision. The bank’s position can be viewed in such a manner, in order to maximise and exploit the favourable opportunities offered by the banking market over a period of time.
The strategy of the bank’s mission represents the reason and purpose (or essence) of the bank’s exis-tence in the economic and social practices. Changing conditions, growth and develompent may also lead to changes in the bank’s mission. Comprehension of the bank’s mission implies five key elements. The first element relates to the bank, i.e. the history of its goals and its business policies. The second element relates to the current characteristics of the bank’s management and owner. The third element relates to the impact of the environment’s opinion regarding the bank in question. The fourth element relates to the bank’s resources. The fifth element relates to the fact that banks base their missions on their personal competences, i.e. personal abilities.
Defining a bank’s mission should remain the focus of channelling the staff’s energy over the follow-ing ten years of the bank’s operation. More precisely, a bank’s mission is not something changed every few years depending on the changes in the environment or unfavourable market circumstances. As im-portant as all the above stated elements are for prorer definition, comprehension and understanding the bank’s mission, the profit and leadership result from the bank’s proper orientation, and speak more than the bank’s mission itself.
The management team is characterised by the fact that they should transform the bank’s mission into several specific goals and tasks, which will provide operative support to the bank’s mission. The most common objectives of banks are profit (return on total investment rate), divided (return on equity), in-crease in banking market share, risk diversification and innovation in banking operation.
Once the bank has determined its mission and objectives, the next step is to define the path it wants to follow. The question is, however, which is the best path for the bank to reach its goals. The answer to this question should be given by the bank’s strategy. Strategy therefore includes choosing goal attain-ment and risk allocation. The bank’s strategy often represents the concept of how to achieve the bank’s growth and development in a deregulated environment. Banks may choose between two alternative growth strategies: (1) intensive growth, (2) integrative growth and (3) diversified growth.
The following essential task for the bank management amid the global economic crisis relates to shaping the bank’s plan portfolio. In this process, the bank’s management team must identify their stra-tegic business units, or the bank’s profit or expenditure centres. A precise definition of the profit and expenditure centres should enable the bank’s management team to perform a rational resource allocation in order to maximise the bank’s profit.
Nenad Vunjak et al. The Challenges of Change on the Banking Market in the Conditions of Financial Crisis 17
STRATEGIC MANAGEMENT, Vol. 17 (2012), No. 3, pp. 010-020
3. Internal change management strategy in banks
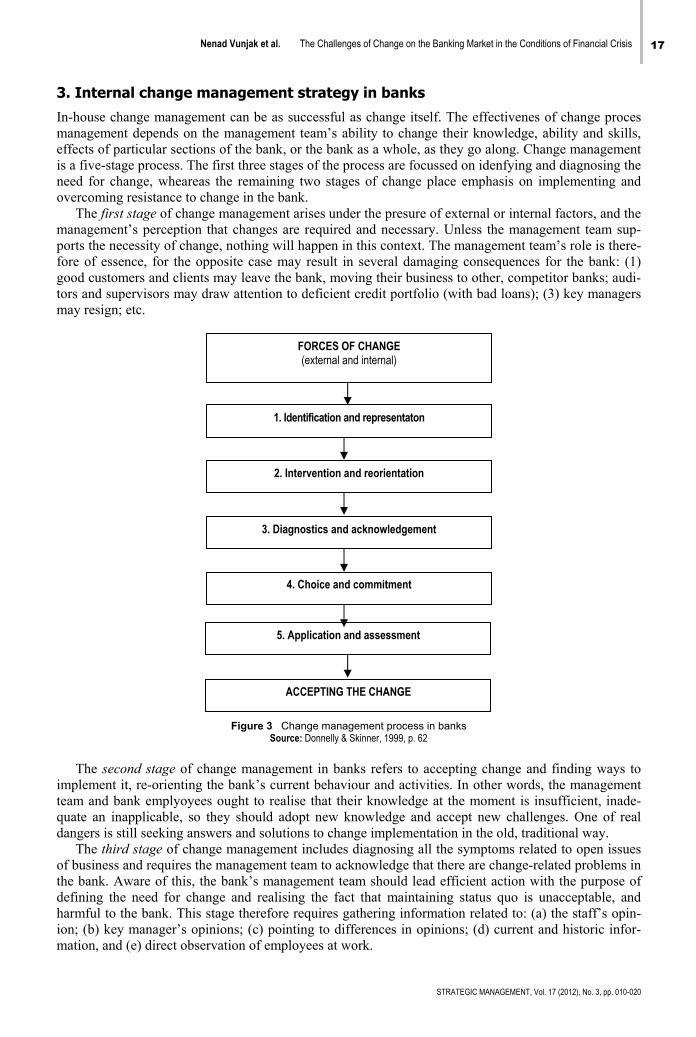
In-house change management can be as successful as change itself. The effectivenes of change proces management depends on the management team’s ability to change their knowledge, ability and skills, effects of particular sections of the bank, or the bank as a whole, as they go along. Change management is a five-stage process. The first three stages of the process are focussed on idenfying and diagnosing the need for change, wheareas the remaining two stages of change place emphasis on implementing and overcoming resistance to change in the bank.
The first stage of change management arises under the presure of external or internal factors, and the management’s perception that changes are required and necessary. Unless the management team sup-ports the necessity of change, nothing will happen in this context. The management team’s role is there-fore of essence, for the opposite case may result in several damaging consequences for the bank: (1) good customers and clients may leave the bank, moving their business to other, competitor banks; audi-tors and supervisors may draw attention to deficient credit portfolio (with bad loans); (3) key managers may resign; etc.
Figure 3 Change management process in banks Source: Donnelly & Skinner, 1999, p. 62
The second stage of change management in banks refers to accepting change and finding ways to
implement it, re-orienting the bank’s current behaviour and activities. In other words, the management team and bank emplyoyees ought to realise that their knowledge at the moment is insufficient, inade-quate an inapplicable, so they should adopt new knowledge and accept new challenges. One of real dangers is still seeking answers and solutions to change implementation in the old, traditional way.
The third stage of change management includes diagnosing all the symptoms related to open issues of business and requires the management team to acknowledge that there are change-related problems in the bank. Aware of this, the bank’s management team should lead efficient action with the purpose of defining the need for change and realising the fact that maintaining status quo is unacceptable, and harmful to the bank. This stage therefore requires gathering information related to: (a) the staff’s opin-ion; (b) key manager’s opinions; (c) pointing to differences in opinions; (d) current and historic infor-mation, and (e) direct observation of employees at work.
FORCES OF CHANGE (external and internal)
1. Identification and representaton
2. Intervention and reorientation
3. Diagnostics and acknowledgement
4. Choice and commitment
5. Application and assessment
ACCEPTING THE CHANGE
18 Nenad Vunjak et al. The Challenges of Change on the Banking Market in the Conditions of Financial Crisis
STRATEGIC MANAGEMENT, Vol. 17 (2012), No. 3, pp. 010-020
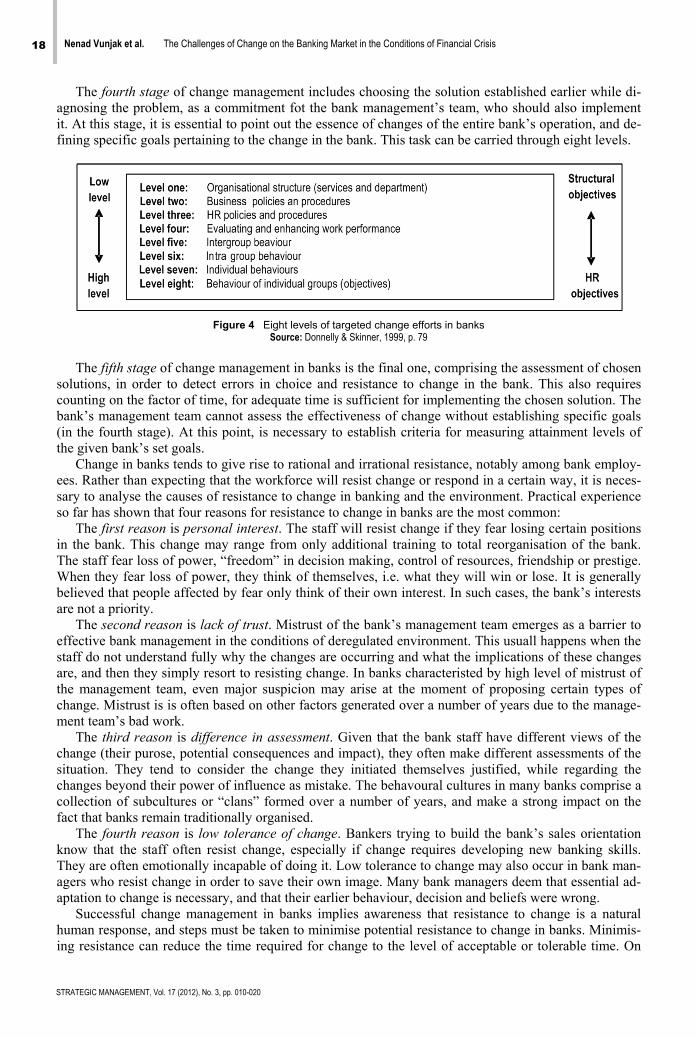
The fourth stage of change management includes choosing the solution established earlier while di-agnosing the problem, as a commitment fot the bank management’s team, who should also implement it. At this stage, it is essential to point out the essence of changes of the entire bank’s operation, and de-fining specific goals pertaining to the change in the bank. This task can be carried through eight levels.
Figure 4 Eight levels of targeted change efforts in banks Source: Donnelly & Skinner, 1999, p. 79
The fifth stage of change management in banks is the final one, comprising the assessment of chosen
solutions, in order to detect errors in choice and resistance to change in the bank. This also requires counting on the factor of time, for adequate time is sufficient for implementing the chosen solution. The bank’s management team cannot assess the effectiveness of change without establishing specific goals (in the fourth stage). At this point, is necessary to establish criteria for measuring attainment levels of the given bank’s set goals.
Change in banks tends to give rise to rational and irrational resistance, notably among bank employ-ees. Rather than expecting that the workforce will resist change or respond in a certain way, it is neces-sary to analyse the causes of resistance to change in banking and the environment. Practical experience so far has shown that four reasons for resistance to change in banks are the most common:
The first reason is personal interest. The staff will resist change if they fear losing certain positions in the bank. This change may range from only additional training to total reorganisation of the bank. The staff fear loss of power, “freedom” in decision making, control of resources, friendship or prestige. When they fear loss of power, they think of themselves, i.e. what they will win or lose. It is generally believed that people affected by fear only think of their own interest. In such cases, the bank’s interests are not a priority.
The second reason is lack of trust. Mistrust of the bank’s management team emerges as a barrier to effective bank management in the conditions of deregulated environment. This usuall happens when the staff do not understand fully why the changes are occurring and what the implications of these changes are, and then they simply resort to resisting change. In banks characteristed by high level of mistrust of the management team, even major suspicion may arise at the moment of proposing certain types of change. Mistrust is is often based on other factors generated over a number of years due to the manage-ment team’s bad work.
The third reason is difference in assessment. Given that the bank staff have different views of the change (their purose, potential consequences and impact), they often make different assessments of the situation. They tend to consider the change they initiated themselves justified, while regarding the changes beyond their power of influence as mistake. The behavoural cultures in many banks comprise a collection of subcultures or “clans” formed over a number of years, and make a strong impact on the fact that banks remain traditionally organised.
The fourth reason is low tolerance of change. Bankers trying to build the bank’s sales orientation know that the staff often resist change, especially if change requires developing new banking skills. They are often emotionally incapable of doing it. Low tolerance to change may also occur in bank man-agers who resist change in order to save their own image. Many bank managers deem that essential ad-aptation to change is necessary, and that their earlier behaviour, decision and beliefs were wrong.
Successful change management in banks implies awareness that resistance to change is a natural human response, and steps must be taken to minimise potential resistance to change in banks. Minimis-ing resistance can reduce the time required for change to the level of acceptable or tolerable time. On
Nenad Vunjak et al. The Challenges of Change on the Banking Market in the Conditions of Financial Crisis 19
STRATEGIC MANAGEMENT, Vol. 17 (2012), No. 3, pp. 010-020
the other hand, badly implemented changes will not produce result, as they will be superficial, short-lived and often deformed. Resistance to change can be minimised by means of many methods, used in various situations and in various combinations. Combinations may include:
1. Education and communication, which may serve as a way of minimising resistance to change (education and communication need to be initiated before resistance to change emerges). Educa-tion and communication helps prepare staff to change. Clear definition of the avenues of change, pointing to the necessity and logic of change, and permanent information dissemination among all staff all the time may reduce resistance to change in a bank.
2. Participation and involvement of the staff who will be affected by change may help in the design and implementation, and help increase their contribution to change. If the staff feel that their be-haviour and ideas are included in the change effort, change will be more respected and there will be less resistance to change in the bank.
3. Equipment and support from managers and their ability to actively participate in banking changes. Managers should show interest in their co-workers, be good listeners, and point to the significance of change in the bank.
4. Negotiation and consent may make an impact, in terms of reducing resistance to change. Discus-sions and analyses may often help managers from different functional bank departments identify negotiating points and points of joint consent.
5. Explicit and implicit corrections may force the staff to accept change under the threat of dis-missal, reduced promotion opportunities, downgrading and loss of benefits. Such behaviour is, of course, risky and increases the likelihood of major problems on the path to change, plus the in-creased mistrust of the bank management.
6. Manipulation and cooperation may influence acceptance of change in banking. The staff can be manipulated with information they receive, in such a way that one department is confronted with another, i.e. disseminating misinformation. The staff can cooperate when given a major and visi-ble role in change design and implementation. These high-risk methods have a high probability of quenching fire by pouring oil, provided that it is viewed over a longer period of time.
Conclusion
The negative impact of the global economic crisis is also present in the national economy, due to the existence of negative trade balance in the exchange with the countries in Europe and worldwide. The financial crisis in Serbia has caused lower capital inflow, producing lower indebtedness levels (smaller presence of foreign direct investment), devaluation of the national curency and reduction in the foreign exchange reserves. A mitigating circumstance is that domestic banks do not have debtors’ mortgage securities, nor do they figure as shareholders of bankrupt financial institutions and banks (Zakic, Vun-jak, Besic, & Simic, 2012). Given that, amid the financial cisis, foreign investors opt to invest only in the best projects, these ought to be offered on the domestic market market as well, so as to attract for-eign capital. Increased interest rates on foreign loans have made a direct impact on the increase in the cost of domestic loan arrangements.
The second wave of the financial crisis emerged in the form of debt crisis, which partly did not spare the domestic banking market. All the facts related to the indebtednes of domestic economy show that Serbia ranges among indebted countries, and yet it still tends to take more loans through the IMF and the World Bank. It must be pointed out that collection of public revenue for the budget of the Republic of Serbia still displays a problem unsolvable without active participation of the Ministry of Finance and the Tax Department. Serbia is currently facing a relatively low collection of public revenue, notably the budget revenue. The exit towards maintaining current liquidity of the Serbian national budget is in issu-ing treasury bills of various volume and various maturity dates (euro bonds issued to 10 years amount-ing to 1.0 bn USD, with an annual interest rate of 7.25%). Financing the budget deficit and redemption of issued national bonds can be provided from domestic loans, foreign credit lines, foreign multinational institutions etc. SM
20 Nenad Vunjak et al. The Challenges of Change on the Banking Market in the Conditions of Financial Crisis
STRATEGIC MANAGEMENT, Vol. 17 (2012), No. 3, pp. 010-020
References
Andersen, A. (1999). New Dimensions in Banking: Managing the Strategic Position. Chicago: Bank Administration Institute. Ćurčić, U. (2003). Upravljanje rastom i performansama banke. Loznica: Mladost-holding, Color Print. Donnelly, H., & Skinner, J. S. (1999). The New Banker Develop Leadership in a Dynamic Era. Homewood: Dow Jones-
Irwin. Gramm-Leach-Bliley Act. (1999). Thrifts Permissible Activities Affiliations. Hawkins, J., & Mihaljak, D. (2001). The banking industry in the emerging market economies: competition, consolidation and
systemic stability – an overview. Basel: Bank for International Settlements (BIS). Koch, W. T., & Macdonald, S. S. (2003). Bank Management. New York: Thomson-South-Western. Krstić, B. (2004). Bankarski menadžment. Niš: Ekonomski fakultet. Mishkin, S. F., & Strahan, E. P. (1999). What will Technology Do to Financial Structure? NBER Working Papers, National
Bureau of Economic Research, Cambridge. Tregoe, B. B., Tobia, M. P., & Zimmerman, W. J. (1988). In Strategy and Resource Allocation. In W. H. Baughn, T. I. Storrs,
& C. E. Walker (Eds.), The Bankers’ Handbook (3rd edition). Homewood: Dow Jones - Irwin. Vunjak, N., & Kovačević, L. (2006). Bankarstvo (Bankarski menadžment). Bečej, Subotica: Proleter, Ekonomski fakultet
Subotica. Vunjak, N., Ćurčić, U., & Kovačević, L. (2009). Korporativno i investiciono bankarstvo. Bečej, Subotica, Belgrade: Proleter,
Ekonomski fakultet Subotica, Čigoja. Vunjak, N., Ćurčić, U., & Kovačević, L. (2011). Strategijski menadžment u bankarstvu. Bečej, Subotica, Travnik:
Proleter,Ekonomski fakultet Subotica, Internacionalni Univerzitet. Vunjak, N., Zelenovic, V., Birovljev, J., & Milenkovic, I. (2012). Strategic Planning in Banking. TTEM - Technics
Technologies Education Management, 7 (1), 196-203. Zakic, V., Vunjak, N., Besic, C., & Simic, J. (2012). Significance of Economic Value Added in Shareholder Value Creation
Process. TTEM - Technics Technologies Education Management, 7 (1), 180-185. Correspondence
Nenad Vunjak
Faculty of Economics Subotica Segedinski put 9-11, 24000, Subotica, Serbia
E-mail: [email protected]
STRATEGIC MANAGEMENT, Vol. 17 (2012), No. 3, pp. 021-028 UDC 005.334:334.716(497.11)"2008-2010”; 005.52:005.336.1(497.11)"2008-2010"
Received: March 15, 2012
Accepted: September 2, 2012
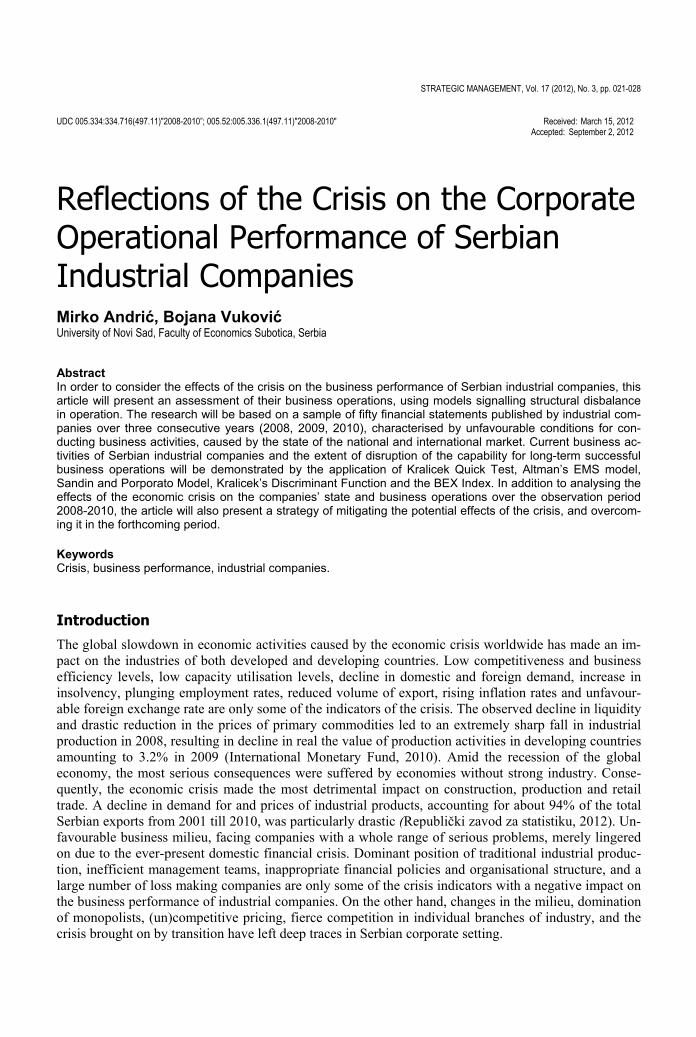
Reflections of the Crisis on the Corporate Operational Performance of Serbian Industrial Companies
Mirko Andrić, Bojana Vuković University of Novi Sad, Faculty of Economics Subotica, Serbia
Abstract In order to consider the effects of the crisis on the business performance of Serbian industrial companies, thisarticle will present an assessment of their business operations, using models signalling structural disbalancein operation. The research will be based on a sample of fifty financial statements published by industrial com-panies over three consecutive years (2008, 2009, 2010), characterised by unfavourable conditions for con-ducting business activities, caused by the state of the national and international market. Current business ac-tivities of Serbian industrial companies and the extent of disruption of the capability for long-term successful business operations will be demonstrated by the application of Kralicek Quick Test, Altman’s EMS model,Sandin and Porporato Model, Kralicek’s Discriminant Function and the BEX Index. In addition to analysing theeffects of the economic crisis on the companies’ state and business operations over the observation period2008-2010, the article will also present a strategy of mitigating the potential effects of the crisis, and overcom-ing it in the forthcoming period. Keywords Crisis, business performance, industrial companies.
Introduction
The global slowdown in economic activities caused by the economic crisis worldwide has made an im-pact on the industries of both developed and developing countries. Low competitiveness and business efficiency levels, low capacity utilisation levels, decline in domestic and foreign demand, increase in insolvency, plunging employment rates, reduced volume of export, rising inflation rates and unfavour-able foreign exchange rate are only some of the indicators of the crisis. The observed decline in liquidity and drastic reduction in the prices of primary commodities led to an extremely sharp fall in industrial production in 2008, resulting in decline in real the value of production activities in developing countries amounting to 3.2% in 2009 (International Monetary Fund, 2010). Amid the recession of the global economy, the most serious consequences were suffered by economies without strong industry. Conse-quently, the economic crisis made the most detrimental impact on construction, production and retail trade. A decline in demand for and prices of industrial products, accounting for about 94% of the total Serbian exports from 2001 till 2010, was particularly drastic (Republički zavod za statistiku, 2012). Un-favourable business milieu, facing companies with a whole range of serious problems, merely lingered on due to the ever-present domestic financial crisis. Dominant position of traditional industrial produc-tion, inefficient management teams, inappropriate financial policies and organisational structure, and a large number of loss making companies are only some of the crisis indicators with a negative impact on the business performance of industrial companies. On the other hand, changes in the milieu, domination of monopolists, (un)competitive pricing, fierce competition in individual branches of industry, and the crisis brought on by transition have left deep traces in Serbian corporate setting.
22 Mirko Andrić et al. Reflections of the Crisis on the Corporate Operational Performance of Serbian Industrial Companies
STRATEGIC MANAGEMENT, Vol. 17 (2012), No. 3, pp. 021-028
In 2009, the many years of uncompetiteveness of industry, coupled with unfavourable business con-ditions caused by the global recession, brought Serbia down to 44.6% of the 1990 production levels (Ministarstvo ekonomije i regionalnog razvoja, 2011). The causes for this included lack of investment funds and finance for current reproduction, low level of technical capacities and outdated technology, inadequate credit support and low expertise levels of employed human resources. The highest participa-tion ratio in the industry sector over the observation period was that of processing industry, contributing to the unsatisfactory trend of change in the structure of technical intensity. The technological level of quality, structure and organisational compatibility of production capacities further limited the produc-tion capacity of industrial companies. The lowest capacity utilisation rates in Serbia in 2009 were found in furniture and miscellaneous product manufacture (15.7%) and basic metal production (23%), due to a particularly sharp decline in production in these industries. Production capacities were outdated rapidly and were utilised inadequately due to shortage of working capital. Industry was characterised by a low share of equipment production in the total industrial production. In addition, Serbia faced insufficient exports and insufficient foreign direct investment, resulting in low supply of commodities for export and slower modernisation of industrial production. Accordingly, the state of world economy and unfa-vourable international environment in 2009 caused major negative consequences for Serbian economy including, among other things, decline in industrial production (-12.1%), especially processing industry (-15,8%) (Ministarstvo ekonomije i regionalnog razvoja, 2011). Losses of most industrial companies were manifested, above all, as the consequence of unfinished restructuring process of large enterprises. The economic crises permanently pointed to inconsistencies in setting and implementing industrial poli-cies, in creating a strong industrial basis and substantial growth in exports. Under such conditions, in-dustrial companies were faced with a whole range of limitations in their attempt to achieve economic, financial and production results, which was also manifested in the companies’ overall performance.
Operative performance of industrial companies was analysed in order to consider the effects of the crisis on the business performance of Serbian industrial companies,. The research is based on a sample of 50 financial statements. The object of observation were the main determinants of companies’ opera-tive achievement over the period from 2008 till 2010, with the aim of presenting the business activities of industrial companies in Serbia, and the extent of disruption of the capability for long-term successful business operations due to slowdown in economic activities caused by the global economic crisis.
1. The subject of the assessment of operative business performance of companies
A company’s operative performance is the company’s ability to grow and develop through business activities. Building an efficient company management system requires developing an appropriate per-formance measure system. A performance measurement system links the company’s strategy with cur-rent operations, providing relevant information on the achievement of goals aimed at realising the de-fined strategies (Neely, 1998, p. 15). Measuring a company’s performance leads to inferences on the degree of success of business operations, but also on the indications of emergence of threat to survival. Accordingly, the role of information on the general conditions of operative business for the purpose of forecasting future trends in the company's operations is natural (Andrić & Vuković, 2011, p. 509). A dynamic approach to monitoring, analysing and evaluating operative achievements results in derived assessment of the company’s operation, based on financial statements that reflect the utilisation of the enterprise’s resources. The aim of analysing financial reports using financial indicators is timely detec-tion of the threat of crisis emerging in a company’s functioning (Rodić, Vukelić, & Andrić, 2011, p. 100). Financial indicators are usually represented as models analysing the overall state of the company’s operations, with the aim of warning against threatening circumstances for continued operations in the forthcoming period. Among others, this group of models includes Kralicek Quick Test, Altman’s EMS model and Kralicek’s Discriminant Function. These models are used for drawing conclusions on whether the company’s operations are healthy or the condition indicates to the existence of one of the stages of crisis development. The above mentioned models will be used as a basis for analysing the per-formance of industrial companies in Serbia in the period of crisis.
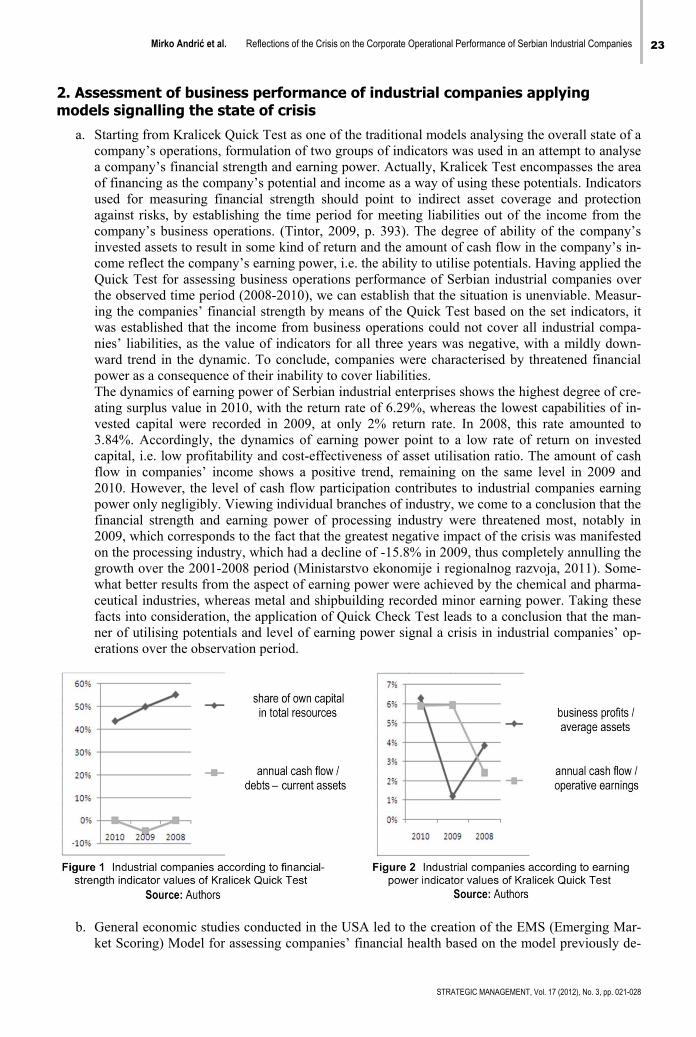
Mirko Andrić et al. Reflections of the Crisis on the Corporate Operational Performance of Serbian Industrial Companies 23
STRATEGIC MANAGEMENT, Vol. 17 (2012), No. 3, pp. 021-028
2. Assessment of business performance of industrial companies applying models signalling the state of crisis
a. Starting from Kralicek Quick Test as one of the traditional models analysing the overall state of a company’s operations, formulation of two groups of indicators was used in an attempt to analyse a company’s financial strength and earning power. Actually, Kralicek Test encompasses the area of financing as the company’s potential and income as a way of using these potentials. Indicators used for measuring financial strength should point to indirect asset coverage and protection against risks, by establishing the time period for meeting liabilities out of the income from the company’s business operations. (Tintor, 2009, p. 393). The degree of ability of the company’s invested assets to result in some kind of return and the amount of cash flow in the company’s in-come reflect the company’s earning power, i.e. the ability to utilise potentials. Having applied the Quick Test for assessing business operations performance of Serbian industrial companies over the observed time period (2008-2010), we can establish that the situation is unenviable. Measur-ing the companies’ financial strength by means of the Quick Test based on the set indicators, it was established that the income from business operations could not cover all industrial compa-nies’ liabilities, as the value of indicators for all three years was negative, with a mildly down-ward trend in the dynamic. To conclude, companies were characterised by threatened financial power as a consequence of their inability to cover liabilities. The dynamics of earning power of Serbian industrial enterprises shows the highest degree of cre-ating surplus value in 2010, with the return rate of 6.29%, whereas the lowest capabilities of in-vested capital were recorded in 2009, at only 2% return rate. In 2008, this rate amounted to 3.84%. Accordingly, the dynamics of earning power point to a low rate of return on invested capital, i.e. low profitability and cost-effectiveness of asset utilisation ratio. The amount of cash flow in companies’ income shows a positive trend, remaining on the same level in 2009 and 2010. However, the level of cash flow participation contributes to industrial companies earning power only negligibly. Viewing individual branches of industry, we come to a conclusion that the financial strength and earning power of processing industry were threatened most, notably in 2009, which corresponds to the fact that the greatest negative impact of the crisis was manifested on the processing industry, which had a decline of -15.8% in 2009, thus completely annulling the growth over the 2001-2008 period (Ministarstvo ekonomije i regionalnog razvoja, 2011). Some-what better results from the aspect of earning power were achieved by the chemical and pharma-ceutical industries, whereas metal and shipbuilding recorded minor earning power. Taking these facts into consideration, the application of Quick Check Test leads to a conclusion that the man-ner of utilising potentials and level of earning power signal a crisis in industrial companies’ op-erations over the observation period.
b. General economic studies conducted in the USA led to the creation of the EMS (Emerging Mar-
ket Scoring) Model for assessing companies’ financial health based on the model previously de-
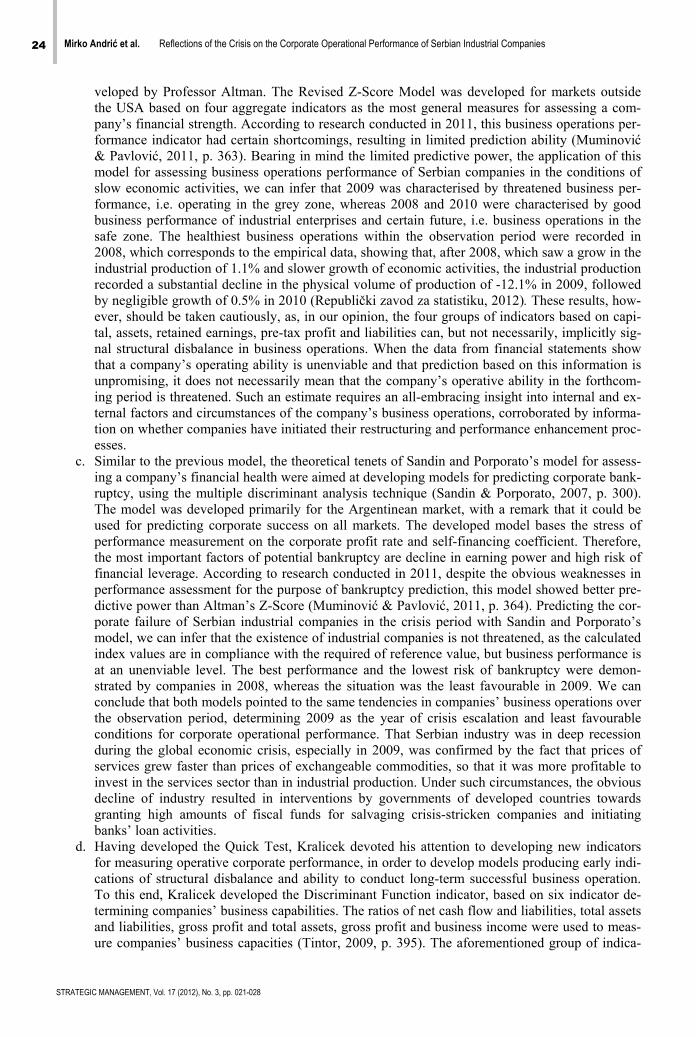
24 Mirko Andrić et al. Reflections of the Crisis on the Corporate Operational Performance of Serbian Industrial Companies
STRATEGIC MANAGEMENT, Vol. 17 (2012), No. 3, pp. 021-028
veloped by Professor Altman. The Revised Z-Score Model was developed for markets outside the USA based on four aggregate indicators as the most general measures for assessing a com-pany’s financial strength. According to research conducted in 2011, this business operations per-formance indicator had certain shortcomings, resulting in limited prediction ability (Muminović & Pavlović, 2011, p. 363). Bearing in mind the limited predictive power, the application of this model for assessing business operations performance of Serbian companies in the conditions of slow economic activities, we can infer that 2009 was characterised by threatened business per-formance, i.e. operating in the grey zone, whereas 2008 and 2010 were characterised by good business performance of industrial enterprises and certain future, i.e. business operations in the safe zone. The healthiest business operations within the observation period were recorded in 2008, which corresponds to the empirical data, showing that, after 2008, which saw a grow in the industrial production of 1.1% and slower growth of economic activities, the industrial production recorded a substantial decline in the physical volume of production of -12.1% in 2009, followed by negligible growth of 0.5% in 2010 (Republički zavod za statistiku, 2012). These results, how-ever, should be taken cautiously, as, in our opinion, the four groups of indicators based on capi-tal, assets, retained earnings, pre-tax profit and liabilities can, but not necessarily, implicitly sig-nal structural disbalance in business operations. When the data from financial statements show that a company’s operating ability is unenviable and that prediction based on this information is unpromising, it does not necessarily mean that the company’s operative ability in the forthcom-ing period is threatened. Such an estimate requires an all-embracing insight into internal and ex-ternal factors and circumstances of the company’s business operations, corroborated by informa-tion on whether companies have initiated their restructuring and performance enhancement proc-esses.
c. Similar to the previous model, the theoretical tenets of Sandin and Porporato’s model for assess-ing a company’s financial health were aimed at developing models for predicting corporate bank-ruptcy, using the multiple discriminant analysis technique (Sandin & Porporato, 2007, p. 300). The model was developed primarily for the Argentinean market, with a remark that it could be used for predicting corporate success on all markets. The developed model bases the stress of performance measurement on the corporate profit rate and self-financing coefficient. Therefore, the most important factors of potential bankruptcy are decline in earning power and high risk of financial leverage. According to research conducted in 2011, despite the obvious weaknesses in performance assessment for the purpose of bankruptcy prediction, this model showed better pre-dictive power than Altman’s Z-Score (Muminović & Pavlović, 2011, p. 364). Predicting the cor-porate failure of Serbian industrial companies in the crisis period with Sandin and Porporato’s model, we can infer that the existence of industrial companies is not threatened, as the calculated index values are in compliance with the required of reference value, but business performance is at an unenviable level. The best performance and the lowest risk of bankruptcy were demon-strated by companies in 2008, whereas the situation was the least favourable in 2009. We can conclude that both models pointed to the same tendencies in companies’ business operations over the observation period, determining 2009 as the year of crisis escalation and least favourable conditions for corporate operational performance. That Serbian industry was in deep recession during the global economic crisis, especially in 2009, was confirmed by the fact that prices of services grew faster than prices of exchangeable commodities, so that it was more profitable to invest in the services sector than in industrial production. Under such circumstances, the obvious decline of industry resulted in interventions by governments of developed countries towards granting high amounts of fiscal funds for salvaging crisis-stricken companies and initiating banks’ loan activities.
d. Having developed the Quick Test, Kralicek devoted his attention to developing new indicators for measuring operative corporate performance, in order to develop models producing early indi-cations of structural disbalance and ability to conduct long-term successful business operation. To this end, Kralicek developed the Discriminant Function indicator, based on six indicator de-termining companies’ business capabilities. The ratios of net cash flow and liabilities, total assets and liabilities, gross profit and total assets, gross profit and business income were used to meas-ure companies’ business capacities (Tintor, 2009, p. 395). The aforementioned group of indica-
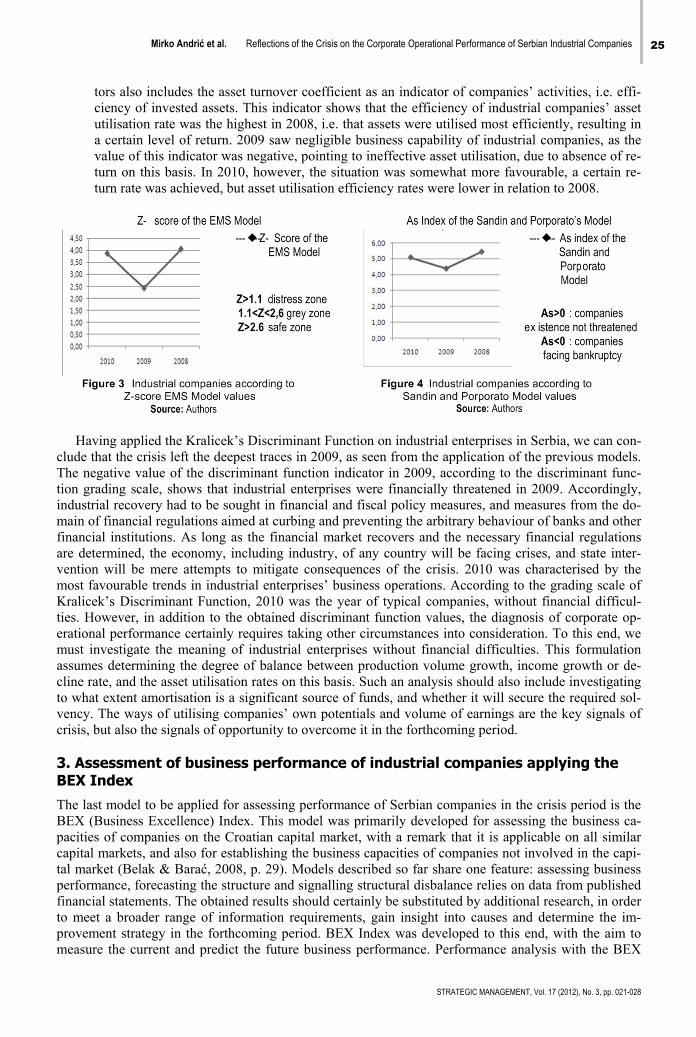
Mirko Andrić et al. Reflections of the Crisis on the Corporate Operational Performance of Serbian Industrial Companies 25
STRATEGIC MANAGEMENT, Vol. 17 (2012), No. 3, pp. 021-028
tors also includes the asset turnover coefficient as an indicator of companies’ activities, i.e. effi-ciency of invested assets. This indicator shows that the efficiency of industrial companies’ asset utilisation rate was the highest in 2008, i.e. that assets were utilised most efficiently, resulting in a certain level of return. 2009 saw negligible business capability of industrial companies, as the value of this indicator was negative, pointing to ineffective asset utilisation, due to absence of re-turn on this basis. In 2010, however, the situation was somewhat more favourable, a certain re-turn rate was achieved, but asset utilisation efficiency rates were lower in relation to 2008.
Having applied the Kralicek’s Discriminant Function on industrial enterprises in Serbia, we can con-
clude that the crisis left the deepest traces in 2009, as seen from the application of the previous models. The negative value of the discriminant function indicator in 2009, according to the discriminant func-tion grading scale, shows that industrial enterprises were financially threatened in 2009. Accordingly, industrial recovery had to be sought in financial and fiscal policy measures, and measures from the do-main of financial regulations aimed at curbing and preventing the arbitrary behaviour of banks and other financial institutions. As long as the financial market recovers and the necessary financial regulations are determined, the economy, including industry, of any country will be facing crises, and state inter-vention will be mere attempts to mitigate consequences of the crisis. 2010 was characterised by the most favourable trends in industrial enterprises’ business operations. According to the grading scale of Kralicek’s Discriminant Function, 2010 was the year of typical companies, without financial difficul-ties. However, in addition to the obtained discriminant function values, the diagnosis of corporate op-erational performance certainly requires taking other circumstances into consideration. To this end, we must investigate the meaning of industrial enterprises without financial difficulties. This formulation assumes determining the degree of balance between production volume growth, income growth or de-cline rate, and the asset utilisation rates on this basis. Such an analysis should also include investigating to what extent amortisation is a significant source of funds, and whether it will secure the required sol-vency. The ways of utilising companies’ own potentials and volume of earnings are the key signals of crisis, but also the signals of opportunity to overcome it in the forthcoming period.
3. Assessment of business performance of industrial companies applying the BEX Index
The last model to be applied for assessing performance of Serbian companies in the crisis period is the BEX (Business Excellence) Index. This model was primarily developed for assessing the business ca-pacities of companies on the Croatian capital market, with a remark that it is applicable on all similar capital markets, and also for establishing the business capacities of companies not involved in the capi-tal market (Belak & Barać, 2008, p. 29). Models described so far share one feature: assessing business performance, forecasting the structure and signalling structural disbalance relies on data from published financial statements. The obtained results should certainly be substituted by additional research, in order to meet a broader range of information requirements, gain insight into causes and determine the im-provement strategy in the forthcoming period. BEX Index was developed to this end, with the aim to measure the current and predict the future business performance. Performance analysis with the BEX
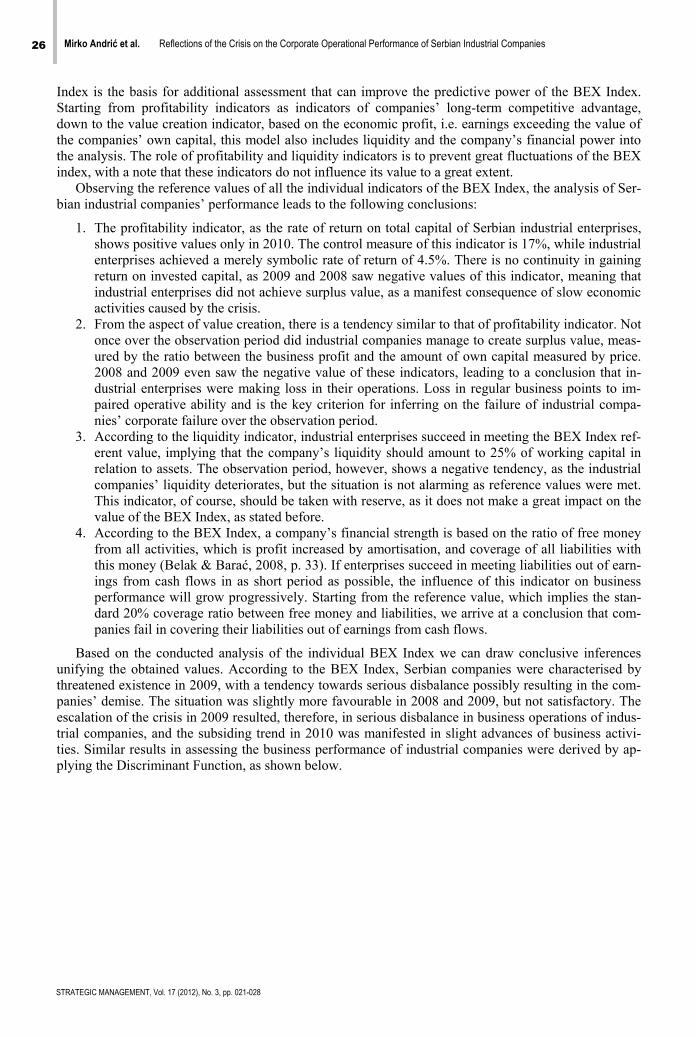
26 Mirko Andrić et al. Reflections of the Crisis on the Corporate Operational Performance of Serbian Industrial Companies
STRATEGIC MANAGEMENT, Vol. 17 (2012), No. 3, pp. 021-028
Index is the basis for additional assessment that can improve the predictive power of the BEX Index. Starting from profitability indicators as indicators of companies’ long-term competitive advantage, down to the value creation indicator, based on the economic profit, i.e. earnings exceeding the value of the companies’ own capital, this model also includes liquidity and the company’s financial power into the analysis. The role of profitability and liquidity indicators is to prevent great fluctuations of the BEX index, with a note that these indicators do not influence its value to a great extent.
Observing the reference values of all the individual indicators of the BEX Index, the analysis of Ser-bian industrial companies’ performance leads to the following conclusions:
1. The profitability indicator, as the rate of return on total capital of Serbian industrial enterprises, shows positive values only in 2010. The control measure of this indicator is 17%, while industrial enterprises achieved a merely symbolic rate of return of 4.5%. There is no continuity in gaining return on invested capital, as 2009 and 2008 saw negative values of this indicator, meaning that industrial enterprises did not achieve surplus value, as a manifest consequence of slow economic activities caused by the crisis.
2. From the aspect of value creation, there is a tendency similar to that of profitability indicator. Not once over the observation period did industrial companies manage to create surplus value, meas-ured by the ratio between the business profit and the amount of own capital measured by price. 2008 and 2009 even saw the negative value of these indicators, leading to a conclusion that in-dustrial enterprises were making loss in their operations. Loss in regular business points to im-paired operative ability and is the key criterion for inferring on the failure of industrial compa-nies’ corporate failure over the observation period.
3. According to the liquidity indicator, industrial enterprises succeed in meeting the BEX Index ref-erent value, implying that the company’s liquidity should amount to 25% of working capital in relation to assets. The observation period, however, shows a negative tendency, as the industrial companies’ liquidity deteriorates, but the situation is not alarming as reference values were met. This indicator, of course, should be taken with reserve, as it does not make a great impact on the value of the BEX Index, as stated before.
4. According to the BEX Index, a company’s financial strength is based on the ratio of free money from all activities, which is profit increased by amortisation, and coverage of all liabilities with this money (Belak & Barać, 2008, p. 33). If enterprises succeed in meeting liabilities out of earn-ings from cash flows in as short period as possible, the influence of this indicator on business performance will grow progressively. Starting from the reference value, which implies the stan-dard 20% coverage ratio between free money and liabilities, we arrive at a conclusion that com-panies fail in covering their liabilities out of earnings from cash flows.
Based on the conducted analysis of the individual BEX Index we can draw conclusive inferences unifying the obtained values. According to the BEX Index, Serbian companies were characterised by threatened existence in 2009, with a tendency towards serious disbalance possibly resulting in the com-panies’ demise. The situation was slightly more favourable in 2008 and 2009, but not satisfactory. The escalation of the crisis in 2009 resulted, therefore, in serious disbalance in business operations of indus-trial companies, and the subsiding trend in 2010 was manifested in slight advances of business activi-ties. Similar results in assessing the business performance of industrial companies were derived by ap-plying the Discriminant Function, as shown below.
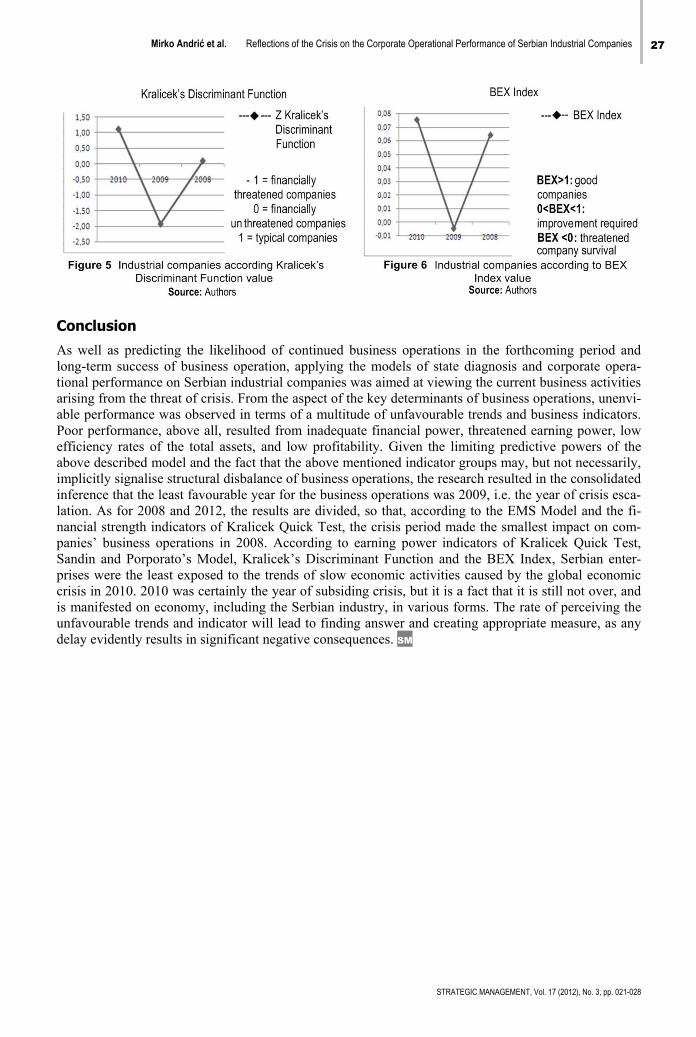
Mirko Andrić et al. Reflections of the Crisis on the Corporate Operational Performance of Serbian Industrial Companies 27
STRATEGIC MANAGEMENT, Vol. 17 (2012), No. 3, pp. 021-028
Conclusion
As well as predicting the likelihood of continued business operations in the forthcoming period and long-term success of business operation, applying the models of state diagnosis and corporate opera-tional performance on Serbian industrial companies was aimed at viewing the current business activities arising from the threat of crisis. From the aspect of the key determinants of business operations, unenvi-able performance was observed in terms of a multitude of unfavourable trends and business indicators. Poor performance, above all, resulted from inadequate financial power, threatened earning power, low efficiency rates of the total assets, and low profitability. Given the limiting predictive powers of the above described model and the fact that the above mentioned indicator groups may, but not necessarily, implicitly signalise structural disbalance of business operations, the research resulted in the consolidated inference that the least favourable year for the business operations was 2009, i.e. the year of crisis esca-lation. As for 2008 and 2012, the results are divided, so that, according to the EMS Model and the fi-nancial strength indicators of Kralicek Quick Test, the crisis period made the smallest impact on com-panies’ business operations in 2008. According to earning power indicators of Kralicek Quick Test, Sandin and Porporato’s Model, Kralicek’s Discriminant Function and the BEX Index, Serbian enter-prises were the least exposed to the trends of slow economic activities caused by the global economic crisis in 2010. 2010 was certainly the year of subsiding crisis, but it is a fact that it is still not over, and is manifested on economy, including the Serbian industry, in various forms. The rate of perceiving the unfavourable trends and indicator will lead to finding answer and creating appropriate measure, as any delay evidently results in significant negative consequences. SM
28 Mirko Andrić et al. Reflections of the Crisis on the Corporate Operational Performance of Serbian Industrial Companies
STRATEGIC MANAGEMENT, Vol. 17 (2012), No. 3, pp. 021-028
References
Andrić, M., & Vuković, B. (2011). Analiza finansijskog izveštaja i ocena performansi. Zbornik radova XV Kongresa Saveza računovođa i revizora Republike Srpske (pp. 491-510). Teslić: Savez računovođa i revizora Republike Srpske. Belak, V., & Barać, Ž. (2008). Tajne tržišta kapitala. Zagreb: Belak Excellence d.o.o. International Monetary Fund. (2010, April). World Economic Outlook. Retrieved February 28, 2012 from International Monetary Fund: http://www.imf.org/external/pubs/ft/weo/2010/01/pdf/text.pdf Ministarstvo ekonomije i regionalnog razvoja. (2011, February). Strategija i politika razvoja industrije Republike Srbije 2011-2020. Retrieved February 20, 2012 from Nacionalne tehnološke platforme Srbije - NTPS: http://www.ntp.rs/wp-content/uploads/2011/06/Industrijska_Politika_2011-2020.pdf Muminović, S., & Pavlović, V. (2011). Analiza slabosti odabranih modela zasnovanih na računovodstvenim podacima za predviđanje bankrota i ocjenu boniteta na primjeru Bulgari Filati d.o.o. Računovodstvo i menadžment (pp. 357-368). Zagreb: Udruga "Hrvatski računovođa". Neely, A. (1998). Measuring Business Performance: Why, What and How. London: The Economist and Profile Books Ltd. Republički zavod za statistiku. (2012). Retrieved February 20, 2012 from Republički zavod za statistiku: http://webrzs.stat.gov.rs/WebSite/ Rodić, J., Vukelić, G., & Andrić, M. (2011). Analiza finansijskih izveštaja. Bečej: Proleter. Sandin, A., & Porporato, M. (2007). Corporate bankruptcy prediction models applied to emerging economies: Evidence from Argentina in the years 1991-1998. International Journal of Commerce and Management, 17 (4), 295-311. Tintor, J. (2009). Poslovna analiza. Zagreb: Masmedia. Correspondence
Mirko Andrić
Faculty of Economics Subotica Segedinski put 9-11, 24000, Subotica, Serbia
E-mail: [email protected]
STRATEGIC MANAGEMENT, Vol. 17 (2012), No. 3, pp. 029-035 UDC 004.052.42
Received: April 8, 2012 Accepted: July 17, 2012
Errors in Building and Using Electronic Tables: Financial Consequences and Minimisation Techiques
Marton Sakal, Lazar Raković University of Novi Sad, Faculty of Economics Subotica, Serbia
Abstract Spreadsheet programs are one of the widest-used types of modern-day programs, with a dominant, but not exclusive use in the business sphere. The experience of the past three decades has shown that errors in theirutilization are constantly present, despite constant progress in the possibilities of electronic tables. This article presents some of the errors in creating and using electronic tables that have caused serious financial conse-quences, and several development models aimed at minimizing such errors. Keywords Spreadsheet programs, electronic tables, errors.
Introduction
Even though it has been used by the accountants for several hundreds of years (Power, 2004), it was the proliferation of personal computers and software at the end of the previous century that made the idea of spreadsheet programs ubiquitous on a global level. The first program of this type, VisiCalc, entered the market in 1979 (Bellis, n.d.), and according to the present-day criteria it included a modest set of func-tionalities. Nevertheless, it succeeded in starting a process that in 2010 resulted in 500.000.000 Micro-soft Excel users all around the world (Microsoft, 2010). The historical development of spreadsheet pro-grams is presented in picture 1.
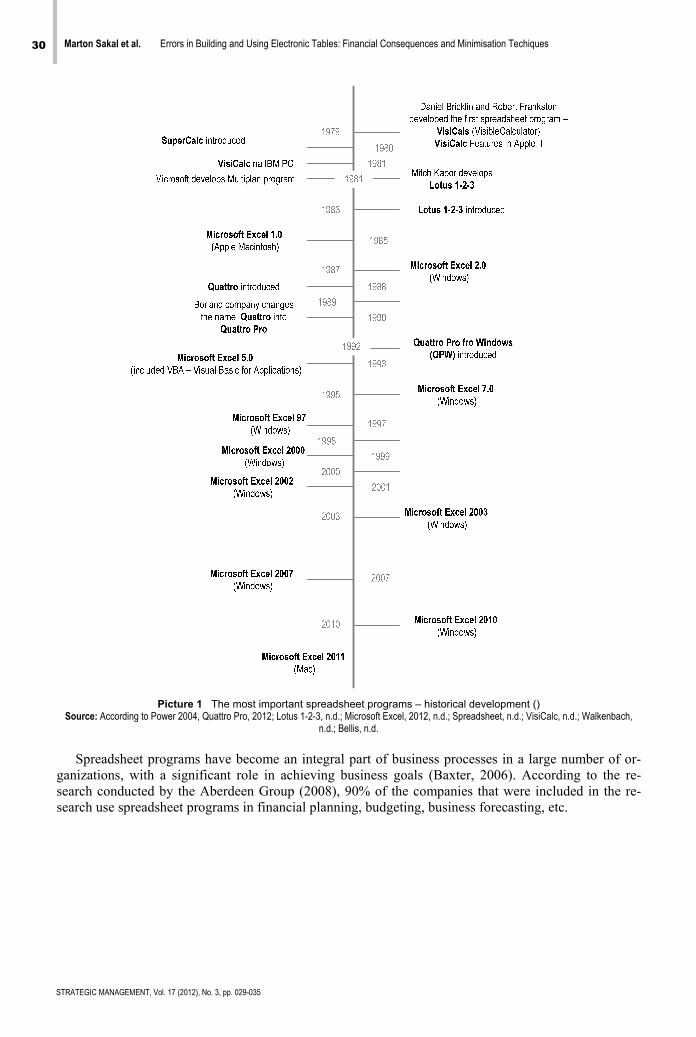
30 Marton Sakal et al. Errors in Building and Using Electronic Tables: Financial Consequences and Minimisation Techiques
STRATEGIC MANAGEMENT, Vol. 17 (2012), No. 3, pp. 029-035
Picture 1 The most important spreadsheet programs – historical development () Source: According to Power 2004, Quattro Pro, 2012; Lotus 1-2-3, n.d.; Microsoft Excel, 2012, n.d.; Spreadsheet, n.d.; VisiCalc, n.d.; Walkenbach,
n.d.; Bellis, n.d.
Spreadsheet programs have become an integral part of business processes in a large number of or-
ganizations, with a significant role in achieving business goals (Baxter, 2006). According to the re-search conducted by the Aberdeen Group (2008), 90% of the companies that were included in the re-search use spreadsheet programs in financial planning, budgeting, business forecasting, etc.
H
velomenprog
1. E
Accprocerroresusubjcellsuchtablprod
SspreriodfereclasPrzason,are but
Sclas
Lbut
M
Pict
However, evenopment, more ntioned in pangrams in the fo
Errors in bu
cording to the cesses containor noted, it canults are also mject: the presens containing ah a high perceles is not as sducts (Baker, FSpecialist litereadsheets. Resd of a few yeaences and disassification intoasnyski, Leon,, 2009b). Quanin correlation has a negativeSome examplessification sugg
logical erro errors in us hardcoding copy-paste entry errors oversights.
Logical erroroversights in
arton Sakal et al.
ure 2 Spreadsh
n though spreauser oriented
ndemic contexollowing chap
uilding/usi
research condn some kind of nnot be ruled o
mentioned by Pnce of tables c
an error is 5.2 entage of errosystematic andFoster-Johnsonrature does nsearchers, awaars (Rajalinghaagreements cono qualitative an, & Seal, 2011ntitative errorswith the desig
e influence on es of spreadshgested by Pow
ors, sing referencesg errors, errors, s,
rs are errors inthe design log
Errors in Building
heet programs asSource
adsheet prograand user frien
xts (Pwc, 2011ter.
ng electron
ducted by the f error; while fout that they arPanko and Portcontaining an % on average
ors, the fact thd methodical an, Lawson, &
not offer unifoare of the faultam, 2005; Panncerning the cnd quantitative1; Teo & Tan,s are mentionegn of electroniproductivity o
heet errors andwell, Baker, &
s,
n formulae, whgics of electron
g and Using Electron
s an integral part e: According to Baxte
ams have becondly, errors in 1). More will b
nic tables
Protivity Comfinancial consere still to be ret (2012) in hiserror within ta
e. Specialist lithat the approaas it is the caPowell, 2006;
orm and genets of their taxo
nko & Aurigemclassification oe errors (Pank, 1997; Pursered in the conteic tables whichof table use (Pad their financia
Lawson (2009
hich give inacnic tables are
ic Tables: Financial
STRATE
of organizationaer, 2006
ome, during thusing them arbe said about
mpany, almost equences have ecognized in ths results summables examineterature offers
ach to the devase with the d; Pricewaterho
erally acceptedonomies, frequmma, 2010). Hof errors, mos
ko & Aurigemmr & Chadwickext of incorrech does not necanko & Aurig
al consequence9a):
ccurate results also considere
Consequences and
EGIC MANAGEMENT, Vo
l business proce
he course of thre still almost the errors in
95% of tablesnot been disco
he future (Evamary of differe
d is 94%, and s, as a possibleelopment and
development oouseCoopers, 2d taxonomy ouently revise t
However, despst authors suggma, 2010; Pan
k, 2006; Powelt results whileessarily resultemma, 2010). es are provided
based on accued logical erro
Minimisation Techiq
ol. 17 (2012), No. 3, pp. 0
sses
heir forty yearinevitable andusing spreadsh
s used in businovered with evns, 2012). Simnt research onthe percentag
e generic caususe of electro
of “real” softw2004). of errors in uthem after thepite numerous gest the first lnko & Port, 20ll, Baker, & Le qualitative ert in numeric er
d according to
urate data entrors. An illustra
ues 31
029-035
r de-d are heet
ness very
milar n the ge of se of onic ware
sing e pe-
dif-evel 012;
Law-rrors rrors
o the
ries, ative
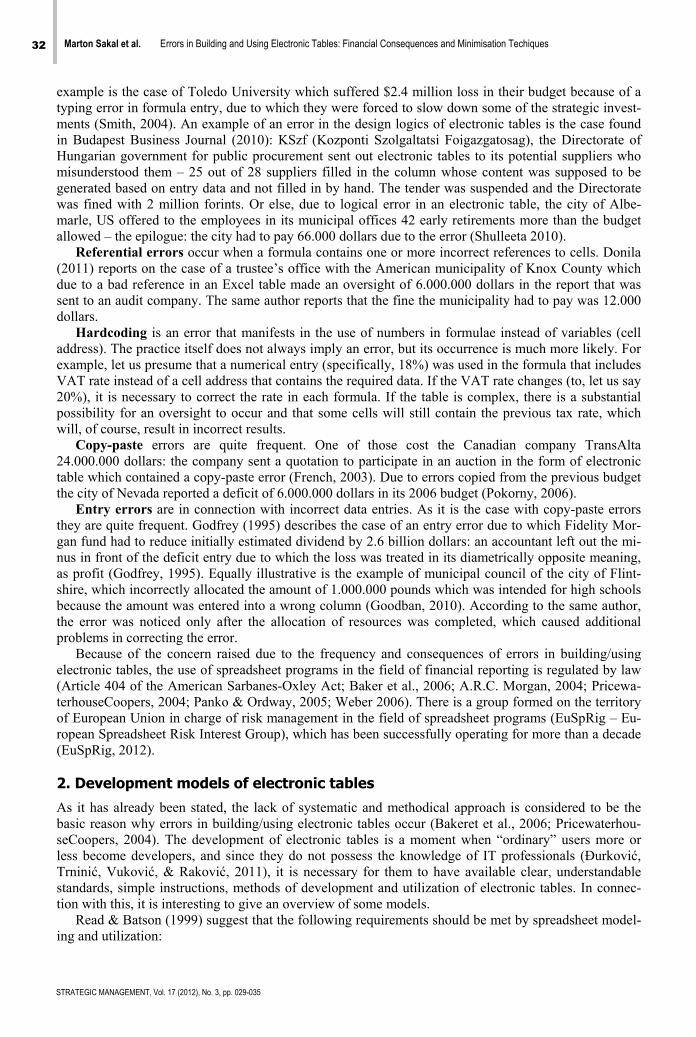
32 Marton Sakal et al. Errors in Building and Using Electronic Tables: Financial Consequences and Minimisation Techiques
STRATEGIC MANAGEMENT, Vol. 17 (2012), No. 3, pp. 029-035
example is the case of Toledo University which suffered $2.4 million loss in their budget because of a typing error in formula entry, due to which they were forced to slow down some of the strategic invest-ments (Smith, 2004). An example of an error in the design logics of electronic tables is the case found in Budapest Business Journal (2010): KSzf (Kozponti Szolgaltatsi Foigazgatosag), the Directorate of Hungarian government for public procurement sent out electronic tables to its potential suppliers who misunderstood them – 25 out of 28 suppliers filled in the column whose content was supposed to be generated based on entry data and not filled in by hand. The tender was suspended and the Directorate was fined with 2 million forints. Or else, due to logical error in an electronic table, the city of Albe-marle, US offered to the employees in its municipal offices 42 early retirements more than the budget allowed – the epilogue: the city had to pay 66.000 dollars due to the error (Shulleeta 2010).
Referential errors occur when a formula contains one or more incorrect references to cells. Donila (2011) reports on the case of a trustee’s office with the American municipality of Knox County which due to a bad reference in an Excel table made an oversight of 6.000.000 dollars in the report that was sent to an audit company. The same author reports that the fine the municipality had to pay was 12.000 dollars.
Hardcoding is an error that manifests in the use of numbers in formulae instead of variables (cell address). The practice itself does not always imply an error, but its occurrence is much more likely. For example, let us presume that a numerical entry (specifically, 18%) was used in the formula that includes VAT rate instead of a cell address that contains the required data. If the VAT rate changes (to, let us say 20%), it is necessary to correct the rate in each formula. If the table is complex, there is a substantial possibility for an oversight to occur and that some cells will still contain the previous tax rate, which will, of course, result in incorrect results.
Copy-paste errors are quite frequent. One of those cost the Canadian company TransAlta 24.000.000 dollars: the company sent a quotation to participate in an auction in the form of electronic table which contained a copy-paste error (French, 2003). Due to errors copied from the previous budget the city of Nevada reported a deficit of 6.000.000 dollars in its 2006 budget (Pokorny, 2006).
Entry errors are in connection with incorrect data entries. As it is the case with copy-paste errors they are quite frequent. Godfrey (1995) describes the case of an entry error due to which Fidelity Mor-gan fund had to reduce initially estimated dividend by 2.6 billion dollars: an accountant left out the mi-nus in front of the deficit entry due to which the loss was treated in its diametrically opposite meaning, as profit (Godfrey, 1995). Equally illustrative is the example of municipal council of the city of Flint-shire, which incorrectly allocated the amount of 1.000.000 pounds which was intended for high schools because the amount was entered into a wrong column (Goodban, 2010). According to the same author, the error was noticed only after the allocation of resources was completed, which caused additional problems in correcting the error.
Because of the concern raised due to the frequency and consequences of errors in building/using electronic tables, the use of spreadsheet programs in the field of financial reporting is regulated by law (Article 404 of the American Sarbanes-Oxley Act; Baker et al., 2006; A.R.C. Morgan, 2004; Pricewa-terhouseCoopers, 2004; Panko & Ordway, 2005; Weber 2006). There is a group formed on the territory of European Union in charge of risk management in the field of spreadsheet programs (EuSpRig – Eu-ropean Spreadsheet Risk Interest Group), which has been successfully operating for more than a decade (EuSpRig, 2012).
2. Development models of electronic tables
As it has already been stated, the lack of systematic and methodical approach is considered to be the basic reason why errors in building/using electronic tables occur (Bakeret et al., 2006; Pricewaterhou-seCoopers, 2004). The development of electronic tables is a moment when “ordinary” users more or less become developers, and since they do not possess the knowledge of IT professionals (Đurković, Trninić, Vuković, & Raković, 2011), it is necessary for them to have available clear, understandable standards, simple instructions, methods of development and utilization of electronic tables. In connec-tion with this, it is interesting to give an overview of some models.
Read & Batson (1999) suggest that the following requirements should be met by spreadsheet model-ing and utilization:
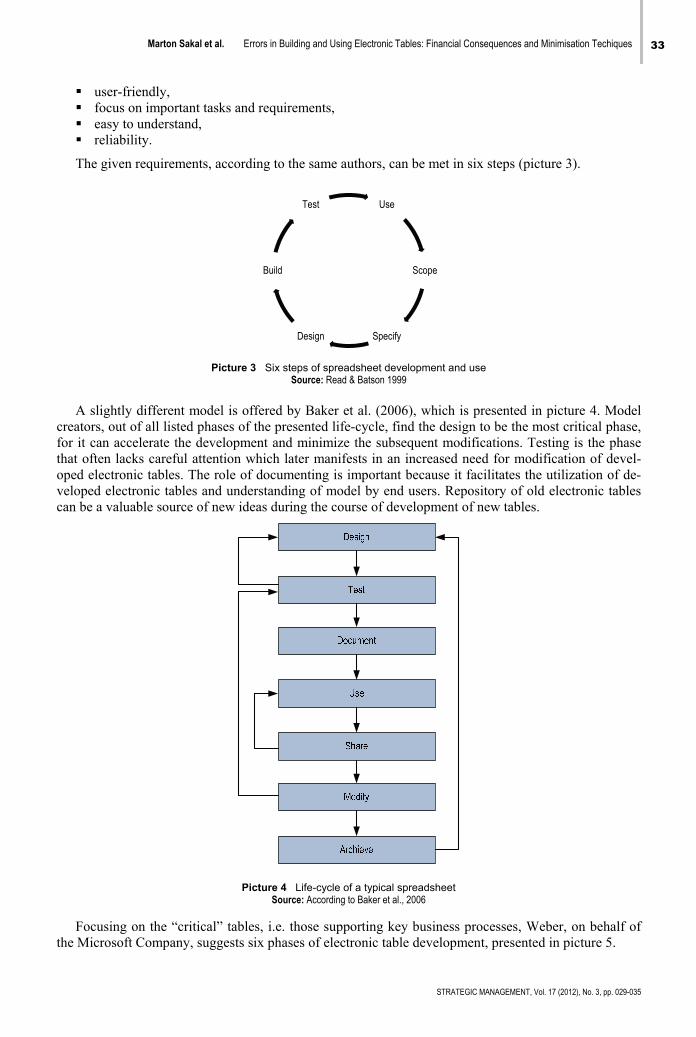
Marton Sakal et al. Errors in Building and Using Electronic Tables: Financial Consequences and Minimisation Techiques 33
STRATEGIC MANAGEMENT, Vol. 17 (2012), No. 3, pp. 029-035
user-friendly, focus on important tasks and requirements, easy to understand, reliability.
The given requirements, according to the same authors, can be met in six steps (picture 3).
Picture 3 Six steps of spreadsheet development and use Source: Read & Batson 1999
A slightly different model is offered by Baker et al. (2006), which is presented in picture 4. Model
creators, out of all listed phases of the presented life-cycle, find the design to be the most critical phase, for it can accelerate the development and minimize the subsequent modifications. Testing is the phase that often lacks careful attention which later manifests in an increased need for modification of devel-oped electronic tables. The role of documenting is important because it facilitates the utilization of de-veloped electronic tables and understanding of model by end users. Repository of old electronic tables can be a valuable source of new ideas during the course of development of new tables.
Picture 4 Life-cycle of a typical spreadsheet Source: According to Baker et al., 2006
Focusing on the “critical” tables, i.e. those supporting key business processes, Weber, on behalf of
the Microsoft Company, suggests six phases of electronic table development, presented in picture 5.
Use
Scope
SpecifyDesign
Build
Test
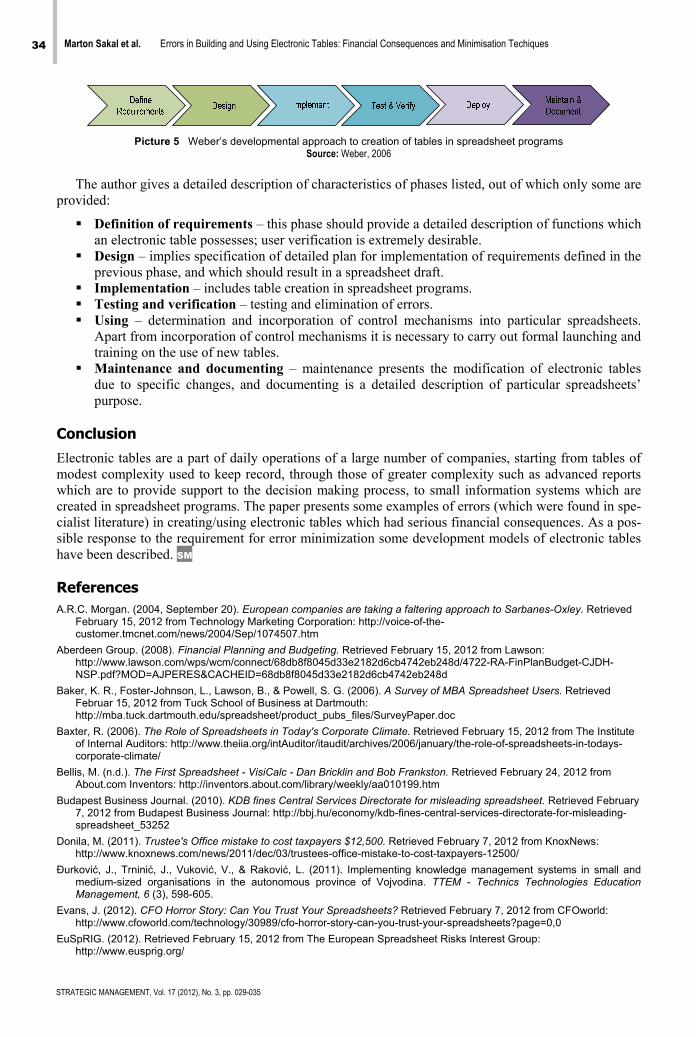
34 Marton Sakal et al. Errors in Building and Using Electronic Tables: Financial Consequences and Minimisation Techiques
STRATEGIC MANAGEMENT, Vol. 17 (2012), No. 3, pp. 029-035
Picture 5 Weber’s developmental approach to creation of tables in spreadsheet programs Source: Weber, 2006
The author gives a detailed description of characteristics of phases listed, out of which only some are
provided:
Definition of requirements – this phase should provide a detailed description of functions which an electronic table possesses; user verification is extremely desirable.
Design – implies specification of detailed plan for implementation of requirements defined in the previous phase, and which should result in a spreadsheet draft.
Implementation – includes table creation in spreadsheet programs. Testing and verification – testing and elimination of errors. Using – determination and incorporation of control mechanisms into particular spreadsheets.
Apart from incorporation of control mechanisms it is necessary to carry out formal launching and training on the use of new tables.
Maintenance and documenting – maintenance presents the modification of electronic tables due to specific changes, and documenting is a detailed description of particular spreadsheets’ purpose.
Conclusion
Electronic tables are a part of daily operations of a large number of companies, starting from tables of modest complexity used to keep record, through those of greater complexity such as advanced reports which are to provide support to the decision making process, to small information systems which are created in spreadsheet programs. The paper presents some examples of errors (which were found in spe-cialist literature) in creating/using electronic tables which had serious financial consequences. As a pos-sible response to the requirement for error minimization some development models of electronic tables have been described. SM
References
A.R.C. Morgan. (2004, September 20). European companies are taking a faltering approach to Sarbanes-Oxley. Retrieved February 15, 2012 from Technology Marketing Corporation: http://voice-of-the-customer.tmcnet.com/news/2004/Sep/1074507.htm
Aberdeen Group. (2008). Financial Planning and Budgeting. Retrieved February 15, 2012 from Lawson: http://www.lawson.com/wps/wcm/connect/68db8f8045d33e2182d6cb4742eb248d/4722-RA-FinPlanBudget-CJDH-NSP.pdf?MOD=AJPERES&CACHEID=68db8f8045d33e2182d6cb4742eb248d
Baker, K. R., Foster-Johnson, L., Lawson, B., & Powell, S. G. (2006). A Survey of MBA Spreadsheet Users. Retrieved Februar 15, 2012 from Tuck School of Business at Dartmouth: http://mba.tuck.dartmouth.edu/spreadsheet/product_pubs_files/SurveyPaper.doc
Baxter, R. (2006). The Role of Spreadsheets in Today's Corporate Climate. Retrieved February 15, 2012 from The Institute of Internal Auditors: http://www.theiia.org/intAuditor/itaudit/archives/2006/january/the-role-of-spreadsheets-in-todays-corporate-climate/
Bellis, M. (n.d.). The First Spreadsheet - VisiCalc - Dan Bricklin and Bob Frankston. Retrieved February 24, 2012 from About.com Inventors: http://inventors.about.com/library/weekly/aa010199.htm
Budapest Business Journal. (2010). KDB fines Central Services Directorate for misleading spreadsheet. Retrieved February 7, 2012 from Budapest Business Journal: http://bbj.hu/economy/kdb-fines-central-services-directorate-for-misleading-spreadsheet_53252
Donila, M. (2011). Trustee's Office mistake to cost taxpayers $12,500. Retrieved February 7, 2012 from KnoxNews: http://www.knoxnews.com/news/2011/dec/03/trustees-office-mistake-to-cost-taxpayers-12500/
Đurković, J., Trninić, J., Vuković, V., & Raković, L. (2011). Implementing knowledge management systems in small and medium-sized organisations in the autonomous province of Vojvodina. TTEM - Technics Technologies Education Management, 6 (3), 598-605.
Evans, J. (2012). CFO Horror Story: Can You Trust Your Spreadsheets? Retrieved February 7, 2012 from CFOworld: http://www.cfoworld.com/technology/30989/cfo-horror-story-can-you-trust-your-spreadsheets?page=0,0
EuSpRIG. (2012). Retrieved February 15, 2012 from The European Spreadsheet Risks Interest Group: http://www.eusprig.org/
Marton Sakal et al. Errors in Building and Using Electronic Tables: Financial Consequences and Minimisation Techiques 35
STRATEGIC MANAGEMENT, Vol. 17 (2012), No. 3, pp. 029-035
French, C. (2003). TransAlta Says Clerical Snafu Costs It $24 Million. Retrieved Februar 8, 2012 from Bell Globemedia: http://www.globeinvestor.com/servlet/ArticleNews/story/ROC/20030603/2003-06-03T232028Z_01_N03354432_RTRIDST_0_BUSINESS-ENERGY-TRANSALTA-COL
Godfrey, K. (1995, January 4). Computing error at Fidelity's Magellan fund. Retrieved February 8, 2012 from Catless: http://catless.ncl.ac.uk/Risks/16.72.html#subj1
Goodban, D. (2010, February 18). Flintshire County Council school cash blunder "down to spreadsheet error". Retrieved Februar 7, 2012 from Flintshire Chronicle: http://www.flintshirechronicle.co.uk/flintshire-news/local-flintshire-news/2010/02/18/flintshire-county-council-school-cash-blunder-down-to-spreadsheet-error-51352-25856321/
Lotus 1-2-3. (n.d.). Retrieved February 24, 2012 from Wikipedia: http://en.wikipedia.org/wiki/Lotus_1-2-3 Microsoft. (2010, July 9). Turn 500 million Excel users to your deployment opportunity: Parallelism with HPC Services for
Excel. Retrieved February 7, 2012 from Microsoft: http://www.microsoft.com/en-us/showcase/details.aspx?uuid=8750ad1d-b854-4b73-aa95-6946fc6a9f9a
Microsoft Excel. (2012). Retrieved February 24, 2012 from Wikipedia: http://en.wikipedia.org/wiki/Microsoft_Excel#History Panko, R. R. (2005, Januar). What We Know About Spreadsheet . Retrieved February 17, 2012 from Opssys:
http://www.opssys.com/InstantKB/attachments/What_We_Know_About_Spreadsheet_Errors_Whitepaper-GUID9b35763e2d504ddab36b9e26a4eee631.pdf
Panko, R. R., & Aurigemma, S. (2010). Revising the Panko–Halversontaxonomy of spreadsheeterrors. Decision Support Systems, 49 (2), 235–244.
Panko, R. R., & Port, D. N. (2012). End User Computing: The Dark Matter (and Dark Energy) of Corporate IT. 45th Hawaii International Conference on System Sciences, (pp. 4603-4612). Maui.
Pokorny, R. (2006). Budget discrepancies attributed to computer error. Retrieved February 8, 2012, from Nevada Daily Mail: http://www.nevadadailymail.com/story/1135458.html
Powell, S. G., Baker, K. R., & Lawson, B. (2009b). Errors in Operational Spreadsheets. Journal of Organizational and End User Computing, 21 (3), 24-36.
Powell, S. G., Baker, K. R., & Lawson, B. (2009a). Impact of errors in operational spreadsheets. Decision Support Systems, 47 (2), 126–132.
Power, D. J. (2004). A Brief History of Spreadsheets. Retrieved February 24, 2012 from DSSResources.COM: http://dssresources.com/history/sshistory.html
PricewaterhouseCoopers. (2004). The Use of Spreadsheets: Considerations for Section 404 of the Sarbanes-Oxley Act. Retrieved February 15, 2012 from AuditSoftware.Net: http://www.auditsoftware.net/community/excel/PwCwpSpreadsheetsSection404Sarbox.pdf
Przasnyski, Z., Leon, L., & Seal, K. C. (2011). In Search of a Taxonomy for Classifying Qualitative Spreadsheet Errors. Proceedings of EuSpRIG 2011 Conference. London: EuSpRIG.
Purser, M., & Chadwick, D. (2006). Does an awareness of differing types of spreadsheet. Retrieved Februarу 17, 2012 from EuSpRIG: Does an awareness of differing types of spreadsheet
PwC. (2011). Spreadsheet Mistakes Issue No. 2. Retrieved February 17, 2012 from PwC: http://www.pwc.com/cy/en/audit-services/assets/pwc-cy_spreadsheet-mistakes-issue2.pdf
Quattro Pro. (2012). Retrieved February 24, 2012 from Wikipedia: http://en.wikipedia.org/wiki/Quattro_Pro Rajalingham, K. (2005). A Revised Classification of Spreadsheet Errors. EuSpRIG 2005 Conference. Read, N., & Batson, J. (1999). Spreadsheet Modelling Best Practice. London: IBM. Shulleeta, B. (2010). Ex-county workers consider suit over reduced retirement. Retrieved February 7, 2012 from Daily
Progress: http://www2.dailyprogress.com/news/cdp-news-local/2010/mar/25/ex-county_workers_consider_suit_over_reduced_retir-ar-75157/
Spreadsheet. (n.d.). Retrieved February 15, 2012 from Wikipedia: http://en.wikipedia.org/wiki/Spreadsheet Smith, R. E. (2004). University of Toledo loses $2.4M in projected revenue. Retrieved February 8, 2012 from The Toledo
Blade: http://www.toledoblade.com/Education/2004/05/01/University-of-Toledo-loses-2-4M-in-projected-revenue.html Teo, T., & Tan, M. (1997). Quantitative and Qualitative Errors in Spreadsheet Development. 30th Hawaii International
Conference on System Sciences: Information System Track-Organizational Systems and Technology (pp. 149-156). IEEE Computer Society Washington.
VisiCalc. (n.d.). Retrieved February 24, 2012 from Wikipedia: http://en.wikipedia.org/wiki/VisiCalc Walkenbach, J. (n.d.). Spreadsheet History. Retrieved February 15, 2012 from J-Walk & Associates: http://www.j-
walk.com/ss/history/ Weber, B. (2006). Strategies for Addressing Spreadsheet Compliance Challenges . Retrieved February 15, 2012 from arXiv:
http://arxiv.org/ftp/arxiv/papers/0711/0711.4634.pdf
Correspondence
Marton Sakal
Faculty of Economics Subotica Segedinski put 9-11, 24000, Subotica, Serbia
E-mail: [email protected]
STRATEGIC MANAGEMENT, Vol. 17 (2012), No. 3, pp. 036-046 UDC 005.21:334.72.021
Received: February 18, 2012
Accepted: May 23, 2012
Strategic Management of Information Systems in the Function of Efficient Business of Companies
Vesna Aleksić Marić, Gordana Ilić University of Banja Luka, Faculty of Economics Banja Luka, Bosnia and Herzegovina
Abstract Modern business is hard to imagine without the use of information technology and information systems. Com-panies worldwide are investing more and more financial and other resources in the functioning of the IT infra-structure, often with uncertain returns. For large investments in IT companies to be profitable and useful, and for information systems to become an equal partner or strategic business management entities, in addition tomanaging informatics, the company’s informational resources, technology and information systems shouldalso be managed in a well-devised and prudent manner. In other words, there is a need for long-term, strateg-ic management of information systems, which will be discussed in more detail in this article. Keywords Strategic management, information systems, strategy of information system, standards of strategic manage-ment.
Introduction
Modern business is hard to imagine without the use of information technology and information systems. Companies around the world invest more financial and other resources in the functioning of the IT in-frastructure of business, where returns are often very uncertain. There are frequent examples of busi-nesses in which more than 50% of capital expenditures are related to IT and IT projects (Nolan & McFarlan, 2005) and where the majority of companies in developed markets invest between 5 and 7% of total annual revenue in informatics (Symons, 2005), with a constant upward trend. These informatics-related and information processing systems are becoming an important business function and a valuable business resource about which very little is known, and even less understood. The reason for their low impact on business productivity should be sought in frequently undefined role in business operations.
Companies, and their management, who cannot or do not know how to assess the role that information systems should have in their business are not rare. Aware of the fact that they are unavoidable, they often make mistakes because they determine the role of business practices of their competitors, or the fashionable trends in business or technology, and not according to their actual needs, or as the result of strategic business analysis. In such circumstances, information systems often have only a technical, i.e. background role and are generally regarded as unnecessary expense.
1. IT governance and business value of information systems
IT Governance is an important part of business management process relating to the management of IT infrastructure and all its parts, especially information systems, their performances and overall impact on the business. IT Governance refers to the informatic framework, which provides a set of techniques and methods that top management undertakes during the application of information systems in business,
Vesna Aleksić Marić et al. Strategic Management of Information Systems in the Function of Efficient Business of Companies 37
STRATEGIC MANAGEMENT, Vol. 17 (2012), No. 3, pp. 036-046
investment decisions, performance and risks of their use, but also takes responsibility for the supervi-sion of the IT processes and all activities. The basic components and areas of application of the concept of IT Governance are: 1.1. Strategic linking of business and information systems (Strategic IT/Alignment)
Strategic alliance of business and information systems determines how information systems support the achievement of business objectives. By this method, they determine the information systems and their operational characteristics which influence the improvement of business results aimed at long-term sup-port to achieving strategic business objectives.
1.2. Risk management information systems implementation (IT Risk Management)
Risk management information systems implementation is an integral part of managing corporate risks that the organization uses to assess the exposure to various risks of application of information systems in business. Within this area, it is necessary to develop a risk management plan and constantly monitor the level of risk and their impact on business processes, and identify effective countermeasures. Meth-ods and frameworks that are used in this are CobiT, IT Risk, ISO 27000 standards, Basel II etc.
1.3. Assigning responsibility and checking the effectiveness of information systems (IT Control Accountability)
Assigning responsibility and checking the effectiveness of an information system refers to a clear and unambiguous allocation of responsibilities for implementation of IT activities and verifying the effi-ciency of controls built into the information system so that business can be conducted smoothly and in line with expectations.
1.4. Performance Audit Information Systems (Information System Audit)
An audit of information systems is the process of checking the success of information systems in accor-dance with business requirements and process analysis and verification of their accuracy, efficiency and reliability. The final result of these procedures is the report of auditors of information system.
2. The strategic alliance of business and information systems
Intensive use of information systems and information technology can yield many business benefits and make a strategic impact on the competitive position, but only if the objectives of its use support and broaden strategic business objectives. Information systems directly affect the competitiveness of busi-ness in two basic ways: (a) positive impact on the operational efficiency of business (a strategy to en-courage low cost) and (b) in certain circumstances, become the drivers of innovation and change in business (promote differentiation business strategy).
In the case where information systems and information technology are used for automation of busi-ness processes, accelerating their progress and reducing overall operating costs, the essence is support-ing low cost strategy. In this case, information systems are used as basic business infrastructure, which enables fast, accurate, reliable and efficient implementation of a large number of transactions. Given that these information system solutions can be easily imitated or substituted with similar ones, they can-not be considered as a source of sustainable competitive advantage.
In the case where the task of information systems is active participation in the creation of entirely new, often previously unknown and innovative business models, then we support the differentiation strategy, or differentiation of business. The basic characteristics of such business models are that they innovative and radically change the way of business in certain sectors, by creating and imposing a com-pletely new business rules and business processes, which soon become a standard (e.g. Dell Computers, Amazon.com, Google, YouTube, etc.).
Many other examples of innovation based on intensive use of information systems that irreversibly changed the way of business processes, but also the behaviour of their users can be added to the above. These are e.g. electronic ticket, check-in online, mobile check-in, the use of Radio Frequency Identifica-tion, RFID technology in business processes of sales and inventory management, LoJack (locating vehi-
38 Vesna Aleksić Marić et al. Strategic Management of Information Systems in the Function of Efficient Business of Companies
STRATEGIC MANAGEMENT, Vol. 17 (2012), No. 3, pp. 036-046
cles using GPS technology) and fleet management via satellite navigation, payment by mobile phone, etc. Users are quickly getting used to the fact that some IT innovation is becoming the standard of im-plementation of specific business processes.
In such cases it is mostly referred to as horizontal innovation, which has fundamentally changed the process of conducting business in certain sectors, and the forms of innovation that were first applied successfully resulted in competitive advantage. To make the problem more complicated, the painstaking effort of engineering, developing managerial skills and leadership visions were often threatened by the fact that such solutions are very easy to imitate. Thus, a pioneer in IT innovation would not be able to exploit its competitive advantage for a long time, because it created only a temporary monopoly on the basis of innovative solutions, which are quickly evolved into an infrastructure accessible to everyone.
3. Methods of use of information systems
The initial step in considering the use of IT infrastructure and information systems in business should be identification of their strategies and positioning information systems in the organizational hierarchy with respect to business requirements. In the not too distant past (1950s till 1970s) informatics and in-formation systems were mainly used in business as a technological servant, or as a necessary techno-logical infrastructure in the business. In retrospect, it is easy to see that such a role in developed markets information systems had in the mid-twentieth century. At the time, the primary purpose of their applica-tion in business was to provide technical support and automated operational unfolding of individual business activities. The main objective of the application in business was technology (IT), most of the hardware, and very little attention was paid to having any effect on the business. Although such atti-tudes originally come from that period, even nowadays one may encounter the misconception that in-formatics and information systems actually are technologies, IT.
The main features of the application of information systems in business at that time were supporting routine applications, enabling data processing, reporting higher levels of routine management informa-tion and networking business by creating a unique network of IT infrastructure. The application of in-formation systems, just like the technology partner or technological servants, often stems from the fact that there was no development plan for their roles in business, and the development opportunities that could enable their application were not recognised. Presumably, even today many organizations are in such a situation of IT.
On the other hand, the purpose of application of information systems and related technology is to serve customers and give them appropriate services. Regardless of what type of business or activity is concerned, information systems should allow its users to perform everyday activities and business proc-esses. Since the operation of information systems is of critical importance in many industries, it is im-portant for them not only to be safe, but also to provide these services through a reliable, accessible and relevant to real needs of users. The ways in which information systems and information technology ser-vices are used as a service to the final users has a significant impact on their overall effectiveness. It is therefore necessary to pay attention to the management of IT services (Aleksić Marić & Bašić, 2012).
At the beginning, especially in the mid-1980s, internal business processes are connecting intensively and information systems are gradually beginning to serve as a means of connecting the inner and inte-gration business. Finally begins to emerge offset technology to business. This second wave of the use of information systems was related primarily to supporting the development of key business processes and services of appropriate quality levels. Since the key business processes take place daily through the IT infrastructure, it is normal to expect to have one that is reliably and continuously functioning, and an appropriate level of availability and quality. Concepts such as Service Level Agreement, SLA, Business Continuity Management, BCM, audit and verify the success of information systems (Information Sys-tem Audit) are becoming increasingly important, which points to the fact that IT is becoming increas-ingly interconnected with the business. Therefore, informatics and information systems are becoming process and service partner of business, but also an important means of radical change and gradual im-provement of business processes and business in general.
The third wave of the use of information systems occurred early and mid 1990s, and is determined primarily by their role as strategic business partners, or business functions, whose intensive applications can improve business performance and provide a more favourable competition position. IT plays a more
Vesna Aleksić Marić et al. Strategic Management of Information Systems in the Function of Efficient Business of Companies 39
STRATEGIC MANAGEMENT, Vol. 17 (2012), No. 3, pp. 036-046
prominent place in the organizational hierarchy, and the function of IT managers (Chief Information Officer, CIO) belongs to the highest level of management.
It must be noted that any use of information systems entails appropriate organizational and business results. If we use such information systems as a strategic business function, a precondition for their effi-cient use will be implementation of corporate governance mechanisms of informatics and regular audits of information systems. The audit check of information systems controls success of their applications in business, and maintain application risks at acceptable levels. Successful and efficient application of in-formation systems is realized by their strategic planning process.
4. Information systems strategy
Determining acceptable roles of information systems is often an initial step in developing a strategic plan for information technology. The strategic planning of information systems from business objec-tives determines the strategy of information system, its role, purpose of use in business and preferred architecture. Strategic planning of information systems is a multidisciplinary group of activities that align business goals and information systems, IT infrastructure planning and operations that enable the realization of business goals (Lederer & Salmela, 1996). The first strategy of running business is strat-egy information; the next step is determining the strategy of information systems, and finally, the strat-egy of its component parts. Opting for the reverse order and allowing the application of a strategy of a part of information system to define the entire information system is a major mistake.
The top management, the Chief Information Officer, and business managers from other important functions should be actively involved in carrying out these activities. In this work, they often form sepa-rate organizational bodies or committees (e.g. Committee for Management Informatics or IT Steering Committee) to oversee the implementation of strategic information technology plans. Committee for Management Informatics represents a separate organizational unit that is independent of industry or IT department, and is directly responsible to the company management. The task of this committee is to take care of linking business and IT, or coordinate information systems implementation in a company, depending on business priorities and objectives.
The final outcome of this process should be design and continuous improvement of information sys-tems, enabling the achievement of set business objectives, maintaining and improving competitive posi-tion and creating a new business value. Strategic planning of information systems is therefore a dynamic process, which sets out: alignment of business strategy and IT strategy; scenarios of using information systems in business and detailed financial analysis of each of them, the optimal role and position of the IT function in business, the prioritization of investment in IT and IT priority projects, organizing mechanisms, management and control information systems, etc.
The steps or phases in which the use of certain methods from business plan develops a strategic plan for information technology are as follows:
1. analysis of activities and external business environment, 2. analysis of the internal environment of business, and analysis of existing information systems, 3. defining the objectives of the future information system and 4. plan for implementation.
4.1. Analysis of activities and external business environment
The first necessary step of creating a strategic plan for information technology is to thoroughly analyze the overall market and competitive environment, and adjust their findings to internal organizational fac-tors. Given that the strategic business plan is an input variable for the process of creating a strategic plan for information technology, it would be good at this point to review the basic contours of the business strategy. When planning IT strategy it is very important to analyze current and future needs of the macro- and microenvironment, determine the desired position, the IT operative needs and future goals of the information system in accordance with the results. In fact, there are numerous methods of strate-gic analysis available, such as Porter's model of industrial structure, Porter’s 5 forces of competitive advantage, PEST analysis (Political, Economic, Social, Technology), in which the analysis of the exter-nal environment takes into account political, economic, sociological and technological factors, the ge-
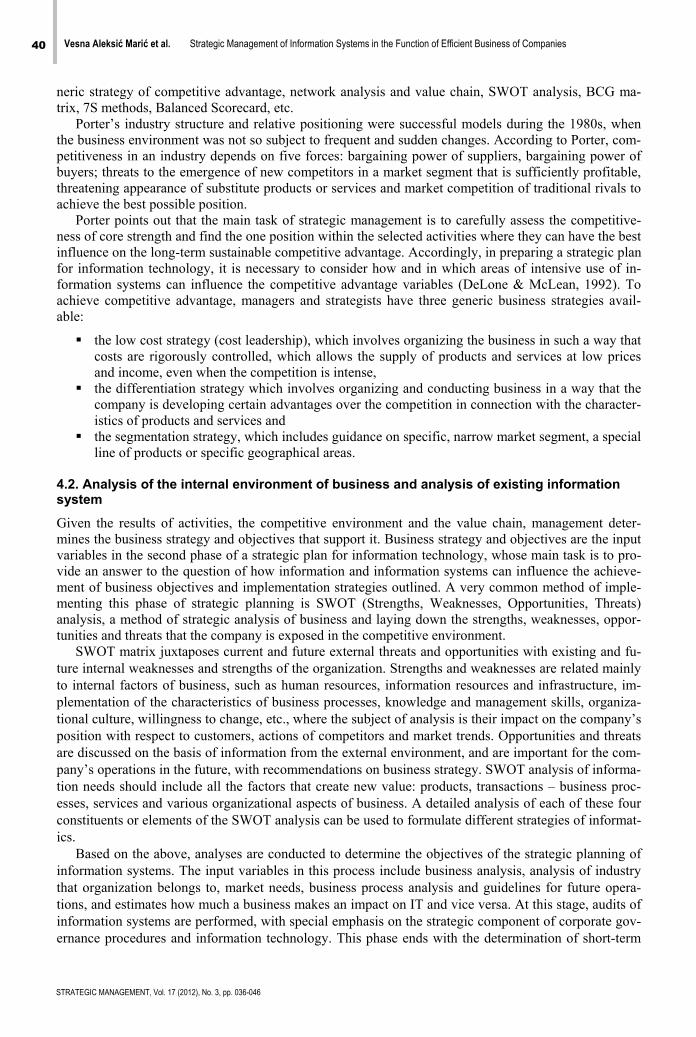
40 Vesna Aleksić Marić et al. Strategic Management of Information Systems in the Function of Efficient Business of Companies
STRATEGIC MANAGEMENT, Vol. 17 (2012), No. 3, pp. 036-046
neric strategy of competitive advantage, network analysis and value chain, SWOT analysis, BCG ma-trix, 7S methods, Balanced Scorecard, etc.
Porter’s industry structure and relative positioning were successful models during the 1980s, when the business environment was not so subject to frequent and sudden changes. According to Porter, com-petitiveness in an industry depends on five forces: bargaining power of suppliers, bargaining power of buyers; threats to the emergence of new competitors in a market segment that is sufficiently profitable, threatening appearance of substitute products or services and market competition of traditional rivals to achieve the best possible position.
Porter points out that the main task of strategic management is to carefully assess the competitive-ness of core strength and find the one position within the selected activities where they can have the best influence on the long-term sustainable competitive advantage. Accordingly, in preparing a strategic plan for information technology, it is necessary to consider how and in which areas of intensive use of in-formation systems can influence the competitive advantage variables (DeLone & McLean, 1992). To achieve competitive advantage, managers and strategists have three generic business strategies avail-able:
the low cost strategy (cost leadership), which involves organizing the business in such a way that costs are rigorously controlled, which allows the supply of products and services at low prices and income, even when the competition is intense,
the differentiation strategy which involves organizing and conducting business in a way that the company is developing certain advantages over the competition in connection with the character-istics of products and services and
the segmentation strategy, which includes guidance on specific, narrow market segment, a special line of products or specific geographical areas.
4.2. Analysis of the internal environment of business and analysis of existing information system
Given the results of activities, the competitive environment and the value chain, management deter-mines the business strategy and objectives that support it. Business strategy and objectives are the input variables in the second phase of a strategic plan for information technology, whose main task is to pro-vide an answer to the question of how information and information systems can influence the achieve-ment of business objectives and implementation strategies outlined. A very common method of imple-menting this phase of strategic planning is SWOT (Strengths, Weaknesses, Opportunities, Threats) analysis, a method of strategic analysis of business and laying down the strengths, weaknesses, oppor-tunities and threats that the company is exposed in the competitive environment.
SWOT matrix juxtaposes current and future external threats and opportunities with existing and fu-ture internal weaknesses and strengths of the organization. Strengths and weaknesses are related mainly to internal factors of business, such as human resources, information resources and infrastructure, im-plementation of the characteristics of business processes, knowledge and management skills, organiza-tional culture, willingness to change, etc., where the subject of analysis is their impact on the company’s position with respect to customers, actions of competitors and market trends. Opportunities and threats are discussed on the basis of information from the external environment, and are important for the com-pany’s operations in the future, with recommendations on business strategy. SWOT analysis of informa-tion needs should include all the factors that create new value: products, transactions – business proc-esses, services and various organizational aspects of business. A detailed analysis of each of these four constituents or elements of the SWOT analysis can be used to formulate different strategies of informat-ics.
Based on the above, analyses are conducted to determine the objectives of the strategic planning of information systems. The input variables in this process include business analysis, analysis of industry that organization belongs to, market needs, business process analysis and guidelines for future opera-tions, and estimates how much a business makes an impact on IT and vice versa. At this stage, audits of information systems are performed, with special emphasis on the strategic component of corporate gov-ernance procedures and information technology. This phase ends with the determination of short-term
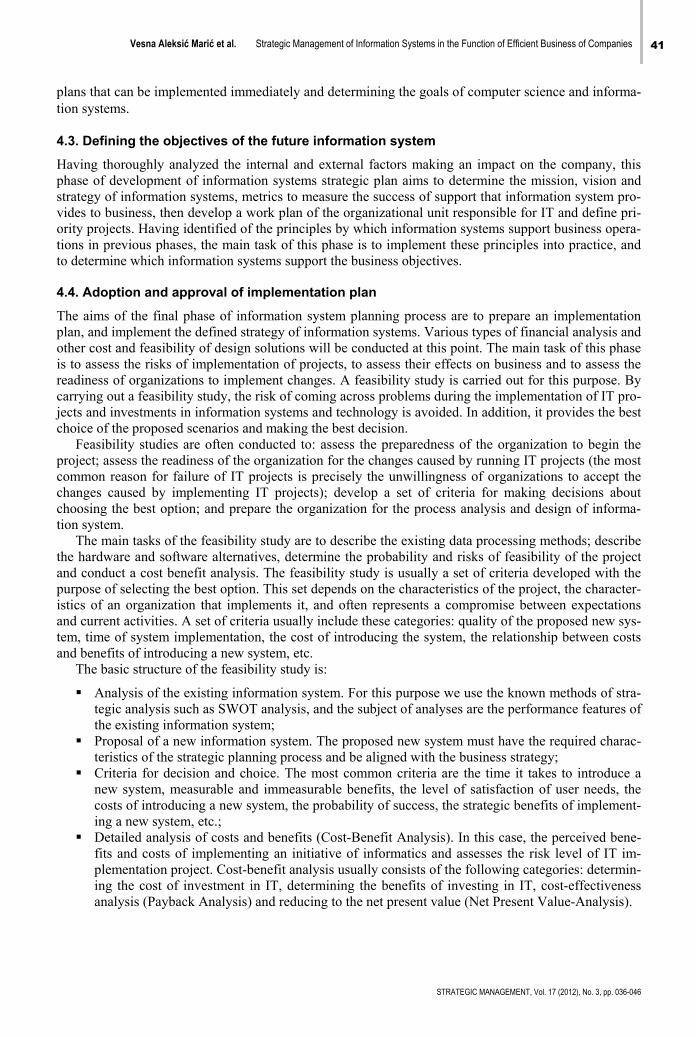
Vesna Aleksić Marić et al. Strategic Management of Information Systems in the Function of Efficient Business of Companies 41
STRATEGIC MANAGEMENT, Vol. 17 (2012), No. 3, pp. 036-046
plans that can be implemented immediately and determining the goals of computer science and informa-tion systems.
4.3. Defining the objectives of the future information system
Having thoroughly analyzed the internal and external factors making an impact on the company, this phase of development of information systems strategic plan aims to determine the mission, vision and strategy of information systems, metrics to measure the success of support that information system pro-vides to business, then develop a work plan of the organizational unit responsible for IT and define pri-ority projects. Having identified of the principles by which information systems support business opera-tions in previous phases, the main task of this phase is to implement these principles into practice, and to determine which information systems support the business objectives.
4.4. Adoption and approval of implementation plan
The aims of the final phase of information system planning process are to prepare an implementation plan, and implement the defined strategy of information systems. Various types of financial analysis and other cost and feasibility of design solutions will be conducted at this point. The main task of this phase is to assess the risks of implementation of projects, to assess their effects on business and to assess the readiness of organizations to implement changes. A feasibility study is carried out for this purpose. By carrying out a feasibility study, the risk of coming across problems during the implementation of IT pro-jects and investments in information systems and technology is avoided. In addition, it provides the best choice of the proposed scenarios and making the best decision.
Feasibility studies are often conducted to: assess the preparedness of the organization to begin the project; assess the readiness of the organization for the changes caused by running IT projects (the most common reason for failure of IT projects is precisely the unwillingness of organizations to accept the changes caused by implementing IT projects); develop a set of criteria for making decisions about choosing the best option; and prepare the organization for the process analysis and design of informa-tion system.
The main tasks of the feasibility study are to describe the existing data processing methods; describe the hardware and software alternatives, determine the probability and risks of feasibility of the project and conduct a cost benefit analysis. The feasibility study is usually a set of criteria developed with the purpose of selecting the best option. This set depends on the characteristics of the project, the character-istics of an organization that implements it, and often represents a compromise between expectations and current activities. A set of criteria usually include these categories: quality of the proposed new sys-tem, time of system implementation, the cost of introducing the system, the relationship between costs and benefits of introducing a new system, etc.
The basic structure of the feasibility study is:
Analysis of the existing information system. For this purpose we use the known methods of stra-tegic analysis such as SWOT analysis, and the subject of analyses are the performance features of the existing information system;
Proposal of a new information system. The proposed new system must have the required charac-teristics of the strategic planning process and be aligned with the business strategy;
Criteria for decision and choice. The most common criteria are the time it takes to introduce a new system, measurable and immeasurable benefits, the level of satisfaction of user needs, the costs of introducing a new system, the probability of success, the strategic benefits of implement-ing a new system, etc.;
Detailed analysis of costs and benefits (Cost-Benefit Analysis). In this case, the perceived bene-fits and costs of implementing an initiative of informatics and assesses the risk level of IT im-plementation project. Cost-benefit analysis usually consists of the following categories: determin-ing the cost of investment in IT, determining the benefits of investing in IT, cost-effectiveness analysis (Payback Analysis) and reducing to the net present value (Net Present Value-Analysis).
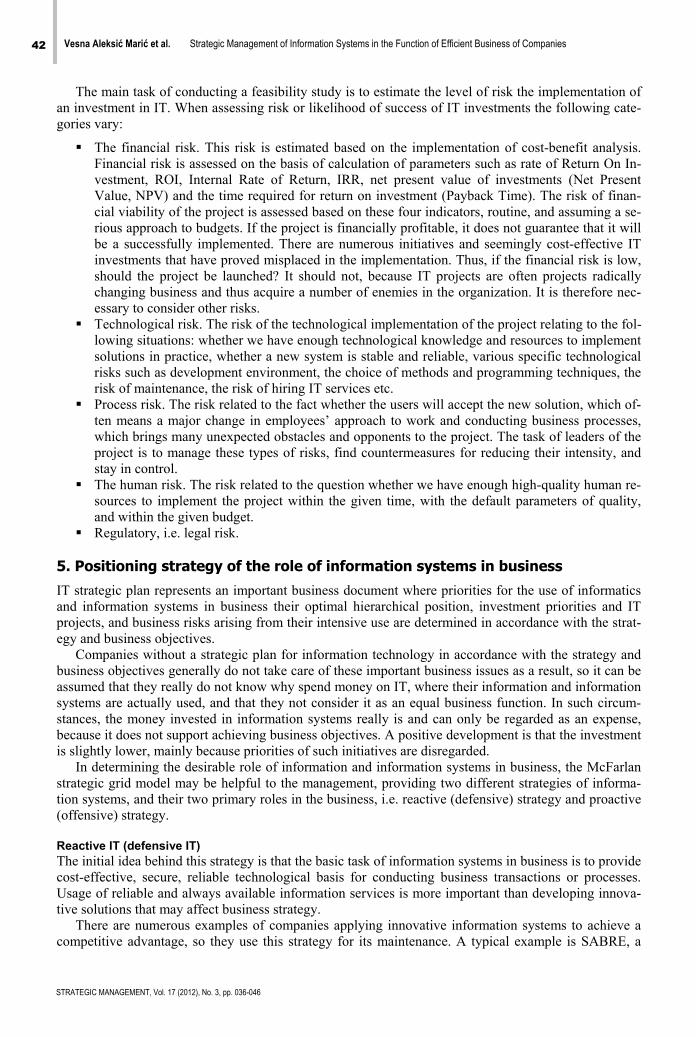
42 Vesna Aleksić Marić et al. Strategic Management of Information Systems in the Function of Efficient Business of Companies
STRATEGIC MANAGEMENT, Vol. 17 (2012), No. 3, pp. 036-046
The main task of conducting a feasibility study is to estimate the level of risk the implementation of an investment in IT. When assessing risk or likelihood of success of IT investments the following cate-gories vary:
The financial risk. This risk is estimated based on the implementation of cost-benefit analysis. Financial risk is assessed on the basis of calculation of parameters such as rate of Return On In-vestment, ROI, Internal Rate of Return, IRR, net present value of investments (Net Present Value, NPV) and the time required for return on investment (Payback Time). The risk of finan-cial viability of the project is assessed based on these four indicators, routine, and assuming a se-rious approach to budgets. If the project is financially profitable, it does not guarantee that it will be a successfully implemented. There are numerous initiatives and seemingly cost-effective IT investments that have proved misplaced in the implementation. Thus, if the financial risk is low, should the project be launched? It should not, because IT projects are often projects radically changing business and thus acquire a number of enemies in the organization. It is therefore nec-essary to consider other risks.
Technological risk. The risk of the technological implementation of the project relating to the fol-lowing situations: whether we have enough technological knowledge and resources to implement solutions in practice, whether a new system is stable and reliable, various specific technological risks such as development environment, the choice of methods and programming techniques, the risk of maintenance, the risk of hiring IT services etc.
Process risk. The risk related to the fact whether the users will accept the new solution, which of-ten means a major change in employees’ approach to work and conducting business processes, which brings many unexpected obstacles and opponents to the project. The task of leaders of the project is to manage these types of risks, find countermeasures for reducing their intensity, and stay in control.
The human risk. The risk related to the question whether we have enough high-quality human re-sources to implement the project within the given time, with the default parameters of quality, and within the given budget.
Regulatory, i.e. legal risk.
5. Positioning strategy of the role of information systems in business
IT strategic plan represents an important business document where priorities for the use of informatics and information systems in business their optimal hierarchical position, investment priorities and IT projects, and business risks arising from their intensive use are determined in accordance with the strat-egy and business objectives.
Companies without a strategic plan for information technology in accordance with the strategy and business objectives generally do not take care of these important business issues as a result, so it can be assumed that they really do not know why spend money on IT, where their information and information systems are actually used, and that they not consider it as an equal business function. In such circum-stances, the money invested in information systems really is and can only be regarded as an expense, because it does not support achieving business objectives. A positive development is that the investment is slightly lower, mainly because priorities of such initiatives are disregarded.
In determining the desirable role of information and information systems in business, the McFarlan strategic grid model may be helpful to the management, providing two different strategies of informa-tion systems, and their two primary roles in the business, i.e. reactive (defensive) strategy and proactive (offensive) strategy.
Reactive IT (defensive IT) The initial idea behind this strategy is that the basic task of information systems in business is to provide cost-effective, secure, reliable technological basis for conducting business transactions or processes. Usage of reliable and always available information services is more important than developing innova-tive solutions that may affect business strategy.
There are numerous examples of companies applying innovative information systems to achieve a competitive advantage, so they use this strategy for its maintenance. A typical example is SABRE, a
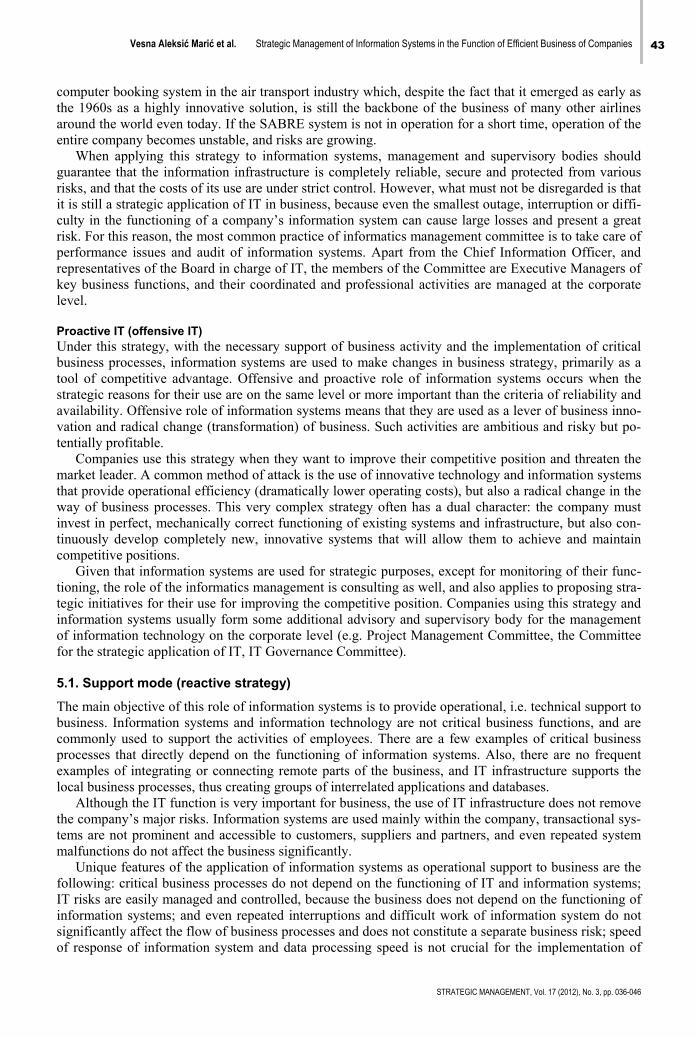
Vesna Aleksić Marić et al. Strategic Management of Information Systems in the Function of Efficient Business of Companies 43
STRATEGIC MANAGEMENT, Vol. 17 (2012), No. 3, pp. 036-046
computer booking system in the air transport industry which, despite the fact that it emerged as early as the 1960s as a highly innovative solution, is still the backbone of the business of many other airlines around the world even today. If the SABRE system is not in operation for a short time, operation of the entire company becomes unstable, and risks are growing.
When applying this strategy to information systems, management and supervisory bodies should guarantee that the information infrastructure is completely reliable, secure and protected from various risks, and that the costs of its use are under strict control. However, what must not be disregarded is that it is still a strategic application of IT in business, because even the smallest outage, interruption or diffi-culty in the functioning of a company’s information system can cause large losses and present a great risk. For this reason, the most common practice of informatics management committee is to take care of performance issues and audit of information systems. Apart from the Chief Information Officer, and representatives of the Board in charge of IT, the members of the Committee are Executive Managers of key business functions, and their coordinated and professional activities are managed at the corporate level.
Proactive IT (offensive IT) Under this strategy, with the necessary support of business activity and the implementation of critical business processes, information systems are used to make changes in business strategy, primarily as a tool of competitive advantage. Offensive and proactive role of information systems occurs when the strategic reasons for their use are on the same level or more important than the criteria of reliability and availability. Offensive role of information systems means that they are used as a lever of business inno-vation and radical change (transformation) of business. Such activities are ambitious and risky but po-tentially profitable.
Companies use this strategy when they want to improve their competitive position and threaten the market leader. A common method of attack is the use of innovative technology and information systems that provide operational efficiency (dramatically lower operating costs), but also a radical change in the way of business processes. This very complex strategy often has a dual character: the company must invest in perfect, mechanically correct functioning of existing systems and infrastructure, but also con-tinuously develop completely new, innovative systems that will allow them to achieve and maintain competitive positions.
Given that information systems are used for strategic purposes, except for monitoring of their func-tioning, the role of the informatics management is consulting as well, and also applies to proposing stra-tegic initiatives for their use for improving the competitive position. Companies using this strategy and information systems usually form some additional advisory and supervisory body for the management of information technology on the corporate level (e.g. Project Management Committee, the Committee for the strategic application of IT, IT Governance Committee).
5.1. Support mode (reactive strategy)
The main objective of this role of information systems is to provide operational, i.e. technical support to business. Information systems and information technology are not critical business functions, and are commonly used to support the activities of employees. There are a few examples of critical business processes that directly depend on the functioning of information systems. Also, there are no frequent examples of integrating or connecting remote parts of the business, and IT infrastructure supports the local business processes, thus creating groups of interrelated applications and databases.
Although the IT function is very important for business, the use of IT infrastructure does not remove the company’s major risks. Information systems are used mainly within the company, transactional sys-tems are not prominent and accessible to customers, suppliers and partners, and even repeated system malfunctions do not affect the business significantly.
Unique features of the application of information systems as operational support to business are the following: critical business processes do not depend on the functioning of IT and information systems; IT risks are easily managed and controlled, because the business does not depend on the functioning of information systems; and even repeated interruptions and difficult work of information system do not significantly affect the flow of business processes and does not constitute a separate business risk; speed of response of information system and data processing speed is not crucial for the implementation of
44 Vesna Aleksić Marić et al. Strategic Management of Information Systems in the Function of Efficient Business of Companies
STRATEGIC MANAGEMENT, Vol. 17 (2012), No. 3, pp. 036-046
business processes and transactions, and critical business processes take place in the batch processing; internal, transactional systems are not accessible to customers, suppliers and partners, but are used only by employees of the company; after interruption or failure of information systems, company can switch to manual mode quickly and without additional cost, which will not significantly affect operations or increase business risks; there are is formal IT management systems, and the CIO belongs to the opera-tional level of management and is responsible to the Director of Finance; decisions about investments in IT are made spontaneously, without having analyzed the needs of business, investment in IT is mainly related to the maintenance of existing infrastructure and functionality and there are very rare examples of investment in development.
5.2. Reliability and operational significance (reactive strategy, i.e. factory mode)
The main characteristic of information systems implementation in this context is that many critical business processes distinctly depend on their continuous support. Companies need reliable, secure and always available IT support, but a very brief interruption in the functioning of information systems or certain services (e.g. failure to less than one minute) means the termination of critical business proc-esses, which presents huge business risks and can cause irreparable damage. The key indicators of per-formance and the critical numbers that evaluate the success of information management will certainly include the level of access to information systems. In addition to the information system being an im-portant means of connecting internal business processes and overall business integrator, its boundaries extend to customers, suppliers and partners from the environment. This means that the system can be used by authorized users outside the organization, which brings major cost savings and represents the foundation of operational efficiency.
The company and its management can hardly imagine efficient operations without continued support of information systems, and information technology is a constant theme in Board and management team meetings. Internet technology is extensively used and most of business processes are online. This means that the concept of electronic commerce is very seriously involved, or at least extranet is extensively used. The business is therefore highly dependent on IT support, and a very short time (e.g. 1 to 2 sec-onds), in which the information system or information services do not support user activities can result in serious difficulties and damage (Fulmer, 2005).
In this case, a business should have highly reliable, secure and continuously available IT. It should be mature, not fashionable; it should use tested solutions and technologies rather than experiment with the latest novelties and technological innovations. Critical IT business processes are continuity of busi-ness, control of IT infrastructure, recovery plan after system malfunction, control system maturity and controlled investments in IT.
Unique features of the application of information systems as a reliable business support are the fol-lowing: information supports critical business processes within and outside the organization; a very brief outage or difficulty in functioning information system can have irreparable consequences for the business; using mature, proven technology is of essence; business continuity management is regarded as one of critical activities; it is necessary to constantly monitor the performance of the system and peri-odically conduct performance audits of information systems; information system implementation is the basis of operational efficiency, because it allows substantial cost savings, but is not a source of differen-tiation and strategic advantage.
5.3. Turnaround mode (proactive strategy)
Companies typically use this strategy of information systems when running large IT projects and large operative change projects. These companies are mostly in the midst of extensive and radical transforma-tion of their business, and IT is used as a means for achieving strategic competitive advantage. Charac-teristics of these strategies include great investments in IT (more than 50% of capital expenditures, more than 15% of total cost) and considerable risk levels, but also a potential interim sustainable competitive advantage. In the case of this strategy, there is an intense need for innovative businesses, and relatively small for reliable information technology. That does not mean that the company does not take care of the availability and reliability of the existing information system, but it wants to replace it with a new, innovative solution in a shorter period of time.
Vesna Aleksić Marić et al. Strategic Management of Information Systems in the Function of Efficient Business of Companies 45
STRATEGIC MANAGEMENT, Vol. 17 (2012), No. 3, pp. 036-046
New systems need to provide a drastic improvement of business processes and services, major cost savings and potential leadership position on the market. This strategy is very risky, and the first com-pany that succeeds in implementing a new technological solution usually manages to maintain its com-petitive advantage for a certain time, although a temporary monopoly created based on innovative solu-tion is very short, because imitators copy it very fast. Given that these companies spend on IT exten-sively with the hope of achieving significant strategic advantages, and that their business is quite risky, they usually use this strategy for a relatively short time. This period usually refers to the time of imple-mentation of IT projects, when the management should seek a new preferred strategy for the application of information systems in business. During this period, there is a smaller need for reliable, continuous systems, and existing systems are sufficiently simple and can be controlled by manual procedures. Monitoring by management and supervisory bodies is necessary and critical for this strategy of informa-tion systems implementation. This particularly applies to risk management and control of implementa-tion of IT projects.
5.4. Strategic mode (proactive strategy)
In this case, information systems are used as a means of constant innovation of business in order to maintain competitive advantage, but also as a reliable, safe and almost always available infrastructure that supports business processes. Hence, this is a very risky and dual strategy that is very difficult to implement, control and manage its implementation risks. The main characteristics of the strategic appli-cation of information systems are very high costs and large investments that include twofold: intensive investment in IT in order to achieve future strategic advantage and intensive investment in reliable, un-interrupted operation of existing information systems that support business processes.
As with the operational significance strategy, a very brief stop in functioning of information system means a cessation of business processes, and thus a great risk and potential problems in the business. The use of reliable, safe, fast and accurate current systems provides the company with competitive ad-vantage, but whether they will keep it in the future depends on their improvement and development. All companies cannot use this type of strategy or the role of IT in business. Some companies (such as auto-motive, airlines, or financial institutions) are forced to continually use this strategy for information technology, because competitive pressure forces them to continually invest in systems delivering strate-gic leadership.
Given that this is a substantial investment and risk, companies using this strategy should have well-developed mechanisms for managing information technology on the corporate level. This primarily means that IT should be a strategic business function, and the CIO should be a member of the Board of Directors and the highest executive management. In addition, it is important to establish an advisory and supervisory bodies whose member is at least one expert in this area. Conclusion
Since information systems are becoming an important backbone of the business, management must take into account their availability, reliability, risk management and use of this valuable corporate resource. Information system management is therefore an important part of business management process relating to the determination of the responsibility for effectively managing the entire IT infrastructure, opera-tions, risk management of its intensive use and management of investments in IT in line with business priorities.
Corporate governance of informatics and information systems is a set of techniques and methods used by the top management when dealing with the implementation of information technology in busi-ness, investment in IT, successes and risks of its use, but also taking responsibility for the implementa-tion of IT control processes and all activities. The main goal of the process of corporate governance of informatics is that executive management and the highest governing body of the company will become responsible for all the important issues of management information systems. This is especially true in the following areas: the adoption and implementation of information systems strategy and its strong connection to business strategy, determining the optimal role of IT in business and way of its organiza-tion and management, determining metrics to measure the impact of IT on the business and its effi-ciency, making IT risk management plan at the level of the entire company, effective management of IT
46 Vesna Aleksić Marić et al. Strategic Management of Information Systems in the Function of Efficient Business of Companies
STRATEGIC MANAGEMENT, Vol. 17 (2012), No. 3, pp. 036-046
projects and investments, and allocation of responsibility for the effectiveness of information systems controls. SM
References Aleksić Marić, V., & Bašić, D. (2012). Customer Relationship Management in Banking in the Context of Business
Intelligence. TTEM - Technics Technologies Education Management, 7 (1), 154-163. DeLone, W. H., & McLean, E. R. (1992). Information Systems Success: The Quest for the Dependant Variable. Information
Sysetms Research, 3 (1), 60-95. Fulmer, K. (2005). Business Continuity Planning - A Step-by-Step Guide With Planning Forms. Brookfield: Rothstein
Associates. Lederer, A. L., & Salmela, H. (1996). Toward of Theory of Strategic Information System Planning. Journal of Strаtеgic
Information Systems, 5 (3), 237-253. Nolan, R., & McFarlan, F. W. (2005). Information Technology and the Board of Directors. Harvard Business Review, 83 (10),
96-106. Symons, C. (2005). It governance framework: Structures, processes and framework. Cambridge: Forrester Research. Correspondence
Vesna Aleksić Marić
Faculty of Economics Banja Luka Majke Jugovića 4, 51000, Banja Luka, Bosnia and Herzegovina
E-mail: [email protected]
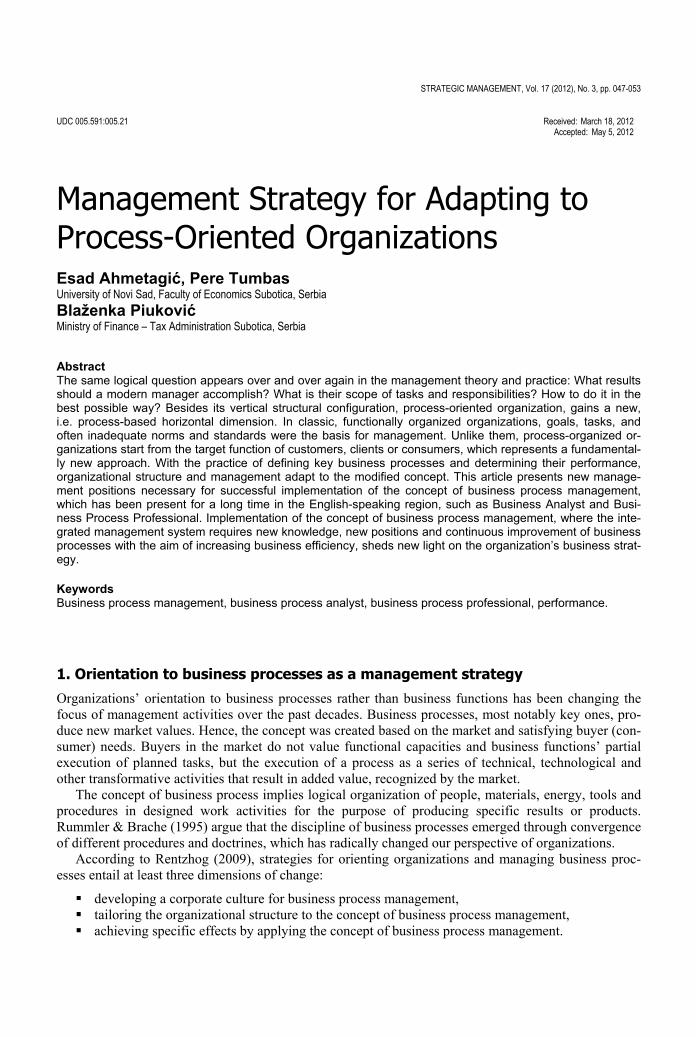
STRATEGIC MANAGEMENT, Vol. 17 (2012), No. 3, pp. 047-053 UDC 005.591:005.21
Received: March 18, 2012
Accepted: May 5, 2012
Management Strategy for Adapting to Process-Oriented Organizations
Esad Ahmetagić, Pere Tumbas University of Novi Sad, Faculty of Economics Subotica, Serbia
Blaženka Piuković Ministry of Finance – Tax Administration Subotica, Serbia
Abstract The same logical question appears over and over again in the management theory and practice: What results should a modern manager accomplish? What is their scope of tasks and responsibilities? How to do it in thebest possible way? Besides its vertical structural configuration, process-oriented organization, gains a new, i.e. process-based horizontal dimension. In classic, functionally organized organizations, goals, tasks, andoften inadequate norms and standards were the basis for management. Unlike them, process-organized or-ganizations start from the target function of customers, clients or consumers, which represents a fundamental-ly new approach. With the practice of defining key business processes and determining their performance,organizational structure and management adapt to the modified concept. This article presents new manage-ment positions necessary for successful implementation of the concept of business process management,which has been present for a long time in the English-speaking region, such as Business Analyst and Busi-ness Process Professional. Implementation of the concept of business process management, where the inte-grated management system requires new knowledge, new positions and continuous improvement of businessprocesses with the aim of increasing business efficiency, sheds new light on the organization’s business strat-egy. Keywords Business process management, business process analyst, business process professional, performance.
1. Orientation to business processes as a management strategy
Organizations’ orientation to business processes rather than business functions has been changing the focus of management activities over the past decades. Business processes, most notably key ones, pro-duce new market values. Hence, the concept was created based on the market and satisfying buyer (con-sumer) needs. Buyers in the market do not value functional capacities and business functions’ partial execution of planned tasks, but the execution of a process as a series of technical, technological and other transformative activities that result in added value, recognized by the market.
The concept of business process implies logical organization of people, materials, energy, tools and procedures in designed work activities for the purpose of producing specific results or products. Rummler & Brache (1995) argue that the discipline of business processes emerged through convergence of different procedures and doctrines, which has radically changed our perspective of organizations.
According to Rentzhog (2009), strategies for orienting organizations and managing business proc-esses entail at least three dimensions of change:
developing a corporate culture for business process management, tailoring the organizational structure to the concept of business process management, achieving specific effects by applying the concept of business process management.
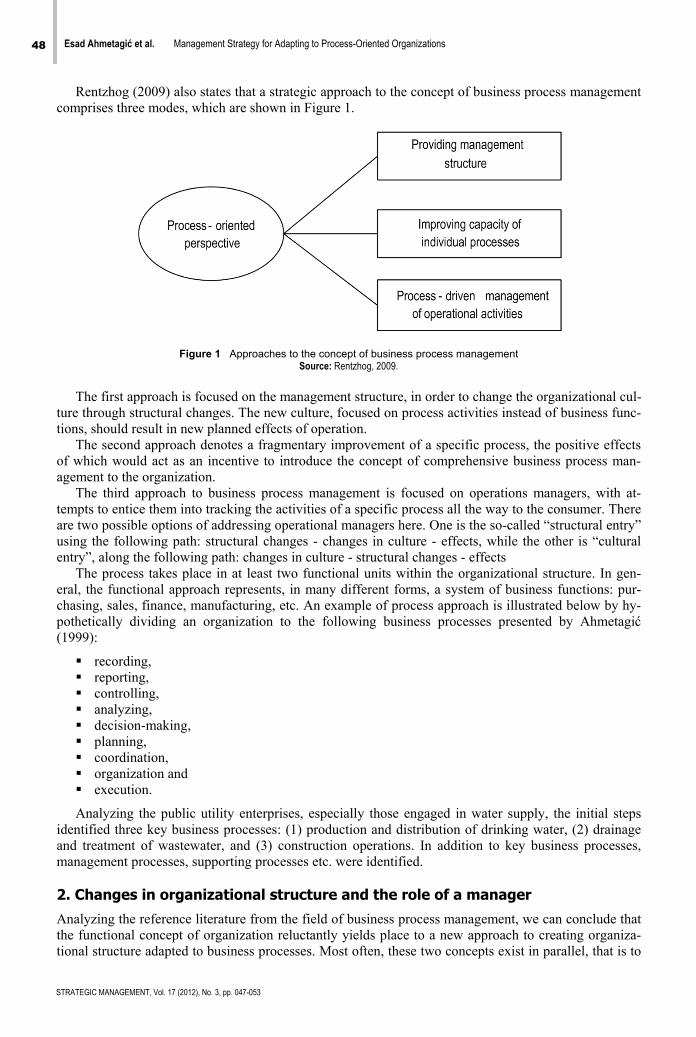
48 Esad Ahmetagić et al. Management Strategy for Adapting to Process-Oriented Organizations
STRATEGIC MANAGEMENT, Vol. 17 (2012), No. 3, pp. 047-053
Rentzhog (2009) also states that a strategic approach to the concept of business process management comprises three modes, which are shown in Figure 1.
Figure 1 Approaches to the concept of business process management Source: Rentzhog, 2009.
The first approach is focused on the management structure, in order to change the organizational cul-
ture through structural changes. The new culture, focused on process activities instead of business func-tions, should result in new planned effects of operation.
The second approach denotes a fragmentary improvement of a specific process, the positive effects of which would act as an incentive to introduce the concept of comprehensive business process man-agement to the organization.
The third approach to business process management is focused on operations managers, with at-tempts to entice them into tracking the activities of a specific process all the way to the consumer. There are two possible options of addressing operational managers here. One is the so-called “structural entry” using the following path: structural changes - changes in culture - effects, while the other is “cultural entry”, along the following path: changes in culture - structural changes - effects
The process takes place in at least two functional units within the organizational structure. In gen-eral, the functional approach represents, in many different forms, a system of business functions: pur-chasing, sales, finance, manufacturing, etc. An example of process approach is illustrated below by hy-pothetically dividing an organization to the following business processes presented by Ahmetagić (1999):
recording, reporting, controlling, analyzing, decision-making, planning, coordination, organization and execution.
Analyzing the public utility enterprises, especially those engaged in water supply, the initial steps identified three key business processes: (1) production and distribution of drinking water, (2) drainage and treatment of wastewater, and (3) construction operations. In addition to key business processes, management processes, supporting processes etc. were identified.
2. Changes in organizational structure and the role of a manager
Analyzing the reference literature from the field of business process management, we can conclude that the functional concept of organization reluctantly yields place to a new approach to creating organiza-tional structure adapted to business processes. Most often, these two concepts exist in parallel, that is to
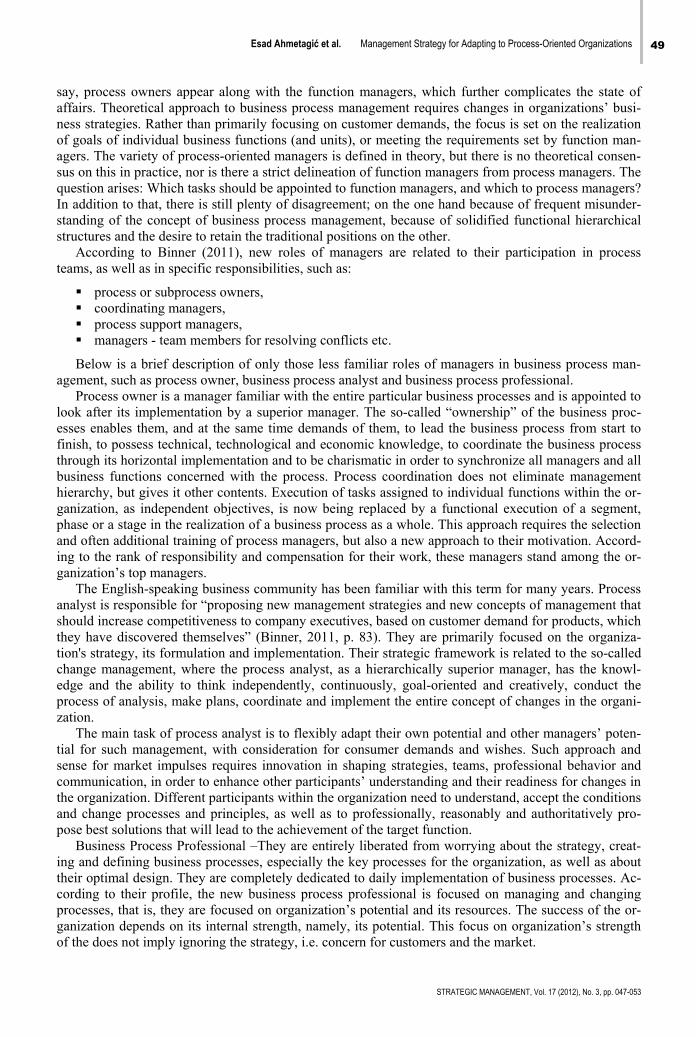
Esad Ahmetagić et al. Management Strategy for Adapting to Process-Oriented Organizations 49
STRATEGIC MANAGEMENT, Vol. 17 (2012), No. 3, pp. 047-053
say, process owners appear along with the function managers, which further complicates the state of affairs. Theoretical approach to business process management requires changes in organizations’ busi-ness strategies. Rather than primarily focusing on customer demands, the focus is set on the realization of goals of individual business functions (and units), or meeting the requirements set by function man-agers. The variety of process-oriented managers is defined in theory, but there is no theoretical consen-sus on this in practice, nor is there a strict delineation of function managers from process managers. The question arises: Which tasks should be appointed to function managers, and which to process managers? In addition to that, there is still plenty of disagreement; on the one hand because of frequent misunder-standing of the concept of business process management, because of solidified functional hierarchical structures and the desire to retain the traditional positions on the other.
According to Binner (2011), new roles of managers are related to their participation in process teams, as well as in specific responsibilities, such as:
process or subprocess owners, coordinating managers, process support managers, managers - team members for resolving conflicts etc.
Below is a brief description of only those less familiar roles of managers in business process man-agement, such as process owner, business process analyst and business process professional.
Process owner is a manager familiar with the entire particular business processes and is appointed to look after its implementation by a superior manager. The so-called “ownership” of the business proc-esses enables them, and at the same time demands of them, to lead the business process from start to finish, to possess technical, technological and economic knowledge, to coordinate the business process through its horizontal implementation and to be charismatic in order to synchronize all managers and all business functions concerned with the process. Process coordination does not eliminate management hierarchy, but gives it other contents. Execution of tasks assigned to individual functions within the or-ganization, as independent objectives, is now being replaced by a functional execution of a segment, phase or a stage in the realization of a business process as a whole. This approach requires the selection and often additional training of process managers, but also a new approach to their motivation. Accord-ing to the rank of responsibility and compensation for their work, these managers stand among the or-ganization’s top managers.
The English-speaking business community has been familiar with this term for many years. Process analyst is responsible for “proposing new management strategies and new concepts of management that should increase competitiveness to company executives, based on customer demand for products, which they have discovered themselves” (Binner, 2011, p. 83). They are primarily focused on the organiza-tion's strategy, its formulation and implementation. Their strategic framework is related to the so-called change management, where the process analyst, as a hierarchically superior manager, has the knowl-edge and the ability to think independently, continuously, goal-oriented and creatively, conduct the process of analysis, make plans, coordinate and implement the entire concept of changes in the organi-zation.
The main task of process analyst is to flexibly adapt their own potential and other managers’ poten-tial for such management, with consideration for consumer demands and wishes. Such approach and sense for market impulses requires innovation in shaping strategies, teams, professional behavior and communication, in order to enhance other participants’ understanding and their readiness for changes in the organization. Different participants within the organization need to understand, accept the conditions and change processes and principles, as well as to professionally, reasonably and authoritatively pro-pose best solutions that will lead to the achievement of the target function.
Business Process Professional –They are entirely liberated from worrying about the strategy, creat-ing and defining business processes, especially the key processes for the organization, as well as about their optimal design. They are completely dedicated to daily implementation of business processes. Ac-cording to their profile, the new business process professional is focused on managing and changing processes, that is, they are focused on organization’s potential and its resources. The success of the or-ganization depends on its internal strength, namely, its potential. This focus on organization’s strength of the does not imply ignoring the strategy, i.e. concern for customers and the market.
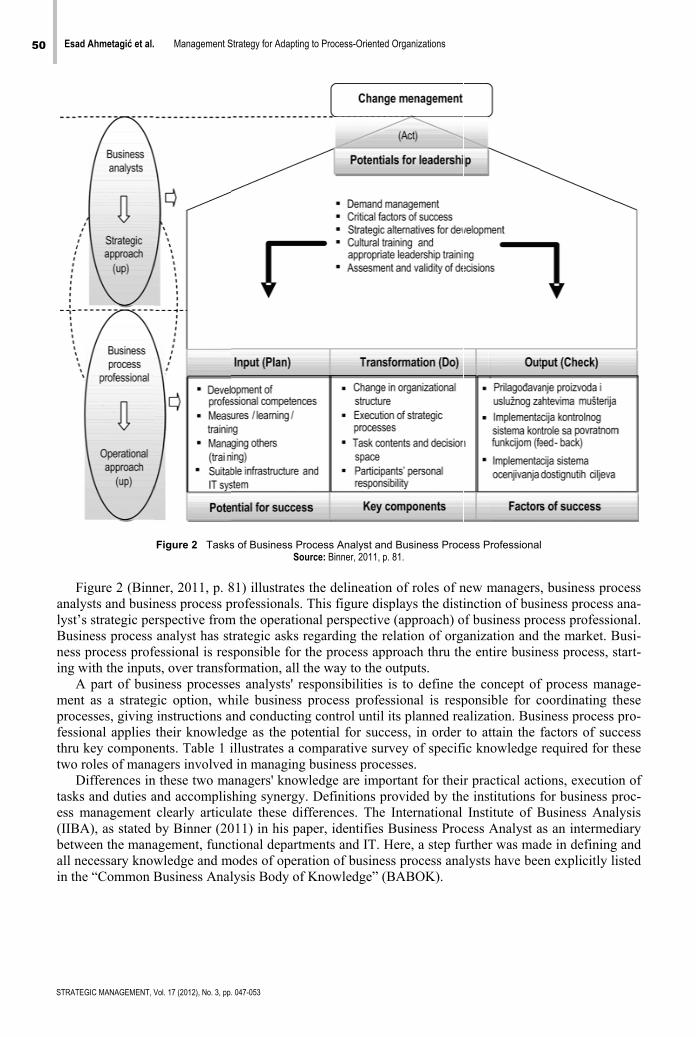
50 Esa
STRAT
F
anallystBusnessing
Amenprocfessthrutwo
Dtaskess (IIBbetwall nin th
ad Ahmetagić et al.
TEGIC MANAGEMENT, V
Figure 2 (Binnlysts and busin’s strategic pe
siness process s process profwith the inputA part of busint as a strategcesses, giving sional applies u key compone roles of manaDifferences inks and duties a
management BA), as stated ween the mananecessary knowhe “Common B
Management S
Vol. 17 (2012), No. 3, pp.
Figure 2 Tasks
ner, 2011, p. 8ness process prspective fromanalyst has st
fessional is rests, over transfoiness processe
gic option, whinstructions atheir knowledents. Table 1 iagers involvedn these two maand accomplisclearly articuby Binner (20agement, functwledge and mBusiness Anal
Strategy for Adapting
. 047-053
s of Business ProSou
81) illustrates professionals. Tm the operationtrategic asks responsible for tormation, all thes analysts' rehile business pand conductingdge as the potillustrates a co
d in managing anagers' knowlhing synergy.
ulate these diff011) in his paptional departm
modes of operatlysis Body of K
to Process-Oriented
ocess Analyst anurce: Binner, 2011, p
the delineationThis figure disnal perspectiveegarding the rhe process apphe way to the osponsibilities process profesg control until ential for succ
omparative surbusiness proceledge are impoDefinitions p
fferences. The per, identifies
ments and IT. Htion of businesKnowledge” (
d Organizations
d Business Procp. 81.
n of roles of nsplays the distie (approach) orelation of orgproach thru thoutputs. is to define thssional is respits planned recess, in order rvey of specifiesses. ortant for thei
provided by theInternational Business Proc
Here, a step fuss process anaBABOK).
ess Professional
new managersinction of busi
of business proanization and
he entire busin
he concept ofponsible for calization. Busto attain the f
ic knowledge
r practical acte institutions fInstitute of B
cess Analyst aurther was madalysts have bee
l
, business proiness process a
ocess professiothe market. B
ness process, st
f process manacoordinating thiness process pfactors of sucrequired for th
ions, executiofor business pBusiness Analas an intermedde in defining en explicitly li
cess ana-
onal. Busi-
tart-
age-hese pro-cess hese
on of proc-lysis diary
and isted
Esad Ahmetagić et al. Management Strategy for Adapting to Process-Oriented Organizations 51
STRATEGIC MANAGEMENT, Vol. 17 (2012), No. 3, pp. 047-053
Table 1 Skills required by business process analysts and professionals
A Business Process Analyst is familiar with: A Business Process Professional is familiar with: Requirements for organization's operation, Business Process Management Lifecycle, Potential risks in business, The basic concept of Business Process management, Distribution of requirements according to the compo-
nents of the system, Factors of success,
The concept of solution in enterprise analysis in corre-lation with the requirements,
Process management using process models within an organization with a portfolio,
Devising integrated management for leadership among the competition,
Changing and introducing business process man-agement using optimization methods,
Means of contriving development and facilitating both internal and external network of processes,
Types and classification of business process man-agement technology,
Conducting change management thru integration of business processes,
Impact of technology on process automation.
Standards of process modeling and familiarity with roles within the process,
Preparation phases of process design and principles of process modeling,
Monitoring and measuring results using suitable indi-cators and methods.
Source: Binner, 2011.
Binner (2011) states the definition of Business Process Professional, included in the definition by the
Association of Business Process Management Professionals (ABPMP) which states that business proc-ess professionals are involved in “identifying, introducing, documenting and improving business proc-esses for the purpose of synchronizing it with the buyer, which should result in better attainment of or-ganizational goals. The main questions here are: WHO does WHAT, HOW and WHAT WITH?”.
BPM CBOK (Business Process Management Common Body of Knowledge) also provides guide-lines for business process managers. Careers and certificates required, that can be reached thru educa-tion are also listed here. Those careers are CBA (Certified Business Analysis Professional), which can be achieved with a particular level of education and 5 years of experience on such jobs, and CBPP (Cer-tified Business Process Professional), which can be achieved with a particular level of education and 2 to 4 years of experience on such jobs.
3. Analysis and Measurement of Process Performance
Business process management entails managing processes in accordance with defined performances. Performances are target values defined by the management or business process analysts, while manag-ing and finding ways to attain them are within the scope of work of business process professionals, that is, process management teams which among others include the owners of key processes and subproc-esses.
The effectiveness of organization’s processes is determined by two factors:
evaluation and measurement of organization’s current and past performance and future goals, stated in the organization’s strategy.
In order to assess and improve the performance of business processes, it is necessary to quantify it. There are numerous measures intended for measuring process performance, which can usually be di-vided into financial, external and internal measures.
Performance measuring is a key activity while designing and implementing the initiative to improve products or processes and assessing achieved results of such improvement.
Financial measures of process performance are based on the difference between the value of process output (product or service) for its buyer and the value of production and shipment cost. The goal of every organization is to maximize this difference. By setting suitable prices for their products and ser-vices, profit organizations retain a portion of this difference as profit. Non-profit organizations allot a major portion of this difference to their clients, while using the remaining portion for facilitating suste-
52 Esad Ahmetagić et al. Management Strategy for Adapting to Process-Oriented Organizations
STRATEGIC MANAGEMENT, Vol. 17 (2012), No. 3, pp. 047-053
nance and expansion of their organizations. Organizations use three types of financial measures of per-formance: absolute (total) measures of performance – e.g. revenue, costs, net income, profit; relative measures of performance in relation to assets employed – e.g. accountancy indicators, such as return on assets, return on investment, inventory turnover ratio; measures of sustenance capability – e.g. cash flow. It should be highlighted that although financial measures of performance are primary ones used for assessing process performance, still they are aggregate and more oriented on results than actions. They are not useful as solitary measures in process management and control. Therefore, successful process management and control presumes the necessity of including external measures, which track consumer expectations, and internal measures, which express the efficiency of the process of satisfying their expectations.
External measures express the level of consumer satisfaction with an organization’s goods or ser-vices. Critical attributes which express consumer expectations concerning the output of the process are: cost (price), response time, variety and quality. Besides measures of satisfaction, measures of dissatis-faction are often used as external measures. These are: repairs within the warranty period, returned products and such. All external measures, whether of satisfaction or dissatisfaction, represent indicators on an aggregate (group) level and are also oriented on results, not actions. They have a very modest contribution to process management and do not indicate how processes can be improved. For them to become more operatively useful, it is necessary to associate them with internal measures, which process managers can control.
Internal measures are detailed operative measures that can be controlled, and are also conditioned by the product and financial performance. External measures, such as cost (price), response time, variety and quality can be translated into internal measures that trace process performance in terms of produc-tion costs, time flow, process flexibility and the quality of output. Internal measures of performance are a portent of external measures of consumer satisfaction, if their expectations are precisely identified. In order to reach efficiency, internal measures must fulfil two conditions: they must be connected to the external measures which buyers state to be important, and must be directly controllable by process man-agers. Measuring and improving the characteristics of product and services that buyers do not value is a waste of time and resources. Likewise, if the impact of process variables on the product and its charac-teristics is unknown, then it is impossible to control.
The managers’ goal is to improve organizations’ financial performance through effective production of goods that satisfy consumer expectations in terms of above stated product features: cost, response time, variety and quality. Therefore, the dimensions used for measuring the capability of a process that correspond with these features are: process costs, process flow time, process flexibility and process quality.
Conclusion
The concept of business process management has been much exploited worldwide for the past 20 years. Business process management has become vital for organizations’ competitiveness. According to the research by Antonucci & Goeke (2009), more than 80% of world's leading organizations are in a stage of implementing a certain business process management program. In the realization of set tasks, organi-zations have particular difficulties with defining the place and the responsibilities of the business proc-ess management concept, as well as finding professionals with specific knowledge, skills and capacity for participating in particular programs.
In their analysis of necessary preconditions for implementing process-oriented organizations, Eicker, Kochbeck, & Schuler (2008) concluded that employees engaged on implementing the concept of busi-ness process management get new roles, or have their present ones altered. Individuals can have more than one role in business process management. This article presents just a few selected roles: process owner, business process analyst and business process professional. Besides these, several other roles appear in business process management: business process consultant, process coordinator, process su-pervisor, and executor of certain process activities.
Primary skills required by the concept of business process management are: real-time management, which entails monitoring event, simulating alternatives and using modern analytical techniques; coop-eration and teamwork, which involves reaching a consensus in operations and modelling prototypes;
Esad Ahmetagić et al. Management Strategy for Adapting to Process-Oriented Organizations 53
STRATEGIC MANAGEMENT, Vol. 17 (2012), No. 3, pp. 047-053
empowerment, which means making decisions based on facts, measuring team performance and con-ducting continuous training of all participants in the realization of activities on implementing the proc-ess approach.
Besides these identified skill, business process management professionals must possess certain key competences. These are: professional competences (great experience and capability of reasoning exper-tise); personal competences (determination in executing activities); methodological competencies (great intellectual power and organizational capability); social competences (self-esteem, focus on teamwork, communicational skills and aptitude for conflict management); entrepreneurial competences (orientation on buyers and enthusiasm for leadership).
Accordingly, realization of significant achievements of the implementation of process approach is conditioned by skills and competences of participants with different roles. Even when well-developed roles exist in business process management, process owners mostly do not have immediate control over the staff engaged on running the processes. Besides that, there a culture supporting team organization is not developed, costs are monitored at the level of activities within business functions, business rules and steps for execution of process activities are hard to change, processes are visible only within business functions, risk analysis is based on experience, intuition and analysis of data provided by managers within the organization. All conclusions point to the need for planned and organized approach to creat-ing preconditions for implementing the concept of business process management within organizations. SM
References
Ahmetagić, E. (1999). Organizacija preduzeća. Subotica: Čikoš Holding. Anntonucci, I. L., & Goeke, R. J. (2009, May 7). Analysis of Business Process Management Skills and Characteristics. Retrieved December 5, 2011 from Widener University: http://www2.widener.edu/~yantonuc/surveyresults/ResultsMay09.pdf Binner, H. F. (2011). Business Analyst und Business Process Professional. Journal Zeitschrift Führung und Organisation (2), 80-87. Eicker, S., Kochbeck, J., & Schuler, P. M. (2008). Employee Competencies for Business Process Management. Proceedings 11th International Conference Business Information Systems BIS 2008 (pp. 251-262). Heidelberg: Springer-Verlag. Rentzhog, O. (2009). Temelji preduzeća sutrašnjice. Novi Sad: Prometej. Rummler, G. A., & Brache, A. P. (1995). Improving performance. New York: John Wiley&Sons. Widener University. (2009, May 7). Analysis of Business Process Management Skills and Characteristics. Retrieved January 22, 2012 from Widener University: http://www2.widener.edu/~yantonuc/surveyresults/ResultsMay09.pdf Correspondence
Esad Ahmetagić
Faculty of Economics Subotica Segedinski put 9-11, 24000, Subotica, Serbia
E-mail: [email protected]
STRATEGIC MANAGEMENT, Vol. 17 (2012), No. 3, pp. 054-063 UDC 005.334:653.4
Received: February 12, 2012
Accepted: July 15, 2012
Compatibility of the Romanian Accounting System with the Standard IAS/IFRS System
Marian Socoliuc, Ionel Bostan, Veronica Grosu, Elena Hlaciuc, Camelia Mihalciuc, Ioana Colbu Stefan cel Mare University of Suceava, Romania
Dorel Mates West University of Timisoara, Romania
Abstract Steps in making the Romanian accounting system compatible with the ones used worldwide are determinedespecially by the new configuration of international economic relations, entering a process of generalized glo-balization, fuelled by the international movement of capital. We can therefore consider that the accounting system is in a phase of „historical conciliation”, in which different accounting systems redefined the conceptualframe in their desire to meet new informational demands. The purpose of this article is to highlight and analyze the differences and the similarities that characterize theinternational IAS/IFRS accounting system and the Romanian national accounting system, and issues faced byall economic entities, regardless of the nature of their activity or size. Keywords IAS/IFRS Standards; Romanian accounting system; harmonization process; framework.
Introduction
The results of applying International Financial Reporting Standards provide insight to financial manag-ers, regulators and those who set standards in the companies for the implementation of standards, under various national regimes. They illustrate the impact of national requirements on the company’s efforts to obtain comparable financial reports. Regulators take into account changes in their requirements and demonstrate how existing national requirements can limit or assist aligning companies.
Contemporary economic reality, which is a continuous change, has as constant the change itself. In a world of dramatic changes in relatively short time, accounting – as the language of business, must adapt to new requirements of the international landscape. This international dimension in a continuous process of growth has further highlighted the fact that the accounting system, as an important means of commu-nication, differs in content and arrangements from one country to another.
The accounting represents a privileged source of information for fiscal authorities. It has often at-tempted to establish a relationship between tax policy and accounting, in order to indicate the direction of influences. Therefore, the following scenarios can be identified (Istrate, 1999):
accounting is influenced by taxation, with varying degrees of intervention; accounting is independent of tax (both are disconnected); tax is influenced by accounting.
Marian Socoliuc et al. Compatibility of the Romanian Accounting System with the Standard IAS/IFRS System 55
STRATEGIC MANAGEMENT, Vol. 17 (2012), No. 3, pp. 054-063
Over the past decades, accounting documents and summary reporting have experienced a series of major changes in form and content, jurisdiction and the rules governing financial markets increasingly inserting their mark on the characteristics of accounting information.
Harmonization is the term established in international accounting for referring to the reduction of gaps between international accounting rules.
The total normalization at international level is, however, considered to be impossible and unneces-sary, if one takes into account that accounting is actually a part of the cultural environment, but that harmonization would permit overcoming major obstacles to international comparisons.
1. Romanian accounting system changes between European and international requirements.
a. The balance sheet Currently, in Romania, the balance sheet is regulated both in terms of content and in form and for-
mat by the Order of the Minister of Public Finance no. 3055/2009 for approval of accounting regula-tions in accordance with European directives.
The first observation that we can make is that the accounting rules in our country have opted for a “classification of the elements” of assets into fixed and current assets, thus respecting the requirements of the Fourth Directive. The criteria adopted for classification of items was the one based on the liquid-ity of assets and not on the classification of current/ non-current.
Under current regulations, the current assets category elements can include elements whose liquidity is higher than a year; for example, the element Receivables includes credit that can be collected either in a period of less than one year (in most cases) or a period longer than one year (in rare cases). As regards the classification of liabilities, standard Romanian accountants have opted for the classification criteria of current / non-current. Thus, in the balance sheet, the structures of debt to be paid in a period longer than one year and that the debts to be paid in a period of less than 1 year appear separately (The Minis-try of Finance of Romania, 2009). Both structures contain the same detailing of debt:
loans from bond issues, sums due to credit institutions, advance payments received for orders, payable, payable commercial paper, amounts owed for participation, other creditors including fiscal and social insurance.
In the following section, we are presenting a series of situations that create confusion in terms of the expression harmonization with EU directives and international accounting standards. Thus, in the form of the balance sheet required by the Romanian regulations, the Formation expenses are presented as intangible fixed assets and not as elements outside the assets, even though the last one is more under-standable, taking into consideration that it is followed the harmonization with international standards, according to which the Formation expenses cannot be recognized as assets, because they do not respect the grounds of assets definition (they do not bring future economic benefits that can be evaluated in credible way) (Grosu & Bostan, 2009). It can also be observed that in the case of Research and devel-opment expenses, the conformity with the international standards is made, in the sense that the recogni-tion of the research expenses that do not comply with the conditions of intangible assets it is waived in the balance sheet, only the Development expenses being maintained in the balance sheet. For the finan-cial and tangible assets, the detailed structure as presented in the Fourth Directive is maintained, while IAS1 Presentation of Financial Statements permits the companies to classify them in detail. For the elements of capital and debts, in general, the format presented in The Forth Directive is adhered to (Grosu, 2010).
A last observation in what concerns the format of the balance sheet is referring to the liquidity indi-cators calculated in the balance sheet: net current assets and net current debts, which reflect the value of permanent capitals. These indicators are taken from The Forth Directive and could not be found in any shape in the model proposed by IAS, but the choice was inspired due to the relevance of financial
56 Marian Socoliuc et al. Compatibility of the Romanian Accounting System with the Standard IAS/IFRS System
STRATEGIC MANAGEMENT, Vol. 17 (2012), No. 3, pp. 054-063
statement’s users, as well as due to the anticipation of reconsidering the model of the balance sheet at international level (Hlaciuc, & Petriş, 2008).
Financial reports aim at assuring an efficient dialogue between the entity and the external operators interested in having realistic estimations on the growing perspectives of the entity and, equally, on its sustainability (Mironiuc, 2006).
b. The profit and loss account Although the financial result is showed in the balance sheet through the account balance of 121
“Profit and loss”, it is necessary to use another document to show in detail the way of generating the result, which could offer additional information regarding the causes that determined a certain economic performance. According to the International Accounting Standards, the company’s performance is showed thru a separate financial statement, The Profit and Loss Account (The Ministry of Finance of Romania, 2009). For this purpose, the current incomes and expenses recorded in the sixth and the sev-enth account classes are processed and systematized separately in the two parts of the results account. The structure of incomes and expenses on the three main activities of the entity allows the determination of essential indicators, on different levels of aggregation, as follows:
Operating result (profit or loss) = Operating income - Operating Expenses. The financial result (profit or loss) = Financial income - Financial expenses. The extraordinary result (profit or loss) = Extraordinary income - Extraordinary expenses.
In the purpose of these regulations, the next terms have the following means: the income is recorded as an increase in economic benefits during the accounting period in the form of inputs or increases in assets or reductions in liabilities, which is reflected in increases in equity, other than those resulting from the contributions of the shareholders.
Expenses are recorded as reductions in economic benefits during the accounting period as outputs or decreases in asset values or increases in liabilities, and results in reductions in equity, other than those resulting from their distribution to shareholders.
The incomes and the expenses which are different than the ones included in the current activities must be presented at “Extraordinary incomes” and “Extraordinary expenses”.
To establish if an event or a transaction is clearly delimited of the current activities, what should be pursued is rather the nature of the element or of the transaction conducted by the company than the fre-quency that the event is expected to take place. As follows, an event or a transaction can be extraordi-nary for one entity, but not for another, due to the differences between the current activities of the com-panies (Ghidul practic de aplicare a reglementărilor contabile conforme cu directivele europene apro-bate prin OMFP nr. 3055/2009, 2010).
c. The cash flow statement The cash flow reflects the net increase or decrease of financial means during a financial year. The
main objective of the cash flow statements is to reflect the influence of operating, investing and financ-ing activities on the monetary means of companies during a financial year. The cash flow statement classifies cash receipts and cash disbursements in three groups.
Cash flow issues were addressed in terms of International Accounting Standards Board - IASB, which makes direct reference to cash flow statements through international standards: IAS 1 “Presenta-tion of Financial Statements”, IAS 7 “Cash flow table.” Thus, when dealing with the problem of the structure and the content of cash flows, IAS 1 refers to IAS 7, which details all aspects of the cash flow table. IAS 7 states that “the objective of the standard is to require the provision of information about the historical change in cash and cash equivalents of an entity by means of a cash flow statement that classi-fies cash flows during the period from operating, investing and financing activities” (The Ministry of Finance of Romania, 2009).
The cash flows generated by operating activities
The cash flows generated by operating activities are, essentially, the consequence of the main activities that generate incomes and, thus, they come from transactions and other elements that compete to form the net result.
Marian Socoliuc et al. Compatibility of the Romanian Accounting System with the Standard IAS/IFRS System 57
STRATEGIC MANAGEMENT, Vol. 17 (2012), No. 3, pp. 054-063
The dimension of cash flows involved in operating activities is a key indicator of the level the com-pany has released by its exploitation enough cash flows to pay back the loans, to maintain its opera-tional capacity, to pay dividends and to make investments without resorting to extern financial sources (Ghidul practic de aplicare a reglementărilor contabile conforme cu directivele europene aprobate prin OMFP nr. 3055/2009, 2010). The operational activities are defined by the Standard as the principal revenue producing activities of the entity, that are not associated with investment or financing activities. The cash flows derived from operation activities represent an important part of the cash flow statement, because it shows the success or the failure registered by these activities at generating cash for returning loans, paying dividends or making new investments without applying to external monetary sources.
Cash flows generated by investing activities
Cash flows generated by investing activities offer information on the manner in which the entity assures its continuity and growth. These activities refer to:
payments to acquire tangible and intangible and other long term assets, including capitalized de-velopment costs and payments incurred in property products for the economic entity itself,
proceeds arising from the sale of tangible and intangible and other long-term assets, payments made for acquisition of equity and debt securities issued by other companies, and pay-
ments for the acquisition of securities of joint ventures (other than payments for the instruments considered as cash equivalents or held for commercial purposes),
proceeds relating to sale of equity and debt securities issued by or derived from other economic entities, and receipts relating to the sale of securities held in joint ventures (other than revenues generated by the instruments considered as cash equivalents or held for commercial purposes),
cash advances and loans to third parties (other than advances and loans made by a financial insti-tution belonging to flows generated by operating activities to such entities),
proceeds arising from the repayment of cash advances and loans to third parties (other than ad-vances and loans made by a financial institution).
Investment activities presented by the standard consist of acquisition and disposal of long-term as-sets and investments, not included in cash equivalents. These flows are presented separately because they represent costs incurred to resources intended to generate income and cash flows in the future.
Cash flows generated by financing activities (Order of the Minister of Public Finance no. 3055/2009).
Financing activities are those activities that involve changes in size and structure of equity and bor-rowed the economic entity. Separate disclosure of these cash flows in graphs is given by the possibility of their use in predicting the amounts which holders shall withdraw their equity from future funds.
Movements of cash generated by financing activities relate to:
receipts from issuing shares and other equity instruments, payments made to shareholders for the purchase or redemption of the company shares, reimbursement form of borrowed liquidities amounts, payments made by the lessee for the reduction of the outstanding debt on a contract of lease fi-
nancing.
The cash flow statement allows the assessment of economic entity’s financial performance because it includes information outlining the company’s capacity to generate cash flows from operating activi-ties that they conducted.
d. Notes to financial statements Notes to financial statements are an integral part of financial reporting process, in accordance with
International Financial Reporting Standards (IFRS), providing important and detailed disclosures re-quired by IFRS, and other information voluntarily provided by management.
Explanatory notes to financial statements of an economic entity must provide information about the basics of preparation of financial statements and specific accounting policies, selected and applied for significant transactions and events and provide additional information that are not presented in the fi-nancial statements but are necessary for a fair presentation (Pereş, Pereş, & Domil, 2008).
58 Marian Socoliuc et al. Compatibility of the Romanian Accounting System with the Standard IAS/IFRS System
STRATEGIC MANAGEMENT, Vol. 17 (2012), No. 3, pp. 054-063
Moreover, the notes must be presented in a systematic manner, so that every element from the bal-ance sheet, the profit and loss account and the cash flow statement refer to the information from the notes.
Notes include information about the following (The Ministry of Finance of Romania, 2009):
specific accounting policies have been used in preparing the financial statements, the conditions attached to loan agreements, information on leases, off-balance sheet financing, breakdown of activities by major segments, contingent assets and liabilities, detailed presentations on pension plans.
Explanatory notes should disclose information about accountancy rules which led to the annual fi-nancial statements and accounting policies used to provide additional information not presented in the balance sheet, income statement and, where applicable, statement of changes in equity and / or cash flow statement, but they are relevant to the understanding of any of them.
Explanatory notes are presented systematically. There should be related information in the notes for each significant element of the annual financial statements. They must include information on valuation methods applied to different elements of the annual financial statements and methods used for calculat-ing the value adjustments. For items included in the annual financial statements which they are or were originally expressed in foreign currency (forex), there must be the basis of conversion used to express them in local currency. The notes also have to contain the following information (The Ministry of Fi-nance of Romania, 2009):
the name and address of each of the bodies in which the entity has interest, either directly or through a person who acts in his own name but on behalf of the entity, representing a participat-ing interest share capital of at least 20%, showing: the proportion of owned capital, the capital and reserves, profits or losses in the last financial year for which annual financial statements were approved and
the name, headquarters or domicile and legal form of each of the entity where the entity is asso-ciated with limited liability.
Explanatory notes should include information on the net turnover, broken down by business seg-ments and geographical markets, to the extent that these segments and markets differ substantially from each other, taking into account way of organizing the product sales and delivery of services for the en-tity’s current activities.
2. Annual financial statements under international financial reporting standards IAS / IFRS
The standards developed by the IASB are called “International Financial Reporting Standards” (IFRS) and contain 41 IASs and IFRS 9, with 40 standards currently in effect.
European accounting standards were developed directly by experts appointed by the European Un-ion, as formalized by the Fourth Directive, which includes rules on social preparation and presentation of annual accounts, the Seventh Directive governing consolidated accounts drawn up by groups of un-dertakings and Directive VII, on free accounting profession oriented audit of annual accounts (Bogdan, 2004).
IFRS and IASB’s goal is to develop a single set of high quality, easily understood and accepted worldwide, in the public interest. As regards the international standards IAS / IFRS issued by IASB, as emerges from IASB strategy, their role and importance are:
providing generally accepted accounting rules accepted in all countries, able to harmonize a large extent as accounting standards and procedures applied in various countries; consequently, the IASB focused on key issues so that standards should not become too complicated and difficult to adopt and apply to the specific accounting of every country,
Marian Socoliuc et al. Compatibility of the Romanian Accounting System with the Standard IAS/IFRS System 59
STRATEGIC MANAGEMENT, Vol. 17 (2012), No. 3, pp. 054-063
ensuring the same basis for preparing financial statements so that investors and international banks can make comparative analysis of different investment opportunities,
IAS / IFRS accounting standards do not overrule local. the scope of IAS is circumscribed only to the essential and the date specified in the standard text,
except those which apply retroactively.
From 1 January 2005, EU companies that have securities listed on a stock exchange in the EU must prepare consolidated financial statements in conformity with International Financial Reporting Stan-dards (IFRS), claiming otherwise in all or almost all cases and comparative financial statements. Also, most EU countries will enable IFRS in annual accounts of all companies. When to use IFRS by private companies in the EU can be decided for reasons of comparability, in anticipation of possible conver-gence of national standards with IFRS, that is, upon the request of shareholders Bostan & Grosu, (2009).
IASC brings together a total of over 150 professional accountancy organizations in over 110 coun-tries on the development and publication of international accounting standards for submitting annual financial statements, and ensures their acceptance and implementation on a global scale.
At least 100 countries worldwide require or permit the use of IAS / IFRS in the preparation of annual accounts. They are mandatory in all EU countries, Norway, Peru, South Africa, Hong Kong, Philippines and Australia (Grosu, 2010).
International Financial Reporting Standards (IFRS), as standard products of the international body (IASB), are found in the following structures: International Financial Reporting Standards IFRSX, In-ternational Accounting Standards IASX, new interpretations developed by the International Committee of the Reporting Interpretations financial or its predecessor, the Standing Committee for Interpretation.
From 2001, IASC has changed its structure to make its successor, the International Accounting Standards Board (IASB), a global setter, which takes into account national particularities in terms of normalization of accounts.
A complete set of financial statements includes the following components: balance sheet, income statement, a statement reflecting all changes in equity or changes in equity, other than those preventing the equity transaction with owners and distributions to owners; the situation of cash flows and account-ing policies and explanatory notes (Bostan, Pereş, & Domil, 2009).
Institutional work influences the form and content of financial statements. Differences of reporting standards and practices between countries used have been observed in many studies that have attempted to show areas of similarity and differences that affect the financial statements that may influence the motivation for companies to use international standards.
Companies listed on foreign exchanges, subject to U.S. GAAP accounting requirements, are ex-pected to be more likely the use of U.S. GAAPs than IAS / IFRS in order to achieve comparability with other companies in the U.S. market (Grosu & Bostan, 2009).
According to the International Financial Reporting Standards IAS / IFRS, financial statements are a separate information tool prevailing current and potential investments, fundamental for economic deci-sions. In national accounting systems of most EU countries, the purpose of financial statements is “true and fair representation”, assuming they are designed to expose the asset structure of the economic and financial year in question, based on criteria of being able to protect the interests of creditors and share-holders through prudent investment evaluation.
The general theory: IAS / IFRS, and of U.S. GAAP include a general theoretical framework. Theo-ries of balance sheet established under each conceptual framework provide the basis for setting account-ing standards and a reference parameter for drafting economic and financial information, if there are specific accounting standards.
Under IAS / IFRS, intangible assets acquired are capitalized if they meet the criteria for capitaliza-tion and should be amortized over the useful life, and if there are signs of loss of value, devalued assets at the highest value net selling price and value utility, based on the present value of cash flows.
Inventories are accounted at the lower cost and net realizable value input. Cost is determined on FIFO or weighted average cost, and LIFO method is not allowed.
IAS / IFRS allows the creation if provisions for expenditure for the obligations derived from current events emerged disposed of, if resources can be reliably estimated, the recording of restructuring
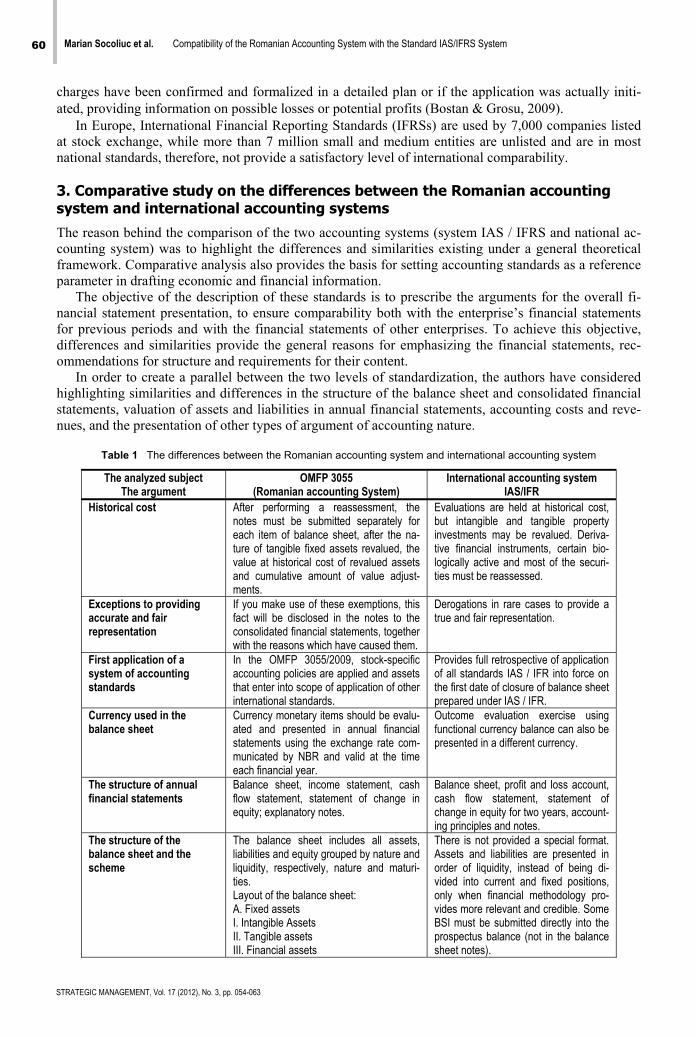
60 Marian Socoliuc et al. Compatibility of the Romanian Accounting System with the Standard IAS/IFRS System
STRATEGIC MANAGEMENT, Vol. 17 (2012), No. 3, pp. 054-063
charges have been confirmed and formalized in a detailed plan or if the application was actually initi-ated, providing information on possible losses or potential profits (Bostan & Grosu, 2009).
In Europe, International Financial Reporting Standards (IFRSs) are used by 7,000 companies listed at stock exchange, while more than 7 million small and medium entities are unlisted and are in most national standards, therefore, not provide a satisfactory level of international comparability.
3. Comparative study on the differences between the Romanian accounting system and international accounting systems
The reason behind the comparison of the two accounting systems (system IAS / IFRS and national ac-counting system) was to highlight the differences and similarities existing under a general theoretical framework. Comparative analysis also provides the basis for setting accounting standards as a reference parameter in drafting economic and financial information.
The objective of the description of these standards is to prescribe the arguments for the overall fi-nancial statement presentation, to ensure comparability both with the enterprise’s financial statements for previous periods and with the financial statements of other enterprises. To achieve this objective, differences and similarities provide the general reasons for emphasizing the financial statements, rec-ommendations for structure and requirements for their content.
In order to create a parallel between the two levels of standardization, the authors have considered highlighting similarities and differences in the structure of the balance sheet and consolidated financial statements, valuation of assets and liabilities in annual financial statements, accounting costs and reve-nues, and the presentation of other types of argument of accounting nature.
Table 1 The differences between the Romanian accounting system and international accounting system
The analyzed subject The argument
OMFP 3055 (Romanian accounting System)
International accounting system IAS/IFR
Historical cost After performing a reassessment, the notes must be submitted separately for each item of balance sheet, after the na-ture of tangible fixed assets revalued, the value at historical cost of revalued assets and cumulative amount of value adjust-ments.
Evaluations are held at historical cost, but intangible and tangible property investments may be revalued. Deriva-tive financial instruments, certain bio-logically active and most of the securi-ties must be reassessed.
Exceptions to providing accurate and fair representation
If you make use of these exemptions, this fact will be disclosed in the notes to the consolidated financial statements, together with the reasons which have caused them.
Derogations in rare cases to provide a true and fair representation.
First application of a system of accounting standards
In the OMFP 3055/2009, stock-specific accounting policies are applied and assets that enter into scope of application of other international standards.
Provides full retrospective of application of all standards IAS / IFR into force on the first date of closure of balance sheet prepared under IAS / IFR.
Currency used in the balance sheet
Currency monetary items should be evalu-ated and presented in annual financial statements using the exchange rate com-municated by NBR and valid at the time each financial year.
Outcome evaluation exercise using functional currency balance can also be presented in a different currency.
The structure of annual financial statements
Balance sheet, income statement, cash flow statement, statement of change in equity; explanatory notes.
Balance sheet, profit and loss account, cash flow statement, statement of change in equity for two years, account-ing principles and notes.
The structure of the balance sheet and the scheme
The balance sheet includes all assets, liabilities and equity grouped by nature and liquidity, respectively, nature and maturi-ties. Layout of the balance sheet: A. Fixed assets I. Intangible Assets II. Tangible assets III. Financial assets
There is not provided a special format. Assets and liabilities are presented in order of liquidity, instead of being di-vided into current and fixed positions, only when financial methodology pro-vides more relevant and credible. Some BSI must be submitted directly into the prospectus balance (not in the balance sheet notes).
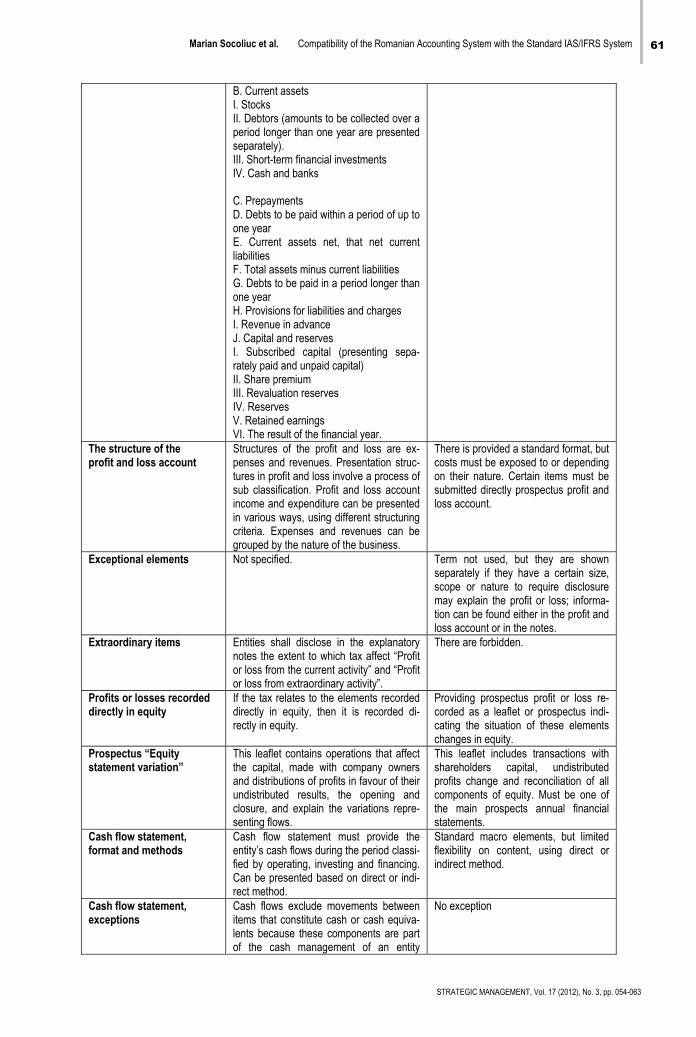
Marian Socoliuc et al. Compatibility of the Romanian Accounting System with the Standard IAS/IFRS System 61
STRATEGIC MANAGEMENT, Vol. 17 (2012), No. 3, pp. 054-063
B. Current assets I. Stocks II. Debtors (amounts to be collected over a period longer than one year are presented separately). III. Short-term financial investments IV. Cash and banks C. Prepayments D. Debts to be paid within a period of up to one year E. Current assets net, that net current liabilities F. Total assets minus current liabilities G. Debts to be paid in a period longer than one year H. Provisions for liabilities and charges I. Revenue in advance J. Capital and reserves I. Subscribed capital (presenting sepa-rately paid and unpaid capital) II. Share premium III. Revaluation reserves IV. Reserves V. Retained earnings VI. The result of the financial year.
The structure of the profit and loss account
Structures of the profit and loss are ex-penses and revenues. Presentation struc-tures in profit and loss involve a process of sub classification. Profit and loss account income and expenditure can be presented in various ways, using different structuring criteria. Expenses and revenues can be grouped by the nature of the business.
There is provided a standard format, but costs must be exposed to or depending on their nature. Certain items must be submitted directly prospectus profit and loss account.
Exceptional elements Not specified. Term not used, but they are shown separately if they have a certain size, scope or nature to require disclosure may explain the profit or loss; informa-tion can be found either in the profit and loss account or in the notes.
Extraordinary items Entities shall disclose in the explanatory notes the extent to which tax affect “Profit or loss from the current activity” and “Profit or loss from extraordinary activity”.
There are forbidden.
Profits or losses recorded directly in equity
If the tax relates to the elements recorded directly in equity, then it is recorded di-rectly in equity.
Providing prospectus profit or loss re-corded as a leaflet or prospectus indi-cating the situation of these elements changes in equity.
Prospectus “Equity statement variation”
This leaflet contains operations that affect the capital, made with company owners and distributions of profits in favour of their undistributed results, the opening and closure, and explain the variations repre-senting flows.
This leaflet includes transactions with shareholders capital, undistributed profits change and reconciliation of all components of equity. Must be one of the main prospects annual financial statements.
Cash flow statement, format and methods
Cash flow statement must provide the entity’s cash flows during the period classi-fied by operating, investing and financing. Can be presented based on direct or indi-rect method.
Standard macro elements, but limited flexibility on content, using direct or indirect method.
Cash flow statement, exceptions
Cash flows exclude movements between items that constitute cash or cash equiva-lents because these components are part of the cash management of an entity
No exception
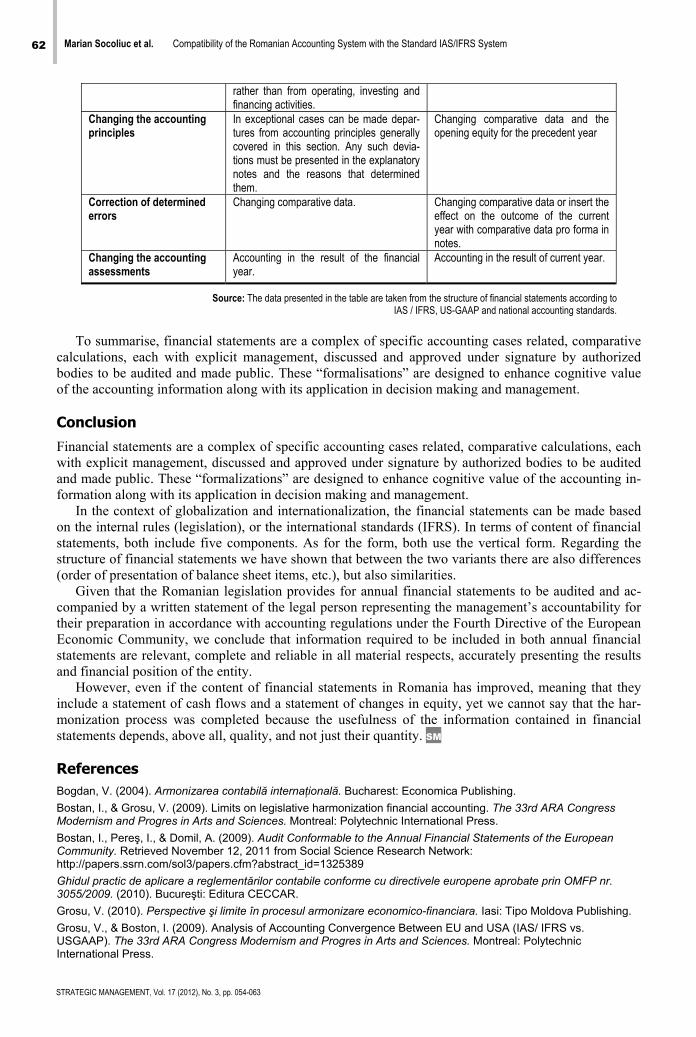
62 Marian Socoliuc et al. Compatibility of the Romanian Accounting System with the Standard IAS/IFRS System
STRATEGIC MANAGEMENT, Vol. 17 (2012), No. 3, pp. 054-063
rather than from operating, investing and financing activities.
Changing the accounting principles
In exceptional cases can be made depar-tures from accounting principles generally covered in this section. Any such devia-tions must be presented in the explanatory notes and the reasons that determined them.
Changing comparative data and the opening equity for the precedent year
Correction of determined errors
Changing comparative data. Changing comparative data or insert the effect on the outcome of the current year with comparative data pro forma in notes.
Changing the accounting assessments
Accounting in the result of the financial year.
Accounting in the result of current year.
Source: The data presented in the table are taken from the structure of financial statements according to IAS / IFRS, US-GAAP and national accounting standards.
To summarise, financial statements are a complex of specific accounting cases related, comparative
calculations, each with explicit management, discussed and approved under signature by authorized bodies to be audited and made public. These “formalisations” are designed to enhance cognitive value of the accounting information along with its application in decision making and management.
Conclusion
Financial statements are a complex of specific accounting cases related, comparative calculations, each with explicit management, discussed and approved under signature by authorized bodies to be audited and made public. These “formalizations” are designed to enhance cognitive value of the accounting in-formation along with its application in decision making and management.
In the context of globalization and internationalization, the financial statements can be made based on the internal rules (legislation), or the international standards (IFRS). In terms of content of financial statements, both include five components. As for the form, both use the vertical form. Regarding the structure of financial statements we have shown that between the two variants there are also differences (order of presentation of balance sheet items, etc.), but also similarities.
Given that the Romanian legislation provides for annual financial statements to be audited and ac-companied by a written statement of the legal person representing the management’s accountability for their preparation in accordance with accounting regulations under the Fourth Directive of the European Economic Community, we conclude that information required to be included in both annual financial statements are relevant, complete and reliable in all material respects, accurately presenting the results and financial position of the entity.
However, even if the content of financial statements in Romania has improved, meaning that they include a statement of cash flows and a statement of changes in equity, yet we cannot say that the har-monization process was completed because the usefulness of the information contained in financial statements depends, above all, quality, and not just their quantity. SM
References
Bogdan, V. (2004). Armonizarea contabilă internaţională. Bucharest: Economica Publishing. Bostan, I., & Grosu, V. (2009). Limits on legislative harmonization financial accounting. The 33rd ARA Congress Modernism and Progres in Arts and Sciences. Montreal: Polytechnic International Press. Bostan, I., Pereş, I., & Domil, A. (2009). Audit Conformable to the Annual Financial Statements of the European Community. Retrieved November 12, 2011 from Social Science Research Network: http://papers.ssrn.com/sol3/papers.cfm?abstract_id=1325389 Ghidul practic de aplicare a reglementărilor contabile conforme cu directivele europene aprobate prin OMFP nr. 3055/2009. (2010). Bucureşti: Editura CECCAR. Grosu, V. (2010). Perspective şi limite în procesul armonizare economico-financiara. Iasi: Tipo Moldova Publishing. Grosu, V., & Boston, I. (2009). Analysis of Accounting Convergence Between EU and USA (IAS/ IFRS vs. USGAAP). The 33rd ARA Congress Modernism and Progres in Arts and Sciences. Montreal: Polytechnic International Press.

Marian Socoliuc et al. Compatibility of the Romanian Accounting System with the Standard IAS/IFRS System 63
STRATEGIC MANAGEMENT, Vol. 17 (2012), No. 3, pp. 054-063
Hlaciuc, E., & Petriş, R. (2008). Normalizarea informaţiei contabile în România. Chi�inău: Publishing Cartier Educational. Istrate, C. (1999). Fiscalitate si contabilitate în cadrul firmei. Iasi: Editura Polirom. Mironiuc, M. (2006, October 28). Informational Valences of the Cash Flow Statement - Methodological and Interpretative Approaches. Retrieved November 12, 2011 from Social Science Research Network: http://papers.ssrn.com/sol3/papers.cfm?abstract_id=980736 Pereş, I., Pereş, C., & Domil, A. (2008). Consideration Regarding the EU Contribution to Small and Medium Sized Enterprises Development. Retrieved November 15, 2011 from Facultatea de Ştiinţe Economice: http://www.fse.tibiscus.ro/anale/Lucrari2008/Peres,%20Domil.pdf The Ministry of Finance of Romania. (2009). The Order of the Minister of Public Finance no. 3055/2009 for approval of accounting regulations in accordance with European directives. Bucharest: The Ministry of Finance of Romania. Correspondence
Marian Socoliuc
Stefan cel Mare University of Suceava Str. Universităţii, nr. 13, 720 229, Suceava, Romania
E-mail: [email protected]

64 Marian Socoliuc et al. Compatibility of the Romanian Accounting System with the Standard IAS/IFRS System
STRATEGIC MANAGEMENT, Vol. 17 (2012), No. 3, pp. 054-063
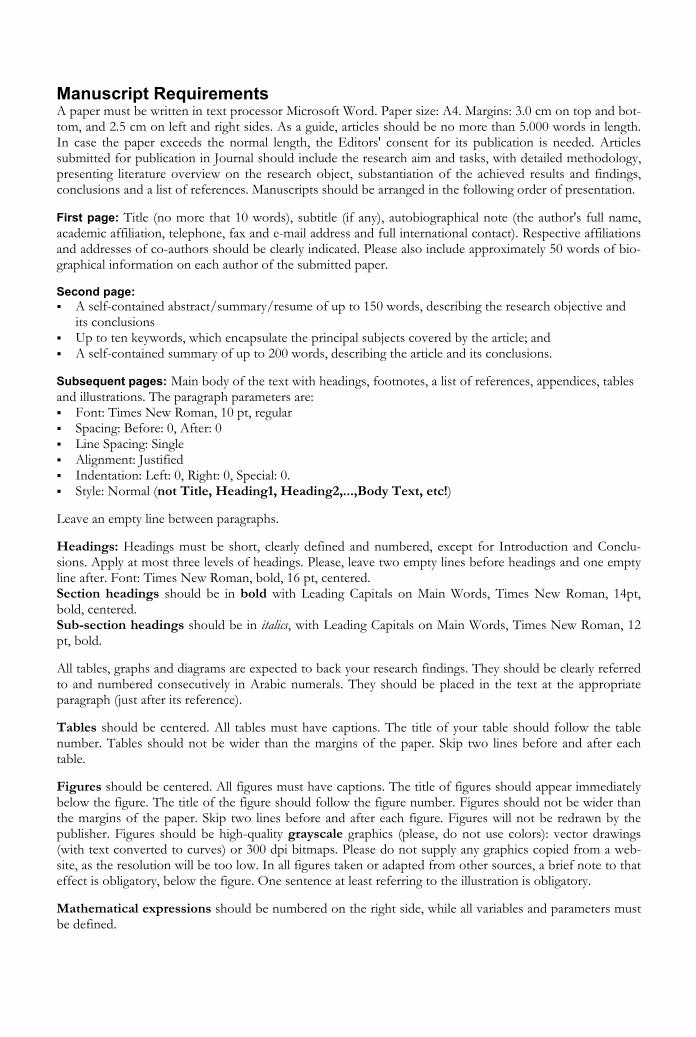
Manuscript Requirements A paper must be written in text processor Microsoft Word. Paper size: A4. Margins: 3.0 cm on top and bot-tom, and 2.5 cm on left and right sides. As a guide, articles should be no more than 5.000 words in length. In case the paper exceeds the normal length, the Editors' consent for its publication is needed. Articles submitted for publication in Journal should include the research aim and tasks, with detailed methodology, presenting literature overview on the research object, substantiation of the achieved results and findings, conclusions and a list of references. Manuscripts should be arranged in the following order of presentation. First page: Title (no more that 10 words), subtitle (if any), autobiographical note (the author's full name, academic affiliation, telephone, fax and e-mail address and full international contact). Respective affiliations and addresses of co-authors should be clearly indicated. Please also include approximately 50 words of bio-graphical information on each author of the submitted paper. Second page: A self-contained abstract/summary/resume of up to 150 words, describing the research objective and
its conclusions
Up to ten keywords, which encapsulate the principal subjects covered by the article; and
A self-contained summary of up to 200 words, describing the article and its conclusions.
Subsequent pages: Main body of the text with headings, footnotes, a list of references, appendices, tables and illustrations. The paragraph parameters are: Font: Times New Roman, 10 pt, regular
Spacing: Before: 0, After: 0
Line Spacing: Single
Alignment: Justified
Indentation: Left: 0, Right: 0, Special: 0. Style: Normal (not Title, Heading1, Heading2,...,Body Text, etc!) Leave an empty line between paragraphs.
Headings: Headings must be short, clearly defined and numbered, except for Introduction and Conclu-sions. Apply at most three levels of headings. Please, leave two empty lines before headings and one empty line after. Font: Times New Roman, bold, 16 pt, centered. Section headings should be in bold with Leading Capitals on Main Words, Times New Roman, 14pt, bold, centered. Sub-section headings should be in italics, with Leading Capitals on Main Words, Times New Roman, 12 pt, bold.
All tables, graphs and diagrams are expected to back your research findings. They should be clearly referred to and numbered consecutively in Arabic numerals. They should be placed in the text at the appropriate paragraph (just after its reference). Tables should be centered. All tables must have captions. The title of your table should follow the table number. Tables should not be wider than the margins of the paper. Skip two lines before and after each table. Figures should be centered. All figures must have captions. The title of figures should appear immediately below the figure. The title of the figure should follow the figure number. Figures should not be wider than the margins of the paper. Skip two lines before and after each figure. Figures will not be redrawn by the publisher. Figures should be high-quality grayscale graphics (please, do not use colors): vector drawings (with text converted to curves) or 300 dpi bitmaps. Please do not supply any graphics copied from a web-site, as the resolution will be too low. In all figures taken or adapted from other sources, a brief note to that effect is obligatory, below the figure. One sentence at least referring to the illustration is obligatory. Mathematical expressions should be numbered on the right side, while all variables and parameters must be defined.
Copyright Articles submitted to the Journal should be authentic and original contributions and should have never been published before in full text, nor be under consideration for any other publication at the same time. Authors submitting articles for publication warrant that the work is not an infringement of any existing copyright and will indemnify the publisher against any breach of such warranty. For use of dissemination and to en-sure proper policing of use, papers and contributions become the legal copyright of the publisher unless otherwise agreed.
Proof Authors are responsible for ensuring that all manuscripts (whether original or revised) are accurately typed before final submission. One set of proof will be sent to authors, if requested, before the final publication, which must be returned promptly.
Referencing Guide The references should specify the source (such as book, journal article or a web page) in sufficient de-tail to enable the readers to identify and consult it. The references are placed at the end of the work, with sources listed alphabetically (a) by authors’ surnames or (b) by the titles of the sources (if the au-thor is unknown). Multiple entries by the same author(s) must be sequenced chronologically, starting from the earliest, e.g.:
Ljubojević, T.K. (1998). Ljubojević, T.K. (2000a). Ljubojević, T.K. (2000b). Ljubojević, T.K., & Dimitrijević, N.N. (1994).
Here is a list of the most common reference types: A. PERIODICALS Authors must be listed by their last names, followed by initials. Publication year must be written in pa-rentheses, followed by a full stop. Title of the article must be in sentences case: only the first word and proper nouns in the title are capitalized. The periodical title must be in title case, followed by the vo-lume number, which is also italicized:
Author, A. A., Author, B. B., & Author, C. C. (Year). Title of article. Title of Periodical, volume number(issue number), pages.
Journal article, one author, paginated by issue Journals paginated by issue begin with page 1 in every issue, so that the issue number is indicated in parentheses after the volume. The parentheses and issue numbers are not italicized, e.g.
Tanasijević, V. (2007). A PHP project test-driven end to end. Management Information Systems, 5 (1), 26-35.
Journal article, one author, paginated by volume Journals paginated by volume begin with page 1 in issue 1, and continue page numbering in issue 2 where issue 1 ended, e.g.
Perić, O. (2006). Bridging the gap: Complex adaptive knowledge management. Strategic Management, 14, 654-668.
Journal article, two authors, paginated by issue
Strakić, F., & Mirković, D. (2006). The role of the user in the software development life cycle. Management Information Systems, 4 (2), 60-72.
Journal article, two authors, paginated by volume
Ljubojević, K., & Dimitrijević, M. (2007). Choosing your CRM strategy. Strategic Management, 15, 333-349.
Journal article, three to six authors, paginated by issue
Jovanov, N., Boškov, T., & Strakić, F. (2007). Data warehouse architecture. Management Information Systems, 5 (2), 41-49.
Journal article, three to six authors, paginated by volume
Boškov, T., Ljubojević, K., & Tanasijević, V. (2005). A new approach to CRM. Strategic Management, 13, 300-310.
Journal article, more than six authors, paginated by issue
Ljubojević, K., Dimitrijević, M., Mirković, D., Tanasijević, V., Perić, O., Jovanov, N., et al. (2005). Putting the user at the center of software testing activity. Management Information Systems, 3 (1), 99-106.
Journal article, more than six authors, paginated by volume
Strakić, F., Mirković, D., Boškov, T., Ljubojević, K., Tanasijević, V., Dimitrijević, M., et al. (2003). Metadata in data warehouse. Strategic Management, 11, 122-132.
Magazine article
Strakić, F. (2005, October 15). Remembering users with cookies. IT Review, 130, 20-21. Newsletter article with author
Dimitrijević, M. (2009, September). MySql server, writing library files. Computing News, 57, 10-12. Newsletter article without author
VBScript with active server pages. (2009, September). Computing News,57, 21-22. B. BOOKS, BROCHURES, BOOK CHAPTERS, ENCYCLOPEDIA ENTRIES, AND BOOK REVIEWS Basic format for books
Author, A. A. (Year of publication). Title of work: Capital letter also for subtitle. Location: Publisher. Note: “Location" always refers to the town/city, but you should also include the state/country if the town/city could be mistaken for one in another country. Book, one author
Ljubojević, K. (2005). Prototyping the interface design. Subotica: Faculty of Economics.
Book, one author, new edition
Dimitrijević, M. (2007). Customer relationship management (6th ed.). Subotica: Faculty of Economics. Book, two authors
Ljubojević, K., Dimitrijević, M. (2007). The enterprise knowledge portal and its architecture. Subotica: Faculty of Economics.
Book, three to six authors
Ljubojević, K., Dimitrijević, M., Mirković, D., Tanasijević, V., & Perić, O. (2006). Importance of software testing. Subotica: Faculty of Economics.
Book, more than six authors
Mirković, D., Tanasijević, V., Perić, O., Jovanov, N., Boškov, T., Strakić, F., et al. (2007). Supply chain management. Subotica: Faculty of Economics.
Book, no author or editor
Web user interface (10th ed.). (2003). Subotica: Faculty of Economics. Group, corporate, or government author
Statistical office of the Republic of Serbia. (1978). Statistical abstract of the Republic of Serbia. Bel-grade: Ministry of community and social services.
Edited book
Dimitrijević, M., & Tanasijević, V. (Eds.). (2004). Data warehouse architecture. Subotica: Faculty of Economics.
Chapter in an edited book
Boškov, T., & Strakić. F. (2008). Bridging the gap: Complex adaptive knowledge management. In T. Boškov & V. Tanasijević (Eds.), The enterprise knowledge portal and its architecture (pp. 55-89). Subotica: Faculty of Economics.
Encyclopedia entry
Mirković, D. (2006). History and the world of mathematicians. In The new mathematics encyclopedia (Vol. 56, pp. 23-45). Subotica: Faculty of Economics.
C. UNPUBLISHED WORKS Paper presented at a meeting or a conference
Ljubojević, K., Tanasijević, V., Dimitrijević, M. (2003). Designing a web form without tables. Paper presented at the annual meeting of the Serbian computer alliance, Beograd.
Paper or manuscript
Boškov, T., Strakić, F., Ljubojević, K., Dimitrijević, M., & Perić, O. (2007. May). First steps in vis-ual basic for applications. Unpublished paper, Faculty of Economics Subotica, Subotica.
Doctoral dissertation
Strakić, F. (2000). Managing network services: Managing DNS servers. Unpublished doctoral disserta-tion, Faculty of Economics Subotica, Subotica.
Master’s thesis
Dimitrijević, M. (2003). Structural modeling: Class and object diagrams. Unpublished master’s thesis, Faculty of Economics Subotica, Subotica.
D. ELECTRONIC MEDIA The same guidelines apply for online articles as for printed articles. All the information that the online host makes available must be listed, including an issue number in parentheses:
Author, A. A., & Author, B. B. (Publication date). Title of article. Title of Online Periodical, volume number(issue number if available). Retrieved from http://www.anyaddress.com/full/url/
Article in an internet-only journal
Tanasijević, V. (2003, March). Putting the user at the center of software testing activity. Strategic Management, 8 (4). Retrieved October 7, 2004, from www.ef.uns.ac.rs/sm2003
Document from an organization
Faculty of Economics. (2008, March 5). A new approach to CRM. Retrieved July 25, 2008, from http://www.ef.uns.ac.rs/papers/acrm.html
Article from an online periodical with DOI assigned
Jovanov, N., & Boškov, T. A PHP project test-driven end to end. Management Information Systems, 2 (2), 45-54. doi: 10.1108/06070565717821898.
Article from an online periodical without DOI assigned
Online journal articles without a DOI require a URL.
Author, A. A., & Author, B. B. (Publication date). Title of article. Title of Journal, volume number. Retrieved from http://www.anyaddress.com/full/url/
Jovanov, N., & Boškov, T. A PHP project test-driven end to end. Management Information Systems,
2 (2), 45-54. Retrieved from http://www.ef.uns.ac.rs/mis/TestDriven.html. REFERENCE QUOTATIONS IN THE TEXT Quotations If a work is directly quoted from, then the author, year of publication and the page reference (preceded by “p.”) must be included. The quotation is introduced with an introductory phrase including the au-thor’s last name followed by publication date in parentheses.
According to Mirković (2001), “The use of data warehouses may be limited, especially if they contain confidential data” (p. 201).
Mirković (2001), found that “the use of data warehouses may be limited” (p. 201). What unex-pected impact does this have on the range of availability?
If the author is not named in the introductory phrase, the author's last name, publication year, and the page number in parentheses must be placed at the end of the quotation, e.g.
He stated, “The use of data warehouses may be limited,” but he did not fully explain the possi-ble impact (Mirković, 2001, p. 201).
Summary or paraphrase
According to Mirković (1991), limitations on the use of databases can be external and software-based, or temporary and even discretion-based. (p.201)
Limitations on the use of databases can be external and software-based, or temporary and even discretion-based (Mirković, 1991, p. 201).
One author
Boškov (2005) compared the access range…
In an early study of access range (Boškov, 2005), it was found... When there are two authors, both names are always cited:
Another study (Mirković & Boškov, 2006) concluded that… If there are three to five authors, all authors must be cited the first time. For subsequent refer-ences, the first author’s name will cited, followed by “et al.”.
(Jovanov, Boškov, Perić, Boškov, & Strakić, 2004).
In subsequent citations, only the first author’s name is used, followed by “et al.” in the introductory phrase or in parentheses:
According to Jovanov et al. (2004), further occurences of the phenomenon tend to receive a much wider media coverage.
Further occurences of the phenomenon tend to receive a much wider media coverage (Jovanov et al., 2004).
In “et al.", “et” is not followed by a full stop. Six or more authors
The first author’s last name followed by "et al." is used in the introductory phrase or in parentheses:
Yossarian et al. (2004) argued that…
… not relevant (Yossarian et al., 2001).
Unknown author
If the work does not have an author, the source is cited by its title in the introductory phrase, or the first 1-2 words are placed in the parentheses. Book and report titles must be italicized or underlined, while titles of articles and chapters are placed in quotation marks:
A similar survey was conducted on a number of organizations employing database managers ("Limiting database access", 2005).
If work (such as a newspaper editorial) has no author, the first few words of the title are cited, fol-lowed by the year:
(“The Objectives of Access Delegation,” 2007)
Note: In the rare cases when the word "Anonymous" is used for the author, it is treated as the au-thor's name (Anonymous, 2008). The name Anonymous must then be used as the author in the refer-ence list.
Organization as an Author
If the author is an organization or a government agency, the organization must be mentioned in the introductory phrase or in the parenthetical citation the first time the source is cited:
According to the Statistical Office of the Republic of Serbia (1978), …
Also, the full name of corporate authors must be listed in the first reference, with an abbreviation in brackets. The abbreviated name will then be used for subsequent references:
The overview is limited to towns with 10,000 inhabitants and up (Statistical Office of the Re-public of Serbia [SORS], 1978). The list does not include schools that were listed as closed down in the previous statistical over-view (SORS, 1978).
When citing more than one reference from the same author:
(Bezjak, 1999, 2002) When several used works by the same author were published in the same year, they must be cited adding a, b, c, and so on, to the publication date:
(Griffith, 2002a, 2002b, 2004) Two or more works in the same parentheses
When two or more works are cited parenthetically, they must be cited in the same order as they appear in the reference list, separated by a semicolon.
(Bezjak, 1999; Griffith, 2004) Two or more works by the same author in the same year
If two or more sources used in the submission were published by the same author in the same year, the entries in the reference list must be ordered using lower-case letters (a, b, c…) with the year. Lower-case letters will also be used with the year in the in-text citation as well:
Survey results published in Theissen (2004a) show that…
To credit an author for discovering a work, when you have not read the original:
Bergson’s research (as cited in Mirković & Boškov, 2006)… Here, Mirković & Boškov (2006) will appear in the reference list, while Bergson will not. When citing more than one author, the authors must be listed alphabetically:
(Britten, 2001; Sturlasson, 2002; Wasserwandt, 1997) When there is no publication date:
(Hessenberg, n.d.) Page numbers must always be given for quotations:
(Mirković & Boškov, 2006, p.12)
Mirković & Boškov (2006, p. 12) propose the approach by which “the initial viewpoint…
Referring to a specific part of a work: (Theissen, 2004a, chap. 3)
(Keaton, 1997, pp. 85-94)
Personal communications, including interviews, letters, memos, e-mails, and telephone conversations, are cited as below. (These are not included in the reference list.)
(K. Ljubojević, personal communication, May 5, 2008).
FOOTNOTES AND ENDNOTES
A few footnotes may be necessary when elaborating on an issue raised in the text, adding something that is in indirect connection, or providing supplementary technical information. Footnotes and end-notes are numbered with superscript Arabic numerals at the end of the sentence, like this.1 Endnotes begin on a separate page, after the end of the text. However, Strategic Management journal does not recommend the use of footnotes or endnotes.

CIP - Каталогизација у публикацији Библиотека Матице српске, Нови Сад 005.21 STRATEGIC managament : international journal of strategic managament and decision support systems in strategic managament / editor-in-chief Jelica Trninić. - Vol. 14, no. 1 (2009) - . - Subotica: University of Novi Sad, Faculty of Economics, 2009-. - 30 cm Tromesečno. - Nastavak publikacije: Strategijski menadžment = ISSN 0354-8414 ISSN 1821-3448 COBISS.SR-ID 244849927 Rešenjem Ministarstva za informisanje Republike Srbije, časopis "Strategijski menadžment" upisan je u regis-tar javnog informisanja pod brojem 2213, od 7. avgusta 1996. Rešenjem Ministarstva za nauku i tehnologiju Republike Srbije br. 413-00-435/1/96-01 časopis je oslobođen opšteg poreza na promet proizvoda kao publi-kacija od posebnog interesa za nauku.

I SS'J 1821 - 3448
771821344000