Embed Size (px)
Citation preview

We Are...
Myers Industries, Inc. 2002 Annual Report

COMPANY PROFILE
Myers Industries, Inc. is an international manufacturer of polymer products for industrial,
agricultural, automotive, commercial, and consumer markets. We are an international leader in
reusable plastic containers and North America’s leading manufacturer of plastic flower planters.
Other principal product lines include plastic storage and organization containers, plastic storage
tanks, molded rubber OEM parts, rubber tire repair products, and custom rubber products.
The Company is also the largest wholesale distributor of tools, equipment, and supplies for the
tire, wheel, and undervehicle service industry in the United States. Our distribution products range
from tire balancers and alignment systems to valve caps and other consumable service supplies.
Headquartered in Akron, Ohio, Myers encompasses: 25 manufacturing facilities in North
America and Europe, 43 domestic and five international distribution branches, more than 20,000
products, and more than 4,300 employees. Myers Industries’ stock is traded on the New York
Stock Exchange under the symbol MYE.
Protecting appliance components during assembly. Controlling water flow through miles of underground pipe.
Repairing tire punctures more efficiently on passenger cars. With a broad spectrum of products, services, and
capabilities, Myers brands enjoy strong positions in many niche markets. Our people are committed to serving
customers with value that helps them reduce the costs of doing business and satisfy their customers more
effectively than ever before.
...Contributing Value in Niche Markets.
Contents
Inside Front Cover Company Profile
1 2002 Financial Highlights
2 Myers Industries Overview
4 Letter to Shareholders
6 Manufacturing Segment Highlights
14 Distribution Segment Highlights
17 Financial Statements
34 Report of Independent Auditors
35 Corporate Officers and Board of Directors
35 Forward-Looking Statements Disclosure
36 Investor Relations Information
Inside Back Cover Business Fundamentals

1
2002 FINANCIAL HIGHLIGHTS
020100
NET SALES$ Millions
608.0652.7
608.0
020100
24.0
15.2
24.0
NET INCOME$ Millions
020100
.80
.51
.80
NET INCOMEPER SHARE$ Dollars
2002 NET SALESBy Business Segment
2001
$607,950
27,240
15,191
.51
$91,719
217,526
7.30
.18
29,752,373
% Change
0.0
48.2
57.7
56.9
(8.7)
17.5
16.4
11.1
0.7
Operations for the Year
Net Sales
Income Before Taxes
Net Income
Net Income Per Common Share
Financial Position At Year-End
Working Capital
Shareholders’ Equity
Book Value Per Common Share
Other Data
Dividends Paid Per Common Share
Average Common Shares Outstanding
Dollars In Thousands (Except Per Share Data)
DISTRIBUTION
25 %
MANUFACTURING
75 %
2002
$607,991
40,361
23,960
.80
$83,771
255,690
8.50
.20
29,971,843
2
N O R T H
A M E R I C A
E U R O P E
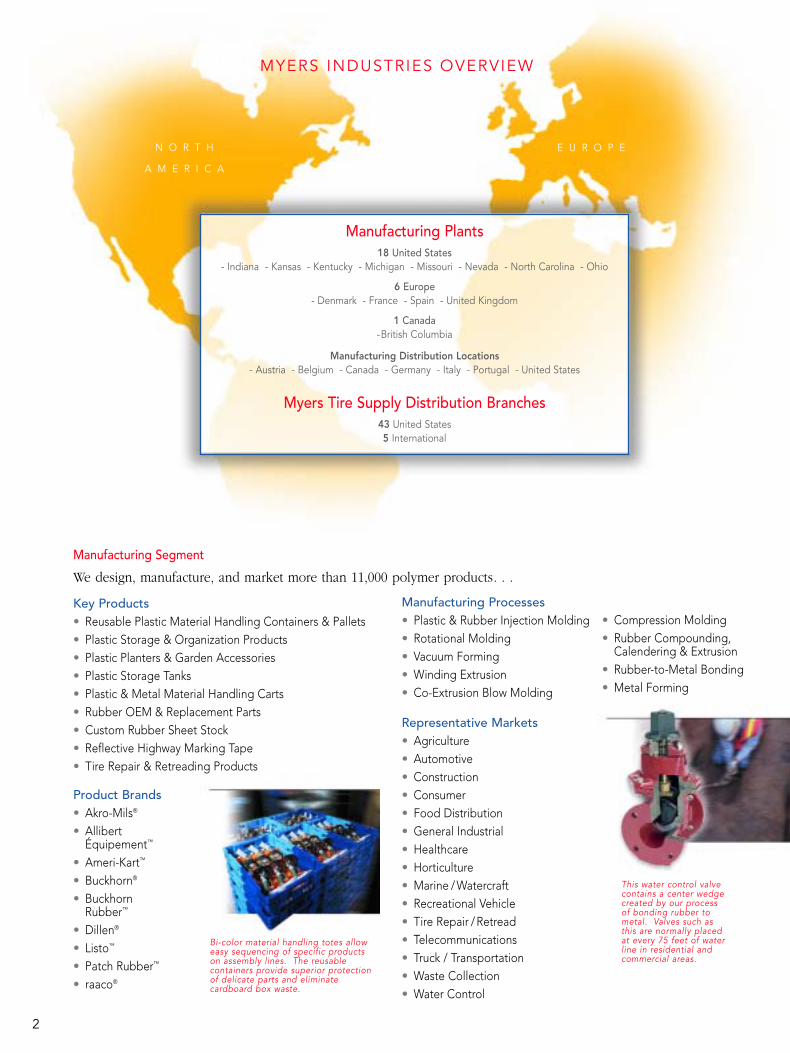
Key Products• Reusable Plastic Material Handling Containers & Pallets • Plastic Storage & Organization Products • Plastic Planters & Garden Accessories• Plastic Storage Tanks • Plastic & Metal Material Handling Carts • Rubber OEM & Replacement Parts • Custom Rubber Sheet Stock• Reflective Highway Marking Tape• Tire Repair & Retreading Products
Manufacturing Segment
We design, manufacture, and market more than 11,000 polymer products. . .
• Compression Molding• Rubber Compounding,
Calendering & Extrusion • Rubber-to-Metal Bonding • Metal Forming
Representative Markets• Agriculture• Automotive • Construction• Consumer• Food Distribution • General Industrial • Healthcare• Horticulture• Marine /Watercraft • Recreational Vehicle • Tire Repair /Retread• Telecommunications• Truck / Transportation • Waste Collection • Water Control
Manufacturing Processes• Plastic & Rubber Injection Molding• Rotational Molding • Vacuum Forming• Winding Extrusion• Co-Extrusion Blow Molding
Product Brands• Akro-Mils®
• AllibertÉquipement™
• Ameri-Kart™
• Buckhorn®
• Buckhorn Rubber™
• Dillen®
• Listo™
• Patch Rubber™
• raaco®
Bi-color material handling totes alloweasy sequencing of specific productson assembly lines. The reusablecontainers provide superior protectionof delicate parts and eliminatecardboard box waste.
Manufacturing Plants18 United States
- Indiana - Kansas - Kentucky - Michigan - Missouri - Nevada - North Carolina - Ohio
6 Europe- Denmark - France - Spain - United Kingdom
1 Canada-British Columbia
Manufacturing Distribution Locations- Austria - Belgium - Canada - Germany - Italy - Portugal - United States
Myers Tire Supply Distribution Branches43 United States5 International
MYERS INDUSTRIES OVERVIEW
This water control valvecontains a center wedgecreated by our processof bonding rubber tometal. Valves such asthis are normally placedat every 75 feet of waterline in residential andcommercial areas.

Computerized wheel alignment equipment soldby Myers prompts the operator through each stepwith continuous readings from eight sensors —creating the perfect alignment and reducingservice time.
MYERS INDUSTRIES OVERVIEW
3
Distribution Segment
We buy and sell nearly 10,000 tire, wheel, and undervehicle service items. . .
Organizing & Transporting
Organizing Industrial Workstations Simplifying CleaningOperations
Efficiency — of time, money,
and effort — is the benefit users gain with our Akro-Mils® plastic and metal products. We are a leader
in storage bins and systems sold by distributors nationwide to simplify tasks such as sorting industrial parts
and organizing retail displays. Our Akro-Mils/RB-Dura™ carts transport products in industrial and commercial
settings, while our new AkroClean™ carts improve productivity in janitorial operations. Akro-Mils consumer
products, sold by leading retailers, organize home and work with items including storage
boxes for holiday decorations and desktop organizers for office supplies.
Key Products• Tire Valves & Accessories • Tire Changing &
Balancing Equipment• Lifts & Alignment Equipment • Service Equipment & Tools • Tire Repair/Retread Equipment
& Supplies
Representative Markets• Retail Tire Dealers • Truck Tire Dealers • Auto Dealers • Commercial Auto & Truck Fleets • Tire Retreaders • General Repair Facilities• Government Agencies
Distribution Capabilities• Broad Sales Coverage• International Distribution • Personalized Service • Customer Product Training• 69 Years of Expertise in Tire
Repair & Retreading
Product Brand• Myers Tire Supply®
• National Accounts• New Products
Speed-to-Market
Storing Seasonal Items

4
The results from our activities in 2002 were stable, if
unexceptional, in synch with the general economies in
North America and Europe. We were able to maintain
productivity and margins on a global basis and to realize
modest improvements in working capital, which helped
us to reduce debt by 12 percent by year’s end.
At $608.0 million, net sales for the year ended
December 31, 2002 were flat compared to the prior year.
Net income was $24.0 million, an increase of 58 percent
from $15.2 million in 2001. Net income per share was $.80,
a 57 percent increase from the $.51 reported in 2001.
Net sales for the fourth quarter ended December 31,
2002, were $159.3 million, an increase of 7 percent from
the $148.5 million reported in 2001. Net income was $4.0
million, an increase of 73 percent compared to $2.3
million in the prior year's fourth quarter. Net income per
share was $.13, an increase of 63 percent compared with
$.08 in the fourth quarter of 2001.
Our adoption of Statement of Financial Accounting
Standards No. 142, which discontinued the amortization
of goodwill, affected results positively in both the fourth
quarter and for the full year. Goodwill amortization in the
comparable quarter and year ended December 31, 2001,
reduced income before taxes by $2.3 million and $9.2
million respectively, and earnings per share by $.06 and $.24.
Favorable foreign currency translation, mainly in the
strength of the euro, increased reported sales by $3.6
million in the fourth quarter and by $6.1 million for the
year. The effect of foreign currency translation had no
material effect on income for either period.
Business Segments Overview
Although sales in our manufacturing segment increased
8 percent compared to the fourth quarter of 2001, they
decreased slightly year-over-year. Industrial markets, into
which we sell material handling products and other items,
remained anemic through most of the year in both North
America and Europe. During the fourth quarter, however,
demand in our niches of automotive markets and some
areas of heavy-duty manufacturing began to show
slight improvements.
The volatility of the price of plastic resin, as businesses
struggle to improve profits in an environment of intense
competition and great uncertainty, was a factor affecting
our performance in the manufacturing segment. Resin
prices were favorable in a year-over-year comparison
through the second quarter, began to increase in the
third quarter, and rose further in the fourth quarter.
At this writing, the upward movement in resin prices
continues with indications of some scarcity of certain
resins in 2003. We are examining several options to
help mitigate the effects of these price swings on
our business.
In our distribution segment, sales increased 5
percent in the fourth quarter and 2 percent for the year,
in comparison to 2001. Demand for consumable supplies
was steady throughout the year. Customers’ requirements
for capital equipment revived towards the end of the year.
According to industry statistics, independent tire
dealers sold approximately two-thirds of the estimated
205 million replacement tires bought by car owners in
2002. The remainder of tire sales occur through tire
manufacturers' retail stores, mass merchandisers,
wholesale clubs, service centers, and car dealers. We
service all of those niches, but independents of all sizes
form our largest customer base. While consolidation of
independent tire dealers into larger entities is creating
fewer customers, Myers is uniquely positioned to service
the emerging national accounts programs. We believe
that Myers Tire Supply's status as the leading supplier for
tire, wheel, and undervehicle service professionals
remains a solid basis for growth.
LETTER TO SHAREHOLDERS
Dear Fellow Shareholders,

LETTER TO SHAREHOLDERS
5
Stephen E. MyersPresident and
Chief Executive Officer
March 7, 2003
Respectfully submitted,
Cash Flow, Debt Reduction & Return to Shareholders
Cash flow from operations, totaling $65.5 million at the
end of the year, allowed us to reduce total debt by $32.0
million for 2002. We finished the year with total debt of
$232.9 million, a decrease of 12 percent from $264.9
million at the start of the year. Debt-to-total capitalization
was 48 percent at the end of 2002 versus 55 percent at
the end of 2001.
In August, the Board of Directors declared a five-for-
four stock split and a $.05 cash dividend on the split
shares, making 2002 the 27th consecutive year in which
we have increased the cash payment to shareholders.
Shareholders’ equity increased 18 percent to $255.7
million from $217.5 million in 2001, and book value per
share was $8.50 at the end of 2002, an increase of 16
percent from $7.30 at the end of 2001.
New Chief Operating Officer
On February 14, 2003, the Board of Directors approved
the promotion of John C. Orr to the newly created
position of chief operating officer. John joined Myers
Industries in 2000 as general manager of our Buckhorn
subsidiary, following distinguished service at The
Goodyear Tire and Rubber Company where he was
formerly vice president of manufacturing for the North
American Tire Division. We expect that his operational
and leadership excellence will contribute positively to the
Company's worldwide operations.
Summary
The uncertainty, both economic and political, before us
indicates that continued focus on debt reduction seems
prudent. Although we are not completely sanguine
about immediate prospects for material improvement
of business conditions, we know that our business
fundamentals are solid.
We fully expect that the talented employees of the
Company will continue to create new products and
services to strengthen relationships with our valued
customers. They will contribute to improving our
performance by focusing on latent synergies across
operational, sales, and marketing platforms within
our organization.
We thank you, our shareholders, for your continuing
confidence in Myers Industries.
6
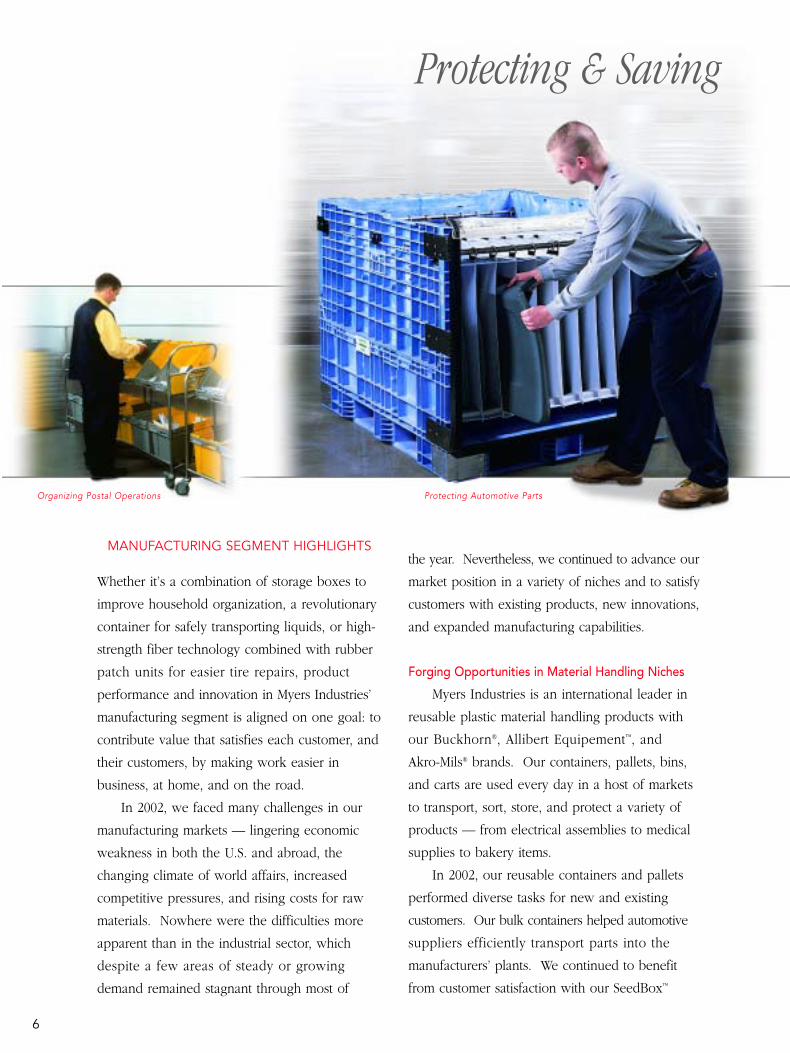
Whether it’s a combination of storage boxes to
improve household organization, a revolutionary
container for safely transporting liquids, or high-
strength fiber technology combined with rubber
patch units for easier tire repairs, product
performance and innovation in Myers Industries’
manufacturing segment is aligned on one goal: to
contribute value that satisfies each customer, and
their customers, by making work easier in
business, at home, and on the road.
In 2002, we faced many challenges in our
manufacturing markets — lingering economic
weakness in both the U.S. and abroad, the
changing climate of world affairs, increased
competitive pressures, and rising costs for raw
materials. Nowhere were the difficulties more
apparent than in the industrial sector, which
despite a few areas of steady or growing
demand remained stagnant through most of
MANUFACTURING SEGMENT HIGHLIGHTSthe year. Nevertheless, we continued to advance our
market position in a variety of niches and to satisfy
customers with existing products, new innovations,
and expanded manufacturing capabilities.
Forging Opportunities in Material Handling Niches
Myers Industries is an international leader in
reusable plastic material handling products with
our Buckhorn®, Allibert Equipement™, and
Akro-Mils® brands. Our containers, pallets, bins,
and carts are used every day in a host of markets
to transport, sort, store, and protect a variety of
products — from electrical assemblies to medical
supplies to bakery items.
In 2002, our reusable containers and pallets
performed diverse tasks for new and existing
customers. Our bulk containers helped automotive
suppliers efficiently transport parts into the
manufacturers’ plants. We continued to benefit
from customer satisfaction with our SeedBox™
Protecting & Saving
Organizing Postal Operations Protecting Automotive Parts

7
MANUFACTURING
Whether transporting construction vehicle parts to assembly lines or distributing meat to grocery stores, customers
in North America and Europe rely on our Buckhorn® and Allibert Équipement™ reusable plastic containers and
pallets to protect their valuable products and save material handling costs. With these two brands, Myers Industries
is an international leader in reusable products that replace cardboard boxes and wood pallets to eliminate waste
and improve productivity for customers in manufacturing, distribution, agriculture, and food businesses. Our
offering includes hand-held totes, pallets, and the most comprehensive range of bulk transport containers in the
industry, plus an extensive array of design and manufacturing capabilities for turnkey production of custom products.
Delivering Foodto Retailers
Distributing Hardware Products Molding CustomComponents
container, which is quickly replacing bags for
more effective shipping and dispensing of
corn and soybean seed. Retail and wholesale
distributors relied on our wide selection of
distribution containers and pallets to supply
stores with everyday products such as shampoo
and pharmaceuticals.
We introduced AkroBins® small parts
containers in 1972 and set the standard for small-
item storage. Since then, our range of storage
and organization products has grown to multiple
styles and sizes and branched into related product
lines such as transport carts. Last year, customers
depended on our bins and storage systems to
organize assembly areas, display retail items, and
more. Our line of carts, expanded by the
integration of R.B. Manufacturing Company in
2000, helped to increase our success with
industrial distributors as a single source supplier
of storage, organization, and transport products.
Beyond existing products, innovation
in our material handling lines delivered
opportunities last year and generated potential
new business relationships.
When a leading distributor wanted to replace
cardboard boxes with a more secure container
to transport tobacco products, which are susceptible
to costly damage and theft, we created the
SecureTote™. The container is designed to handle
different-sized cigarette cartons, withstand the
rough handling of distribution, and can be
securely sealed to reduce pilferage — providing
customers with the potential for thousands of
dollars in savings per shipment.
In Europe, we worked with Britain’s largest
hardware retailer to develop a new container for
their national distribution center. The container
needed to perform triple duty: transport goods
inbound from suppliers, serve as a “picking”
container from which to fill store orders, and

8
With our Ameri-Kart™ brand, we are a top supplier
of high quality, custom rotationally-molded and vacuum-formed plastic parts to makers of recreational
vehicles. Products range from internal storage tanks for water and waste to dashboards and travel
storage packs. Other Ameri-Kart products include plastic waste hauling carts, which are compatible with
automated systems to allow more efficient residential and commercial waste collection. We also custom-
mold products for niches of automotive, industrial, agriculture, and other markets — including making
specialty items such as elevated toilet seats and tub rails for the healthcare market.
Storing & Collecting
Simplifying Trash Collection
Storing Fresh Water Organizing Vacation Supplies
ship completed orders to 570 stores. Combining
attributes from products in our Allibert and
Buckhorn lines, the new container solution
incorporates a lid that operates in multiple
orientations to fit the needs of each situation,
increasing productivity in the customer’s
supply chain.
During the year, we also developed a new
pallet using our Flame Edge® fire-retardant
plastic. The product will allow us to help
customers with large warehouse operations
replace wooden pallets for the long-term
durability of plastic pallets and comply with
new fire protection code requirements. At
the end of the year, we introduced the Citadel®
Bulk Fluid Transport Container. The unique,
collapsible container offers superior performance
and cost-saving potential for industries that
require storage and transport of fluid or semi-
solid products.
RV, Waste Collection Markets Steady
Demand from the recreational vehicle (RV)
market was strong last year. The integration of
the Best Plastics acquisition into our Ameri-Kart™
brand has made Myers a dominant source of
rotationally-molded and vacuum-formed plastic
parts for the major RV original equipment
manufacturers. Our capabilities provide
customers with turnkey design, production,
and assembly options for a wide range of
products: high-strength water, waste, and fuel
holding tanks; intricately shaped interior and
exterior trim pieces; roof storage packs; and
interior components such as consoles with
multiple curves and cut-outs.
Myers also roto-molds trash carts used in
residential waste collection. Responding to that
market’s need for a more durable trash cart,
we combined the design and plastics molding
expertise of Ameri-Kart and Buckhorn to create

9
Customers in diverse
markets depend on Myers’ Buckhorn Rubber™ OE and replacement parts
to move air, seal water, and dampen vibration. We are a top producer of
engineered, molded rubber products including air intake hoses, hood latches,
and boots used on semi-trucks and farm vehicles; vibration dampening pads for construction
equipment; and specialty parts for small appliances. We also bond rubber to metal to develop
products ranging from seals for water main valves to torque-absorbing bushings for truck trailer suspensions.
Moving & Sealing MANUFACTURING
Sealing Flood Control Dams Dampening Equipment Vibration Moving Air through Engines
the MegaKart™. The 96-gallon, injection-molded
cart is stronger than roto-molded carts; is
universally compatible with automated collection
systems; and is the only cart in the industry that
can be stacked and transported with the lid
installed, meaning waste management companies
save up to 50 percent of the usual cost for
on-site preparation. By the time the cart was
introduced it was shaping up to be one of the
most successful products in the history of our
Ameri-Kart brand.
Innovation Fuels Plastic Planter Markets
Over the last several years, gardening has
become the number one leisure activity by
Americans. Myers Industries plays a large part
in fulfilling the needs of this activity as North
America’s leading manufacturer of plastic planters.
We serve all segments of the horticultural market
with our Dillen®, Listo™, and Akro-Mils Lawn &
Garden™ brands: growers rely on our unparalleled
selection of trays, pots, and other items to
ensure efficient operation of their businesses,
while retailers look to our array of innovative
indoor and outdoor decorative planters to meet
their customers’ gardening needs.
In 2002, the weak U.S. economy, plus
an extended period of unfavorable weather
conditions early in the year, hurt the North
American grower market. Despite the difficulties,
Myers’ Dillen brand continued to make gains.
Our capabilities present a package to growers
that is unmatched by any other North American
manufacturer: extensive product selection,
unsurpassed market knowledge, and constant
innovation focused on increasing growers’
productivity and profitability.
As part of more than 30 new products for
growers last year, we pioneered an injection-
molded plug tray that boosts efficiency with

10
Planting & Growing Growers at greenhouses and nurseries, retail garden centers,
mass merchandisers — Myers brings value-added benefits to all of these customers from the most extensive range of
plastic planters in North America. With our Dillen®, Listo™, and Akro-Mils Lawn & Garden™ brands, the Myers offering
includes indoor and outdoor decorative planters, pots, bowls, hanging baskets, window boxes, and grower trays.
Constant product innovation fuels the advantages for our customers: new plug trays that improve productivity at
growing operations; color printing on pots to help growers brand their plant material; and intricate molding details in
metallic, stone, and textured resin planters with unique finishes that capture consumers’ attention and imagination.
Displaying Greenhouse Plants Protecting Delicate Growth BrandingGrowers’Products
automated equipment for planting seeds and
transplanting plugs. Rather than having
machines pause between trays, we designed
trays that could be loaded on conveyors and
maintain the same distance between the cavities,
creating an “endless tray” system. As a result,
growers are able to improve their output.
In the retail arena, new product and process
innovation helped us to gain more exposure at
mass merchandisers and home improvement
centers with our Listo products. Beyond adding
new styles of stone texture resin planters, we
developed a system for creating unique finishes
on planters. Our “Versailles” metallic line
features classical European detailing with a
patina finish for the look of aged bronze, and
the “Rattanya” Vintage style provides the look of
time-worn rattan palm. Retail acceptance was
immediate, fueling strength for our Listo brand
and opening new growth avenues.
Custom Molding Solutions
With some of our more traditional industrial
markets in a slowdown last year, we worked to
mitigate the effects through expansion of custom
design and molding services in several new markets.
When a leading manufacturer of outdoor
playsets could not get the quality and delivery
required for a key component, they turned
to Myers Industries and our structural foam
molding capabilities. Soon enough, thousands
of the parts were moving off the production line
and out to the customer, with our precise
molding tolerances and robotic handling systems
assuring superior quality. For Myers, the success
allows us to explore additional products with the
customer and has led to product development
ideas for other new markets.
Early in the year, the leading supplier of
commercial cooling towers in the U.S. approached
Myers seeking ideas for a new, less expensive

11
MANUFACTURING
Innovating Fresh Designs Creating IndoorGardens
line of cooling towers. After replacing costly
stainless steel parts on the towers with high-
strength, rotationally-molded parts, we set up a
secondary production line to assemble the units
and ship the finished product to the customer’s
facilities. Our design and fabrication solutions
were essential to help the customer successfully
create the new product and gain market share.
Putting More Value in Trucks, on the Road, and at Home
Orders for Class 8 heavy trucks surged in the
first half of the year as fleets tried to minimize
the impact of more costly, pollution-reducing
engines being introduced after October 2002.
As a leading supplier of rubber hoses, latches,
and other specialty products to the heavy-truck
market, Myers benefited from the spike in
truck orders. For example, our Buckhorn
Rubber™ brand provides air intake hoses in over
200 standard fittings for the majority of Class 6
and 8 trucks.
Last year, in response to customers in truck
and other heavy equipment markets, we added
co-extrusion blow molding with three-dimensional
capabilities to our operations. The process
uses rubber and plastic to create single-piece,
complex parts with both rigid and flexible
features — such as air hoses with extreme angles.
The seamless parts offer reduced potential for
connection failure and are easier to install when
compared to traditional blow-molded parts.
Myers is able to produce parts faster and at a
lower cost to the customer. As engines for trucks
and other heavy equipment are redesigned to
meet new emissions regulations, Myers is
positioned to strengthen our market presence.
Although the truck tractor market weakened
in the third and fourth quarters, progress made
in other niches helped to partially offset the

12
From tire plugs to industrial rubber, diverse markets
depend on Myers’ Patch Rubber™ brand products for superior performance. We make the most comprehensive
line of tire repair and retreading products on which service professionals rely for safe repairs to passenger, truck,
and off-road tires. Our highly reflective, rubber-based Advance Traffic Markings™ tape and symbols provide the
durability and brightness that road construction professionals demand to replace paint for marking highways and
guiding traffic through repair areas. We also work with customers to develop custom rubber, which is used by
customers to create items such as golf grips and aerospace materials.
Repairing & Guiding
Repairing Tire Punctures
Developing Custom Rubber
Marking Highway Intersections
decline. We penetrated the trailer niche of the
trucking industry, developing new customers
through design innovation in our shock-absorbing
rubber bushings for trailer suspension systems.
As a top supplier of rubber parts to the water
control industry, the robust housing market
and new municipal projects provided inroads
to customers for new products such as main
valves for fire hydrants and mechanical joint
gaskets for water supply lines. With our blow
molding capability, we emerged in niches of the
agricultural and construction equipment markets
with new products such as steering columns and
HVAC ducts.
In the tire repair and retread market, Myers
maintained a strong position by offering the
widest range of products to service passenger,
truck, and off-road tires. High-quality
manufacturing of our Patch Rubber™ products,
everything from tire plugs to retread cements,
helped us to improve business even in the soft
conditions of 2002. We also introduced several
new products, including a high-strength repair
patch reinforced with aramid fiber to simplify
repair of tires found on earthmovers, dump
trucks, and other heavy equipment. Aramid
fiber is used in materials such as bullet-resistant
body armor and other products subject to
extreme conditions. When infused with rubber
in a tire repair unit, the result is a flexible,
extremely durable patch that is easier to install.
In addition, demand continued to grow for
our custom rubber materials, which are used
as the base for products in industrial, sports,
and other markets. Our ability to custom
manufacture for a specific niche, modify the
product to meet each customer’s needs within
that niche, then expand the product’s application
into other markets offers excellent potential for
new business.
13
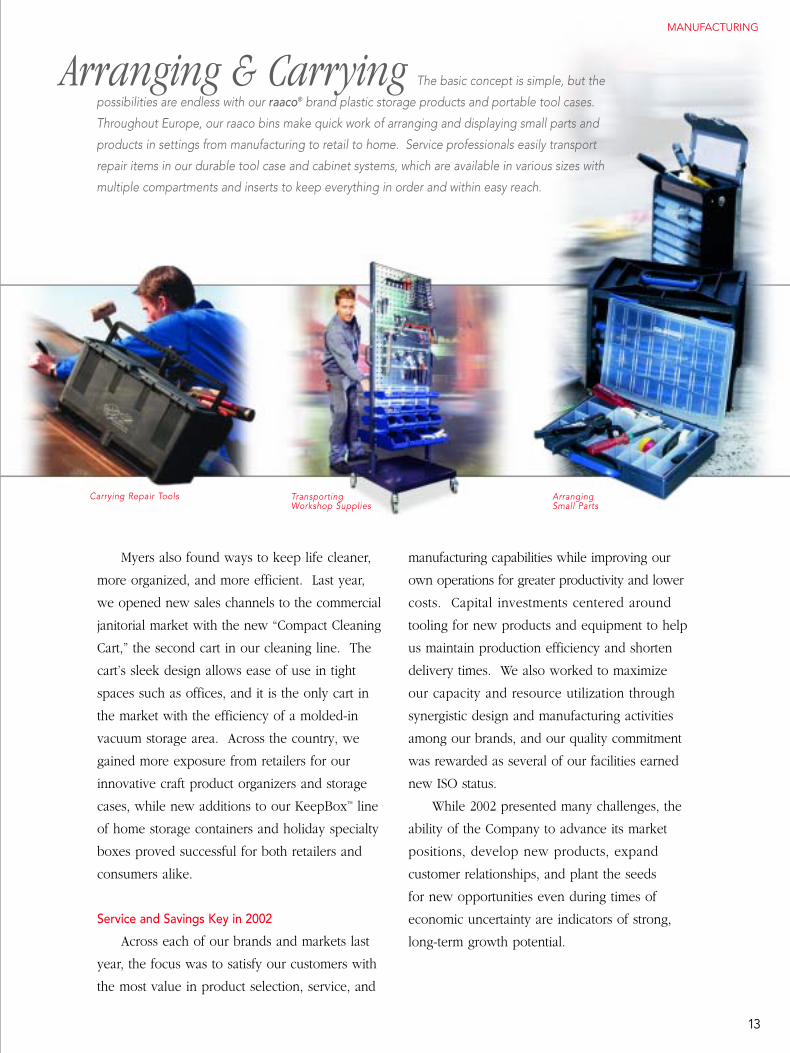
The basic concept is simple, but the
possibilities are endless with our raaco® brand plastic storage products and portable tool cases.
Throughout Europe, our raaco bins make quick work of arranging and displaying small parts and
products in settings from manufacturing to retail to home. Service professionals easily transport
repair items in our durable tool case and cabinet systems, which are available in various sizes with
multiple compartments and inserts to keep everything in order and within easy reach.
Arranging & CarryingMANUFACTURING
Carrying Repair Tools TransportingWorkshop Supplies
Arranging Small Parts
Myers also found ways to keep life cleaner,
more organized, and more efficient. Last year,
we opened new sales channels to the commercial
janitorial market with the new “Compact Cleaning
Cart,” the second cart in our cleaning line. The
cart’s sleek design allows ease of use in tight
spaces such as offices, and it is the only cart in
the market with the efficiency of a molded-in
vacuum storage area. Across the country, we
gained more exposure from retailers for our
innovative craft product organizers and storage
cases, while new additions to our KeepBox™ line
of home storage containers and holiday specialty
boxes proved successful for both retailers and
consumers alike.
Service and Savings Key in 2002
Across each of our brands and markets last
year, the focus was to satisfy our customers with
the most value in product selection, service, and
manufacturing capabilities while improving our
own operations for greater productivity and lower
costs. Capital investments centered around
tooling for new products and equipment to help
us maintain production efficiency and shorten
delivery times. We also worked to maximize
our capacity and resource utilization through
synergistic design and manufacturing activities
among our brands, and our quality commitment
was rewarded as several of our facilities earned
new ISO status.
While 2002 presented many challenges, the
ability of the Company to advance its market
positions, develop new products, expand
customer relationships, and plant the seeds
for new opportunities even during times of
economic uncertainty are indicators of strong,
long-term growth potential.

Selection. Coverage. Personal relationships.
These define Myers Industries’ essence as the
largest U.S. wholesale distributor of tools,
equipment, and supplies for tire and allied
service needs on passenger, truck, and off-road
vehicles. Independent tire dealers, mass
merchandisers, commercial auto and truck fleets,
tire retreaders, and general repair facilities rely
on Myers Tire Supply® for the value in products
and solutions they need to grow their business
and become more productive and profitable.
Value in Broad Product Selection
Our primary focus is on service and repair
products for tire repair, balancing, alignment, and
retreading — and no one supplies the markets
with more choices than Myers. We have the
products customers need, ready to be delivered
when they need them. From the latest
computerized equipment for tire changing, to
the simplest passenger tire valve, and everything
in between, our nearly 10,000 different consumable
supply and equipment items help our customers
reduce costly downtime in their business and
provide service that keeps their customers moving
down the road with confidence.
In 2002, the increased awareness of the
importance in maintaining correct air pressure in
tires, whether in automobile, light truck, or over-
the-road truck applications, heightened demand
for products to aid in the process: air gauges,
new tire valves, air delivery systems, and a wide
variety of repair supplies. Demand for capital
equipment, which had remained weak for an
extended period, improved in several product
areas — such as tire changers, balancers, wheel
alignment systems, and hydraulic lifts. We were
the first to introduce the markets to a new
fully-automatic tire changer that is specifically
14
Servicing & Training
DISTRIBUTION SEGMENT HIGHLIGHTS
Automating Tire Changing Simplifying Truck Tire Repair

DISTRIBUTION
15
Broad product selection, rapid availability, and personal service: these elements create value for customers of Myers
Tire Supply®. Myers is the one-stop-shop for tire, wheel, and undervehicle service tools, equipment, and supplies. We
buy from the leading manufacturers and sell everything that professionals need to service passenger, truck, and off-road
tires and wheels — computerized alignment equipment, tire balancers, tire repair plugs, small hand tools, air gauges,
and more. We also provide products for allied services, such as transmission, brake, and cooling system maintenance.
Distribution from 43 nationwide branches, international affiliates, and our online e-branch gives customers quick access
to products. And we deliver personal service, including on-site training to introduce new products and repair
techniques to help customers improve efficiency in their business.
Maintaining Air Pressure Servicing BrakeComponents
Balancing Passenger Tires
designed to eliminate damage to rims and tires
when working on low profile, high performance,
and run-flat type of tires, as well as standard OE
rally and steel wheels. The technician simply
enters the wheel’s information into the computer
and with just a few steps an old tire is removed
and a new one is set in place. The built-in tire
lift eliminates the danger of lower back injuries
to the operator.
We build our business and our customers’
business through product scope. While the needs
and composition of our markets constantly change,
Myers adapts and delivers the products and services
that are crucial to our customers’ success.
Wide Coverage Means Business
What good is a broad product line if
customers cannot get what they need on time?
Our nationwide coverage from 43 branches in 31
states, plus an extensive e-branch and international
distribution, means supply lines to customers
are short — a value-advantage that contributes to
millions of people’s income, mobility, and safety.
In 2002, the macro trends for our distribution
business remained favorable: vehicle average
age, population, and complexity continued
to increase, all of which translated into more
service opportunities for our customers.
Increased activity among auto dealers as tire
dealers opened potential new sales channels.
Continued consolidation of tire dealers, while
creating fewer customers, also presents Myers
with more opportunities for national accounts
service — for which our distribution business is
uniquely positioned.
Growing Personal Relationships
Even in today’s faceless world of point-and-
click, instant gratification, Myers delivers personal
service that our customers value: value in the
16
FINANCIAL STATEMENTS
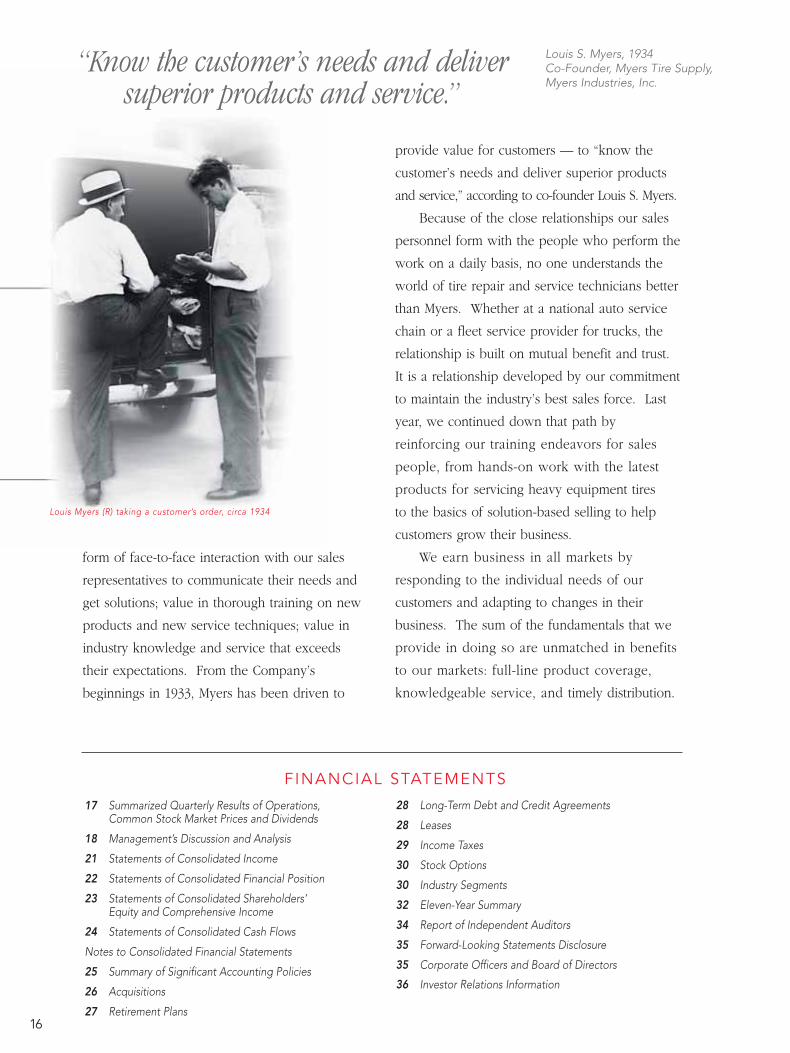
Louis Myers (R) taking a customer’s order, circa 1934
form of face-to-face interaction with our sales
representatives to communicate their needs and
get solutions; value in thorough training on new
products and new service techniques; value in
industry knowledge and service that exceeds
their expectations. From the Company’s
beginnings in 1933, Myers has been driven to
provide value for customers — to “know the
customer’s needs and deliver superior products
and service,” according to co-founder Louis S. Myers.
Because of the close relationships our sales
personnel form with the people who perform the
work on a daily basis, no one understands the
world of tire repair and service technicians better
than Myers. Whether at a national auto service
chain or a fleet service provider for trucks, the
relationship is built on mutual benefit and trust.
It is a relationship developed by our commitment
to maintain the industry’s best sales force. Last
year, we continued down that path by
reinforcing our training endeavors for sales
people, from hands-on work with the latest
products for servicing heavy equipment tires
to the basics of solution-based selling to help
customers grow their business.
We earn business in all markets by
responding to the individual needs of our
customers and adapting to changes in their
business. The sum of the fundamentals that we
provide in doing so are unmatched in benefits
to our markets: full-line product coverage,
knowledgeable service, and timely distribution.
17 Summarized Quarterly Results of Operations, Common Stock Market Prices and Dividends
18 Management’s Discussion and Analysis
21 Statements of Consolidated Income
22 Statements of Consolidated Financial Position
23 Statements of Consolidated Shareholders’Equity and Comprehensive Income
24 Statements of Consolidated Cash Flows
Notes to Consolidated Financial Statements
25 Summary of Significant Accounting Policies
26 Acquisitions
27 Retirement Plans
28 Long-Term Debt and Credit Agreements
28 Leases
29 Income Taxes
30 Stock Options
30 Industry Segments
32 Eleven-Year Summary
34 Report of Independent Auditors
35 Forward-Looking Statements Disclosure
35 Corporate Officers and Board of Directors
36 Investor Relations Information
“Know the customer’s needs and deliversuperior products and service.”
Louis S. Myers, 1934Co-Founder, Myers Tire Supply,Myers Industries, Inc.

2002
Quarter Ended Sales Price Dividends PaidHigh Low
March 31 11.64 9.20 .05June 30 14.48 11.22 .05September 30 14.20 10.21 .05December 31 13.70 10.02 .05
2001Quarter Ended Sales Price Dividends Paid
High LowMarch 31 11.64 8.01 .04June 30 11.34 8.91 .04September 30 11.05 8.56 .05December 31 11.66 8.72 .05
of record holders at December 31, 2002 was 2,214. High and lowstock prices and dividends for the last two years were:
2002
Quarter Ended March 31 June 30 Sept. 30 Dec. 31 TotalNet sales $148,939 $153,095 $146,626 $159,331 $607,991 Gross profit 54,499 51,730 44,395 50,794 201,418 Net income 10,046 6,802 3,068 4,044 23,960 Per share .34 .23 .10 .13 .80
2001Quarter Ended March 31 June 30 Sept. 30 Dec. 31 TotalNet sales $165,260 $152,738 $141,447 $148,505 $607,950 Gross profit 58,891 50,291 45,970 49,787 204,939 Net income 7,987 3,181 1,691 2,332 15,191 Per share .27 .10 .06 .08 .51
17
The Company's Common Stock is traded on the New YorkStock Exchange (ticker symbol MYE). The approximate number
Summarized Quarterly Results of Operations(Unaudited) Thousands of Dollars, Except Per Share Data
Common Stock Market Prices and Dividends
020100
.20
.18.17
DIVIDENDSPER SHARE$ Dollars
020100
8.50
7.307.21
BOOK VALUEPER SHARE$ Dollars
18
Management’s Discussion and Analysis of Results
of Operations and Financial Condition
2002Net sales of $608.0 million for the year ended December 31, 2002were virtually unchanged from the prior year. Despite the flatsales, net income for 2002 of $24.0 million or $.80 per shareincreased 58 percent from the net income of $15.2 million or $.51per share reported in 2001, as a result of the cessation of goodwillamortization and significantly lower interest expense.
On a segment basis, sales in the distribution segmentincreased $3.1 million or 2 percent as sales of capital equipmentpicked up following several years of weak demand. In themanufacturing segment, sales declined $1.7 million or less thanone percent, however, excluding the favorable translation effect of foreign currencies, primarily from a stronger euro, sales in themanufacturing segment would have been down 2 percent for theyear. Weak demand in most of the Company’s markets combinedwith competitive pressures on pricing, particularly for horticulturalcontainers and consumer products, led to the decline.
Gross profit, expressed as a percentage of sales, declinedslightly to 33.1 percent for the year ended December 31, 2002,compared with 33.7 percent in the prior year. In the distributionsegment, margins increased slightly based on continuing favorablesales mix of higher margin supplies. In the manufacturingsegment, margins declined as a result of lower selling prices andan increase of unabsorbed fixed manufacturing costs due to lowerproduction levels. Raw material costs, primarily for plastic resins,were lower than prior year costs through the first half of 2002 butincreased throughout the year and were unfavorable in the thirdand fourth quarters.
Total operating expenses decreased $9.8 million or 6 percent to $149.2 million. Expressed as a percentage of sales, operatingexpenses were reduced to 24.5 percent in 2002 compared to 26.1percent in 2001. The reduction in current year operating expenseswas primarily due to the elimination of goodwill amortizationwhich totaled $9.2 million in 2001. Other reductions in generaland administrative expenses resulting from cost containmentefforts were largely offset by significantly higher costs for medical,property, casualty and other insurance.
Net interest expense of $11.8 million for 2002 was down $6.9million or 37 percent from the prior year. This decrease wasprimarily the result of lower interest rates, however, the Companyalso received the benefit of lower average borrowing levels byrepaying $35.8 million of debt during the year.
Income taxes as a percentage of pretax income was 40.6percent compared with 44.2 percent in the prior year. The lowereffective tax rate reflects the elimination of the impact which non-deductible goodwill amortization had in prior years. In addition,the Company experienced a more favorable foreign tax ratedifference in the current year.
2001 For the year ended December 31, 2001, net sales of $608.0million were down 7 percent from the $652.7 million in 2000. Net
income for 2001 of $15.2 million decreased 37 percent from the$24.0 million reported in 2000.
The Company experienced sales decline in both of its businesssegments. Distribution segment sales were down $7.2 million or5 percent reflecting lower unit volumes, particularly for capitalequipment. In the manufacturing segment, sales decreased $37.7million or 7 percent from the prior year as the Companyexperienced sharply lower demand brought on by the generalrecession and global economic slowdown affecting most of theindustrial markets we serve. In addition, competitive pressuresand lower raw material costs resulted in conditions to maintain orlower selling prices for most of the Company’s product lines andmarkets. Excluding the impact of acquired companies, sales in themanufacturing segment would have declined 10 percent and totalsales would be down 9 percent for the year. The translationeffect of foreign currencies, primarily the euro, did not have amaterial impact with a difference of less than one percent on thesales amounts as reported.
Cost of sales decreased $32.1 million or 7 percent, reflectingthe significant drop in fiscal 2001 sales. Gross profit, expressedas a percentage of sales, improved slightly to 33.7 percent for theyear ended December 31, 2001, compared with 33.3 percent in the prior year. In the distribution segment, margins improvedslightly reflecting a shift in sales mix to higher margin suppliesversus capital equipment. In the manufacturing segment, marginswere virtually unchanged as the benefit of lower raw materialcosts were offset by slightly lower selling prices and a decreasein the absorption of fixed manufacturing costs resulting fromreduced production.
Total operating expenses increased $4.7 million or 3 percent to $159.0 million. The increase in fiscal 2001 reflects the full yearimpact of expenses of companies acquired in the fourth quarter oflast year as well as the amortization of related goodwill. Inaddition, the Company experienced substantially higher costs formedical insurance and bad debt expense, including approximately$1.0 million as a result of the Kmart bankruptcy filing in January2002. Expressed as a percentage of sales, operating expenseswere 26.1 percent in 2001 compared with 23.6 percent in 2000.This decrease in operating expense leverage is a result of both the higher costs and reduced sales volume in the current year.
Net interest expense for 2001 decreased $3.7 million or 16percent compared with the prior year. This decrease reflectsprimarily the impact of lower interest rates. In addition, theCompany reduced debt by $35.3 million in fiscal 2001, andtherefore, received the benefit of lower average borrowing levels.Income taxes as a percent of income before taxes was 44.2percent compared to 41.3 percent in the prior year. The highereffective tax rate reflects the more significant impact of non-deductible goodwill amortization resulting from lower pretaxincome combined with a lower foreign tax rate difference.
Results Of Operations

19
Management’s Discussion and Analysis of Results
of Operations and Financial Condition
Financial Condition
Liquidity and Capital ResourcesIn 2002, the Company generated cash from operating activities of$65.5 million. During the year investments in property, plant andequipment totaled $28.4 million and total debt was reduced by$32 million. Debt as a percentage of total capitalization wasreduced to 48 percent at December 31, 2002 compared to 55percent at the end of 2001. At December 31, 2002, the Companyhad working capital of $83.8 million and a current ratio of 1.7 to 1.
At December 31, 2002, available borrowing under theCompany’s revolving credit facility was approximately $70 million.During the next five years management anticipates on-going
capital expenditures in the range of $25 to $30 million annually.Cash flows from operations and funds available under existingcredit facilities will provide the Company’s primary source offuture financing. Management believes that it has sufficientfinancial resources to meet anticipated business requirements inthe foreseeable future, including capital expenditures, dividends,working capital and debt service.
The following summarizes the Company’s future cash outflows for the next five years resulting from financial contractsand commitments:
2003 2004 2005 2006 2007 Total
Long-term Debt $20,690 $26,516 $174,954 $736 $765 $223,661Operating Leases 8,336 7,182 6,273 4,897 4,246 30,934Total $29,026 $33,698 $181,227 $5,633 $5,011 $254,595
(Dollars in thousands)
Market Risk and Derivative Financial InstrumentsThe Company has financing arrangements that require interestpayments based on floating interest rates. As such, theCompany’s financial results are subject to changes in themarket rate of interest. Our objective in managing theexposure to interest rate changes is to limit the volatility andimpact of rate changes on earnings while maintaining thelowest overall borrowing cost. At present, the Company hasnot entered into any interest rate swaps or other derivativeinstruments to fix the interest rate on any portion of itsfinancing arrangements with floating rates. Accordingly,based on current debt levels at December 31, 2002, if marketinterest rates increase one percent, the Company’s interestexpense would increase approximately $2.5 million.
Some of the Company’s subsidiaries operate in foreigncountries and, as such, their financial results are subject tothe variability that arises from exchange rate movements. The Company believes that foreign currency exchange ratefluctuations do not represent a significant market risk due tothe nature of the foreign countries in which we operate,primarily Canada and Western Europe, as well as the size ofthose operations relative to the total Company.
The Company uses certain commodities, primarily plasticresins, in its manufacturing processes. As such, the cost ofoperations is subject to fluctuation as the market for thesecommodities changes. The Company monitors this risk butcurrently has no derivative contracts to hedge this risk,however, the Company also has no significant purchaseobligations to purchase fixed quantities of such commoditiesin future periods.
Critical Accounting PoliciesOur discussion and analysis of the Company’s financialcondition and results of operations are based on theaccompanying consolidated financial statements, which areprepared in accordance with accounting principles generallyaccepted in the United States of America. As indicated in Note 1to our consolidated financial statements, the amounts of assets,liabilities, revenue and expenses reported are affected byestimates and judgements that are necessary to comply withgenerally accepted accounting principles. We base our estimateson prior experience and other assumptions that we considerreasonable to our circumstances. While estimates and judgementsare applied in arriving at reported amounts such as pensionbenefits and provisions for self-insured risks, we believe thefollowing matters may involve a high degree of judgement and complexity.
Revenue Recognition – The Company recognizes revenuesfrom the sale of products, net of actual and estimated returns, at the point of passage of title, which is generally at the time of shipment.
Bad Debts – The Company evaluates the collectibility ofaccounts receivable based on a combination of factors. Incircumstances where the Company is aware of a specific customer’sinability to meet its financial obligations, a specific allowance fordoubtful accounts is recorded against amounts due to reduce thenet recognized receivable to the amount the Company reasonablybelieves will be collected. Additionally, the Company reviewshistorical trends for collectibility in determining an estimate for its allowance for doubtful accounts. If economic circumstances

20
Management’s Discussion and Analysis of Results
of Operations and Financial Condition
change substantially, estimates of the recoverability of amountsdue the Company could be reduced by a material amount.
Inventory – Inventories are valued at the lower of cost ormarket. Cost is determined by the last-in, first-out (LIFO) methodfor approximately 41 percent of the Company’s inventories and bythe first-in, first-out (FIFO) method for all other inventories. Whereappropriate, standard cost systems are utilized for purposes ofdetermining cost; the standards are adjusted as necessary toensure they approximate actual costs. Estimates of lower of cost or market value of inventory are determined based uponcurrent economic conditions, historical sales quantities andpatterns and, in some cases, the specific risk of loss on specificallyidentified inventories.
Goodwill – As a result of Statement of Financial AccountingStandards No. 142, ”Goodwill and Other Intangible Assets,”recorded goodwill will be subjected to annual impairment testing.Goodwill impairment testing requires, in part, that we estimatethe fair value of our business units which, in turn, requires that wemake judgements concerning future cash flows and appropriatediscount rates for those businesses. Our estimate of the fair valueof these business units and the related goodwill could change over time based on a variety of factors, including the actualoperating performance of the underlying businesses or the impactof future events on the cost of capital and the related discountrates used.
Contingencies – In the ordinary course of business, we are involved invarious legal proceedings and contingencies. We have recorded liabilitiesfor these matters in accordance with Statement of Financial AccountingStandards No. 5, “Accounting for Contingencies” (SFAS 5). SFAS 5 requires aliability to be recorded based on our estimate of the probable cost of theresolution of a contingency. The actual resolution of these contingenciesmay differ from our estimates. If a contingency is settled for an amountgreater than our estimates, a future charge to income would result.Likewise, if a contingency is settled for an amount that is less than ourestimate, a future credit to income would result.
Income Taxes – Deferred income taxes are provided to recognize the effect of temporary differences between financial and tax reporting.Deferred income taxes are not provided for undistributed earnings of foreignconsolidated subsidiaries as it is our intention to reinvest such earnings foran indefinite period of time. The Company has significant operations outsidethe United States and in jurisdictions with statutory tax rates both higherand lower than in the United States. As a result, significant tax and treasuryplanning and analysis of future operations are necessary to determine theproper amounts of tax assets, liabilities and expense to be recognized.
The Company has reserved the deferred tax benefit of certain tax losscarry forwards in foreign countries that if realized would reduce futureincome tax expense by approximately $5,977,000. Of this amount,$2,657,000 expires in various years from 2003 through 2007, and $3,320,000has no expiration date. The Company also has U.S. foreign tax credit carryforwards of approximately $800,000 expiring in 2004.
Critical Accounting Policies (cont.)

21
Statements of Consolidated Income
Myers Industries, Inc. and Subsidiaries
For The Years Ended December 31, 2002, 2001 and 2000
2002 2001 2000Net sales $607,991,158 $607,950,431 $652,659,900
Cost of sales 406,572,783 403,011,346 435,081,945 Gross profit 201,418,375 204,939,085 217,577,955
Operating expensesSelling 88,407,389 88,020,857 85,632,525General and administrative 60,840,409 70,979,067 68,675,568
149,247,798 158,999,924 154,308,093 Operating income 52,170,577 45,939,161 63,269,862
InterestIncome (461,038) (695,140) (972,248)Expense 12,270,787 19,394,282 23,332,503
11,809,749 18,699,142 22,360,255
Income before income taxes 40,360,828 27,240,019 40,909,607
Income taxes 16,401,000 12,049,000 16,909,000
Net income $23,959,828 $15,191,019 $24,000,607
Net income per share $.80 $.51 $.80
Weighted average shares outstanding 29,971,843 29,752,373 29,828,210
The accompanying notes are an integral part of these statements.

22
Statements of Consolidated Financial Position
Myers Industries, Inc. and Subsidiaries
As of December 31, 2002 and 2001
2002 2001Current Assets
Cash $1,702,334 $7,074,964 Accounts receivable – less allowances
of $4,507,000 and $4,417,000, respectively 111,207,172 104,602,982 Inventories
Finished and in-process products 66,819,085 66,239,288 Raw materials and supplies 16,280,910 15,109,952
83,099,995 81,349,240 Prepaid expenses 5,130,856 3,591,411
Total Current Assets 201,140,357 196,618,597
Other AssetsGoodwill 204,465,504 187,960,222 Patents and other intangible assets, net 2,422,772 2,834,582 Other 3,658,670 4,017,156
210,546,946 194,811,960 Property, Plant and Equipment, at Cost
Land 7,878,664 7,311,493 Buildings and leasehold improvements 77,061,850 73,983,923 Machinery and equipment 318,617,656 282,140,259
403,558,170 363,435,675 Less allowances for depreciation and amortization 212,763,143 172,699,854
190,795,027 190,735,821 $602,482,330 $582,166,378
2002 2001Current Liabilities
Accounts payable $49,970,910 $44,818,664 Accrued expenses
Employee compensation and related items 29,843,708 25,501,181 Taxes, other than income taxes 3,260,304 2,632,663 Accrued interest 754,668 1,207,733 Other 12,849,101 12,971,309
Current portion of long-term debt 20,690,265 17,767,688 Total Current Liabilities 117,368,956 104,899,238
Long-term Debt, less current portion 212,222,615 247,145,234
Deferred Income Taxes 17,201,131 12,595,697
Shareholders' EquitySerial Preferred Shares (authorized 1,000,000 shares) -- --Common Shares, without par value
(authorized 60,000,000 shares; outstanding 30,071,736and 29,809,618 shares, respectively) 18,301,212 14,503,828
Additional paid-in capital 216,077,838 217,594,648 Accumulated other comprehensive income (loss) (16,590,693) (34,411,755)Retained income 37,901,271 19,839,488
255,689,628 217,526,209 $602,482,330 $582,166,378
The accompanying notes are an integral part of these statements.
Assets
Liabilities and Shareholders' Equity

23
Statements of Consolidated Shareholders’ Equity
and Comprehensive Income
Myers Industries, Inc. and Subsidiaries
For The Years Ended December 31, 2002, 2001 and 2000
AccumulatedAdditional Other
Common Shares Paid-In Comprehensive Retained ComprehensiveNumber Amount Capital Income (Loss) Income Income
Balance at January 1, 2000 19,987,446 $12,256,209 $169,508,024 ($19,013,675) $44,996,259 --Additions
Net income -- -- -- -- 24,000,607 $24,000,607 Sales under option plans 14,796 9,134 135,970 -- -- --Employees stock purchase plan 42,605 25,988 458,816 -- -- --Dividend reinvestment plan 13,033 7,949 164,223 -- -- --
DeductionsPurchases for treasury (428,800) (260,620) (5,271,582) -- -- --Dividends – $.17 per share -- -- -- -- (4,969,876) --10% stock dividend 1,960,932 1,196,170 24,784,392 -- (25,989,239) --Foreign currency translation
adjustment -- -- -- (8,136,041) -- (8,136,041)Balance at December 31, 2000 21,590,012 $13,234,830 $189,779,843 ($27,149,716) $38,037,751 $15,864,566 Additions
Net income -- -- -- -- 15,191,019 15,191,019 Sales under option plans 46,404 26,707 331,899 -- -- --Employees stock purchase plan 35,204 21,474 410,218 -- -- --Dividend reinvestment plan 11,830 8,840 365,917 -- -- --
DeductionsDividends – $.18 per share -- -- -- -- (5,454,868) --10% stock dividend 2,164,244 1,211,977 26,706,771 -- (27,934,414) --Foreign currency translation
adjustment -- -- -- (7,262,039) -- (7,262,039) Balance at December 31, 2001 23,847,694 $14,503,828 $217,594,648 ($34,411,755) $19,839,488 $7,928,980 Additions
Net income -- -- -- -- 23,959,828 23,959,828 Sales under option plans 166,837 102,297 1,562,041 -- -- --Employees stock purchase plan 30,035 18,321 359,833 -- -- --Dividend reinvestment plan 16,415 10,015 228,067 -- -- --Foreign currency translation
adjustment -- -- -- 19,404,517 -- 19,404,517Deductions
Dividends – $.20 per share -- -- -- -- (5,878,169) --Five-for-four stock split 6,010,755 3,666,751 (3,666,751) -- (19,876) --SFAS 87 additional pension liability -- -- -- (1,583,455) -- (1,583,455)
Balance at December 31, 2002 30,071,736 $18,301,212 $216,077,838 ($16,590,693) $37,901,271 $41,780,890
The accompanying notes are an integral part of these statements.

24
Statements of Consolidated Cash Flows
Myers Industries, Inc. and Subsidiaries
For The Years Ended December 31, 2002, 2001 and 2000
2002 2001 2000Cash Flows From Operating Activities
Net income $23,959,828 $15,191,019 $24,000,607 Items not affecting use of cash
Depreciation 34,550,402 33,361,480 33,075,562 Amortization of goodwill -- 9,223,542 8,949,361 Amortization of other intangibles 1,163,688 1,320,197 802,606 Deferred income taxes 4,526,372 1,632,285 964,870
Cash flow provided by (used for) working capitalAccounts receivable 553,688 18,608,281 (11,646,970)Inventories 741,868 6,359,412 (3,079,902)Prepaid expenses (1,481,808) (1,220,662) 3,292,023 Accounts payable and accrued expenses 1,491,683 (7,674,145) 10,978,852
Net cash provided by operating activities 65,505,721 76,801,409 67,337,009
Cash Flows From Investing ActivitiesAcquisition of businesses, net of cash acquired (2,819,901) (7,480,000) (17,529,677)Additions to property, plant and equipment, net (28,389,133) (25,182,509) (43,606,144)Other (298,226) (1,807,899) 42,204
Net cash used for investing activities (31,507,260) (34,470,408) (61,093,617)
Cash Flows From Financing ActivitiesRepayment of long-term debt (12,000,000) (12,000,000) (8,000,000)Net borrowings (repayments) on credit facility (23,773,496) (21,144,207) 12,540,289Cash dividends paid (5,878,169) (5,454,868) (4,969,876)Proceeds from issuance of common stock 2,280,574 1,165,055 802,080 Repurchase of common stock -- -- (5,532,202)
Net cash used for financing activities (39,371,091) (37,434,020) (5,159,709)
Increase (Decrease) In Cash (5,372,630) 4,896,981 1,083,683
Cash at January 1 7,074,964 2,177,983 1,094,300
Cash at December 31 $1,702,334 $7,074,964 $2,177,983
Supplemental Disclosures of CashFlow Information
Cash paid during the year for Interest $12,023,900 $19,715,515 $21,370,386Income taxes 11,617,883 11,478,129 17,558,167
The accompanying notes are an integral part of these statements.

25
Basis of PresentationThe consolidated financial statements include the accounts of Myers Industries, Inc. and all wholly owned subsidiaries(Company). Significant intercompany accounts and transactionshave been eliminated in consolidation. The preparation offinancial statements in conformity with generally acceptedaccounting principles requires management to make estimatesand assumptions that affect the reported amounts of assets andliabilities and disclosures at the date of the financial statementsand the reported amount of revenues and expenses during the reported period. Actual results could differ from those estimates.
Translation of Foreign CurrenciesAll balance sheet accounts of consolidated foreign subsidiariesare translated at the current exchange rate as of the end of theaccounting period and income statement items are translated at an average currency exchange rate. The resulting translationadjustment is recorded in other comprehensive income as aseparate component of shareholders' equity.
Financial InstrumentsFinancial instruments, consisting of trade and notes receivable,and long-term debt, consisting of borrowings at variable interestrates, are considered to have a fair value which approximatescarrying value at December 31, 2002.
Concentration of Credit RiskFinancial instruments that potentially subject the Company toconcentration of credit risk primarily consist of trade accountsreceivable. The concentration of accounts receivable credit risk isgenerally limited based on the Company’s diversified operations,with customers spread across many industries and countries. Nosingle customer accounts for more than two percent of total salesand no country, outside of the United States, accounts for morethan ten percent of total sales. In addition, management hasestablished certain requirements that customers must meetbefore credit is extended. The financial condition of customers iscontinuously monitored and collateral is usually not required.
InventoriesInventories are stated at the lower of cost or market. Forapproximately 41 percent of its inventories, the Company uses the last-in, first-out (LIFO) method of determining cost. All otherinventories are valued at the first-in, first-out (FIFO) method ofdetermining cost.
If the FIFO method of inventory cost valuation had been usedexclusively by the Company, inventories would have been$4,455,000, $3,731,000 and $4,756,000 higher than reported atDecember 31, 2002, 2001 and 2000, respectively.
Notes To Consolidated Financial Statements
Myers Industries, Inc. and Subsidiaries
For The Years Ended December 31, 2002, 2001 and 2000
Summary of Significant Accounting Policies
Property, Plant and EquipmentProperty, plant and equipment are carried at cost less accumulateddepreciation and amortization. The Company provides fordepreciation and amortization on the basis of the straight-linemethod over the estimated useful lives of the assets as follows:
Buildings 20 to 30 yearsLeasehold Improvements 7 to 10 yearsMachinery & Equipment 3 to 10 yearsVehicles 1 to 3 years
Long-Lived AssetsThe Company reviews its long-lived assets and identifiableintangible assets with finite lives for impairment whenever eventsor changes in circumstances indicate that the carrying amount ofan asset may not be recoverable. Measurement of the amount ofimpairment may be based on appraisal, market values of similarassets or discounted future cash flows resulting from the use andultimate disposition of the asset. There were no impairmentcharges recorded in connection with the long-lived assets in 2002,2001 or 2000.
In October 2001, the Financial Accounting Standards Board(FASB) issued Statement of Financial Accounting Standards (SFAS)No. 144, “Accounting for the Impairment or Disposal of Long-LivedAssets.” SFAS No. 144 became effective for the Company in 2002and establishes guidelines for accounting for the impairment oflong-lived assets. The provisions of SFAS No. 144 had no impacton the Company’s financial statements upon adoption.
Revenue RecognitionThe Company recognizes revenue from sales when goods areshipped and title has passed to the customer.
Income TaxesDeferred income taxes are provided to recognize differencesbetween financial statement and income tax reporting, principallyfor depreciation, non-deductible reserves and certain valuationallowances. No provision is made for U.S. income taxes on the unremitted earnings of foreign subsidiaries as the Company’sintention is to indefinitely reinvest these earnings in theoperations of these subsidiaries.
Goodwill and Intangible AssetsEffective January 1, 2002, the Company adopted the provisions of SFAS No. 141, “Business Combinations” and SFAS No. 142,“Goodwill and Other Intangible Assets.” SFAS No. 141 requiresthat all business combinations be accounted for by the purchasemethod and that certain acquired intangible assets be recognizedas assets apart from goodwill. No reclassification of intangibleassets apart from goodwill was necessary as a result of theCompany adopting the new standard.

26
Under the provisions of SFAS No. 142, the Company wasrequired to perform a transitional goodwill impairment test within six months of adopting the new standard and to test forimpairment on at least an annual basis thereafter. For purposes oftransitional impairment testing, the Company determined the fairvalue of its reporting units using discounted cash flow models and relative market multiples for comparable businesses. TheCompany compared the fair value of each of its reporting units to their respective carrying values, including related goodwill, which resulted in no impairment being recognized. Evaluation ofrecorded goodwill as of October 1, 2002, the date of the Company‘sannual impairment testing, also resulted in no indication ofgoodwill impairment.
In accordance with SFAS No. 142, the Company discontinuedthe amortization of goodwill effective January 1, 2002, at whichtime accumulated amortization was $30.7 million. Had goodwillamortization not been recorded in 2001 and 2000, income beforetaxes would have increased $9.2 million and $8.9 million, respectively,while net income would have increased by $7.1 million to $22.3million and $6.8 million to $30.8 million. Net income per share wouldhave increased by $.24 and $.23 for 2001 and 2000, respectively.
Net Income Per ShareNet income per share, as shown on the Statements of ConsolidatedIncome, is determined on the basis of the weighted averagenumber of common shares outstanding during the year, and for allperiods shown basic and diluted earnings per share are identical.During the year ended December 31, 2002, the Company declareda five-for-four stock split and during fiscal years 2001 and 2000,the Company paid a ten percent stock dividend. All per share datahas been adjusted for the stock split and stock dividends.
Stock CompensationThe Company accounts for stock compensation arrangementsusing the intrinsic value in Accounting Principles Board (APB)Opinion No. 25, ”Accounting for Stock Issued to Employees.“ Inaccordance with the intrinsic value method, the Company has notrecognized any expense related to stock options, as options haveonly been granted with an exercise price equal to the marketvalue of the shares at the date of the grant.
The alternative policy in SFAS No. 123, ”Accounting for StockBased Compensation,“ provides that compensation expense berecognized based on the fair value of the options awarded,determined by an option pricing model. If the Company hadrecognized compensation expense using the fair value methodunder SFAS No. 123 rather than APB 25, net income would nothave been materially different than reported amounts and netincome per share would be identical for 2002, 2001 and 2000.In calculating the compensation expense under SFAS No. 123, the Company assumes that all options will vest and be exercisedat the expiration date of the grant. Other assumptions used in
calculating the compensation expense for options granted in 2002include a dividend yield of 1.6 percent, a risk free interest rate of3.85 percent and a volatility measure based on the Company’sstock beta of .40.
In December 2002, the FASB issued SFAS No. 148, Accountingfor Stock Based Compensation—Transition and Disclosure," as anamendment to SFAS No. 123. SFAS No. 148 provides for alternativemethods of transition for a voluntary change to the fair valuebased method of accounting for stock based employee compensation.In addition, SFAS No. 148 amends the disclosure requirements torequire prominent disclosure in both interim and annual financialstatements about the method of accounting used for stock basedemployee compensation and the effect of the method on reportedresults. The Company adopted the disclosure provisions of SFASNo. 148 effective December 31, 2002.
Acquisitions
In October 2000, the Company acquired R.B. Manufacturing (RB), aSandusky, Ohio manufacturer of material handling carts, and BestPlastics, Inc., a Cassopolis, Michigan manufacturer of thermoformedand rotational molded plastic products. Total cost of the acquisitionswas approximately $18.2 million and both acquisitions have beenaccounted for under the purchase method of accounting. Theexcess of purchase price over the fair value of assets acquiredwas approximately $12.4 million. Consolidated pro-forma sales,income and earnings per share, adjusted to reflect the acquisitionsof RB and Best, would not be materially different from the reportedamounts for fiscal year 2000.
In 2002, the Company paid approximately $2.8 million asadditional and final consideration in connection with the acquisitionof Listo Products, Ltd. (Listo). Listo was acquired in August 1999for a total cost, including the additional consideration noted above,of approximately $18 million.
Notes To Consolidated Financial Statements
Myers Industries, Inc. and Subsidiaries
For The Years Ended December 31, 2002, 2001 and 2000
Summary of Significant Accounting Policies (cont.)
27
Notes To Consolidated Financial Statements
Myers Industries, Inc. and Subsidiaries
For The Years Ended December 31, 2002, 2001 and 2000
which are at least equal to the minimum required contribution asdefined by the Employee Retirement Income Security Act of 1974.
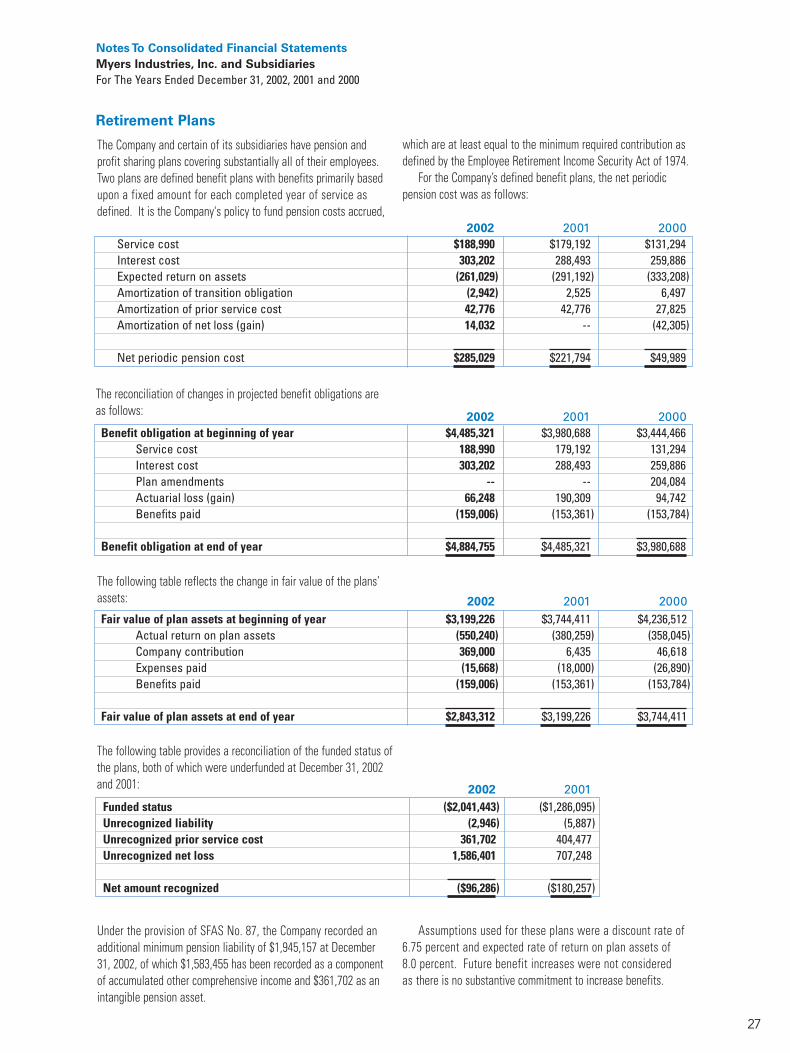
For the Company’s defined benefit plans, the net periodicpension cost was as follows:
The Company and certain of its subsidiaries have pension andprofit sharing plans covering substantially all of their employees.Two plans are defined benefit plans with benefits primarily basedupon a fixed amount for each completed year of service asdefined. It is the Company's policy to fund pension costs accrued,
Retirement Plans
2002 2001 2000Service cost $188,990 $179,192 $131,294Interest cost 303,202 288,493 259,886Expected return on assets (261,029) (291,192) (333,208)Amortization of transition obligation (2,942) 2,525 6,497Amortization of prior service cost 42,776 42,776 27,825Amortization of net loss (gain) 14,032 -- (42,305)
Net periodic pension cost $285,029 $221,794 $49,989
The following table reflects the change in fair value of the plans’assets: 2002 2001 2000Fair value of plan assets at beginning of year $3,199,226 $3,744,411 $4,236,512
Actual return on plan assets (550,240) (380,259) (358,045)Company contribution 369,000 6,435 46,618Expenses paid (15,668) (18,000) (26,890)Benefits paid (159,006) (153,361) (153,784)
Fair value of plan assets at end of year $2,843,312 $3,199,226 $3,744,411
2002 2001 2000Benefit obligation at beginning of year $4,485,321 $3,980,688 $3,444,466
Service cost 188,990 179,192 131,294Interest cost 303,202 288,493 259,886Plan amendments -- -- 204,084Actuarial loss (gain) 66,248 190,309 94,742Benefits paid (159,006) (153,361) (153,784)
Benefit obligation at end of year $4,884,755 $4,485,321 $3,980,688
The reconciliation of changes in projected benefit obligations areas follows:
The following table provides a reconciliation of the funded status ofthe plans, both of which were underfunded at December 31, 2002and 2001: 2002 2001
Funded status ($2,041,443) ($1,286,095) Unrecognized liability (2,946) (5,887) Unrecognized prior service cost 361,702 404,477Unrecognized net loss 1,586,401 707,248
Net amount recognized ($96,286) ($180,257)
Under the provision of SFAS No. 87, the Company recorded anadditional minimum pension liability of $1,945,157 at December31, 2002, of which $1,583,455 has been recorded as a componentof accumulated other comprehensive income and $361,702 as anintangible pension asset.
Assumptions used for these plans were a discount rate of 6.75 percent and expected rate of return on plan assets of 8.0 percent. Future benefit increases were not considered as there is no substantive commitment to increase benefits.

28
A profit sharing plan is maintained for the Company’s U.S.based employees, not covered under defined benefit plans, whohave met eligibility service requirements. The amount to becontributed by the Company under the profit sharing plan isdetermined at the discretion of the Board of Directors. Profitsharing plan expense was $1,700,000, $1,500,000, and $2,000,000for the years 2002, 2001 and 2000, respectively. In addition, the
Notes To Consolidated Financial Statements
Myers Industries, Inc. and Subsidiaries
For The Years Ended December 31, 2002, 2001 and 2000
Company has a Supplemental Executive Retirement Plan (SERP)to provide participating senior executives with retirement benefitsin addition to amounts payable under the profit sharing plan.Expense related to the SERP was $253,000, $108,000 and$128,000 for the years 2002, 2001 and 2000, respectively. TheSERP is unfunded apart from the general assets of the Company.
Long-Term Debt and Credit Agreements
The Company has a Multi-Currency Loan Agreement with a groupof banks which at December 31, 2002 provides for a $41.5 millionterm loan facility and a revolving credit facility in five currencies,approximating $245 million (US). Amounts available under therevolving credit facility are 185 million US dollars, 30 millioneuros, 23 million Canadian dollars, 63 million Danish kroners, and3.0 million pound sterling. At December 31, 2002, the amountborrowed was $41.5 million under the term loan, and $156.0million US dollars, 2.3 million euros, 13.4 million Canadian dollars,40.0 million Danish kroners and 1.0 million pound sterling underthe revolving credit facility.
Interest is based upon LIBOR for US dollars and similar basesfor the other currencies plus an applicable margin that variesdepending on the Company’s ratio of total debt to earnings beforeinterest, taxes, depreciation and amortization (EBITDA). Thecurrent average interest rate on the outstanding advances atDecember 31, 2002 is 3.31 percent. In addition, the Companypays a quarterly facility fee at a rate dependent on the EBITDAratio, which was 45 basis points at December 31, 2002. The LoanAgreement expires in February 2005.
The Loan Agreement contains covenants which include amongother things, the maintenance of certain financial ratios regardingleverage, net worth, interest coverage, and limits as to paymentsfor cash dividends and capital expenditures. At December 31,2002, the Company was in compliance with all of its debt covenants.In addition, the Loan Agreement restricts debt outside the facilityto $25 million. At December 31, 2002, the Company had $17.2million borrowed against this limit consisting of industrial revenuebonds, certain indebtedness of acquired companies, and in-country
credit facilities for the Company’s international operations. Theweighted average interest rate on these amounts outstanding was3.8 percent at December 31, 2002.
Maturities of long-term debt for the five years endingDecember 31, 2007 are: $21,000,000 in 2003; $27,000,000 in2004; $175,000,000 in 2005; $1,000,000 in 2006 and $1,000,000 in 2007.
Leases
The Company and certain of its subsidiaries are committed undernon-cancelable operating leases involving certain facilities andequipment. Aggregate rental expense for all leased assets was $9,395,000, $9,493,000, and $5,416,000 for the years endedDecember 31, 2002, 2001 and 2000, respectively.
Future minimum rental commitments for the next five yearsare as follows:
Long-term debt at December 31, consisted of the following:2002 2001
Revolving credit agreement $174,179,776 $192,992,890Term loan 41,500,000 53,500,000Industrial revenue bonds 4,000,000 4,000,000Other 13,233,104 14,420,032
232,912,880 264,912,922Less current portion 20,690,265 17,767,688
$212,222,615 $247,145,234
Year Ended December 31, Commitment
2003 $8,336,0002004 7,182,000 2005 6,273,0002006 4,897,000 2007 4,246,000
Retirement Plans (cont.)

29
Notes To Consolidated Financial Statements
Myers Industries, Inc. and Subsidiaries
For The Years Ended December 31, 2002, 2001 and 2000
The effective tax rate was 40.6% in 2002, 44.2% in 2001 and41.3% in 2000. A reconciliation of the Federal statutory incometax rate to the Company's effective tax rate is as follows:
Percent of Pre-Tax Income
2002 2001 2000Statutory Federal income tax rate 35.0% 35.0% 35.0%State income taxes – net of Federal tax benefit 4.2 3.8 4.2Foreign tax rate differential 1.1 2.1 (.5)Effect of non-deductible depreciation and amortization 0.0 2.3 1.3Other 0.3 1.0 1.3Effective tax rate for the year 40.6% 44.2% 41.3%
Income Taxes
(Dollars in thousands)
2002 2001 2000Current Deferred Current Deferred Current Deferred
Federal $7,269 $3,921 $6,518 $2,140 $12,152 $671Foreign 2,392 202 2,322 (529) 1,457 (12)State and local 2,135 482 1,651 (53) 2,325 316
$11,796 $4,605 $10,491 $1,558 $15,934 $975
(Dollars in thousands)
2002 2001 Deferred income tax liabilities
Property, plant and equipment $20,101 $19,689 Tax deductible goodwill 2,206 --Employee benefit trust 556 435Other 1,641 388
24,504 20,512Deferred income tax assets
Compensation 3,282 3,276Inventory valuation 1,108 1,246Allowance for uncollectible accounts 858 971Non-deductible accruals 2,055 2,423
7,303 7,916Net deferred income tax liability $17,201 $12,596
Significant components of the Company's deferred taxes as ofDecember 31, 2002 and 2001 are as follows:
Income taxes consisted of the following:
In addition, at December 31, 2002 the Company has reserved thedeferred tax benefit of certain tax loss carry forwards in foreigncountries that if realized would reduce future income tax expenseby approximately $5,977,000. Of this amount, $2,657,000 expires
in various years from 2003 through 2007, and $3,320,000 has noexpiration date. The Company also has U.S. foreign tax creditcarry forwards of approximately $800,000 expiring in 2004.

30
Notes To Consolidated Financial Statements
Myers Industries, Inc. and Subsidiaries
For The Years Ended December 31, 2002, 2001 and 2000
Options granted during the past three years:Year Shares Price
2002 6,250 $12.322001 300,212 $8.36 to $10.402000 16,504 $8.18 to $9.32
Options outstanding and exercisable at December 31, 2002, 2001and 2000 were as follows:
Range of Weighted Average
Year Outstanding Exercise Prices Exercisable Exercise Price
2002 911,871 $8.18 to $15.78 675,288 $10.512001 1,181,309 $8.18 to $15.78 743,719 $10.032000 1,028,616 $8.18 to $15.78 640,379 $10.26
Options exercised during the past three years:Year Shares Price
2002 255,000 $8.18 to $9.922001 72,098 $8.55 to $9.832000 30,534 $7.13 to $8.12
Industry Segments
The Company’s business units have separate management teamsand offer different products and services. Using the criteria ofSFAS No.131, these business units have been aggregated intotwo reportable segments; distribution of aftermarket repairproducts and services and manufacturing of polymer products.The aggregation of business units is based on management by the chief operating decision maker for the segment as well assimilarities of production processes, distribution methods andeconomic characteristics (e.g. average gross margin and theimpact of economic conditions on long-term financial performance).
The Company’s distribution segment is engaged in thedistribution of equipment, tools and supplies used for tireservicing and automotive underbody repair. The distributionsegment operates domestically through 43 branches located inmajor cities throughout the United States and in foreign countriesthrough export sales and businesses in which the Company holdsan equity interest.
The Company’s manufacturing segment designs, manufacturesand markets a variety of polymer based plastic and rubber products.
These products are manufactured primarily through the moldingprocess in facilities throughout the United States and in Europe.Sales to external customers for manufactured plastic productswere $406.7 million, $411.1 million and $443.7 million for fiscalyears 2002, 2001 and 2000, respectively. Outside sales ofmanufactured rubber products were $47.3 million, $46.0 millionand $50.8 million for fiscal years 2002, 2001 and 2000.
Operating income for each segment is based on net sales lesscost of products sold, and the related selling, administrative andgeneral expenses. In computing segment operating income,general corporate overhead expenses and interest expenses arenot included. The identifiable assets of each segment include:accounts receivable, inventory, net fixed assets, goodwill,patents and other intangible assets. Corporate assets areprincipally land, buildings, computer equipment and cash. Totalsales from foreign business units and export were approximately$182.5 million, $182.0 million and $194.2 million for the years2002, 2001 and 2000, respectively. There are no individual foreigncountries for which sales are material. Long-lived assets in
Stock Options
In 1999, the Company and its shareholders adopted the 1999Stock Plan allowing the Board of Directors to grant key employeesand Directors the right to purchase Common Stock of the Companyat the market price on the date of grant. In general, optionsgranted and outstanding permit 20 percent of the shares grantedto be exercised after six months, with additional vesting of 20
percent exercisable each year thereafter, with the options expiringsix years from the date of grant. At December 31, 2002, therewere 1,551,733 stock option shares available for future grant. The activity listed below covers the 1999 Stock Plan, the 1997Incentive Stock Plan and the 1992 Stock Option Plan.

31
Notes To Consolidated Financial Statements
Myers Industries, Inc. and Subsidiaries
For The Years Ended December 31, 2002, 2001 and 2000
(Dollars in thousands)
2002 2001 2000Net Sales
Distribution of aftermarket repairproducts and services $154,028 $150,932 $158,151
Manufacturing of polymer products 468,633 470,387 508,070 Intra-segment elimination (14,670) (13,369) (13,561)
$607,991 $607,950 $652,660
Income Before Income TaxesDistribution of aftermarket repair
products and services $16,970 $14,733 $15,431Manufacturing of polymer products 45,091 40,597 56,562 Corporate (9,890) (9,391) (8,723) Interest expense—net (11,810) (18,699) (22,360)
$40,361 $27,240 $40,910
Identifiable AssetsDistribution of aftermarket repair
products and services $50,934 $48,993 $57,136Manufacturing of polymer products 545,970 528,775 563,637 Corporate 6,008 4,558 2,787Intra-segment elimination (430) (160) (1,456)
$602,482 $582,166 $622,104
Capital Additions, NetDistribution of aftermarket repair
products and services $52 $29 $344Manufacturing of polymer products 27,895 24,950 42,787 Corporate 442 206 475
$28,389 $25,185 $43,606
DepreciationDistribution of aftermarket repair
products and services $433 $483 $496Manufacturing of polymer products 33,390 32,172 31,965 Corporate 727 706 615
$34,550 $33,361 $33,076
Industry Segments (cont.)
foreign countries consisting primarily of property, plant andequipment and goodwill were approximately $133.9 million atDecember 31, 2002 and $113.3 million at December 31, 2001.
No single customer accounts for 10 percent or more of totalcompany net sales or the net sales of either business segment.

32
608.0580.8
392.0
339.6320.9
300.7274.1
245.1229.3
608.0
652.7NET SALES$ Millions
02009998979695949392 01
24.0
31.2
28.7
22.3
21.0
16.0
17.8
15.4
13.1
15.2
24.0
NET INCOME$ Millions
02009998979695949392 01
2002 2001 2000 1999Operations for the Year
Net sales $607,991,158 $607,950,431 $652,659,900 $580,760,740Cost and expenses
Cost of sales 406,572,783 403,011,346 435,081,945 367,635,460Selling 88,407,389 88,020,857 85,632,525 83,352,607General and administrative 60,840,409 70,979,067 68,675,568 60,265,518Interest—net 11,809,749 18,699,142 22,360,255 15,205,809
567,630,330 580,710,412 611,750,293 526,459,394Income before income taxes 40,360,828 27,240,019 40,909,607 54,301,346Income taxes 16,401,000 12,049,000 16,909,000 23,125,000Net income $23,959,828 $15,191,019 $24,000,607 $31,176,346Net income per share* $.80 $.51 $.80 $1.02
Financial Position—at Year EndTotal assets $602,482,330 $582,166,378 $622,103,970 $600,409,632Current assets 201,140,357 196,618,597 219,307,253 206,990,990Current liabilities 117,368,956 104,899,238 112,890,230 102,244,419Working capital 83,771,401 91,719,359 106,417,023 104,746,571Other assets 210,546,946 194,811,960 201,291,971 203,923,134Property, plant and equipment—net 190,795,027 190,735,821 201,504,746 189,495,508Less:
Long-term debt 212,222,615 247,145,234 284,273,097 280,103,906Deferred income taxes 17,201,131 12,595,697 11,037,935 10,314,490
Shareholders’ Equity $255,689,628 $217,526,209 $213,902,708 $207,746,817Common Shares outstanding* 30,071,736 29,809,618 29,686,266 30,231,013Book value per Common Share* $8.50 $7.30 $7.21 $6.87Other Data
Dividends paid $5,578,169 $5,454,870 $4,969,876 $4,626,471Dividends paid per Common Share* .20 .18 .17 .15Average Common Sharesoutstanding during the year.* 29,971,843 29,752,373 29,828,210 30,502,466
* Adjusted for the five-for-four stock split distributed in August, 2002; the ten percent stock dividends paid in August, 2001; August, 2000; August, 1999; August, 1997; and August,1995; the five-for-four stock split distributed in August, 1994; the ten percent stock dividend paid in August, 1993; and the five-for-four stock split distributed in August, 1992.
Eleven-Year Financial Summary
Myers Industries, Inc. and Subsidiaries

33
255.7
207.7202.7
176.7
162.4
145.2
130.9
115.3
83.9
217.5213.9
02009998979695949392 01
SHAREHOLDERS’EQUITY$ Millions
.80
.51
.80
1.02
.94
.73
.68
.52
.58
.52
.46
NET INCOMEPER SHARE$ Dollars
02009998979695949392 01
1998 1997 1996 1995 1994 1993 1992
$392,019,900 $339,625,585 $320,943,771 $300,699,109 $274,054,163 $245,136,189 $229,255,085
256,506,103 232,376,615 219,152,386 206,050,902 183,890,614 163,794,129 154,007,50247,959,466 39,322,295 36,170,478 33,973,656 32,238,245 30,428,260 27,286,62638,181,368 29,613,322 29,720,351 32,834,285 27,258,865 24,373,483 24,782,393
887,873 247,570 285,290 784,427 620,276 1,091,590 1,341,811343,534,810 301,559,802 285,328,505 273,643,270 244,008,000 219,687,462 207,418,33248,485,090 38,065,783 35,615,266 27,055,839 30,046,163 25,448,727 21,836,75319,806,000 15,727,000 14,612,000 11,087,000 12,215,000 10,054,000 8,727,000
$28,679,090 $22,338,783 $21,003,266 $15,968,839 $17,831,163 $15,394,727 $13,109,753$.94 $.73 $.68 $.52 $.58 $.52 $.46
$306,707,788 $224,077,922 $207,121,727 $193,603,873 $172,026,887 $152,386,302 $142,081,023153,650,201 107,426,627 106,309,880 101,087,297 94,724,955 78,922,479 74,892,47151,233,510 39,643,522 36,853,013 32,372,026 34,093,593 24,380,541 31,685,772
102,416,691 67,783,105 69,456,867 68,715,271 60,631,362 54,541,938 43,206,69943,614,594 26,100,386 20,151,914 23,086,827 15,923,620 15,769,611 16,525,900
109,442,993 90,550,909 80,659,933 69,429,749 61,378,312 57,694,212 50,662,652
48,832,240 4,261,257 4,569,396 13,335,191 4,154,646 10,654,650 24,917,4263,953,185 3,496,196 3,254,327 2,713,106 2,869,976 2,064,399 1,594,855
$202,688,853 $176,676,947 $162,444,991 $145,183,550 $130,908,672 $115,286,712 $83,882,97030,509,949 30,411,513 30,845,895 30,940,128 30,801,188 30,758,183 28,371,490
$6.64 $5.81 $5.27 $4.69 $4.25 $3.75 $2.96
$4,027,721 $3,529,921 $3,049,642 $2,577,154 $2,326,964 $2,058,288 $1,746,780.13 .11 .10 .08 .08 .07 .06
30,454,614 30,726,728 30,977,659 30,876,708 30,801,700 29,642,640 28,310,406
34
We have audited the accompanying statement of consolidatedfinancial position of Myers Industries, Inc. (an Ohio Corporation)and Subsidiaries as of December 31, 2002 and the related statementsof consolidated income, shareholders’ equity and comprehensiveincome and cash flows for the year then ended. These financialstatements are the responsibility of the Company’s management.Our responsibility is to express an opinion on these financialstatements based on our audit. The consolidated financial statementsof Myers Industries, Inc. and Subsidiaries as of December 31, 2001and for each of the two years in the period then ended wereaudited by other auditors who have ceased operations and whosereport dated February 15, 2002, expressed an unqualified opinionon those statements before the revisions described below and inthe Goodwill and Intangible Assets note and the 2002 restatementadjustment for the retroactive effect of the five-for-four stock splitdescribed below and in the Net Income Per Share note.
We conducted our audit in accordance with auditing standardsgenerally accepted in the United States. Those standards requirethat we plan and perform the audit to obtain reasonable assuranceabout whether the financial statements are free of materialmisstatement. An audit includes examining, on a test basis,evidence supporting the amounts and disclosures in the financialstatements. An audit also includes assessing the accountingprinciples used and significant estimates made by management,as well as evaluating the overall financial statement presentation.We believe that our audit provides a reasonable basis for our opinion.
In our opinion, the financial statements referred to abovepresent fairly, in all material respects, the consolidated financialposition of Myers Industries, Inc. and Subsidiaries at December31, 2002 and the consolidated results of their operations and theircash flows for the year then ended in conformity with accountingprinciples generally accepted in the United States.
As explained in the Goodwill and Intangible Assets note,effective January 1, 2002, the Company changed its method ofaccounting for goodwill.
As discussed above, the financial statements of MyersIndustries, Inc. as of December 31, 2001, and for each of the twoyears in the period then ended were audited by other auditorswho have ceased operations. As described in the Goodwill andIntangible Assets note, these financial statements have beenrevised to include the transitional disclosures required by Statementof Financial Accounting Standards (SFAS) No. 142, Goodwill andOther Intangible Assets, which was adopted by the Company as ofJanuary 1, 2002. Our audit procedures with respect to the disclosuresfor 2001 and 2000 in the Goodwill and Intangible Assets noteincluded (a) agreeing the previously reported net income and netincome per share to the previously issued financial statementsand the adjustments to those amounts representing amortizationexpense (including any related tax effects) recognized in thoseperiods related to goodwill to the Company’s underlying recordsobtained from management, and (b) testing the mathematical
Report of Independent Auditors
accuracy of the calculation of adjusted net income. Also, as described in the Net Income Per Share note, in 2002 theCompany’s Board of Directors approved a five-for-four stock split,and all references to the number of shares, per share informationand the number of stock options in the financial statements havebeen adjusted to reflect the stock split on a retroactive basis. Weaudited the adjustments that were applied to restate the numberof shares and per share information and the number of stockoptions reflected in the 2001 and 2000 financial statements. Ourprocedures included (a) agreeing the authorization for the five-for-four stock split to the Company’s underlying records obtained frommanagement, and (b) testing the mathematical accuracy of therestated number of shares, net income per share, stock optioninformation and all other per share amounts.
In our opinion, the disclosures for 2001 and 2000 in theGoodwill and Intangible Assets note are appropriate and theadjustments to reflect the five-for-four stock split are appropriateand have been properly applied. However, we were not engagedto audit, review, or apply any procedures to the 2001 or 2000financial statements of the Company other than with respect tosuch disclosures and adjustments and, accordingly, we do notexpress an opinion or any other form of assurance on the 2001 or2000 financial statements taken as a whole.
Akron, OhioFebruary 12, 2003

35
Keith A. Brown
President and Chief Executive OfficerChimera Corp.
Karl S. Hay
Retired from Brouse McDowellA Legal Professional Association
Richard P. Johnston
Private Equity Investor
Michael W. Kane
President and Chief Executive OfficerM. Kane & Company, Inc.
Edward W. Kissel
President and Chief Executive OfficerKissel Group Ltd.
Stephen E. Myers
President and Chief Executive Officer
Richard L. Osborne
Professor for the Practice of ManagementCase Western Reserve University
Jon H. Outcalt
Chairman, NCS HealthCare Inc.
Milton I. Wiskind
Senior Vice President and Secretary
Stephen E. Myers
President and Chief Executive Officer
John C. Orr
Chief Operating Officer
Milton I. Wiskind
Senior Vice President and Secretary
Gregory J. Stodnick
Vice President, Finance and Chief Financial Officer
Jean-Paul Lesage
Vice President
Kevin C. O'Neil
General Counsel and Assistant Secretary
Forward-Looking
Statements Disclosure Board of Directors
Corporate Officers
Statements contained in this report concerning the Company’sgoals, strategies, and expectations for business and financialresults may be “forward-looking statements” within the meaningof the Private Securities Litigation Reform Act of 1995 and arebased on current indicators and expectations. Whenever youread a statement that is not simply a statement of historical fact(such as when we describe what we “believe,” “expect,” or“anticipate” will occur, and other similar statements), you mustremember that our expectations may not be correct, even thoughwe believe they are reasonable. We do not guarantee that thetransactions and events described will happen as described (orthat they will happen at all).
You should read this report with the understanding thatactual future results may be materially different from what weexpect. Many of the factors that will determine these results arebeyond our ability to control or predict. You are cautioned not toput undue reliance on any forward-looking statement. We do notintend, and undertake no obligation, to update these forward-looking statements.
These statements involve a number of risks and uncertainties that could cause actual results to differ materially from those expressed or implied in the applicablestatements. Such risks include, but are not limited to:
(1) Fluctuations in product demand and market acceptance
(2) Uncertainties associated with the general economic conditions in our domestic and international markets
(3) Foreign currency risks(4) Interest rate fluctuations(5) Increased competition in our markets(6) Changes in seasonality(7) Our ability to make successful acquisitions(8) Difficulties in manufacturing operations(9) Our degree of leverage and uncertainties
associated with servicing our debt(10) Raw material availability(11) Fluctuations in raw material costs(12) Changes in laws or regulations and approvals
and decisions of courts, regulators, and governmental bodies

36
Annual Meeting
The Annual Meeting of Shareholders will be held onWednesday, April 23, 2003, at 9:00 a.m. in the Company’sL.S. Myers Training Center, 1554 South Main Street,Akron, Ohio. For more information, please call (330) 253-5592.
Company Headquarters
Myers Industries, Inc.1293 South Main StreetAkron, Ohio 44301Tel: (330) 253-5592
Web Site: www.myersind.com
Myers Industries’ home page provides detailedinformation about the company, including:
• Stock prices and charting from the NYSE;• Downloadable Annual Report PDF files;• SEC Filings;• Recent press releases;• Myers’ products, services, and markets;• Historical information about Myers; and• Information order form to obtain current
financial and investor-related information.
Common Stock
Traded on the New York Stock Exchange
Dividend Reinvestment Plan
Shareholders have a convenient opportunity toautomatically reinvest cash dividends and make voluntarycash investments in the Company’s stock through theDividend Reinvestment Plan. Participating shareholderspay no brokerage commissions or other charges onpurchases of shares under the Plan; all such commissionsand charges are paid by the Company.
For full details about participating in the DividendReinvestment Plan, please contact Garee Daniska,Assistant Treasurer, Myers Industries, Inc., 1293 SouthMain Street, Akron, Ohio 44301.
Transfer Agent & Registrar
EquiServe, First Chicago Trust Company of New York is the company’s principal transfer agent andregistrar. Please contact First Chicago directly with allrequests to:
• Transfer stock;• Change name or address;• Replace lost stock certificates or
dividend checks;• Consolidate accounts;
• Eliminate multiple mailings; and• Obtain statements of holdings.
EquiServeP. O. Box 43069Providence, RI 02940-3069Customer Service Center: (781) 575-2724
Form 10-K Requests
A copy of the Company’s 2001 Annual Report on Form 10-K is available to shareholders at our website or upon written request to:
Gregory J. StodnickVice President, FinanceMyers Industries, Inc.1293 South Main StreetAkron, Ohio 44301
National Association of Investors
Corporation (NAIC)
Myers Industries is a corporate member of the National Association of Investors Corporation (NAIC), the world’s largest individual shareholder membership group. Myers participates in NAIC regional and national events.
Auditors
Ernst & Young LLP222 South Main Street, Suite 300Akron, Ohio 44308Tel: (330) 255-5800
Shareholder Contacts
Gregory J. StodnickVice President, Finance & CFO
Myers Industries, Inc. • 1293 S. Main Street • Akron, Ohio 44301Telephone: (330) 253-5592 • Fax: (330) 761-6156
Investor Relations
Information
Max R. Barton IIInvestor Relations Manager

A Focused Business Approach for Growth. . .
• Concentrate on markets where our products and expertise createprofit opportunities for our customers and ourselves.
• Achieve leadership in key product areas through breadth ofoffering, consistent quality, and superior customer service.
• Drive internal growth with new products, line extensions,and new technology.
• Leverage brand equity and capabilities to increase businesswith existing customers and cultivate new ones.
• Investigate complementary acquisitions with potential forlong-term growth.
• Respond to opportunities that present themselves and workto protect that which has been gained.
. . .Supported by Strong Fundamentals to Increase Benefits for Our Customers and Our Shareholders:
• Long-Term Approach to Business
• Consistent Quality
• Multiple Growth Platforms
• Diverse Product Offering
• Complementary Acquisitions
• International Reach
• Brand Strength and Market Leadership
• Broad Distribution Capabilities
• Broad Manufacturing Capabilities
• Superior Customer Service
• Product Innovation
A Note About the Annual ReportEach year we work to make the Annual Report more interesting and to reduce production costs without sacrificing content and quality. In fact, this year’sbook cost more than 25 percent less to produce than the 2001 Report. We hope that you will find our presentation this year — “Contributing Value inNiche Markets” — to be very informative as we highlight the strength of our brands and the benefits their products bring to diverse areas of business.
Designed and produced in-house by Myers Industries, Inc.

1293 South Main Street, Akron, Ohio 44301 | Tel: (330) 253-5592 | Fax: (330) 761-6156 | www.myersind.com
69 years of Growth. . . Our 31st year as a public company.
© 2003 Myers Industries, Inc. Form No.702202 - 03/03 - 14M