Embed Size (px)
Citation preview

1
Overview of Chinese Taipei Energy Sector - Current Status
and Plans of Future Development
Dr. Yophy Huang
October 31, 2007

2
I. Preface
II. Energy Supply / Demand
III. Major Energy Policy
IV. Challenges
Contents

3

4
1. Densely populated island with limited natural resources
• Population : 23 million• Area : 36,000 km2
• Landscape : 2/3 mountain

5
2. Economy(1986-2006) – 1/2
• Agriculture dropped from 6% to 2% of the GDP• Industry dropped from 47% to 25%• Services rose from 47% to 73%• GDP rose from US$76.9 billion to US$355.6 billion• Per capita GNP increased from US$4,071 to
US$16,098• Foreign trade increased from US$64.0 billion to
US$427.0 billion

6
2. Economy(1986-2006) – 2/2
Foreign Trade (At Current Prices)

7

8
98% of total energy is imported crude oil, the major portion of energy supply, 80% from the Middle
East In 2006, 91% is fossil energy.
1. 1. Energy SupplyEnergy Supply Structure - 1/4 Structure - 1/4
Gas8%
Coal32%Coal32%
Oil51%
Nuclear7%
Dependence on Imported Energy: 89.3% 95.9% 98.0%
1986 1996 2006
Renewables 2%

9
1. 1. Energy SupplyEnergy Supply Structure - 2/4 Structure - 2/4

10
1. 1. Energy SupplyEnergy Supply Structure ChangesStructure Changes -- 3/43/4
1986-2006• Coal’s share increased from 21% to 32%• Petroleum decreased from 53% to 51%• Natural gas increased from 3% to 8%• Hydropower decreased from 5% to 2%• Nuclear power decreased from 16% to 7%• Coal was the main energy source before 1966, but
oil replaced it as the major energy source as of 1967.

11
1. 1. Energy SupplyEnergy Supply Growth RatesGrowth Rates 4/44/4
Item
1986 1996 2006 1986-2006
Million KLOE
% Million KLOE
% Million KLOE
% Growth Rate %
Total Supply 41.6 100 83.3 100 138.4 100 6.2
Indigenous 4.3 12 3.3 4 2.5 2 -2.8
Imported 37.3 88 80.0 96 135.9 98 6.7
Petroleum 22.9 62 44.5 53 70.5 51 5.8
Coal 8.9 18 22.5 27 44.4 32 8.3
LNG - - 3.8 5 11.2 8 -
Natural Gas 1.2 4 0.9 1 0.5 0 -4.7
Hydro Power 1.8 3 2.2 3 2.0 1 0.4
Nuclear Power
6.7 13 9.4 11 9.9 7 2.0
Geothermal, Solar and Wind
0.0 0 0.0 0 0.0 0 -

12
1.1 1.1 Electricity SupplyElectricity Supply Structure - 1/2 Structure - 1/2
• MAIN ENERGY SUPPLY SYSTEM

13
1.1 1.1 Electricity SupplyElectricity Supply Structure – 2/2 Structure – 2/2
• 1986-2006 (Taipower + IPPs)– Average annual growth rate of Power Generation : 6.9%– Average annual growth rate of total installed capacity :
5.1%
235.5Wh
Coal38.7%Coal
38.7%
Gas16.8%
Nuclear16.9%
Hydro3.4%
Oil6.1%
Cogeneration18.0%

14
1.1 1.1 ElectricityElectricity Supply by Supply by TaipowerTaipower – 1/3 – 1/3
1. By the end of 2006, Taipower had a total of 74 power plants.
2. The total installed capacity of Taipower was 30,045 MW.
3. The peak load was 32,060 MW.
4. Power generation by Taipower totaled 156.0 TWh.
5. Total electricity consumption in 2006 amounted to 2,214 TWh.

15
1.1 1.1 ElectricityElectricity Supply by Taipower - 2/3 Supply by Taipower - 2/3
Item1986 1996 2006 1986-2006
GWh % GWh % GWh % Growth Rate %
Taipower 61,590 100 126,956 100 155,999 100 4.8
Hydro 7,419 12 9,044 7 7,939 5 0.3
Thermal 27,231 44 80,124 63 108,189 69 10.1
Coal-Fired 19,743 32 49,094 39 68,794 44 6.4
Oil-Fired 7,488 12 25,090 20 14,465 9 3.3
Gas-Fired 0 - 5,940 4 24,930 16 -
Nuclear 26,941 44 37,788 30 39,871 26 2.0
Wind - - - - 275.9 0 -
IPP - - 0 - 36,809 - -
Cogeneration - - 15,006 - 42,225 - -

16
1.1 1.1 ElectricityElectricity Supply Supply of nuclear power plants – 3/3
Nuclear I Nuclear II Nuclear III Nuclear IV
No. of Generators
2 2 2 2
Generator Capacity
636/MWe 985/MWe 951/MWe 1350/MWe
Reactor Model BWR BWR PWR ABWR
Commencement of Construction
1971 、 1972
1974 1978 1997
Commencement of Commercial
Operation
1978 、 1979
1981 、 1983
1984 、 1986
???

17
1.2 Coal 1.2 Coal SupplySupply

18
2. Energy 2. Energy Demand Demand – 1/3– 1/3

19
2. Energy 2. Energy Demand Demand – 2/3– 2/3
• Structure of Energy Consumption (By Consuming Sector)
• Structure of Energy Consumption (By Energy Form)

20
2. Energy 2. Energy Demand Demand – 3/3– 3/3
Item
1986 1996 2006 1986-2006
Million KLOE
% Million KLOE
% Million KLOE
% Growth Rate
%
Domestic Consumption
37.7 100 70.2 100 109.9 100 5.5
1.Industrial Sector 23.1 61 37.1 53 62.9 57 5.1
2.Transportation Sector
5.1 14 12.8 18 16.7 15 6.1
3.Residential Sector
4.3 11 8.9 13 13.2 12 5.8
Agricultural Sector
1.2 3 1.5 2 1.3 1 0.2
Commercial Sector
1.0 3 3.6 5 6.8 6 10.3
Others 2.5 7 4.6 7 7.0 7 5.3
Non-energy Use 0.6 1 1.5 2 2.0 2 6.6

21
2.1 2.1 CoalCoal Consumption 1/3 Consumption 1/3
• Coal Consumption by Sector:
1. 77% for power generation
2. 12% for iron and steel production
3. 3% for cement production
4. 8% for other uses • Consumption by Types of Coal Product:
1. Steam coal: 92%
2. Coking coal: 8%

22
2.1 2.1 CoalCoal Consumption 2/3 Consumption 2/3
77%
12%
3%8%
power generation
iron and steel production
cement production
other uses

23
2.2 2.2 CoalCoal Consumption 3/3 Consumption 3/3
• Coal consumption
Item
1986 1996 2006 1986-2006
103 Tons
%103
Tons%
103 Tons
%Growth
Rate %
Total Consumption
13,476 100 30,054 100 61,728 100 7.9
1.Power Generation
7,259 54 19,823 66 47,463 77 9.8
2.Iron and Steel
2,783 21 4,825 16 7,147 12 4.8
3.Cement 1,978 14 2,707 9 2,371 3 0.9
4.Others 1,456 11 2,699 9 4,747 8 6.1

24
2.3 2.3 PetroleumPetroleum Consumption– 1/3 Consumption– 1/3
• The consumption in 2006 totaled 47.26 million KLOE, by sector as follows:
1. 44% for industrial use2. 34% for transportation3. 11% for power generation3. 3% for residential use4. 1% for agricultural us5. 1% for commercial use6. 2% for other uses7. 4% for non-energy uses

25
2.3 2.3 PetroleumPetroleum Consumption– 2/3 Consumption– 2/3
44%
34%
11%
11%
industrial use
transportation
power generation
others
26
2.3 2.3 PetroleumPetroleum Consumption– 3/3 Consumption– 3/3
Item1986 1996 2006 1986-2006
MLOE % MLOE % MLOE % Growth Rate %
Total Consumption
20,696 100 37,135 100 47,259 100 4.2
1.Industrial 10,024 48 12,663 34 20,632 44 3.7
2.Transportation 5,038 24 12,708 34 16,289 34 6.0
3.Power Generation
1,877 9 6,708 18 5,066 11 5.1
Residential 1,111 5 1,429 4 1,396 3 1.1
Agricultural 893 4 1,000 3 615 1 -1.9
Commercial 105 1 197 1 597 1 9.1
Others 1,094 6 982 2 779 2 -1.7
Non-energy Uses
554 3 1,447 4 1,884 4 6.3

27
2.4 2.4 Natural GasNatural Gas Consumption– 1/3 Consumption– 1/3
• Natural gas consumption in 2006 totaled 10.29 billion cubic meters, breakdown by use as follows:
• 76% for power generation• 12% for industrial use• 9% for residential use• 3% for commercial and others use

28
2.4 2.4 Natural GasNatural Gas Consumption– 2/3 Consumption– 2/3
76%
12%
9% 3%power generation
industrial use
residential use
commercial and othersuse

29
2.4 2.4 Natural GasNatural Gas Consumption– 3/3 Consumption– 3/3
Item
1986 1996 2006 1986-2006
106m3 % 106m3 % 106m3 % Growth Rate %
Total Consumption
1,021 100 4,242 100 10,295 100 12.2
Power Generation
- - 1,524 36 7,816 76 -
Industrial 468 46 1,818 43 1,259 12 5.1
Residential 457 45 729 17 916 9 3.5
Commercial & Others
96 9 171 4 304 3 5.9

30
2.5 Electricity Consumption – 1/22.5 Electricity Consumption – 1/2
58%19%
10%
2%
11% Industrial
Residential
Commercial
Agricultural&Transportation
Others

31
2.5 Electricity Consumption – 2/22.5 Electricity Consumption – 2/2
Item1986 1996 2006 1986-2006
GWh % GWh % GWh % Growth Rate %
Total Consumption 57,669 100 128,757 100 221,369 100 6.9
Industrial 36,800 64 70,218 55 127,406 58 6.4
Residential 10,779 19 27,580 21 42,464 19 7.1
Commercial 3,070 5 13,342 10 23,212 10 10.6
Agricultural &Transportation
1,721 3 2,736 2 4,092 2 4.4
Others 5,299 9 14,881 12 24,195 11 7.9

32
2.6 Energy consumption & CO2 emission
Sources : 1. Bureau of Energy, MOE, Chinese Taipei 2. Carbon Dioxide Information Analysis Center

33
3. Energy Supply and Demand 3. Energy Supply and Demand Projection – 1/3Projection – 1/3Item 2004 2010 2020 2004-2020
MillionKLOE
% MillionKLOE
% Million KLOE
% Growth Rate(%)
Total Supply 129.1 100 147.2 100 173.9 100 2.1
Indigenous 12.2 9 39.5 27 45.6 26 18.3
Imported 116.9 91 107.7 73 128.3 74 0.5
Coal 43.5 34 44.2 30 64.3 37 2.9
Petroleum 63.5 49 63.8 43 56.3 32 -0.5
Natural Gas 0.8 1 0.7 0 0.7 0 -1.2
LNG 9.9 8 18.2 12 29.0 17 7.9
Pumped Storage Hydro 1.0 1 1.0 1 0.9 1 -0.6
Nuclear Power 9.8 8 14.3 10 12.0 7 1.3
Renewable Energy 0.6 0 5.0 3 10.7 6 17.4
Domestic Consumption 107.6 100 123.9 100 146.3 100 2.1
Coal 10.8 10 13.0 11 15.9 11 2.1
Petroleum 42.2 39 41.8 34 36.8 25 -0.5
Natural Gas 2.4 2 3.0 2 3.3 2 1.9
Electricity 51.5 48 61.1 49 79.5 54 2.9
Renewable Energy 0.6 1 5.0 4 10.7 7 17.4

34
3. Energy Supply 3. Energy Supply Projection – 2/3Projection – 2/3
-5
0
5
10
15
20
Total
Supp
ly C
oal
Petro
leum
Natu
ral G
as LNG
Pumpe
d Stor
age H
ydro
Nuclea
r Pow
er
Renew
able
Energ
y
35
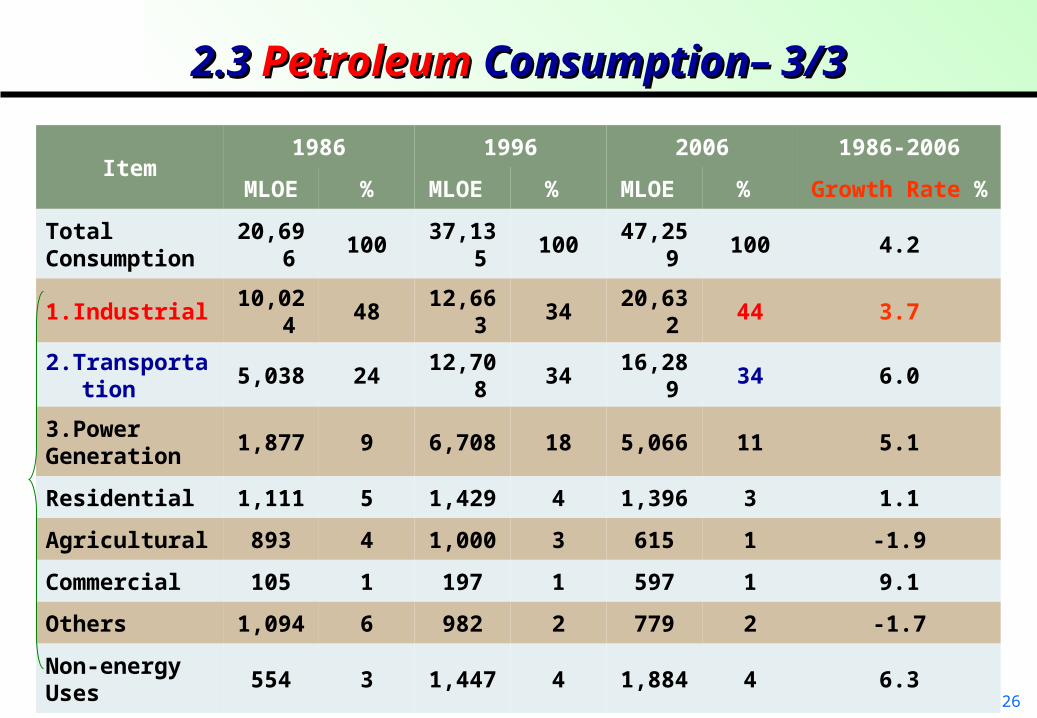
3. Energy Demand 3. Energy Demand Projection – 3/3Projection – 3/3
-202468
101214161820
Domest
ic Co
nsumpti
on C
oal
Petro
leum
Natu
ral G
as
Elect
ricity
Renew
able
Energ
y
36

37
1. 1. FrameworkFramework of the Energy Policy of the Energy Policy
Background Changes in Foreign &Domestic Energy Situation
Trend towardLiberalization of the
Energy Industry
Increased EnvironmentalProtection Pressure
PolicyGuidelines
StabilizingEnergySupply
PromotingEnergy
Efficiency
DeregulatingEnergy
Enterprises
EnhancingEnergy
Safety andEnvironmental
Protection
ReinforcingEnergy
Research andDevelopment
PromotingEnergy
Education andDissemination
Energy Policy
OverallObjectives Liberalized, Orderly, Efficient, and Clean Energy
Supply and Demand System

38
2. Energy Policy 2. Energy Policy ContentsContents – 1/6 – 1/6
• Stabilizing Energy Supply
1. Intensification of integrated energy planning.
2.Diversification of kinds and sources of primary energy.
3.Precise stipulation of energy safety reserve.
4.Promotion of energy-related mines exploration, development and investment.

39
2. Energy Policy Contents – 2/62. Energy Policy Contents – 2/6
• Promoting Energy Efficiency
1.Enhancement of energy productivity.
2.Stress on energy conservation.
3.Laissez faire determination of market mechanism.
4.Reasonable reflection of social costs in energy prices.

40
2. Energy Policy Contents – 3/62. Energy Policy Contents – 3/6
• Deregulating Energy Enterprises
1.Review and revision of laws and regulations governing energy related enterprises in order to establish a fair and competitive environment.
2.Promotion of the liberalization and privatization of energy-related enterprises.

41
2. Energy Policy Contents – 4/62. Energy Policy Contents – 4/6
• Enhancing Environmental protection
1.Active introduction and production of clean energy.
2.Promotion of high efficiency burners and pollution prevention equipment and technology.
3.Mitigating the greenhouse effect to cope with international environmental protection.

42
2. Energy Policy Contents – 5/62. Energy Policy Contents – 5/6
• Reinforcing Energy Research and Development
1. Promoting R&D on energy conservation technologies.
2. Promoting R&D in renewable energy and utilization on a cost effective basis.
3. Strengthening international cooperation and information interchange.

43
2. Energy Policy Contents – 6/62. Energy Policy Contents – 6/6
• Promoting Energy Education and Dissemination
1.Fostering correct energy concepts.
2.Promoting energy education.
3.Training energy professionals.

44
3. Key 3. Key ProspectsProspects in Energy Policy in Energy Policy
Enhance regional
cooperation
StabilityStabilityStabilityStability
EfficiencyEfficiency
SustainabilitySustainability
CleanlinessCleanliness
Energy Energy SecuritySecurityEnergy Energy SecuritySecurity
Maintain a balance of economy, environment and energy
Expand technology capability
Promote Renewable energy
Support green energy industries
Improve energy efficiency
Enhance price mechanism
Improve energy diversity

45
4 The 4 The Main ItemsMain Items of Energy Policy – 1/9 of Energy Policy – 1/9
A. Promotion of Energy Diversification Diversification of Energy Use
coal oil natural gas nuclear renewable energy
2006 32% 51% 8% 7% 2%
2020 40-42% 32% 14-18% 7% 4-6%
Diversification of Energy Suppliers
-decreasing the dependence on the oil imported from the Middle East
-enhancing energy cooperation with other energy suppliers
The use of natural gas will increase significantly

46
4 The 4 The Main ItemsMain Items of Energy Policy – 2/9 of Energy Policy – 2/9
B. Enhancement of Energy Conservation
Expansion of energy conservation te
chnical services (ESCOs) Key Strategies
Implementation of energy efficiency management(E
EM)
self-initiated energy
conservation by industries
Popularization of the use of high-
efficiency products
Education and guidance
GoalThe goal for energy efficiency and energy productivity improvement is set at over 2% per annum.

47
4. The Main Items of Energy Policy – 3/94. The Main Items of Energy Policy – 3/9
2006 2010
Current Status Targets
Year
Renewables
Installed Capacity (MW)
Share of total (%)
Installed Capacity (MW)
Share of total (%)
1. Hydropower 1,911 4.13 2,168 4.22
2. Wind Power 187.7 0.41 2,159 4.20
3. Solar Photovoltaic 1.306 0.00 21 0.04
4. Geothermal - - 50 0.10
5. Biomass 619.3 1.34 741 1.44
Total 2,719 5.88 5,139 10.0
Target share for renewable energy in terms of installed capacity of the total
5.88% 10.0%
Targets and Current StatusTargets and Current Status
C. Development of Renewable Energy

48
4. The Main Items of Energy Policy – 4/94. The Main Items of Energy Policy – 4/9
Wind Power
•Current Status: 187.7MW
• Targets: 2,159 MW by 2010
•Strategies: Review incentive measures for enhancing the development of wind energy.
Mailiao: 2.64 MW Chungtun: 2.4 MW Chupei: 3.5 MW

49
4. The Main Items of Energy Policy – 5/94. The Main Items of Energy Policy – 5/9
Solar Photovoltaic Systems
•Current Status: 1.306MW
•Targets: 21 MW by 2010•Strategies:
Promote demonstration projects such as the Solar City.
Establish solar PV systems in remote areas
Develop PV industries.
Presidential Hall: 10.5kW• Annual generation:1,100 kWh/kW
Southern Taiwan U. of Tech: 10 kW
• Annual generation: 1,300kWh/kW
Penghu County Hall: 3 kW• Annual generation: 1,200kWh/kW
A household: 4.2 kW• Annual generation: 1,100 kWh/kW

50
4. The Main Items of Energy Policy – 6/94. The Main Items of Energy Policy – 6/9
Hydropower
•Current status : 1,911 MW
•Targets: 2,168MW by 2010 •Strategies:
Promote 5 hydropower generation projects by Taipower, with total installed capacity of 171MW.
Promote 6 hydropower generation projects by private sectors, with total installed capacity of 72 MW.

51
4. The Main Items of Energy Policy – 6/94. The Main Items of Energy Policy – 6/9
Geothermal Energy
•Current Status: A BOT project at Qing-Shui aims at the integration of geothermal energy usage with recreational facilities.
•Targets: 50 MW by 2010
•Strategies: Facilitate the development of geothermal projects with local governments in finance and technology .
Qing-Shui GeothermalEnergy
E-Land County
52
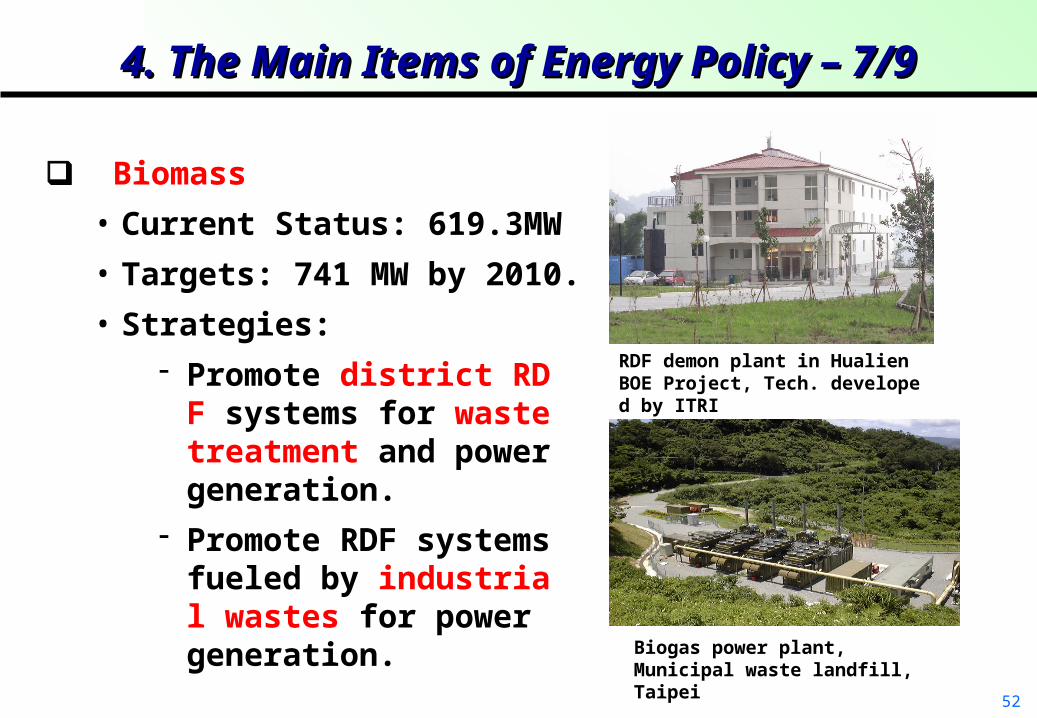
Biomass
• Current Status: 619.3MW
• Targets: 741 MW by 2010.
• Strategies:
Promote district RDF systems for waste treatment and power generation.
Promote RDF systems fueled by industrial wastes for power generation.
RDF demon plant in HualienBOE Project, Tech. developed by ITRI
Biogas power plant,Municipal waste landfill, Taipei
4. The Main Items of Energy Policy – 7/94. The Main Items of Energy Policy – 7/9

53
4. The Main Items of Energy Policy – 8/94. The Main Items of Energy Policy – 8/9
Bio-diesel •Current Status: 3,000 KL (kilolitres) yielded from waste cooking oil in 2005
•Targets: 100 thousand KL (B2 in all stations) by 2010. •Strategies:
Develop production technology for commercialization. Establish Green County Demonstration Program and promotion of
B1-B2 supplied in all filling station by 2010
3,000 kl/yr Bio-diesel demo plant in Chiayi BOE Project, Tech. developed by ITRI
Road-test of bio-diesel truck in Taipei city

54
4. The Main Items of Energy Policy – 9/94. The Main Items of Energy Policy – 9/9
Solar Thermal Water Heater Systems
•Current Status: The installed area of heat collectors has reached 1.47 million m2, the installed household number has reached 360 thousand, and the ratio of installed household is up to 4.27%.
•Targets: Total installation area of 2.15 million m2 (estimated about 540 thousand Installed households) by 2010.
•Strategies: Extend the incentive to building integrated applications.
Diwan College , Tainan CountySolar Thermal Water Heater System Installation area: 307.5m2 (for 450 students)
Hualien College, Hualien CountySolar Thermal Water Heater System Installation area: 77m2 (for 115 students)

55
5. Future Energy Policies and Strategies – 1/95. Future Energy Policies and Strategies – 1/9
(1)(1) Stabilize Energy Supply: enhancing energy cooperation Stabilize Energy Supply: enhancing energy cooperation
and increasing indigenous energy supplyand increasing indigenous energy supplyA.Enhance security scheme of energy supply as well as international
cooperation.
B. Increase indigenous energy supply.
Aggressively promote non-carbon renewable energy:
2010 : 5,130MW.
2020 : 7,000~8,000MW.
To accelerate the enactment of “Renewable Energy Development
Act”.

56
To meet the energy demand & stabilize CO2 concentrations unprecedented technology changes must occur in this century
BiomassBiomass
Wind PowerWind Power
PhotovoltaicsPhotovoltaics
Waste-to-energy generation: 741 MW by 2010.Waste-to-energy generation: 741 MW by 2010.
2,159 MW by 20102,159 MW by 2010
800 MW by 2025. 800 MW by 2025.
Bio-diesel:100,000 KLOE by 2010.Bio-diesel:100,000 KLOE by 2010.
Geothermal, ocean energy, hydrogen and fuel cell are promoted with various programmes.
Geothermal, ocean energy, hydrogen and fuel cell are promoted with various programmes.
5. Future Energy Policies and5. Future Energy Policies and Strategies – 2/9Strategies – 2/9
C. Promotion Targets of non-carbon renewable energy
57
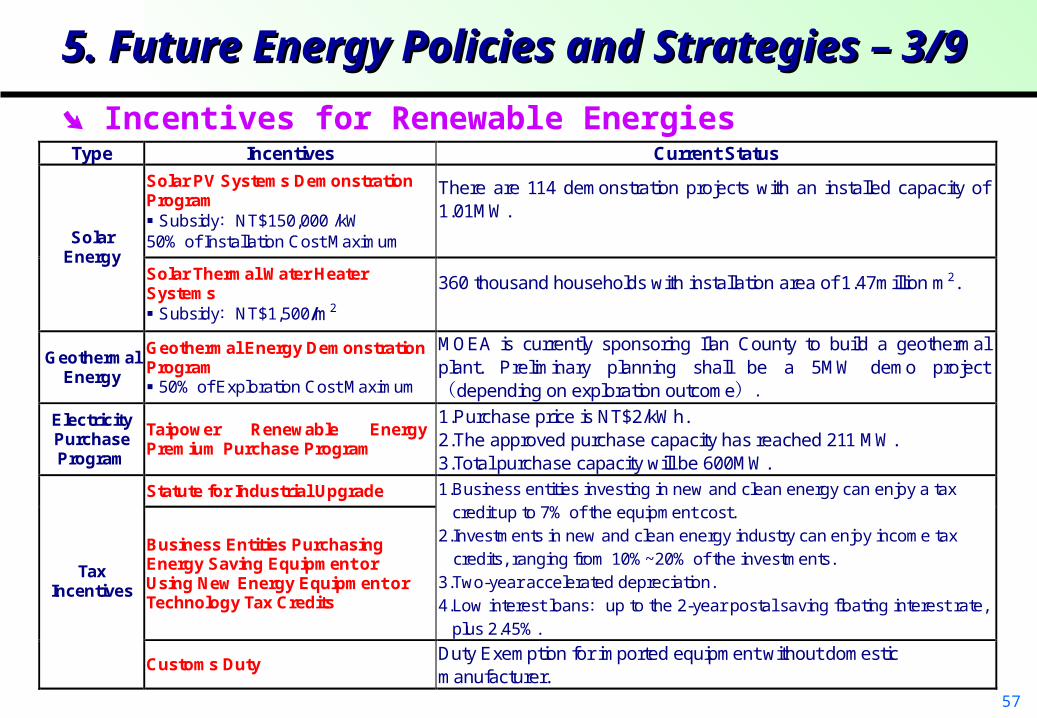
Type Incentives Current Status
Solar PV Systems Demonstration Program
Subsidy:NT$150,000 /kW 50% of Installation Cost Maximum
There are 114 demonstration projects with an installed capacity of 1.01MW.
Solar Energy
Solar Thermal Water Heater Systems Subsidy:NT$1,500/m2
360 thousand households with installation area of 1.47million m2.
Geothermal Energy
Geothermal Energy Demonstration Program 50% of Exploration Cost Maximum
MOEA is currently sponsoring Ilan County to build a geothermal plant. Preliminary planning shall be a 5MW demo project (depending on exploration outcome).
Electricity Purchase Program
Taipower Renewable Energy Premium Purchase Program
1.Purchase price is NT$2/kWh. 2.The approved purchase capacity has reached 211 MW. 3.Total purchase capacity will be 600MW.
Statute for Industrial Upgrade
Business Entities Purchasing Energy Saving Equipment or Using New Energy Equipment or Technology Tax Credits
1.Business entities investing in new and clean energy can enjoy a tax credit up to 7% of the equipment cost.
2.Investments in new and clean energy industry can enjoy income tax credits, ranging from 10%~20% of the investments.
3.Two-year accelerated depreciation. 4.Low interest loans:up to the 2-year postal saving floating interest rate,
plus 2.45%.
Tax Incentives
Customs Duty Duty Exemption for imported equipment without domestic manufacturer.
Incentives for Renewable Energies
5. Future Energy Policies and5. Future Energy Policies and Strategies – 3/9Strategies – 3/9

58
Renewable Energy Development Bill has been submitted to Congress for approval since 2002
The goal of 6,500MW for renewable energies utilization was set
Purchase price for renewable energy shall be reviewed for every fourth year • Wind power (in land): NT$2.0/kWh • Wind power (offshore): NT$2.7/kWh • Bio-energy: NT$2.0/kWh • Geothermal energy: NT$2.7/kWh • Solar Photovoltaics: NT$8~10/kWh with 50% of installation cost maximum
A special-purpose Fund shall be set-up and comes from the following sources • Electricity sectors • Government’s fiscal year budget
5. Future Energy Policies and5. Future Energy Policies and Strategies – 4/9Strategies – 4/9

59
E. Energy Diversity
(a) Expanding the usage of low-carbon energy (i.e.natural gas).
Natural gas consumption is expected to be 13 million tons by 2010,
16~20 million tons by 2020, 20~22million tons by 2025.
Increasing the the capacity factor for gas turbines and constructing new
gas-fired power plants.
Planning the extending construction of infrastructures, such as natural
gas tanks, pipelines and receiving terminals.
(b) Applying clean coal technology.
(c) Completing the project of the fourth nuclear power plant (2,700 MW) and
maintaining the previous nuclear power plants in operation (5,140MW).
5. Future Energy Policies and5. Future Energy Policies and Strategies – 5/9Strategies – 5/9

60
(2)(2) Improve Energy Efficiency: introducing price Improve Energy Efficiency: introducing price mechanism and mechanism and
strengthening efficiency managementstrengthening efficiency management
A. Energy efficiency and energy productivity will increase over 2% per annum.
B. Straighten the energy efficiency standards of electrical appliances and
conduct the mandated energy efficiency labeling system.
C. Assist the Development in Green Energy Industries, such as renewable
energy, energy conservation, and fuel cell industries.
D. Introduce market mechanism and rationalize energy prices.
5. Future Energy Policies and5. Future Energy Policies and Strategies – 6/9Strategies – 6/9

61
E.Improve energy transformation efficiency.
(a) Applying high efficiency power generating equipment. Enhancing efficien
cy of new coal-fired power plants from 35% to 40%, new gas-fired power
generating plants from 45% to 53%.
(b) Developing clean coal technology.
(c) Enhancing transmission and distribution efficiency. Reducing line loss u
nder 5% in the long-term .
F.Continue promotion of co-generation system.
The capacity of co-generation is expected to be 8GW by 2010, and 10GW
by 2025.
5. Future Energy Policies and5. Future Energy Policies and Strategies - 7/9Strategies - 7/9

62
(3) Open Energy Market: liberalizing energy market.(3) Open Energy Market: liberalizing energy market.
A.Remove barriers to market entry from the petroleum market.
B.Continue licensing the establishment of IPPs.
C.Revise “Electricity Act” and legislate “Natural Gas Business Act.”
(4) Emphasize on Environment and Security: balancing the d(4) Emphasize on Environment and Security: balancing the d
evelopment of economy, environment and energyevelopment of economy, environment and energy
A.Energy assessment shall be considered in industrial, environmen
tal, and social-economic projects.
B.Capacity building to cope with GHG emission reduction.
5. Future Energy Policies and5. Future Energy Policies and Strategies – 8/9Strategies – 8/9

63
(5) Increase R&D: expanding technology capability.(5) Increase R&D: expanding technology capability.
A. Expand the budget allocated to energy technology research and
increase its budget share annually.
B. Create National Energy Technology Development Program to promote
the progress of energy R&D in all aspects.
C.Emphasize on energy efficiency improvement, renewable energy
technology, and innovative utilization of traditional energy.
(6) Educate the public: enlarging public participation.(6) Educate the public: enlarging public participation.
Encourage households and local governments to participate in energy
saving and CO2 emission reduction.
5. Future Energy Policies and5. Future Energy Policies and Strategies – 9/9Strategies – 9/9

64

65
Challenges
• Energy prices relatively low• Sensitive to international energy shocks• Liberalization of energy sectors behind schedule• No-Nuke policy contradicts with GHG abatement program• Conflicts between economic development and
environment protection

66
1. Wrong “signaling”
• Subsidies on electricity, water, oil• When international oil prices hike, the government hesitat
es to let market mechanism function on state-run energy enterprises (such as Taipower, China Petrol)
• Sometimes even cut taxes on energy products• Environmental taxes/fees (eg. air pollution fee) only lightl
y levied → dampens the incentives to save energy→Overall energy efficiency is still relatively low→ Hard for the ESCO industry to grow

67
1.1 Comparison of Prices & tax rates on Premium unleaded gasoline
27.6
41.93
54.87
37.22
51.9350.14
21.16
27.59
34.93
52.82
47.14%
121.87%
22.55%
52.34%
186.14%
165.14%170.50%
40.35%
70.53%
114.26%
0
10
20
30
40
50
60
Taiwan
JapanKorea
Singapore
Germany
UK France
USACanada
Avg. World Price
0.00%
20.00%
40.00%
60.00%
80.00%
100.00%
120.00%
140.00%
160.00%
180.00%
200.00%
Price tax rate%

68
1.2 Comparison of Prices & tax rates on Diesel
23.5
32.23
42.26
36.6
27.8
38.07
46.58
36.18
22.43
26.49
31.11
31.48%
49.63%
81.84%
14.34%
4.98%
93.18%
131.85%
81.83%
22.12%
38.50%
69.81%
0
5
10
15
20
25
30
35
40
45
50
Taiwan
JapanKorea
HK Singapore
Germany
UK France
USACanada
World Avg. Price
0.00%
20.00%
40.00%
60.00%
80.00%
100.00%
120.00%
140.00%
Gross price tax rate %

69
1.3 Comparison of tax rates on Fuel Oil
10450
15404.2
17899.9
11653.6
15671.3
11882.5 12169.9 12594
8.68%
6.16%
11.09%12.28%
9.49%
5.00%
23.37%
20.18%
0
2000
4000
6000
8000
10000
12000
14000
16000
18000
20000
Taiwan
JapanKorea
Germany
UK France
Canada
World Avg. Price
0.00%
5.00%
10.00%
15.00%
20.00%
25.00%Gross Price Tax rate %

70
2. Sensitive to international energy shocks
• Adjustment costs high due to the long run low energy prices
• Industry “hollowing out” • Inflationary problems• Energy security• “Energy tax” halted

71
3. Liberalization behind schedule
• Privatization of Taipower far behind schedule• Forcing Taipower to buy electricity from other private IPP
s.• Heavily regulated China Petrol on floating prices

72
4. Nuclear power plants at dispute
Nuclear I Nuclear II Nuclear III Nuclear IV
No. of Generators
2 2 2 2
Generator Capacity
636/MWe 985/MWe 951/MWe 1350/MWe
Reactor Model BWR BWR PWR ABWR
Commencement of Construction
1971 、 1972
1974 1978 1997
Commencement of Commercial
Operation
1978 、 1979
1981 、 1983
1984 、 1986 ???

73
4.1 The fourth nuclear power plant
Year MAJOR EVENTS
1980 The proposal of the 4th Nuke PP project approved by the Cabinet.
1985-1986 After the Chernobyl incident, the Congress froze the budget.
1992-1993 The Cabinet reconsider the 4th Nuke PP project, the Congress reinstate the budget
1997-1999 Taipower submitted its application to the Atomic Energy Council for a plant construction license and got approved
2000-2001 Anti-nuclear DPP won the presidential election, Pro-nuclear premier forced to step down,The 2nd premier announced to halt the construction and withhold its budget, the stock mkt
plunged
2001-2002 Economic growth rate drop to -2.2% (unprecedented)The Grand Justices Council ruled to withhold the budget and and the cabinet must report t
o the congress.
The Cabinet Reinstate the statutory budget and resume the construction
2002~ Construction delayed and the future is still unknown, est. loss over 400 billion NT$

74
4.2 No-Nuke policy dilemma
• Ideological disputes: Experts vs. fundamentalists• Citizen participation without majority support:
60% people disagree with the ruling party• Never legislated• Facts: Stock market and the economy plunged in
2001( -2.2%)• Current status: Re-construction still far behind
schedule• Unanswered question: No-Nuke Program means
more “coal” consumption→ contradicting GHG abatement scheme

75
5. Environment vs. Economy
• Energy authority, under the Ministry of Economic Affairs, ranks lower than EPA
• Sluggish economy vs. environment protection
• “Energy tax” legislation delayed

76
Thank You For Your Attention