Embed Size (px)
Citation preview
1
GOVERNMENT SECURITIES MARKET – QUARTERLY DATA
JANUARY – MARCH 2018
PRIMARY MARKET OF GOVERNMENT SECURITIES
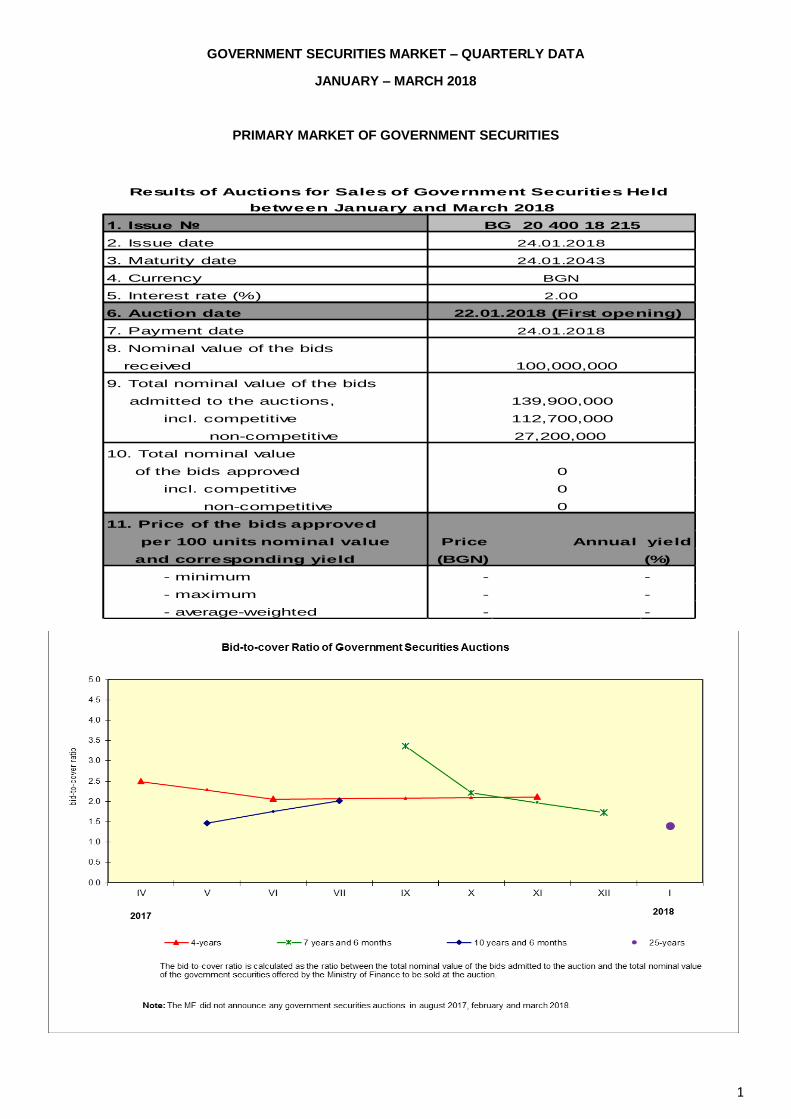
1. Issue №
2. Issue date
3. Maturity date
4. Currency
5. Interest rate (%)
6. Auction date
7. Payment date
8. Nominal value of the bids
received 100,000,000
9. Total nominal value of the bids
admitted to the auctions,
incl. competitive
non-competitive 27,200,000
10. Total nominal value
of the bids approved
incl. competitive
non-competitive
11. Price of the bids approved
per 100 units nominal value Price Annual yield
and corresponding yield (BGN) (%)
- minimum - -
- maximum - -
- average-weighted - -
0
0
24.01.2043
BGN
22.01.2018 (First opening)
24.01.2018
2.00
139,900,000
24.01.2018
112,700,000
0
Results of Auctions for Sales of Government Securities Held
between January and March 2018
BG 20 400 18 215
2
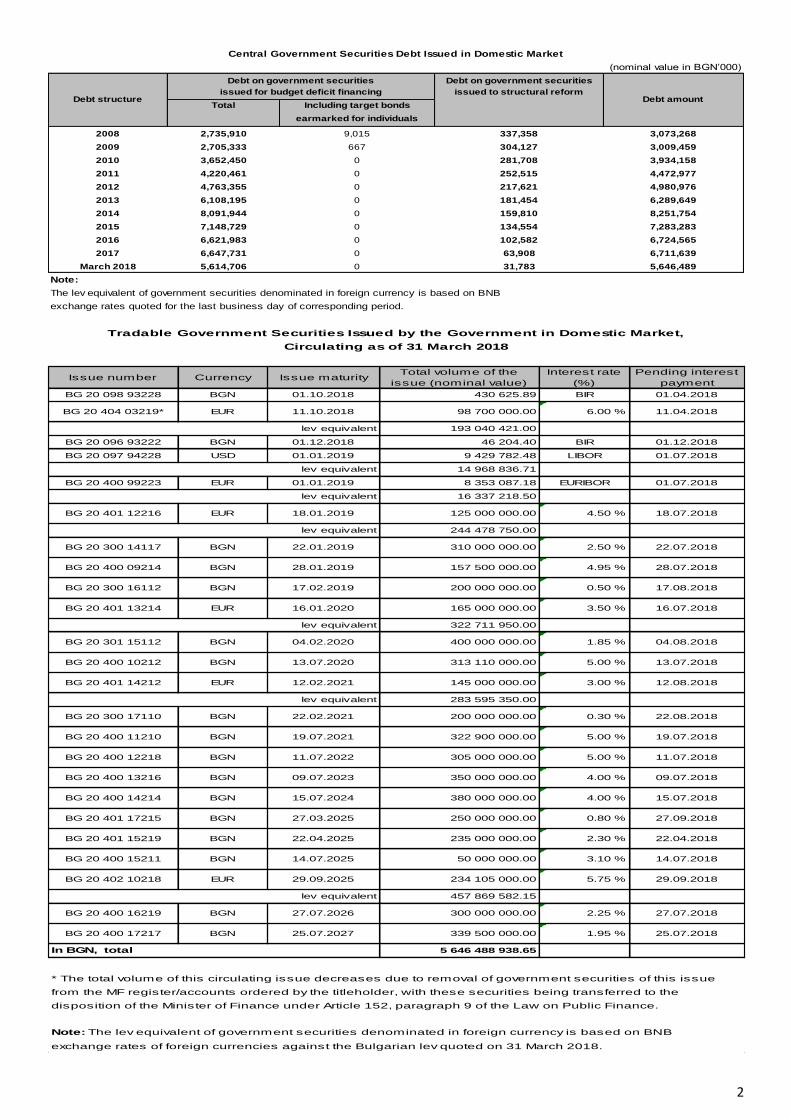
(nominal value in BGN’000)
Debt on government securities
issued to structural reform
Total Including target bonds
earmarked for individuals
2008 2,735,910 9,015 337,358 3,073,268
2009 2,705,333 667 304,127 3,009,459
2010 3,652,450 0 281,708 3,934,158
2011 4,220,461 0 252,515 4,472,977
2012 4,763,355 0 217,621 4,980,976
2013 6,108,195 0 181,454 6,289,649
2014 8,091,944 0 159,810 8,251,754
2015 7,148,729 0 134,554 7,283,283
2016 6,621,983 0 102,582 6,724,565
2017 6,647,731 0 63,908 6,711,639
March 2018 5,614,706 0 31,783 5,646,489
Note:
The lev equivalent of government securities denominated in foreign currency is based on BNB
exchange rates quoted for the last business day of corresponding period.
Central Government Securities Debt Issued in Domestic Market
Debt on government securities
issued for budget deficit financingDebt structure Debt amount
Issue number Currency Issue maturityTotal volume of the
issue (nominal value)
Interest rate
(%)
Pending interest
payment
BG 20 098 93228 BGN 01.10.2018 430 625.89 BIR 01.04.2018
BG 20 404 03219* EUR 11.10.2018 98 700 000.00 6.00 % 11.04.2018
193 040 421.00
BG 20 096 93222 BGN 01.12.2018 46 204.40 BIR 01.12.2018
BG 20 097 94228 USD 01.01.2019 9 429 782.48 LIBOR 01.07.2018
14 968 836.71
BG 20 400 99223 EUR 01.01.2019 8 353 087.18 EURIBOR 01.07.2018
16 337 218.50
BG 20 401 12216 EUR 18.01.2019 125 000 000.00 4.50 % 18.07.2018
244 478 750.00
BG 20 300 14117 BGN 22.01.2019 310 000 000.00 2.50 % 22.07.2018
BG 20 400 09214 BGN 28.01.2019 157 500 000.00 4.95 % 28.07.2018
BG 20 300 16112 BGN 17.02.2019 200 000 000.00 0.50 % 17.08.2018
BG 20 401 13214 EUR 16.01.2020 165 000 000.00 3.50 % 16.07.2018
322 711 950.00
BG 20 301 15112 BGN 04.02.2020 400 000 000.00 1.85 % 04.08.2018
BG 20 400 10212 BGN 13.07.2020 313 110 000.00 5.00 % 13.07.2018
BG 20 401 14212 EUR 12.02.2021 145 000 000.00 3.00 % 12.08.2018
283 595 350.00
BG 20 300 17110 BGN 22.02.2021 200 000 000.00 0.30 % 22.08.2018
BG 20 400 11210 BGN 19.07.2021 322 900 000.00 5.00 % 19.07.2018
BG 20 400 12218 BGN 11.07.2022 305 000 000.00 5.00 % 11.07.2018
BG 20 400 13216 BGN 09.07.2023 350 000 000.00 4.00 % 09.07.2018
BG 20 400 14214 BGN 15.07.2024 380 000 000.00 4.00 % 15.07.2018
BG 20 401 17215 BGN 27.03.2025 250 000 000.00 0.80 % 27.09.2018
BG 20 401 15219 BGN 22.04.2025 235 000 000.00 2.30 % 22.04.2018
BG 20 400 15211 BGN 14.07.2025 50 000 000.00 3.10 % 14.07.2018
BG 20 402 10218 EUR 29.09.2025 234 105 000.00 5.75 % 29.09.2018
457 869 582.15
BG 20 400 16219 BGN 27.07.2026 300 000 000.00 2.25 % 27.07.2018
BG 20 400 17217 BGN 25.07.2027 339 500 000.00 1.95 % 25.07.2018
5 646 488 938.65
* The total volume of this circulating issue decreases due to removal of government securities of this issue
from the MF register/accounts ordered by the titleholder, with these securities being transferred to the
disposition of the Minister of Finance under Article 152, paragraph 9 of the Law on Public Finance.
Note: The lev equivalent of government securities denominated in foreign currency is based on BNB
exchange rates of foreign currencies against the Bulgarian lev quoted on 31 March 2018.
lev equivalent
lev equivalent
lev equivalent
lev equivalent
In BGN, total
Tradable Government Securities Issued by the Government in Domestic Market,
Circulating as of 31 March 2018
lev equivalent
lev equivalent
lev equivalent
3
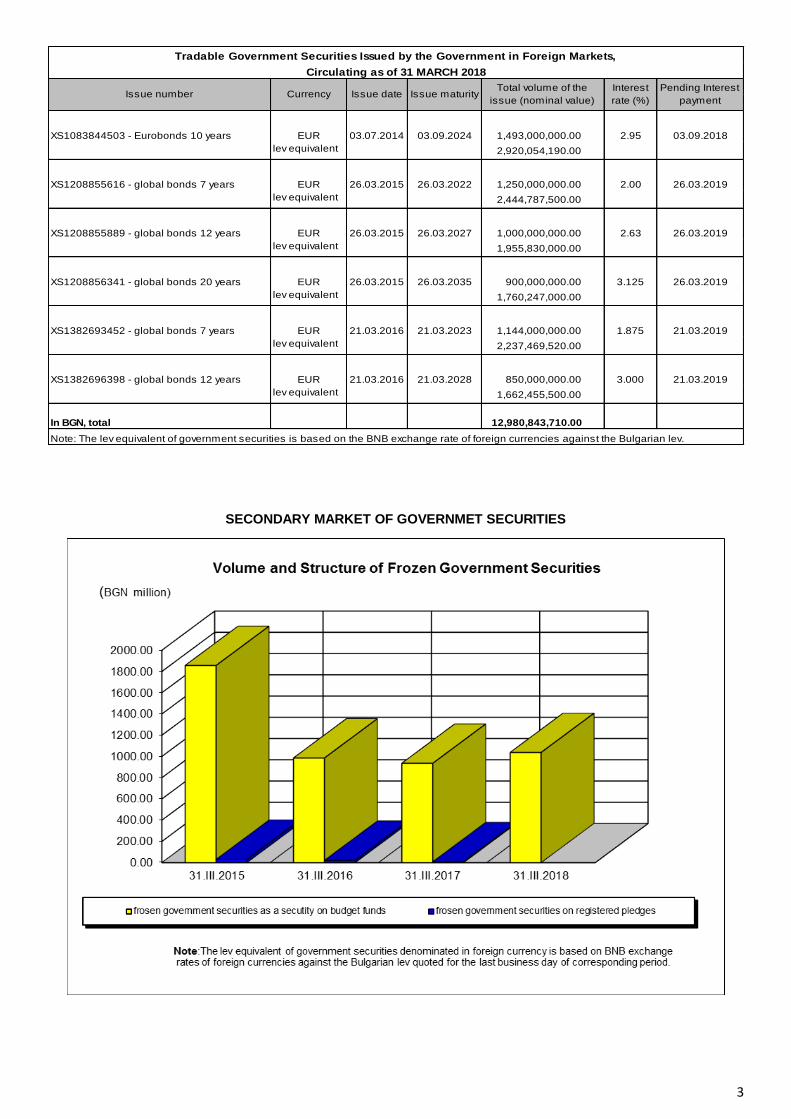
SECONDARY MARKET OF GOVERNMET SECURITIES
XS1083844503 - Eurobonds 10 years EUR 03.07.2014 03.09.2024 1,493,000,000.00 2.95 03.09.2018
lev equivalent 2,920,054,190.00
XS1208855616 - global bonds 7 years EUR 26.03.2015 26.03.2022 1,250,000,000.00 2.00 26.03.2019
lev equivalent 2,444,787,500.00
XS1208855889 - global bonds 12 years EUR 26.03.2015 26.03.2027 1,000,000,000.00 2.63 26.03.2019
lev equivalent 1,955,830,000.00
XS1208856341 - global bonds 20 years EUR 26.03.2015 26.03.2035 900,000,000.00 3.125 26.03.2019
lev equivalent 1,760,247,000.00
XS1382693452 - global bonds 7 years EUR 21.03.2016 21.03.2023 1,144,000,000.00 1.875 21.03.2019
lev equivalent 2,237,469,520.00
XS1382696398 - global bonds 12 years EUR 21.03.2016 21.03.2028 850,000,000.00 3.000 21.03.2019
lev equivalent 1,662,455,500.00
In BGN, total 12,980,843,710.00
Note: The lev equivalent of government securities is based on the BNB exchange rate of foreign currencies against the Bulgarian lev.
Tradable Government Securities Issued by the Government in Foreign Markets,
Circulating as of 31 MARCH 2018
Issue number Currency Issue date Issue maturityTotal volume of the
issue (nominal value)
Interest
rate (%)
Pending Interest
payment
4
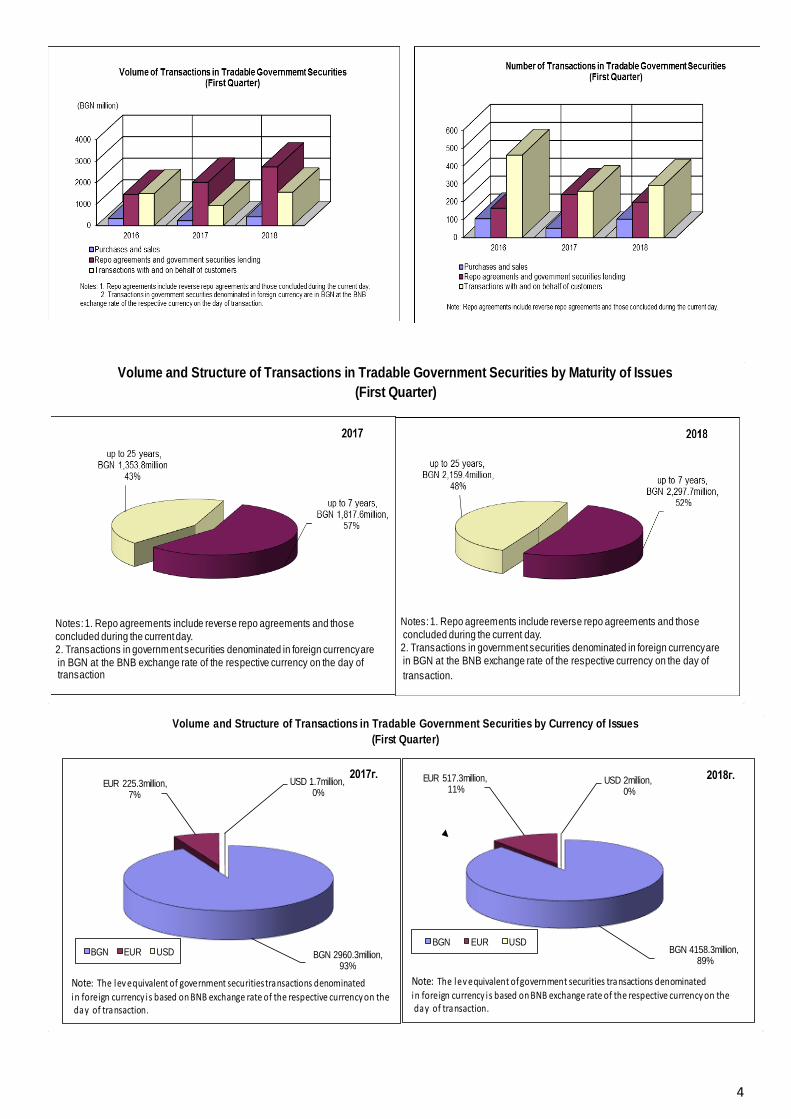
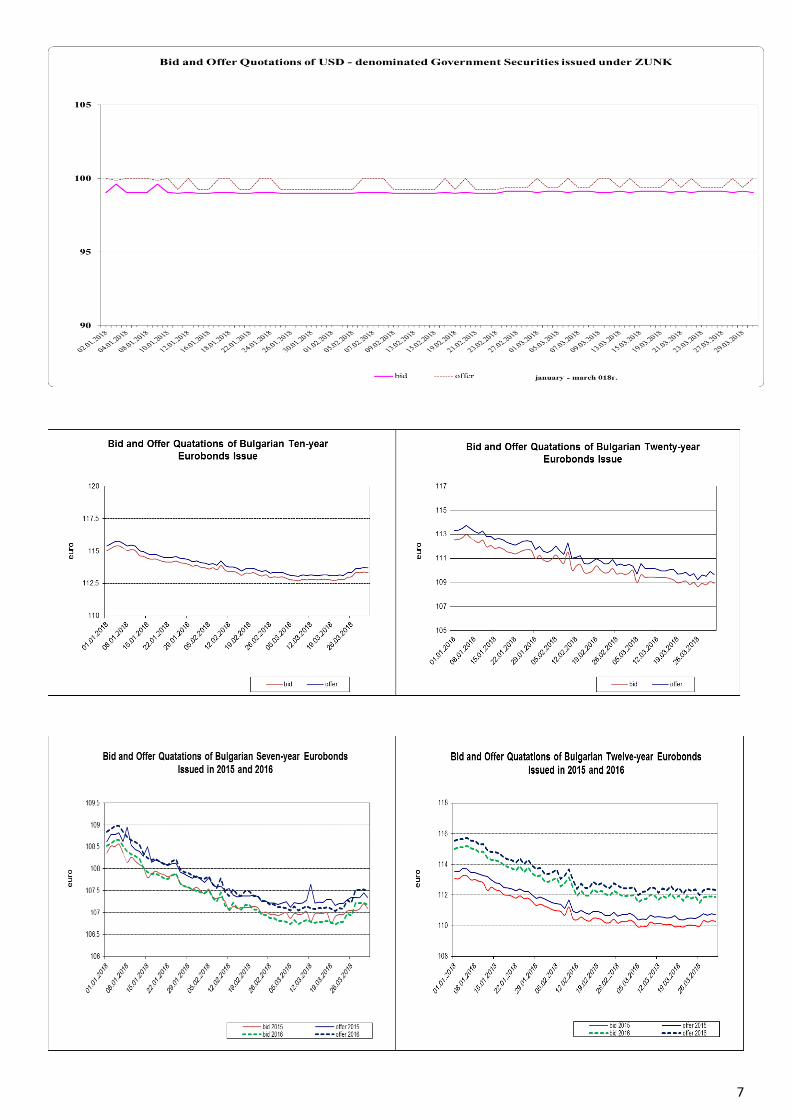
Volume and Structure of Transactions in Tradable Government Securities by Maturity of Issues
(First Quarter)
Notes: 1. Repo agreements include reverse repo agreements and thoseconcluded during the current day.2. Transactions in government securities denominated in foreign currency arein BGN at the BNB exchange rate of the respective currency on the day of transaction
Notes: 1. Repo agreements include reverse repo agreements and thoseconcluded during the current day.2. Transactions in government securities denominated in foreign currency arein BGN at the BNB exchange rate of the respective currency on the day of
transaction.
Volume and Structure of Transactions in Tradable Government Securities by Currency of Issues
(First Quarter)
BGN 4158.3million,89%
EUR 517.3million,11%
USD 2million,0%
2018г.
BGN EUR USD
Note: The lev equivalent of government securities transactions denominated in foreign currency is based on BNB exchange rate of the respective currency on theday of transaction.
BGN 2960.3million, 93%
EUR 225.3million, 7%
USD 1.7million,0%
2017г.
BGN EUR USD
Note: The lev equivalent of government securities transactions denominated
in foreign currency is based on BNB exchange rate of the respective currency on theday of transaction .
5
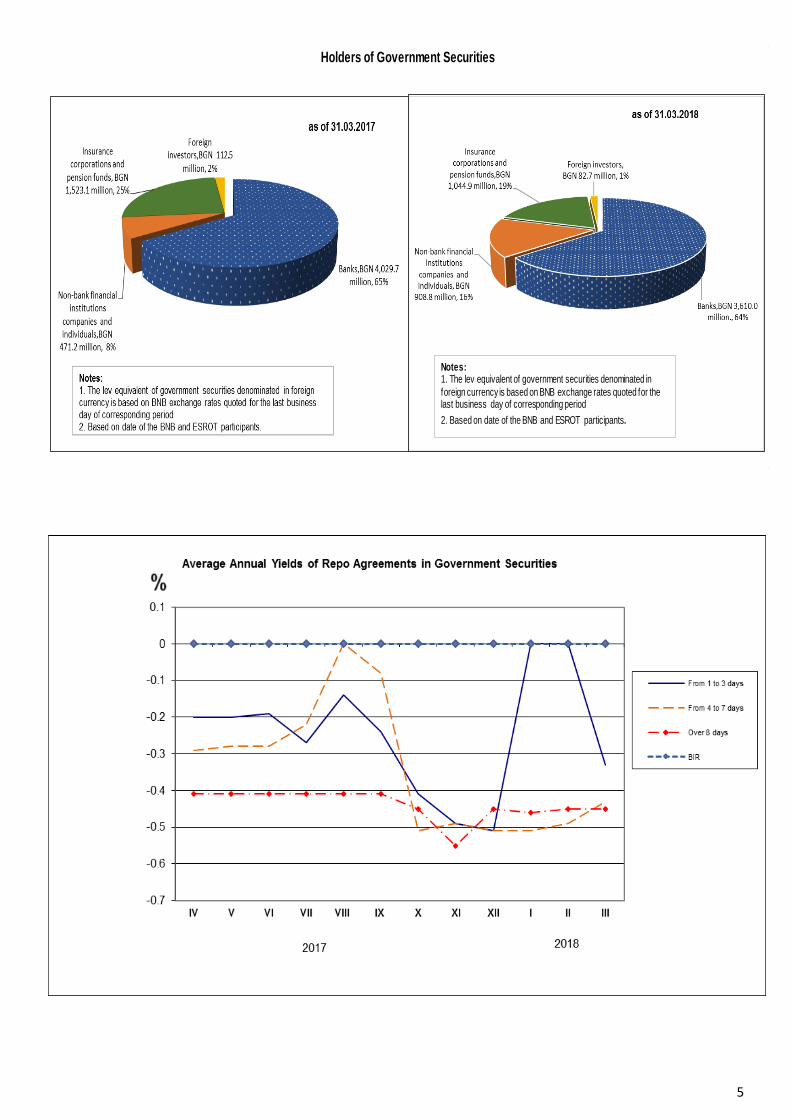
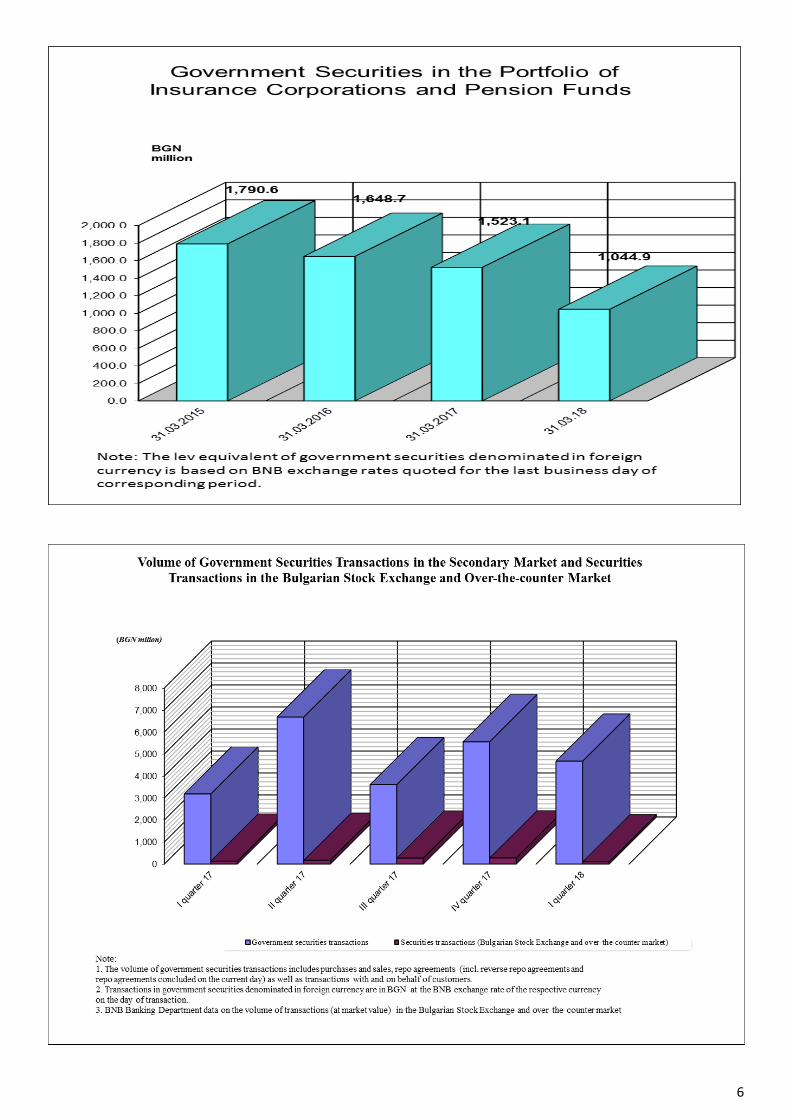
Holders of Government Securities
Notes:1. The lev equivalent of government securities denominated in
foreign currency is based on BNB exchange rates quoted for the last business day of corresponding period
2. Based on date of the BNB and ESROT participants.
6
7
8
9
Participant's
Code Name
SWIFT
address
Primary dealer*-
GSAS participant Sub-depositary
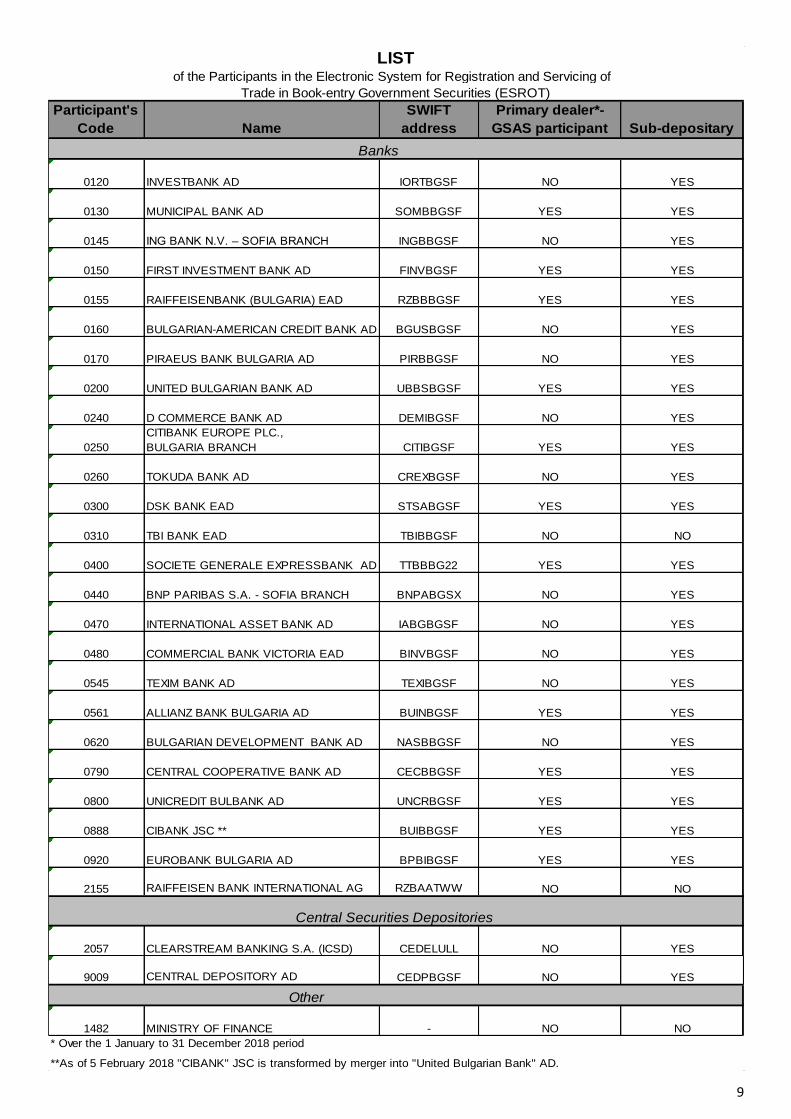
0120 INVESTBANK AD IORTBGSF NO YES
0130 MUNICIPAL BANK AD SOMBBGSF YES YES
0145 ING BANK N.V. – SOFIA BRANCH INGBBGSF NO YES
0150 FIRST INVESTMENT BANK AD FINVBGSF YES YES
0155 RAIFFEISENBANK (BULGARIA) EAD RZBBBGSF YES YES
0160 BULGARIAN-AMERICAN CREDIT BANK AD BGUSBGSF NO YES
0170 PIRAEUS BANK BULGARIA AD PIRBBGSF NO YES
0200 UNITED BULGARIAN BANK AD UBBSBGSF YES YES
0240 D COMMERCE BANK AD DEMIBGSF NO YES
0250
CITIBANK EUROPE PLC.,
BULGARIA BRANCH CITIBGSF YES YES
0260 TOKUDA BANK AD CREXBGSF NO YES
0300 DSK BANK EAD STSABGSF YES YES
0310 TBI BANK EAD TBIBBGSF NO NO
0400 SOCIETE GENERALE EXPRESSBANK AD TTBBBG22 YES YES
0440 BNP PARIBAS S.A. - SOFIA BRANCH BNPABGSX NO YES
0470 INTERNATIONAL ASSET BANK AD IABGBGSF NO YES
0480 COMMERCIAL BANK VICTORIA EAD BINVBGSF NO YES
0545 TEXIM BANK AD TEXIBGSF NO YES
0561 ALLIANZ BANK BULGARIA AD BUINBGSF YES YES
0620 BULGARIAN DEVELOPMENT BANK AD NASBBGSF NO YES
0790 CENTRAL COOPERATIVE BANK AD CECBBGSF YES YES
0800 UNICREDIT BULBANK AD UNCRBGSF YES YES
0888 CIBANK JSC ** BUIBBGSF YES YES
0920 EUROBANK BULGARIA AD BPBIBGSF YES YES
2155 RAIFFEISEN BANK INTERNATIONAL AG RZBAATWW NO NO
2057 CLEARSTREAM BANKING S.A. (ICSD) CEDELULL NO YES
9009 CENTRAL DEPOSITORY AD CEDPBGSF NO YES
Other
1482 MINISTRY OF FINANCE - NO NO
* Over the 1 January to 31 December 2018 period
**As of 5 February 2018 "CIBANK" JSC is transformed by merger into "United Bulgarian Bank" AD.
Central Securities Depositories
LISTof the Participants in the Electronic System for Registration and Servicing of
Trade in Book-entry Government Securities (ESROT)
Banks
10
(continued)
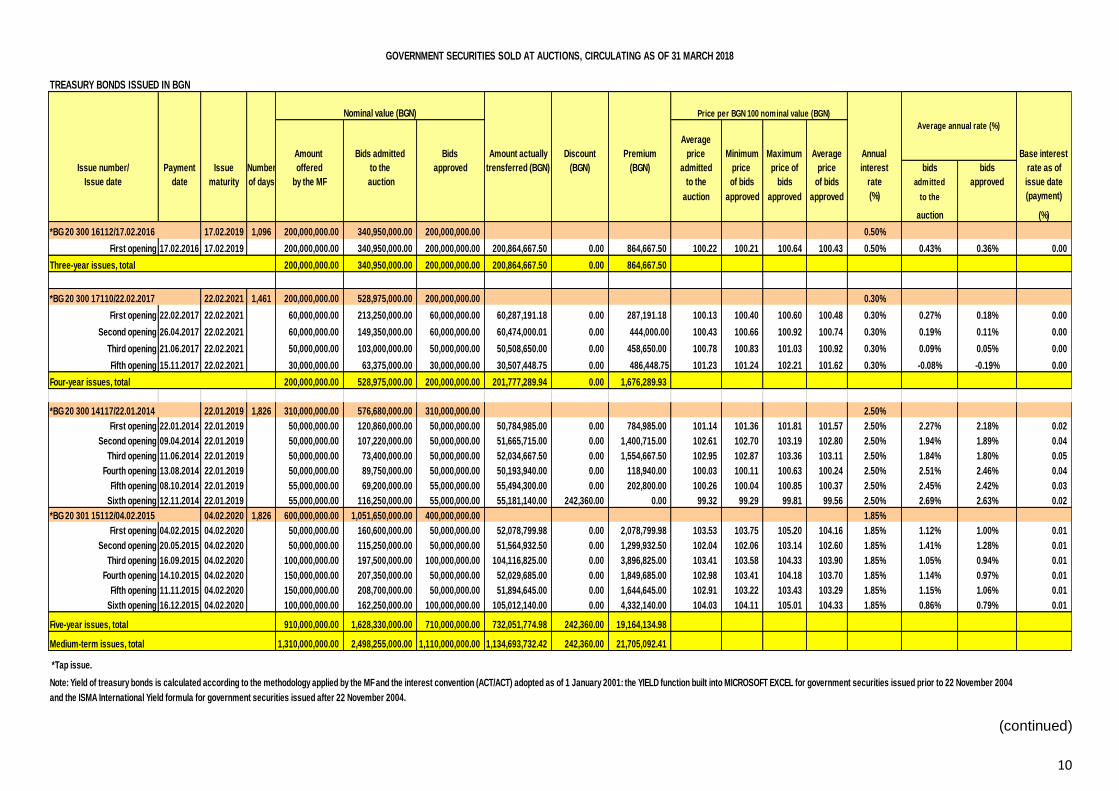
TREASURY BONDS ISSUED IN BGN
Nominal value (BGN) Price per BGN 100 nominal value (BGN)
Amount Bids admitted Bids Discount Premium
Average
price Minimum Maximum Average Annual Base interest
Issue number/ Payment Issue Number offered to the approved (BGN) (BGN) admitted price price of price interest bids bids rate as of
Issue date date maturity of days by the MF auction to the of bids bids of bids rate admitted approved issue date
auction approved approved approved (%) to the (payment)
auction (%)
*BG 20 300 16112/17.02.2016 17.02.2019 1,096 200,000,000.00 340,950,000.00 200,000,000.00 0.50%
First opening 17.02.2016 17.02.2019 200,000,000.00 340,950,000.00 200,000,000.00 200,864,667.50 0.00 864,667.50 100.22 100.21 100.64 100.43 0.50% 0.43% 0.36% 0.00
Three-year issues, total 200,000,000.00 340,950,000.00 200,000,000.00 200,864,667.50 0.00 864,667.50
*BG 20 300 17110/22.02.2017 22.02.2021 1,461 200,000,000.00 528,975,000.00 200,000,000.00 0.30%
First opening 22.02.2017 22.02.2021 60,000,000.00 213,250,000.00 60,000,000.00 60,287,191.18 0.00 287,191.18 100.13 100.40 100.60 100.48 0.30% 0.27% 0.18% 0.00
Second opening 26.04.2017 22.02.2021 60,000,000.00 149,350,000.00 60,000,000.00 60,474,000.01 0.00 444,000.00 100.43 100.66 100.92 100.74 0.30% 0.19% 0.11% 0.00
Third opening 21.06.2017 22.02.2021 50,000,000.00 103,000,000.00 50,000,000.00 50,508,650.00 0.00 458,650.00 100.78 100.83 101.03 100.92 0.30% 0.09% 0.05% 0.00
Fifth opening 15.11.2017 22.02.2021 30,000,000.00 63,375,000.00 30,000,000.00 30,507,448.75 0.00 486,448.75 101.23 101.24 102.21 101.62 0.30% -0.08% -0.19% 0.00
Four-year issues, total 200,000,000.00 528,975,000.00 200,000,000.00 201,777,289.94 0.00 1,676,289.93
*BG 20 300 14117/22.01.2014 22.01.2019 1,826 310,000,000.00 576,680,000.00 310,000,000.00 2.50%
First opening 22.01.2014 22.01.2019 50,000,000.00 120,860,000.00 50,000,000.00 50,784,985.00 0.00 784,985.00 101.14 101.36 101.81 101.57 2.50% 2.27% 2.18% 0.02
Second opening 09.04.2014 22.01.2019 50,000,000.00 107,220,000.00 50,000,000.00 51,665,715.00 0.00 1,400,715.00 102.61 102.70 103.19 102.80 2.50% 1.94% 1.89% 0.04
Third opening 11.06.2014 22.01.2019 50,000,000.00 73,400,000.00 50,000,000.00 52,034,667.50 0.00 1,554,667.50 102.95 102.87 103.36 103.11 2.50% 1.84% 1.80% 0.05
Fourth opening 13.08.2014 22.01.2019 50,000,000.00 89,750,000.00 50,000,000.00 50,193,940.00 0.00 118,940.00 100.03 100.11 100.63 100.24 2.50% 2.51% 2.46% 0.04
Fifth opening 08.10.2014 22.01.2019 55,000,000.00 69,200,000.00 55,000,000.00 55,494,300.00 0.00 202,800.00 100.26 100.04 100.85 100.37 2.50% 2.45% 2.42% 0.03
Sixth opening 12.11.2014 22.01.2019 55,000,000.00 116,250,000.00 55,000,000.00 55,181,140.00 242,360.00 0.00 99.32 99.29 99.81 99.56 2.50% 2.69% 2.63% 0.02
*BG 20 301 15112/04.02.2015 04.02.2020 1,826 600,000,000.00 1,051,650,000.00 400,000,000.00 1.85%
First opening 04.02.2015 04.02.2020 50,000,000.00 160,600,000.00 50,000,000.00 52,078,799.98 0.00 2,078,799.98 103.53 103.75 105.20 104.16 1.85% 1.12% 1.00% 0.01
Second opening 20.05.2015 04.02.2020 50,000,000.00 115,250,000.00 50,000,000.00 51,564,932.50 0.00 1,299,932.50 102.04 102.06 103.14 102.60 1.85% 1.41% 1.28% 0.01
Third opening 16.09.2015 04.02.2020 100,000,000.00 197,500,000.00 100,000,000.00 104,116,825.00 0.00 3,896,825.00 103.41 103.58 104.33 103.90 1.85% 1.05% 0.94% 0.01
Fourth opening 14.10.2015 04.02.2020 150,000,000.00 207,350,000.00 50,000,000.00 52,029,685.00 0.00 1,849,685.00 102.98 103.41 104.18 103.70 1.85% 1.14% 0.97% 0.01
Fifth opening 11.11.2015 04.02.2020 150,000,000.00 208,700,000.00 50,000,000.00 51,894,645.00 0.00 1,644,645.00 102.91 103.22 103.43 103.29 1.85% 1.15% 1.06% 0.01
Sixth opening 16.12.2015 04.02.2020 100,000,000.00 162,250,000.00 100,000,000.00 105,012,140.00 0.00 4,332,140.00 104.03 104.11 105.01 104.33 1.85% 0.86% 0.79% 0.01
Five-year issues, total 910,000,000.00 1,628,330,000.00 710,000,000.00 732,051,774.98 242,360.00 19,164,134.98
Medium-term issues, total 1,310,000,000.00 2,498,255,000.00 1,110,000,000.00 1,134,693,732.42 242,360.00 21,705,092.41
*Tap issue.
Note: Yield of treasury bonds is calculated according to the methodology applied by the MF and the interest convention (ACT/ACT) adopted as of 1 January 2001: the YIELD function built into MICROSOFT EXCEL for government securities issued prior to 22 November 2004
and the ISMA International Yield formula for government securities issued after 22 November 2004.
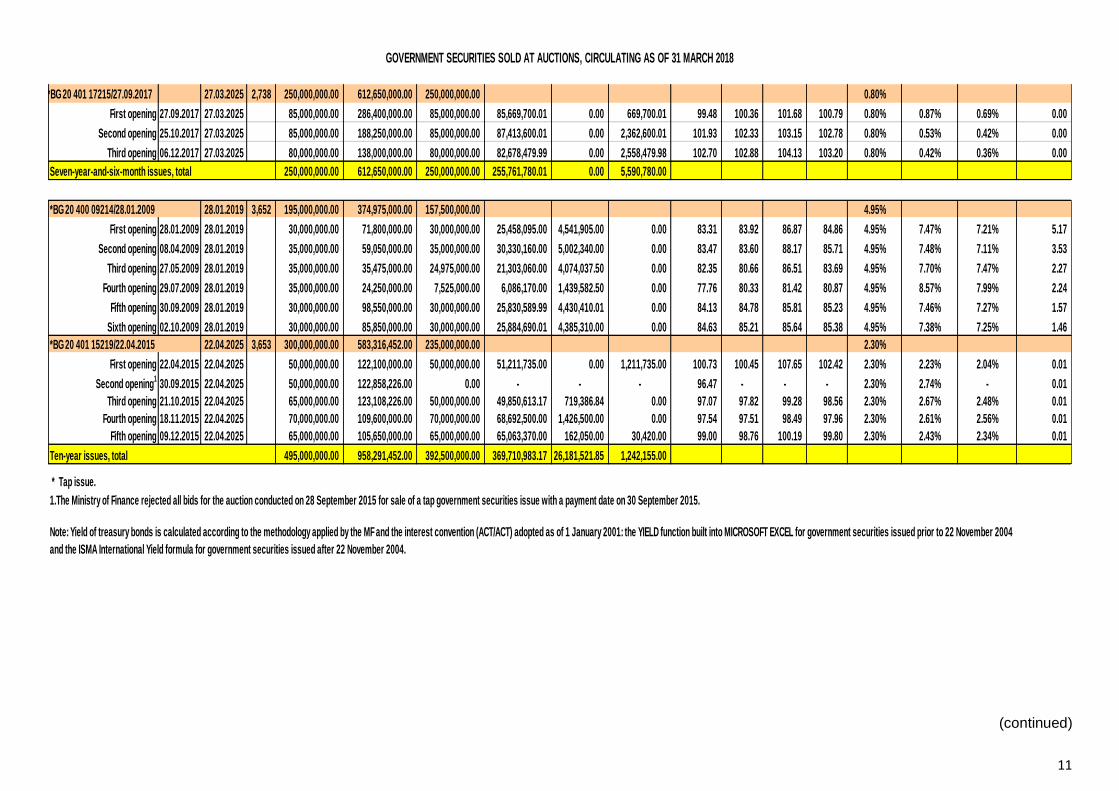
GOVERNMENT SECURITIES SOLD AT AUCTIONS, CIRCULATING AS OF 31 MARCH 2018
Average annual rate (%)
Amount actually
trensferred (BGN)
11
(continued)
*BG 20 401 17215/27.09.2017 27.03.2025 2,738 250,000,000.00 612,650,000.00 250,000,000.00 0.80%
First opening 27.09.2017 27.03.2025 85,000,000.00 286,400,000.00 85,000,000.00 85,669,700.01 0.00 669,700.01 99.48 100.36 101.68 100.79 0.80% 0.87% 0.69% 0.00
Second opening 25.10.2017 27.03.2025 85,000,000.00 188,250,000.00 85,000,000.00 87,413,600.01 0.00 2,362,600.01 101.93 102.33 103.15 102.78 0.80% 0.53% 0.42% 0.00
Third opening 06.12.2017 27.03.2025 80,000,000.00 138,000,000.00 80,000,000.00 82,678,479.99 0.00 2,558,479.98 102.70 102.88 104.13 103.20 0.80% 0.42% 0.36% 0.00
Seven-year-and-six-month issues, total 250,000,000.00 612,650,000.00 250,000,000.00 255,761,780.01 0.00 5,590,780.00
*BG 20 400 09214/28.01.2009 28.01.2019 3,652 195,000,000.00 374,975,000.00 157,500,000.00 4.95%
First opening 28.01.2009 28.01.2019 30,000,000.00 71,800,000.00 30,000,000.00 25,458,095.00 4,541,905.00 0.00 83.31 83.92 86.87 84.86 4.95% 7.47% 7.21% 5.17
Second opening 08.04.2009 28.01.2019 35,000,000.00 59,050,000.00 35,000,000.00 30,330,160.00 5,002,340.00 0.00 83.47 83.60 88.17 85.71 4.95% 7.48% 7.11% 3.53
Third opening 27.05.2009 28.01.2019 35,000,000.00 35,475,000.00 24,975,000.00 21,303,060.00 4,074,037.50 0.00 82.35 80.66 86.51 83.69 4.95% 7.70% 7.47% 2.27
Fourth opening 29.07.2009 28.01.2019 35,000,000.00 24,250,000.00 7,525,000.00 6,086,170.00 1,439,582.50 0.00 77.76 80.33 81.42 80.87 4.95% 8.57% 7.99% 2.24
Fifth opening 30.09.2009 28.01.2019 30,000,000.00 98,550,000.00 30,000,000.00 25,830,589.99 4,430,410.01 0.00 84.13 84.78 85.81 85.23 4.95% 7.46% 7.27% 1.57
Sixth opening 02.10.2009 28.01.2019 30,000,000.00 85,850,000.00 30,000,000.00 25,884,690.01 4,385,310.00 0.00 84.63 85.21 85.64 85.38 4.95% 7.38% 7.25% 1.46
*BG 20 401 15219/22.04.2015 22.04.2025 3,653 300,000,000.00 583,316,452.00 235,000,000.00 2.30%
First opening 22.04.2015 22.04.2025 50,000,000.00 122,100,000.00 50,000,000.00 51,211,735.00 0.00 1,211,735.00 100.73 100.45 107.65 102.42 2.30% 2.23% 2.04% 0.01
Second opening1
30.09.2015 22.04.2025 50,000,000.00 122,858,226.00 0.00 - - - 96.47 - - - 2.30% 2.74% - 0.01
Third opening 21.10.2015 22.04.2025 65,000,000.00 123,108,226.00 50,000,000.00 49,850,613.17 719,386.84 0.00 97.07 97.82 99.28 98.56 2.30% 2.67% 2.48% 0.01
Fourth opening 18.11.2015 22.04.2025 70,000,000.00 109,600,000.00 70,000,000.00 68,692,500.00 1,426,500.00 0.00 97.54 97.51 98.49 97.96 2.30% 2.61% 2.56% 0.01
Fifth opening 09.12.2015 22.04.2025 65,000,000.00 105,650,000.00 65,000,000.00 65,063,370.00 162,050.00 30,420.00 99.00 98.76 100.19 99.80 2.30% 2.43% 2.34% 0.01
Ten-year issues, total 495,000,000.00 958,291,452.00 392,500,000.00 369,710,983.17 26,181,521.85 1,242,155.00
* Tap issue.
1.The Ministry of Finance rejected all bids for the auction conducted on 28 September 2015 for sale of a tap government securities issue with a payment date on 30 September 2015.
Note: Yield of treasury bonds is calculated according to the methodology applied by the MF and the interest convention (ACT/ACT) adopted as of 1 January 2001: the YIELD function built into MICROSOFT EXCEL for government securities issued prior to 22 November 2004
and the ISMA International Yield formula for government securities issued after 22 November 2004.
GOVERNMENT SECURITIES SOLD AT AUCTIONS, CIRCULATING AS OF 31 MARCH 2018
12
(continued)
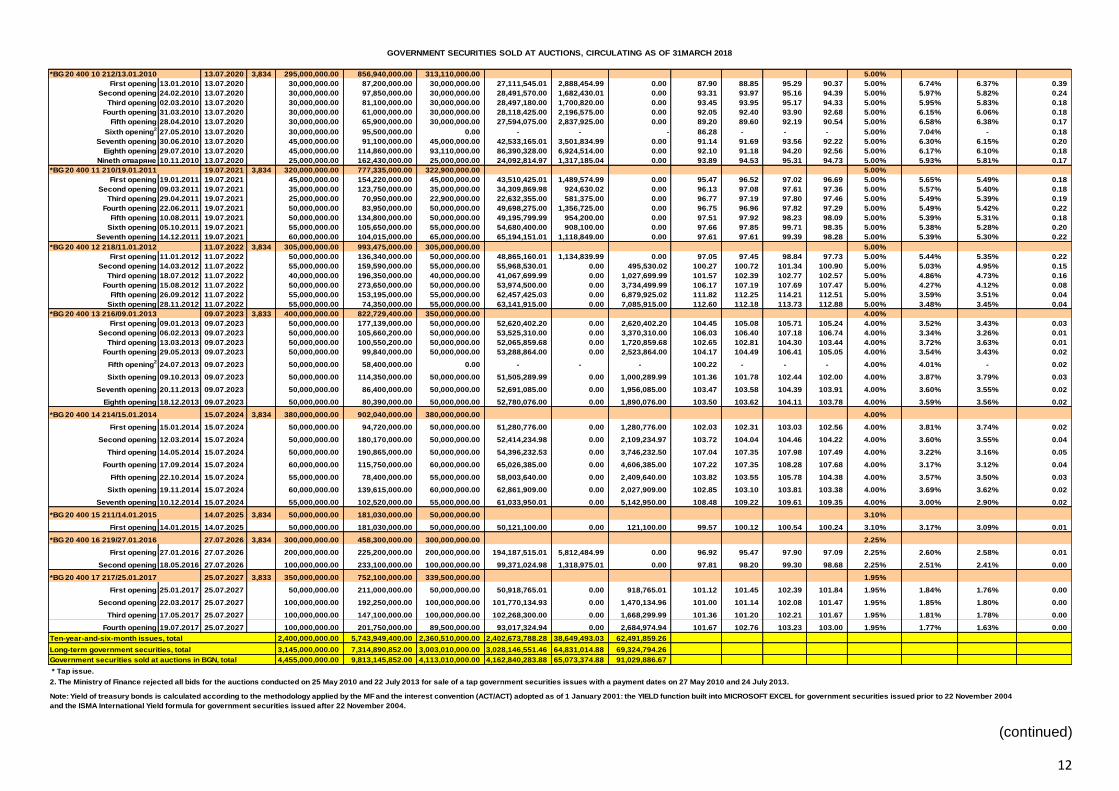
*BG 20 400 10 212/13.01.2010 13.07.2020 3,834 295,000,000.00 856,940,000.00 313,110,000.00 5.00%
First opening 13.01.2010 13.07.2020 30,000,000.00 87,200,000.00 30,000,000.00 27,111,545.01 2,888,454.99 0.00 87.90 88.85 95.29 90.37 5.00% 6.74% 6.37% 0.39
Second opening 24.02.2010 13.07.2020 30,000,000.00 97,850,000.00 30,000,000.00 28,491,570.00 1,682,430.01 0.00 93.31 93.97 95.16 94.39 5.00% 5.97% 5.82% 0.24
Third opening 02.03.2010 13.07.2020 30,000,000.00 81,100,000.00 30,000,000.00 28,497,180.00 1,700,820.00 0.00 93.45 93.95 95.17 94.33 5.00% 5.95% 5.83% 0.18
Fourth opening 31.03.2010 13.07.2020 30,000,000.00 61,000,000.00 30,000,000.00 28,118,425.00 2,196,575.00 0.00 92.05 92.40 93.90 92.68 5.00% 6.15% 6.06% 0.18
Fifth opening 28.04.2010 13.07.2020 30,000,000.00 65,900,000.00 30,000,000.00 27,594,075.00 2,837,925.00 0.00 89.20 89.60 92.19 90.54 5.00% 6.58% 6.38% 0.17
Sixth opening2
27.05.2010 13.07.2020 30,000,000.00 95,500,000.00 0.00 - - - 86.28 - - - 5.00% 7.04% - 0.18
Seventh opening 30.06.2010 13.07.2020 45,000,000.00 91,100,000.00 45,000,000.00 42,533,165.01 3,501,834.99 0.00 91.14 91.69 93.56 92.22 5.00% 6.30% 6.15% 0.20
Eighth opening 29.07.2010 13.07.2020 45,000,000.00 114,860,000.00 93,110,000.00 86,390,328.00 6,924,514.00 0.00 92.10 91.18 94.20 92.56 5.00% 6.17% 6.10% 0.18
Nineth отваряне 10.11.2010 13.07.2020 25,000,000.00 162,430,000.00 25,000,000.00 24,092,814.97 1,317,185.04 0.00 93.89 94.53 95.31 94.73 5.00% 5.93% 5.81% 0.17
*BG 20 400 11 210/19.01.2011 19.07.2021 3,834 320,000,000.00 777,335,000.00 322,900,000.00 5.00%
First opening 19.01.2011 19.07.2021 45,000,000.00 154,220,000.00 45,000,000.00 43,510,425.01 1,489,574.99 0.00 95.47 96.52 97.02 96.69 5.00% 5.65% 5.49% 0.18
Second opening 09.03.2011 19.07.2021 35,000,000.00 123,750,000.00 35,000,000.00 34,309,869.98 924,630.02 0.00 96.13 97.08 97.61 97.36 5.00% 5.57% 5.40% 0.18
Third opening 29.04.2011 19.07.2021 25,000,000.00 70,950,000.00 22,900,000.00 22,632,355.00 581,375.00 0.00 96.77 97.19 97.80 97.46 5.00% 5.49% 5.39% 0.19
Fourth opening 22.06.2011 19.07.2021 50,000,000.00 83,950,000.00 50,000,000.00 49,698,275.00 1,356,725.00 0.00 96.75 96.96 97.82 97.29 5.00% 5.49% 5.42% 0.22
Fifth opening 10.08.2011 19.07.2021 50,000,000.00 134,800,000.00 50,000,000.00 49,195,799.99 954,200.00 0.00 97.51 97.92 98.23 98.09 5.00% 5.39% 5.31% 0.18
Sixth opening 05.10.2011 19.07.2021 55,000,000.00 105,650,000.00 55,000,000.00 54,680,400.00 908,100.00 0.00 97.66 97.85 99.71 98.35 5.00% 5.38% 5.28% 0.20
Seventh opening 14.12.2011 19.07.2021 60,000,000.00 104,015,000.00 65,000,000.00 65,194,151.01 1,118,849.00 0.00 97.61 97.61 99.39 98.28 5.00% 5.39% 5.30% 0.22
*BG 20 400 12 218/11.01.2012 11.07.2022 3,834 305,000,000.00 993,475,000.00 305,000,000.00 5.00%
First opening 11.01.2012 11.07.2022 50,000,000.00 136,340,000.00 50,000,000.00 48,865,160.01 1,134,839.99 0.00 97.05 97.45 98.84 97.73 5.00% 5.44% 5.35% 0.22
Second opening 14.03.2012 11.07.2022 55,000,000.00 159,590,000.00 55,000,000.00 55,968,530.01 0.00 495,530.02 100.27 100.72 101.34 100.90 5.00% 5.03% 4.95% 0.15
Third opening 18.07.2012 11.07.2022 40,000,000.00 196,350,000.00 40,000,000.00 41,067,699.99 0.00 1,027,699.99 101.57 102.39 102.77 102.57 5.00% 4.86% 4.73% 0.16
Fourth opening 15.08.2012 11.07.2022 50,000,000.00 273,650,000.00 50,000,000.00 53,974,500.00 0.00 3,734,499.99 106.17 107.19 107.69 107.47 5.00% 4.27% 4.12% 0.08
Fifth opening 26.09.2012 11.07.2022 55,000,000.00 153,195,000.00 55,000,000.00 62,457,425.03 0.00 6,879,925.02 111.82 112.25 114.21 112.51 5.00% 3.59% 3.51% 0.04
Sixth opening 28.11.2012 11.07.2022 55,000,000.00 74,350,000.00 55,000,000.00 63,141,915.00 0.00 7,085,915.00 112.60 112.18 113.73 112.88 5.00% 3.48% 3.45% 0.04
*BG 20 400 13 216/09.01.2013 09.07.2023 3,833 400,000,000.00 822,729,400.00 350,000,000.00 4.00%
First opening 09.01.2013 09.07.2023 50,000,000.00 177,139,000.00 50,000,000.00 52,620,402.20 0.00 2,620,402.20 104.45 105.08 105.71 105.24 4.00% 3.52% 3.43% 0.03
Second opening 06.02.2013 09.07.2023 50,000,000.00 105,660,200.00 50,000,000.00 53,525,310.00 0.00 3,370,310.00 106.03 106.40 107.18 106.74 4.00% 3.34% 3.26% 0.01
Third opening 13.03.2013 09.07.2023 50,000,000.00 100,550,200.00 50,000,000.00 52,065,859.68 0.00 1,720,859.68 102.65 102.81 104.30 103.44 4.00% 3.72% 3.63% 0.01
Fourth opening 29.05.2013 09.07.2023 50,000,000.00 99,840,000.00 50,000,000.00 53,288,864.00 0.00 2,523,864.00 104.17 104.49 106.41 105.05 4.00% 3.54% 3.43% 0.02
Fifth opening2
24.07.2013 09.07.2023 50,000,000.00 58,400,000.00 0.00 - - - 100.22 - - - 4.00% 4.01% - 0.02
Sixth opening 09.10.2013 09.07.2023 50,000,000.00 114,350,000.00 50,000,000.00 51,505,289.99 0.00 1,000,289.99 101.36 101.78 102.44 102.00 4.00% 3.87% 3.79% 0.03
Seventh opening 20.11.2013 09.07.2023 50,000,000.00 86,400,000.00 50,000,000.00 52,691,085.00 0.00 1,956,085.00 103.47 103.58 104.39 103.91 4.00% 3.60% 3.55% 0.02
Eighth opening 18.12.2013 09.07.2023 50,000,000.00 80,390,000.00 50,000,000.00 52,780,076.00 0.00 1,890,076.00 103.50 103.62 104.11 103.78 4.00% 3.59% 3.56% 0.02
*BG 20 400 14 214/15.01.2014 15.07.2024 3,834 380,000,000.00 902,040,000.00 380,000,000.00 4.00%
First opening 15.01.2014 15.07.2024 50,000,000.00 94,720,000.00 50,000,000.00 51,280,776.00 0.00 1,280,776.00 102.03 102.31 103.03 102.56 4.00% 3.81% 3.74% 0.02
Second opening 12.03.2014 15.07.2024 50,000,000.00 180,170,000.00 50,000,000.00 52,414,234.98 0.00 2,109,234.97 103.72 104.04 104.46 104.22 4.00% 3.60% 3.55% 0.04
Third opening 14.05.2014 15.07.2024 50,000,000.00 190,865,000.00 50,000,000.00 54,396,232.53 0.00 3,746,232.50 107.04 107.35 107.98 107.49 4.00% 3.22% 3.16% 0.05
Fourth opening 17.09.2014 15.07.2024 60,000,000.00 115,750,000.00 60,000,000.00 65,026,385.00 0.00 4,606,385.00 107.22 107.35 108.28 107.68 4.00% 3.17% 3.12% 0.04
Fifth opening 22.10.2014 15.07.2024 55,000,000.00 78,400,000.00 55,000,000.00 58,003,640.00 0.00 2,409,640.00 103.82 103.55 105.78 104.38 4.00% 3.57% 3.50% 0.03
Sixth opening 19.11.2014 15.07.2024 60,000,000.00 139,615,000.00 60,000,000.00 62,861,909.00 0.00 2,027,909.00 102.85 103.10 103.81 103.38 4.00% 3.69% 3.62% 0.02
Seventh opening 10.12.2014 15.07.2024 55,000,000.00 102,520,000.00 55,000,000.00 61,033,950.01 0.00 5,142,950.00 108.48 109.22 109.61 109.35 4.00% 3.00% 2.90% 0.02
*BG 20 400 15 211/14.01.2015 14.07.2025 3,834 50,000,000.00 181,030,000.00 50,000,000.00 3.10%
First opening 14.01.2015 14.07.2025 50,000,000.00 181,030,000.00 50,000,000.00 50,121,100.00 0.00 121,100.00 99.57 100.12 100.54 100.24 3.10% 3.17% 3.09% 0.01
*BG 20 400 16 219/27.01.2016 27.07.2026 3,834 300,000,000.00 458,300,000.00 300,000,000.00 2.25%
First opening 27.01.2016 27.07.2026 200,000,000.00 225,200,000.00 200,000,000.00 194,187,515.01 5,812,484.99 0.00 96.92 95.47 97.90 97.09 2.25% 2.60% 2.58% 0.01
Second opening 18.05.2016 27.07.2026 100,000,000.00 233,100,000.00 100,000,000.00 99,371,024.98 1,318,975.01 0.00 97.81 98.20 99.30 98.68 2.25% 2.51% 2.41% 0.00
*BG 20 400 17 217/25.01.2017 25.07.2027 3,833 350,000,000.00 752,100,000.00 339,500,000.00 1.95%
First opening 25.01.2017 25.07.2027 50,000,000.00 211,000,000.00 50,000,000.00 50,918,765.01 0.00 918,765.01 101.12 101.45 102.39 101.84 1.95% 1.84% 1.76% 0.00
Second opening 22.03.2017 25.07.2027 100,000,000.00 192,250,000.00 100,000,000.00 101,770,134.93 0.00 1,470,134.96 101.00 101.14 102.08 101.47 1.95% 1.85% 1.80% 0.00
Third opening 17.05.2017 25.07.2027 100,000,000.00 147,100,000.00 100,000,000.00 102,268,300.00 0.00 1,668,299.99 101.36 101.20 102.21 101.67 1.95% 1.81% 1.78% 0.00
Fourth opening 19.07.2017 25.07.2027 100,000,000.00 201,750,000.00 89,500,000.00 93,017,324.94 0.00 2,684,974.94 101.67 102.76 103.23 103.00 1.95% 1.77% 1.63% 0.00
Ten-year-and-six-month issues, total 2,400,000,000.00 5,743,949,400.00 2,360,510,000.00 2,402,673,788.28 38,649,493.03 62,491,859.26
Long-term government securities, total 3,145,000,000.00 7,314,890,852.00 3,003,010,000.00 3,028,146,551.46 64,831,014.88 69,324,794.26
Government securities sold at auctions in BGN, total 4,455,000,000.00 9,813,145,852.00 4,113,010,000.00 4,162,840,283.88 65,073,374.88 91,029,886.67
* Tap issue.
2. The Ministry of Finance rejected all bids for the auctions conducted on 25 May 2010 and 22 July 2013 for sale of a tap government securities issues with a payment dates on 27 May 2010 and 24 July 2013.
Note: Yield of treasury bonds is calculated according to the methodology applied by the MF and the interest convention (ACT/ACT) adopted as of 1 January 2001: the YIELD function built into MICROSOFT EXCEL for government securities issued prior to 22 November 2004
and the ISMA International Yield formula for government securities issued after 22 November 2004.
GOVERNMENT SECURITIES SOLD AT AUCTIONS, CIRCULATING AS OF 31MARCH 2018
13
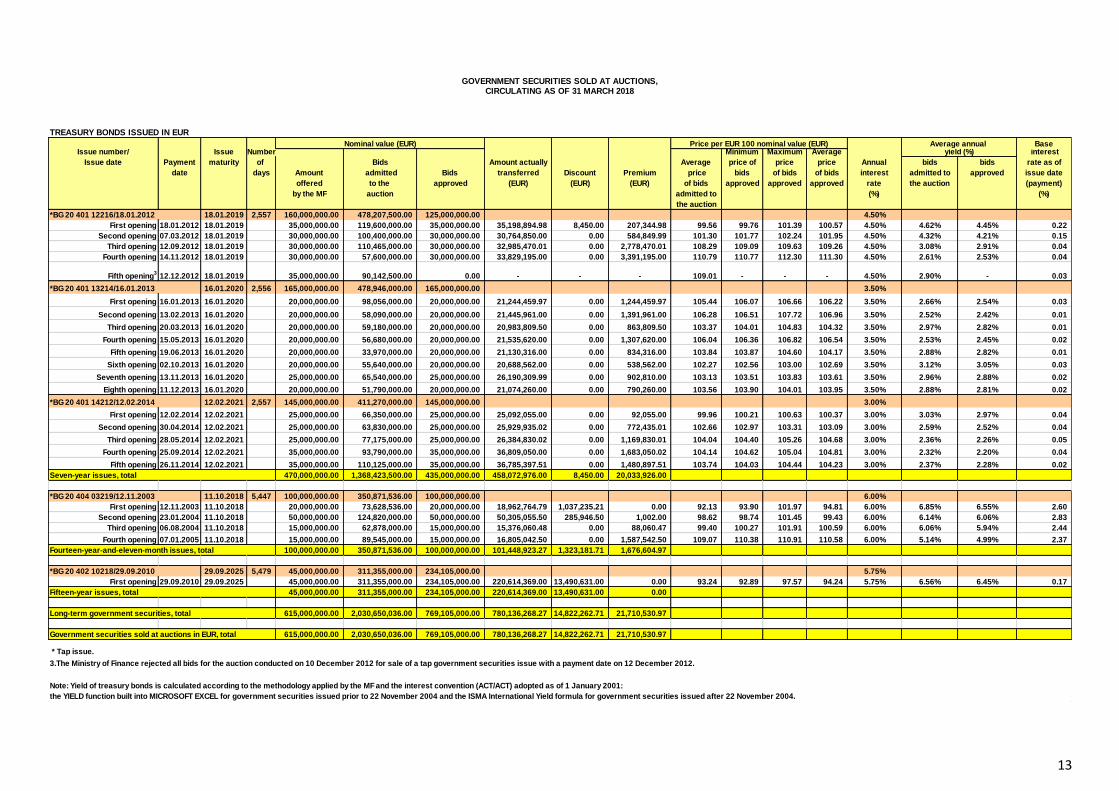
TREASURY BONDS ISSUED IN EUR
Nominal value (EUR) Price per EUR 100 nominal value (EUR) Average annual BaseIssue number/ Issue Number Minimum Maximum Average yield (%) interest
Issue date Payment maturity of Bids Amount actually Average price of price price Annual bids bids rate as of
date days Amount admitted Bids transferred Discount Premium price bids of bids of bids interest admitted to approved issue date
offered to the approved (EUR) (EUR) (EUR) of bids approved approved approved rate the auction (payment)
by the MF auction admitted to (%) (%)
the auction
*BG 20 401 12216/18.01.2012 18.01.2019 2,557 160,000,000.00 478,207,500.00 125,000,000.00 4.50%
First opening 18.01.2012 18.01.2019 35,000,000.00 119,600,000.00 35,000,000.00 35,198,894.98 8,450.00 207,344.98 99.56 99.76 101.39 100.57 4.50% 4.62% 4.45% 0.22
Second opening 07.03.2012 18.01.2019 30,000,000.00 100,400,000.00 30,000,000.00 30,764,850.00 0.00 584,849.99 101.30 101.77 102.24 101.95 4.50% 4.32% 4.21% 0.15
Third opening 12.09.2012 18.01.2019 30,000,000.00 110,465,000.00 30,000,000.00 32,985,470.01 0.00 2,778,470.01 108.29 109.09 109.63 109.26 4.50% 3.08% 2.91% 0.04
Fourth opening 14.11.2012 18.01.2019 30,000,000.00 57,600,000.00 30,000,000.00 33,829,195.00 0.00 3,391,195.00 110.79 110.77 112.30 111.30 4.50% 2.61% 2.53% 0.04
Fifth opening3
12.12.2012 18.01.2019 35,000,000.00 90,142,500.00 0.00 - - - 109.01 - - - 4.50% 2.90% - 0.03
*BG 20 401 13214/16.01.2013 16.01.2020 2,556 165,000,000.00 478,946,000.00 165,000,000.00 3.50%
First opening 16.01.2013 16.01.2020 20,000,000.00 98,056,000.00 20,000,000.00 21,244,459.97 0.00 1,244,459.97 105.44 106.07 106.66 106.22 3.50% 2.66% 2.54% 0.03
Second opening 13.02.2013 16.01.2020 20,000,000.00 58,090,000.00 20,000,000.00 21,445,961.00 0.00 1,391,961.00 106.28 106.51 107.72 106.96 3.50% 2.52% 2.42% 0.01
Third opening 20.03.2013 16.01.2020 20,000,000.00 59,180,000.00 20,000,000.00 20,983,809.50 0.00 863,809.50 103.37 104.01 104.83 104.32 3.50% 2.97% 2.82% 0.01
Fourth opening 15.05.2013 16.01.2020 20,000,000.00 56,680,000.00 20,000,000.00 21,535,620.00 0.00 1,307,620.00 106.04 106.36 106.82 106.54 3.50% 2.53% 2.45% 0.02
Fifth opening 19.06.2013 16.01.2020 20,000,000.00 33,970,000.00 20,000,000.00 21,130,316.00 0.00 834,316.00 103.84 103.87 104.60 104.17 3.50% 2.88% 2.82% 0.01
Sixth opening 02.10.2013 16.01.2020 20,000,000.00 55,640,000.00 20,000,000.00 20,688,562.00 0.00 538,562.00 102.27 102.56 103.00 102.69 3.50% 3.12% 3.05% 0.03
Seventh opening 13.11.2013 16.01.2020 25,000,000.00 65,540,000.00 25,000,000.00 26,190,309.99 0.00 902,810.00 103.13 103.51 103.83 103.61 3.50% 2.96% 2.88% 0.02
Eighth opening 11.12.2013 16.01.2020 20,000,000.00 51,790,000.00 20,000,000.00 21,074,260.00 0.00 790,260.00 103.56 103.90 104.01 103.95 3.50% 2.88% 2.81% 0.02
*BG 20 401 14212/12.02.2014 12.02.2021 2,557 145,000,000.00 411,270,000.00 145,000,000.00 3.00%
First opening 12.02.2014 12.02.2021 25,000,000.00 66,350,000.00 25,000,000.00 25,092,055.00 0.00 92,055.00 99.96 100.21 100.63 100.37 3.00% 3.03% 2.97% 0.04
Second opening 30.04.2014 12.02.2021 25,000,000.00 63,830,000.00 25,000,000.00 25,929,935.02 0.00 772,435.01 102.66 102.97 103.31 103.09 3.00% 2.59% 2.52% 0.04
Third opening 28.05.2014 12.02.2021 25,000,000.00 77,175,000.00 25,000,000.00 26,384,830.02 0.00 1,169,830.01 104.04 104.40 105.26 104.68 3.00% 2.36% 2.26% 0.05
Fourth opening 25.09.2014 12.02.2021 35,000,000.00 93,790,000.00 35,000,000.00 36,809,050.00 0.00 1,683,050.02 104.14 104.62 105.04 104.81 3.00% 2.32% 2.20% 0.04
Fifth opening 26.11.2014 12.02.2021 35,000,000.00 110,125,000.00 35,000,000.00 36,785,397.51 0.00 1,480,897.51 103.74 104.03 104.44 104.23 3.00% 2.37% 2.28% 0.02
Seven-year issues, total 470,000,000.00 1,368,423,500.00 435,000,000.00 458,072,976.00 8,450.00 20,033,926.00
*BG 20 404 03219/12.11.2003 11.10.2018 5,447 100,000,000.00 350,871,536.00 100,000,000.00 6.00%
First opening 12.11.2003 11.10.2018 20,000,000.00 73,628,536.00 20,000,000.00 18,962,764.79 1,037,235.21 0.00 92.13 93.90 101.97 94.81 6.00% 6.85% 6.55% 2.60
Second opening 23.01.2004 11.10.2018 50,000,000.00 124,820,000.00 50,000,000.00 50,305,055.50 285,946.50 1,002.00 98.62 98.74 101.45 99.43 6.00% 6.14% 6.06% 2.83
Third opening 06.08.2004 11.10.2018 15,000,000.00 62,878,000.00 15,000,000.00 15,376,060.48 0.00 88,060.47 99.40 100.27 101.91 100.59 6.00% 6.06% 5.94% 2.44
Fourth opening 07.01.2005 11.10.2018 15,000,000.00 89,545,000.00 15,000,000.00 16,805,042.50 0.00 1,587,542.50 109.07 110.38 110.91 110.58 6.00% 5.14% 4.99% 2.37
Fourteen-year-and-eleven-month issues, total 100,000,000.00 350,871,536.00 100,000,000.00 101,448,923.27 1,323,181.71 1,676,604.97
*BG 20 402 10218/29.09.2010 29.09.2025 5,479 45,000,000.00 311,355,000.00 234,105,000.00 5.75%
First opening 29.09.2010 29.09.2025 45,000,000.00 311,355,000.00 234,105,000.00 220,614,369.00 13,490,631.00 0.00 93.24 92.89 97.57 94.24 5.75% 6.56% 6.45% 0.17
Fifteen-year issues, total 45,000,000.00 311,355,000.00 234,105,000.00 220,614,369.00 13,490,631.00 0.00
Long-term government securities, total 615,000,000.00 2,030,650,036.00 769,105,000.00 780,136,268.27 14,822,262.71 21,710,530.97
Government securities sold at auctions in EUR, total 615,000,000.00 2,030,650,036.00 769,105,000.00 780,136,268.27 14,822,262.71 21,710,530.97
* Tap issue.
3.The Ministry of Finance rejected all bids for the auction conducted on 10 December 2012 for sale of a tap government securities issue with a payment date on 12 December 2012.
Note: Yield of treasury bonds is calculated according to the methodology applied by the MF and the interest convention (ACT/ACT) adopted as of 1 January 2001:
the YIELD function built into MICROSOFT EXCEL for government securities issued prior to 22 November 2004 and the ISMA International Yield formula for government securities issued after 22 November 2004.
GOVERNMENT SECURITIES SOLD AT AUCTIONS,CIRCULATING AS OF 31 MARCH 2018