Embed Size (px)
Citation preview

MPRAMunich Personal RePEc Archive
Immigration and Social Benefits in aMediterranean Welfare State: The Caseof Spain
Rafael Munoz de Bustillo and Jose-Ignacio Anton
March 2009
Online at http://mpra.ub.uni-muenchen.de/13849/MPRA Paper No. 13849, posted 8. March 2009 15:21 UTC

IMMIGRATION AND SOCIAL BENEFITS IN A MEDITERRANEAN
WELFARE STATE: THE CASE OF SPAIN
RAFAEL MUÑOZ DE BUSTILLO*
JOSÉ-IGNACIO ANTÓN**
ABSTRACT
The aim of this paper is to explore the impact of immigration on the Spanish Welfare
State nowadays. Using two different household surveys, both the reception of state cash
transfers and the use of public health care insurance by nationals and immigrants are
analysed. Controlling by observable socio-demographic characteristics, we find that
immigrants receive fewer cash transfers than locals and do not exhibit a statistically
significant higher use of health care services than nationals. The nature of the Spanish
Welfare State compared to its European correlates and the age composition of the
immigrant population, concentrated in active age, can help to explain these findings.
KEYWORDS: Immigration, Welfare State, Spain, cash transfers, health care.
1. INTRODUCTION1
From a historical point of view, nowadays immigration rates do not stand
comparison to the flows corresponding to the massive migration wave that took place,
in a context of almost free movement of people, from the mid 1850’s to the beginning
of World War I (Hatton and Williamson, 2005). However, the lower economic growth
rates of the receiving countries, their higher population density, and the reorientation of
migration towards the developed countries have made migration a highly visible and
* Professor of Economics, University of Salamanca. E-mail: [email protected]. ** Assistant Professor, University of Salamanca. E-mail: [email protected] (corresponding author). 1 This paper was presented at the European Foundation for the Improvement of Living and Working Conditions in Dublin in August 2007, the XVth Public Economics Meeting in Salamanca 2008 and the X INFER Conference in Evora 2008. The authors thank Samuel Freije, Marcelo Delajara, Enrique Fernández and the attendants of the mentioned events for valuable comments on previous drafts of this work.
debatable issue nowadays.2 According to the Eurobarometer 65 (2007), immigration is
considered in the EU-15 the fourth most important issue of concern faced by the
member states (right after unemployment, crime, and the economic situation). At the
same time, less than half of EU-15 citizens (42%) consider immigrants contribute a
great deal to their countries. In Spain, in 2006, for the first time immigration figured as
the most important problem faced by the country (59% of answers), well above
unemployment (42%) and housing (21%).3
This general concern about the impact of immigration on Spanish society shows
in three different dimensions: the impact of immigration on the labour market, potential
problems of integration (including delinquency, etc.) and the implications of
immigration for the public sector’s budget. This paper intends to shed light upon a very
specific issue related to the third dimension: the direct impact of immigration on the
Spanish Welfare State. It comprises two different dimensions: state cash transfers and
health care expenditure. Though there is a long tradition of studies on the implications
of immigration for welfare systems, most of them focus on consolidated welfare
regimes and consolidated migration communities. Apart from the attitudes towards
immigration mentioned above, the case studied in this paper is different for two reasons.
First, in Spain immigration is a very recent phenomenon, particularly interesting in a
country that was traditionally an emigrant nation. Second, because of historical reasons,
including the late democratization of the country, the Spanish Welfare State was
developed comparatively late (in the 1970s) and is still much weaker than most of their
European correlates. These two characteristics make the Spanish case an interesting
case study. The hypothesis to be tested is whether immigrants receive more or fewer
social benefits than locals and whether the differences, when existing, can be fully
explained by observable characteristics.
In order to accomplish this aim, the paper is organized in five sections as
follows. Firstly, the main literature relating to immigration and the Welfare State is
briefly reviewed. In the second section, some stylized facts about the Spanish Welfare
State and Spanish immigration are offered to allow the reader to understand the
2 While in 1960 the worldwide emigration rate was only slightly below the emigration rate of the more developed countries (3.4 versus 2.6%), in 2005 the difference was much higher, 9.5 versus 3% (United Nations Population Division, 2005). 3 Data from the CIS Barómetro de septiembre 2006. Estudio 2654, question 5. Available from: <http://www.cis.es> [Accessed 26 February 2009].
2

specificity of the case analysed. The third part deals briefly with the main characteristics
of the databases used in this work. In the fourth place, the methodology and the main
results of the analysis are presented. Last, section five summarizes the main conclusions
obtained.
2. LITERATURE REVIEW
Literature documenting the implications of immigration for the sustainability of
the Welfare State of the receiving countries follows five different perspectives. From a
theoretical perspective, some scholars (Gilens, 1999; Alesina and Glaesser, 2004;
Banting and Kymlicka, 2006) have investigated whether the decrease in cultural and
ethnical homogeneity resulting from immigration could weaken the popularity of the
Welfare State or at least of some of its redistributive programs. From a demographic
perspective, it has been argued that immigration could contribute to solve, at least
partially, the negative implications for the Welfare State of an increasingly older
population and the burden derived from it in terms of growing pension expenditure
(Krieger, 2005; Blake and Mayhew, 2006). In demographically mature countries, it is
argued that, immigrants, being young, would reduce, at least temporarily, the rate of
increase of the dependency rate. From a more mundane, but still general approach, other
researchers have tried to evaluate the overall economic impact of immigration on the
receiving country, often estimating what is known as the “immigrant surplus”.4 The
third approach limits itself to the analysis of the direct budgetary implications of
immigration, estimating the effect of the contribution of immigrants to public sector
income through taxes and their contribution to expenditures through their use of the
different public services and transfer programs. For example, according to Ekberg
(1999), the contribution of immigrants to the Swedish sector was positive (around 1-2%
of GDP) in the decades of full employment (1950-70), levelling in the 1980s and
turning negative nowadays owing to the increase of immigrants’ unemployment rates
(around 2%). Ulrich’s study for Germany arrives at different conclusions, estimating a
slightly positive impact explained by the younger age structure of the immigrant
population (Ulrich, 1994). The conclusion of Wadensjö and Gerdes (2004) for five 4 See, among others, Borjas (1995) for the United States or Dolado and Fernández-Yusta (2001) for Spain.
3
different immigrant communities in Germany ( from Iran, Lebanon, Turkey, Poland and
Yugoslavia) is partially different as they estimate a negative impact for the first
generation and a positive impact in the case of the last two groups for the second
generation. Last, Straubhaar and Weber (1994) estimate that foreign residents in
Switzerland are most likely to be net contributors to the government budget. The works
for Spain are basically limited to the analysis of Collado, Iturbe-Ormaetxe and Valera
(2004), who, based on ad hoc assumptions on payment of taxes and take-up rates of
social benefits by immigrants, determined the long-term impact of immigration on
public budget.5 Logically, their results are influenced to a large extent by the
assumptions made and the demographic composition of immigrant population.
The last approach, the one we follow in this paper, is less ambitious and only
focuses on the expenditure side of the public sector. The purpose is to analyse whether
immigrants have a specific behaviour in relation to social protection once we account
for their socio-economic characteristics. There are many examples of this strategy in the
relevant literature. For example, Borjas and Trejos (1991) found that take-up rates of
welfare benefits of immigrant households were not significantly different to those of
similar native ones. According to Bird et al. (1999), in Germany higher take-up of
social benefits by immigrants were fully explained by socio-demographic
characteristics. Hansen and Lofstrom (2003), whose work was focused on Sweden from
1990 to 1996, showed that immigrants used welfare to a greater extent than nationals,
even when controlling for household characteristics. Bengtsson and Scott (2006), also
for Sweden, reached similar conclusions, in this case referring to the period 1982-91
and limited to sickness benefits. In contrast, Winkelmann (2002), for Switzerland,
concluded that the differences in health care use of female migrants (higher use rates)
tended to be no larger than those observed between Swiss citizens living in different
cantons of the country.
Also worth mentioning is the comparative study by Brücker et al. (2002), who
analysed the perception of the main state cash transfers (unemployment benefits,
pensions and family benefits) by migrants and natives in several European countries.
The main drawback of this work is that, because of its reduced sample size, the database
on which the analysis is based, the European Community Household Panel 1994, 5 There is also a version of this work for a Spanish region, Andalusia (García Pérez, Osuna and Vera, 2007).
4

comprises very few observations (fewer than 20 in some cases) of non-EU citizens in
countries like Spain or Italy. The results obtained were mixed. Regarding
unemployment benefits, while the authors found that being an immigrant had a positive
impact on unemployment benefit dependency in some countries (Denmark, the
Netherlands, France, Austria and Finland), the country of birth had no significant effect
in others (Germany, the United Kingdom, Greece and Spain). With relation to pensions,
owing to the small number of observations only four countries were analysed (Austria,
Greece, France and Belgium), and no residual effect of immigrant status was found.
Finally, the probability of receiving family benefits was higher for immigrants in Spain
and France, lower in the United Kingdom and non-significant in the rest of cases.
Finally, García, González and Saez (2007) studied the use of health care services in a
Spanish region (Catalonia) in 1994 and 2002 and found that the immigrant population
used public health care services to a lesser extent than the locals. However, apart from
being limited to a very particular Spanish region, this work did not control for
demographic and economic characteristics.6
Our work, when controlling for characteristics, tries to evaluate whether
immigrants receive more or fewer welfare benefits and public health care than nationals.
Although the comparative study by Brücker et al. (2002) represents a first attempt to do
so with relation to cash transfers, as mentioned above, the results reported for Spain can
hardly be considered representative because of the few observations available for this
country in the ECHP. The aim of this paper is to overcome some of these shortcomings
faced by the aforementioned authors, since we explore the reception of state cash
transfers from the most national recent household survey, the European Union Social
Indicators on Living Conditions 2005 (EU-SILC 2005) and the use of health care
services from the last wave of the Spanish Health Survey (SHS 2003). Both databases
include large samples and are described in more detail in section 4.
6 Catalonia accounted for 15 and 20% of the Spanish population and the Spanish GDP in 2006, respectively.
5

3. HISTORICAL BACKGROUND OF IMMIGRATION AND THE WELFARE STATE IN SPAIN
3.1. Spanish immigration in historical perspective
Until recently, Spain was a country of emigrants. Three decades ago, at the
height of its intensity, Spain had up to 3 million of workers abroad (from a population
of 34 million) and around 10% of imports could be financed with their remittances
(Oporto del Olmo, 1992). The impact of the economic crisis of 1973 on the host
countries, and the modernization and development of the Spanish economy since then
has greatly reduced, almost eliminated, the emigration of Spanish workers abroad, even
after joining the EU in 1986. On the receiving side, a decade ago Spain was one of the
countries of the EU with a lower proportion of immigrants (1%). In sharp contrast with
these facts, according to census data, in the last few years Spain has witnessed a
gargantuan increase in the number of immigrants, dwarfing all expectations. In less than
a decade the percentage of immigrants in Spain increased from 1.4 to 9.5%.7 In fact, in
the context of the EU only Greece experienced a higher increase (6.7 points from 1990
to 2004) and only Ireland (with 4.8) came anywhere close (Eurostat, 2006).8
According to Census data, non-EU-25 born individuals make up more than two
thirds of immigrants in Spain. The bulk of them (48.5%) come from Latin America,
mostly from Ecuador, Colombia and Argentina. Africans (with 22.9%) are the second
major group (mostly Moroccans), while European non-EU-25 citizens (mostly
Romanians) form the third major group (adding another 21.1%). Finally, nearly 6.5% of
the immigrants come from Asia.9
3.2. Institutional features of the Spanish Welfare State
Spain is one of the countries in the EU-15 with lower social spending as a
percentage of GDP. In 2004, public social expenditure as a percentage of the GDP was
20%, compared to 27.6% in the EU-15. Although it is beyond the scope of this paper to
7 See Bover and Velilla (1999) for details on Spanish immigration flows from an historical perspective. 8 In the case of Greece, immigration is basically explained by the influx of Albanese citizens, while in the Irish case immigration is explained by their huge rate of economic growth in a context of almost full employment. 9 See http://www.ine.es/inebase/cgi/um?M=%2Ft20%2Fe245&O=inebase&N=&L for Spanish Census data.
6

offer an account of the factors behind the comparatively low development of the
Spanish Welfare State, it is important to notice that this lower level of social protection
can only be partially explained by the lower GDP per capita of the country (figure 1).
The same is valid for the dependency rate, another key element in explaining social
expenditure, as the Spanish dependency rate is similar to the average (25.3% compared
to 25.9%).
FIGURE 1 HERE
This lower level of protection characteristic of the Spanish Welfare State is
present in all the rubrics of social protection but one: unemployment protection, because
of the historically higher level of unemployment in Spain (figure 2). When comparing
the average general social protection gap (Spanish relative expenditure is 72% of EU-15
relative expenditure) with the gap in the different categories of social expenditure, the
conclusion is clear: the gap is much higher than warranted by the overall difference in
relative social expenditure in four categories (family and children, housing, survivors,
and social exclusion), to be exact, some of the programs most directly targeted to
populations with low income, i.e., means-tested benefits.
It should be mentioned that old age and survivors’ benefits accounted for more
than 40% of total expenditure on social protection and the Spanish pension system is
mostly based on contributory principles, since, apart from minimum benefits,
redistribution is limited to non-contributory pensions, which comprise roughly 0.2% of
the Spanish GDP.
Regarding health care, several remarks are also required.10 The Spanish National
Health Care System was created in the mid-eighties from the (insurance-oriented) social
security health services. It has a regional organizational structure and coverage is almost
universal (99.5%, only some non-salaried and high income workers are not obliged to
join the National Health System). It is mainly financed by taxes and, excepting doctors’
prescriptions, all health services are free at the point of use, although it is important to
note that there is a system of gate-keepers, that is, in order to visit the specialist
10 See Durán, Lara and van Waveren (2006) for details.
7

individuals have to be referred by their general practitioner. Finally, it is worth
mentioning that even illegal immigrants are also entitled to public health care.
Summing up, Spain has clearly a low profile Welfare State, with the second
lowest level of protection (after Ireland) of the EU-15. Furthermore, this lower level of
development of the welfare state cannot be fully explained by its lower GDP per capita.
In fact, relative social expenditure in Spain is similar to Poland, a country with half its
GDP per capita in 2004.
FIGURE 2 HERE
4. DATABASES
As mentioned, the data sources for analysing social benefits and health care are
two different household surveys: the European Union Social Indicators and Living
Conditions (EU-SILC) survey for the year 2005 and the National Health Survey (NHS)
for the year 2003. The EU-SILC 2005 is used to analyse reception of cash transfers by
immigrants and locals. It follows the common rules regarding sampling design and
other features present in modern household surveys.11 The EU-SILC 2005 has two
important advantages over previous databases. Firstly, it includes data on income and
social inclusion referring to nationals and immigrants for 2004, when immigration in
Spain was already very important. In second place, the size of the EU-SILC has
increased considerably with regard to the ECHP and surveys more than 20,000
households, including around 500 headed by individuals born outside of the EU.
The NHS 2003 represents the most relevant database for analysing issues related
to health status, health habits and use of health care services. Apart from the much older
Family Budget Survey carried out in 1990-1991, the NHS is the only source for
analysing issues related to access to health services and the allocation of public health
expenditure. It includes around 700 observations of non-EU citizens. The NHS presents,
however, many imperfections. It does not contain information about the health care
expenditure received by each individual and only comprises information about the
yearly number of visits to the general practitioner and specialists, days of hospitalization
and emergency room visits.
11 See Eurostat (2005) for details.
8

In addition, we only know who financed a health care service in the case of the
last utilization for each category, which means around 70% of total services delivered.
These problems are not new in the literature and some scholars like Abásolo (1998) and
Urbanos (2000) offer some simple procedures to deal with these difficulties, which we
have approximately followed here. In order to solve this problem we calculated the
average proportion of publicly financed visits and days of hospitalization by immigrant
status and type of coverage. We then applied these values to the 30% of services whose
payer is unknown.12 Lastly, once the number of publicly financed visits and days of
hospitalization has been derived, it is possible to impute a value for public health
expenditure to each person using the average cost of the different services provided by
the National Health System (visits to the general practitioner and the specialist, days of
hospitalization and emergency room visits). This information has been estimated from
the Ramón y Cajal Hospital 2004 Annual Report, one of the most important Spanish
hospitals, situated in Madrid, and the public price list of medical services of one of the
Spanish autonomous regions (Law of Public Fees of the Generalitat Valenciana of
2005).13 It should be noted that because of these limitations of the database, all health
services within each category are valued at the same rate, although there is evidence to
believe that immigrants are treated by pathologies that are less costly for the health
system (Salazar et al., 2003; López Vélez, 2006).14
Another problem of this survey is the high non-response rate for household
income (more than half of the values are missing). With a view to solving this, we
follow the procedure used by Urbanos (2000) and Álvarez (2001), using a different
household survey (the Family Budget Survey 1990-1991) to estimate household
income. For this purpose, we combine the NHS 2003 and the EU-SILC 2004, which is
12 Abásolo (1998) and Urbanos (2000) only used total average values. We consider that it is better to distinguish between immigrants and locals and that there may be important differences between those with only public health insurance and those with private coverage. 13 Unfortunately, because of the decentralization process of the National Health System, since 1990 there is no central source of information on the average cost of different medical services on a nation-wide scale (personal communication from the Ministry of Health to the authors). Other researchers, like Abásolo (1998) and Urbanos (2000), have opted for using the latest data available on a national basis, which dates from 1990. 14 For example, in 2005 15% of births in Spain were from a foreign mother. While the average cost of giving birth is 1,244€ (Cots and Castells, 2004), the average cost of a coronary bypass without PTCA (Percutaneous Transluminal Coronary Angioplasty) with cardiac catheterization, a pathology most frequently treated in the case of natives, is 13.431€ (Spanish Royal Decree Law 1207/2006 on the regulation of the Health Cohesion Fund) .
9

very similar to EU-SILC 2005 and includes information on household income in
2003.15 Finally, it is worth mentioning that some civil servants in Spain can opt between
the National Health System and private health services funded by the state. Since in the
NHS there are serious difficulties to identify private services publicly funded from
private services paid by individuals, those civil servants opting for private services were
removed from the sample.
One relevant decision to be made ex ante the empirical analysis is to define who
is an immigrant. In principle, one could choose between two alternatives: country of
birth and nationality. The existence of different naturalization rules according to the
country of origin (fewer years of residence for citizens from Latin American countries,
for example) makes us favour the former criterion. Furthermore, the country of birth
criterion is a common choice followed in other studies (Brücker et al., 2002; Bird et al.,
1999; Hansen and Lofstrom, 2003; Anastassova and Paligorova, 2006). Therefore, we
adopt the criterion of country of birth to define immigrant status in the analysis from
EU-SILC. However, as in the NHS only information on citizenship is available, we
followed the nationality criterion when working with this second database.
Another important point to address is whether to consider all foreign born
population as immigrants. According to the local perception, one should consider as
immigrants people born outside EU-15, a choice made for example, by Brücker et al.
(2002). Unfortunately, both the EU-SILC 2005 and the NHS 2003 contain little
information about the specific country of immigrants and it is only possible to
distinguish between Spanish, EU-citizens (i.e., from a country belonging to the EU-25),
other Europeans and people from other foreign countries. Therefore, we have defined
nationals as people born in Spain or the present EU-25 and immigrants as people whose
country of birth is outside of the EU. Fortunately, this criterion, although not the
optimum, does not exclude Romanians or Bulgarians, two very important groups among
immigrant workers according to Census data.
A final remark to be made has to do with our decision, when working with
household data, of considering that the immigrant or the native status of a household is
15 The procedure followed here basically consists in estimating by OLS the determinants of log household income from the EU-SILC 2004 using a set of variables also present in the NHS 2003. The estimated coefficients are then used to predict and impute log income of households in the NHS 2003. All these calculations are available on request.
10

determined by its head, as it is commonly assumed in the literature (Borjas and Trejo,
1991; Hansen and Lofstrom, 2003; Anastassova and Paligorova, 2006).
5. IMMIGRANTS AND THE WELFARE STATE
5.1. Social transfers in cash
The take-up of cash benefits by immigrants versus locals is the obvious starting
point in the discussion on the Welfare State implications of immigration. A first glance
at take-up rates for the different social benefits available in Spain shows that a lower
proportion of immigrants than nationals receive transfers (Table 1). However, if
pensions are excluded, there is no statistical difference in take-up rates between both
population groups. Considering the transfers individually, significant differences in the
reception of benefits can be found only in pensions and sickness benefits, with a higher
percentage of recipient households among local population. Regarding the rest of the
benefits, although the proportion of immigrant households receiving some transfers
(unemployment benefits, family assistance, social assistance and housing) is higher than
among locals, the percentages are not statistically different. The low proportion of
households (among both groups) receiving any social transfer apart from unemployment
benefits and pensions can be observed. With relation to the average transfer received by
households, a similar pattern arises.
In order to test to what extent the recorded differences between locals and
immigrants in the receiving of social benefits are related to differences in the personal
and occupational characteristics of both groups, we carry out several different
econometric analyses. A detailed description of the variables considered in them is
presented in Table A1 in Annex I. In the first place, we focus our attention on total
social cash transfers, including and excluding pensions. This analysis is carried out at a
household level, since most of these kinds of benefits are assigned on a household basis.
Secondly, we analyse take-up rates for the two most important welfare programs in
Spain: unemployment benefits and pensions. This second exercise is performed at an
individual level and only people aged 16 or more are included.
TABLE 1 HERE
11

As mentioned, the first step is to determine whether being an immigrant is a
factor contributing, ceteris paribus, towards receiving cash transfers. With this aim, we
estimate a tobit model, since social income (transfers received by each household) is a
continuous variable with a high proportion of zero values. The use of hurdle or two-part
models is not appropriate in this case since a household receiving 1 euro from social
transfers is not essentially different from another one not receiving social transfers at all.
Furthermore, if we considered health or education expenditures along with social
transfers, there would probably not be any zero values, so we are not really working
with a model with two variables (participation in the program and size of the transfer
received). Letting yi be a continuous variable denoting social benefits received by
household I, the tobit model can be expressed as
*max(0, )iy = iy [1]
where *iy is a latent variable generated by the following process:
*i i iy X β u= + [2]
where
2| (0,i iu X N )σ∼ [3]
Xi denotes a vector of observable socio-demographic characteristics of household
i, including immigrant status, household size, household size squared, number of
children in the household, and sex, age, marital status, education and main activity of
household head. β is a vector of coefficients for each characteristic. We present average
characteristics by household for welfare participation in Table 2. The results of these
econometric exercises are showed in Tables 3 and 4. It can be observed that, even after
controlling for several household and household head characteristics, being an
immigrant household has a negative effect on cash transfers received (Table 3). If
pensions are excluded from computed social income, once we control for observable
12
characteristics, the results found are very similar (table 4). These outcomes, like the
ones reported above, may be explained by the non-universal nature of most Spanish
social transfers and the important role played in the Spanish Welfare State by benefits
related to the employment record of the beneficiary, like pensions and unemployment
insurance.
TABLE 2 HERE
TABLE 3 HERE
TABLE 4 HERE
In the second step to studying social transfers in Spain, that is, analysing the
take-up rates for the most important social programs, we closely follow the work of
Brücker et al. (2002). By formulating a probit model, we aim to determine if being a
non-EU citizen influences the probability of receiving unemployment benefits or
pensions. The dependent variable is a binary variable, Pi, which adopts value 1 for
individuals receiving unemployment benefits/pensions and value 0 otherwise. The
model can be described as:
( ) 1, 2,..., i iP X i Nβ= Φ ∀ = [4]
where Φ(.) is the normal cumulative density function, i is subscript that denotes the ith
individual, Xi is a vector of observable socio-demographic characteristics of each
individual, including immigrant status, household size, household size squared, number
of children in the household, sex, age, marital status, education and main activity and β
is a vector of coefficients for each characteristic. Table 5 shows the main descriptive
statistics of variables used in the regression and econometric results are presented in
Tables 6 and 7. Results are not surprising and agree with those reported above. While
immigrant status is not relevant in explaining the reception of unemployment benefits,
the probability of receiving pensions is lower for non-EU citizens, even after controlling
by observable characteristics. Although eligibility for pension benefits mainly depends
on age, portability problems (i.e., people who work for a long time outside Spain) can
also help to explain this residual effect.
13
TABLE 5 HERE
TABLE 6 HERE
TABLE 7 HERE
5.2. Public health expenditure
Using the NHS 2003 and following the methodology described in detail above,
rates of public health services use for immigrants and locals are calculated and, then, a
weighted public health spending is imputed to each individual. As it is presented in
Table 8, according to the data, immigrants receive lower health expenditure than locals,
but the difference is not significant in statistical terms. With respect to the use of health
services, only significant divergences are detected for visits to the general practitioner
and emergency services use, with locals showing slightly higher rates of use.
TABLE 8 HERE
In order to see if the condition of immigrant per se is an explanatory variable of
the use of health services, we perform a multivariate analysis. As in the previous sub-
section, a tobit model is estimated, although other econometric techniques were also
used to test the robustness of the results (see Annex II). Variables used in the analysis
are described in detail in Table A2 in Annex I and the main descriptive statistics are
presented in Table 9.
TABLE 9 HERE
The model formulated here is very similar to the one presented above, but the
analysis is carried out at an individual level. Imputed public health spending is the
dependent variable and, apart from the immigrant status, the covariates are a set of need
variables (self-perceived health status and variables associated with accidents, chronic
and acute illnesses, smoking, drinking alcohol, practising sport and limitation of
activity) and several socio-demographic variables (sex, age, age squared, educational
14

level, marital status, main activity status, household income, household size, household
size squared, number of children in the household, number of earners in the household
and having or not private insurance).
The results of the econometric analysis (Table 10) indicate that, once we control
for age, sex, different variables of health risk and a set of socioeconomic variables of
the individuals, statistically speaking, immigrants do not consume more health services
than locals (in addition, though non-significant –p-value is above 0.4-, the marginal
effect of being immigrant is of only 50€). Furthermore, the application of other
econometric techniques widely used in health economics, particularly, several sorts of
two-part models (probit-OLS, probit-log OLS and probit-GLM) do not show different
results. Therefore, the hypothesis of an over-consumption of health services by
immigrants should be rejected.
TABLE 10 HERE
6. CONCLUSIONS
Our aim in this paper has been to deal in a comprehensive way with the topic of
immigration and Welfare use in Spain. The analysis presented here includes two
different dimensions: social benefits in cash and use of public health services. By means
of two representative household surveys, it was found, firstly, that immigrant
households receive fewer cash transfers than local ones, even after controlling for
observable characteristics, and this result holds even if pension income is excluded. The
profile of the Spanish Welfare State, with one of the lowest levels of social spending in
the EU-15 and its emphasis on contributory benefits, may contribute to explain these
findings. In the second place, regarding the use of public health services, the results
presented here have shown that health spending received by immigrants is not
statistically higher than that allocated to natives. These results do not necessarily imply
that immigration will not put more pressure on the Spanish Welfare State. It is possible
that in a few years, when the immigrant population has aged and satisfies to a larger
extent requirements and eligibility conditions for pensions and unemployment benefits,
a phenomenon of migrant Welfare dependency will arise. Anyway, because of the scant
15

priority given to means-tested programs by Spanish governments, the relevance of this
issue would be smaller than in other countries with more generous Welfare regimes.
This work also shows several limitations. The most important one is the sample
sizes of the household surveys used. Although the study uses the most recent and largest
databases, which are of substantially higher quality than those used in previous
literature, only a few hundred observations of immigrants are available. Furthermore,
the definition of immigrant is far from being optimal. As a consequence, this work
could be extended in several directions. Firstly, the release of new health databases
(such as the NHS 2006) will make it possible to check the robustness of some of the
results presented here. In the second place, a separate study on the different
determinants of the demand of public health services is required in order to better
understand potential behaviour differences between immigrants and locals. Finally,
future waves of the EU-SILC will allow studies to be carried out on Welfare recipiency
from a (much richer) longitudinal perspective.
REFERENCES
Abásolo, I. 2003. “Equidad horizontal en la distribución del gasto público en sanidad
por grupos socioeconómicos en Canarias. Un estudio comparado con el conjunto
español,” Hacienda Pública Española 137: 3-28.
Alesina, A. and E. Glaeser. 2004. Fighting Poverty in the US and Europe: A World of
Difference. Oxford: Oxford University Press.
Álvarez, B. 2001. “La demanda atendida de consultas médicas y servicios urgentes en
España,” Investigaciones Económicas 25: 93-138.
Anastassova, L. and T. Paligorova. 2006. “What is Behind the Native-Immigrant Social
Income Gap?,” Luxembourg Income Study Working Paper 432.
Banting, K. and W. Kimlicka. 2006. Multiculturalism and the Welfare State:
Recognition and Redistribution in Contemporary Democracies. Oxford: Oxford
University Press.
Bengtsson, T. and K. Scott. 2006. “Immigrant consumption of sickness benefits in
Sweden, 1982-1991,” Journal of Socio Economics 35: 440-457.
16

Bird, E. J., H. Kayser, J.R. Frick and G.G. Wagner 1999 “The Immigrant Welfare
Effect: Take-Up or Eligibility?,” IZA Discussion Paper 66.
Blake, D. and L. Mayhew. 2006. “On the Sustainability of the UK State Pension
System in the Light of Population Ageing and Declining Fertility,” Economic
Journal 116: 286-305.
Borjas, G.J. 1995. “The Economic Benefits from Immigration,” Journal of Economic
Perspectives 9: 3-22.
Borjas, G.J. and S.J. Trejo. 1991 “Immigrant participation in the Welfare system,”
Industrial and Labor Relations Review 44: 195-211.
Bover, O. and P. Velilla. 1999. Migration in Spain: Historical Background and Current
Trends. IZA Discussion Paper 88.
Brücker, H., G.S. Epstein, B. McCormick, B., G. Saint-Paul, A. Venturini and K.F.
Zimmermann. 2002. “Welfare State Provision,” in T. Boeri, G. H. Hanson and B.
McCormick (eds.), Immigration Policy and the Welfare System. London: Oxford
University Press, pp. 66-90.
Collado, M.D., I. Iturbe-Ormaetxe and G. Valera. 2004. “Quantifying the Impact of
Immigration on the Spanish Welfare State,” International Tax and Public Finance
11: 335-353.
Cots, F. and X. Castells. 2004. “Diferencias del coste hospitalario del parto entre
población nacional e inmigrante”. Paper presented at the XXIV Meeting on Health
Economics, El Escorial, Spain, May.
Dolado, J.J. and C. Fernández-Yusta. 2001. “Los nuevos fenómenos migratorios: retos
y políticas”. Paper presented at the Fourth Meeting of the Centre de Recerca en
Economia Internacional, Universidad Pompeu Fabra, Barcelona, Spain, October.
Durán, A., J.L. Lara and M. van Waveren. 2006. Spain: Health System Review.
Copenhagen: World Health Organization.
Ekberg, J. 1999. “Immigration and the Public sector: Income effects for the native
population in Sweden,” Journal of Population Economics 12: 411-430.
Eurobarometer. 2007. “Public Opinion in the European Union,” [Internet] Spring 2006,
65. Available from:
<http://ec.europa.eu/public_opinion/archives/eb/eb65/eb65_en.pdf> [Accessed 26
February 2009]
17

Eurostat. 2001. “Why do people migrate,” Statistics in focus 1/2001.
Eurostat. 2006. “Non-national populations in the EU Member States,” Statistics in
focus 8/2006.
García Pérez, J. I., V. Osuna and G. Vera. 2007. “La inmigración y sus efecto en las
finanzas públicas andaluzas,” in J.J. Dolado and P. Vázquez (eds.), Ensayos sobre
los efectos económicos de la integración en España. Madrid: FEDEA, pp. 98-126.
García, P., S. González and S. Saez. 2007. “Diferencias en estado de salud y en los
condicionantes de utilización de los servicios sanitarios entre la población de
origen extranjero,” in G. López i Casanovas (dir.), Inmigración y transformación
económica en Cataluña (vol. I). Aspectos socioeconómicos del fenómeno
migratorio: las cuestiones relevantes. Bilbao: Fundación BBVA, pp. 257-304.
Gilens, M. 1999. Why Americans Hate Welfare: Race, Media and the Politics of
Antipoverty Policy. Chicago: Chicago University Press.
Hansen, J. and M. Lofstrom. 2003.” Immigrant Assimilation and Welfare Participation:
Do Immigrants Assimilate Into or Out-of Welfare?,” Journal of Human
Resources 38: 74-98.
Hatton, T.J. and J.G. Williamson. 2005. Global Migration and the World Economy.
Two Centuries of Policy and Performance. Boston: MIT Press.
Krieger, T. 2005. Public Pensions and Immigration. A Public Choice Approach,
Northampton, M.A.: Edward Elgar.
López Vélez, R. 2006. La salud del inmigrante con especial referencia a la población
pediátrica. Madrid: GlaxoSmithKline,.
Nielsen, N. 2004. “Social Transfers to Immigrants in Germany and Denmark,” in . T.
Trances and K.F. Zimmermann (eds.), Migrants, Work and the welfare State.
Odense: University Press of Southern Denmark, pp. 245-284.
Oporto del Olmo, A. 1992 Emigración y ahorro en España 1959-1986. Madrid:
Ministerio de Trabajo y Seguridad Social.
Salazar, A., E. Navarro-Calderón et al. 2003. “Diagnósticos al alta hospitalaria de las
personas inmigrantes en la ciudad de Valencia 2001-2002,” Revista de Salud
Pública 77: 713-723.
18

Straubhaar, T. and R. Weber. 1994. “On the Economics of Immigration: Some
Empirical Evidence for Switzerland,” International Review of Applied Economics
8: 107-129.
Ulrich, R. 1994. “The Impact of Foreigners on the Public Purse,” in S. Spencer (ed.),
Immigration as an Economic Asset: The German Experience. Staffordshire:
Trentham Books, pp. 65-91.
United Nations Population Division. .2005. “Trends in Total Migrant Stock: The 2005
Revision,” [Internet] Department of Economic and Social Affairs, The United
Nations. Available from:
<http://www.un.org/esa/population/publications/migration/> [Accessed 26
February 2009].
Urbanos, R.M. 2000. “La prestación de los servicios sanitarios públicos en España:
cálculo y análisis de la equidad horizontal interpersonal para el período 1987-
1995,” Hacienda Pública Española 153: 139-160.
Wadensjö, E. and C. Gerdes. 2004. “Immigrants and the public sector in Denmark and
Germany,” in T. Trances and K.F. Zimmermann (eds.), Migrants, Work and the
welfare State. Odense: University Press of Southern Denmark, pp. 319-357.
Winkelmann, R. .2002. “Work and health in Switzerland: Immigrants and Natives,
Working Paper 203,” [Internet] University of Zurich. Available from:
<http://www.soi.uzh.ch/research/wp/wp0203.pdf> [Accessed 26 February 2009].
ANNEX I
TABLE A1 HERE
TABLE A2 HERE
ANNEX II
TABLE A3 HERE
19
Figure 1. GDP per capita and public social spending as % of the GDP in the EU-25 and the EES (2004)
LAT
LITEST
SLK IRECYMT
CZESPOL
HUN
POR
SLO
GRE
ICE
NORUK
EU-25
ITA
SWEFRA
GER SWI
FIN
DNKBEL
AUS NETEU-15
y = 11.75 + 0.1212x R2 = 0.4229
10
15
20
25
30
35
0 25 50 75 100 125 150 175 200
GPD (PPP) per capita (EU-25 = 100)
Soci
al sp
endi
ng (%
of t
he G
DP)
Source: Authors’ analysis from Eurostat database.
20

Figure 2. Social spending by category in Spain (as % of the GDP) as % of the EU-15 equivalent (2004)
7280
71
139
50
3340
50
72
0
20
40
60
80
100
120
140
160
Old
age
Sick
ness
/Hea
lthca
re
Dis
abili
ty
Une
mpl
oym
ent
Surv
ivor
s
Fam
ily/c
hild
ren
Hou
sing
Soci
al e
xclu
sion
Tota
l soc
ial
spen
ding
%
Source: Authors’ analysis from Eurostat database.
21

Table 1. Estimates of the take-up rates of social cash benefits and average transfers for locals and immigrants in Spain (2004)
% household receiving cash transfers Average cash transfer received (euros, all households) Average cash transfer received (euros, only recipient households)
Total Locals Immigrants Means test Total Locals Immigrants Means test Total Locals Immigrants Means test
Any social benefit 56.6 57.6 32.4 *** 5,092 5,234 1,787 *** 8,999 9,084 5,512 ***
Any social benefit (except pensions) 23.2 23.2 23.6 1,040 1,054 712 *** 4,489 4,554 3,018 ***
Pensions 41.7 43.0 11.3 *** 4,399 4,539 1,168 *** 10,592 10,593 10,484
Unemployment benefits 11.0 10.9 13.4 409 409 409 3,780 3,817 3,092
Sickness benefits 3.1 3.2 1.6 *** 132 136 44 *** 4,584 4,615 3,080 **
Family assistance 3.0 3.0 3.6 58 58 42 1,910 1,947 1,178 ***
Social assistance 0.7 0.6 1.4 15 14 31 2,190 2,185 2,250
Housing 0.8 0.8 1.9 41 40 72 4,880 5,000 3,741
Scholarships 4.0 4.0 3.9 44 45 24 1,161 633 1,184 *
*** significant at 1%; ** significant at 5%; * significant at 10%.
Source: Authors’ analysis from EU-SILC 2005.

Table 2. Main observable characteristics by immigrant status and welfare recipiency
Any social benefit Any social benefit (except pensions)
Locals Immigrants Locals Immigrants
Non rec. Rec. Non rec. Rec. Non rec. Rec. Non rec. Rec.
Household characteristics Household size (mean) 3.0 2.7 3.4 3.3 2.7 3.3 3.3 3.5 Number of children (mean) 0.5 0.2 0.8 0.8 0.3 0.5 0.7 1.0 Number of earners (mean) 1.7 0.8 1.7 1.4 1.1 1.3 1.6 1.6 H.H. characteristics Sex (%)
Man 75.7 62.9 70.0 75.3 67.9 69.8 69.2 80.0 Woman 24.3 37.1 30.0 24.7 32.2 30.2 30.9 20.0
Age group (%) 25 or under 1.4 0.6 3.9 0.0 0.9 1.1 3.4 0.0 26 to 45 54.6 18.6 69.1 58.8 31.6 41.5 61.7 78.9 46 to 60 37.1 21.9 24.7 21.0 25.9 36.6 25.4 17.2 61 or over 6.9 58.9 2.3 20.2 41.7 20.8 9.4 3.9
Education (%) Elementary 24.7 60.3 24.3 20.0 45.8 43.2 24.7 17.2 Basic 21.3 13.8 10.8 8.6 16.1 20.0 9.9 10.8 Intermediate 23.3 12.1 35.5 33.1 16.5 18.0 35.7 31.3 High 30.7 13.8 29.4 38.3 21.6 18.8 29.7 40.7
Marital status (%) Single 17.4 10.6 27.6 17.4 13.8 12.7 25.6 20.0 Married 74.4 62.7 58.8 66.5 65.7 74.1 59.9 65.7 Divorced/separated 6.7 3.8 10.8 10.1 4.8 5.7 10.5 10.9 Widow/widower 1.5 22.9 2.8 6.0 15.7 7.4 4.0 3.4
Activity (%) Employed 72.6 25.2 79.5 61.7 43.7 50.6 74.8 70.4 Self-employed 18.7 5.3 11.4 3.3 11.6 8.9 10.3 3.9 Unemployed 2.8 5.8 5.0 13.0 2.2 12.2 4.5 17.4 Retired 0.0 44.0 0.0 13.6 29.4 12.0 5.3 1.4 Other inactivity 5.9 19.7 4.1 8.4 13.1 16.3 5.0 6.9
% of total households 95.9 4.1 95.9 4.1
% receiving benefits 57.6 32.4 23.2 23.6
Transfers received (euros) (mean) 5,234 1,787 1,054 712
Source: Authors’ analysis from EU-SILC 2005.
Table 3. Determinants of social benefits recipiency in Spain (tobit model) (2004)
Coefficients M.E. Coefficients M.E. Coefficients M.E.
Constant 1658.2 *** 1787.5 *** -8156.0 ***
Immigrant (Local = 0) -7710.1 *** -3272.0 *** -3216.3 *** -1600.3 *** -1725.2 ** -970.9 ***
Household characteristics
Household size 3934.2 *** 2208.8 *** 4600.5 *** 2768.2 ***
Household size squared -47.0 -26.4 -301.8 *** -181.6 ***
Number of children -5889.1 *** -3306.3 *** -2402.4 *** -1445.6 ***
Number of earners -7331.5 *** -4116.1 *** -2388.4 *** -1437.2 ***
Household head characteristics
Women (man = 0) -330.9 -198.2
Age of household head (61 or more = 0)
25 or under -4930.0 *** -2375.7 ***
26 to 45 -3666.0 *** -2106.1 ***
46 to 60 -2648.6 *** -1517.8 ***
Marital status (married = 0)
Single 2052.9 *** 1307.3 ***
Divorced/separated -46.7 -28.0
Widow/widower 2701.6 *** 1751.1 ***
Education (Elementary = 0)
Basic 1056.7 *** 653.7 ***
Intermediate 1553.3 *** 972.0 ***
High 2481.2 *** 1575.9 ***
Activity (Employed = 0)
Self-employed -882.3 -516.0 *
Unemployed 5315.2 *** 3768.9 ***
Retired 11857.1 *** 8541.8 ***
Other inactivity 7042.8 *** 5023.5 ***
R2 0.01 0.29 0.44
Wald χ 83.23*** 1,501.2*** 2,050.1***
Observations 12,661 12,661 12,661
*** significant at 1%; ** significant at 5%; * significant at 10%.
Source: Authors’ analysis from EU-SILC 2005.
24

Table 4. Determinants of social benefits recipiency (apart from pensions) (tobit model) in Spain (2004)
Coefficients M.E. Coefficients M.E. Coefficients M.E.
Constant -7,247.3 *** -15,752.5 *** -17,442.7 ***
Immigrant (Local = 0) -517.4 -109.5 -736.1 -145.5 -1,822.6 ** -341.1 ***
Household characteristics
Household size 4,686.1 *** 974.7 *** 4,433.8 *** 947.4 ***
Household size squared -381.8 *** -79.4 *** -340.9 *** -72.8 ***
Number of children -263.8 -54.9 -1,115.5 *** -238.3 ***
Number of earners -930.3 *** -193.5 *** -786.2 *** -168.0 ***
Household head characteristics
Women (man = 0) -1,686.9 *** -343.7 ***
Age of household head (61 or more = 0)
25 or under 2,622.5 ** 682.0 *
26 to 45 4,052.3 *** 957.8 ***
46 to 60 2,927.0 *** 693.1 ***
Marital status (married = 0)
Single 1,941.4 *** 462.7 ***
Divorced/separated 1,659.6 *** 397.9 ***
Widow/widower -774.8 -158.3
Education (Elementary = 0)
Basic -662.5 * -136.7 *
Intermediate -925.6 ** -188.7 **
High -854.0 ** -175.7 **
Activity (Employed = 0)
Self-employed -1,756.6 *** -336.8 ***
Unemployed 7,625.3 *** 2,675.0 ***
Retired -775.1 -160.6
Other inactivity 4,939.3 *** 1,390.9 ***
R2 0.00 0.02 0.07
Wald test ** ***
Observations 12,661 12,661 12,661 *** significant at 1%; ** significant at 5%; * significant at 10%.
Source: Authors’ analysis from EU-SILC 2005.
25
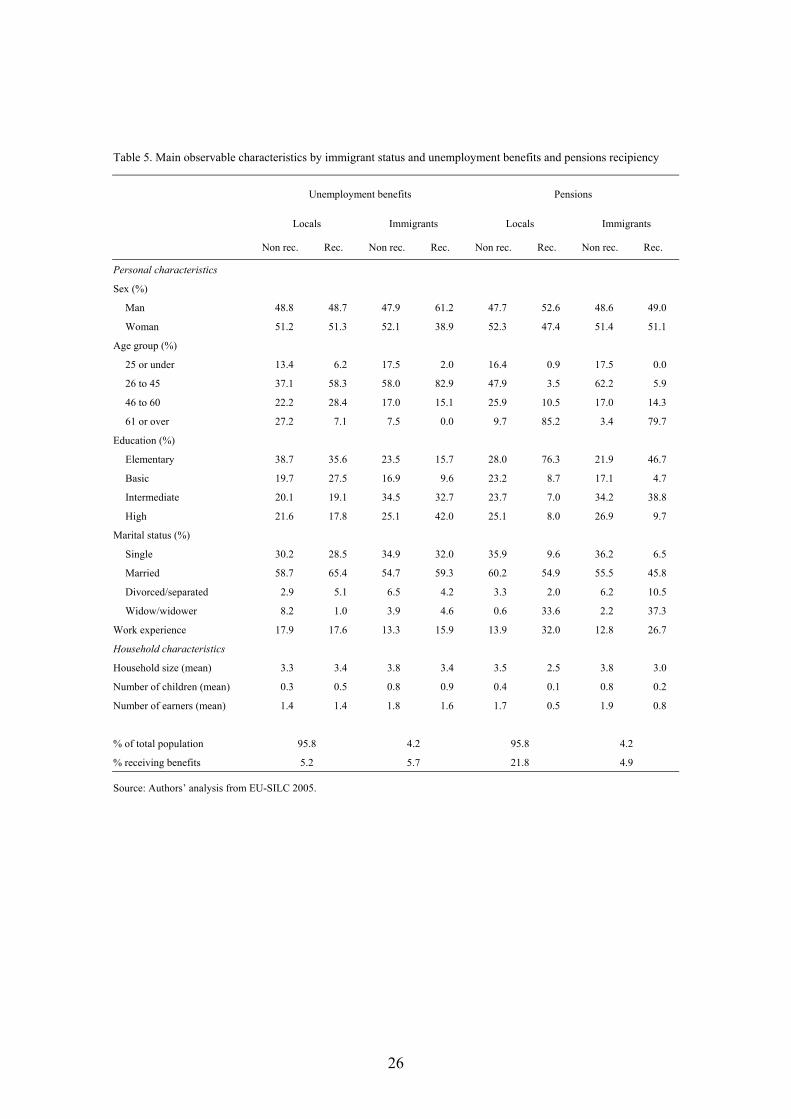
Table 5. Main observable characteristics by immigrant status and unemployment benefits and pensions recipiency
Unemployment benefits Pensions
Locals Immigrants Locals Immigrants
Non rec. Rec. Non rec. Rec. Non rec. Rec. Non rec. Rec.
Personal characteristics Sex (%)
Man 48.8 48.7 47.9 61.2 47.7 52.6 48.6 49.0
Woman 51.2 51.3 52.1 38.9 52.3 47.4 51.4 51.1
Age group (%)
25 or under 13.4 6.2 17.5 2.0 16.4 0.9 17.5 0.0
26 to 45 37.1 58.3 58.0 82.9 47.9 3.5 62.2 5.9
46 to 60 22.2 28.4 17.0 15.1 25.9 10.5 17.0 14.3
61 or over 27.2 7.1 7.5 0.0 9.7 85.2 3.4 79.7
Education (%)
Elementary 38.7 35.6 23.5 15.7 28.0 76.3 21.9 46.7
Basic 19.7 27.5 16.9 9.6 23.2 8.7 17.1 4.7
Intermediate 20.1 19.1 34.5 32.7 23.7 7.0 34.2 38.8
High 21.6 17.8 25.1 42.0 25.1 8.0 26.9 9.7
Marital status (%)
Single 30.2 28.5 34.9 32.0 35.9 9.6 36.2 6.5
Married 58.7 65.4 54.7 59.3 60.2 54.9 55.5 45.8
Divorced/separated 2.9 5.1 6.5 4.2 3.3 2.0 6.2 10.5
Widow/widower 8.2 1.0 3.9 4.6 0.6 33.6 2.2 37.3
Work experience 17.9 17.6 13.3 15.9 13.9 32.0 12.8 26.7
Household characteristics
Household size (mean) 3.3 3.4 3.8 3.4 3.5 2.5 3.8 3.0
Number of children (mean) 0.3 0.5 0.8 0.9 0.4 0.1 0.8 0.2
Number of earners (mean) 1.4 1.4 1.8 1.6 1.7 0.5 1.9 0.8
% of total population 95.8 4.2 95.8 4.2
% receiving benefits 5.2 5.7 21.8 4.9
Source: Authors’ analysis from EU-SILC 2005.
26

Table 6. Determinants of unemployment insurance dependency in Spain (probit model) (2004)
Coefficients M.E. (%) Coefficients M.E. (%) Coefficients M.E. (%)
Constant -1.630 *** -1.403 -1.366 ***
Immigrant (Local = 0) 0.045 0.5 -0.033 -0.3 -0.010 -0.1
Personal characteristics
Sex (Man = 0) 0.087 ** 0.8 ** 0.093 ** 0.8 **
Age (26 to 45 = 0)
25 or under -0.533 *** -3.3 *** -0.514 *** -3.2 ***
46 to 60 -0.248 *** -1.9 *** -0.258 *** -2.0 ***
61 or over -0.970 *** -6.0 *** -1.097 *** -6.6 ***
Education (Elementary = 0)
Basic -0.029 -0.2 -0.015 -0.1
Intermediate -0.211 *** -1.6 *** -0.193 *** -1.5 ***
High -0.312 *** -2.3 *** -0.284 *** -2.2 ***
Marital status (Married = 0)
Single 0.024 0.2 0.030 0.3
Divorced/separated 0.129 * 1.2 * 0.100 0.9
Widow/widower -0.511 *** -3.1 *** -0.511 *** -3.1 ***
Work experience 0.007 *** 0.1 *** 0.009 *** 0.1 ***
Household characteristics
Household size 0.056 0.5
Household size squared -0.005 0.0
Number of children -0.015 -0.1
Number of earners -0.117 *** -1.0 ***
Mc Fadden R2 0.00 0.06 0.07
Wald χ 0.3 449.3*** 465.2***
Observations 29,203 29,203 29,203 *** significant at 1%; ** significant at 5%; * significant at 10%.
Source: Authors’ analysis from EU-SILC 2005.
27
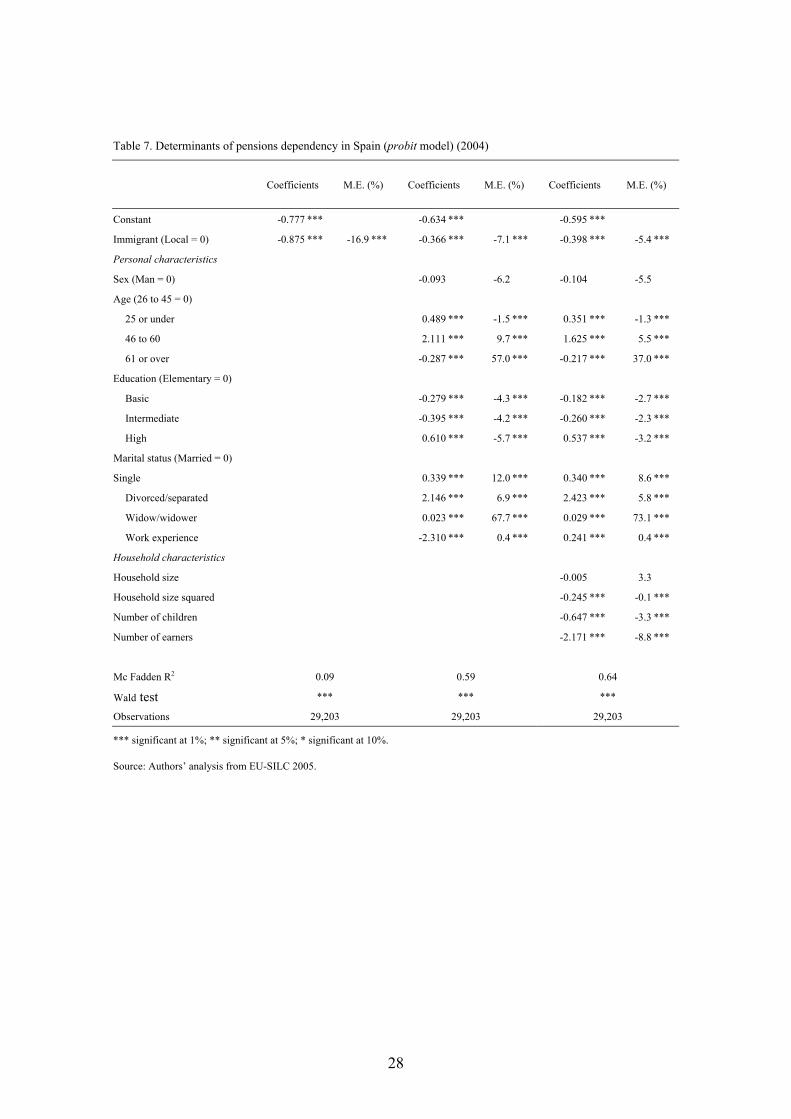
Table 7. Determinants of pensions dependency in Spain (probit model) (2004)
Coefficients M.E. (%) Coefficients M.E. (%) Coefficients M.E. (%)
Constant -0.777 *** -0.634 *** -0.595 ***
Immigrant (Local = 0) -0.875 *** -16.9 *** -0.366 *** -7.1 *** -0.398 *** -5.4 ***
Personal characteristics Sex (Man = 0) -0.093 -6.2 -0.104 -5.5
Age (26 to 45 = 0) 25 or under 0.489 *** -1.5 *** 0.351 *** -1.3 ***
46 to 60 2.111 *** 9.7 *** 1.625 *** 5.5 ***
61 or over -0.287 *** 57.0 *** -0.217 *** 37.0 ***
Education (Elementary = 0) Basic -0.279 *** -4.3 *** -0.182 *** -2.7 ***
Intermediate -0.395 *** -4.2 *** -0.260 *** -2.3 ***
High 0.610 *** -5.7 *** 0.537 *** -3.2 ***
Marital status (Married = 0) Single 0.339 *** 12.0 *** 0.340 *** 8.6 ***
Divorced/separated 2.146 *** 6.9 *** 2.423 *** 5.8 ***
Widow/widower 0.023 *** 67.7 *** 0.029 *** 73.1 ***
Work experience -2.310 *** 0.4 *** 0.241 *** 0.4 ***
Household characteristics Household size -0.005 3.3
Household size squared -0.245 *** -0.1 ***
Number of children -0.647 *** -3.3 ***
Number of earners -2.171 *** -8.8 ***
Mc Fadden R2 0.09 0.59 0.64
Wald test *** *** ***
Observations 29,203 29,203 29,203 *** significant at 1%; ** significant at 5%; * significant at 10%.
Source: Authors’ analysis from EU-SILC 2005.
28
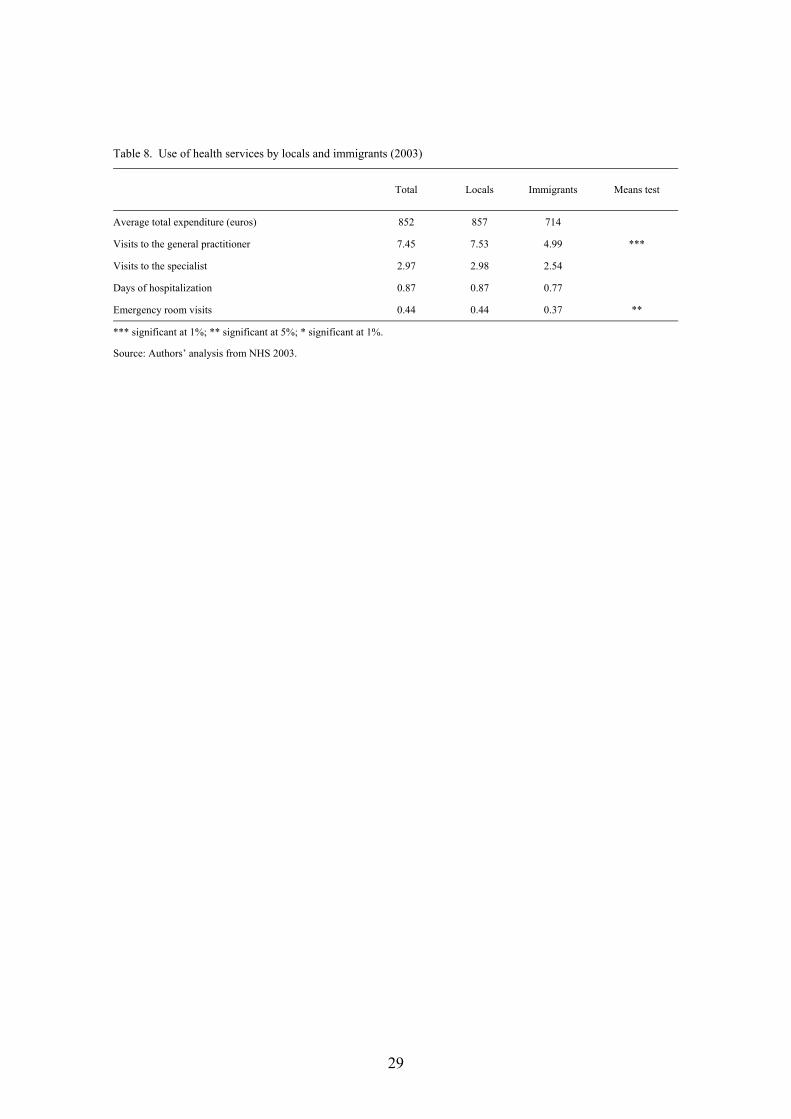
Table 8. Use of health services by locals and immigrants (2003)
Total Locals Immigrants Means test
Average total expenditure (euros) 852 857 714
Visits to the general practitioner 7.45 7.53 4.99 ***
Visits to the specialist 2.97 2.98 2.54
Days of hospitalization 0.87 0.87 0.77
Emergency room visits 0.44 0.44 0.37 **
*** significant at 1%; ** significant at 5%; * significant at 1%.
Source: Authors’ analysis from NHS 2003.
29

Table 9. Main observable characteristics by immigrant status and public health spending recipiency
Locals Immigrants
Non rec. Rec. Non rec. Rec.
Need variables Sex (%) Man 61.1 46.5 62.6 45.2 Woman 38.9 53.5 37.4 54.8 Age (mean) 35.6 41.1 28.8 28.5 Health status (%)
Very good 22.8 10.9 22.0 15.8 Good 69.4 55.0 72.9 59.8 Not bad 7.0 24.6 4.6 21.7 Bad 0.8 7.2 0.5 2.2 Very bad 0.1 2.4 0.0 0.6
Accidents (%) 2.8 11.7 0.0 11.0 Chronic illnesses (%) 19.5 49.2 12.1 24.6 Acute illnesses (%) 5.2 26.6 3.5 22.4 Limitation of activity (last year) (%) 5.9 16.6 7.3 15.2 Limitation of activity (2 weeks) (%) 4.0 18.5 1.9 6.9 Smoker (%) 33.7 24.9 25.0 19.2 Alcohol (%) 17.7 14.4 7.5 5.1 Sport (%) 47.8 44.2 39.6 39.8 Socio-demographic variables Personal variables Education (%)
Elementary 34.0 47.2 30.9 37.6 Basic 19.6 19.3 16.5 14.0 Intermediate 26.4 21.1 35.1 31.3 High 20.0 12.4 17.5 17.1
Marital status (%) Single 50.1 41.4 53.3 54.1 Married 45.3 49.1 44.4 39.9 Divorced/separated 2.3 2.2 2.2 4.1 Widow/widower 2.3 7.3 0.0 1.8
Activity (%) Aged 16 or under 11.4 16.4 11.5 21.2 Employed 55.6 35.8 65.3 49.8 Unemployed 6.1 4.9 6.4 6.0 Retired 6.5 18.8 0.5 2.4 Other inactivity 20.5 24.2 16.3 20.7
Household variables Household size (mean) 3.8 3.5 4.5 4.3 Number of children (mean) 0.7 0.6 1.1 1.1 Number of earners (mean) 1.6 1.3 2.3 1.9 Log household income (mean) 10.0 9.9 10.1 10.0 Private insurance (%) 20.6 11.1 14.3 4.7
% of total population 96.8 3.2 % receiving health spending 81.4 79.1 Health spending received (euros) (mean) 857 714
Source: Authors’ analysis from NHS 2003.
30
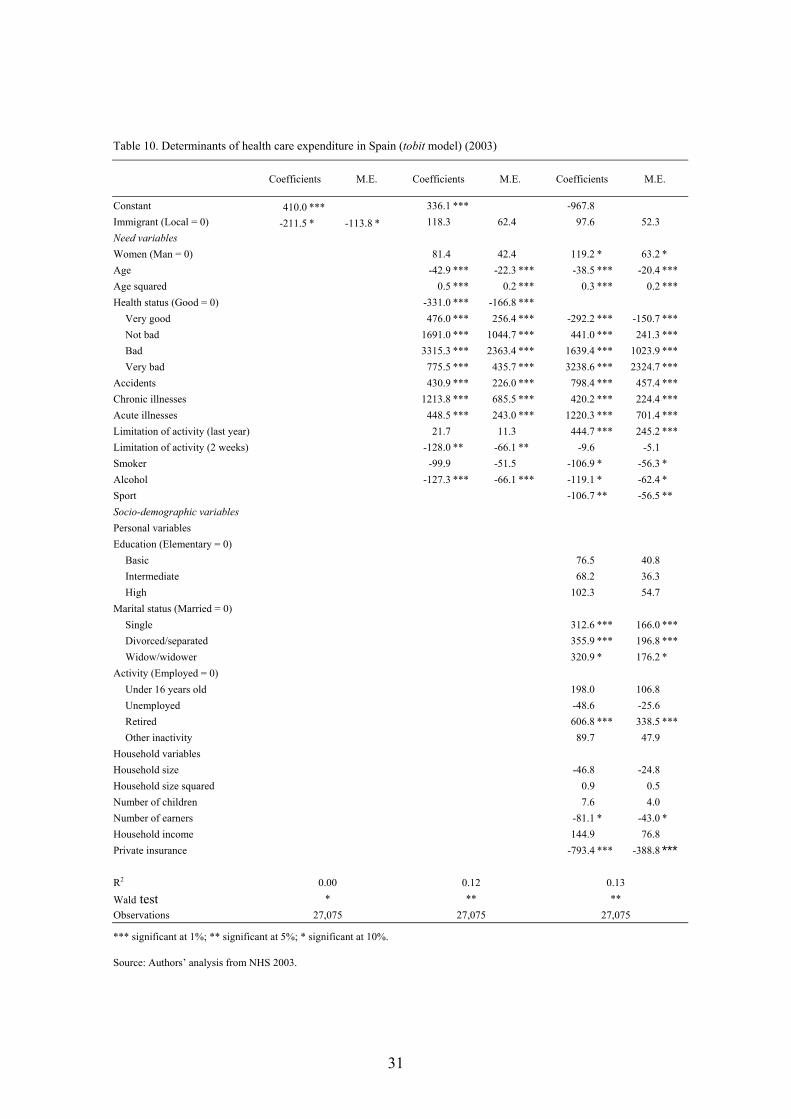
Table 10. Determinants of health care expenditure in Spain (tobit model) (2003)
Coefficients M.E. Coefficients M.E. Coefficients M.E.
Constant 410.0 *** 336.1 *** -967.8 Immigrant (Local = 0) -211.5 * -113.8 * 118.3 62.4 97.6 52.3 Need variables Women (Man = 0) 81.4 42.4 119.2 * 63.2 * Age -42.9 *** -22.3 *** -38.5 *** -20.4 *** Age squared 0.5 *** 0.2 *** 0.3 *** 0.2 *** Health status (Good = 0) -331.0 *** -166.8 ***
Very good 476.0 *** 256.4 *** -292.2 *** -150.7 *** Not bad 1691.0 *** 1044.7 *** 441.0 *** 241.3 *** Bad 3315.3 *** 2363.4 *** 1639.4 *** 1023.9 *** Very bad 775.5 *** 435.7 *** 3238.6 *** 2324.7 ***
Accidents 430.9 *** 226.0 *** 798.4 *** 457.4 *** Chronic illnesses 1213.8 *** 685.5 *** 420.2 *** 224.4 *** Acute illnesses 448.5 *** 243.0 *** 1220.3 *** 701.4 *** Limitation of activity (last year) 21.7 11.3 444.7 *** 245.2 *** Limitation of activity (2 weeks) -128.0 ** -66.1 ** -9.6 -5.1 Smoker -99.9 -51.5 -106.9 * -56.3 * Alcohol -127.3 *** -66.1 *** -119.1 * -62.4 * Sport -106.7 ** -56.5 ** Socio-demographic variables Personal variables Education (Elementary = 0)
Basic 76.5 40.8 Intermediate 68.2 36.3 High 102.3 54.7
Marital status (Married = 0) Single 312.6 *** 166.0 *** Divorced/separated 355.9 *** 196.8 *** Widow/widower 320.9 * 176.2 *
Activity (Employed = 0) Under 16 years old 198.0 106.8 Unemployed -48.6 -25.6 Retired 606.8 *** 338.5 *** Other inactivity 89.7 47.9
Household variables Household size -46.8 -24.8 Household size squared 0.9 0.5 Number of children 7.6 4.0 Number of earners -81.1 * -43.0 * Household income 144.9 76.8 Private insurance -793.4 *** -388.8 ***
R2 0.00 0.12 0.13 Wald test * ** ** Observations 27,075 27,075 27,075 *** significant at 1%; ** significant at 5%; * significant at 10%.
Source: Authors’ analysis from NHS 2003.
31
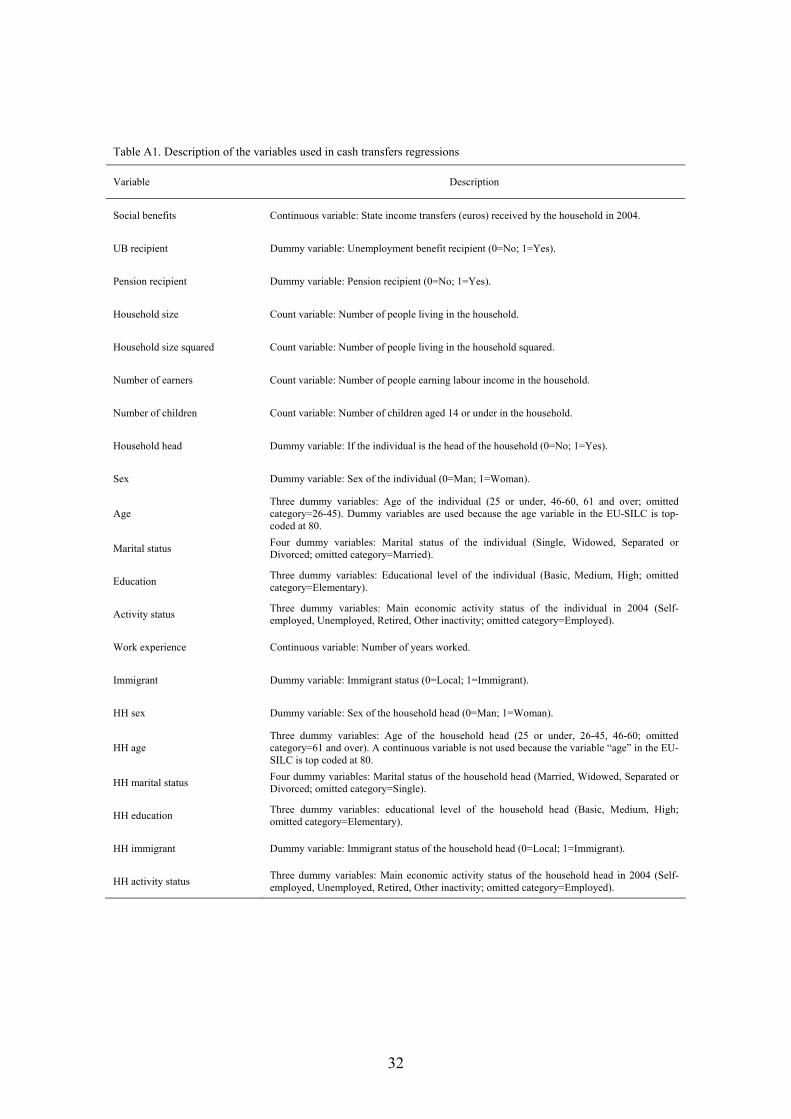
Table A1. Description of the variables used in cash transfers regressions
Variable Description
Social benefits Continuous variable: State income transfers (euros) received by the household in 2004.
UB recipient Dummy variable: Unemployment benefit recipient (0=No; 1=Yes).
Pension recipient Dummy variable: Pension recipient (0=No; 1=Yes).
Household size Count variable: Number of people living in the household.
Household size squared Count variable: Number of people living in the household squared.
Number of earners Count variable: Number of people earning labour income in the household.
Number of children Count variable: Number of children aged 14 or under in the household.
Household head Dummy variable: If the individual is the head of the household (0=No; 1=Yes).
Sex Dummy variable: Sex of the individual (0=Man; 1=Woman).
Age Three dummy variables: Age of the individual (25 or under, 46-60, 61 and over; omitted category=26-45). Dummy variables are used because the age variable in the EU-SILC is top-coded at 80.
Marital status Four dummy variables: Marital status of the individual (Single, Widowed, Separated or Divorced; omitted category=Married).
Education Three dummy variables: Educational level of the individual (Basic, Medium, High; omitted category=Elementary).
Activity status Three dummy variables: Main economic activity status of the individual in 2004 (Self-employed, Unemployed, Retired, Other inactivity; omitted category=Employed).
Work experience Continuous variable: Number of years worked.
Immigrant Dummy variable: Immigrant status (0=Local; 1=Immigrant).
HH sex Dummy variable: Sex of the household head (0=Man; 1=Woman).
HH age Three dummy variables: Age of the household head (25 or under, 26-45, 46-60; omitted category=61 and over). A continuous variable is not used because the variable “age” in the EU-SILC is top coded at 80.
HH marital status Four dummy variables: Marital status of the household head (Married, Widowed, Separated or Divorced; omitted category=Single).
HH education Three dummy variables: educational level of the household head (Basic, Medium, High; omitted category=Elementary).
HH immigrant Dummy variable: Immigrant status of the household head (0=Local; 1=Immigrant).
HH activity status Three dummy variables: Main economic activity status of the household head in 2004 (Self-employed, Unemployed, Retired, Other inactivity; omitted category=Employed).
32

Table A2. Description of the variables used in the public health care spending regressions
Variable Description
HC expenditure Continuous variable: Public health care expenditure received by the individual.
Health status Four dummy variables: Health self-perception (Good, Regular, Bad, Very Bad; omitted category=Very Good).
Accidents Dummy variables: Having suffered an accident in the last year (0=No; 1=Yes).
Chronic illnesses Dummy variable: Having suffered a chronic illness in the last year (0=No; 1=Yes).
Acute illnesses Dummy variable: Having suffered an acute illness in the last two weeks (0=No; 1=Yes).
Limitation of activity (last year)
Dummy variable: Limitation of the individual activity for more than ten days by an acute illness in the last year (0=No; 1=Yes).
Limitation of activity (last two weeks) Dummy variable: Limitation of the individual activity in the last two weeks (0=No; 1=Yes).
Smoker Dummy variable: Smoking (0=No; 1=Yes).
Alcohol Dummy variable: Drinking alcoholic drinks daily (0=No; 1=Yes).
Sport Dummy variable: Performing physical exercise daily (0=No; 1=Yes).
Sex Dummy variable: Sex of the individual (0=Man; 1=Woman).
Age Continuous variable: Age of the individual.
Age squared Continuous variable: Age of the individual squared/100.
Marital status Four dummy variables: Marital status of the individual (Married, Widowed, Legally Separated, Divorced; omitted category=Single).
Education Three dummy variables: Educational level of the individual (Basic, Medium, High; omitted category=Elementary). If the individual is under 16 years old, the educational level of the household is reported.
Income Continuous variable: Ln of equivalised household income/1000.
Activity status Four dummy variables: Activity of the individual (Employed, Unemployed, Retired, Other type of inactivity; omitted category=individuals aged under 16).
Household size Count variable: Number of people living in the household.
Household size squared Count variable: Number of people living in the household squared.
Number of earners Count variable: Number of people earning labour income in the household.
Number of children Count variable: Number of children aged 14 or under in the household.
Private insurance Dummy variable: Having a private health insurance plan (0=No; 1=Yes).
Immigrant Dummy variable: Immigrant status (0=Local; 1=Immigrant).
33

34
Table A3. Determinants of health care expenditure in Spain (several specifications) (2003)
Probit OLS Log OLS GLM
Coefficients M.E. (%) Coefficients Coefficients Coefficients
Constant 2.184 *** -1091.6 6.332 *** 6.303 *** Immigrant (Local = 0) 0.081 2.1 24.4 0.027 0.119 Need variables Women (Man = 0) 0.312 *** 8.2 *** -131.2 ** 0.008 -0.056 * Age -0.045 *** -1.2 *** -14.6 * -0.024 *** -0.026 *** Age squared 0.000 *** 0.0 *** 0.1 0.000 *** 0.000 *** Health status (Good = 0)
Very good -0.246 *** -7.0 *** -30.8 -0.122 *** -0.091 ** Not bad 0.392 *** 9.3 *** 240.1 *** 0.262 *** 0.281 *** Bad 0.524 *** 11.0 *** 1494.8 *** 0.539 *** 0.759 *** Very bad 0.797 *** 14.0 *** 3079.5 *** 0.696 *** 1.061 ***
Accidents 0.776 *** 14.9 *** 441.0 *** 0.192 *** 0.312 *** Chronic illnesses 0.535 *** 13.6 *** -3.0 0.194 *** 0.180 *** Acute illnesses 0.582 *** 13.1 *** 970.4 *** 0.446 *** 0.807 *** Limitation of activity (last year) 0.139 *** 3.5 *** 404.2 *** 0.507 *** 0.457 *** Limitation of activity (2 weeks) -0.123 * -3.4 * 128.2 -0.013 -0.005 Smoker -0.011 -0.3 -120.0 * -0.067 *** -0.089 ** Alcohol -0.106 *** -2.9 *** -66.1 -0.038 -0.049 Sport 0.050 * 1.3 * -163.9 *** -0.054 *** -0.114 *** Socio-demographic variables Personal variables Education (Elementary = 0)
Basic 0.052 1.3 37.5 0.073 *** 0.035 Intermediate 0.073 * 1.9 * 5.1 0.050 * 0.009 High 0.063 1.6 85.6 0.029 0.039
Marital status (Married = 0) Single 0.289 *** 7.6 *** 80.4 0.218 *** 0.213 *** Divorced/separated 0.168 ** 4.1 ** 209.9 0.262 *** 0.255 ** Widow/widower 0.056 1.4 276.6 0.125 ** 0.172 **
Activity (Employed = 0) Under 16 years old 0.151 * 3.8 * -61.4 0.086 0.034 Unemployed -0.048 -1.3 -64.0 0.058 0.085 Retired 0.092 2.4 490.8 *** 0.234 *** 0.282 *** Other inactivity 0.005 0.1 59.9 0.112 *** 0.145 ***
Household variables Number of children 0.074 * 2.0 * -120.0 -0.065 ** -0.077 ** Number of earners -0.010 ** -0.3 ** 10.6 0.006 * 0.004 Household size -0.037 -1.0 42.4 0.009 0.054 * Household size squared -0.018 -0.5 -82.2 * 0.007 -0.008 Household income -0.121 ** -3.2 ** 236.7 * -0.022 0.042 Private insurance -0.472 *** -14.4 *** -482.5 *** -0.747 *** -0.623 *** R2 0.17 0.11 0.27 Wald test *** *** *** AIC 15.35 Observations 27,075 22,658 22,658 22,658 *** significant at 1%; ** significant at 5%; * significant at 10%.
Source: Authors’ analysis from NHS 2003.