Embed Size (px)
Citation preview
MPRAMunich Personal RePEc Archive
Livestock industrialization, trade andsocial-health-environment impacts indeveloping countries: a case of Indianpoultry sector
Mehta, Rajesh; Narrod, Clare and Tiongco, Marites
Research and Information System for Developing Countries
December 2008
Online at http://mpra.ub.uni-muenchen.de/32678/
MPRA Paper No. 32678, posted 08. August 2011 / 20:57
Research and Information Systemfor Developing Countries
Core IV-B, Fourth FloorIndia Habitat CentreLodhi RoadNew Delhi-110 003, India.Ph. 91-11-2468 2177-80Fax: 91-11-2468 2173-74-75Email: [email protected]: http://www.ris.org.inWebsite: http://www.newasiaforum.org
RIS
RISDiscussion Papers
Research and Information Systemfor Developing Countries
RIS
RISRIS is a New Delhi-based autonomous policy think-tank supported
by the Government of India and devoted to trade and development
issues. Its work programme focuses on policy research and capacity
building on multilateral trade and financial negotiations, regional
economic cooperation in Asia, South-South cooperation, new
technologies and development, and strategic policy responses of
developing countries to globalization, among other issues. The
work of RIS is published in the form of research reports, books,
discussion papers, policy briefs and journals.
RIS has networked effectively with other prominent policy
think-tanks, government agencies, industry bodies and international
organizations in Asia and other parts of the world for collaborative
research and joint activities. It has a consultative status with
UNCTAD, and has been accredited to the Summit Meetings of
NAM and WTO Ministerial Conferences. It has conducted policy
research and other activities in collaboration with other agencies,
including UN-ESCAP, UNCTAD, UNU, Group of 77, SAARC
Secretariat, Asian Development Bank (ADB), the World Bank,
and the South Centre.
For more information about RIS and its work programme,
please visit its website: www.ris.org.in.
— Policy research to shape the international development agenda
A Think-Tankof Developing Countries
Livestock Industrialization, Trade andSocial-Health-Environment Impacts in
Developing Countries:A Case of Indian Poultry Sector
Rajesh Mehta,Clare A. Narrod
andMarites M. Tiongco
RIS-DP # 146
Livestock Industrialization, Trade andSocial-Health-Environment Impacts in
Developing Countries:A Case of Indian Poultry Sector
Rajesh Mehta,Clare A. Narrod
andMarites M. Tiongco
RIS-DP # 146
December 2008
Core IV-B, Fourth Floor, India Habitat CentreLodhi Road, New Delhi – 110 003 (India)
Tel: +91-11-2468 2177/2180; Fax: +91-11-2468 2173/74Email: [email protected]
RIS Discussion Papers intend to disseminate preliminary findings of the researchcarried out within the framework of institute’s work programme or related research.The feedback and comments may be directed to the author(s). RIS Discussion Papersare available at www.ris.org.in
1
Livestock Industrialization, Trade and Social-Health-Environment Impacts in DevelopingCountries: A Case of Indian Poultry Sector
Rajesh Mehta*, Clare A. Narrod**Marites M. Tiongco**
Abstract: This paper presents the results of an empirical study of the IndianPoultry Industry which is specially focused on the social and environmentaloutcomes generated by the rapidly increasing scale of egg and broiler productionin India. Among the effects of these rapid changes that occurred in the poultryindustry include increased risk for animal health, changes in demand patters interms of amount, quality, and food safety, higher prices for high value items; butthere is also a threat to smallholders that they will be excluded from moredemanding markets. There are important questions, which have arisen with theindustrialization of poultry activity in India. Is the scaling up of productiondriving small producers to disadvantage on account of high transaction costs,policy distortions and environment externalities? Why do some poultry farmshave higher incomes than others? Do large farms earn more profit per unit ofoutput than small farms? What explains the differentials in efficiency? An attemptis made here to take stock of these changes and to assess their social andenvironmental outcomes particularly those that affect the welfare of poor. Thepaper starts by examining the state of the Indian Poultry Industry, then it goes indealing with selected socio-economic, health, and environment changes thataffect the competitiveness of livestock production including domestic institutionalarrangement of food safety standards.Keywords: Indian poultry sector, livestock industrialization, competitiveness,transaction costs, environmental externalities, contract farming.
The authors gratefully acknowledge many institutions and individuals that have facilitatedthe undertaking of this study. This paper is based on project report produced as part of theIFPRI-FAO entitled “Livestock Industrialization, Trade, and Social–Health-EnvironmentsImpacts in Developing Countries,” which was carried out from 2001 to 2003. Gratefulacknowledgement of support is made to the Livestock, Environment, and Development(LEAD) initiative housed at Food and Agriculture Organization of the United Nations (FAO)and the International Food Policy Research Institute (IFPRI). We thank Dr. Henning Steinfeld,FAO, and Dr. Christopher Delgado, IFPRI, at the time of this study, for their encouragement,support and consistent interest in the project. We owe a heavy intellectual debt to R.G.Nambiar and S. Subramanyan for their significant contributions to the country report.Needless to say, all observations and conclusions are our own and we alone are responsiblefor any shortcomings.* Senior Fellow, Research and Information System for Developing Countries (RIS), New
Delhi, Email: [email protected]** Senior Fellow and Post-doctoral Fellow of International Food Policy Research Institute,
Washington D.C.
2 3
1. THE INDIAN POULTRY INDUSTRY
1.1 Growing Productions of Eggs and BroilersThe Indian poultry industry is classic example of how a largely backwardventure has transformed into a major vibrant commercial activity. In theearly 1970s, India’s poultry industry was still a small traditional sectorwith a head count of only 4 million broilers per year.1 Poultry at this timewas considered an expensive luxury, as maize the primary input wasexpensive. Most Indian poultry producers at this time were using localbreeds whose Feed Conversion Ratio (FCR) at that time was very low relativeto commercial hybrids that were being used in many developed countries.2
Since then, the Indian poultry industry has undergone a sea change on bothindustrial and technological grounds so as to meet the growing domesticdemand. First, productivity was improved through the introduction of highyielding hybrids produced through pure lines. In the early 80s, companieslike Venkateswara Research and Breeding Farm, and Cobb Ventress Inc.started joint breeding program leading to establishment of pure line operationsand with their genetic pool, hybrids acclimatized to Indian conditions. Thecompany has been consistently doing research based on information collectedfrom broilers and broiler- breeds, using latest technology. The main objectiveof this research is to produce desirable (profitable) parent birds suitable toIndian conditions. At present the company enjoys 86 per cent share of layermarket (DOC), and 65 per cent share of Indian broiler market.3 With theuse of these breeds the size of laying hen housed grew from hen house4
production of 250 egg per bird used for industrial purposes in the early 70sto hen houses producing close to 315+ eggs per bird5. Second, in broilers,the Feed Conversion Ratio (FCR) has gone down from 3 kg of feed for 1kg of chicken meat in 1970 to less than 2 kg of feed for 1 kg of chickenmeat in early 2000.6 The later figure is comparable to the FCR of developedcountries,7 despite the fact that India does not add tallow nor use othergrowth promoters including hormones as inputs for fattening the broilers.8
In addition the body weight of broiler of contract farmer has increasedfrom 1.8 Kg. in 1980 to 2.3 Kg.9 What facilitated this was that manyintegrated operations stared using linear programming to ensure that theywere able to formulate the most efficient feed given access to nutrients andchanging prices. Third, size of individual poultry farms has increased. In
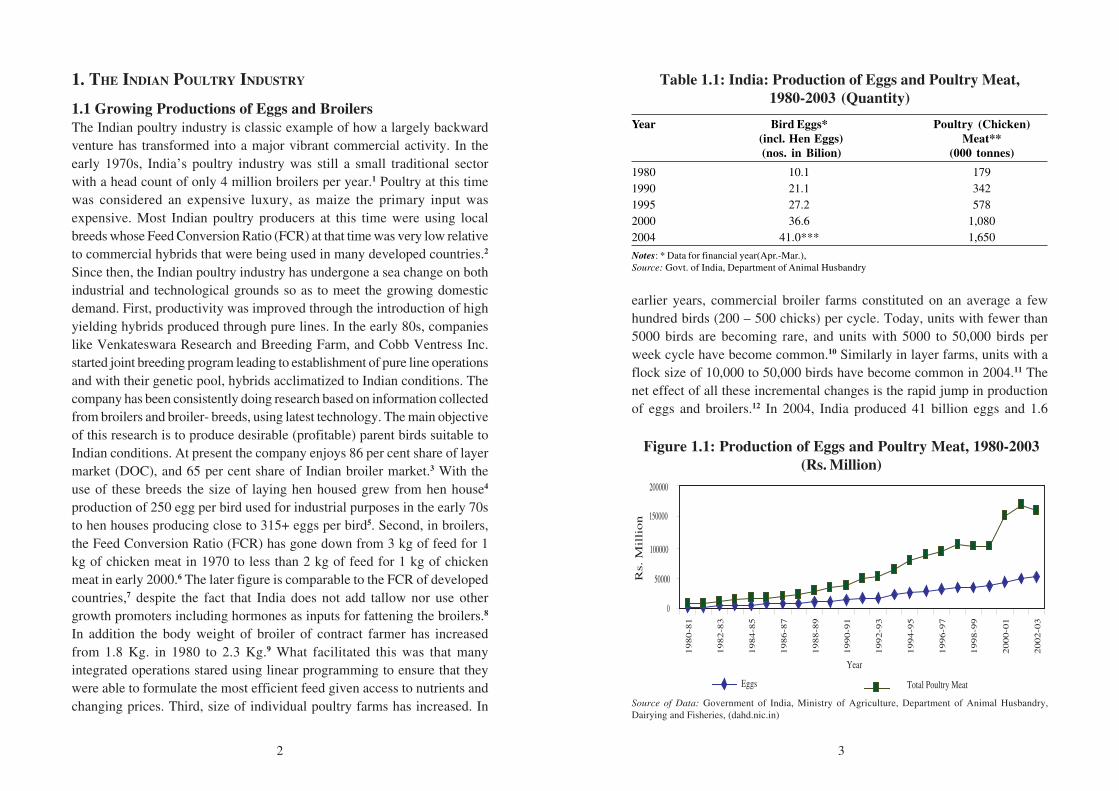
earlier years, commercial broiler farms constituted on an average a fewhundred birds (200 – 500 chicks) per cycle. Today, units with fewer than5000 birds are becoming rare, and units with 5000 to 50,000 birds perweek cycle have become common.10 Similarly in layer farms, units with aflock size of 10,000 to 50,000 birds have become common in 2004.11 Thenet effect of all these incremental changes is the rapid jump in productionof eggs and broilers.12 In 2004, India produced 41 billion eggs and 1.6
Table 1.1: India: Production of Eggs and Poultry Meat,1980-2003 (Quantity)
Year Bird Eggs* Poultry (Chicken) (incl. Hen Eggs) Meat** (nos. in Bilion) (000 tonnes)
1980 10.1 1791990 21.1 3421995 27.2 5782000 36.6 1,0802004 41.0*** 1,650
Notes: * Data for financial year(Apr.-Mar.),Source: Govt. of India, Department of Animal Husbandry
0
50000
100000
150000
200000
1980-8
1
1982-8
3
1984-8
5
1986-8
7
1988-8
9
1990-9
1
1992-9
3
1994-9
5
1996-9
7
1998-9
9
2000-0
1
2002-0
3
Year
Rs.
Mil
lion
Eggs Total Poultry Meat
Figure 1.1: Production of Eggs and Poultry Meat, 1980-2003(Rs. Million)
Source of Data: Government of India, Ministry of Agriculture, Department of Animal Husbandry,Dairying and Fisheries, (dahd.nic.in)
4 5
The total capital investment in poultry equipment, production, processingis estimated to be around at Rs.10, 000 crores.14 In terms of contribution toGDP (at current prices in local currency), poultry accounted for somethingless than 1 percent of GDP (Table 1.2), based on government official sources.The share was 0.60 per cent in 1980-81; rose to 0.79 percent in 2000-01;
million tonnes of poultry meat compared to only 10 billion eggs and 0.18million tonnes of poultry meat in 1980-81, as shown in Table I.1 (FigureI.1 displays production of eggs and poultry in value terms).13
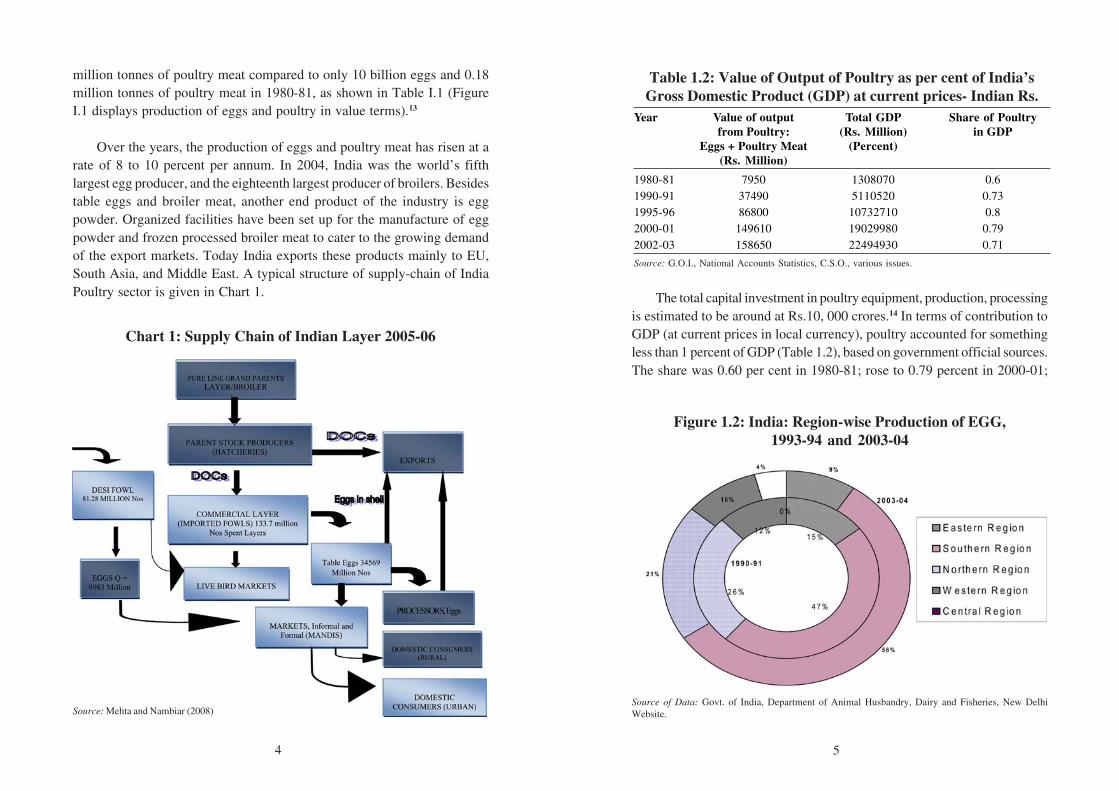
Over the years, the production of eggs and poultry meat has risen at arate of 8 to 10 percent per annum. In 2004, India was the world’s fifthlargest egg producer, and the eighteenth largest producer of broilers. Besidestable eggs and broiler meat, another end product of the industry is eggpowder. Organized facilities have been set up for the manufacture of eggpowder and frozen processed broiler meat to cater to the growing demandof the export markets. Today India exports these products mainly to EU,South Asia, and Middle East. A typical structure of supply-chain of IndiaPoultry sector is given in Chart 1.
Chart 1: Supply Chain of Indian Layer 2005-06
Source: Mehta and Nambiar (2008)
Table 1.2: Value of Output of Poultry as per cent of India’sGross Domestic Product (GDP) at current prices- Indian Rs.
Year Value of output Total GDP Share of Poultryfrom Poultry: (Rs. Million) in GDP
Eggs + Poultry Meat (Percent)(Rs. Million)
1980-81 7950 1308070 0.61990-91 37490 5110520 0.731995-96 86800 10732710 0.82000-01 149610 19029980 0.792002-03 158650 22494930 0.71
Source: G.O.I., National Accounts Statistics, C.S.O., various issues.
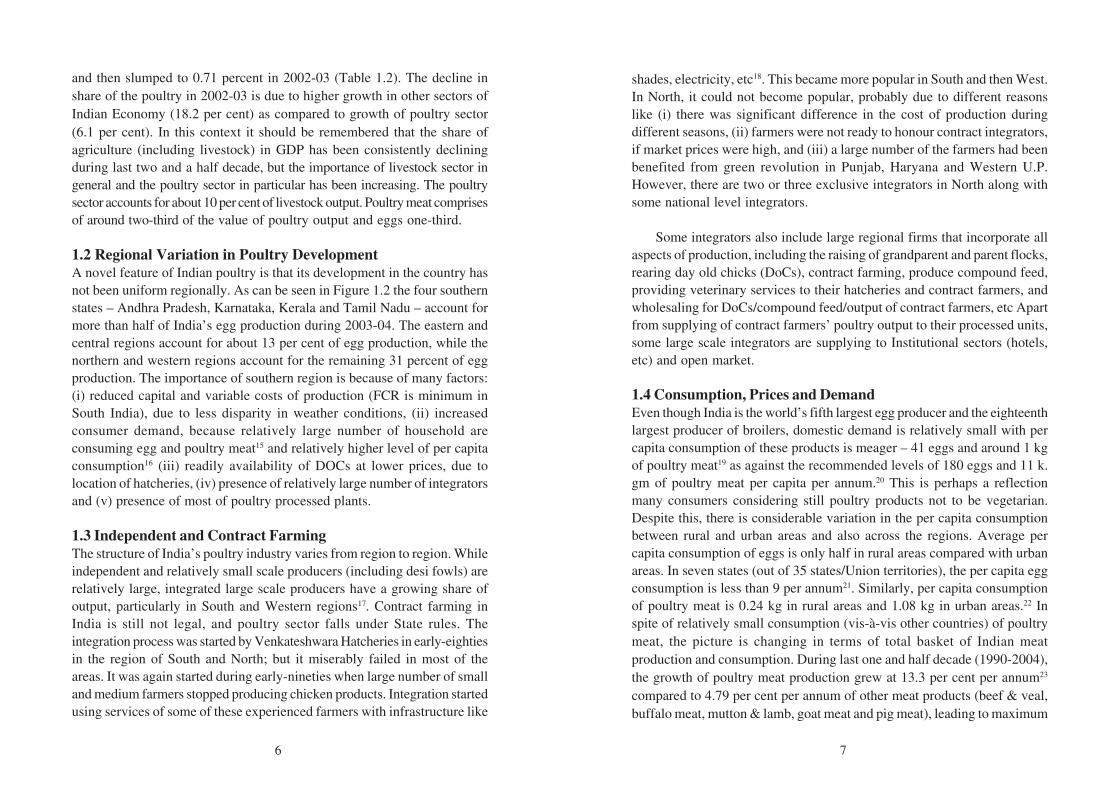
Figure 1.2: India: Region-wise Production of EGG,1993-94 and 2003-04
Source of Data: Govt. of India, Department of Animal Husbandry, Dairy and Fisheries, New DelhiWebsite.
6 7
and then slumped to 0.71 percent in 2002-03 (Table 1.2). The decline inshare of the poultry in 2002-03 is due to higher growth in other sectors ofIndian Economy (18.2 per cent) as compared to growth of poultry sector(6.1 per cent). In this context it should be remembered that the share ofagriculture (including livestock) in GDP has been consistently decliningduring last two and a half decade, but the importance of livestock sector ingeneral and the poultry sector in particular has been increasing. The poultrysector accounts for about 10 per cent of livestock output. Poultry meat comprisesof around two-third of the value of poultry output and eggs one-third.
1.2 Regional Variation in Poultry DevelopmentA novel feature of Indian poultry is that its development in the country hasnot been uniform regionally. As can be seen in Figure 1.2 the four southernstates – Andhra Pradesh, Karnataka, Kerala and Tamil Nadu – account formore than half of India’s egg production during 2003-04. The eastern andcentral regions account for about 13 per cent of egg production, while thenorthern and western regions account for the remaining 31 percent of eggproduction. The importance of southern region is because of many factors:(i) reduced capital and variable costs of production (FCR is minimum inSouth India), due to less disparity in weather conditions, (ii) increasedconsumer demand, because relatively large number of household areconsuming egg and poultry meat15 and relatively higher level of per capitaconsumption16 (iii) readily availability of DOCs at lower prices, due tolocation of hatcheries, (iv) presence of relatively large number of integratorsand (v) presence of most of poultry processed plants.
1.3 Independent and Contract FarmingThe structure of India’s poultry industry varies from region to region. Whileindependent and relatively small scale producers (including desi fowls) arerelatively large, integrated large scale producers have a growing share ofoutput, particularly in South and Western regions17. Contract farming inIndia is still not legal, and poultry sector falls under State rules. Theintegration process was started by Venkateshwara Hatcheries in early-eightiesin the region of South and North; but it miserably failed in most of theareas. It was again started during early-nineties when large number of smalland medium farmers stopped producing chicken products. Integration startedusing services of some of these experienced farmers with infrastructure like
shades, electricity, etc18. This became more popular in South and then West.In North, it could not become popular, probably due to different reasonslike (i) there was significant difference in the cost of production duringdifferent seasons, (ii) farmers were not ready to honour contract integrators,if market prices were high, and (iii) a large number of the farmers had beenbenefited from green revolution in Punjab, Haryana and Western U.P.However, there are two or three exclusive integrators in North along withsome national level integrators.
Some integrators also include large regional firms that incorporate allaspects of production, including the raising of grandparent and parent flocks,rearing day old chicks (DoCs), contract farming, produce compound feed,providing veterinary services to their hatcheries and contract farmers, andwholesaling for DoCs/compound feed/output of contract farmers, etc Apartfrom supplying of contract farmers’ poultry output to their processed units,some large scale integrators are supplying to Institutional sectors (hotels,etc) and open market.
1.4 Consumption, Prices and DemandEven though India is the world’s fifth largest egg producer and the eighteenthlargest producer of broilers, domestic demand is relatively small with percapita consumption of these products is meager – 41 eggs and around 1 kgof poultry meat19 as against the recommended levels of 180 eggs and 11 k.gm of poultry meat per capita per annum.20 This is perhaps a reflectionmany consumers considering still poultry products not to be vegetarian.Despite this, there is considerable variation in the per capita consumptionbetween rural and urban areas and also across the regions. Average percapita consumption of eggs is only half in rural areas compared with urbanareas. In seven states (out of 35 states/Union territories), the per capita eggconsumption is less than 9 per annum21. Similarly, per capita consumptionof poultry meat is 0.24 kg in rural areas and 1.08 kg in urban areas.22 Inspite of relatively small consumption (vis-à-vis other countries) of poultrymeat, the picture is changing in terms of total basket of Indian meatproduction and consumption. During last one and half decade (1990-2004),the growth of poultry meat production grew at 13.3 per cent per annum23
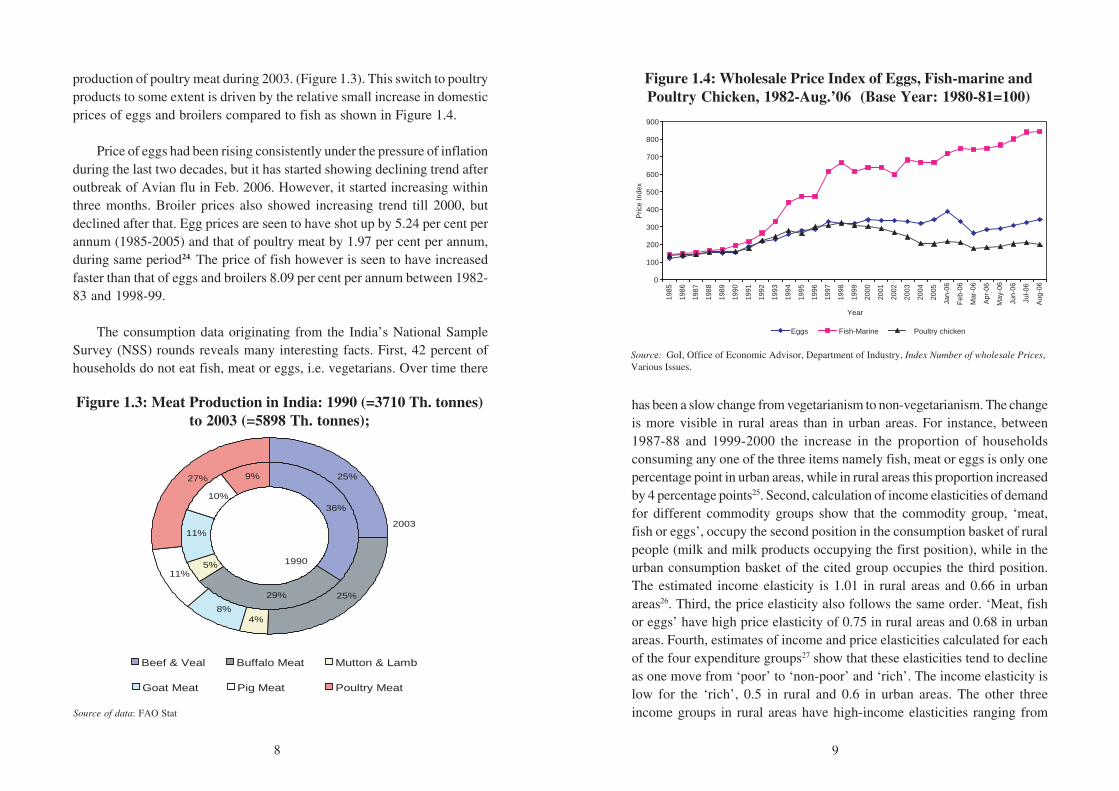
compared to 4.79 per cent per annum of other meat products (beef & veal,buffalo meat, mutton & lamb, goat meat and pig meat), leading to maximum
8 9
Figure 1.3: Meat Production in India: 1990 (=3710 Th. tonnes)to 2003 (=5898 Th. tonnes);
has been a slow change from vegetarianism to non-vegetarianism. The changeis more visible in rural areas than in urban areas. For instance, between1987-88 and 1999-2000 the increase in the proportion of householdsconsuming any one of the three items namely fish, meat or eggs is only onepercentage point in urban areas, while in rural areas this proportion increasedby 4 percentage points25. Second, calculation of income elasticities of demandfor different commodity groups show that the commodity group, ‘meat,fish or eggs’, occupy the second position in the consumption basket of ruralpeople (milk and milk products occupying the first position), while in theurban consumption basket of the cited group occupies the third position.The estimated income elasticity is 1.01 in rural areas and 0.66 in urbanareas26. Third, the price elasticity also follows the same order. ‘Meat, fishor eggs’ have high price elasticity of 0.75 in rural areas and 0.68 in urbanareas. Fourth, estimates of income and price elasticities calculated for eachof the four expenditure groups27 show that these elasticities tend to declineas one move from ‘poor’ to ‘non-poor’ and ‘rich’. The income elasticity islow for the ‘rich’, 0.5 in rural and 0.6 in urban areas. The other threeincome groups in rural areas have high-income elasticities ranging fromSource of data: FAO Stat
36%
29%
5%
11%
10%
9% 25%
25%
4%8%
11%
27%
Beef & Veal Buffalo Meat Mutton & Lamb
Goat Meat Pig Meat Poultry Meat
1990
2003
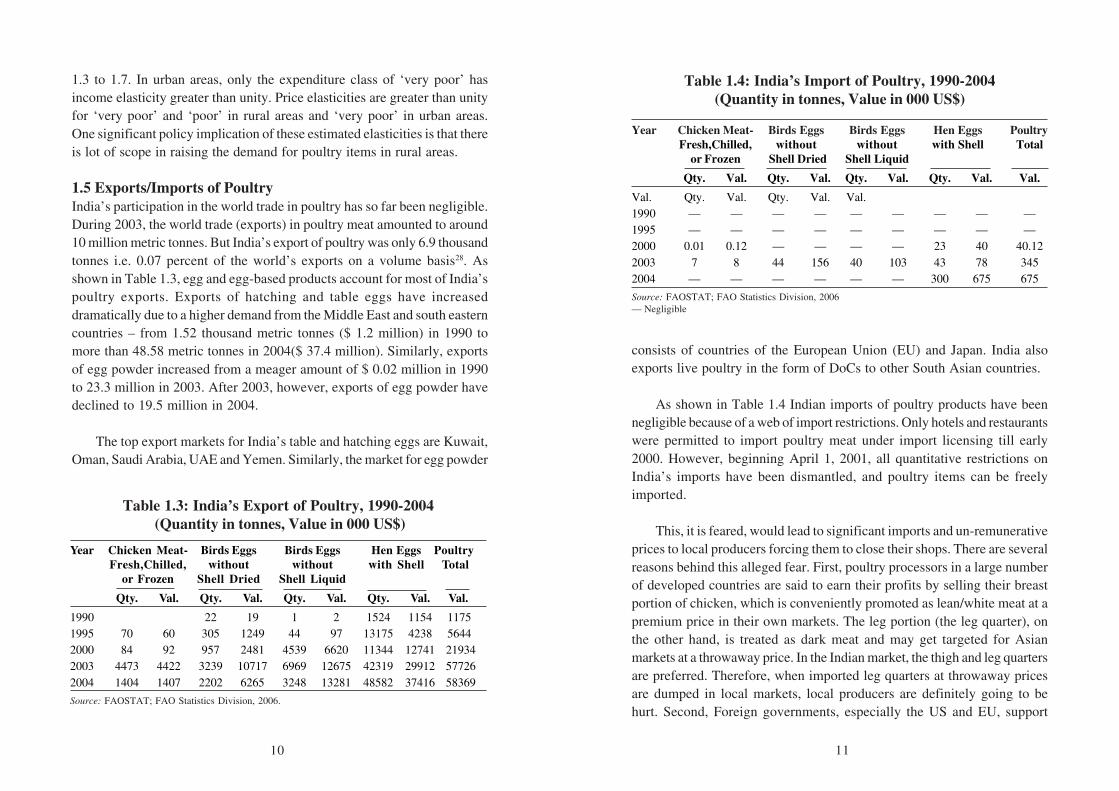
Figure 1.4: Wholesale Price Index of Eggs, Fish-marine andPoultry Chicken, 1982-Aug.’06 (Base Year: 1980-81=100)
Source: GoI, Office of Economic Advisor, Department of Industry, Index Number of wholesale Prices,Various Issues.
0
100
200
300
400
500
600
700
800
900
1985
1986
1987
1988
1989
1990
1991
1992
1993
1994
1995
1996
1997
1998
1999
2000
2001
2002
2003
2004
2005
Jan-
06
Feb-
06
Mar
-06
Apr-0
6
May
-06
Jun-
06
Jul-0
6
Aug-
06
Year
Pric
e In
dex
Eggs Fish-Marine Poultry chicken
production of poultry meat during 2003. (Figure 1.3). This switch to poultryproducts to some extent is driven by the relative small increase in domesticprices of eggs and broilers compared to fish as shown in Figure 1.4.
Price of eggs had been rising consistently under the pressure of inflationduring the last two decades, but it has started showing declining trend afteroutbreak of Avian flu in Feb. 2006. However, it started increasing withinthree months. Broiler prices also showed increasing trend till 2000, butdeclined after that. Egg prices are seen to have shot up by 5.24 per cent perannum (1985-2005) and that of poultry meat by 1.97 per cent per annum,during same period24. The price of fish however is seen to have increasedfaster than that of eggs and broilers 8.09 per cent per annum between 1982-83 and 1998-99.
The consumption data originating from the India’s National SampleSurvey (NSS) rounds reveals many interesting facts. First, 42 percent ofhouseholds do not eat fish, meat or eggs, i.e. vegetarians. Over time there
10 11
consists of countries of the European Union (EU) and Japan. India alsoexports live poultry in the form of DoCs to other South Asian countries.
As shown in Table 1.4 Indian imports of poultry products have beennegligible because of a web of import restrictions. Only hotels and restaurantswere permitted to import poultry meat under import licensing till early2000. However, beginning April 1, 2001, all quantitative restrictions onIndia’s imports have been dismantled, and poultry items can be freelyimported.
This, it is feared, would lead to significant imports and un-remunerativeprices to local producers forcing them to close their shops. There are severalreasons behind this alleged fear. First, poultry processors in a large numberof developed countries are said to earn their profits by selling their breastportion of chicken, which is conveniently promoted as lean/white meat at apremium price in their own markets. The leg portion (the leg quarter), onthe other hand, is treated as dark meat and may get targeted for Asianmarkets at a throwaway price. In the Indian market, the thigh and leg quartersare preferred. Therefore, when imported leg quarters at throwaway pricesare dumped in local markets, local producers are definitely going to behurt. Second, Foreign governments, especially the US and EU, support
1.3 to 1.7. In urban areas, only the expenditure class of ‘very poor’ hasincome elasticity greater than unity. Price elasticities are greater than unityfor ‘very poor’ and ‘poor’ in rural areas and ‘very poor’ in urban areas.One significant policy implication of these estimated elasticities is that thereis lot of scope in raising the demand for poultry items in rural areas.
1.5 Exports/Imports of PoultryIndia’s participation in the world trade in poultry has so far been negligible.During 2003, the world trade (exports) in poultry meat amounted to around10 million metric tonnes. But India’s export of poultry was only 6.9 thousandtonnes i.e. 0.07 percent of the world’s exports on a volume basis28. Asshown in Table 1.3, egg and egg-based products account for most of India’spoultry exports. Exports of hatching and table eggs have increaseddramatically due to a higher demand from the Middle East and south easterncountries – from 1.52 thousand metric tonnes ($ 1.2 million) in 1990 tomore than 48.58 metric tonnes in 2004($ 37.4 million). Similarly, exportsof egg powder increased from a meager amount of $ 0.02 million in 1990to 23.3 million in 2003. After 2003, however, exports of egg powder havedeclined to 19.5 million in 2004.
The top export markets for India’s table and hatching eggs are Kuwait,Oman, Saudi Arabia, UAE and Yemen. Similarly, the market for egg powder
Table 1.3: India’s Export of Poultry, 1990-2004 (Quantity in tonnes, Value in 000 US$)
Year Chicken Meat- Birds Eggs Birds Eggs Hen Eggs PoultryFresh,Chilled, without without with Shell Total
or Frozen Shell Dried Shell Liquid
Qty. Val. Qty. Val. Qty. Val. Qty. Val. Val.
1990 22 19 1 2 1524 1154 11751995 70 60 305 1249 44 97 13175 4238 56442000 84 92 957 2481 4539 6620 11344 12741 219342003 4473 4422 3239 10717 6969 12675 42319 29912 577262004 1404 1407 2202 6265 3248 13281 48582 37416 58369
Source: FAOSTAT; FAO Statistics Division, 2006.
Table 1.4: India’s Import of Poultry, 1990-2004(Quantity in tonnes, Value in 000 US$)
Year Chicken Meat- Birds Eggs Birds Eggs Hen Eggs PoultryFresh,Chilled, without without with Shell Total
or Frozen Shell Dried Shell Liquid
Qty. Val. Qty. Val. Qty. Val. Qty. Val. Val.
Val. Qty. Val. Qty. Val. Val.1990 — — — — — — — — —1995 — — — — — — — — —2000 0.01 0.12 — — — — 23 40 40.122003 7 8 44 156 40 103 43 78 3452004 — — — — — — 300 675 675
Source: FAOSTAT; FAO Statistics Division, 2006— Negligible
12 13
poultry exports with subsidies. The amount of subsidy works out to besubstantial.29 The result is an un-level playing field in which the ball inevitablybounces towards the Indian market. Third, effective April 2001, (a) chickenmay be imported without license but subject to an import duty of 30 percent for whole chicken fresh/chilled/frozen, and 100 per cent for cut inpieces30, (b) Imports of grand parent breeding stock placed without anybarriers and (c) Some additives such as lysine, methanine, choline, chloride,and vitamins can be freely imported.
1.6 EmploymentThere is no official employment statistics relating to poultry sector in India.However, some reliable statistics on employment by usual activities includinglivestock is available for select years. The latest comparable data is availableonly for years 1993-94 and 1999-2000. All India rural employed workersin livestock sector were 7.89 million and 7.96 million during 1993-94 and1999-2000 respectively31.
According to the industry sources, there has been an increase in thenumber of people involved in the poultry industry, over the years. Threedecades ago, when egg and broiler production was 10 billion and 30 million,respectively, the total employment numbers in the poultry sector was small32.With the demand for poultry increasing, this sector employed around 2.0million people in 200333. At least 80 percent of employment in the poultrysector is generated directly by poultry producers, while 20 percent is engagedin feed, pharmaceuticals, equipment and other services required by the poultrysector. Additionally, there may be a similar number of people roughly 2.0million who are engaged in marketing and other channels servicing thepoultry sector34.
2. COMMERCIALIZATION OF THE INDIAN POULTRY SECTOR
Today, the world population is just over six billion people. By 2020, it ispredicted that 7.5 billion people will inhabit the world and eating around327 million tonnes of meat. The outlook for poultry meat appears to bemost favorable among different types of meat, with all market fundamentalsexpected to demonstrate strong growth. World production, consumption
and trade are all seen by most international organizations to accelerate duringthe next few decades. Most of this growth is expected to originate in non-OECD countries35. Lower price of poultry meat relative to the price ofother meats, combined with rising income and changing food habits inmost of these countries, including India, is expected to strengthen the demandfor meat.
For many countries with a relatively low per capita consumption it isexpected that economic improvement would favor growth in the poultrysector relative to other livestock products36. India is no exception and theIndian poultry sector will likely witness drastic changes in terms ofstructure, production, and processing in the next decade. In order tomeet the growing consumer demand it is likely that there will be amove to larger integrated operations having their own breeding farms,feed mills, hatcheries, and processing units who contract out productionand the role of small independent farmers will decline. Further as muchof the growing demand is in urban areas with consumers demandingsafe food, it is expected that large investments will also flow intoinfrastructure development for production, processing, cold chainmanagement, and marketing of poultry products.
2.1 Food Safety Concerns for IndiaLike many developed countries increasing consumers in India areexpecting safe and hygienic food and looking towards the governmentto be the one to ensure such. The Indian government over the years hasdeveloped different rules to try to meet consumer’s expectations. Boththe Prevention of Food Adulteration Act, 1953 for domestic purposesand the Export Quality Control Act of 1963, which is governed by theExport Inspection Council(EIC) of India for export purposes weredeveloped in an effort to make regulations of health and hygienemandatory for processing plants. Government is trying now to harmonizeits food standards with Codex standards and trying to put all these lawsunder one agency so as to avoid problems associated with the multiplicityof standard formulating agencies and implementation agencies.However, at present, most of the food safety emphasis is concerningexport consignments.
14 15
2.2 Processed Poultry Products and Export MarketsAs shown in section I, egg powder is major item of Indian poultry. Prior to1996, there were six egg-processing units, and all of them were exportingto the EU. All these units were set up to cater export market, because thereis negligible demand for egg–powder in India. In 1996, the EU delistedIndia from the list of approved countries for import of egg powder ongrounds that these units had not submitted their residue-monitoring plan(RMP).38 As a possible result, export of egg powder, which stood at $28.77million in 1997 declined drastically to 13.62 million in 2000. The frequentchanges in food safety standards in India’s destination markets, particularlyEU, has led to in many difficulties for Indian processors leading to closerof three units (out of six).
At the same time, there was not a single agency set up by India tounderstand the problems of export supply, including egg powder. The matterwas shunted from one ministry (department) to another so that this tardyapproach may also have affected the country’s exports. A second problemis with regard to granting equivalence by external market to countries likeIndia in the export of egg powder. Even ten years after the submission of alist of units to be notified, the EU has not set up a commission to inspectthese units and grant equivalence. A third example is that of Non-acceptanceof Domestic Certification: Invariably, the test certificates issued by Indianlaboratories are not accepted by the EU or other developed countries asthey are not accredited to laboratories in the developed countries. Fourth,Environment and Welfare Issues adopted by EU have begun to constrainthe export performance of developing countries like India.39
Part of the problem in poultry also stems from the complex nature ofthe industry. Vertical integration has not taken root very strongly. Integrationin India is mostly horizontal.40 A large number of the poultry operationsare operated by independent producers – hatchery operators, feed operators41,commercial farmers, etc. In this complex situation of so many players inthe whole chain, maintaining food safety becomes a major problem.
2.3 Food Safety Issues: Steps by Government and ProcessorsDomestic institutional mechanism is now gearing upwards to internationalfood safety standards. The “three sisters” of the international standards,
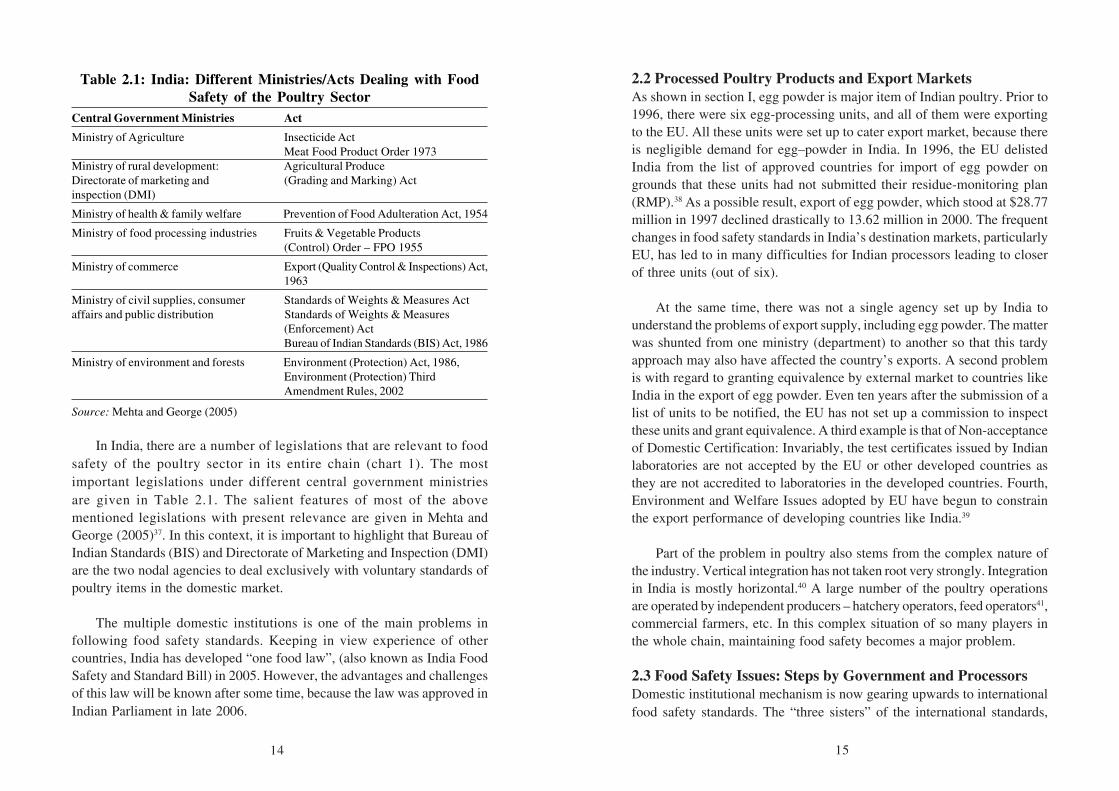
In India, there are a number of legislations that are relevant to foodsafety of the poultry sector in its entire chain (chart 1). The mostimportant legislations under different central government ministriesare given in Table 2.1. The salient features of most of the abovementioned legislations with present relevance are given in Mehta andGeorge (2005)37. In this context, it is important to highlight that Bureau ofIndian Standards (BIS) and Directorate of Marketing and Inspection (DMI)are the two nodal agencies to deal exclusively with voluntary standards ofpoultry items in the domestic market.
The multiple domestic institutions is one of the main problems infollowing food safety standards. Keeping in view experience of othercountries, India has developed “one food law”, (also known as India FoodSafety and Standard Bill) in 2005. However, the advantages and challengesof this law will be known after some time, because the law was approved inIndian Parliament in late 2006.
Table 2.1: India: Different Ministries/Acts Dealing with FoodSafety of the Poultry Sector
Central Government Ministries Act
Ministry of Agriculture Insecticide ActMeat Food Product Order 1973
Ministry of rural development: Agricultural ProduceDirectorate of marketing and (Grading and Marking) Actinspection (DMI)
Ministry of health & family welfare Prevention of Food Adulteration Act, 1954
Ministry of food processing industries Fruits & Vegetable Products(Control) Order – FPO 1955
Ministry of commerce Export (Quality Control & Inspections) Act,1963
Ministry of civil supplies, consumer Standards of Weights & Measures Actaffairs and public distribution Standards of Weights & Measures
(Enforcement) ActBureau of Indian Standards (BIS) Act, 1986
Ministry of environment and forests Environment (Protection) Act, 1986,Environment (Protection) ThirdAmendment Rules, 2002
Source: Mehta and George (2005)
16 17
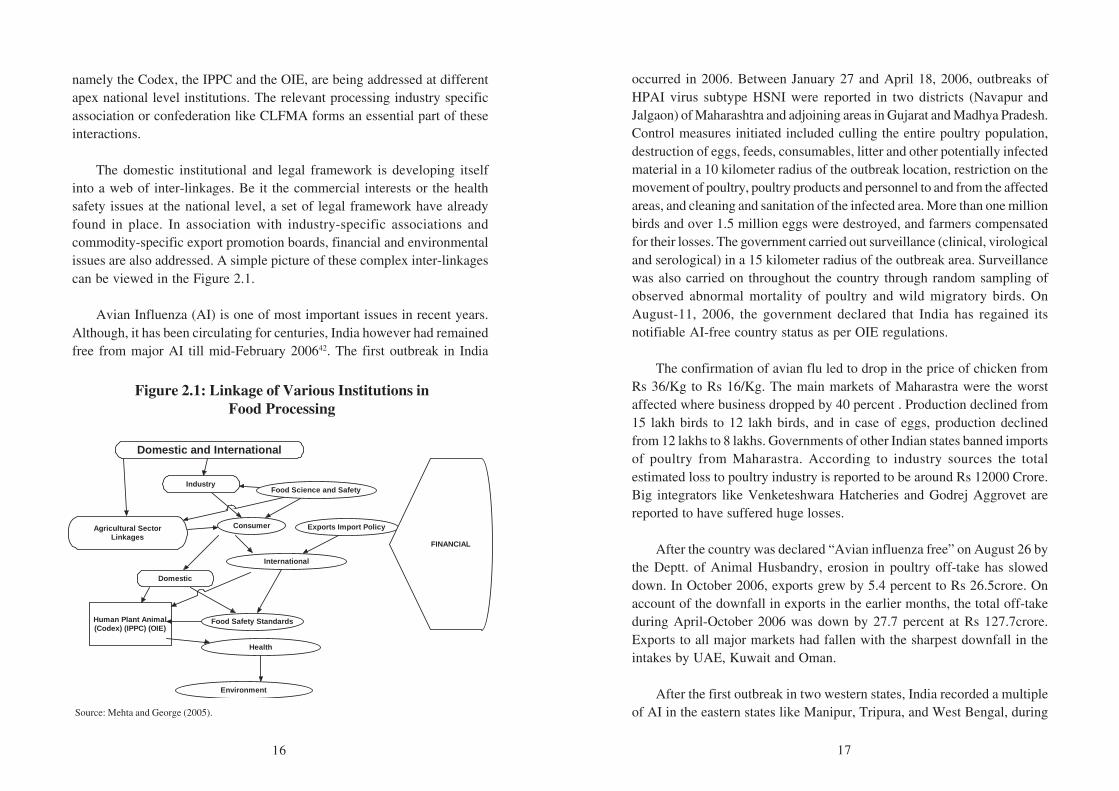
namely the Codex, the IPPC and the OIE, are being addressed at differentapex national level institutions. The relevant processing industry specificassociation or confederation like CLFMA forms an essential part of theseinteractions.
The domestic institutional and legal framework is developing itselfinto a web of inter-linkages. Be it the commercial interests or the healthsafety issues at the national level, a set of legal framework have alreadyfound in place. In association with industry-specific associations andcommodity-specific export promotion boards, financial and environmentalissues are also addressed. A simple picture of these complex inter-linkagescan be viewed in the Figure 2.1.
Avian Influenza (AI) is one of most important issues in recent years.Although, it has been circulating for centuries, India however had remainedfree from major AI till mid-February 200642. The first outbreak in India
occurred in 2006. Between January 27 and April 18, 2006, outbreaks ofHPAI virus subtype HSNI were reported in two districts (Navapur andJalgaon) of Maharashtra and adjoining areas in Gujarat and Madhya Pradesh.Control measures initiated included culling the entire poultry population,destruction of eggs, feeds, consumables, litter and other potentially infectedmaterial in a 10 kilometer radius of the outbreak location, restriction on themovement of poultry, poultry products and personnel to and from the affectedareas, and cleaning and sanitation of the infected area. More than one millionbirds and over 1.5 million eggs were destroyed, and farmers compensatedfor their losses. The government carried out surveillance (clinical, virologicaland serological) in a 15 kilometer radius of the outbreak area. Surveillancewas also carried on throughout the country through random sampling ofobserved abnormal mortality of poultry and wild migratory birds. OnAugust-11, 2006, the government declared that India has regained itsnotifiable AI-free country status as per OIE regulations.
The confirmation of avian flu led to drop in the price of chicken fromRs 36/Kg to Rs 16/Kg. The main markets of Maharastra were the worstaffected where business dropped by 40 percent . Production declined from15 lakh birds to 12 lakh birds, and in case of eggs, production declinedfrom 12 lakhs to 8 lakhs. Governments of other Indian states banned importsof poultry from Maharastra. According to industry sources the totalestimated loss to poultry industry is reported to be around Rs 12000 Crore.Big integrators like Venketeshwara Hatcheries and Godrej Aggrovet arereported to have suffered huge losses.
After the country was declared “Avian influenza free” on August 26 bythe Deptt. of Animal Husbandry, erosion in poultry off-take has sloweddown. In October 2006, exports grew by 5.4 percent to Rs 26.5crore. Onaccount of the downfall in exports in the earlier months, the total off-takeduring April-October 2006 was down by 27.7 percent at Rs 127.7crore.Exports to all major markets had fallen with the sharpest downfall in theintakes by UAE, Kuwait and Oman.
After the first outbreak in two western states, India recorded a multipleof AI in the eastern states like Manipur, Tripura, and West Bengal, during
Agricultural SectorLinkages
Food Science and Safety
Consumer
International
Exports Import Policy
Domestic
Human Plant Animal(Codex) (IPPC) (OIE)
Food Safety Standards
Health
Environment
FINANCIAL
Domestic and International
Industry
Figure 2.1: Linkage of Various Institutions inFood Processing
Source: Mehta and George (2005).
18 19
2007 and 2008. On July 25, 2007, an outbreak was located in small poultryfarm in far-east (an east district of Manipur). Within 15 days, 336000 birdswere culled, and 28000 eggs destroyed and 131 metric tonnes of poultrymeat burned.
The strains of H5N1 virus were confirmed in West Bengal during Jan.2008. It was worst ever in India, covering 14 of its 19 districts. Thecommunist-ruled state briefly contained the outbreak by culling more than4 million birds. Poultry sales in the state had fallen by about 70 per cent inthe January – March 2008, and traders were still struggling to over comelosses. But the virus re-surfaced in tea-growing 15th District in May 2008.As per official statement, the West Bengal virus was reported only inbackyard birds and not in any commercial farm. West Bengal bordersBangladesh where the virus has been detected in more than half of thecountries 64 districts. The disease was first detected in Bangladesh in Feb.2007 and was almost dormant by late 2007 but made a forceful comebackin January 2008.
A major amount of compensation to farmers/traders is being given byGovernment. According the official sources compensation has been fixedat Rs. 50 for layer, Rs. 20 for a chic, Rs. 75 for a duck and Rs. 2 for an egg.This amount is close to the market prices. India has so far not reported anyhuman infections, but experts fear the H5N1 strain into a form which canbe easily transmitted from person to person leading to a pandemic.
In view of the global threat of outbreak of AI and apprehensions of ahuman pandemic, it was necessary to take steps to ensure preparedness incase of an outbreak of AI. Major steps taken by GOI to control avian flu at(i) Pre-outbreak level, (ii) steps to be taken in the case of suspicion and (iii)specific action plan in case of outbreak. Most of these action plans havebeen prepared in consultation with WHO and other International organisationlike OIC. Some broad points of Indian latest action plan to control avianflu has been in given in Annex I. When H5N1 virus is notified in any areaof India, a red alert is issued and Government issues the state of the positionevery day.
2.4 Complementarities: A Case of Processors and ContractFarmingIn the case of egg powder (mostly 100 percent export oriented units) thereis close relationship between egg processor and contract layer farmers.Similarly, chicken processing units also procure broilers from contract farms,and the supply chain is maintained. The processing units own some of thefarms themselves and in other cases they procure broilers from contractfarms43. However, the processor sells value-added products through anetwork of distributors/retailers/directly to institutions where supply is inbulk or on yearly basis. In some cases chicken-based food outlets have nowbecome vertical integrators44.
Started in the year 1984, Suguna Poultry Farm Ltd. is today one ofthe leading poultry companies in India with a steadily increasing globalpresence. Its turnover exceeded 8.1 billion rupees in 2004-05. Whatmakes Suguna Poultry special is its pioneering efforts in contractfarming with help of thousands of small farmers to grow along withthe company. It has also gone global and entered into partnerships withseveral international players.
In contract farming all the inputs such as Day Old Chicks, feed,medicines and daily care are the products supplied by Suguna. The contractfarmer has to take care of daily management of the farm until the birdsgrow to the stage of marketability. The farmer owns the shed and for takingcare of the birds. He is paid a fair amount namely, growing charges for theservices he rendered for looking after the birds growth in his farm. Tosome extend responsibility rests with the company. Everything comes tohis farm shed and same way it is taken from his farm gate. There is negligiblerisk for the farmer such as market volatility, raw material price fluctuations,etc. They are assured of a regular income at equal intervals.
2.5 Issues and Impact of Changing Food Safety Standards onExportsThe WTO agreement on the application of sanitary and phyto-sanitarymeasures sets out the basic rules for food safety for human, animal andplant health standards. It allows countries to set their own standards, but it
20 21
also stipulates that regulations must be based on science. They should notarbitrarily or unjustifiably discriminate between countries where identicaland similar conditions prevail.
One of the problems in these standards is that they are so stringentthat many countries have difficulty in implementing them nationally.India has been no exception and is trying to harmonize its standardswith Codex so that it falls in line with all these agreements. Though,Indian standards for egg processing plants have been derived fromUSDA and EU Regulations, many countries like Australia and Malaysiado not recognize these standards. Similarly, the importing countries donot approve the veterinary certificate issued by competent governmentapproved authorities like export inspection agencies and insist on aseparate certificate issued by foreign consulting firms. In some cases,even the importing companies have their own specifications, whichvary from their own national standards. However, there is a feeling inthe Indian industry that sometime the importing countries particularlyfor egg products are using these measures discriminately. It is, therefore,quite evident that despite the best spirit of SPS Agreement these measuresin some or other garb are being used to hinder exports from India.45
The Indian poultry sector, particularly egg processing units have alreadystarted integrating themselves with the global system. All the egg processingunits in India are already HACCP compliant. Similarly, the chickenprocessing units are in line for adoption of HACCP, and many have alreadyadopted. But it would not be out hof place to mention that only bigger unitswho have the manpower, infrastructure and financial strength can adoptHACCP and ISO 9000 type of measures. Small and marginal farmers andsmall units engaged in processing may find it difficult to implement thesesystems. In the following paragraph we give a case study which shows thathow WTO is unable to meet supply-side issues.
An Indian consignment of “Egg Powder” was rejected in the EU46
because the destination market included additional element known as MRPLor “minimum required performance limit”, in May 2003. The rejectionbased on these additional criteria, MRPL, was not known to the Indian
establishment, because the new standard had to be met within 2-3 weeks.47
In addition, it was also not clear whether the consignment met additionalcriteria or not, because the competent authority had not tested for the criteria.However, on re-examination it was found that the consignment met theadditional criteria also. Since the re-examination of the consignment tooksome time, the consignment developed more problems due to longer shelflife at port.
The establishments whose consignment was rejected had a validequivalence issued by the EU. And yet there was a “Rapid Alert’ issued inEC as a routine that went to all importing countries. However when theconsignment was declared to be meeting the additional element of MRPL,the ‘Rapid Alert’ was neither withdrawn nor importing countries de-alerted.The loss of reputation and increases in costs both implicit and explicit inthis whole episode is going to take a long time to recover.
In this context, illustrations can also be provided from the Shrimpexport ban by EU from the developing countries in general and Bangladeshin particular. The classical African peanut export ban, again by EU, onaccount of afflatoxin; rejection of fish consignments from Kenya on accountof bacterium which causes Cholera; are a few of the experiences that thedeveloping countries are not able to forget while SPS implementation issuesare under discussion.48
2.6. Some Issues Related to Animal Health WelfareThere is no simple objective measure of welfare or general consensus ofwhat welfare involves and, thus, all the emphasis to be given to any aspectof husbandry and economics. This arises because of inadequateunderstanding by at least some and possibly many people of one or more ofthe following disciplines: ethics, animal physiology, athology, diseases,pathology and epidimology. There are so many divergent groups involvedthat they have opposite ideas, interpretation and objectives and it is difficultto arrive at a consensus applicable to all. Therefore, welfare of livestock islost in the ensuing often-acrimonious arguments. One of the difficultiesarises from the large number of animals involved. One may consider 100,000birds in one house, as a small unit whereas a million birds is a reasonable
22 23
In urban areas some animal health welfare enthusiasts have been raisingtheir voices for animal welfare and humane treatment to the livestock. Infuture, some issues may become of some consideration even in India: (i)efficient in circulating balanced nutrients and in reducing leakage of suchnutrients in air and water, (ii) sophisticated production methods with lowerturnover of raw materials and energy, and (iii) sustainable forms of energylike solar energy, bio-fuels, etc.
2.7 Waste Disposal Concerns for ProducersIn US and Western Europe, there is a great concern for waste disposal ofpoultry excreta as well as rendering material from processing units. This ismore so in EU and USA since they have very intensive system of productionbecause of the climate and most of the houses need heating systems becauseof the cold climate. In India, most of flocks are kept in open houses and itis only in winter months, that too, in a few regions when the heating systemshave to use for few days. The excreta of birds, whether in cages or throughdeep-litter is used as fertilizer by the agricultural farmers for different cropsand as of today there is no such problem of excreta waste disposal.
Regarding waste from processing units of chicken, some of the unitshave got rendering plants, which properly use the blood, feathers, intestines,etc., and other waste material recovered from processing of the chicken.However, by-products from rendering plants are not reused in poultryproduction. Moreover, most of the poultry units in India are located inrural areas and as such do not cause several environmental problems. Butlooking into the future global concerns over such issues, India will have tolook into these matters more objectively and make plans to sort them out.
2.8. Environmental Pollution in Poultry ProductsIn many countries, there has been an increasing concern over environmentalpollution since most of the houses use massive energy to provide heatingand in turn these production units produce lot of ammonia and other gases.The processing units of chicken also produce plenty polluting elements andconcerns has been raised time and again pertaining to the quality of groundwater, risk of leakage of poisonous material, etc. In India, these issues are notyet critical, though, they are discussed now at various seminars and discussions
size, which is economically viable. Both may follow good health husbandrypractices but both must face the inevitable welfare problems of environment,nutrition and disease control. One must also keep in mind that the presentindustrial agriculture is required to feed a very large human population.We can broadly put objectives and measures of animal welfare, which canbe assessed, in poultry houses as (1)Visual inspection and resulting assessment,(2)Ensure that freedom from thirst, freedom from pain, (3)Measurementof space available for hen, (4)Absence of behavioural anomalies likes fear,hysteria, cannibalism, feather picking, and vent picking, (5) Measurementof husbandry and flock health, and (6) Lab estimates of various physiologicalfunctions and hormone levels.
Welfare assessment is, however, more complicated for severalreasons. The information of the above criteria is acceptable to everyone.There are a large number of hens in major poultry houses wheretraditional systems or battery cages are used. Caged houses containingover 100,000 hens or even more are now being built and there may besmall farms in deep-litters with a size of 500 or 1000 birds. It isgenerally easier visually to assess individual animals in small flocks upto 100 than larger flocks where individual birds can be overlooked. Incages, hens are presented to the observer in good light and in smallnumbers as each cage hold a small flock. However, in the smaller flocksof traditional system, sick and bullied hens are much more likely to beoverlooked as they may be hidden by equipment or dark corners. Thisis an important challenge to both management and caretakers in cagesand more importantly in traditional systems. In India, the medium andbig farms keep birds in cages whereas small and marginal farmers stillhave the traditional deep-litter system. In Europe, issues of animalwelfare, antibiotic and ground water quality may become major concernsand cages have to be done away with by 2012 but there is no suchconcern in India as of today. But considering the globalization andinternational trade in poultry products these issues may be live in Indiaafter few years because of pressures from importers from countries likeWestern Europe and US. These countries may not import from India ifpoultry is produced in A-4 size cages However, one has to find acceptablesystems of production.
is generally not available to local public even for drinking purpose. Insome areas, it leads to major conflict between producers and local population.This problem will further aggravate with increasing poultry production, infuture. With the growth in poultry, the need for water (and grains) wouldincrease. Since the Indian population is also increasing, the poultry growthwill would place a challenge to policy makers about how to balance theconsumption of water (and grains) between the human and the birds.
2.10. Constraints on the Growth of Poultry IndustryA major constraint affecting the growth of the poultry industry in India isthe lack of basic infrastructure such as storage and transportation includingcold chain facilities. As a result, there are wild price fluctuations in theprices of poultry products, i.e. eggs and broilers. Another constraint togrowth is an inefficient marketing system. A third problem relates toprices of feed resources. Maize or corn plays a major role in broilerproduction, as it constitutes 50 to 55 percent of broiler feed. As thebroiler industry is growing at the rate of 15 percent per annum, thedemand for maize is thus likely to increase. Presently, India growsaround 11-12 million tonnes of maize49, and only 5-6 million tonnesare available for poultry which is insufficient if the current growth rateof the industry is to be maintained. Fourth, though poultry is an integralpart of agriculture and treated on par with livestock in India, it facesrestrictions on use of agricultural land, attracts higher electricity tariffs/sales tax than that of agriculture, pays tax on income earned from poultryfarms, and is subject to different land/labor laws including the minimumwage act. Fifth, in India there is no tradition of processed poultry in whichthe poultry is frozen, which provides higher shelf life to the poultry. Herethe poultry is kept alive thus there is no shelf life of poultry.50 This leads towide price fluctuations thus impacting the profitability of poultry farms.Sixth, lack of vertical integration of poultry industry is another importantproblem Indian poultry industry is facing.
In other counties, particularly developed ones, a number of other issueslike environment, food safety and animal welfare etc. are important in thecontext of poultry production. The following section gives the present stateof the position of some of these issues in India.
24 25
on poultry production. As organic production systems are gaining relevance inmany countries, organic production systems are designed to produce optimumquantity of food by using management practices that aim to avoid the use ofagro-chemical inputs that, in turn, minimize damage to the environment andwildlife. These issues may crop up in India too after few years.
The organic philosophy for clear environment is that production shouldbe carried out in small flocks in small units which would create greater riskof infection which will lead to greater risk of diseases as medicines andfeed additives will not be used for this type of farming. Since growthpromoters, hormones etc. are not used and there is not very intensive poultryproduction and houses are open there is a big difference between Indianand western production of broiler and eggs. Therefore, the problems mayarise only when the international trade takes place and the countries raiseobjections to such production systems as not compatible with their ownproduction systems. No serious thought has been given to this problem.
2.9. Conflicts between Poultry Productions, Producers/Processors,and Local Population over Environmental IssuesPresently, there is no conflict between the producers of poultry products,farmers, and population living around them since these farms are notsupposed to be creating any health hazards. But as the urban populationgrows and moves towards rural areas and becomes more alive toenvironmental issues, this may become a problem of future as the poultryindustry grows along. However, there is big problem (a) with poultryslaughters, as Indian people prefer slaughtering in their presence, and (b)availability of quality water. A very significant portion of Indian broilersare slaughtered in small road side shops with no provisions for meetingminimum conditions. Many times it has been found that the blood, feathers,intestines, etc are thrown into nearby areas creating a health hazard forlocal community. Strict vegetarians object to poultry or other meat shopsin their nearby areas. Although, Govt. of India has special conditions forapproval of poultry slaughter houses, it is seldom followed by poultryslaughter shops/houses (Annex II).
The quality of the water used for the poultry sector in hatcheries, farmingand processing has to meet some minimum standards. That quality of water
26 27
3. RESEARCH QUESTIONS, HYPOTHESES AND METHODOLOGY
3.1 Specific Research QuestionsAs the main objective of this study, as earlier stated, is to identify factors inthe scaling up of poultry production in India and to assess its implicationsfor social and environmental outcomes, particularly the ones that the welfareof the poor we start by looking at ways to separate out the technological,economic and policy driven aspects so to understand which types of policyactions may be more pro-poor and welfare enhancing. Keeping this as ourproximate goal, we frame questions for investigation as follows:(a) Why do some poultry farms have higher nominal profits per unit of
output than others?(b) Why do some farms have higher negative environmental impact per
unit of output than others? Do the negative environmental externalitiesexplain the relative competitiveness?
(c) To what extent are these differences across farms due to differences intransaction costs and environmental externalities, or due to greater orless technical/allocative efficiency?
(d) Once above mentioned factors in (c) have been taken into account,what is the relative importance of each of these across farm sizes?
(e) Do contract farms earn higher nominal profits per unit compared withindependents of a similar scale?
3.2 HypothesesThese questions lead us to frame following hypotheses for testing:(1) Small-scale producers reap lower profits per unit of output than do
large farmers (i.e. economies of scale).(2) Small-scale producers are not less efficient if family labour is not costed
and true environmental externalities are taken into account.(3) Profits of small-scale producers are more sensitive to ‘transaction costs’
than are those of large-scale producers. (4) Small farmers expend a higher amount of effort or investment in
pollution abatement per unit of output than do large farmers; and thissituation creates a lower capture of environmental externalities per unitof output by small farms.
(5) Contract farmers have higher nominal profits per unit compared withindependents of a similar scale.
3.3 MethodologyIn testing above-mentioned hypotheses, we use two important approaches:1. Simple statistical tests, like difference in mean value of profit of large
and small farmers, contract and independent farmers.2. Stochastic Profit frontier Function, for estimating determinants of
relative profitability incorporating the cost associated with51
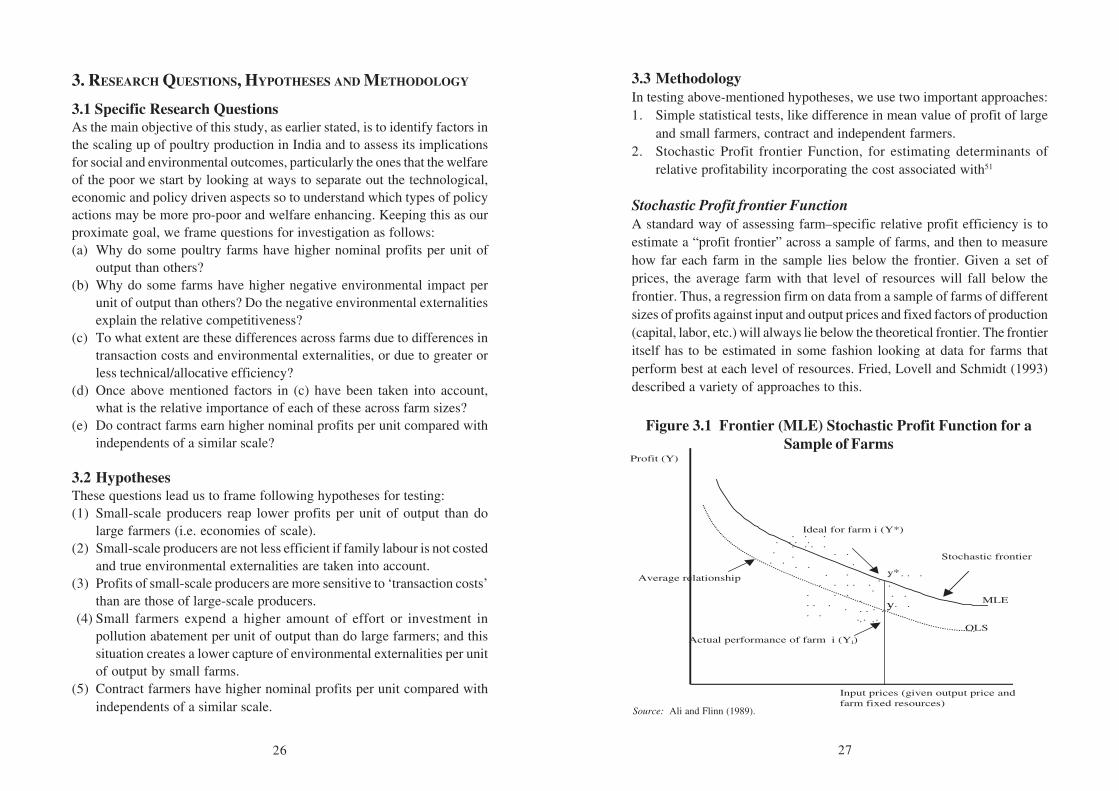
Stochastic Profit frontier FunctionA standard way of assessing farm–specific relative profit efficiency is toestimate a “profit frontier” across a sample of farms, and then to measurehow far each farm in the sample lies below the frontier. Given a set ofprices, the average farm with that level of resources will fall below thefrontier. Thus, a regression firm on data from a sample of farms of differentsizes of profits against input and output prices and fixed factors of production(capital, labor, etc.) will always lie below the theoretical frontier. The frontieritself has to be estimated in some fashion looking at data for farms thatperform best at each level of resources. Fried, Lovell and Schmidt (1993)described a variety of approaches to this.
Input prices (given output price and farm fixed resources)
Stochastic frontier
Profit (Y)
Average relationship
Actual performance of farm i (Y i )
Ideal for farm i (Y*)
y*
y
OLS
MLE
· · · · · · · · · ·
· · · · · · · · · ·
· · · · · · ·
· · · · · · · · · ·
· · · · ·
· · · · · · · ·
· · · · · · · ·
Figure 3.1 Frontier (MLE) Stochastic Profit Function for aSample of Farms
Source: Ali and Flinn (1989).
28 29
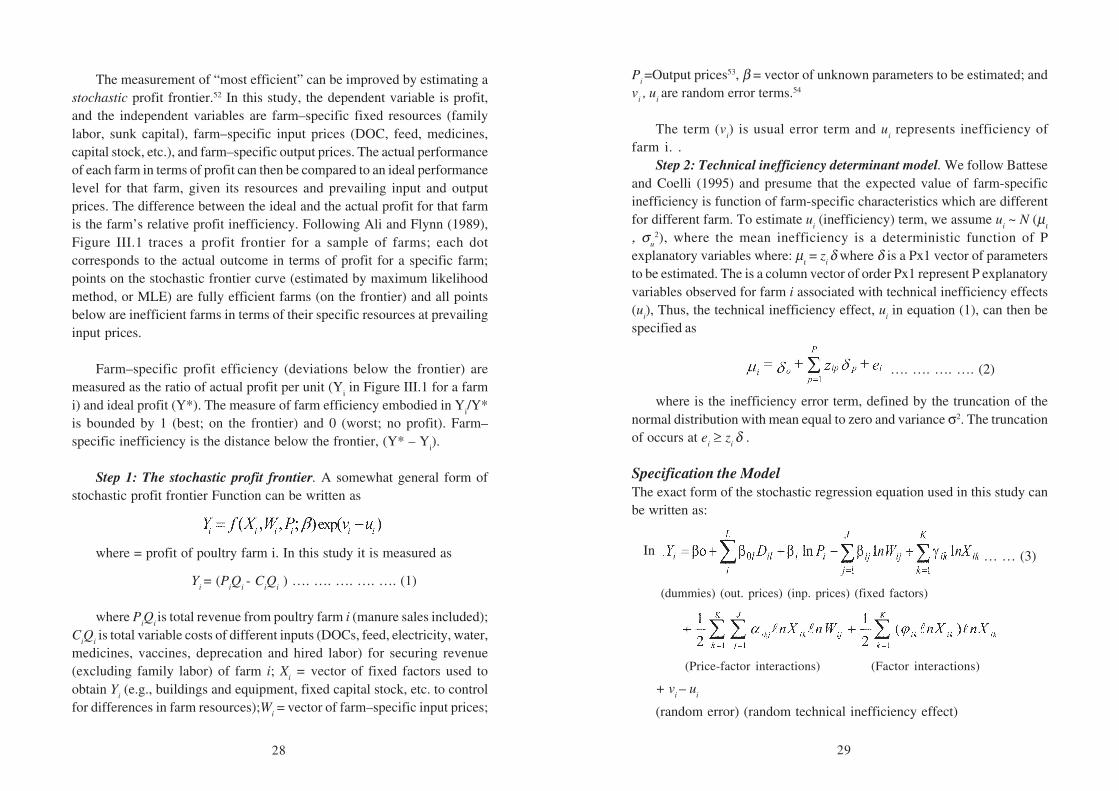
The measurement of “most efficient” can be improved by estimating astochastic profit frontier.52 In this study, the dependent variable is profit,and the independent variables are farm–specific fixed resources (familylabor, sunk capital), farm–specific input prices (DOC, feed, medicines,capital stock, etc.), and farm–specific output prices. The actual performanceof each farm in terms of profit can then be compared to an ideal performancelevel for that farm, given its resources and prevailing input and outputprices. The difference between the ideal and the actual profit for that farmis the farm’s relative profit inefficiency. Following Ali and Flynn (1989),Figure III.1 traces a profit frontier for a sample of farms; each dotcorresponds to the actual outcome in terms of profit for a specific farm;points on the stochastic frontier curve (estimated by maximum likelihoodmethod, or MLE) are fully efficient farms (on the frontier) and all pointsbelow are inefficient farms in terms of their specific resources at prevailinginput prices.
Farm–specific profit efficiency (deviations below the frontier) aremeasured as the ratio of actual profit per unit (Y
i in Figure III.1 for a farm
i) and ideal profit (Y*). The measure of farm efficiency embodied in Yi/Y*
is bounded by 1 (best; on the frontier) and 0 (worst; no profit). Farm–specific inefficiency is the distance below the frontier, (Y* – Y
i).
Step 1: The stochastic profit frontier. A somewhat general form ofstochastic profit frontier Function can be written as
where = profit of poultry farm i. In this study it is measured as
Yi = (P
iQ
i - C
iQ
i ) …. …. …. …. …. (1)
where PiQ
i is total revenue from poultry farm i (manure sales included);
CiQ
i is total variable costs of different inputs (DOCs, feed, electricity, water,
medicines, vaccines, deprecation and hired labor) for securing revenue(excluding family labor) of farm i; X
i = vector of fixed factors used to
obtain Yi (e.g., buildings and equipment, fixed capital stock, etc. to control
for differences in farm resources);Wi = vector of farm–specific input prices;
Pi =Output prices53, β = vector of unknown parameters to be estimated; and
vi , u
i are random error terms.54
The term (vi) is usual error term and u
i represents inefficiency of
farm i. .Step 2: Technical inefficiency determinant model. We follow Battese
and Coelli (1995) and presume that the expected value of farm-specificinefficiency is function of farm-specific characteristics which are differentfor different farm. To estimate u
i (inefficiency) term, we assume u
i ~ N (µι
, σu
2), where the mean inefficiency is a deterministic function of Pexplanatory variables where: µι = z
i δ where δ is a Px1 vector of parameters
to be estimated. The is a column vector of order Px1 represent P explanatoryvariables observed for farm i associated with technical inefficiency effects(u
i), Thus, the technical inefficiency effect, u
i in equation (1), can then be
specified as
…. …. …. …. (2)
where is the inefficiency error term, defined by the truncation of thenormal distribution with mean equal to zero and variance σ2. The truncationof occurs at e
i ≥ z
i δ .
Specification the ModelThe exact form of the stochastic regression equation used in this study canbe written as:
In … … (3)
(dummies) (out. prices) (inp. prices) (fixed factors)
(Price-factor interactions) (Factor interactions)
+ vi – u
i
(random error) (random technical inefficiency effect)
30 31
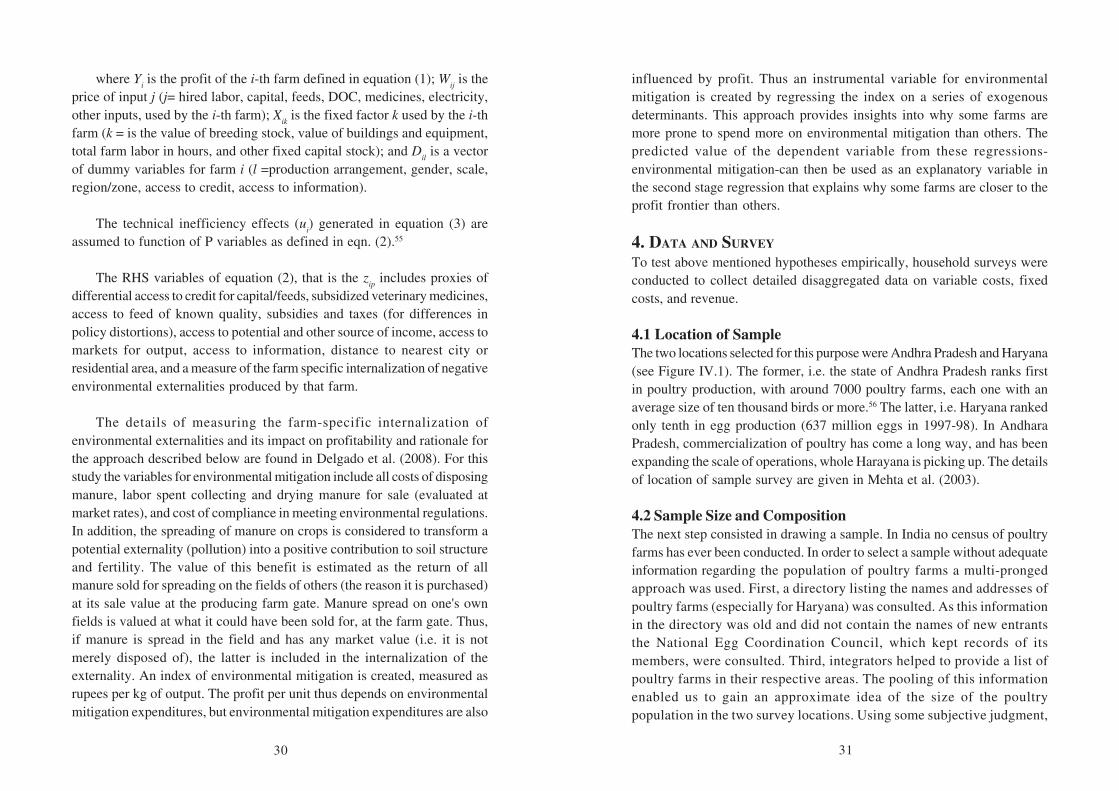
where Yi is the profit of the i-th farm defined in equation (1); W
ij is the
price of input j (j= hired labor, capital, feeds, DOC, medicines, electricity,other inputs, used by the i-th farm); X
ik is the fixed factor k used by the i-th
farm (k = is the value of breeding stock, value of buildings and equipment,total farm labor in hours, and other fixed capital stock); and D
il is a vector
of dummy variables for farm i (l =production arrangement, gender, scale,region/zone, access to credit, access to information).
The technical inefficiency effects (ui) generated in equation (3) are
assumed to function of P variables as defined in eqn. (2).55
The RHS variables of equation (2), that is the zip includes proxies of
differential access to credit for capital/feeds, subsidized veterinary medicines,access to feed of known quality, subsidies and taxes (for differences inpolicy distortions), access to potential and other source of income, access tomarkets for output, access to information, distance to nearest city orresidential area, and a measure of the farm specific internalization of negativeenvironmental externalities produced by that farm.
The details of measuring the farm-specific internalization ofenvironmental externalities and its impact on profitability and rationale forthe approach described below are found in Delgado et al. (2008). For thisstudy the variables for environmental mitigation include all costs of disposingmanure, labor spent collecting and drying manure for sale (evaluated atmarket rates), and cost of compliance in meeting environmental regulations.In addition, the spreading of manure on crops is considered to transform apotential externality (pollution) into a positive contribution to soil structureand fertility. The value of this benefit is estimated as the return of allmanure sold for spreading on the fields of others (the reason it is purchased)at its sale value at the producing farm gate. Manure spread on one's ownfields is valued at what it could have been sold for, at the farm gate. Thus,if manure is spread in the field and has any market value (i.e. it is notmerely disposed of), the latter is included in the internalization of theexternality. An index of environmental mitigation is created, measured asrupees per kg of output. The profit per unit thus depends on environmentalmitigation expenditures, but environmental mitigation expenditures are also
influenced by profit. Thus an instrumental variable for environmentalmitigation is created by regressing the index on a series of exogenousdeterminants. This approach provides insights into why some farms aremore prone to spend more on environmental mitigation than others. Thepredicted value of the dependent variable from these regressions-environmental mitigation-can then be used as an explanatory variable inthe second stage regression that explains why some farms are closer to theprofit frontier than others.
4. DATA AND SURVEY
To test above mentioned hypotheses empirically, household surveys wereconducted to collect detailed disaggregated data on variable costs, fixedcosts, and revenue.
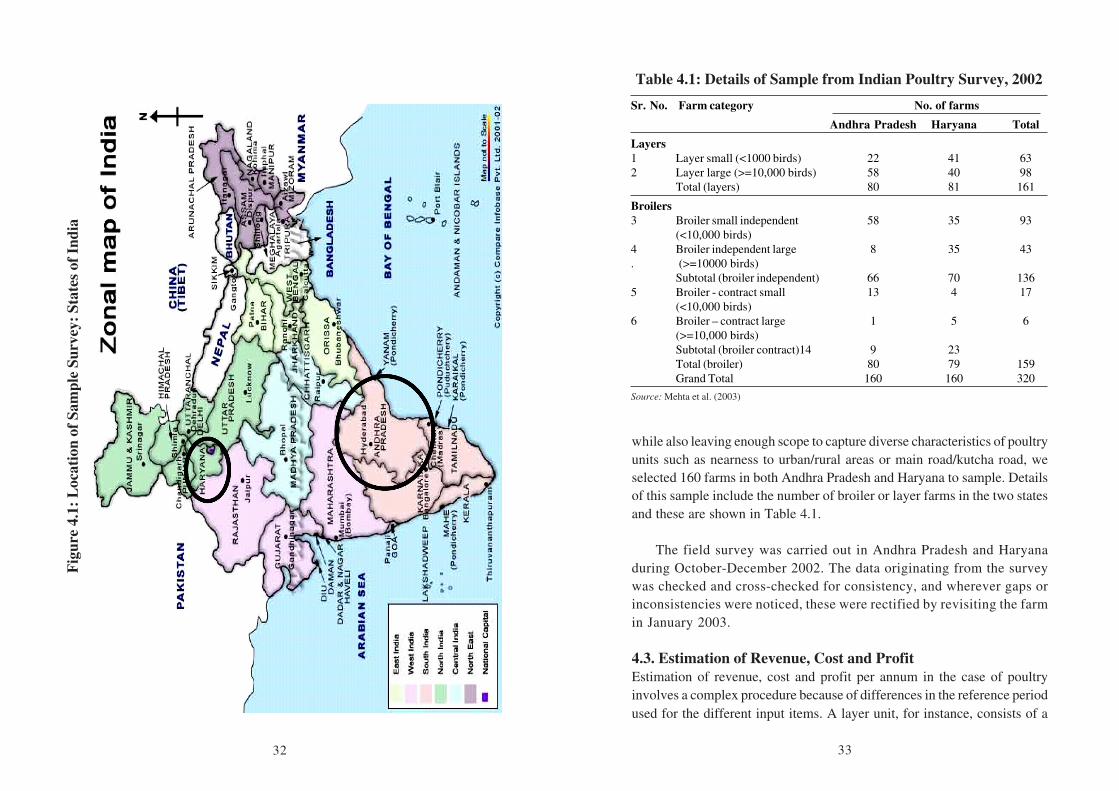
4.1 Location of SampleThe two locations selected for this purpose were Andhra Pradesh and Haryana(see Figure IV.1). The former, i.e. the state of Andhra Pradesh ranks firstin poultry production, with around 7000 poultry farms, each one with anaverage size of ten thousand birds or more.56 The latter, i.e. Haryana rankedonly tenth in egg production (637 million eggs in 1997-98). In AndharaPradesh, commercialization of poultry has come a long way, and has beenexpanding the scale of operations, whole Harayana is picking up. The detailsof location of sample survey are given in Mehta et al. (2003).
4.2 Sample Size and CompositionThe next step consisted in drawing a sample. In India no census of poultryfarms has ever been conducted. In order to select a sample without adequateinformation regarding the population of poultry farms a multi-prongedapproach was used. First, a directory listing the names and addresses ofpoultry farms (especially for Haryana) was consulted. As this informationin the directory was old and did not contain the names of new entrantsthe National Egg Coordination Council, which kept records of itsmembers, were consulted. Third, integrators helped to provide a list ofpoultry farms in their respective areas. The pooling of this informationenabled us to gain an approximate idea of the size of the poultrypopulation in the two survey locations. Using some subjective judgment,
32 33
while also leaving enough scope to capture diverse characteristics of poultryunits such as nearness to urban/rural areas or main road/kutcha road, weselected 160 farms in both Andhra Pradesh and Haryana to sample. Detailsof this sample include the number of broiler or layer farms in the two statesand these are shown in Table 4.1.
The field survey was carried out in Andhra Pradesh and Haryanaduring October-December 2002. The data originating from the surveywas checked and cross-checked for consistency, and wherever gaps orinconsistencies were noticed, these were rectified by revisiting the farmin January 2003.
4.3. Estimation of Revenue, Cost and ProfitEstimation of revenue, cost and profit per annum in the case of poultryinvolves a complex procedure because of differences in the reference periodused for the different input items. A layer unit, for instance, consists of a
Fig
ure
4.1:
Loc
atio
n of
Sam
ple
Surv
ey: S
tate
s of
Ind
iaTable 4.1: Details of Sample from Indian Poultry Survey, 2002
Sr. No. Farm category No. of farms
Andhra Pradesh Haryana Total
Layers1 Layer small (<1000 birds) 22 41 632 Layer large (>=10,000 birds) 58 40 98
Total (layers) 80 81 161
Broilers3 Broiler small independent 58 35 93
(<10,000 birds)4 Broiler independent large 8 35 43. (>=10000 birds)
Subtotal (broiler independent) 66 70 1365 Broiler - contract small 13 4 17
(<10,000 birds)6 Broiler – contract large 1 5 6
(>=10,000 birds)Subtotal (broiler contract)14 9 23Total (broiler) 80 79 159Grand Total 160 160 320
Source: Mehta et al. (2003)

34 35
number of batches in order to have a continuous flow of income. Data onoutput and most of the inputs are collected for only the latest completedbatch, which makes up only a part of the unit. The size of the unit isexpressed in terms of the total number of birds in all the batches at a pointof time. For instance, if a unit maintains three different batches of 10,000birds each, the size of the unit is 30,000 birds. Each batch will be completedin about 72 weeks or 17 months. There will be a gap of two to three weeksafter the completion of the batch for cleaning and disinfecting the shedsbefore commencing with the next batch. The duration of the batch variesfrom 72 weeks to 80 weeks depending on the production rate of eggs. Thecompletion of all the batches is counted as a single and it coincides with theduration of a batch. The duration of a batch is about seven weeks in the caseof a broiler unit. Annual estimates have to be derived for both types ofunits. Furthermore, the data available for a batch has to be multiplied for acycle. The following method is used to derive the annual estimates for allof the broiler and layer units.
In order to derive the annual output of a layer unit from the outputoriginating from a batch, a multiplier is constructed as the product of twofactors: one for converting the batch estimate (about 72 weeks) for oneyear, and the other for converting the estimate for one batch to the estimatefor the entire unit. If x is the duration of the batch (in weeks) and y is thegap between two batches (in weeks), the first factor is 52/(x+y). To illustrate,if the gap between two batches is two weeks and the duration of the batch is72 weeks, the first factor is 0.7027. The second factor, i.e. the factor forconverting the batch to estimate for the year is the ratio of the size of theunit to the size of the batch. If a layer unit of 10,000 birds has 2,500 layersin the latest completed batch, the second conversion factor becomes four.The multiplier for the above unit is 2.8108 (0.7027 x 4.0). Since broileroutput is collected for all the batches maintained in a year, the multiplier isunity for output. However, certain items of inputs are collected for thelatest batch and for these items; the multiplier is the ratio of unit size to thesize of the batch. Thus, only one of the two factors of the multiplier forlayer will be applicable for the broiler.
The revenue from a layer unit comes from eggs and manure. As thereis some spoilage of eggs, the value of eggs is based on the production of
eggs minus the value of spoilage. A broiler unit produces, and brings inrevenue from meat and manure. Information on the quantity of these outputsand their corresponding prices is available. The value of manure is calculatedas the total value of manure used either by the farm or by others, and isvalued at the market price.
Data on inputs are collected for various reference periods. Informationon some inputs such as regular workers is collected for the year, and onother inputs such as casual workers or feed, is instead, collected for thebatch. Information on feed is collected for different stages of the bird forthe latest completed batch. Expenditure data on electricity, water, phone,etc. are available for the entire unit. Cost items are classified into twocategories. Cost items representing the entire unit per year are taken as theyare without applying any factor for blowing up. Cost items representing thebatch are converted into annual estimates for the entire unit using themultiplier.
4.4 Structural Characteristics of Sample Poultry UnitsThe detailed information of sample survey consisting of (i) education/training/experience of decision maker in poultry, (ii) availability ofinfrastructure, fixed capital/working capital etc., (iii) closeness of unit tourban areas/residence area; technology of poultry production (deep litter orcages), management (proprietorship/partnership) enterprise; present size ofunits, and age of unit; (iv) mortality rate/yield per bird; (v) hired labour,(vi) sale of output to type of agencies (wholesale/retail/contractor etc); (vii)mode and location of disposal of dead birds; (viii) indicators of environmentpollution/environment cleaning, etc., is given in Mehta et al. (2003).
5. EMPIRICAL RESULTS
This section presents the empirical results obtained from testing the varioushypotheses presented in Section 3. They are discussed here again briefly soas to understand the results of the hypotheses.
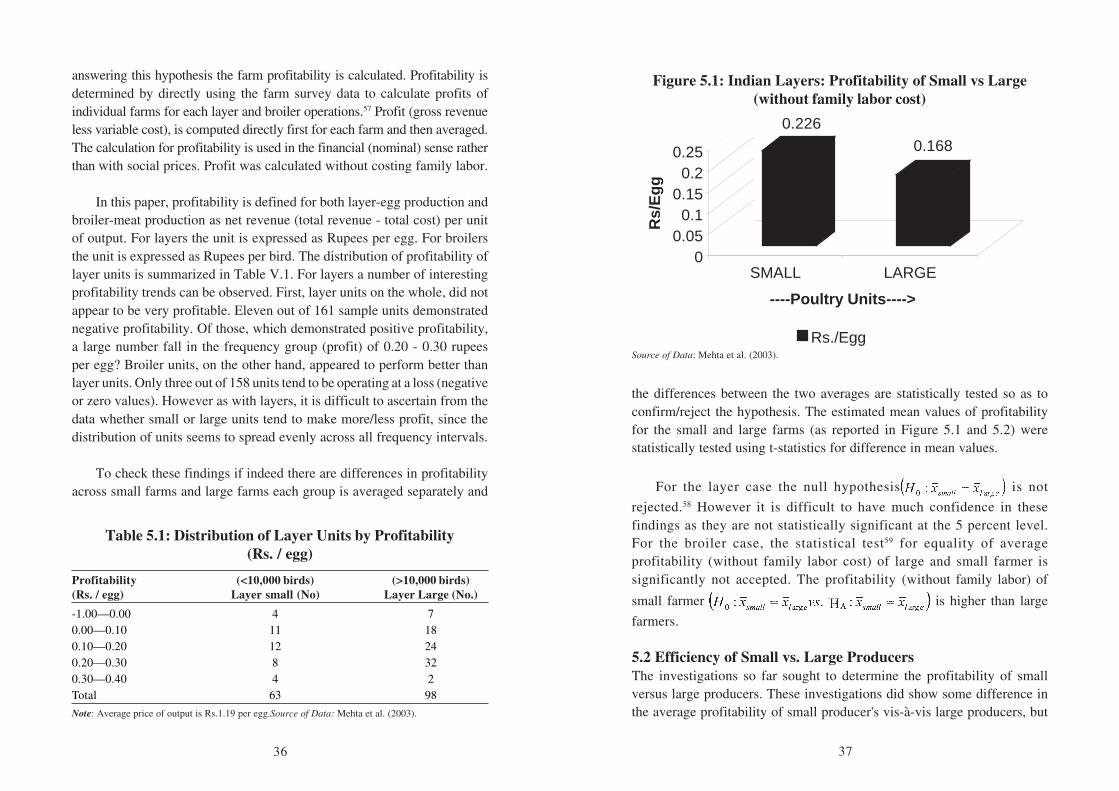
5.1 Small-Scale Producers have Higher or Equal Profits per unitof Output than do Large Producers.This hypothesis is interested in whether small-scale producers have higher orequal profits per unit of output than larger producers. For the purpose of
36 37
the differences between the two averages are statistically tested so as toconfirm/reject the hypothesis. The estimated mean values of profitabilityfor the small and large farms (as reported in Figure 5.1 and 5.2) werestatistically tested using t-statistics for difference in mean values.
For the layer case the null hypothesis is not
rejected.58 However it is difficult to have much confidence in thesefindings as they are not statistically significant at the 5 percent level.For the broiler case, the statistical test59 for equality of averageprofitability (without family labor cost) of large and small farmer issignificantly not accepted. The profitability (without family labor) of
small farmer is higher than large
farmers.
5.2 Efficiency of Small vs. Large ProducersThe investigations so far sought to determine the profitability of smallversus large producers. These investigations did show some difference inthe average profitability of small producer's vis-à-vis large producers, but
answering this hypothesis the farm profitability is calculated. Profitability isdetermined by directly using the farm survey data to calculate profits ofindividual farms for each layer and broiler operations.57 Profit (gross revenueless variable cost), is computed directly first for each farm and then averaged.The calculation for profitability is used in the financial (nominal) sense ratherthan with social prices. Profit was calculated without costing family labor.
In this paper, profitability is defined for both layer-egg production andbroiler-meat production as net revenue (total revenue - total cost) per unitof output. For layers the unit is expressed as Rupees per egg. For broilersthe unit is expressed as Rupees per bird. The distribution of profitability oflayer units is summarized in Table V.1. For layers a number of interestingprofitability trends can be observed. First, layer units on the whole, did notappear to be very profitable. Eleven out of 161 sample units demonstratednegative profitability. Of those, which demonstrated positive profitability,a large number fall in the frequency group (profit) of 0.20 - 0.30 rupeesper egg? Broiler units, on the other hand, appeared to perform better thanlayer units. Only three out of 158 units tend to be operating at a loss (negativeor zero values). However as with layers, it is difficult to ascertain from thedata whether small or large units tend to make more/less profit, since thedistribution of units seems to spread evenly across all frequency intervals.
To check these findings if indeed there are differences in profitabilityacross small farms and large farms each group is averaged separately and
Table 5.1: Distribution of Layer Units by Profitability(Rs. / egg)
Profitability (<10,000 birds) (>10,000 birds)(Rs. / egg) Layer small (No) Layer Large (No.)
-1.00—0.00 4 70.00—0.10 11 180.10—0.20 12 240.20—0.30 8 320.30—0.40 4 2Total 63 98
Note: Average price of output is Rs.1.19 per egg.Source of Data: Mehta et al. (2003).
0.2260.168
00.05
0.10.15
0.20.25
Rs/
Egg
SMALL LARGE
----Poultry Units---->
Rs./Egg
Figure 5.1: Indian Layers: Profitability of Small vs Large(without family labor cost)
Source of Data: Mehta et al. (2003).
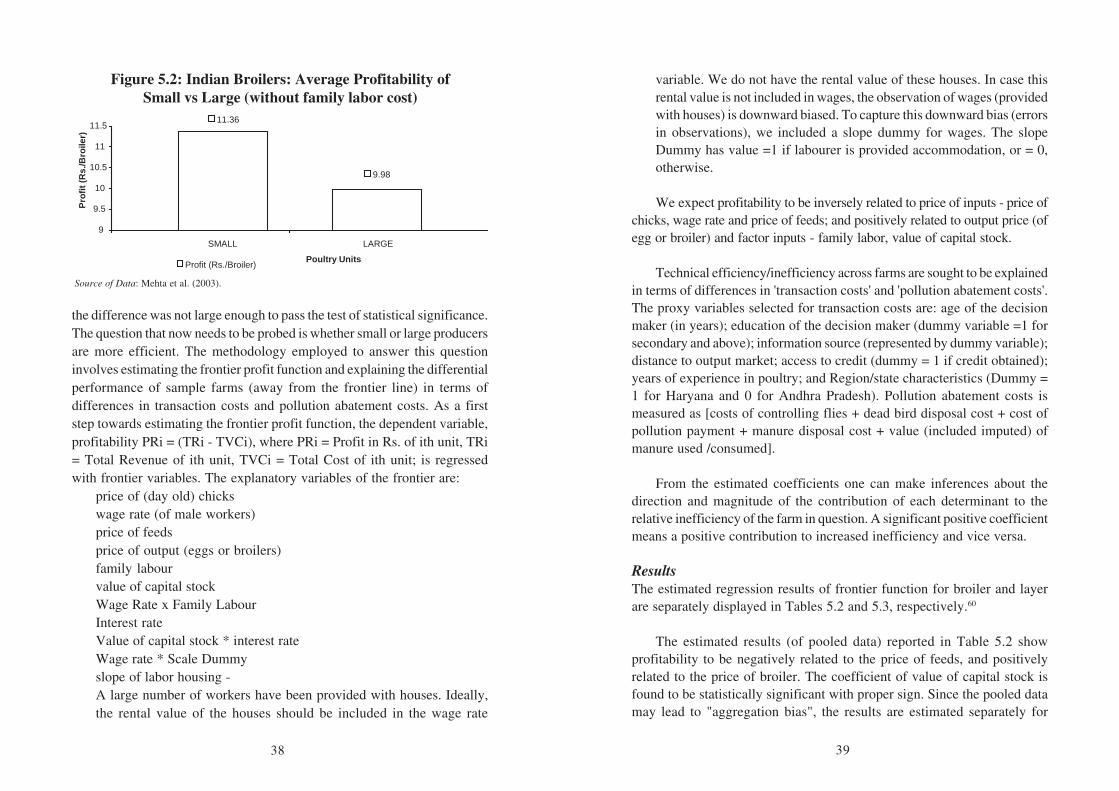
the difference was not large enough to pass the test of statistical significance.The question that now needs to be probed is whether small or large producersare more efficient. The methodology employed to answer this questioninvolves estimating the frontier profit function and explaining the differentialperformance of sample farms (away from the frontier line) in terms ofdifferences in transaction costs and pollution abatement costs. As a firststep towards estimating the frontier profit function, the dependent variable,profitability PRi = (TRi - TVCi), where PRi = Profit in Rs. of ith unit, TRi= Total Revenue of ith unit, TVCi = Total Cost of ith unit; is regressedwith frontier variables. The explanatory variables of the frontier are:
price of (day old) chickswage rate (of male workers)price of feedsprice of output (eggs or broilers)family labourvalue of capital stockWage Rate x Family LabourInterest rateValue of capital stock * interest rateWage rate * Scale Dummyslope of labor housing -A large number of workers have been provided with houses. Ideally,the rental value of the houses should be included in the wage rate
11.36
9.98
9
9.5
10
10.5
11
11.5
SMALL LARGE
Poultry Units
Prof
it (R
s./B
roile
r)
Profit (Rs./Broiler)
Figure 5.2: Indian Broilers: Average Profitability ofSmall vs Large (without family labor cost)
Source of Data: Mehta et al. (2003).
variable. We do not have the rental value of these houses. In case thisrental value is not included in wages, the observation of wages (providedwith houses) is downward biased. To capture this downward bias (errorsin observations), we included a slope dummy for wages. The slopeDummy has value =1 if labourer is provided accommodation, or = 0,otherwise.
We expect profitability to be inversely related to price of inputs - price ofchicks, wage rate and price of feeds; and positively related to output price (ofegg or broiler) and factor inputs - family labor, value of capital stock.
Technical efficiency/inefficiency across farms are sought to be explainedin terms of differences in 'transaction costs' and 'pollution abatement costs'.The proxy variables selected for transaction costs are: age of the decisionmaker (in years); education of the decision maker (dummy variable =1 forsecondary and above); information source (represented by dummy variable);distance to output market; access to credit (dummy = 1 if credit obtained);years of experience in poultry; and Region/state characteristics (Dummy =1 for Haryana and 0 for Andhra Pradesh). Pollution abatement costs ismeasured as [costs of controlling flies + dead bird disposal cost + cost ofpollution payment + manure disposal cost + value (included imputed) ofmanure used /consumed].
From the estimated coefficients one can make inferences about thedirection and magnitude of the contribution of each determinant to therelative inefficiency of the farm in question. A significant positive coefficientmeans a positive contribution to increased inefficiency and vice versa.
ResultsThe estimated regression results of frontier function for broiler and layerare separately displayed in Tables 5.2 and 5.3, respectively.60
The estimated results (of pooled data) reported in Table 5.2 showprofitability to be negatively related to the price of feeds, and positivelyrelated to the price of broiler. The coefficient of value of capital stock isfound to be statistically significant with proper sign. Since the pooled datamay lead to "aggregation bias", the results are estimated separately for
38 39

Table 5.2: Profit Efficiency Estimated and Explained on IndianBroiler Farms
Small* Large* Pooled*N=93 N=42 N=135
Stochastic Profit FrontierPrice of chicks –0.77 (0.27) –2.35 (1.00) n.s.Wage Rate n.s. n.s. n.s.Price of feeds n.s. –1.21 (0.53) –1.58 (0.36)Price of output (Broiler) 3.59 (0.58) 5.59 (0.86) 4.64 (0.56)Family labour n.s. 2.11 (0.96) n.s.Value of capital stock n.s. -10.79 (0.73) 0.79 (0.39)Wage Rate x Family Labour n.s. n.s. n.s.Interest rate n.s. -54.29 (0.95) 2.79 (0.92)Value of capital stock x Interest rate n.s. 8.22 (0.55) -0.55 (0.29)Constant n.s. 146.30 (0.99) –6.89 (1.17)
Explainers of Inefficiencies
Constant n.s. n.s. -2.90 (1.21)Age of the decision maker n.s. n.s. n.s.Information source (dummy variable = n.s. n.s. n.s.1 for radio, TV, newspaper)Region (Dummy, North = 1) n.s. n.s. n.s.Pollution abatement costs n.s. n.s. n.s.Has access to credit, dummy n.s. n.s. n.s.Output Market Distance 0.64 (0.33) n.s. 0.81 (0.16)Experience n.s. –0.90 (0.33) n.s.Log likelihood function –100.72 –36.39 –165.74LR test (one–sided) 39.92 9.35 64.85Gamma (g) 0.94 (0.04) 0.51 (0.36) 0.15 (0.30)
*Contract farmers not includedNote: “n.s.” means statistically insignificant at 10 percent. Numbers in parentheses are standard errors.Source: Authors’ estimation using data from Mehta et al. (2003).
large and small broilers. Similarly the results of small and large farmsshow estimated co-efficient have expected signs. Prices of inputs, i.e. DOCs,interest rate and feed have negative co-efficient value and significant(exception being price of feed for small scale farms, which is insignificant). Price of output has statistically highly significant value in both small andlarge farms. However some co-efficients of regression equation arestatistically not significant, particularly in small broiler farms.
Similarly, the estimated results (of pooled observations) reportedin Table 5.3 for layers show profitability to be negatively related to theprice of feeds; and positively related to value of capital stock. Similarly,the slope of labour housing has a positive sign in small and pooleddata. The coefficient of family labor is found to be not statisticallysignificant.
Table 5.3: Profit Efficiency Estimated and Explained on IndianLayer Farms
Small Large PooledN=62 N=96 N=158
Stochastic Profit Frontier
Wage Rate 7.30 (0.68) n.s. n.s.
Price of feeds –1.69 (0.95) –1.53 (0.24) –1.46 (0.25)
Price of Egg 2.04 (0.99) 1.00 (0.45) 0.93 (0.42)
Family labour –6.07 (0.62) n.s. n.s.
Value of capital stock n.s. n.s. n.s.
Slope of labour housing n.s. 0.02 (0.01) n.s.
Wage Rate x Family Labour 1.62 n.s. n.s.
Wage Rate * SCALE DUMMY n.s. – 0.60 (0.22)
Feed Conversion Ratio n.s. n.s. n.s.
Constant –46.53 (0.99) 6.91 (3.68) 10.64 (6.25)
Explainers of Inefficiencies
Constant n.s. 3.56 (1.13) 4.64 (1.60)
Age of the decision maker n.s. –3.43 (0.62) –3.36 (0.98)
Region (Dummy, North = 1) n.s. n.s. –6.80 (2.05)
Pollution abatement costs n.s. –6.39 (1.04) 6.29 (2.58)
Education of Decision Maker n.s. –3.07 (0.69) n.s.
Has access to credit, dummy n.s. n.s. n.s.
Information source (dummy variable = n.s. 0.81 (0.42) n.s.
1 for radio, TV, newspaper)
Output market distance n.s. 0.88 (0.16) n.s.
Log likelihood function 4.24 –4.78 –8.01
LR test (one–sided) 18.92 83.46 104.31
Gamma (g) 0.99 (0.0001) 0.996 (0.002) 0.99 (0.002)
Note: “n.s.” means statistically insignificant at 10 percent. Numbers in parentheses are standard errors.Source: Authors’ estimation using data from Mehta, et al. (2003).
40 41
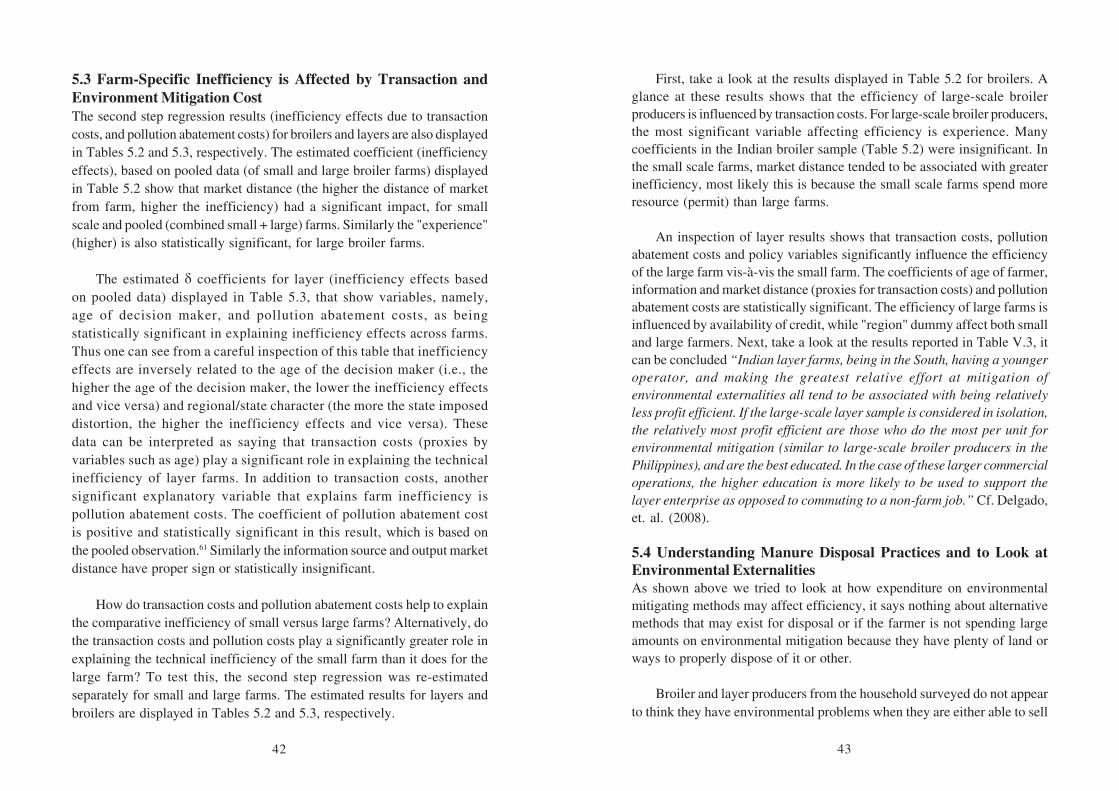
5.3 Farm-Specific Inefficiency is Affected by Transaction andEnvironment Mitigation CostThe second step regression results (inefficiency effects due to transactioncosts, and pollution abatement costs) for broilers and layers are also displayedin Tables 5.2 and 5.3, respectively. The estimated coefficient (inefficiencyeffects), based on pooled data (of small and large broiler farms) displayedin Table 5.2 show that market distance (the higher the distance of marketfrom farm, higher the inefficiency) had a significant impact, for smallscale and pooled (combined small + large) farms. Similarly the "experience"(higher) is also statistically significant, for large broiler farms.
The estimated δ coefficients for layer (inefficiency effects basedon pooled data) displayed in Table 5.3, that show variables, namely,age of decision maker, and pollution abatement costs, as beingstatistically significant in explaining inefficiency effects across farms.Thus one can see from a careful inspection of this table that inefficiencyeffects are inversely related to the age of the decision maker (i.e., thehigher the age of the decision maker, the lower the inefficiency effectsand vice versa) and regional/state character (the more the state imposeddistortion, the higher the inefficiency effects and vice versa). Thesedata can be interpreted as saying that transaction costs (proxies byvariables such as age) play a significant role in explaining the technicalinefficiency of layer farms. In addition to transaction costs, anothersignificant explanatory variable that explains farm inefficiency ispollution abatement costs. The coefficient of pollution abatement costis positive and statistically significant in this result, which is based onthe pooled observation.61 Similarly the information source and output marketdistance have proper sign or statistically insignificant.
How do transaction costs and pollution abatement costs help to explainthe comparative inefficiency of small versus large farms? Alternatively, dothe transaction costs and pollution costs play a significantly greater role inexplaining the technical inefficiency of the small farm than it does for thelarge farm? To test this, the second step regression was re-estimatedseparately for small and large farms. The estimated results for layers andbroilers are displayed in Tables 5.2 and 5.3, respectively.
First, take a look at the results displayed in Table 5.2 for broilers. Aglance at these results shows that the efficiency of large-scale broilerproducers is influenced by transaction costs. For large-scale broiler producers,the most significant variable affecting efficiency is experience. Manycoefficients in the Indian broiler sample (Table 5.2) were insignificant. Inthe small scale farms, market distance tended to be associated with greaterinefficiency, most likely this is because the small scale farms spend moreresource (permit) than large farms.
An inspection of layer results shows that transaction costs, pollutionabatement costs and policy variables significantly influence the efficiencyof the large farm vis-à-vis the small farm. The coefficients of age of farmer,information and market distance (proxies for transaction costs) and pollutionabatement costs are statistically significant. The efficiency of large farms isinfluenced by availability of credit, while "region" dummy affect both smalland large farmers. Next, take a look at the results reported in Table V.3, itcan be concluded “Indian layer farms, being in the South, having a youngeroperator, and making the greatest relative effort at mitigation ofenvironmental externalities all tend to be associated with being relativelyless profit efficient. If the large-scale layer sample is considered in isolation,the relatively most profit efficient are those who do the most per unit forenvironmental mitigation (similar to large-scale broiler producers in thePhilippines), and are the best educated. In the case of these larger commercialoperations, the higher education is more likely to be used to support thelayer enterprise as opposed to commuting to a non-farm job.” Cf. Delgado,et. al. (2008).
5.4 Understanding Manure Disposal Practices and to Look atEnvironmental ExternalitiesAs shown above we tried to look at how expenditure on environmentalmitigating methods may affect efficiency, it says nothing about alternativemethods that may exist for disposal or if the farmer is not spending largeamounts on environmental mitigation because they have plenty of land orways to properly dispose of it or other.
Broiler and layer producers from the household surveyed do not appearto think they have environmental problems when they are either able to sell
42 43
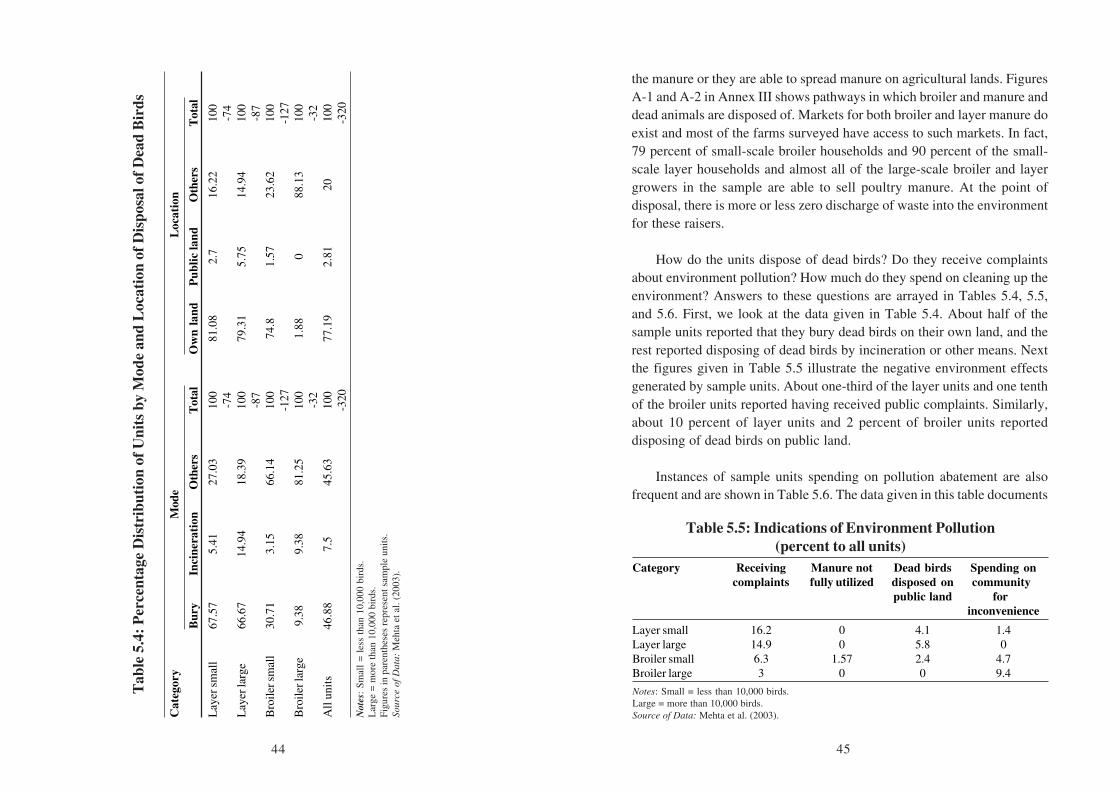
the manure or they are able to spread manure on agricultural lands. FiguresA-1 and A-2 in Annex III shows pathways in which broiler and manure anddead animals are disposed of. Markets for both broiler and layer manure doexist and most of the farms surveyed have access to such markets. In fact,79 percent of small-scale broiler households and 90 percent of the small-scale layer households and almost all of the large-scale broiler and layergrowers in the sample are able to sell poultry manure. At the point ofdisposal, there is more or less zero discharge of waste into the environmentfor these raisers.
How do the units dispose of dead birds? Do they receive complaintsabout environment pollution? How much do they spend on cleaning up theenvironment? Answers to these questions are arrayed in Tables 5.4, 5.5,and 5.6. First, we look at the data given in Table 5.4. About half of thesample units reported that they bury dead birds on their own land, and therest reported disposing of dead birds by incineration or other means. Nextthe figures given in Table 5.5 illustrate the negative environment effectsgenerated by sample units. About one-third of the layer units and one tenthof the broiler units reported having received public complaints. Similarly,about 10 percent of layer units and 2 percent of broiler units reporteddisposing of dead birds on public land.
Instances of sample units spending on pollution abatement are alsofrequent and are shown in Table 5.6. The data given in this table documents
Tab
le 5
.4: P
erce
ntag
e D
istr
ibut
ion
of U
nits
by
Mod
e an
d L
ocat
ion
of D
ispo
sal o
f Dea
d B
irds
Cat
egor
yM
ode
Loc
atio
n
Bur
yIn
cine
rati
onO
ther
sT
otal
Ow
n la
ndP
ublic
land
Oth
ers
Tot
al
Lay
er s
mal
l67
.57
5.41
27.0
310
081
.08
2.7
16.2
210
0-7
4-7
4L
ayer
larg
e66
.67
14.9
418
.39
100
79.3
15.
7514
.94
100
-87
-87
Bro
iler s
mal
l30
.71
3.15
66.1
410
074
.81.
5723
.62
100
-127
-127
Bro
iler l
arge
9.38
9.38
81.2
510
01.
880
88.1
310
0-3
2-3
2A
ll u
nits
46.8
87.
545
.63
100
77.1
92.
8120
100
-320
-320
Not
es:
Smal
l =
les
s th
an 1
0,00
0 bi
rds.
Lar
ge =
mor
e th
an 1
0,00
0 bi
rds.
Figu
res
in p
aren
thes
es r
epre
sent
sam
ple
unit
s.So
urce
of D
ata:
Meh
ta e
t al.
(200
3).
Table 5.5: Indications of Environment Pollution(percent to all units)
Category Receiving Manure not Dead birds Spending oncomplaints fully utilized disposed on community
public land forinconvenience
Layer small 16.2 0 4.1 1.4Layer large 14.9 0 5.8 0Broiler small 6.3 1.57 2.4 4.7Broiler large 3 0 0 9.4
Notes: Small = less than 10,000 birds.Large = more than 10,000 birds.Source of Data: Mehta et al. (2003).
44 45
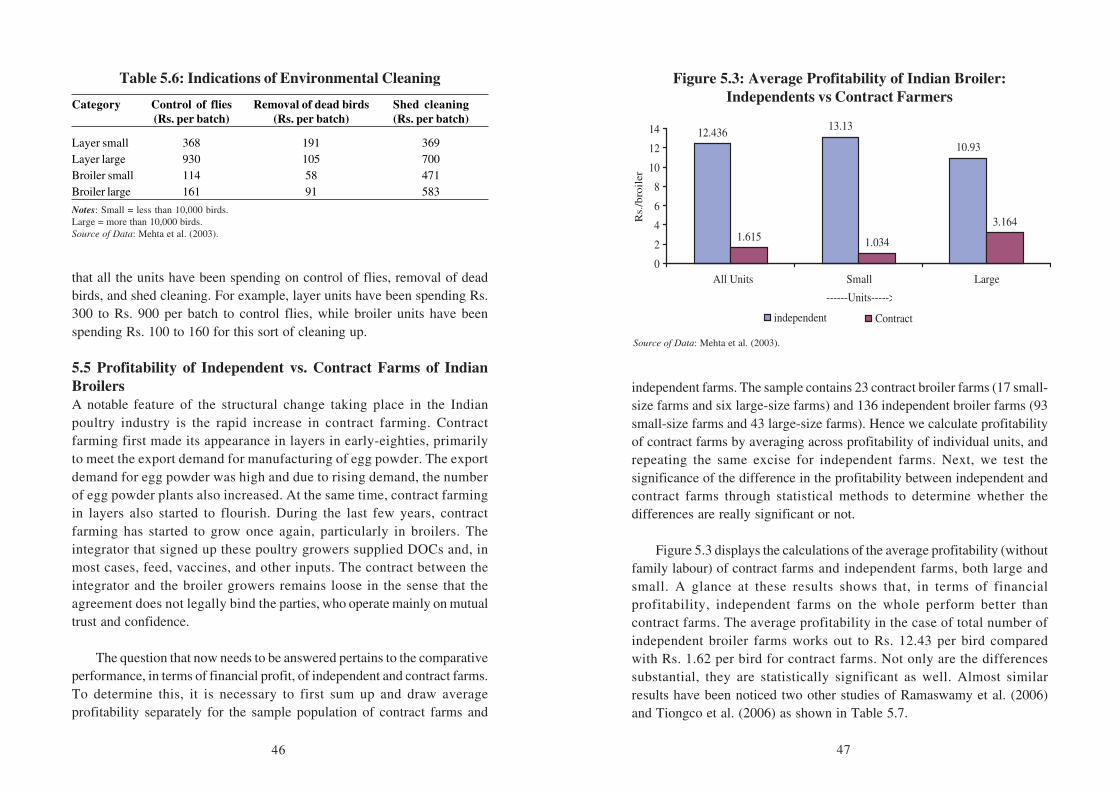
46 47
that all the units have been spending on control of flies, removal of deadbirds, and shed cleaning. For example, layer units have been spending Rs.300 to Rs. 900 per batch to control flies, while broiler units have beenspending Rs. 100 to 160 for this sort of cleaning up.
5.5 Profitability of Independent vs. Contract Farms of IndianBroilersA notable feature of the structural change taking place in the Indianpoultry industry is the rapid increase in contract farming. Contractfarming first made its appearance in layers in early-eighties, primarilyto meet the export demand for manufacturing of egg powder. The exportdemand for egg powder was high and due to rising demand, the numberof egg powder plants also increased. At the same time, contract farmingin layers also started to flourish. During the last few years, contractfarming has started to grow once again, particularly in broilers. Theintegrator that signed up these poultry growers supplied DOCs and, inmost cases, feed, vaccines, and other inputs. The contract between theintegrator and the broiler growers remains loose in the sense that theagreement does not legally bind the parties, who operate mainly on mutualtrust and confidence.
The question that now needs to be answered pertains to the comparativeperformance, in terms of financial profit, of independent and contract farms.To determine this, it is necessary to first sum up and draw averageprofitability separately for the sample population of contract farms and
independent farms. The sample contains 23 contract broiler farms (17 small-size farms and six large-size farms) and 136 independent broiler farms (93small-size farms and 43 large-size farms). Hence we calculate profitabilityof contract farms by averaging across profitability of individual units, andrepeating the same excise for independent farms. Next, we test thesignificance of the difference in the profitability between independent andcontract farms through statistical methods to determine whether thedifferences are really significant or not.
Figure 5.3 displays the calculations of the average profitability (withoutfamily labour) of contract farms and independent farms, both large andsmall. A glance at these results shows that, in terms of financialprofitability, independent farms on the whole perform better thancontract farms. The average profitability in the case of total number ofindependent broiler farms works out to Rs. 12.43 per bird comparedwith Rs. 1.62 per bird for contract farms. Not only are the differencessubstantial, they are statistically significant as well. Almost similarresults have been noticed two other studies of Ramaswamy et al. (2006)and Tiongco et al. (2006) as shown in Table 5.7.
Table 5.6: Indications of Environmental Cleaning
Category Control of flies Removal of dead birds Shed cleaning(Rs. per batch) (Rs. per batch) (Rs. per batch)
Layer small 368 191 369Layer large 930 105 700Broiler small 114 58 471Broiler large 161 91 583
Notes: Small = less than 10,000 birds.Large = more than 10,000 birds.Source of Data: Mehta et al. (2003).
12.43613.13
10.93
1.615 1.034
3.164
0
2
4
6
8
10
12
14
All Units Small Large
------Units----->
Rs.
/bro
iler
independent Contract
Figure 5.3: Average Profitability of Indian Broiler:Independents vs Contract Farmers
Source of Data: Mehta et al. (2003).
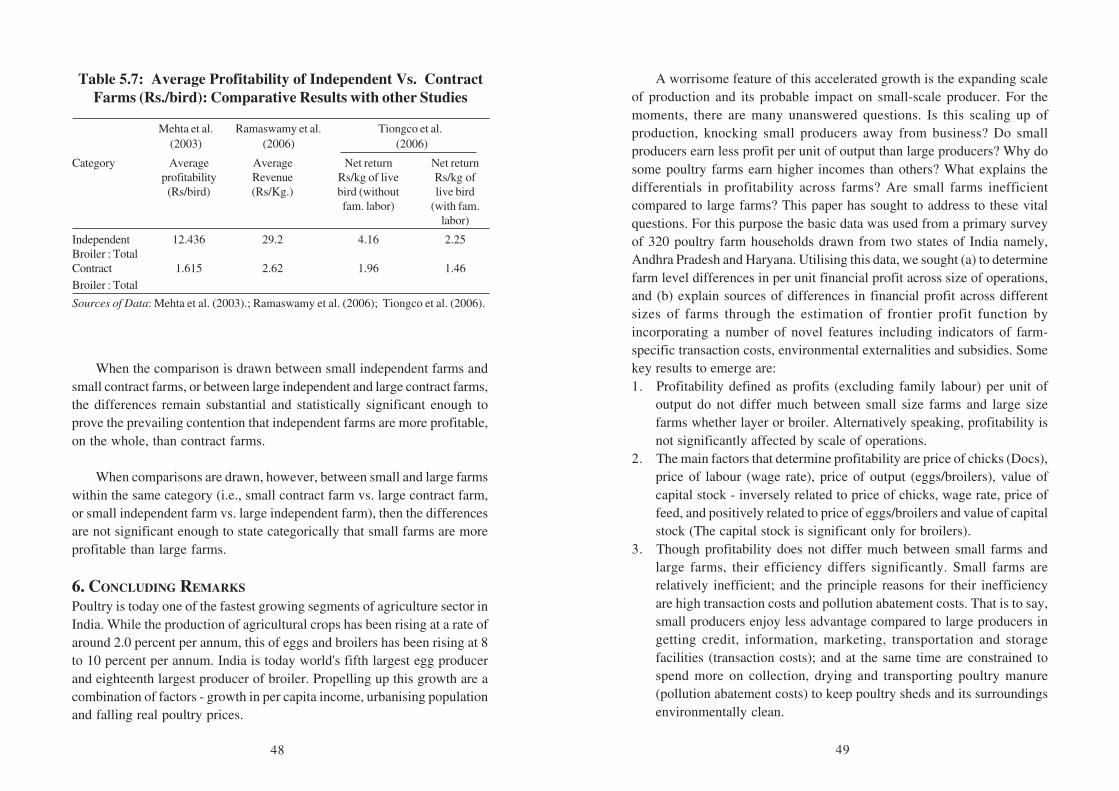
48 49
When the comparison is drawn between small independent farms andsmall contract farms, or between large independent and large contract farms,the differences remain substantial and statistically significant enough toprove the prevailing contention that independent farms are more profitable,on the whole, than contract farms.
When comparisons are drawn, however, between small and large farmswithin the same category (i.e., small contract farm vs. large contract farm,or small independent farm vs. large independent farm), then the differencesare not significant enough to state categorically that small farms are moreprofitable than large farms.
6. CONCLUDING REMARKS
Poultry is today one of the fastest growing segments of agriculture sector inIndia. While the production of agricultural crops has been rising at a rate ofaround 2.0 percent per annum, this of eggs and broilers has been rising at 8to 10 percent per annum. India is today world's fifth largest egg producerand eighteenth largest producer of broiler. Propelling up this growth are acombination of factors - growth in per capita income, urbanising populationand falling real poultry prices.
A worrisome feature of this accelerated growth is the expanding scaleof production and its probable impact on small-scale producer. For themoments, there are many unanswered questions. Is this scaling up ofproduction, knocking small producers away from business? Do smallproducers earn less profit per unit of output than large producers? Why dosome poultry farms earn higher incomes than others? What explains thedifferentials in profitability across farms? Are small farms inefficientcompared to large farms? This paper has sought to address to these vitalquestions. For this purpose the basic data was used from a primary surveyof 320 poultry farm households drawn from two states of India namely,Andhra Pradesh and Haryana. Utilising this data, we sought (a) to determinefarm level differences in per unit financial profit across size of operations,and (b) explain sources of differences in financial profit across differentsizes of farms through the estimation of frontier profit function byincorporating a number of novel features including indicators of farm-specific transaction costs, environmental externalities and subsidies. Somekey results to emerge are:1. Profitability defined as profits (excluding family labour) per unit of
output do not differ much between small size farms and large sizefarms whether layer or broiler. Alternatively speaking, profitability isnot significantly affected by scale of operations.
2. The main factors that determine profitability are price of chicks (Docs),price of labour (wage rate), price of output (eggs/broilers), value ofcapital stock - inversely related to price of chicks, wage rate, price offeed, and positively related to price of eggs/broilers and value of capitalstock (The capital stock is significant only for broilers).
3. Though profitability does not differ much between small farms andlarge farms, their efficiency differs significantly. Small farms arerelatively inefficient; and the principle reasons for their inefficiencyare high transaction costs and pollution abatement costs. That is to say,small producers enjoy less advantage compared to large producers ingetting credit, information, marketing, transportation and storagefacilities (transaction costs); and at the same time are constrained tospend more on collection, drying and transporting poultry manure(pollution abatement costs) to keep poultry sheds and its surroundingsenvironmentally clean.
Table 5.7: Average Profitability of Independent Vs. ContractFarms (Rs./bird): Comparative Results with other Studies
Mehta et al. Ramaswamy et al. Tiongco et al.(2003) (2006) (2006)
Category Average Average Net return Net returnprofitability Revenue Rs/kg of live Rs/kg of(Rs/bird) (Rs/Kg.) bird (without live bird
fam. labor) (with fam.labor)
Independent 12.436 29.2 4.16 2.25Broiler : TotalContract 1.615 2.62 1.96 1.46
Broiler : Total
Sources of Data: Mehta et al. (2003).; Ramaswamy et al. (2006); Tiongco et al. (2006).
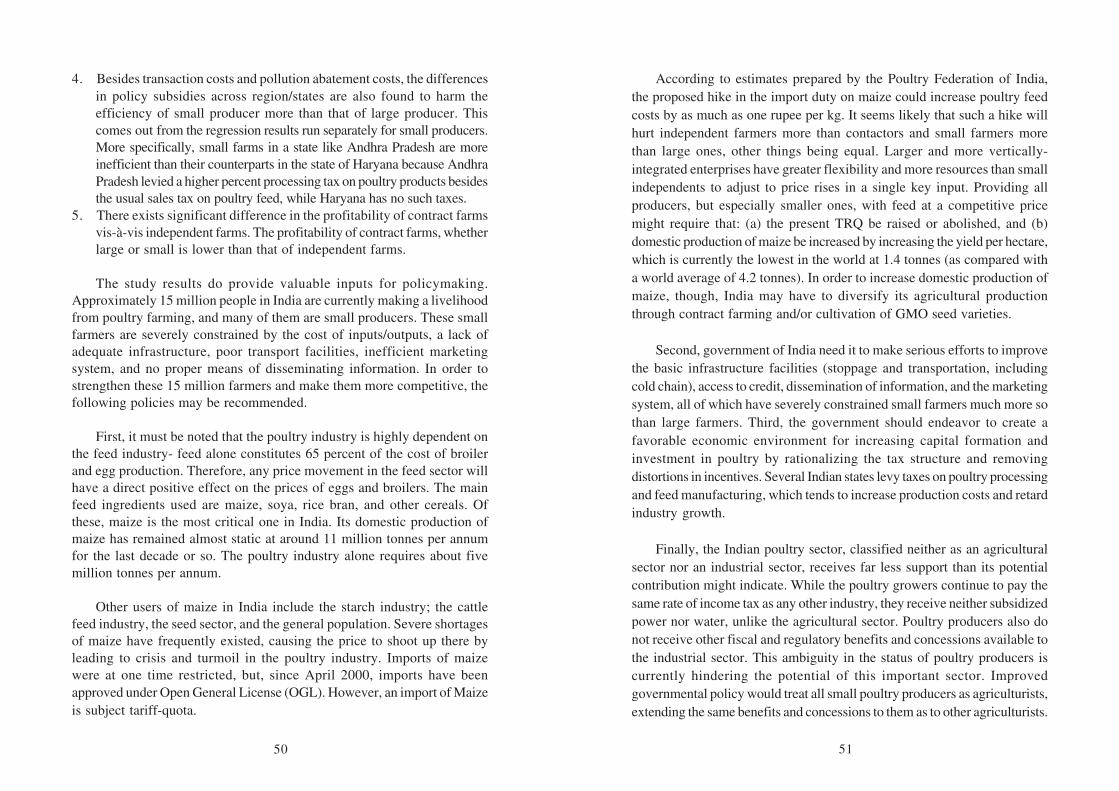
50 51
4. Besides transaction costs and pollution abatement costs, the differencesin policy subsidies across region/states are also found to harm theefficiency of small producer more than that of large producer. Thiscomes out from the regression results run separately for small producers.More specifically, small farms in a state like Andhra Pradesh are moreinefficient than their counterparts in the state of Haryana because AndhraPradesh levied a higher percent processing tax on poultry products besidesthe usual sales tax on poultry feed, while Haryana has no such taxes.
5. There exists significant difference in the profitability of contract farmsvis-à-vis independent farms. The profitability of contract farms, whetherlarge or small is lower than that of independent farms.
The study results do provide valuable inputs for policymaking.Approximately 15 million people in India are currently making a livelihoodfrom poultry farming, and many of them are small producers. These smallfarmers are severely constrained by the cost of inputs/outputs, a lack ofadequate infrastructure, poor transport facilities, inefficient marketingsystem, and no proper means of disseminating information. In order tostrengthen these 15 million farmers and make them more competitive, thefollowing policies may be recommended.
First, it must be noted that the poultry industry is highly dependent onthe feed industry- feed alone constitutes 65 percent of the cost of broilerand egg production. Therefore, any price movement in the feed sector willhave a direct positive effect on the prices of eggs and broilers. The mainfeed ingredients used are maize, soya, rice bran, and other cereals. Ofthese, maize is the most critical one in India. Its domestic production ofmaize has remained almost static at around 11 million tonnes per annumfor the last decade or so. The poultry industry alone requires about fivemillion tonnes per annum.
Other users of maize in India include the starch industry; the cattlefeed industry, the seed sector, and the general population. Severe shortagesof maize have frequently existed, causing the price to shoot up there byleading to crisis and turmoil in the poultry industry. Imports of maizewere at one time restricted, but, since April 2000, imports have beenapproved under Open General License (OGL). However, an import of Maizeis subject tariff-quota.
According to estimates prepared by the Poultry Federation of India,the proposed hike in the import duty on maize could increase poultry feedcosts by as much as one rupee per kg. It seems likely that such a hike willhurt independent farmers more than contactors and small farmers morethan large ones, other things being equal. Larger and more vertically-integrated enterprises have greater flexibility and more resources than smallindependents to adjust to price rises in a single key input. Providing allproducers, but especially smaller ones, with feed at a competitive pricemight require that: (a) the present TRQ be raised or abolished, and (b)domestic production of maize be increased by increasing the yield per hectare,which is currently the lowest in the world at 1.4 tonnes (as compared witha world average of 4.2 tonnes). In order to increase domestic production ofmaize, though, India may have to diversify its agricultural productionthrough contract farming and/or cultivation of GMO seed varieties.
Second, government of India need it to make serious efforts to improvethe basic infrastructure facilities (stoppage and transportation, includingcold chain), access to credit, dissemination of information, and the marketingsystem, all of which have severely constrained small farmers much more sothan large farmers. Third, the government should endeavor to create afavorable economic environment for increasing capital formation andinvestment in poultry by rationalizing the tax structure and removingdistortions in incentives. Several Indian states levy taxes on poultry processingand feed manufacturing, which tends to increase production costs and retardindustry growth.
Finally, the Indian poultry sector, classified neither as an agriculturalsector nor an industrial sector, receives far less support than its potentialcontribution might indicate. While the poultry growers continue to pay thesame rate of income tax as any other industry, they receive neither subsidizedpower nor water, unlike the agricultural sector. Poultry producers also donot receive other fiscal and regulatory benefits and concessions available tothe industrial sector. This ambiguity in the status of poultry producers iscurrently hindering the potential of this important sector. Improvedgovernmental policy would treat all small poultry producers as agriculturists,extending the same benefits and concessions to them as to other agriculturists.
52 53
Annex I: India: Action Plan to Control Avian Influenza62
The strategy of the government of India has been to contain the disease atsources, i.e. at the level of animal itself. This is the principle way to reduceopportunities for spread of the disease and for possible human infection.Therefore disease intelligence active animal surveillance, strengthening theearly warning system in the pre-outbreak stage and total culling in prescribedradius resulting in rapid containment in the outbreak phase are critical assetsto reduce such opportunities for spread of infection.
I. Pre-outbreak preparedness:I.1: Surveillance: Need to be in a state of alertness and preparedness:
Surveillance is the most important part of the strategy to control andcontain Avian Influenza. India has a poultry population of 481 millionboth commercial and backyard. About 60% of the population is in thecommercial sector. It is indicated that the migratory birds play a role inthe spread of the virus across countries and continents. India lies withinthree major internal fly ways of migratory birds. Surveillance willtherefore have to include both poultry and migratory birds.I.1.1: Poultry owner, especially commercial poultry owners including
consultants, franchisees, service providers and those related torearing of poultry are individually and collectively responsibleto immediately report unusual mortality and sickness in birds tothe govt.
I.1.2: The state govts are advised to develop routine surveillance plans.Representative random sampling may be done.
I.1.3: A system of active and large targeted surveillance has beeninitiated. It includes immediate response to unusual sickness/mortality among the birds.
I.2: Sample collection, packing and Transportation: The states must ensureproper collection, packing and transportation of samples, and giveparticular attention to the quality and quantity of samples forwardedto the labs.
I.3: District collector has to play a central and coordinating role especiallyconcerning aspects of quarantine closure of shops, corporation, moneycontrol, ban on sale of poultry related products, administeringvaccination plan etc. Therefore the district collector should bethoroughly formalized with the action plan.
II: Steps to be taken in case of suspicion of outbreak of AI:II.1: In case of suspicion of outbreak of AI such as receipt of any
preliminary report regarding unusual sickness or above averagemortality of poultry as well as wild and migratory birds at a placefor any other source, the investigation officer shall visit the placeimmediately and ascertain the facts of the case.
II.2: The investigation officer should carry out a clinical investigationwith the aim to establish the clinical situation on the farm, includingill and suspect birds. The clinical investigation must be performedon all susceptible species present on the farm, and it must begin forthe most peripheral units. All this information must be reported inthe epidemiological inquiry report.
II.3: If the preliminary and clinical investigations indicate that it is anunusual situation indicating surveillance of AI, then the investigatingofficer has to ensure that steps as indicated in the subsequent parasare taken immediately.
II.4: Collection of samples and dispatch for laboratory tests: Samples shouldbe sent to lab immediately.
II.5: Immediate report to Director, Animal Husbandry.II.6: Identification of alert zones.
III: Action plan in case of outbreak of NAI is confirmed:III.1: Notification and information of outbreak: In case lab test confirmed
the occurrence of Notifiable Avian Influenza; HSAD Bhopal willinform the Govt. of India. The Govt. will dispatch Central RapidResponse teams of Dept of Animal Husbandry.
III.2: The International Agencies are to be notified by the Dept of AnimalHusbandry.
III.3: In view of the threat of human infection for particular strain of NAI,public health aviation is to be immediately notified.
III 4: Demarcation of surveillance and infected areas and actions to betaken in these areas.
III.5: Immediate tasks to be carried out by the veterinary officer onconfirmation of(i) Quickly report the state and condition of the farm to determine
the nature and scope of operations to be conducted.
54 55
(ii) Identify locations on the farm where vehicles leaving the farmcan be properly washed and disinfected.
(iii) Active disinfection procedures at the point of entry/exit fromthe infected premises.
(iv) Ensure that vehicles are washed and disinfected internally andexternally.
(v) Absolute ban on movement of poultry.(vi) Closure of poultry and egg.(vii) Ban on movement of farm personnel.(viii) Destruction of birds in the infected zone of 3km radius.
III.6: Compensation to be paid for forced culling. The Government of Indiawill share cost of compensation paid for culling of birds duringoperations and destruction of infected feed/feed materials up to 50%of total cost.
IV: Bio Security Measures, Advice to persons handling NAI infectedpoultry etc.IV.1 Exchange of information with industry/farmers: Following notification
of the disease, the Government should take the poultry industry andsmall poultry farm owners into confidence and inform themperiodically about the measures that are being taken to control NAI.Popular poultry and livestock journals and mass media should beencouraged to disseminate information about the Government'sinitiative on NAI. The support of the industry should be sought forimplementing the Government's decisions.
IV.2 Public Awareness/Media Briefing: The poultry farmers associations,cooperatives, NECC, APEDA, etc. should be actively involved inthis process. The minimum expenditure required for awarenesscampaigns can be met from the GOI Fund.
IV.3 Bio-Security Measures: The best way to control NAI is to preventexposure by imposing strict bio security measures. This can be achievedby advising the poultry owners to adopt following measures in allfarms, even though they are not currently infected.i) Keep distanceii) Keep cleanliness
iii) Don't let the disease enter the farmiv) Don't borrow the diseasev) Know the signsvi) Report sick birdsvii) Follow uniform age group policyviii) Guidelines for farm personnel
IV.4: Advice about contact with poultry in an area with NAIIV.5: Raising poultry at home in an area affected with NAIIV.6: Advice on how to decontaminate the yard/chicken penIV.7: Estimation of stores requirements
Annex II: Conditions - Approval of Poultry Slaughter Houses
1. In addition to the general requirements, slaughterhouses shallhave at least:1.1 A room or covered space which is sufficiently large and easy to clean
and disinfect1.2 A slaughter room large enough for stunning and bleeding on the one
hand, and plucking and any scalding on the other, to be carried out inseparate places. Any communication between the slaughter room andthe room or space referred to in point 1.1 above other than the narrowopening through which only slaughter poultry may pass shall have anautomatically closing door.
1.3 An evisceration and preparation room which is large enough forevisceration to be carried out in a place sufficiently far from the otherwork stations, or separated from them by a partition, so as to preventcontamination. Any communication between the evisceration andpreparation room and the slaughter room other than the narrow openingthrough which only slaughter poultry may pass must have anautomatically closing door; if necessary, a dispatching room;
1.4 Oone or more sufficiently large chilling of refrigerating rooms, with alockable facility, for poultry meat, which has been detained.
1.5 A room or space for collecting feathers unless these are treated as waste;1.6 Separate wash basins and lavatories for staff handling live birds.
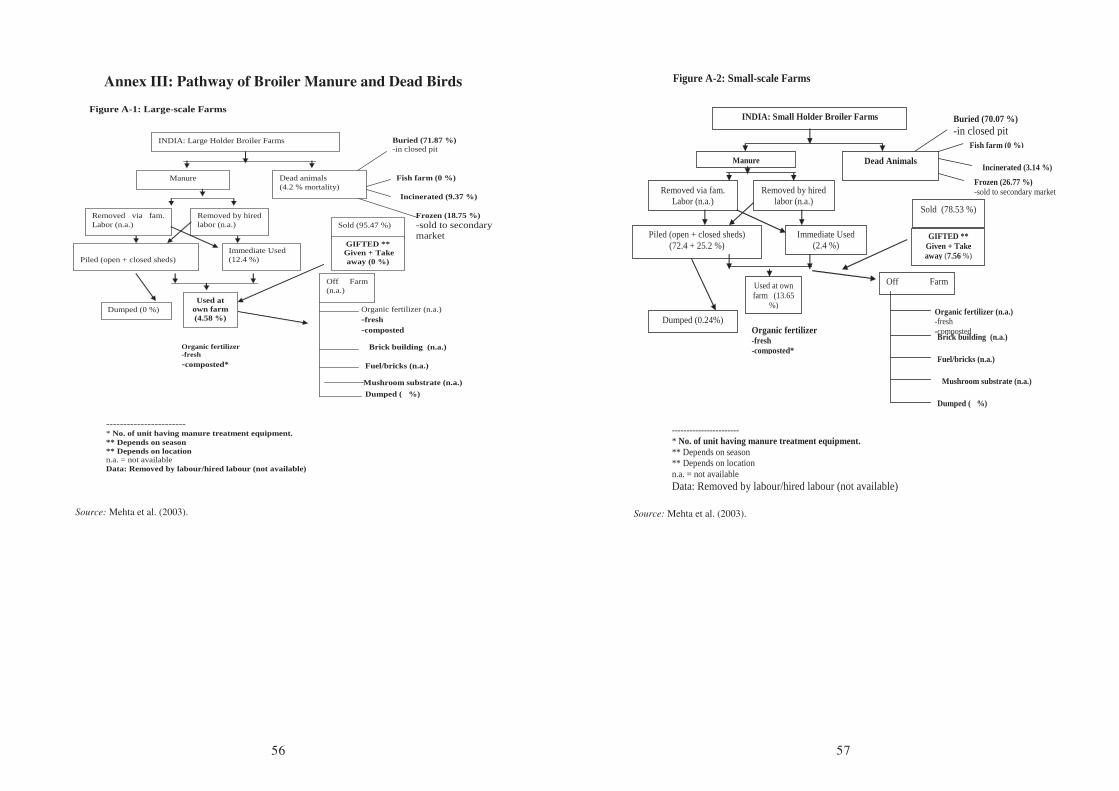
56 57
Figure A-1: Large-scale Farms
INDIA: Large Holder Broiler Farms
Manure Dead animals (4.2 % mortality)
Removed via fam. Labor (n.a.)
Removed by hired labor (n.a.)
Piled (open + closed sheds) Immediate Used (12.4 %)
Sold (95.47 %)
GIFTED ** Given + Take
away (0 %)
Used at own farm (4.58 %)
Off � Farm (n.a.)
Dumped (0 %)
Buried (71.87 %) -in closed pit
Organic fertilizer (n.a.) -fresh -composted
Brick building (n.a.)
Fuel/bricks (n.a.)
Mushroom substrate (n.a.) Dumped ( %)
Fish farm (0 %)
Incinerated (9.37 %)
Frozen (18.75 %) -sold to secondary market
Organic fertilizer -fresh -composted*
----------------------- * No. of unit having manure treatment equipment. ** Depends on season ** Depends on location n.a. = not available Data: Removed by labour/hired labour (not available)
Annex III: Pathway of Broiler Manure and Dead Birds
Source: Mehta et al. (2003).
Figure A-2: Small-scale Farms
Mushroom substrate (n.a.)
Incinerated (3.14 %)
Frozen (26.77 %) -sold to secondary market
INDIA: Small Holder Broiler Farms
Manure Dead Animals
Removed via fam. Labor (n.a.)
Removed by hired labor (n.a.)
Piled (open + closed sheds) (72.4 + 25.2 %)
Immediate Used (2.4 %)
Sold (78.53 %)
GIFTED ** Given + Take away (7.56 %)
Used at own farm (13.65
%)
Off � Farm
Dumped (0.24%)
Buried (70.07 %) -in closed pit
Organic fertilizer (n.a.) -fresh -composted Brick building (n.a.)
Fuel/bricks (n.a.)
Dumped ( %)
Fish farm (0 %)
Organic fertilizer -fresh -composted*
----------------------- * No. of unit having manure treatment equipment. ** Depends on season ** Depends on location n.a. = not available Data: Removed by labour/hired labour (not available)
Source: Mehta et al. (2003).
58 59
ENDNOTES1 Government of India, Ministry of Agriculture, Department of Animal Husbandry,
Dairying and Fisheries, Livestock Census 1972 (dahd.nic.in). Even now backyardpoultry is important, although the share of the egg production from Desi (local)Fowls was 9083 million as compared to 34564 million of improved (commercial orcross breed) fowls, during 2005-06.
2 FCR is amount of feed consumed per unit of the output (say kilogram of poultry meat)produced. It means that the Indian breeds (desi) consumed more feed than the improvedbreeds. As per GoI Statistics, the average yield for of an improved fowl was 258.29(inspite of avian flu) egg as compared to that of 111.65 of Desi fowl, during 2005-06.
3 In this context it should be noted that pure line birds can be freely imported in Indiawithout any restriction, since 1985.
4 Hen-house production is calculated by dividing the total number of eggs produced bytotal days in lay.
5 During 1987-1992, the total production of eggs increased by 5.2 per cent per annum.60 per cent of this growth is contributed by productivity increased (FCR) and 40 percent is contributed by increase in number of birds. For details see Mehta et al. (2002).
6 Based on discussion with experts during author’s survey. As per Landes et al. (2004),FCR in India is around 1.85 (in South India) to 1.90 (in East India). According toRajan (2007), the FCR is 1.8 in integrator farming.
7 Feed conversion ratio in the US was around 2.2, see Crucikshank (2002), and Lohmannvisited on 12/27/2006.
8 Most of tallow is banned in India, due to religious reasons.9 Rajan (2007).1 0 According to Rajan (2007), the integrator’s farming can be grouped in three categories
(i) large units of 100,000 and above, (ii) medium units of 20,000 to 100,000, and (iii)small unit with less than 20,000 capacity
1 1 See also Reddy (2001).1 2 In other countries, poultry consists of birds such as turkeys, ostrich, chickens, ducks,
pigeons, geese, etc. But in India, poultry is largely related to chicken and to someextent ducks.
1 3 The values can be downward biased for poultry meat, because the Government officialstatistics is downward biased. See Landes et al. (2004), among other.
1 4 G.O.I., (2002), (2002), “Report of the Working Group on Animal Husbandry andDairying for The Tenth Five Year Plan (2002-2007)”, Planning Commission,Government of India,
1 5 See Section, I.4 for details.1 6 See Section, I.4 for details.1 7 There is no reliable data on this aspect, as contract farming is not legal in Indian states.
As per personal communication with industry, the current state of the position of forcontract farming (commercial poultry) is: South region – 90%, West – 70%, East –50% and North – 10%. See also, Suguna Group, (2006).
1 8 See Rajan (2007).1 9 Based on statistics given in Govt. of India, Department of Animal Husbandry, and
FAO
2 0 As per recommendation of “The National Committee on Human Nutrition in India”.2 1 As per statistics, quoted in Govt. of India, Department of Animal Husbandry.2 2 The four states in the southern region exhibit high preference for eggs and poultry
meat. The percentage of households consuming eggs ranges between 25 per cent inKarnataka and 52 per cent in Andhra Pradesh (as compared to 34 for all India).Andhra Pradesh leads in consumer preference for eggs as well as poultry meat.Andhra Pradesh, Assam, and West Bengal occupy top position in high preference forpoultry products. Another four states viz., Kerala, Tamil Nadu, Karnataka andMaharastra are also important in generating demand for poultry products. For details,see Mehta et al. (2002).
2 3 Compound growth rate, based on FAO statistics2 4 Compound growth rate.2 5 For details, see Mehta et al. (2002).2 6 The estimates of price and income elasticties have been taken from Mehta et al.
(2002).2 7 The groups are ‘very poor’, ‘poor’, ‘not poor’ and ‘rich’2 8 See, Mehta et al. (2005).2 9 India can not give export subsidies as per WTO commitments. However, incentives
for export promotion, international freight and internal transport can be provided.3 0 Custom duties have changed during different financial years.3 1 G.o.I. (2006), Basic Animal Husbandry Statistics 2006, Department of Animal
Husbandry, Dairying and Fisheries, New Delhi.3 2 Personal interaction with industry.3 3 See G.o.I (2005), Draft National Poultry Policy, Department of Animal Husbandry3 4 See Deasi (2004).3 5 See Poultry Times of India, (2007)3 6 In developed countries, the demand for Pork and Beef is higher than that of poultry.
See Poultry Times of India , (2007), among others3 7 See Mehta and George (2005)3 8 The residue monitoring plan gives details of various residues along with the surveillance
system to monitor the residues, name of approved labs, procedures for obtaining testservices, name of the Natural Resource Labs, responsibility of the nominated lab,evaluation of the report by the National Referee Lab, description of pesticide residuelimits, etc.
3 9 Mehta, Nambiar and Arockiasamy (2005)4 0 In this context, it should be remembered that 95% of broiler meat market is still wet.4 1 Only 25% of India’s feed used is supplied in the form of compound feed, the rest 75%
is still been prepared in small scale or by farmers themselves.4 2 Although 2004 outbreak had significant impact on India’s Poultry sector. See, Mehta
(2006), among others.4 3 See Rajan (2007) for details.4 4 Arambagh, in W. Bengal, is one such unit.4 5 Mehta (2005).4 6 In the EU, the food safety standards are different in its member-countries.4 7 In this context it should be remembered that WTO SPS agreement says that “reasonable
60 61
time” should be given for implementation of new standards. However, the definitionof reasonable time is not clear. Although WTO track – II is trying to solve thisproblem, but has miserable failed. See Mehta et al. (2005), for details.
4 8 See Mehta et al. (2005), for details.4 9 See, G.o.I, Ministry of Agriculture, Department of Economic and Statistics, website5 0 Ninety Five per cent Indian’s domestic market for poultry meat is wet.5 1 See Delgado et al. (2008), among others.5 2 See Battese (1992), for a survey of this literature.5 3 Weighted averages, where weights are farm-specific transaction quantities.5 4 Note that the frontiers are run separately by commodity (layer and broiler). In most
cases sample farms did not engage in producing for sale more than one of our chosencommodities. Where they did, possible economies of scope from joint productionwere not taken into account for practical reasons, although the model used couldincorporate multiple outputs in a straightforward if somewhat laborious way (see,Coelli, Rao and Battese 1998, among others).
5 5 For models relating to varying scale elasticities, see Panchamukhi, V.R., et al. (1995).5 6 See APEDA, “A Study on Poultry Sector in Andhra Pradesh” sponsored by
Agricultural and Processed Food Products Export Development Authority, Ministryof Commerce, Govt. of India.
5 7 See Mehta et al. (2003) for more details5 8 Estimated t-statistics is 2.01.5 9 Estimated t-statistics is 0.62.6 0 Contract farmers were not included in this analysis because (a) there are very few
observations and (b) profitability of contract farmers does not depend on prices ofinputs etc.
6 1 However, the separate regression results of small and large farms show that the co-efficient is negative and highly significant for large firms, and not for small farms.Hence pooled results are not reliable, unless we capture impact of characteristics ofsmall and large firms in regression estimates through ‘fixed effect’ or ‘random effect’models. For such models, see Mehta and Parul (2004).
6 2 Source: GoI, Ministry of Agriculture, Department of Animal Husbandry, November2006. The whole action plan consists of 110 pages with details on every aspect. In thisAnnex, we are presenting only few points.
REFERENCESAli, M. and J.C. Flinn. (1989), "Profit Efficiency Among Basmati Rice Produces in
Pakistan Punjab." Amer. J. Agr. Econ., May(1989):303-310.APEDA (2006), Residue Monitoring Plan for 2006, for Drugs and Pesticides for Exported
Egg Products to the European Union, March.Battese, G. E. (1992), "Frontier Production Functions and Technical Efficiency: A Survey
of Empirical Applications in Agricultural Economics." Agric. Econ, 7:185-208.Battese, G. E. and T. J. Coelli. (1995), "A Model for Technical Inefficiency Effects in a
Stochastic Frontier Production Function for Panel Data." Empirical Economics, 20:325-332.
Coelli, T., D.S. Prasada Rao, and G.E. Battese. (1998), An Introduction to Efficiency andProductivity Analysis. Kluwer Academic Publishers, 275 pages.
CMIE (2004), India's TradeCrucikshank ( 2002). "Food Conversion Ratios (FCR) and average live weights for animals
and poultry", (http://answers.google.com/answers/threadview?id=25449).Delgado, C., et al. (2008), Determinants and Implications of the Growing Scale of Livestock
Farms in Four Fast-Growing Developing Countries, Research Report No. 157, IFPRI,Washington, D.C.
Desai, A. (2004) "An Overview of the Indian Poultry and Future Scenario", All IndiaPoultry Year Book, Special Millennium Issue.
FAO (2006), FAO STAT websiteFAO and OECD (2006), "Impact of Animal Disease Outbreaks on Livestock Markets",
Committee on Commodity Problems, Inter-government Group on Meat and DiaryProducts, 21st Seminar, Rome, 13-16 November.
Fried, H. O., C.A. Knox Lovell, and S. S. Schmidt, editors, (1993), The Measurement ofProductive Efficiency: Techniques and Applications, Oxford University Press. NewYork, 425 pages.
Government of India (2002), Report of the Working Group on Animal Husbandry andDairying for The Tenth Five Year Plan (2002-2007), Planning Commission,Government of India,
Government of India (2006), Basic Animal Husbandry Statistics, Ministry of Agriculture,Department of Animal Husbandry, Dairying and Fisheries, Krishi Bhawan, NewDelhi.
Government of India (2007-08), Custom Tariff.Government of India, Custom Tariff of India, various issues.Government of India, Economic Survey, various issues.Government of India, National Income Accounts Statistics, various issues, Central Statistical
Organisation.Kearney, A.T. and the Confederation of Indian Industry (CII): "Retail in India: Getting
organized to Drive growth", http://www.ibef.org/industry/retail.aspx.Khare, S.P. (2003-04), "Estimation of Production and Marketing Parameters of Indian
Poultry Industry", Poultry Year Book.Landes, M., S. Persuad, and J. Dyek (2004), "India's Poultry Sector; Development and
Prospects", Market and Trade Economics Division, Economic Research Unit, USDept. of Agriculture, Agriculture and Trade Report, WRS 04-03, January.
Lohmann (http://www.nicholas-turkey.com/docs/Lohmann%20Me), visited on 12/27/2006Mehta, R. (2005), "Non-Tariff Barriers Affecting India's Exports", RIS DP #97.Mehta, R. (2006), "Indian Poultry Industry in Global Context", World Agro Trade Scanner,
Vol. 1, No. 1, pp. 7-11.Mehta,R. et al. (2002), "Livestock Industrialization, Trade and Social-Health-Environment
Issues for the Indian Poultry Sector", Livestock Industrialization Project; Phase I,IFPRI, June.
Mehta, R. et al. (2003), "Policy, Technical, and Environmental Determinants and Implicationsof the Scaling up of Broiler and Egg Production in India" Livestock IndustrializationProject, Phase II IFPRI- FAO Project.
(62)
RIS DISCUSSION PAPERS
Available at http://www.ris.org.in/risdiscussion_papers.html
DP#145-2008 South-South and Triangular Cooperation in Asia-Pacific:Towards a New Paradigm in Development Cooperation byNagesh Kumar
DP#144-2008 Exchange Rate Pass-through in India’s Exports to Developedand Emerging Markets by Sushanta Mallick and HelenaMarques
DP#143-2008 Changing Economic Power in the World Economy byManmohan Agarwal
DP#142-2008 Transportation Cost and Trade Competitiveness: EmpiricalEvidence from India by Prabir De and Bhisma Rout
DP#141-2008 Re-Discovering the Role of Developing Countries in theGATT before the Doha Round by Faizel Ismail
DP#140-2008 Internationalization of Indian Enterprises: Patterns,Strategies, Ownership Advantages and Implicationsby Nagesh Kumar
DP#139-2008 Emerging Patterns in Architecture for Management ofEconomic Assistance and Development Cooperation:Implications and Challenges for India by Sachin Chaturvedi
DP#138-2008 Emerging Countries and the World Economy: Implications ofIndia’s Recent Expansion on Developing Countries by S.K.Mohanty
DP#137-2008 Emerging Countries as Sources of Investment and AppropriateTechnology: Case Study of India by Sachin Chaurvedi
DP#136-2008 Potential of Asian Economic Integration: A Perspective fromthe Strategy of Japanese Enterprises by Tetsuji Kawamura
DP#135-2008 East Asian Infrastructure Development in a ComparativeGlobal Perspective: An Analysis of RIS Infrastructure Indexby Nagesh Kumar and Prabir De
DP#134-2008 India-Africa Economic Partnership: Trends and Prospectsby S. K. Mohanty and Sachin Chaturvedi
DP#133-2008 Towards An Asian “Bretton Woods” for Restructuring ofthe Regional Financial Architecture by Ramgopal Agarwala
DP#132-2008 The WTO’s Doha Negotiations: An Assessment by BhagirathLal Das
DP#131-2007 Regional Cooperation and Integration Prospects in Asiaby Rajat Nag
Mehta, R. et al. (2005), Food Safety Standards and Indian Food Exports, Workshop on"International Food Safety Regulations and Processed Food Exports: A ComparativeStudy of India and Thailand", RIS, New Delhi, August 13, 2005.
Mehta, R. and J. George (2005), "Institutional and Legal Framework of Food SafetyRegulation in India", in Mehta, R. and J. George (Eds.), Food Safety RegulationConcerns and Trade: The Developing Country Perspective, Macmillan India Ltd., pp141-186.
Mehta, R. and P. Mathur (2004), "India's Export by Countries and Commodities: On theEstimation of a Forecasting Model Using Panel Data", RIS DP # 84 .
Mehta, R. &R. Nambiar. (2008), "The poultry industry in India", Poultry in the 21stCentury: avian influenza and beyond, Proceedings of the International PoultryConference, FAO Animal Production and Health Proceedings, No. 9, FAO Rome.
Mehta, R., R. Nambiar and S. Ray (2005), "WTO and Poultry Industry in India", SouthAsian Journal, Vol 9, July-September, pp.69-87.
Mohanty, S. and K. Rajendran (2003), "2010 Vision for Indian Poultry", InternationalJournal of Poultry Science, 2(2) 139-143.
Panchamukhi, V.R., et al. (1995), Complementarity in Trade and Production: Intra SouthPotential, Sage Publications, New Delhi/Thousand Oaks/London, 1995, pp.1 179
Poultry Times of India, (2007), "Enormous Poultry Expansion Possible in India", a specialinterview with Mr. Wiebe Van Der Sluis, Vol. 11, November 2007, pp. 6-8.
Rajan, B.S. (2007), "Integrated Broiler Production - A Process of Transformation", HindPoultry, Vol VI, No. 6, pp. 25-33
Ramaswami, B., P. Birthal and P.K.Joshi (2006), "Efficiency and Distribution and ContractFarming: The Case of Indian Poultry Growth", MTID Discussion Paper No.91,International Food Policy Research Institute, Washington, January.
Reddy, C.V. (2001), "Sustainable Poultry Production for Poverty Alleviation and HumanDevelopment in South Asian countries", paper presented at the South Asian RegionalConference and Exhibition, Pune, September 24-26.
Tiongco, M., Narrod, C. & Delgado, C. 2006. Equitable intensification of market-orientedsmallholder dairy and poultry production in India through contract farming: a synthesis.Final Report of IFPRI-FAO Contract Farming of Milk and Poultry in India Project.Washington DC, International Food Policy Research Institute.
Suguna Group (2006), "Poultry Market - opportunities for Farmers", presented by P.K.Bharadwaj, G.M., Corporate Finance Suguna Poultry Farm Ltd., Coimbatoire, 2006.
(i)
DP#130-2007 Deepening India–Bangladesh Economic Cooperation:Challenges and Opportunities by Prabir De and Biswa N.Bhattacharyay
DP#129-2007 Intellectual Property Regime, Indigenous Knowledge Systemand Access and Benefit Sharing: Drawing Lessons fromKani Case by Sachin Chaturvedi
DP#128-2007 WTO and Trade in Electronically Delivered Software (EDS):Emerging Challenges and Policy Options - An IndianPerspective by Sachin Chaturvedi and S. K. Mohanty
DP#127-2007 Economy: Recent Evolution and New Perspectives for South-South Cooperation by Maria Lúcia L.M. Pádua Lima
DP#126-2007 Welfare Gains from Regional Economic Integration in Asia:ASEAN+3 or EAS by S.K. Mohanty and Sanjib Pohit
DP#125-2007 Investment Provisions in Regional Trading Arrangementsin Asia: Relevance, Emerging Trends, and PolicyImplications by Nagesh Kumar
DP#124-2007 Indian Innovation Systems and Emergence ofBiopharmaceutical Sector: Issues and Prospects by SachinChaturvedi
DP#123-2007 Regional Economic Integration, Foreign Direct Investmentand Efficiency-Seeking Industrial Restructuring in Asia: TheCase of India by Nagesh Kumar
DP# 122-2007 Community-based Rights and IPR Regime: Revisiting theDebate by Srividhya Ragavan and Jamie Mayer
DP#121-2007 India’s Rising Role in Asia by Mukul G. AsherDP#120-2007 Relevance of ‘Policy Space’ for Development: Implications
for Multilateral Trade Negotiations by Nagesh Kumar andKevin P. Gallagher
DP#119-2007 India-Sri Lanka Bilateral Free Trade Agreement: Six YearsPerformance and Beyond by Saman Kelegama and IndraNath Mukherji
DP#118-2007 Trade Facilitation Measures in South Asian FTAs: AnOverview of Initiatives and Policy Approaches by SachinChaturvedi
DP#117-2006 Emerging Multinationals: Trends, Patterns andDeterminants of Outward Investment by Indian Enterprisesby Nagesh Kumar
DP#116-2006 Addressing Global Growth Asymmetries throughRegional Trade Integration: Some Explorations by RamUpendra Das and Ramaa Sambamurty.
(ii)


![Kenchic Broiler Manual.KENCHIC BROILER MANUAL] ... 1 gas brooder per ... • Introduce some tube feeders and automatic drinkers, placed on the floor to get the chicks](https://img.pdfslide.us/doc/110x75/5aad4da17f8b9aa06a8e21fe/kenchic-broiler-kenchic-broiler-manual-1-gas-brooder-per-introduce.jpg)


![Investigations of Pathological Immunohistochemical and ... 1655.pdf · anti-Mycoplasma drug administrations in broiler chicks [2]. Some researchers demonstrated positive staining](https://img.pdfslide.us/doc/110x75/5fbe7bcb3cc23d12d51d15dd/investigations-of-pathological-immunohistochemical-and-1655pdf-anti-mycoplasma.jpg)