Embed Size (px)
Citation preview
MPRAMunich Personal RePEc Archive
Stars War in French Gastronomy:Prestige of Restaurants and Chefs’Careers
Olivier Gergaud and Valerie Smeets and Frederic Warzynski
Aarhus School of Business, Aarhus University
February 2010
Online at https://mpra.ub.uni-muenchen.de/21045/MPRA Paper No. 21045, posted 2. March 2010 06:35 UTC
Stars War in French Gastronomy: Prestige ofRestaurants and Chefs’ Careers ∗
Olivier Gergaud †
(University of Reims)
Valérie Smeets ‡ and Frédéric Warzynski §
(Aarhus School of Business, Aarhus University)
First draft: September 2006This version: January 2010
Abstract
In this paper, we analyze the careers from a sample of more than1,000 top French chefs over more than twenty years and link it tothe success or reputation of the restaurants where they have worked.This allows us to test what are the determinants of success but alsoto investigate the dynamics of performance and reputation, stressingthe importance of the quality of apprenticeships, mentoring and entre-preneurship spirit. We find that the prestige of the restaurant whereindividuals work is on average declining along the career, and that thequality of apprenticeship is strongly related to the future success aschef. We also find that prices of restaurants with higher reputationare more sensitive to bad signals.
JEL Codes: J24, M5
∗We thank seminar participants at Carlos III, Aarhus School of Business, Universityof Reims, University of Frankfurt and the 2009 IZA/SOLE meeting for helpful comments.The usual disclaimer applies.
†email: [email protected]‡email: [email protected]§email: [email protected]
1
1 Introduction
For most chefs, having his restaurant being awarded one or more stars in the
famous Michelin Guide Rouge represents a major achievement, a recognition
of their work, and also increased notoriety generating a significant stream
of future revenues. In this specific industry, experts play a decisive role,
and reputation of restaurants and chefs are basically established according
to their opinions. The aim of this paper is to analyze how these reputations
are made and unmade and to understand better the development of careers
in this highly creative occupation. Thanks to the richness of our dataset, we
are able to observe the birth of a “star” and its evolution in the constellation
of stars forming the French gastronomic scene.
We first describe the typical career of a chef, explaining the different
stages of the career and looking at the determinants of performance along
the career. We find that careers follow a particular path. At an earlier stage
of their career, after graduating from a culinary school, individuals learn the
untaught tricks of the profession by assisting different accomplished chefs
at various stages of the meal preparation, starting as commis de cuisine,
then chef de partie and then second de cuisine, or main assistant. This
apprenticeship process is nicknamed Tour de France as young chefs travel
through the country and sometimes beyond to improve their knowledge and
benefit from various experiences at the best restaurants. We show that the
quality of the restaurant where an individual works on average declines over
the career. In other words, individuals start their careers in restaurants
with the highest reputation, and gradually move to restaurants with a lower
reputation along their apprenticeship. At the end of this apprenticeship, they
usually start they own restaurant starting from scratch, and gradually build
their own reputation.
We are especially interested in the process of initial accumulation of hu-
man capital. We use a quality-weighted measure of apprenticeship human
capital measuring the quality of the apprenticeship received during the early
2
stage of the career, and measure its effect on the determinants of later suc-
cess. We find that these measures of accumulated human capital are a key
determinant of the performance as chef de cuisine. The quality of appren-
ticeship appears to be particularly important at an intermediate level (chef
de partie) and, to a less extent, at the end of the apprenticeship (second de
cuisine).
We then measure the consequences of reaching the stars. We estimate
hedonic price regressions and find that an additional star translates into a
15% price increase for a typical menu. We also estimate a regression in
first difference, looking at the change in price associated with a change in
stars. While the overall effect is positive, we find that the effect is stronger
the higher was the prestige of the restaurant the previous year, and also that
change in prices are more sensitive to downgradings than to upgradings. The
first result is in line with the theoretical predictions frommodels of reputation
like Diamond (1989).
We contribute to three very different strands of the literature. First,
a long tradition in labor economics has investigated individual careers and
the dynamics of productivity over the career. Starting with the theoretical
work of Becker, Mincer and Ben-Porath on human capital, the literature on
learning (Gibbons and Katz, 1991; Farber and Gibbons, 1996), or on career
concerns (Holmström, 1982), and more recently on careers in organizations
(Gibbons and Waldman, 1999a,b), these authors have tried to understand
what is driving careers.
Empirical work has attempted to validate some key predictions of some
of these theories using personal information from mutual fund managers
(Chevallier and Ellison, 1999), financial analysts (Hong, Kubik and Solomon,
2000; Hong and Kubik, 2003), academic economists (Coupé, Smeets and
Warzynski, 2006a,b,c; Oyer, 2006). Others have documented the career dy-
namics in single firms (Baker, Gibbs and Holmströn, 1994a,b and followers)
and have linked their findings to various theories. We bring some additional
light by stressing the importance of the quality of initial apprenticeship hu-
3
man capital as a determinant of success and by documenting careers and the
dynamics of performance in the specific context of haute cuisine.
Secondly, a relatively large and mostly theoretical literature studies the
importance of reputation in contractual agreements (Milgrom and Roberts,
1982; Kreps andWilson, 1982; Diamond, 1989; see Cabral, 2005 for a compar-
ative description). Reputation is described as a valuable asset, built through
repeated interactions where actors update their beliefs about the type of
the other contracting party, that firms use as a competitive advantage. We
document the emergence of reputation and measure the consequence of this
reputation building on the price that restaurants can charge.
Thirdly, a small literature studies the economics and management of gas-
tronomy. A few papers discuss the leadership qualities of the top French
chefs (Balazs, 2001, 2002). Chossat and Gergaud (2003) look at the effect of
the quality of the setting on experts’ opinion and find a positive relationship.
The paper more closely associated to our work is Durand, Monin and Rao
(2001). Building on the the resource-based view of the firm, they discuss
how chefs are able to improve their resource or reputation (measured by an
increase in the number of Michelin stars) through innovation and investment
in general human capital. However, none of these papers analyze the dynam-
ics of careers, nor analyze the initial accumulation of human capital as key
determinant for future success.
Section 2 describes the construction of the dataset and provides some
summary statistics. Sections 3 details our empirical methodology, while sec-
tion 4 shows our results. Section 5 concludes and provides suggestions for
future research.
4

2 Data
Our dataset is constructed by combining two sources of data. The first
dataset describes the careers of 1,000 top chefs in French gastronomy, as
assessed by the guide Le Botin Gourmand in their book Les Etoiles de la
Gastronomie Française published in 2001. The second consists of the Miche-
lin books Guide Rouge from 1980 to 2001.
The first source associates the name of the chef to name of the restau-
rant, its location, a clear description of the career similar to a vitae (i.e.
which type of job at which restaurant over which period of time), as well as
other individual information such as the gender, the date of birth, the type
of education (the different types of degrees obtained and the date of gradu-
ation), information about apprenticeships, and whether he learned by itself
(autodidacte). The second source provides, associated to the name of the
restaurant, the location, presence of an hotel, the minimum and maximum
prices for a menu, and also a remark as to whether it is necessary or advised
to call in advance. More importantly, it provides for each restaurant ranked
by Michelin two measures of quality: the quality of the food as measured by
the number of stars (on a scale from 0 to 3), and the quality or luxury of
the setting as measured by the number (and color) of forks (or houses), on
a scale from 0 to 5. Chefs from restaurants with at least one star are also
asked to indicate three recipes among their specialties. We then merged the
two datasets by location, restaurant and by year.
Table 1 shows the number of individuals working in Michelin starred
restaurants by year. By construction, our dataset contains a succession of
new cohorts arriving on the market and a few incumbents who were already
chefs before 1980.
The job structure in the industry is very clearly defined and hierarchical.
At the top of the hierarchy are the chefs. They are assisted by their second
de cuisine. Lower in the hierarchy are chef de partie and commis de cuisine,
who assist at different stages of the process. Table 2 shows the evolution of
5
the distribution of jobs over our period of analysis. Again, by construction,
we see that the proportion of chefs and, to a lower extent, of seconds de
cuisine is increasing with time, while the proportion of chef de partie and
commis de cuisine is declining.
Concentrating on the firm/restaurant side, Figure 1 shows the evolution
of the average price (not controlling for inflation) and the price ratio between
restaurant categories. We can clearly see that the price difference between
3-stars restaurant and the other categories increases gradually, suggesting a
superstar effect.
Table 3 shows the transition matrix in and out of the Michelin guide, as
well as the star transition. We observe that there is more upward mobility
(probably as a consequence of our sample selection) and also quite a lot of
persistence. Persistence is also much higher at the top than at the bottom1.
3 Empirical Methodology and Results
3.1 Stylized facts about prestige of the restaurant andcareer dynamics
We start by linking the prestige of the restaurant to the career dynamics.
Table 4 shows the percentage of individuals working in different subsets of
restaurants ranked by quality at various stages of their careers. A striking
pattern is that the prestige of the restaurant is higher at the beginning of
the career: commis de cuisine and chefs de partie work on average in higher-
quality restaurants than seconds de cuisine, themselves working in higher-
quality restaurants than chef de cuisine This should come as no surprise
as individuals at the beginning of their career tour the best restaurants in
the country, learning the techniques from the most famous chefs. This fact
can partly be explained by the selective nature of our sample. However,
it also provides an interesting description of the typical pattern regarding
1See Schumacher (2009) for a theoretical motivation.
6
career dynamics and reputation building for our subset of highly talented
individuals: after learning from all these top chefs, individuals start from
scratch, become chefs themselves and start with no reputation. We turn
next to what can explain their success of their restaurant once they become
chef.
3.2 Effect of “apprenticeship human capital”
In the second part, we only consider the subset of individuals who have
reached the level of chef and try to understand which factors affect their
performance, or the prestige of the restaurant they work at. In particular,
we stress the importance of the quality of the apprenticeship human capital
accumulated at the earlier stage of the career. As we have just seen in the
previous step, individuals spend their apprenticeship learning in the restau-
rants with well established reputation. Obviously, some are more lucky or
talented than others and end up in better places. So how does the quality
of the restaurant where you worked as commis de cuisine, chef de partie or
second de cuisine affects your success as a chef? To study this, we create a
measure of quality weighted accumulation of apprenticeship human capital
by summing the number of stars accumulated over the years at the various
stages of your career. We then look at the effect of this variable on perfor-
mance as a chef:
Performanceijt = f
⎛⎜⎜⎝Genderi, Ageit, Age
2it, Educationit,
Stars accumulated as second de cuisine,Stars accumulated as chef de partie,Stars accumulated as commis de cuisine
⎞⎟⎟⎠Tables 5 to 7 show the results. It appears that the quality of appren-
ticeship has an important effect on performance, as the stars accumulated,
especially as chef de partie, impacts on the presence in the Michelin and the
number of stars as a chef. This could indicate either that there is a selection
between individuals to be selected as chef de partie in the best restaurants,
7

or/and that you need to be sufficiently close to the chef to really learn from
him, what might not be the case as commis de cuisine. Finally, the fact that
the number of stars accumulated as second de cuisine is only significant in
one specification could be linked to the different career choices that individ-
uals make, as some individuals might wait a long time as second de cuisine
that the chef retires to take over the restaurant, while others would start
rapidly on their own. We study that decision more carefully in a companion
paper.
3.3 Hedonic price regressions
As a third part, we measure the consequence of reaching the stars and link
the average price of a menu to the number of stars awarded to the restaurant,
We also look at the effect of the quality of the setting on the average price
charged.
logPit = g(Stars, Forks, Location)
In table 8,we find that, on average, an extra star is associated with a
15% price increase, reflecting the increased value the consumer is expected
to receive in his plate. The quality of the setting is also associated with
higher price.
We next analyze more precisely the dynamic relationship between price
and performance, stressing the importance of reputation. We test change
in performance should matter differently whether you were a three stars
restaurant or a restaurant with no star. We run a simple first difference
regression between the change in price and the change in stars, as well as
the interaction between the change in stars and the past reputation of the
restaurant, and the interaction between the change in stars and the type of
change (positive or negative assessment):
d logPit = dStarsit + dStarsit ∗ Positive+ dStarsit ∗ Re putationi(t−1)
8
Table 9 shows the results. We find that the relationship between a change
in performance and a change in price is much stronger at the top of the
prestige ladder than at the bottom. In others words, a bad signal is much
more costly when a firm has acquired a high level of reputation, in line with
the theoretical predictions from several models of reputation like Diamond
(1989). We also find that change in prices are more sensitive to downgradings
than to upgradings.
4 Conclusion
In this paper, we analyzed the career patterns of a subset of top French chefs.
We described a few stylized facts about this specific labor markets: the qual-
ity of the workplace is on average higher at the beginning of the career. This
is consistent with the idea that individuals acquire human capital on the
job and then start their own firm from scratch using the tools they have
learned by observing the best chefs at work. We then tested whether this
reputational human capital had an impact on future performance. Our re-
sults confirmed our prior that the quality of the restaurant where individuals
learned the profession had a significant impact on the probability to enter in
the Michelin and acquire highly valuable stars. We also analyzed the pricing
patterns of restaurants. We found that prices were more sensitive to bad
signals for restaurants of higher quality. As such, our paper contributes to
the understanding of the dynamics of reputation.
References
[1] Chossat, V. and Gergaud, Olivier (2003), Expert Opinion and Gas-
tronomy: The Recipe for Success, Journal of Cultural Economics, 27,
127-141.
[2] Cabral, L. (2005). “The Economics of Trust and Reputation: A Primer.”
Unpublished manuscript, NYU.
9
[3] Diamond, D. W. (1989), “Reputation Acquisition in Debt Markets,”
Journal of Political Economy 97, 828—862.
[4] Durand, R., Monin, P. and Rao, H. (2001), Construire et défendre une
ressource intangible: le cas de la grande cuisine francaise, Perspective
en management stratégique, 8, 223-240.
[5] Gibbons, R. and Waldman, M. (1999a), A Theory of Wage and Pro-
motion Dynamics Inside Firms, Quarterly Journal of Economics, 114,
1321-1358.
[6] Gibbons, R. and Waldman, M. (1999b), Careers in Organizations: The-
ory and Evidence, in Ashenfelter, O. and Card, D. (Eds.), Handbook of
Labor Economics, Vol. IIIB, North Holland, .
[7] Holmström, B. (1982), Managerial Incentive Problems: A Dynamic Per-
spective”, in Essays in Economics and Management in Honor of Lars
Wahlbeck, Swedish School of Economy.
[8] Hong, H. and Kubik, J. D. (2003), Analyzing the Analysts: Career
Concerns and Biased Earnings Forecasts, Journal of Finance, 63, 313-
351.
[9] Hong, H., Kubik, J. D. and Solomon, A. (2000), Security Analysts’
Career Concerns and Herding of Earnings Forecasts, RAND Journal of
Economics, 31, 121-144.
[10] Schumacher, H. (2009), Reputation and competition in a market for
differentiated products, mimeo, Goethe University.Frankfurt.
10
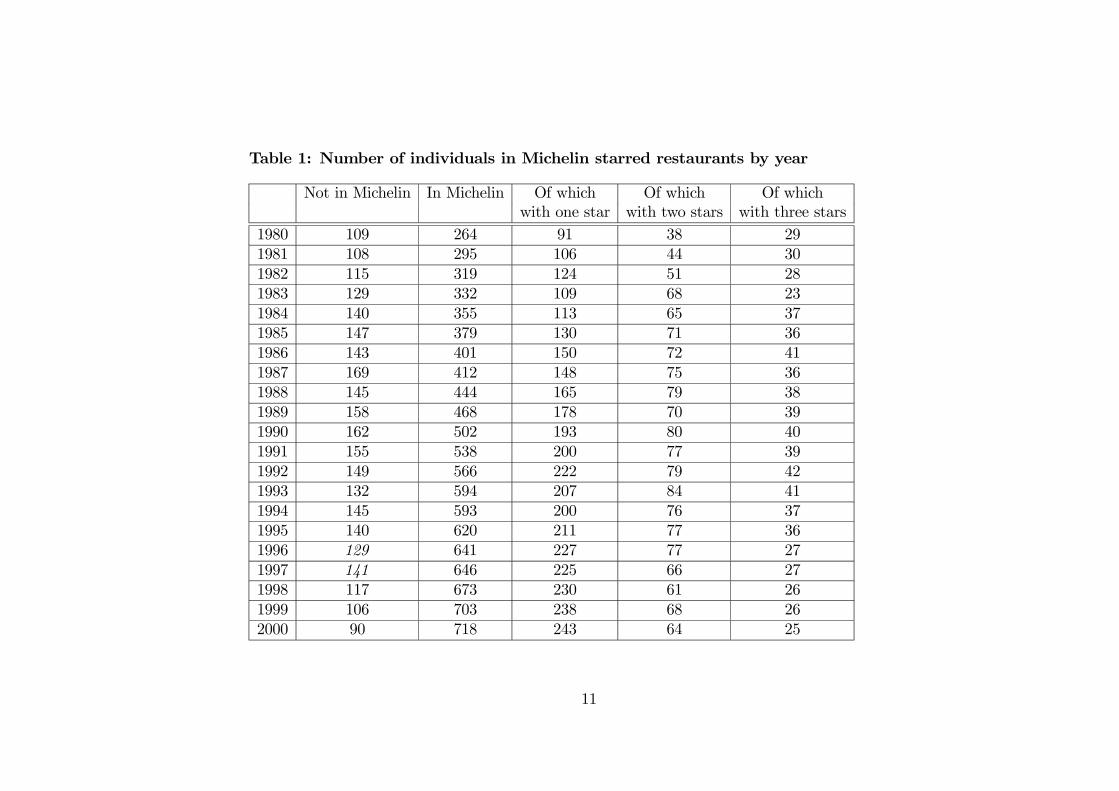
Table 1: Number of individuals in Michelin starred restaurants by year
Not in Michelin In Michelin Of which Of which Of whichwith one star with two stars with three stars
1980 109 264 91 38 291981 108 295 106 44 301982 115 319 124 51 281983 129 332 109 68 231984 140 355 113 65 371985 147 379 130 71 361986 143 401 150 72 411987 169 412 148 75 361988 145 444 165 79 381989 158 468 178 70 391990 162 502 193 80 401991 155 538 200 77 391992 149 566 222 79 421993 132 594 207 84 411994 145 593 200 76 371995 140 620 211 77 361996 129 641 227 77 271997 141 646 225 66 271998 117 673 230 61 261999 106 703 238 68 262000 90 718 243 64 25
11
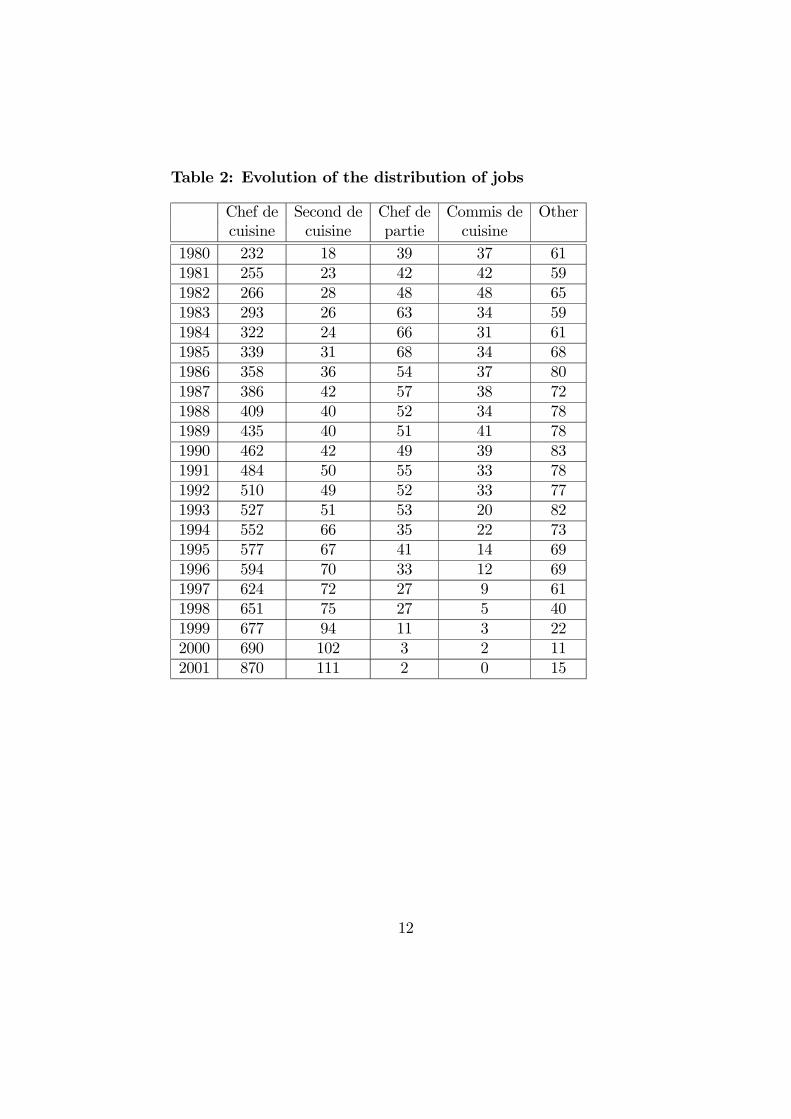
Table 2: Evolution of the distribution of jobs
Chef de Second de Chef de Commis de Othercuisine cuisine partie cuisine
1980 232 18 39 37 611981 255 23 42 42 591982 266 28 48 48 651983 293 26 63 34 591984 322 24 66 31 611985 339 31 68 34 681986 358 36 54 37 801987 386 42 57 38 721988 409 40 52 34 781989 435 40 51 41 781990 462 42 49 39 831991 484 50 55 33 781992 510 49 52 33 771993 527 51 53 20 821994 552 66 35 22 731995 577 67 41 14 691996 594 70 33 12 691997 624 72 27 9 611998 651 75 27 5 401999 677 94 11 3 222000 690 102 3 2 112001 870 111 2 0 15
12
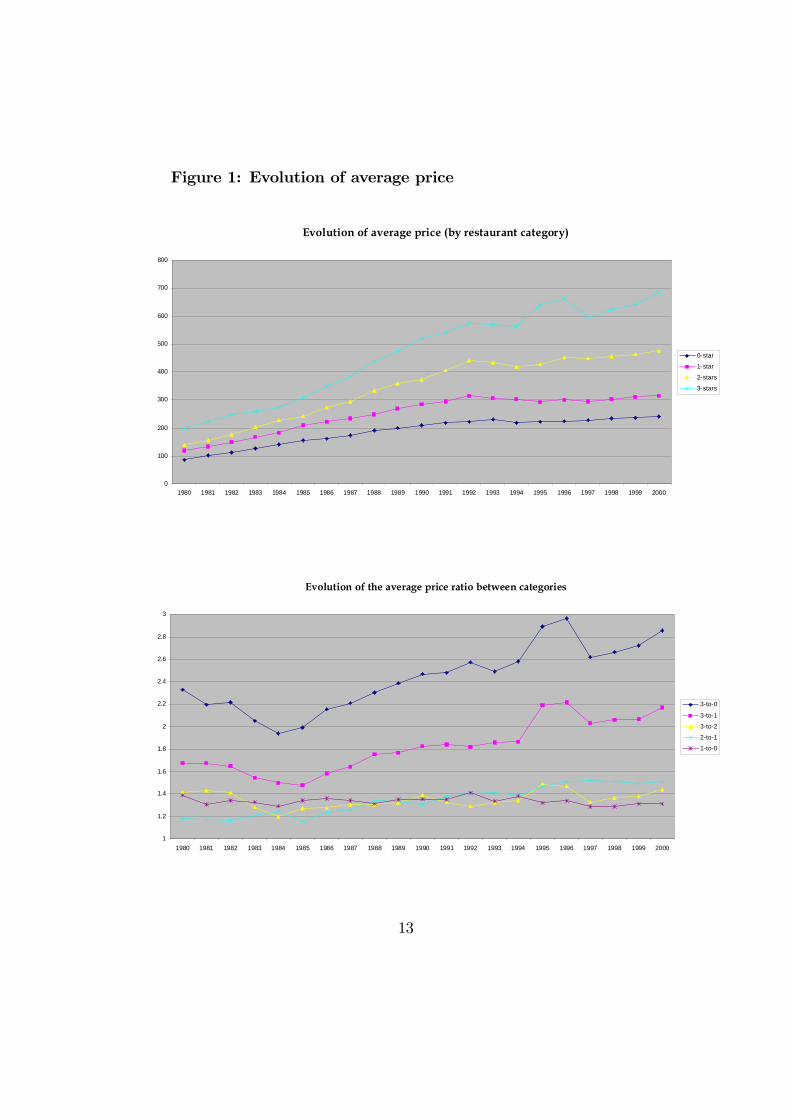
Figure 1: Evolution of average price
Evolution of average price (by restaurant category)
0
100
200
300
400
500
600
700
800
1980 1981 1982 1983 1984 1985 1986 1987 1988 1989 1990 1991 1992 1993 1994 1995 1996 1997 1998 1999 2000
0-star
1-star
2-stars
3-stars
Evolution of the average price ratio between categories
1
1.2
1.4
1.6
1.8
2
2.2
2.4
2.6
2.8
3
1980 1981 1982 1983 1984 1985 1986 1987 1988 1989 1990 1991 1992 1993 1994 1995 1996 1997 1998 1999 2000
3-to-0
3-to-1
3-to-2
2-to-1
1-to-0
13
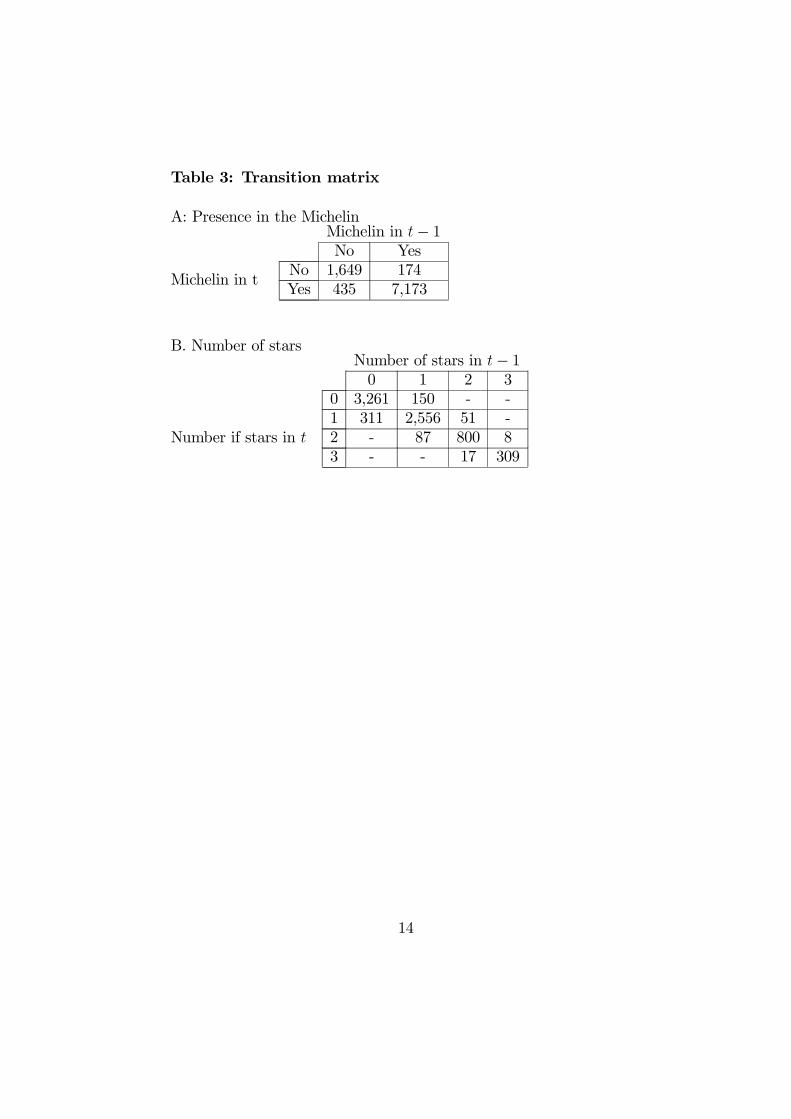
Table 3: Transition matrix
A: Presence in the Michelin
Michelin in t
Michelin in t− 1No Yes
No 1,649 174Yes 435 7,173
B. Number of stars
Number if stars in t
Number of stars in t− 10 1 2 3
0 3,261 150 - -1 311 2,556 51 -2 - 87 800 83 - - 17 309
14
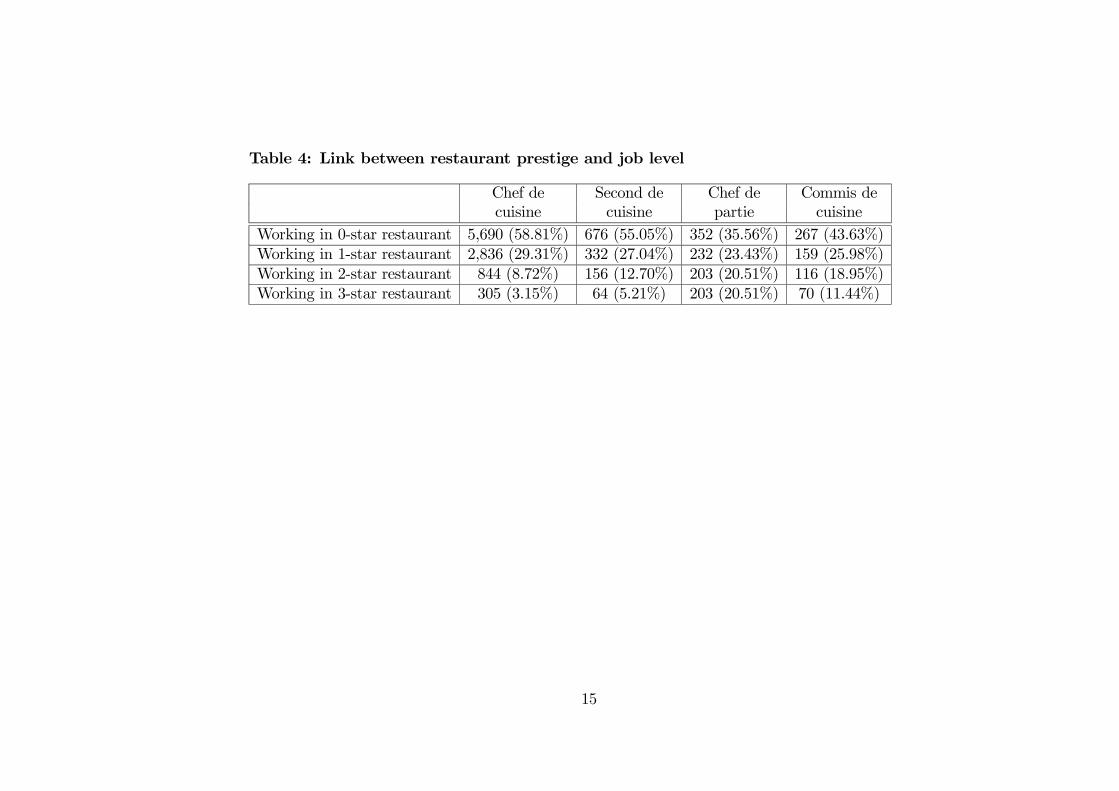
Table 4: Link between restaurant prestige and job level
Chef de Second de Chef de Commis decuisine cuisine partie cuisine
Working in 0-star restaurant 5,690 (58.81%) 676 (55.05%) 352 (35.56%) 267 (43.63%)Working in 1-star restaurant 2,836 (29.31%) 332 (27.04%) 232 (23.43%) 159 (25.98%)Working in 2-star restaurant 844 (8.72%) 156 (12.70%) 203 (20.51%) 116 (18.95%)Working in 3-star restaurant 305 (3.15%) 64 (5.21%) 203 (20.51%) 70 (11.44%)
15
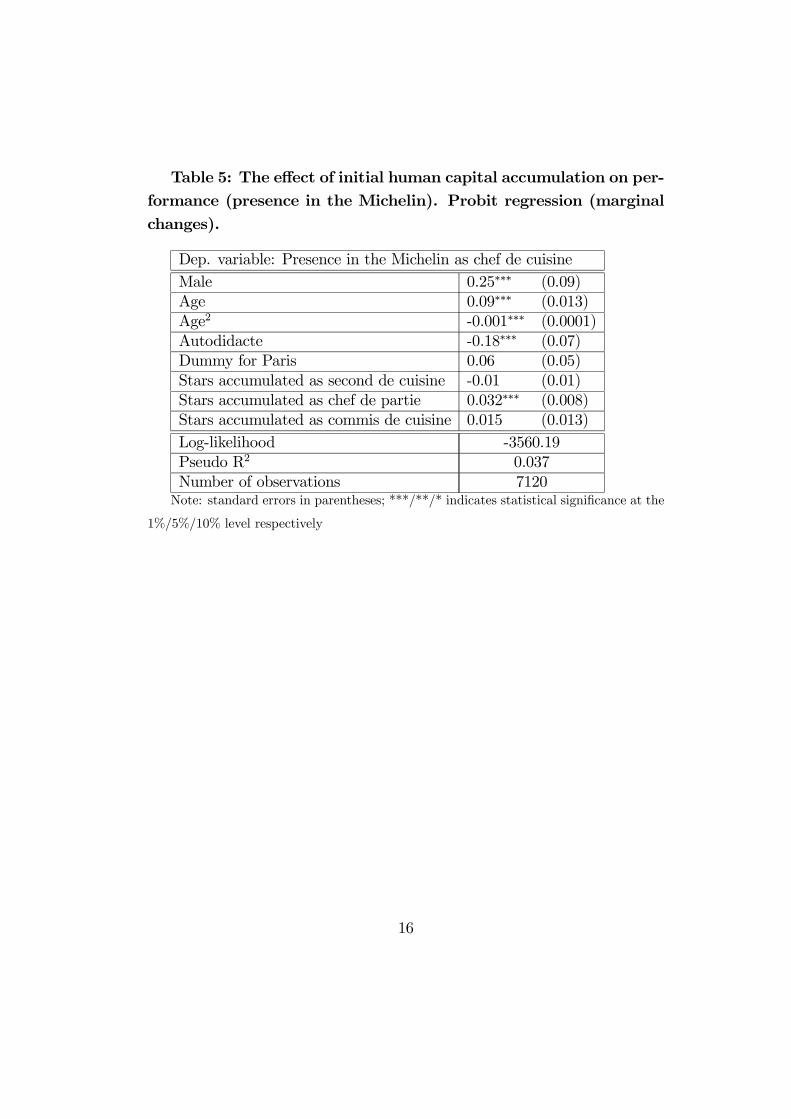
Table 5: The effect of initial human capital accumulation on per-formance (presence in the Michelin). Probit regression (marginalchanges).
Dep. variable: Presence in the Michelin as chef de cuisineMale 0.25∗∗∗ (0.09)Age 0.09∗∗∗ (0.013)Age2 -0.001∗∗∗ (0.0001)Autodidacte -0.18∗∗∗ (0.07)Dummy for Paris 0.06 (0.05)Stars accumulated as second de cuisine -0.01 (0.01)Stars accumulated as chef de partie 0.032∗∗∗ (0.008)Stars accumulated as commis de cuisine 0.015 (0.013)Log-likelihood -3560.19Pseudo R2 0.037Number of observations 7120Note: standard errors in parentheses; ***/**/* indicates statistical significance at the
1%/5%/10% level respectively
16
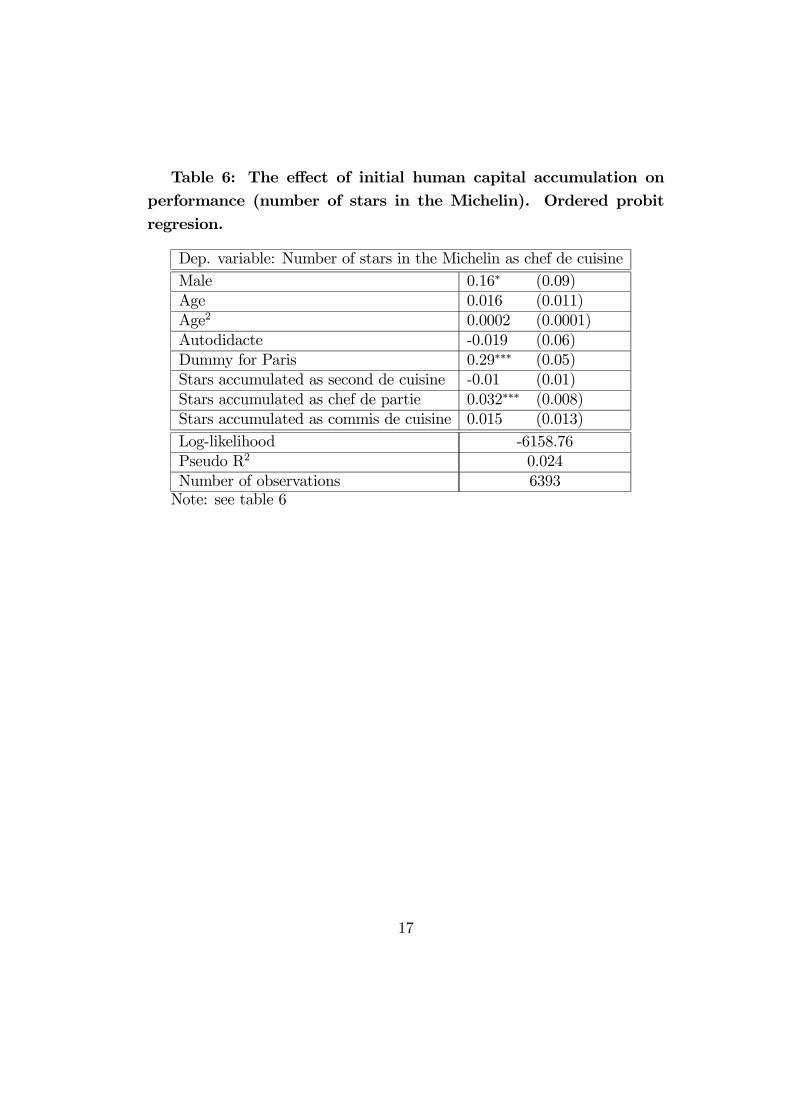
Table 6: The effect of initial human capital accumulation onperformance (number of stars in the Michelin). Ordered probitregresion.
Dep. variable: Number of stars in the Michelin as chef de cuisineMale 0.16∗ (0.09)Age 0.016 (0.011)Age2 0.0002 (0.0001)Autodidacte -0.019 (0.06)Dummy for Paris 0.29∗∗∗ (0.05)Stars accumulated as second de cuisine -0.01 (0.01)Stars accumulated as chef de partie 0.032∗∗∗ (0.008)Stars accumulated as commis de cuisine 0.015 (0.013)Log-likelihood -6158.76Pseudo R2 0.024Number of observations 6393Note: see table 6
17
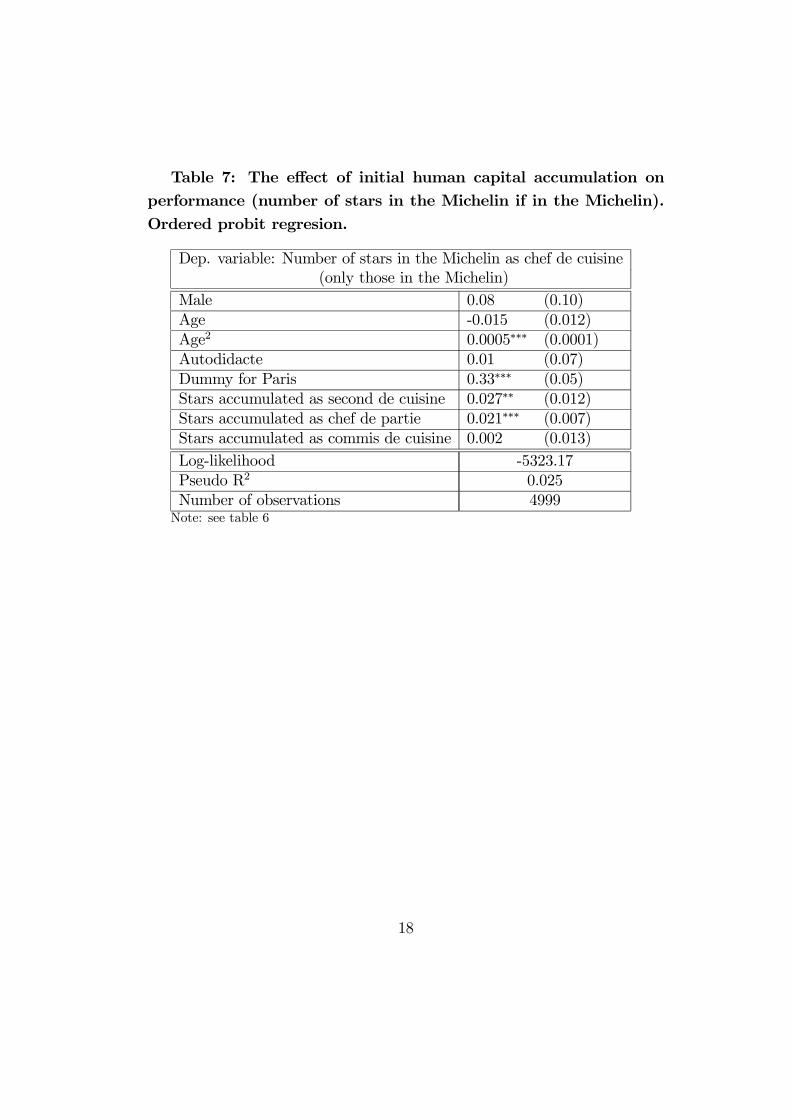
Table 7: The effect of initial human capital accumulation onperformance (number of stars in the Michelin if in the Michelin).Ordered probit regresion.
Dep. variable: Number of stars in the Michelin as chef de cuisine(only those in the Michelin)
Male 0.08 (0.10)Age -0.015 (0.012)Age2 0.0005∗∗∗ (0.0001)Autodidacte 0.01 (0.07)Dummy for Paris 0.33∗∗∗ (0.05)Stars accumulated as second de cuisine 0.027∗∗ (0.012)Stars accumulated as chef de partie 0.021∗∗∗ (0.007)Stars accumulated as commis de cuisine 0.002 (0.013)Log-likelihood -5323.17Pseudo R2 0.025Number of observations 4999Note: see table 6
18
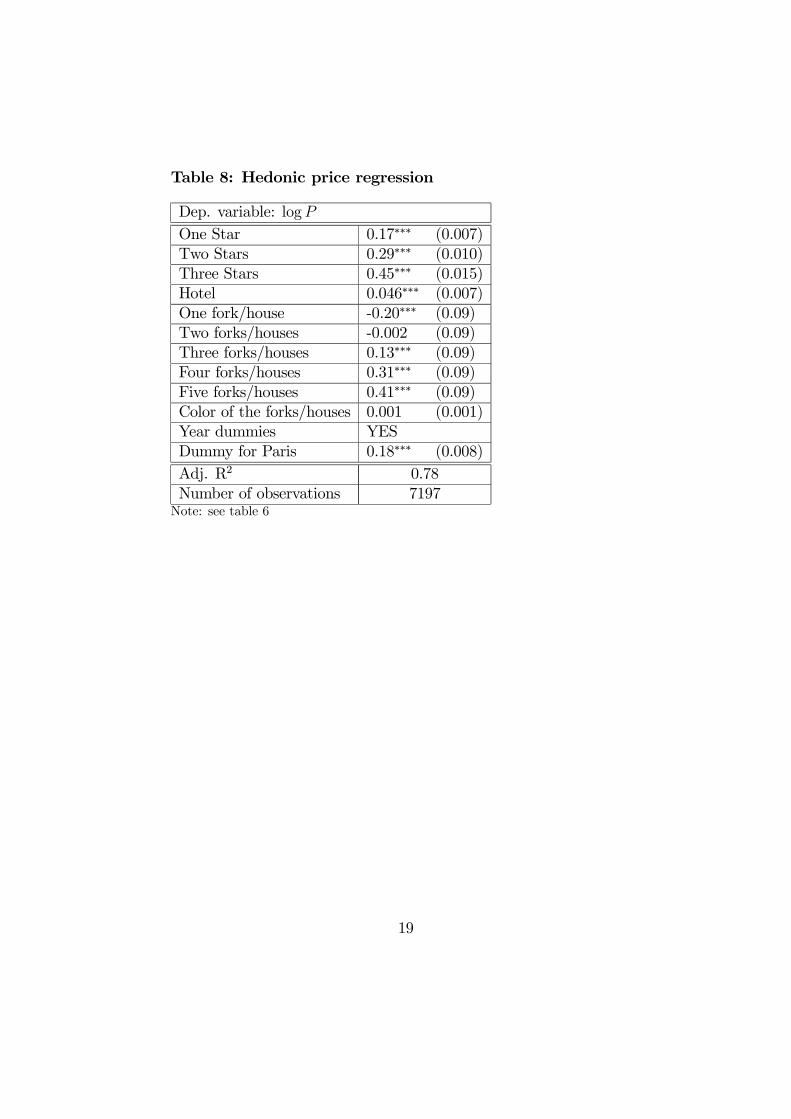
Table 8: Hedonic price regression
Dep. variable: logPOne Star 0.17∗∗∗ (0.007)Two Stars 0.29∗∗∗ (0.010)Three Stars 0.45∗∗∗ (0.015)Hotel 0.046∗∗∗ (0.007)One fork/house -0.20∗∗∗ (0.09)Two forks/houses -0.002 (0.09)Three forks/houses 0.13∗∗∗ (0.09)Four forks/houses 0.31∗∗∗ (0.09)Five forks/houses 0.41∗∗∗ (0.09)Color of the forks/houses 0.001 (0.001)Year dummies YESDummy for Paris 0.18∗∗∗ (0.008)Adj. R2 0.78Number of observations 7197Note: see table 6
19
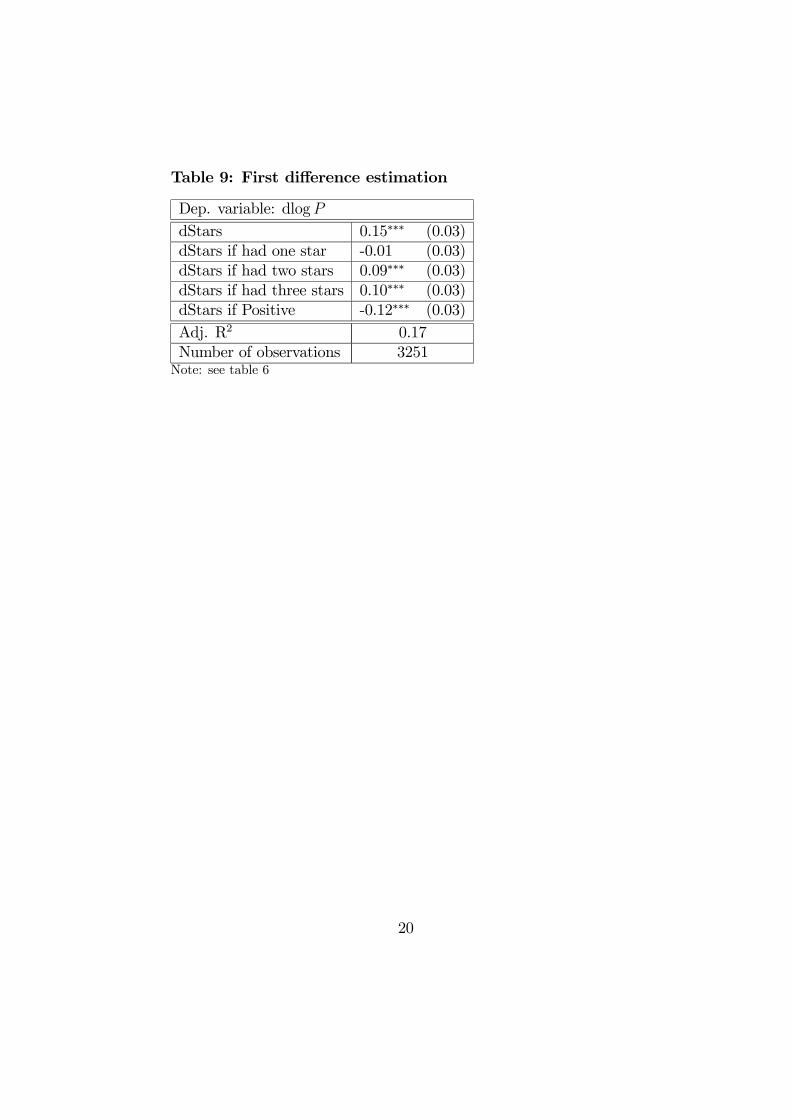
Table 9: First difference estimation
Dep. variable: dlogPdStars 0.15∗∗∗ (0.03)dStars if had one star -0.01 (0.03)dStars if had two stars 0.09∗∗∗ (0.03)dStars if had three stars 0.10∗∗∗ (0.03)dStars if Positive -0.12∗∗∗ (0.03)Adj. R2 0.17Number of observations 3251Note: see table 6
20