Embed Size (px)
Citation preview

MPRAMunich Personal RePEc Archive
Strengths And Weaknesses Of The NewPublic Management (NPM)-Cross-Sectional And LongitudinalAnalysis
Oehler-Sincai, Iulia Monica
Institute of World Economy
November 2008
Online at http://mpra.ub.uni-muenchen.de/11767/
MPRA Paper No. 11767, posted 25. November 2008 / 22:08

Paper for the Conference organized by the SOG and the QoG Institute, University of Gothenburg –New Public Management and the Quality of Government, November 13-15, 2008
1
STRENGTHS AND WEAKNESSES OF THE NEW PUBLIC MANAGEMENT (NPM)-CROSS-SECTIONAL AND LONGITUDINAL ANALYSIS
- Part I of a wider analysis of the NPM -
Abstract: The paradigm of NPM, like its forerunners, has been trying to answer the same question for almost twenty years: how to implement policies, strategies, programs and projects, using the market-type mechanisms, so that the institutions of the state could achieve the desired results.
The praises and criticism that have accompanied this paradigm along its evolution are fully justified. Indeed, the NPM has strengths and weaknesses as well, and one purpose of this paper is to identify them and to find answers to the following questions.
Which components of the mechanism named NPM generate negative results? Why? What can be done? It is not easy to answer these questions, taking into consideration the multitude of factors influencing the public management, and especially the tremendous impacts of the accelerated process of globalization. The global problems of nowadays make any unilateral action of a government unconceivable, and this brings us to the concept of global public management (GPM). Nevertheless, the way forward will be the subject of another paper.
The paper is structured in two main sections, as follows: The first section provides a conceptual framework, examining the multifaceted
structure of the NPM and its mechanisms (the “state-of-the-art” of the “art of the state”).The second section suggests a theoretical framework on “measuring” the aggregate
attribute of the NPM – the QoG – illustrated by practical cases, in a twofold perspective: longitudinal (variation in time) and cross-sectional (variation among countries).
Key Words: New Public Management, Global Public Management, Governance, New Institutional Economics, Bertelsmann Transformation Index, Corruption Perceptions Index, e-Government Index, Global Competitiveness Index, Human Development Index, Index of Freedom in the World, Transition Indicators, Worldwide Governance Indicators.
Dr. Iulia Monica OEHLER-
Romanian Academy
Institute of World Economy, Romania
Calea 13 Septembrie, 13, Bucharest, sector 5, Romania, [email protected]

Paper for the Conference organized by the SOG and the QoG Institute, University of Gothenburg –New Public Management and the Quality of Government, November 13-15, 2008
2
Abbreviations and acronyms:
BF – Bertelsmann FoundationBTI – Bertelsmann Transformation IndexCPI – Corruption Perceptions IndexEBRD – European Bank for Reconstruction and DevelopmenteGI – e-Government IndexEU – European UnionEU-15 – Austria, Belgium, Denmark, Finland, France, Germany, Greece, Ireland,
Italy, Luxembourg, Netherlands, Portugal, Spain, Sweden, United Kingdom (UK)EU-12 or the NMS – New Member States of the EU – Bulgaria, Cyprus, the Czech
Republic, Estonia, Hungary, Latvia, Lithuania, Malta, Poland, Romania, Slovakia, SloveniaGCI – Global Competitiveness IndexGDP – Gross Domestic ProductGPM – Global Public ManagementHDI – Human Development IndexICT – Information and Communication TechnologiesIFW – Index of Freedom in the WorldNGO – Non-Governmental Organizations NIE – New Institutional EconomicsNPM – New Public ManagementNMS-10 – New Member States of the EU, with the exception of Cyprus and MaltaOECD – Organization for Economic Cooperation and DevelopmentPPP – Purchasing Power Parity QoG – Quality of GovernanceTI – Transition IndicatorsUNDP – United Nations Development Program WEF – World Economic ForumWGI – Worldwide Governance Indicators

Paper for the Conference organized by the SOG and the QoG Institute, University of Gothenburg –New Public Management and the Quality of Government, November 13-15, 2008
3
STRENGTHS AND WEAKNESSES OF THE NEW PUBLIC MANAGEMENT –CROSS-SECTIONAL AND LONGITUDINAL ANALYSIS
MOTIVATION
As “some generic label seemed to be needed for a general, though certainly not universal shift in public management styles”1, academics like: Pollitt (1990), Hood (1991), Hoggett (1991), Osborne and Gaebler (1992) et al. coined the term new public management(NPM).
This paradigm, like its forerunners, has been trying for almost twenty years to answer the same question: how to implement policies, strategies, programs and projects, using the market-type mechanisms, so that the institutions of the state could achieve the desired results?
The praises and critics that have accompanied this paradigm along its transformative way are fully justified. Indeed, the NPM has strengths and weaknesses as well, and onepurpose of this paper is to identify these strengths and weaknesses and to find solutions.
Intuitively, disparities between the rich and the poor, environment degradation, poor infrastructure are results of the weaknesses of the governance or NPM or both. International organizations, foundations, NGOs have deepened the analysis and developed sophisticatecomposite indexes like: Human Development Index, e-Government Index, Corruption Perceptions Index, Global Competitiveness Index, in order to underline the weaknesses (and in some cases, the strengths) of the NPM.
But which components of the mechanism named NMP generate negative results? Why? What can be done? Such questions are not easy to answer, taking into consideration the multitude of factors influencing the public management, and especially the tremendous impacts of the accelerated process of globalization. The global problems of nowadays make any unilateral action of a government unconceivable, and this brings us to the concept of global public management (GPM). Nevertheless, the way forward will be subject of another paper.
As a result, the present paper is structured in two main parts, as follows:1. A conceptual framework, examining the multifaceted structure of the NPM and its
mechanisms (the “state-of-the-art” of the “art of the state”);2. A theoretical framework on “measuring” the aggregate attribute of the NPM – the
QoG – accompanied by practical cases, in a twofold perspective: longitudinal (variation in time) and cross-sectional (variation among countries).
1 Hood, 1995, p. 94

Paper for the Conference organized by the SOG and the QoG Institute, University of Gothenburg –New Public Management and the Quality of Government, November 13-15, 2008
4
1. NPM, NIE and the QoG – A Brief Conceptual Framework
1.1. What are the meanings of: public management (new or old), governance and government and which relationship is between them?
“Governance is the manner in which power is exercised in the management of a country's economic and social resources for development” (World Bank, 1992), or “the manner in which public officials and institutions acquire and exercise the authority to shape public policy and provide public goods and services” (World Bank, 2007) (definitions cited by Kaufmann and Kraay, 2007).
The latest definition given by the World Bank bears the mark of the New Institutional Economics (NIE): “Governance consists of the traditions and institutions by which authority in a country is exercised. This includes the process by which governments are selected, monitored and replaced; the capacity of the government to effectively formulate and implement sound policies; and the respect of citizens and the state for the institutions that govern economic and social interactions among them.
In the opinion of the World Bank, governance consists of 5 key dimensions:2
Ø The structure of government, the legal and practical separation of the executive, legislative, and judicial powers;
Ø The structure of the accountability and contestability of political leaders, the quality of the public policies;
Ø The public sector management, the behaviour and efficiency of civil servants (and of contractors if delivery of public services is outsourced) in managing public resources, carrying out regulatory functions, and implementing public policy;
Ø Open entry and competition in the private sector, the degree to which the governance system allows, or prevents, a limited business elite to consolidate economic power that it then transforms into political power, including influencing officials and laws in ways that further consolidate and protect its economic power;
Ø The nexus of issues dealing with civil society, voice, participation.International Monetary Fund (2001, pp. 7 and 9) considers the general government
sector as one of the five sectors of a national economy3, representing “all the institutional units primarily engaged in non-market operations (e.g.: legislative, judicial, or executive
2 http://go.worldbank.org/WA0I2A8VS03 The total economy of a country can be divided into five sectors (International Monetary Fund, 2001, p. 7):
Ø The non-financial corporations sector, which consists of entities created for the purpose of producing goods and non-financial services for the market;
Ø The financial corporations sector, which consists of entities engaged in providing financial services for the market;
Ø The general government sector, which consists of entities that fulfil the functions of government as their primary activity;
Ø The non-profit institutions serving households sector, which consists of all resident non-profit institutions, except those controlled and mainly financed by government, that provide non-market goods or services to households; and
Ø The households sector, which consists of small groups of persons who share the same living accommodation, pool some or all of their income and wealth, and consume certain types of goods and services collectively,
with each sector consisting of a number of institutional units that are resident in the economy.

Paper for the Conference organized by the SOG and the QoG Institute, University of Gothenburg –New Public Management and the Quality of Government, November 13-15, 2008
5
authority over other institutional units within a given area; responsibility for the provision of goods and services to the community as a whole or to individual households on a non-market basis; transfer payments to redistribute income and wealth; finance of their activities, directly or indirectly, mainly by means of taxes and other compulsory transfers from units in other sectors).”
In other words, governance is about leadership, government about leadership and implementation alike, while public management is about implementation. The results of leadership and implementation give the measure of the quality of governance (QoG) (Figure 1.1.).
1.2. What is the new public management?The “shift in public management styles” (or public management reform) “consists of
deliberate changes to the structures and processes of public sector organizations with the objective of getting them (in some sense) to run better” (Pollitt, Bouckaert, 2004, p. 8).
Structural change includes:Ø Retrenchment or downsizing the public sector organizations (Polidano, 1999, p. 5);Ø Merging or splitting the departments, in order to improve coordination or to
sharpen focus and encourage specialisation (Pollitt, Bouckaert, 2004, p. 8);Ø Privatisation (Polidano, 1999, p. 5);Ø Decentralisation (Hood, 1991);Ø Corporatisation or agentification (Polidano, p. 6),
while process change includes:Ø Hands-on professional management (Hood, 1991);Ø Private sector styles of management practice (Hood, 1991), but moderation in
running government like a business (Box, 1999);Ø Flexibilization of previous practices in personnel, IT, public procurement and other
functions, generated by the disaggregation (Dunleavy et al 2005); Ø The use of market-type mechanisms (OECD, 2005b);Ø Liberalisation (OECD, 2005b); Ø Modernisation of services delivery mechanisms (e.g. introduction of the e-
government, one-stop-shops) (OECD, 2003a);
Governance +Government- > strategies,
policies, regulations
Government+Public management
->strategies, policies, programs, projects
Results, quality of
governance
Leadership Implementation
Figure 1.1.: Relationship between public management (new or old), governance and government
Source: Own representation.

Paper for the Conference organized by the SOG and the QoG Institute, University of Gothenburg –New Public Management and the Quality of Government, November 13-15, 2008
6
Ø New financial management procedures (OECD, 2005b);Ø New performance management procedures (OECD, 2005b);Ø Explicit standards and measures of performance (Hood, 1991);Ø Output controls (Hood, 1991);Ø Parsimony in resource use (Hood, 1991);Ø Competition (Hood, 1991, Dunleavy, 2005);Ø Incentivization (Dunleavy, 2005);Ø Public value management (Stoker, 2006), and public value pragmatism (Alford,
Hughes, 2008), generated by: - networked governance or collaborative government or public-private
partnerships or joined-up government (Pollitt, 2003, p. 35, Agranoff&McGuire, 2003, Bardach, 1998, Mandell, 2001, Perri 6, 2004, Stoker, 2006);
Ø Fostering dialogue with civil society (i.e.: information, consultation, active participation – Shah, 2005, p. 220, OECD, 2003b), as a result of:- Building open government and a citizen-centered governance (i.e.:
accountability, transparency, openness – OECD, 2003b);- Developing a comprehensive legislative or regulatory framework for
enhancing transparency and accountability of lobbying (OECD, 2008b).4
Some of the changes mentioned above hide “traps” or weaknesses of the NPM. Privatisation, decentralisation, corporatisation and agentification in the absence of
strong independent and autonomous monitoring institutions generate corruption and abuses. Incentivization in the absence of disincentivization, as well as the reverse, may lead to failures. Networked governance, collaborative government, public-private partnerships or joined-up government cannot survive in the absence of trust between partners. And one cannot speak of quality of governance without skilled, competent, honest, and impartial civil servants and officials.
In order to achieve high degrees of impartiality and performance in the public sector, the monitoring and controlling of its activities by independent authorities, on the basis of the incentivization - disincentivization tandem, are essential.
1.3. Which is the relationship between the NPM and the NIE?The permanent adaptation of the NPM has been briefly defined in a sentence:
“different circumstances demand different managerial tools”. This represents “public value pragmatism” (Alford, Hughes, 2008, p. 141), having as a basis the contingency theory, part of the new institutional economics (NIE).
The instruments of the NIE: contingency theory, public choice, collective action, transaction costs, social capital, path dependency, property rights, comparative institutional
4 The USA, Canada, Australia have more experience in the field of lobbying than the European countries. It was only in 2006 that the European Commission adopted a Green Paper referring to lobbyism. (European Commission, 2006b). At the date of the adoption of the European Transparency Initiative, Germany was the only member state that had formal rules on registration of lobbyists. After that date, Denmark and Poland developed regulations on lobbying as well.

Paper for the Conference organized by the SOG and the QoG Institute, University of Gothenburg –New Public Management and the Quality of Government, November 13-15, 2008
7
analysis, rent-seeking, commons, governance and so on represent concepts used by the NPM, and they are the “language” itself of the NPM.
Relying on Talbot’s “consilience” theory (2005), we argue in favour of a holistic approach of: public policy, governance or meta-governance (coordinated governance) 5 , administration, and management. This “aggregate”, interacting with sciences like: economics, sociology, political sciences, law, management, psychology, uses the specific terminology ofthe new institutional economics (NIE).
1.4. Which is the key mechanism of the NPM?People (political leaders and civil servants) are those who manage public resources by
issuing and implementing policies, strategies, programs, projects. People (civil society) are those who benefit from the results as well. That is why people are viewed as the key mechanism of the NPM: people for people.
The NPM needs competent and committed managers, which implement policies and provide services to the public in ways that are:
Ø Low cost – economical;Ø Maximizing outputs within budgets through good work practice – efficient;Ø Satisfying clients/customers with quality – effective;Ø Seen as friendly, fair and honest – ethical;Ø Open, keeping the public well informed – accountable (to end users); andØ Consultative, taking into account priorities of clients (including those of the
disadvantaged categories) – responsive;Ø Adaptable, selecting what appears to generate positive outcomes and giving up
what is harmful for the economy, for the society, for the environment – eclectic.(Osborne, 2001, p. 637, Polidano, 1999, p. 32).
1.5. Are the NPM patterns static or dynamic?The unprecedented development of the information and communication technologies
(ICT), globalisation, and global problems like: climate change, financial crisis, poverty, food crisis, terrorism etc. contribute to the ceaseless adaptation of the NPM-patterns. We can speak nowadays of global public management or global governance (GPM, GG)6, knowledge public management or knowledge governance (KPM, KG)7, electronic public management (e-PM), crisis/contingency public management (CPM) and so on. Some scholars have coined the phrase “post-NPM” (Christensen, Lægreid, 2008, Alford, Hughes, 2008, Dunleavy et al., 2005), while Dunleavy et al. go further and speak even about the “death of the NPM” and the “construction of the digital era governance”. Other academics consider that the new governance based on networks replaced the NPM based on markets (Steurer, 2007, p. 208). Our opinion is that in spite of the continuous change of the NPM styles, its key mechanisms remain the same.
5 Metagovernance is a way of enhancing coordinated governance in a fragmented political system based on a high degree of autonomy for a plurality of self-governing networks and institutions (Sørensen, 2006, p. 100)6 i.e.: the common actions of governments, international organisations, NGOs, private players and/or citizens, in order to find global solutions for global problems. 7 i.e.: the process of applying the knowledge economy at the level of public administration.
Paper for the Conference organized by the SOG and the QoG Institute, University of Gothenburg –New Public Management and the Quality of Government, November 13-15, 2008
8
1.6. How heterogeneous are the NPM-patterns? and1.7. Why do we need international comparisons?At the global level, the NPM-patterns in rich countries (e.g. OECD group) are
different from those in developing or least developed countries, or those encompassing supranational institutions, like the European Commission.
The European Commission, for example, has to deal with its own “management
deficit” (Metcalfe, 2000, p. 123, Metcalfe, 2001, p. 419). The recent enlargement waves,
accompanied by the expansion of the complexity and diversity of the EU, contributed to the
increase of this “management deficit”.
In the aftermath of the Santer Commission, a strong emphasis was put on the reform of
its priorities, structure, organization and management (Metcalfe 2001, p. 419). The first steps
were taken in 2000, when the European Commission adopted the Lisbon Growth and Jobs
Strategy (re-launched in 2005) and a White Paper on reforming the Commission (European
Commission, 2000a and 2000b), followed by a White Paper on European Governance
(European Commission, 2001) and a Green Paper on European Transparency (European
Commission, 2006).
At the leadership level, all the EU member states have the same purposes (EU, 2006,
article 2):
- A harmonious, balanced and sustainable development of economic activities,
- A high level of employment and of social protection,
- Equality between men and women,
- Sustainable and non-inflationary growth,
- A high degree of competitiveness and convergence of economic performance,
- A high level of protection and improvement of the quality of the environment,
- The raising of the standard of living and quality of life, and
- Economic and social cohesion and solidarity among Member States.
But due to the principles of subsidiarity and proportionality (EU, 2006, article 5)8,
each member state may adopt its own public management style in order to achieve the above-
8 “The Community shall act within the limits of the powers conferred upon it by this Treaty and of the objectives assigned to it therein.In areas which do not fall within its exclusive competence, the Community shall take action, in accordance with the principle of subsidiarity, only if and in so far as the objectives of the proposed action cannot be sufficiently achieved by the Member States and can therefore, by reason of the scale or effects of the proposed action, be better achieved by the Community.Any action by the Community shall not go beyond what is necessary to achieve the objectives of this Treaty (principle of proportionality).”
Paper for the Conference organized by the SOG and the QoG Institute, University of Gothenburg –New Public Management and the Quality of Government, November 13-15, 2008
9
mentioned principles. That explains why, from the present-day stage to a common European
NPM, there is still a long way.
Besides, there are variations even within a country, sectorally and over time (Polidano, p. 31). All these point to the fact that there is no unitary NPM model (Polidano, 1999, p. 5).
In spite of the heterogeneity of the NPM-styles, there are academics that have identified forms of NPM-convergence: more accentuated at discourse and decision levels, and more limited or not enough explored at the level of practice and results (Pollitt, 2002).
This leads to a complex comparative analysis (and hundreds of composite indexes), not only for theory’s sake, but also aimed at diminishing the deficiencies of the NPM, and generating examples of “best practices”.
The academic analyses of the NPM movement range from NPM-archetype-countries (e.g.: Australia, New Zealand, UK, USA, Canada), to NPM-importer-countries (e.g.: Malaysia, Chile, Ghana, Nigeria, Uganda), or NPM-resistant-countries (e.g. Japan), and from praxis to theories like: network governance, joined-up government, public value pragmatism, meta-governance.
The “policy transfer” from “best practices” of developed countries to developing countries is trendy and it is encouraged by the international and aid agencies. Nevertheless, this transfer led to many failures, especially in countries with no:
- Stable macroeconomic environment;- Redistributive tax base;- Rules based system;- Transparent and accountable public policy process;- Clear separation of powers between executive, legislature, and judiciary;- Appropriate financial and human resources.(Common, 1998, Hood and Scott, 2000, Minogue, 2005, Minogue and Cariño, 2006, OECD, 2005b). Polidano (1999, p. 4) underlines that, “while many developing countries have taken up
elements of the NPM agenda, they have not adopted anything close to the entire package; and they are simultaneously undertaking reforms that are unrelated or even contrary to that agenda. The NPM is only one among a number of contending strands of reform in the developing world.”
The above-mentioned assertion is true for most of the developing countries, with one notable exception: the new member states (NMS) of the EU, still having the status of developing countries (Bulgaria, the Czech Republic, Estonia, Hungary, Latvia, Lithuania, Poland, Romania, and the Slovak Republic). 9 Through the adoption of the EU legislation (Acquis Communautaire), these countries have embraced new formal rules, including the general rules of the EU NPM. In other words, at the formal level, all the elements of the NMP agenda have been taken up. The problem remains at the informal level. North (1990), Aoki (2001), Acemoglu (2008) affirm that the failures recorded in different transition periods are due to the tensions between the new formal rules and the old informal ones. The NMS experience confirms these assertions thoroughly.
9 According to the IMF (2008), Cyprus, Malta and Slovenia are advanced economies.

Paper for the Conference organized by the SOG and the QoG Institute, University of Gothenburg –New Public Management and the Quality of Government, November 13-15, 2008
10
Figure 1.2.: Essence of the NPM
Source: Adapted from Andrews (2005, pp. 31-34), Shah (2005, p. 214), Alford and Hughes (2008, p. 130), Polidano (1999, pp. 5, 26), Acemoglu (2008), QoG Institute, OECD (2005), and personal considerations.
NPM country „i“, moment „t“,VALUES, MISSIONS, GOALS
Global conjuncture, technical progress, economical, political
and social realities
System of international relations* Fundamental causes **
* System of the international relations: relations of the country “i” with the international organisations,countries, groups of countries, governed by contracts.** Fundamental causes: “luck”, geographical, institutional, cultural differences, history (Acemoglu, 2008).
Strategies, programs, projects
Inputs(human and
financial resources)
Activities/outputs:- Services delivery(education, health, infrastructure, utilities);- Financial management;- Performance management;- Representation;- Enforcement of contracts, property rights.
Outcomes, impact / the QoG:- accountability; - efficiency; - effectiveness; - economy; - eclecticism; - equity; - ethic;
- control of corruption; - honesty; - impartiality; justice; - openness;- reliability; - responsiveness; - trustworthiness; etc.
- well-being of all citizens.
Result-oriented approach (results-oriented management and evaluation or ROME framework) / outcomes management / public value pragmatism
ENABLING ENVIRONMENT
OPERATIONAL CAPACITY
National environmentPrivate sector
NGOsCitizens
Institutions

Paper for the Conference organized by the SOG and the QoG Institute, University of Gothenburg –New Public Management and the Quality of Government, November 13-15, 2008
11
In conclusion, as “a chain is only as strong as its weakest link”, the strength of the NPM is given by the human resource component. The civil servants and officials should be skilled, competent, honest, and impartial. Unfortunately, the only form of intelligence “100% impartial” is the artificial intelligence, but the CIT will never be able to completely undertake the work of the civil servants and officials. E-government is a great step forward, but this isnot sufficient. In order to achieve high degrees of impartiality and performance in the public sector, the monitoring and controlling of its activities by independent authorities, on the basis of the incentivization - disincentivization tandem, are essential.
2. Assessing NPM through Comparative Analyses As the NPM has become more “result-oriented”, the importance of the “results
measuring” process (i.e. performance management) has increased. First, one has to measure the results, in order to re-launch strategies and policies. Second, the composite indicators have become increasingly important to development assistance and to the international support of democratic and economic reforms. For example, the approval or rejection of development projects by international financial institutions depends on national performance indicators, these being a precondition for the disbursement of funds. Third, decisions related to foreign direct investments (FDI) in a country or another are based on international comparisons.
Nevertheless, the power of generating awards and punishments (“carrot-and-stick”policies) at national level on the basis of composite indicators is still low. And there are other weaknesses of “measurement”, especially at the methodological level, e.g.:
- Trend analysis cannot be based on data from different editions of the reports, as methodologies are periodically improved and the country coverage is continuously enlarged, in other words, the longitudinal analyses are difficult to realise;
- Most of the indicators have as a basis the national statistics, which are frequently“cosmeticized” and do not reflect the reality;
- In most cases, data represent subjective opinions of the international experts;- Some information is out-of-date (e.g. UNDP, presents in 2008 data from 2005),
but this is not a serious “minus”, as significant progress cannot occur in several years. In a short period of time, a worsening of the situation is more probable to occur than an improvement.
The Hood’s remark (1995, p. 98), that “there are no systematic cross-national studies showing degrees of variation in public management reform in a robust and reliable way”, is still valid at the beginning of the 21st century. Such a complex study could be made only by a team of experts from all the analysed countries. Instead, a comparative analysis of the resultsof public management reforms in different countries is feasible and useful at the same time.
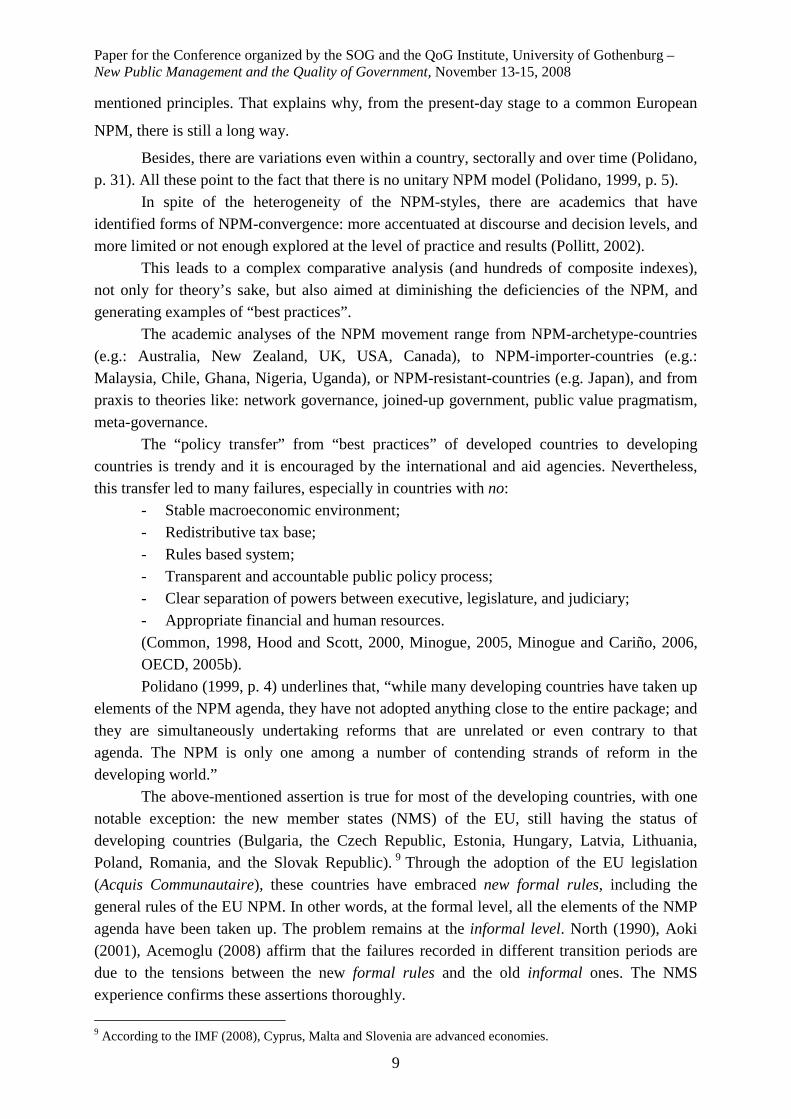
In this paper we present a set of eight indicators/indexes (Table 2.1):Ø Human Development Index (HDI), elaborated by the United Nations Development
Program;Ø e-Government Index (EGI), compiled by the United Nations;Ø Corruption Perceptions Index (CPI), developed by Transparency International;Ø Worldwide Governance Indicators (WGI), elaborated by the World Bank;

Paper for the Conference organized by the SOG and the QoG Institute, University of Gothenburg –New Public Management and the Quality of Government, November 13-15, 2008
12
Ø Transition Indicators (TI), elaborated by the European Bank for Reconstruction and Development;
Ø Global Competitiveness Index (GCI), developed by World Economic Forum;Ø Bertelsmann Transformation Index (BTI), issued by Bertelsmann Foundation; and Ø Index of Freedom in the World (IFW), elaborated by Freedom House.
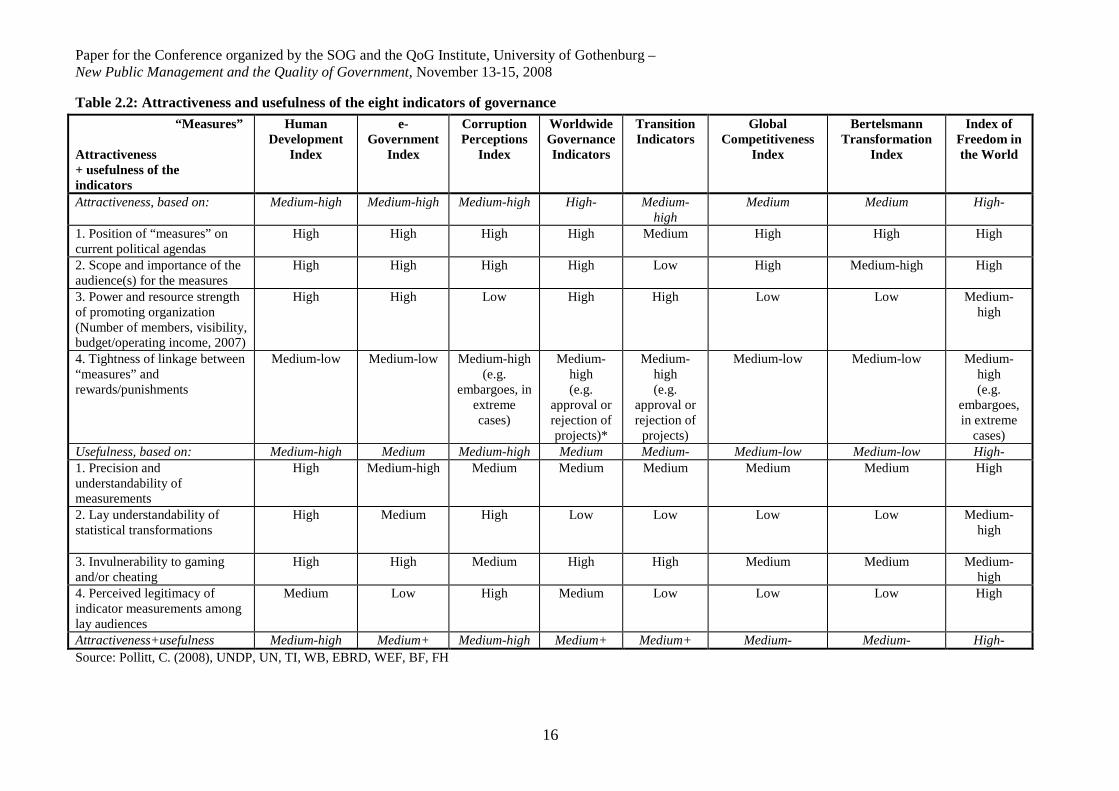
Following Pollitt’s exercise (2008), we have classified the above-mentioned indicators according to their attractiveness and usefulness (Table 2.2), on a scale from “low” to “high”, going through 7 intermediary stages: “low+”, “medium-low”, “medium-“, “medium”, “medium+”, “medium-high”, “high-“, as follows:
Figure 2.1: Attractiveness + usefulness of the eight indicators
Source: Pollitt (2008), own perceptions.
Concerning attractiveness, almost all indicators (the only exception: TI) received high scores at two criteria: position of “measures” on current political agendas and scope and importance of the audience(s) for the measures. For the other two criteria, power and resource strength of promoting organization and tightness of linkage between “measures” and rewards/punishments, the scores vary considerably.
Regarding usefulness, due to the lower scores recorded by most of the indicators at lay understandability of statistical transformations and perceived legitimacy of indicator measurements among lay audiences, the usefulness scores are generally lower than attractiveness.
Low Low+Medium-
low Medium- Medium Medium+ High-Medium-
high High
HDI,CPI
EGI,TI,
WGI
GCI,BTI
IFW
Paper for the Conference organized by the SOG and the QoG Institute, University of Gothenburg –New Public Management and the Quality of Government, November 13-15, 2008
13
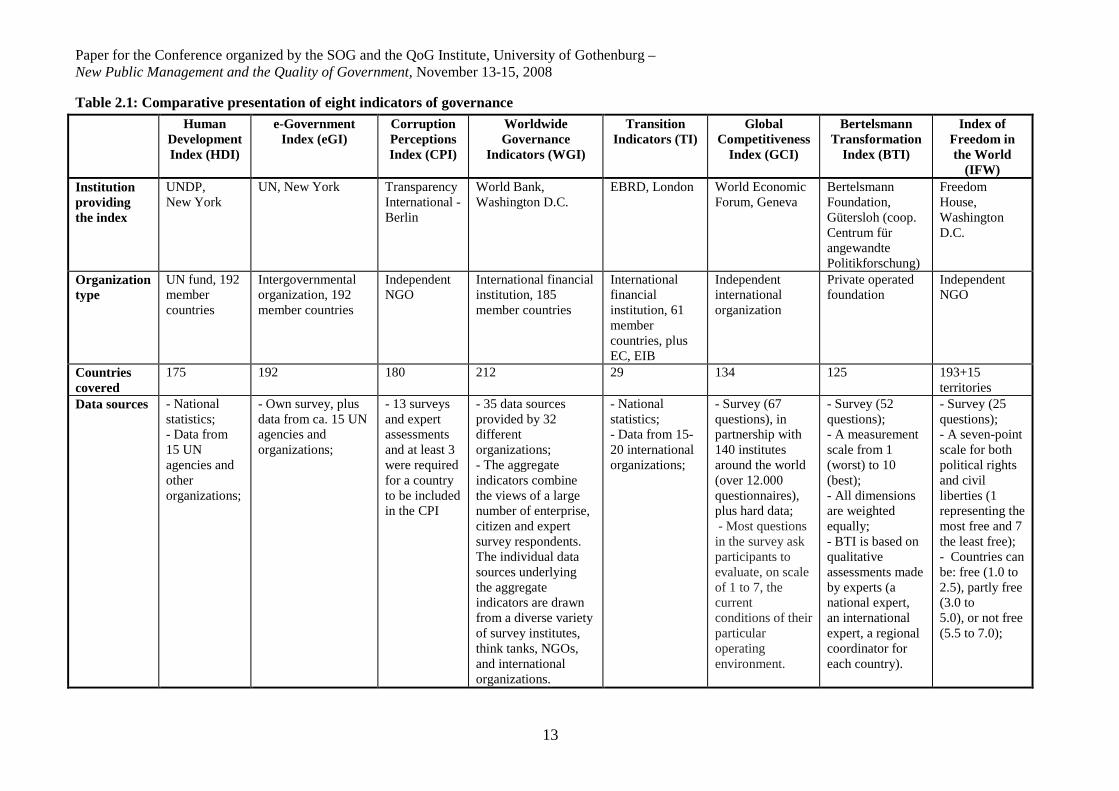
Table 2.1: Comparative presentation of eight indicators of governance
Human Development Index (HDI)
e-Government Index (eGI)
Corruption Perceptions Index (CPI)
Worldwide Governance
Indicators (WGI)
Transition Indicators (TI)
Global Competitiveness
Index (GCI)
Bertelsmann Transformation
Index (BTI)
Index of Freedom in the World
(IFW)Institution providing the index
UNDP, New York
UN, New York Transparency International -Berlin
World Bank, Washington D.C.
EBRD, London World Economic Forum, Geneva
Bertelsmann Foundation, Gütersloh (coop. Centrum für angewandte Politikforschung)
Freedom House,Washington D.C.
Organization type
UN fund, 192 member countries
Intergovernmental organization, 192 member countries
Independent NGO
International financial institution, 185 member countries
International financial institution, 61 member countries, plus EC, EIB
Independent international organization
Private operated foundation
Independent NGO
Countries covered
175 192 180 212 29 134 125 193+15 territories
Data sources - National statistics;- Data from 15 UN agencies and other organizations;
- Own survey, plus data from ca. 15 UN agencies and organizations;
- 13 surveys and expert assessments and at least 3 were required for a country to be included in the CPI
- 35 data sources provided by 32 different organizations;- The aggregate indicators combine the views of a large number of enterprise, citizen and expert survey respondents. The individual data sources underlying the aggregate indicators are drawn from a diverse variety of survey institutes, think tanks, NGOs, and international organizations.
- National statistics;- Data from 15-20 international organizations;
- Survey (67 questions), in partnership with 140 institutes around the world (over 12.000 questionnaires), plus hard data;- Most questions
in the survey ask participants to evaluate, on scale of 1 to 7, the currentconditions of their particular operating environment.
- Survey (52 questions);- A measurement scale from 1 (worst) to 10 (best);- All dimensions are weighted equally;- BTI is based onqualitative assessments made by experts (a national expert, an international expert, a regional coordinator for each country).
- Survey (25 questions);- A seven-point scale for both political rights and civil liberties (1representing the most free and 7the least free);- Countries can be: free (1.0 to 2.5), partly free (3.0 to5.0), or not free (5.5 to 7.0);

Paper for the Conference organized by the SOG and the QoG Institute, University of Gothenburg –New Public Management and the Quality of Government, November 13-15, 2008
14
Human Development Index (HDI)
e-Government Index (eGI)
Corruption Perceptions Index (CPI)
Worldwide Governance
Indicators (WGI)
Transition Indicators (TI)
Global Competitiveness
Index (GCI)
Bertelsmann Transformation
Index (BTI)
Index of Freedom in the World
(IFW)Period 1975-2005 2001-2008 1995-2008 1996-2007 1989-2007 1979-2007 1996-2007 1972-2007Main dimensions of the index
- Life expectancy at birth;
- Adult literacy rate;
- Combined primary, secondary and tertiary gross enrolment ratios;
- GDP per capita (PPP, US dollar)
e-government readiness
- Web measure index->Assessments based on a questionnaire, which allocated a binary value to the indicator based on the presence/absence of specific e-facilities or services available(stages: emerging, enhanced, interactive, transactional, connected);
-Telecommunication infrastructure index -> Composite weightedaverage of five primary indicators = 1/5x(PC index) + 1/5x(Internet user index) + 1/5x(Telephone line index) + 1/5x(Mobile user index) +
- The CPI measures the perceived levels of public-sector corruption in agiven country and is a composite index, drawing on different expert and business surveys;- The 2008CPI scores 180 countries (the same number as the 2007 CPI) on a scale from zero (highly corrupt) toten (highly clean).
- Voice and Accountability,
- Political Stability and Absenceof Violence/Terrorism,
- Government Effectiveness,
- Regulatory Quality,
- Rule of Law, and
- Control ofCorruption.
- Large-scale privatisation;
- Small-scale privatisation;
- Governance and enterprise restructuring;
- Price liberalisation;
- Trade and foreign exchange system;
- Competition policy;
- Banking reform and interest rate liberalisation;
- Securities markets and non-bank financial institutions;
- Institutions;
- Infrastructure;
- Macroeconomic stability;
- Health and primary education;
- Higher education and training;
- Goods market efficiency;
- Labour market efficiency;
- Financial market sophistication;
- Technological readiness;
- Market size;
- Business sophistication;
- Innovation.
- Status of development toward constitutional democracy;
- Status of development toward a market economy flanked by socio-political safeguards;
- Management of development and transformation processes.
Democracy:- Stateness;- Political participation;- Rule of law;- Stability of democratic institutions;- Political and social integration;(18 questions)
- Political rights (10 questions):Electoral Process (3 questions), Political Pluralism and Participation (4), and Functioning of Government (3);
- Civil liberties (15 questions):Freedom of Expression and Belief (4 questions), Associational and Organizational Rights (3), Rule of Law (4), and Personal Autonomy and Individual Rights (4).

Paper for the Conference organized by the SOG and the QoG Institute, University of Gothenburg –New Public Management and the Quality of Government, November 13-15, 2008
15
Human Development Index (HDI)
e-Government Index (eGI)
Corruption Perceptions Index (CPI)
Worldwide Governance
Indicators (WGI)
Transition Indicators (TI)
Global Competitiveness
Index (GCI)
Bertelsmann Transformation
Index (BTI)
Index of Freedom in the World
(IFW)1/5x(Broadband Index);- Human capital index-> Composite weightedaverage of two indicators = 2/3x(adult literacy rate) + 1/3x(gross enrolment ratio);
e-participation indexAssessment of 21 services and facilities under three categories: e-information, e-consultation and e-decision-making.
- Infrastructure reform;
The transition indicator scores reflect the judgment of the EBRD’s Office of the Chief Economist about country-specific progress in transition. The measurement scale for the indicators ranges from 1 to 4+, where 1 represents little or no change from a rigid centrally planned economy and 4+ represents the standards of an industrialised market economy.
Three stages of development:- Factor driven;- Efficiency driven;- Innovation driven.
Market economy:- Level of socio-economic development;- Organization of the market competition;- Currency and price stability;- Private property;- Welfare regime;- Economic performance;- Sustainability;(14 questions)
Transformation management:- Level of difficulty;- Steering capability;- Resource efficiency;- Consensus building;- International cooperation;(20 questions).
- The findings are reached after a multilayered process of analysis and evaluation of ca. 200 sources by a team of over 50 regional experts and scholars.
Source: UNDP, UN, TI, WB, EBRD, WEF, BF, FH
Paper for the Conference organized by the SOG and the QoG Institute, University of Gothenburg –New Public Management and the Quality of Government, November 13-15, 2008
16
Table 2.2: Attractiveness and usefulness of the eight indicators of governance
“Measures”
Attractiveness+ usefulness of the indicators
Human Development
Index
e-Government
Index
Corruption Perceptions
Index
Worldwide Governance Indicators
Transition Indicators
Global Competitiveness
Index
Bertelsmann Transformation
Index
Index of Freedom in the World
Attractiveness, based on: Medium-high Medium-high Medium-high High- Medium-high
Medium Medium High-
1. Position of “measures” on current political agendas
High High High High Medium High High High
2. Scope and importance of the audience(s) for the measures
High High High High Low High Medium-high High
3. Power and resource strength of promoting organization(Number of members, visibility, budget/operating income, 2007)
High High Low High High Low Low Medium-high
4. Tightness of linkage between “measures” and rewards/punishments
Medium-low Medium-low Medium-high(e.g.
embargoes, in extreme cases)
Medium-high(e.g.
approval or rejection of projects)*
Medium-high(e.g.
approval or rejection of
projects)
Medium-low Medium-low Medium-high(e.g.
embargoes, in extreme
cases)Usefulness, based on: Medium-high Medium Medium-high Medium Medium- Medium-low Medium-low High-1. Precision and understandability of measurements
High Medium-high Medium Medium Medium Medium Medium High
2. Lay understandability of statistical transformations
High Medium High Low Low Low Low Medium-high
3. Invulnerability to gaming and/or cheating
High High Medium High High Medium Medium Medium-high
4. Perceived legitimacy of indicator measurements among lay audiences
Medium Low High Medium Low Low Low High
Attractiveness+usefulness Medium-high Medium+ Medium-high Medium+ Medium+ Medium- Medium- High-Source: Pollitt, C. (2008), UNDP, UN, TI, WB, EBRD, WEF, BF, FH

Paper for the Conference organized by the SOG and the QoG Institute, University of Gothenburg –New Public Management and the Quality of Government, November 13-15, 2008
17
2.1. Human Development Index (HDI)Compiled by UNDP for 175 countries, plus Hong Kong-China and the Palestinian
Authority, for the period 1975-2005, the composite index HDI has four main dimensions:- Life expectancy at birth;- Adult literacy rate;- Combined primary, secondary and tertiary gross enrolment ratios;- GDP per capita (PPP, US dollar).According to the HDI, the ‘champion’ countries are: Iceland (0,968), Norway,
Australia, Canada, Ireland, Sweden, Switzerland, Japan, Netherlands and France (0,952) – 7 European countries, out of which 4 EU-countries.
All the EU-15 countries are among the first 30 countries in the hierarchy (Graph 2.1), while the NMS occupy positions ranking between 27 and 60 (Graph 2.2). All the EU-27 countries are characterized by high human development.
Graph 2.1: HDI for the EU-15 countries, 1985, 1990, 1995, 2000 and 2005
0,75 0,8 0,85 0,9 0,95 1
5. Irleland
6. Sweden
9. Netherlands
10. France
11. Finland
13. Spain
14. Denmark
15. Austria
16. UK
17. Belgium
18. Luxembourg
20. Italy
22. Germany
24. Greece
29. Portugal
1985
1990
1995
2000
2005
Source: UNDP (2007).
Among the EU-15 countries, Ireland has had the most spectacular evolution, being able to advance from the last but one position in the EU-15 group in 1985 to the first position in 2005.
In contrast with Ireland, several NMS (the Baltic States, Bulgaria and Romania) did not manage to have a continuous positive evolution, and, as a result, lag behind.

Paper for the Conference organized by the SOG and the QoG Institute, University of Gothenburg –New Public Management and the Quality of Government, November 13-15, 2008
18
Graph 2.2: HDI for the NMS, 1985, 1990, 1995, 2000 and 2005
0,65 0,7 0,75 0,8 0,85 0,9 0,95
27. Slovenia
28. Cyprus
32. Czech Republic
34. Malta
36. Hungary
37. Poland
42. Slovakia
43. Lithuania
44. Estonia
45. Latvia
53. Bulgaria
60. Romania
1985
1990
1995
2000
2005
Source: UNDP (2007).
With a HDI of 0.813, Romania ranks the 60th. It is, however, better positioned at adult literacy rate (position 26), than GDP per capita (position 63), combined primary, secondary and tertiary gross enrolment ratio (position 70), and life expectancy at birth (position 76).
2.2. The e-Government Index (eGI)The Department of Economic and Social Affairs of the United Nations defines e-
government as: utilizing the internet and the world-wide-web for delivering government information and services to citizens (UN and ASPA, 2001, p. 1).
Measured by the United Nations for 192 countries and territories for the time span 2001-2008, and based on a standard methodology, the EGI captures two sub-indicators:
- e-government readiness, calculated on basis of: web measure index, telecommunication infrastructure index and human capital index;- e-participation index, calculated on basis of the assessment of 21 services and facilities grouped under three categories: e-information, e-consultation and e-decision-making.The web measure index provides the countries analysed with a comparative ranking
of their ability to deliver online services to their citizens. (UN, 2008, p. 15). There are five stages in the e-Government evolution: emerging, enhanced, interactive, transactional, and connected (Figure 1). The web measure survey assessments are based on a questionnaire, which allocates a binary value to the indicator based on the presence vs. absence of specific e-facilities or services available.

Paper for the Conference organized by the SOG and the QoG Institute, University of Gothenburg –New Public Management and the Quality of Government, November 13-15, 2008
19
Figure 2.2: Stages of the e-Government evolution
Connected
Transactional
Interactive
Enhanced
Emerging
Connected
Transactional
Interactive
Enhanced
Emerging
Source: UN (2008, p. 15).
The telecommunication infrastructure index, a composite index of five primary indices, is calculated as:
1/5x(PC index) + 1/5x(Internet user index) + 1/5x(Telephone line index) + 1/5x(Mobile user index) + 1/5x(Broadband index).The human capital index is the composite weighted average of two indicators:2/3x(adult literacy rate) + 1/3x(gross enrolment ratio).As of 2008, Sweden ranks the first (0,9157) in the ranking of countries according to
the e-government readiness index, followed by Denmark, Norway, the United States, the Netherlands, the Republic of Korea, Canada, Australia, France and UK (0,7872) – 6 European countries, out of which 5 are EU members. Regionally, North America is on the first place (0,8408), followed by Northern Europe (0,7721), Western Europe (0,7329), and Eastern Asia (0,6443). At the EU-level, Western EU holds similar positions with Northern EU (0,76), while the Eastern EU lags behind (0,60) (Graph 2.3).
Graph 2.3: e-Government readiness index in Europe, 2003, 2005 and 2008
0,63
0,65
0,66
0,70
0,75
0,76
0,76
0,60
0,45
0 0,2 0,4 0,6 0,8 1
World
Eastern EU-27
NMS
Southern EU-27
Europe
EU-27
EU-15
Northern EU-27
Western EU-27
2003
2005
2008
Source: UN (2005 and 2008).

Paper for the Conference organized by the SOG and the QoG Institute, University of Gothenburg –New Public Management and the Quality of Government, November 13-15, 2008
20
According to the e-readiness index, Sweden is the leader of the Northern EU-27 and a global leader as well. The Netherlands ranks the first among the Western EU-27, the same holds true for Spain among the Southern EU-27, the Czech Republic among the Eastern EU-27, and Estonia among the NMS (Graphs 2.4 and 2.5).
Graph 2.4: e-Government readiness index in EU-15, 2003, 2005 and 2008
0,9157
0,9134
0,8631
0,8038
0,7872
0,7512
0,7488
0,7428
0,7296
0,7228
0,7136
0,6779
0,668
0,6479
0,5718
0 0,2 0,4 0,6 0,8 1
1. Sw eden
2. Denmark
5. Netherlands
9. France
10. United Kingdom
14. Luxembourg
15. Finland
16. Austria
19. Irleland
20. Spain
22. Germany
24. Belgium
27. Italy
31. Portugal
44. Greece
2003
2005
2008
Source: UN (2005 and 2008).
12 out of 27 member states of the EU scored worse in 2008 in comparison with 2005: UK, Finland, Austria, Germany, Belgium, Italy, and Greece, together with Slovenia, Malta, Hungary, Latvia and Romania.
Graph 2.5: e-Government readiness index in the EU NMS, 2003, 2005 and 2008
0,76
0,6696
0,6681
0,6617
0,6582
0,6485
0,6117
0,6019
0,5944
0,5889
0,5719
0,5383
0 0,1 0,2 0,3 0,4 0,5 0,6 0,7 0,8
13. Estonia
25. Czech Republic
26. Slovenia
28. Lithuania
29. Malta
30. Hungary
33. Poland
35. Cyprus
36. Latvia
38. Slovakia
43. Bulgaria
51. Romania
2003
2005
2008
Source: UN (2005 and 2008).

Paper for the Conference organized by the SOG and the QoG Institute, University of Gothenburg –New Public Management and the Quality of Government, November 13-15, 2008
21
Romania is at the beginning of its e-Government experience, ranking the last in the EU hierarchy, after countries like Cyprus, Latvia, Slovakia, Bulgaria and Greece. Nevertheless, it is interesting to note that, in spite of the reduced contributions of web measure index (0,4147) and infrastructure index (0,2992) at the e-Government index, the human capital index has a high value (0,9047). The political leaders should build on this resource, as at present, the anecdotal evidence underlines that almost 80% of the people younger that 25 intend to work abroad.
Concerning the e-participation index, the ranking aims to capture the dimensions of the interaction between government and citizens (G2C), by assessing the extent to which government proactively solicits citizens’ input (UN, 2008, p. 58).
The three dimensions of the e-participation index are:- e-information – answering the question: do governments provide the basic
information that serves as the foundation for citizens’ participation?- e-consultation – answering the question: do governments request citizens’
opinion?- e-decision-making – do governments take into account the citizens’ input when
making decisions?The USA ranks the first (with an index of 1 or 100%), and it represents the
comparison element for the other countries. It is followed by the Republic of Korea (0,9773), Denmark, France, Australia, New Zealand, Mexico, Estonia, Sweden and Singapore.
Graph 2.6: e-Government participation index in the EU-27, 2008
0
0,1
0,2
0,3
0,4
0,5
0,6
0,7
0,8
0,9
1
3. D
en
ma
rk
3. F
ran
ce
8. E
sto
nia
9. S
we
de
n
11
. Lu
xem
bo
urg
16
. Ne
the
rla
nd
s
20
. Au
stri
a
22
. Lith
ua
nia
25
. UK
28
. Be
lgiu
m
32
. Ma
lta
34
. Sp
ain
45
. Fin
lan
d
49
. Ire
lan
d
49
. Po
rtu
ga
l
55
. Ita
ly
55
. La
tvia
55
. Po
lan
d
55
. Slo
ven
ia
60
. Cze
ch R
ep
ub
lic
60
. Hu
ng
ary
74
. Ge
rma
ny
98
. Cyp
rus
98
. Gre
ece
11
6. S
lova
kia
13
5. B
ulg
ari
a
13
5. R
om
an
ia
Source: UN (2008).

Paper for the Conference organized by the SOG and the QoG Institute, University of Gothenburg –New Public Management and the Quality of Government, November 13-15, 2008
22
2.3. Corruption Perceptions Index (CPI)CPI Score, compiled for 180 countries, relates to perceptions of the degree of
corruption as seen by business people and country analysts, and ranges between 10 (highly clean) and 0 (highly corrupt). It has been measured by Transparency International, an independent NGO, since 1995. The main weaknesses of the index are the yearly change of methodology, which makes longitudinal analysis almost impossible, and the subjective assessment of data.
As of 2008, Sweden, Denmark and New Zealand, in a tie, rank the first, with a score of 9,3, being followed by Singapore (9,2), Finland (9,0), Switzerland (9,0), Iceland (8,9), Netherlands (8,9), Australia and Canada (each with a score of 8,7).
In the EU, the Northern and Western countries rank ahead of the Southern members and NMS. Slovenia and Estonia rank even ahead of Spain, Cyprus ahead of Portugal, Malta, the Czech Republic, Hungary, Slovakia, Latvia ahead of Italy and Greece, while Greece, Poland, Lithuania, Romania and Bulgaria are faced with a strong phenomenon of corruption (graph 2.7 and 2.8).
Graph 2.7: Corruption Perceptions Index (CPI) in the EU-15, 2008
4,7
4,8
6,1
6,5
6,9
7,3
7,7
7,7
7,9
8,1
8,3
8,9
9
9,3
9,3
0 2 4 6 8 10
57. Greece
55. Italy
32. Portugal
28. Spain
23. France
18. Belgium
16. Irleland
16. United Kingdom
14. Germany
12. Austria
11. Luxembourg
7. Netherlands
5. Finland
1. Denmark
1. Sw eden
Score
Source: Transparency International (2008).

Paper for the Conference organized by the SOG and the QoG Institute, University of Gothenburg –New Public Management and the Quality of Government, November 13-15, 2008
23
Graph 2.8: Corruption Perceptions Index (CPI) in the EU NMS, 2008
3,6
3,8
4,6
4,6
5
5
5,1
5,2
5,8
6,4
6,6
6,7
0 1 2 3 4 5 6 7 8
72. Bulgaria
70. Romania
58. Lithuania
58. Poland
52. Latvia
52. Slovakia
47. Hungary
45. Czech Republic
36. Malta
31. Cyprus
27. Estonia
26. Slovenia
Score
Source: Transparency International (2008).
2.4. Worldwide Governance Indicators (WGI)The World Bank compiles the WGI for 212 countries and territories over the period
1996–2007, taking into consideration six dimensions of governance:Ø Voice and Accountability – measuring perceptions of the extent to which a country's
citizens are able to participate in selecting their government, as well as freedom of expression, freedom of association, and a free media;
Ø Political Stability and Absence of Violence/Terrorism – assessing the likelihood that the government will be destabilized or overthrown by unconstitutional or violent means, including politically-motivated violence and terrorism;
Ø Government Effectiveness – measuring perceptions of the quality of public services, the quality of the civil service and the degree of its independence from political pressures, the quality of policy formulation and implementation, and the credibility of the government's commitment to such policies;
Ø Regulatory Quality – evaluating the ability of the government to formulate and implement sound policies and regulations that permit and promote private sector development;
Ø Rule of Law – assessing the extent to which agents have confidence in and abide by the rules of society, and in particular the quality of contract enforcement, property rights, the police, and the courts, as well as the likelihood of crime and violence;
Ø Control of Corruption – measuring perceptions of the extent to which public power is exercised for private gain, including both petty and grand forms of corruption, as well as "capture" of the state by elites and private interests.

Paper for the Conference organized by the SOG and the QoG Institute, University of Gothenburg –New Public Management and the Quality of Government, November 13-15, 2008
24
Based on a standard methodology, the WGI facilitate international comparisons, with a low standard error. The World Bank offers on the home page even the statistical and graphical tools necessary for longitudinal and cross-sectional analyses. Taking into consideration the variety and large number of sources, the degree of subjectivity is lower than in the case of other indexes (e.g. Corruption Perceptions Index).
The online data are presented in percentile ranks, reflecting the rank of a country among all countries in the world, 0 corresponding to the lowest rank, and 100 to the highest rank.
Poland, Bulgaria and Romania are situated in the 50th-75th percentile in all the six cases: voice and accountability, political stability, government effectiveness, regulatory quality, rule of law and control of corruption. Slovenia is in the 75th-90th percentile in all the cases, while the other countries record variable results (Graph 2.9).
In the case of Romania, in the time frame of 1996-2007, we witness the improvement of voice and accountability, government effectiveness, regulatory quality and control of corruption, while the political stability and rule of law ameliorate slowly (Graph 2.10). On the whole, the general trend is positive on the long-term for all the NMS.

Paper for the Conference organized by the SOG and the QoG Institute, University of Gothenburg –New Public Management and the Quality of Government, November 13-15, 2008
25
Graph 2.9: Hierarchies of the EU-15 and NMS (minus Cyprus and Malta), after the six dimensions of governance (WGI), 2007
90th-100th Percentile75th-90th Percentile50th-75th Percentile25th-50th Percentile
Source: Kaufmann, Kraay, Mastruzzi (2008).

Paper for the Conference organized by the SOG and the QoG Institute, University of Gothenburg –New Public Management and the Quality of Government, November 13-15, 2008
26
90th-100th Percentile75th-90th Percentile50th-75th Percentile25th-50th Percentile
Source: Kaufmann, Kraay, Mastruzzi (2008).

Paper for the Conference organized by the SOG and the QoG Institute, University of Gothenburg –New Public Management and the Quality of Government, November 13-15, 2008
27
90th-100th Percentile75th-90th Percentile50th-75th Percentile25th-50th Percentile
Source: Kaufmann, Kraay, Mastruzzi (2008).

Paper for the Conference organized by the SOG and the QoG Institute, University of Gothenburg –New Public Management and the Quality of Government, November 13-15, 2008
28
Graph 2.10: Evolution of the six dimensions of the governance (WGI) in the case of Romania, 1996-2007
Source: Kaufmann, Kraay, Mastruzzi (2008).

Paper for the Conference organized by the SOG and the QoG Institute, University of Gothenburg –New Public Management and the Quality of Government, November 13-15, 2008
29
2.5. Transition Indicators (TI)Compiled by the European Bank for Reconstruction and Development for the period
1989-2007, the Transition Indicators (TI) analyse four main reform fields (companies, markets and trade, financial sector and infrastructure) through 9 main dimensions:
Ø Large-scale privatisation;Ø Small-scale privatisation;Ø Governance and enterprise restructuring;Ø Price liberalisation;Ø Trade and foreign exchange system;Ø Competition policy;Ø Banking reform and interest rate liberalisation;Ø Securities markets and non-bank financial institutions;Ø Infrastructure reform.
The methodology enables cross-sectional, as well as longitudinal analyses for a group of 29 transition economies (including the EU NMS, with the exception of Cyprus and Malta).
Transition indicators have been used to track reform developments in all countries of operations since the beginning of transition. Progress is measured against the standards of industrialised market economies, while recognising that there is neither a “pure” market economy nor a unique end-point for transition.
The results of the analysis of the TI for the NMS are, somewhat, surprising, in comparison with WGI or CPI or HDI. According to TI, the progress of the reform process in Slovenia is the lowest among the NMS (Graph 2.11). But this does not prevent Sloveniafrom having the highest performance in terms of human development and the lowest level of corruption among the NMS! Is the case of Slovenia a paradox, or is the quality of reformsmore important than their pace, depth and scale? This rhetorical question seems to be the key to the understanding the NPM in the NMS, a topic that will be examined in other papers.
Graph 2.11: Average of the Transition Indicators, NMS (minus Cyprus and Malta), 2007
3,26
3,41
3,43
3,45
3,45
3,57
3,68
3,71
3,78
3,92
0,00 0,50 1,00 1,50 2,00 2,50 3,00 3,50 4,00 4,50
Slovenia
Bulgaria
Romania
Latvia
Lithuania
Slovakia
Poland
Czech Republic
Estonia
Hungary
Source: European Bank for Reconstruction and Development (2008).

Paper for the Conference organized by the SOG and the QoG Institute, University of Gothenburg –New Public Management and the Quality of Government, November 13-15, 2008
30
2.6. Global Competitiveness Index (GCI)Competitiveness is defined by the World Economic Forum (2008) as “the set of
institutions, policies, and factors that determine the level of productivity of a country. The level of productivity, in turn, sets the sustainable level of prosperity that can be earned by an economy. In other words, more competitive economies tend to be able to produce higher levels of income for their citizens.”
GCI, compiled by the World Economic Forum, has 12 pillars:Ø Institutions;Ø Infrastructure;Ø Macroeconomic stability;Ø Health and primary education;
Ø Higher education and training;Ø Goods market efficiency;Ø Labour market efficiency;Ø Financial market sophistication;Ø Technological readiness;Ø Market size;
Ø Business sophistication;Ø Innovation.
The latest methodology enables cross-sectional analyses among 134 countries. The longitudinal analyses are possible only for 2007 and 2008, due to the change of the methodology in 2007. As the index is based on a survey, as well as on “hard data”, its objectivity degree is high.
Table 2.3: Income thresholds for establishing stages of development
STAGE OF DEVELOPMENT GDP PER CAPITA (IN US$)
Stage 1 – factor driven <2000
Transition from stage 1 to stage 2 2000-3000
Stage 2 – Efficiency driven 3000-9000
Transition from stage 2 to stage 3 9000-17000
Stage 3 – Innovation driven >17000
Source: World Economic Forum (2008, p. 7).
The concept of stages of development is integrated into the Index by attributing higher relative weights to those pillars that are relatively more relevant for a country given its particular stage of development (World Economic Forum, 2008, p. 7).
The USA, with a score of 5,74, remain the most competitive economy in the world, in spite of the actual financial crisis, followed by Switzerland, Denmark, Sweden, Singapore, Finland, Germany, the Netherlands, Japan and Canada. All these economies are in the 3rd
stage of development. Out of 33 innovation-driven economies, 22 are European countries.
Basic requirements=Key for factor-driven economies
Efficiency enhancers=Key for efficiency-driven economies
Innovation and sophistication factors=Key for innovation-driven economies

Paper for the Conference organized by the SOG and the QoG Institute, University of Gothenburg –New Public Management and the Quality of Government, November 13-15, 2008
31
All the EU-15 countries are in the third stage of development (innovation-driven). The Scandinavian countries are standouts (Denmark, Sweden, Finland), followed by Germany, Netherlands and United Kingdom. The highest scores are those for basic requirements, followed by those for efficiency enhancers, and those for innovation factors. At innovationlevel, Germany, Sweden, Finland and Denmark lead the way (Graph 2.12).
Graph 2.12: Hierarchy of the EU-15, according to the overall GCI, with the indication of the innovation factors, efficiency enhancers, and basic requirements scores, 2007
4,11
4,35
4,47
4,72
4,85
4,99
5,14
5,22
5,23
5,3
5,41
5,46
5,5
5,53
5,58
0 1 2 3 4 5 6 7
67. Greece
49. Italy
43. Portugal
29. Spain
25. Luxembourg
22. Irleland
19. Belgium
16. France
14. Austria
12. United Kingdom
8. Netherlands
7. Germany
6. Finland
4. Sw eden
3. Denmark
Innovation factors
Eff iciency enhancers
Basic requirements
Overall index
Source: World Economic Forum (2008).
In the NMS, Estonia is the leader of the group, followed by the Czech Republic, Cyprus, Slovenia and Lithuania (Graph 2.13).
Bulgaria and Romania are in the second stage of development (efficiency driven), the Baltic States, Hungary, Poland and Slovakia are in the transition from 2 to 3, while Cyprus, Malta, the Czech Republic and Slovenia are in the third stage (innovation driven). At innovation, the Czech Republic, Slovenia, Estonia, Cyprus, and Lithuania are leaders of the group of NMS.

Paper for the Conference organized by the SOG and the QoG Institute, University of Gothenburg –New Public Management and the Quality of Government, November 13-15, 2008
32
Graph 2.13: Hierarchy of the NMS, after the overall GCI, with the indication of the innovation factors, efficiency enhancers, and basic requirements, 2007
4,03
4,1
4,22
4,26
4,28
4,31
4,4
4,45
4,5
4,53
4,62
4,67
0 1 2 3 4 5 6
76. Bulgaria
68. Romania
62. Hungary
54. Latvia
53. Poland
52. Malta
46. Slovakia
44. Lithuania
42. Slovenia
40. Cyprus
33. Czech Republic
32. Estonia
Innovation factors
Eff iciency enhancers
Basic requirements
Overall index
Source: World Economic Forum (2008).
2.7. Bertelsmann Transformation Index (BTI)Compiled by Bertelsmann Foundation, in cooperation with the Centre for Applied
Policy Research, the BTI is calculated for the period 1996-2007, for developing economies. Due to the change of the methodology and the permanent enlargement of the countries analysed, the longitudinal observations are not possible. The research is based on a 52-questions survey, using a measurement scale from 1 (worst) to 10 (best), and resorts to “hard data” of the international organizations and national statistics in subsidiary. The qualitative assessments are made by experts (a national expert, an international expert and a regional coordinator for each country). This leads to a high degree of subjectivity. Nevertheless, the cross-sectional analyses lead to interesting results.
The main pillars of the index are:Ø Status of development toward constitutional democracy (on the basis of: “stateness”,
political participation, rule of law, stability of democratic institutions, political and social integration);
Ø Status of development toward a market economy flanked by socio-political safeguards(level of socio-economic development, organization of the market competition, currency and price stability, private property, welfare regime, economic performance, sustainability);
Ø Management of development and transformation processes (level of difficulty, steering capability, resource efficiency, consensus building, and international cooperation). The breakdown of the transformation index into the three pillars emphasizes at the European level a stronger constitutional democracy status than the market economy one (with the exception of the Czech Republic, where the market economy status is 0,02 points higher than the constitutional democracy one), and a stronger market

Paper for the Conference organized by the SOG and the QoG Institute, University of Gothenburg –New Public Management and the Quality of Government, November 13-15, 2008
33
economy status than the management index. This underlines the difficulties encountered by the NMS in the field of public management.
The Czech Republic ranks the first among the 125 “transforming” economies, and it is followed by: Slovenia and Estonia, Taiwan, Hungary, Lithuania, Slovakia, Chile, Uruguay, and South Korea (Graph 2.14).
Graph 2.14: Hierarchy of the NMS, after the BTI, with the indication of the democracy status, market economy status, and management index, 2007
8,31
8,44
8,60
8,76
9,14
9,16
9,18
9,42
9,49
9,56
0,00 2,00 4,00 6,00 8,00 10,00 12,00
17. Romania
15. Bulgaria
13. Latvia
11. Poland
7. Slovakia
6. Lithuania
5. Hungary
3. Estonia
2. Slovenia
1. Czech Republic
Management index
Market economy status
Democracy status
Status index
Source: Bertelsmann Foundation (2008).
2.8. Index of Freedom in the World (IFW)Measured annually by Freedom House since 1972, the IFW assesses the political
rights and civil liberties among 193 countries and 15 territories. The methodology is accessible, and longitudinal analyses, combined with cross-country comparisons are possible for the time frame 1972-2007. All the historical data are available online, free of charge, in excel format, which increases the attractiveness of the index.
The methodology is based on a 25-questions survey, centred upon two main axes: Ø Political rights (10 questions), referring to: electoral process (3 questions), political
pluralism and participation (4), and functioning of government (3);Ø Civil liberties (15 questions), regarding: freedom of expression and belief (4
questions), associational and organizational rights (3), rule of law (4), and personal autonomy and individual rights (4).Each country and territory is assigned two numerical ratings – one for political rights
and one for civil liberties – based on a 1 to 7 scale (1, most free, 7, least free). Underlying those ratings are more detailed assessments of country situations based on a 40-point scale for political rights and a 60-point scale for civil liberties.

Paper for the Conference organized by the SOG and the QoG Institute, University of Gothenburg –New Public Management and the Quality of Government, November 13-15, 2008
34
All the EU-15 countries recorded after 2002 “complete free” status, with the exception of Greece.10 The Netherlands has been completely free since 1972, while Belgium, Ireland, Luxembourg, Sweden and the United Kingdom almost the whole interval 1972-present.
The pattern is different for the NMS-10 (the new member states, with the exception of Cyprus and Malta). Slovenia, Estonia, Lithuania, Latvia became independent in 1991, the Czech Republic and Slovakia separated in 1993, Hungary and Poland started from a “partly free” status, while Bulgaria and Romania from a “not free” status. At present, all these countries record a “free” status, with minor differences (Graph 2.14 and 2.15).
Graph 2.15: Political rights scores in the NMS minus Cyprus*, 1989-1991, 1998, 2007
7
4
1
4
7
1 1 1 1
2
1 1 1
2
1 1
0
1
2
3
4
5
6
7
8
Bu
lga
ria
Cz
ec
h R
ep
ub
lic
Es
ton
ia
Hu
ng
ary
La
tvia
Lith
ua
nia
Ma
lta
Po
lan
d
Ro
ma
nia
Slo
va
kia
Slo
ve
nia
PR 1989
PR 1990
PR 1991
PR 1998
PR 2007
* Cyprus (the Turkish, as well as the Greek part) has a free status since 2005. Source: Freedom House (2008).
Graph 2.16: Civil liberties scores in the NMS minus Cyprus*, 1989-1991, 1998, 2007
7
3
1
3
7
2
1 1 1 1 1 1 1
2
1 1
0
1
2
3
4
5
6
7
8
Bu
lga
ria
Cz
ec
h R
ep
ub
lic
Es
ton
ia
Hu
ng
ary
La
tvia
Lith
ua
nia
Ma
lta
Po
lan
d
Ro
ma
nia
Slo
va
kia
Slo
ve
nia
CL 1989
CL 1990
CL 1991
CL 1998
CL 2007
* Cyprus (the Turkish, as well as the Greek part) has a free status since 2005. Source: Freedom House (2008).
10 Greece evolved from “not free” status in 1972-1973 to “free status” in 1974, with political rights scoring 1 since 1989, but with civil liberties remaining at 2.
Paper for the Conference organized by the SOG and the QoG Institute, University of Gothenburg –New Public Management and the Quality of Government, November 13-15, 2008
35
CONCLUSIONS…
… related to the NPM:First, the academic analyses of the NPM movement range from NPM-archetype-
countries (e.g.: Australia, New Zealand, UK, USA, Canada), to NPM-importer-countries (e.g.: Malaysia, Chile, Ghana, Nigeria, Uganda), or NPM-resistant-countries (e.g. Japan), and from praxis to theories like: network governance, joined-up government, public value pragmatism, meta-governance.
Second, even at the EU level, dimensions of governance are heterogeneous and dynamic. One can notice stronger differences between the EU-15 and NMS, and weaker between countries belonging to each group.
Third, the process of transition from a centrally planned economy to a market-based economy takes time and it is accompanied by failures. Even though the NMS have adopted the Acquis Communautaire (i.e. the total body of the EU law), they continue to lag behind many of the older members of the EU in terms of quality of governance. At the formal level,all the elements of the NMP agenda have been taken up. The problems remain at the informal level, as the tensions between the new formal rules and the old informal ones are still very strong. Mentality cannot be changed on the short-term, even though the right institutions are in place. Nevertheless, the existing differences between the NMS (e.g. Slovenia, the Czech Republic, Cyprus, Malta in contrast with Poland, Lithuania, Romania and Bulgaria) underline that the change process is not uniform, and is dependent on the local conditions, people, traditions, mentalities.
Fourth, quality of reforms is more important than their pace, depth and scale. Fifth, the general trend, at least in Europe, is that of positive changes on the long-term. Sixth, people are the key mechanism of the chain named NPM, but its weakest link as
well. In order to achieve high degrees of impartiality and performance in the public sector, the monitoring and controlling of its activities by independent authorities, on the basis of the incentivization - disincentivization tandem, are essential.
Seventh, public policy, governance or meta-governance (coordinated governance), administration, management and their “aggregate” have as common language the New Institutional Economics (NIE).
… concerning the use of indexes for cross-cutting and longitudinal analysis:In spite of the weaknesses of “measurement”, like:- Trend analysis cannot be based on data from different editions of the reports, as
methodologies are periodically improved and the country coverage is continuously enlarged, in other words, the longitudinal analyses are difficult to realise;
- Most of the “hard data” rely on national statistics, which are often “cosmeticized” and do not reflect the reality;
- In the case of surveys, data represent subjective opinions of the international experts;
- Some information is out-of-date (e.g. UNDP, presents in 2008 data from 2005);

Paper for the Conference organized by the SOG and the QoG Institute, University of Gothenburg –New Public Management and the Quality of Government, November 13-15, 2008
36
- The power of generating awards and punishments (“carrot-and-stick” policies) at national level on the basis of composite indicators is still low,
the importance of the “results measuring” process (i.e. performance management) has been increasing, as the NPM has become more “result-oriented”. First, one has to measure the results, in order to re-launch strategies and policies. Second, the composite indicators have become increasingly important to development assistance and to the international support of democratic and economic reforms. For example, the approval or rejection of development projects by international financial institutions depends on national performance indicators, these being a precondition for the disbursement of funds. Third, decisions related to foreign direct investments (FDI) in a country or another are based on international comparisons.
Nevertheless, “there are no systematic cross-national studies showing degrees of variation in public management reform in a robust and reliable way” (Hood, 1995, p. 98).Such a complex study could be made only by a team of experts from all the analysed countries. And this is an invitation addressed to you, distinguished colleagues, to create a functional global research network.
… related to the future of the NPM:The way is wide open for the Global Public Management (GPM)…
References:
Acemoglu, D. (2008), Introduction to Modern Economic Growth, Department of Economics, Massachusetts Institute of Technology.Agranoff, R., & McGuire, M. (2003), Collaborative public management: New strategies for local governments.
Washington, DC: Georgetown University Press. [quoted by Alford, Hughes (2008)].Alford, J., Hughes, O. (2008), Public Value Pragmatism as the Next Phase of Public Management, The
American Review of Public Administration, volume 38, pp. 130-148.Andrews, M. (2005), Performance-Based Budgeting Reform, in: Fiscal Management, Public Sector Governance
and Accountability Series, edited by Shah, A., The World Bank, Washington D.C., pp. 31-70.Andrews, M., Shah, A. (2005), On Measuring the Net Worth of a Government, in: Fiscal Management, Public
Sector Governance and Accountability Series, edited by Shah, A., The World Bank, Washington D.C., pp. 191-210.
Aoki, M. (2001), Toward a Comparative Institutional Analysis, MIT Press, Cambridge.Bardach, E. (1998), Getting agencies to work together: The practice and theory of managerial craftsmanship.
Washington, DC: Brookings Institution Press. [quoted by Alford, Hughes (2008)].Bertelsmann Foundation (1998-2008), The Bertelsmann Transformation Index. Available at:
http://www.bertelsmann-transformation-index.de/11.0.html?&L=1.Box, R. C. (1999), Running Government like a Business: Implications for Public Administration Theory and
Practice, The American Review of Public Administration, vol. 29(1), pp. 19-43.Common, R. (1998), Convergence and Transfer: A Review of the Globalization of NPM, International Journal
of Public Sector Management, volume 11, no. 6, pp. 440-448.Dunleavy, P. Hood, C. (1994), From Old Public Administration to New Public Management, Public Money and
Management, Vol.14, No.3, pp. 9-16.Dunleavy, P., Margetts, H., Bastow, S., Tinkler, J. (2006), Digital era governance: IT corporations, the state and
e-government, Oxford University Press. Dunleavy, P., Margetts, H., Bastow, S., Tinkler, J. (2005), New Public Management is Dead – Long Live
Digital-Era Governance, EDS Innovation Research Programme, Discussion Paper Series, No. 004, Public Policy and Services, London.
European Bank for Reconstruction and Development (2007), “Transition Report”. Available at: http://transitionreport.co.uk/TRO/b/transition-report/volume2007/issue1.
European Commission (2007), Communication to the Spring European Council, Strategic Report on the Renewed Lisbon Strategy for Growth and Jobs: Launching the New Cycle (2008-2010). Keeping Up the Pace of Change, 11.12.2007.

Paper for the Conference organized by the SOG and the QoG Institute, University of Gothenburg –New Public Management and the Quality of Government, November 13-15, 2008
37
European Commission (2006b), Communication from the Commission, Green Paper: European Transparency Initiative, Brussels, 03.05.2006, COM(2006) 194 final.
European Commission (2001), Communication from the Commission, European Governance: A White Paper, Brussels, 25.07.2001, COM(2001) 428 final.
European Commission (2000a), Communication from the Commission, A White Paper: Reforming the Commission – Action Plan, Brussels, 01.03.2000, COM(2000) 200 final.
European Commission (2000b), Communication from the Commission, A White Paper: Reforming the Commission, Brussels, 05.04.2000, COM(2000) 200 final/2.
European Union (2006), Consolidated version of the Treaty Establishing the European Community, Official Journal C 321E of 29.12.2006.
Flynn, N. (2007), Public Sector Management, 5th edition. London: Sage.Freedom House (2007), “Freedom in the World”. Available at:
http://www.heritage.org/Index/. Heritage Foundation, The Wall Street Journal (2008), “Index of Economic Freedom”. Available at:
http://www.heritage.org/Index/. Hoggett, P. (1991), A New Management in the Public Sector?, Policy and Politics, Vol.19, No.4, pp. 243-256.Hood, C. (1991), A Public Management for All Seasons?, Public Administration 69, pp. 3-19.Hood, C. (1995), The ‘New Public Management’ in the 1990s: Variations on a Theme, Accounting Organizations
and Society 20(2/3): pp. 93-109.Hood, C. (1998), The Art of The State. Clarendon Press, Oxford.Hood, C., Scott, C. (2000), Regulating Government in a ‘Managerial’ Age: Towards a Cross-National
Perspective, Discussion Paper No 1, p2, Centre for Analysis of Risk and Regulation, London, London School of Economics and Political Science.
Huxham, C., & Vangen, S. (2006), Managing to collaborate: The theory and practice of collaborative advantage. Boston: Routledge. [quoted by Alford, Hughes (2008)].
International Monetary Fund (IMF) (2008), World Economic Outlook, Database – Groups and Aggregates Information, October 2008, Washington D. C.
IMF (2001), Government Finance Statistics Manual, Washington D. C.Kaufmann, D., Kraay, A., Mastruzzi, M. (2008), Governance Matters VII: Aggregate and Individual Governance
Indicators 1996-2007, World Bank Policy Research Working Paper No. 4654, The World Bank, Development Research Group, Macroeconomics and Growth Team, World Bank Institute.
Kaufmann, D., Kraay, A. (2007), Governance Indicators: Where Are We, Where Should We Be Going?, Policy Research Working Paper No. 4370, The World Bank, World Bank Institute, Global Governance Group and Development Research Group, Macroeconomics and Growth Team.
Christensen, T., Lægreid, P. (2008), Increased Complexity in Public Organizations – the Challenges and Implications of Combining NPM and Post-NPM Features, Paper presented at the Conference: New Public Management and the Quality of Governance, Gothenburg, 13-15 November 2008.
Mandell, M. (2001), Getting results through collaboration: Networks and network structures for public policy and management. Westport, CT: Quorum. [quoted by Alford, Hughes (2008)].
Metcalfe, L. (2000), Linking Levels of Government: European Integration and Globalization, International Review of Administrative Sciences, 66(1), pp. 119-142.
Metcalfe, L. (2001), Reforming European Governance: Old Problems of New Principles?, 67(3), pp. 415-443.Minogue, M., Cariño, L. (2006), Regulatory Governance in Developing Countries, CRC Series on Competition,
Regulation and Development, Edward Elgar Publishing Ltd.Minogue, M. (2005), Apples and Oranges – Comparing International Experiences in Regulatory Reform, Centre
for the Study of Regulated Industries, University of Bath School of Management. Minogue, M. (1998), Changing the state: concepts and practice in the reform of the public sector in Minogue,
Martin, Charles Polidano and David Hulme (eds) Beyond the New Public Management: Changing Ideas and Practices in Governance (Northampton, MA: E. Elgar).
North, D. C. (1990), Institutions, Institutional Change and Economic Performance, New York, Cambridge University Press.Organization for Economic Co-operation and Development (OECD) (2008a), Towards Government at a Glance:
Identification of Core Data and Issues related to Public Sector Efficiency, Paris.OECD (2008b), Lobbyists, Governments and Public Trust: Building a Legislative Framework for Enhancing
Transparency and Accountability in Lobbying, Paris. OECD (2008c), Integrity in Public Procurement: Good Practice from A to Z, Paris.OECD (2008d), Public-Private Partnerships: In Pursuit of Risk Sharing and Value for Money, Paris.OECD (2008e), Central Government Debt, Statistical Yearbook 1998-2007, 2008 Edition, Paris.OECD (2005a), e-Government for Better Government, Paris.OECD (2005b), Modernising Government, The Way Forward, Paris.OECD (2005c), Public Sector Integrity, A Framework for Assessment, Paris.

Paper for the Conference organized by the SOG and the QoG Institute, University of Gothenburg –New Public Management and the Quality of Government, November 13-15, 2008
38
OECD (2003a), The e-government imperative: main findings, OECD Observer Report, Available at: www.oecd.org/publication/Pol_brief.
OECD (2003b), Open Government, Fostering Dialogue with Civil Society, Paris.Perri 6. (2004), Joined up government in the Western world in perspective: A preliminary literature review and
exploration. Journal of Public Administration Research and Theory, 14(1), 103-138. [quoted by Alford, Hughes (2008)].
Polidano C., Hulme, D. (1999), Public Management Reform in Developing Countries, Public Management Review, volume 1, issue 1, pp. 121-132.
Pollitt, C. (2008), ‘Moderation in all Things’: Governance Quality and Performance Measurement, Paper presented at the Conference: New Public Management and the Quality of Governance, Gothenburg, 13-15 November 2008.Pollitt, C. & Bouckaert, G. (2004), Public Management Reform, Chapter XI. Oxford University Press. Pollitt, C. (2003), Joined-up government: A survey. Political Studies Review, 1, 34-49. [quoted by Alford,
Hughes (2008)].Shah, A. (2005), On Getting the Giant to Kneel – Approaches to a Change in the Bureaucratic Culture, in: Fiscal
Management, Public Sector Governance and Accountability Series, edited by Shah, A., The World Bank, Washington D.C., pp. 211-227.
Steurer, R. (2007), From Government Strategies to Strategic Public Management: An Exploratory Outlook on the Pursuit of Cross-Sectoral Policy Integration, European Environment, 17: 201-214.
Stoker, G. (2006), Public Value Management: A New Narrative for Networked Governance? American Review of Public Administration, 36(1), 41-57. [quoted by Alford, Hughes (2008)].
Talbot, C. (2006), Modernising Government: The Way Forward – A Comment, International Review of Administrative Sciences, pp. 337-340.
Talbot, C. (2005), Consilience and Performance in the “Art of the State”, Public Policy and Administration, January 2005, vol. 20: pp. 20-51.
Transparency International (1998-2008), “Corruption Perceptions Index (CPI)”. Available at:http://www.transparency.org/policy_research/surveys_indices/cpi.
United Nations (UN) (2008), Department of Economic and Social Affairs, Division for Public Administration and Development Management, “United Nations e-Government Survey 2008 – From e-Government to Connected Governance”, New York.
United Nations (UN) (2005), Global E-Government Readiness Report 2005: From E-Government to E-Inclusion, New York.
United Nations (UN), American Society for Public Administration (ASPA) (2001), Benchmarking E-government: A Global Perspective – Assessing the Progress of the UN Member States.
UN (2008), Department of Economic and Social Affairs, Division for Public Administration and Development Management, “United Nations e-Government Survey 2008 – From e-Government to Connected Governance”, New York.
United Nations Development Programme (2007), “Human Development Report 2007/2008”, New York, Oxford University Press.
World Bank (1992), "Governance and Development", Washington D.C.World Bank (2007), "Strengthening World Bank Group Engagement on Governance and Anticorruption". Available at:
http://www.worldbank.org/html/extdr/comments/governancefeedback/gacpaper-03212007.pdf.World Economic Forum (2008), “The Global Competitiveness Report”. Available at:
http://www.gcr.weforum.org/.