Embed Size (px)
Citation preview
KACHCHH
RAJKOT
AMRELI
JAMNAGAR
PATAN
JUNAGADH
BANAS KANTHA
BHAVNAGAR
VYARA
AHMEDABAD
KHEDASURENDRANAGAR
BHARUCH
DAHOD
SABAR KANTHA
SURAT
ANAND
MAHESANA
VALSAD
VADODARA
PANCH MAHALS
NARMADA
NAVSARI
CHHOTA UDEPUR
PORBANDAR
THE DANGS
GANDHINAGAR
AMC
VMC
SMC
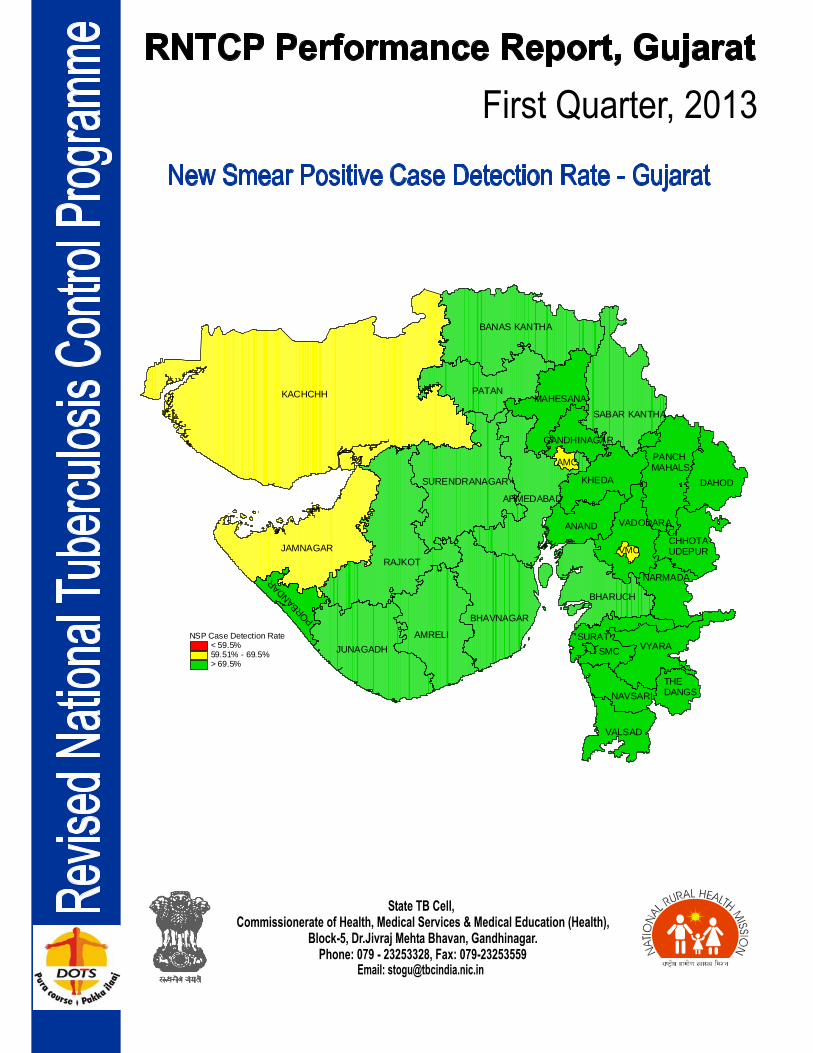
NSP Case Detection Rate< 59.5%59.51% - 69.5%> 69.5%
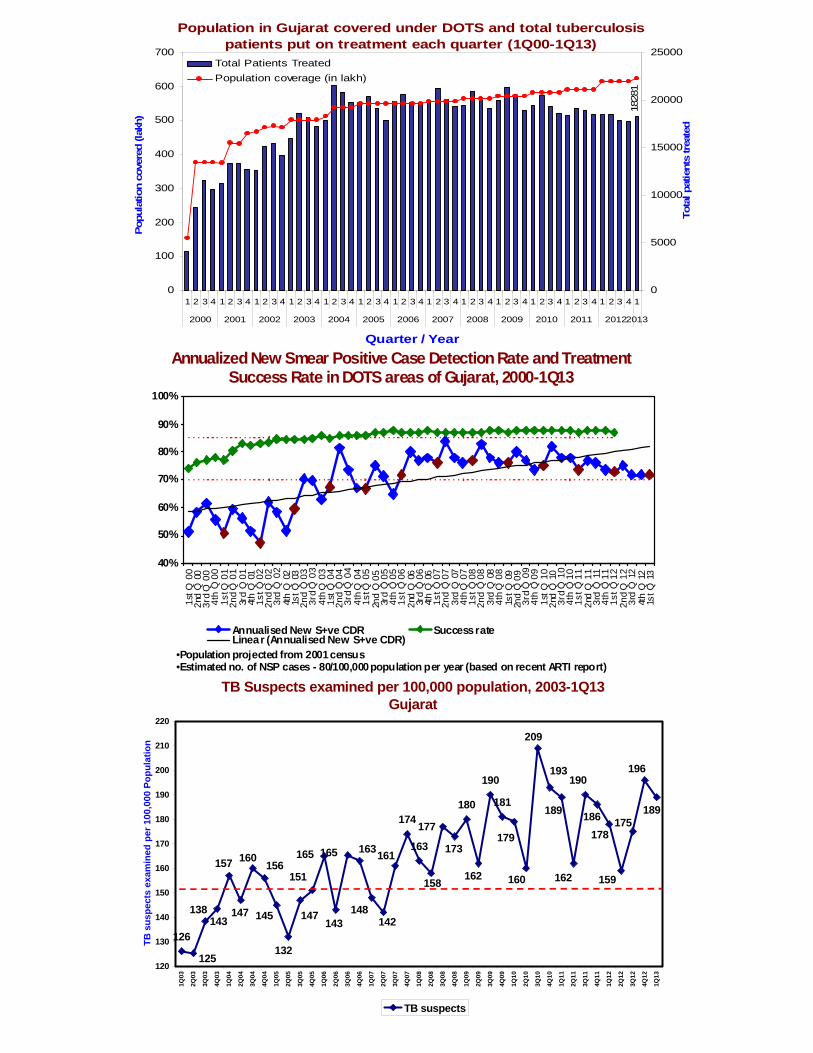
Annualized New Smear Positive Case Detection Rate and Treatment Success Rate in DOTS areas of Gujarat, 2000-1Q13
•Population projected from 2001 census•Estimated no. of NSP cases - 80/100,000 population per year (based on recent ARTI report)
40%
50%
60%
70%
80%
90%
100%
1st Q
00
2nd
Q 0
03r
d Q
00
4th
Q 0
01s
t Q 0
12n
d Q
01
3rd
Q 0
14t
h Q
01
1st Q
02
2nd
Q 0
23r
d Q
02
4th
Q 0
21s
t Q 0
32n
d Q
03
3rd
Q 0
34t
h Q
03
1st Q
04
2nd
Q 0
43r
d Q
04
4th
Q 0
41s
t Q 0
52n
d Q
05
3rd
Q 0
54t
h Q
05
1st Q
06
2nd
Q 0
63r
d Q
06
4th
Q 0
61s
t Q 0
72n
d Q
07
3rd
Q 0
74t
h Q
07
1st Q
08
2nd
Q 0
83r
d Q
08
4th
Q 0
81s
t Q 0
92n
d Q
09
3rd
Q 0
94t
h Q
09
1st Q
10
2nd
Q 1
03r
d Q
10
4th
Q 1
01s
t Q 1
12n
d Q
11
3rd
Q 1
14t
h Q
11
1st Q
12
2nd
Q 1
23r
d Q
12
4th
Q 1
21s
t Q 1
3
Annualised New S+ve CDR Success rateLinear (Annualised New S+ve CDR)
TB Suspects examined per 100,000 population, 2003-1Q13Gujarat
126
174
163
180
190
181189
196
175
159
178
143
151
147145147138
132
157 160156
125
143
165 165 163
148
177
162
179
160
209
193
161
142
158
173
189
162
190
186
120
130
140
150
160
170
180
190
200
210
220
1Q03
2Q03
3Q03
4Q03
1Q04
2Q04
3Q04
4Q04
1Q05
2Q05
3Q05
4Q05
1Q06
2Q06
3Q06
4Q06
1Q07
2Q07
3Q07
4Q07
1Q08
2Q08
3Q08
4Q08
1Q09
2Q09
3Q09
4Q09
1Q10
2Q10
3Q10
4Q10
1Q11
2Q11
3Q11
4Q11
1Q12
2Q12
3Q12
4Q12
1Q13
TB s
uspe
cts
exam
ined
per
100
,000
Pop
ulat
ion
TB suspects
Population in Gujarat covered under DOTS and total tuberculosis patients put on treatment each quarter (1Q00-1Q13)
1828
1
0
100
200
300
400
500
600
700
1 2 3 4 1 2 3 4 1 2 3 4 1 2 3 4 1 2 3 4 1 2 3 4 1 2 3 4 1 2 3 4 1 2 3 4 1 2 3 4 1 2 3 4 1 2 3 4 1 2 3 4 1
2000 2001 2002 2003 2004 2005 2006 2007 2008 2009 2010 2011 20122013
Quarter / Year
Tota
l pat
ient
s tr
eate
d
0
5000
10000
15000
20000
25000
Popu
latio
n co
vere
d (la
kh)
Total Patients TreatedPopulation coverage (in lakh)
Rann of Kachchh
Lalpur
Nakhtrana
Muli
Vav
Una
Dhrol
Bhuj_DTC
Rapar
Morbi
Amod
Surendranagar
Idar
Botad
Shihor
Talaja
Mandvi
Dhandhuka
Dhrangadhra
Babra
Ahwa
Radhanpur
Dhanera
Khambhalia
JetpurUpleta
Savli
Valia
Rajula
DTC_Rural
Halol
Viramgam
Padra
Deesa Palanpur
Keshod
Porbandar
Anjar
Diodar
Palitana
Veraval
Patan
BhachauKadi
Bavla
Amreli_DTC
Vyara
Dant a
Rajpipla
Mandavee
Dhansura
Shahera
Bhiloda
KavantKotda Shangani
Mora
Kamrej
Balasinor
Dediapada
Khambhat
Visnagar
Kaprada
Bardoli
Godhra
Nizar
Sarsa
Matar
Hansot
SongadhNavsari
Sant rampur
Chikhli
Jhalod
Pardi
Dhanpur
Khedbrahma
Dahod
Dahegam
Bhilad
D'bar ia#
Jamnagar_DTC
Limkheda
Garbada
Bharuch
ValsadDharampur
Gandevi Vansda
Savarkundla
Meghraj
Fatehpura
Himatnagar
Kheralu
G'nagar_DTC
Mehsana_DTC
Chanasma
Atarsumba
Nadiad
Petl ad
Anklav
Sankheda
Pavi_Jetpur
CUPBaroda
Surat
MangrolJunagadh_UrbanJunagadh
_Rural
Mansa
GotriJub ilibaugBawchawad
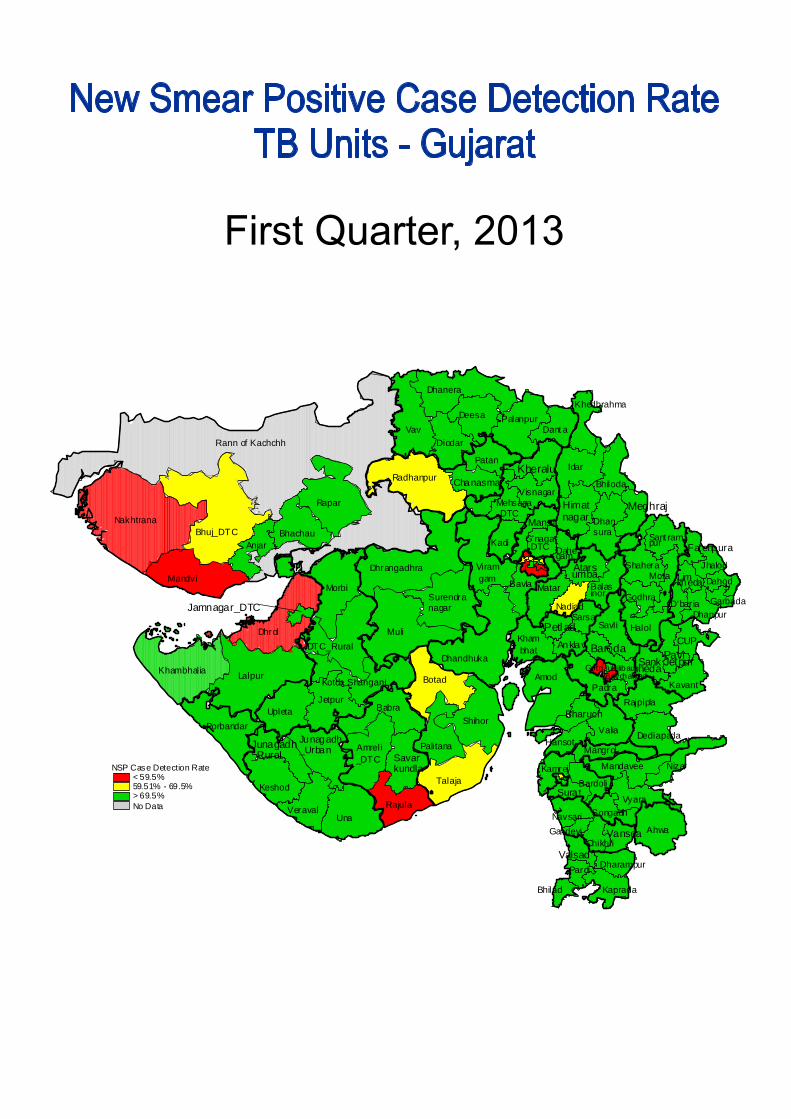
NSP Case Detection Rate< 59.5%59.51% - 69.5%> 69.5%No Data
Rann of Kachchh
Lalpur
Nakhtrana
Muli
Vav
Una
Dhrol
Bhuj_DTC
Rapar
Morbi
Amod
Surendranagar
Idar
Botad
Shihor
Talaja
Mandvi
Dhandhuka
Dhrangadhra
Babra
Ahwa
Radhanpur
Dhanera
Khambhalia
JetpurUpleta
Savli
Valia
Rajula
DTC_Rural
Halol
Viramgam
Padra
Deesa Palanpur
Keshod
Porbandar
Anjar
Diodar
Palitana
Veraval
Patan
BhachauKadi
Bavla
Amreli_DTC
Vyara
Danta
Rajpipla
Mandavee
Dhansura
Shahera
Bhiloda
KavantKotda Shangani
Mora
Kamrej
Balasinor
Dediapada
Khambhat
Visnagar
Kaprada
Bardoli
Godhra
Nizar
Sarsa
Matar
Hansot
SongadhNavsari
Santrampur
Chikhli
Jhalod
Pardi
Dhanpur
Khedbrahma
Dahod
Dahegam
Bhilad
D'baria#
Jamnagar_DTC
Limkheda
Garbada
Bharuch
ValsadDharampur
Gandevi Vansda
Savarkundla
Meghraj
Fatehpura
Himatnagar
Kheralu
G'nagar_DTC
Mehsana_DTC
Chanasma
Atarsumba
Nadiad
Petlad
Anklav
Sankheda
Pavi_Jetpur
CUPBaroda
Surat
MangrolJunagadh_Urban
Junagadh_Rural
Mansa
GotriJubilibaugBawchawad
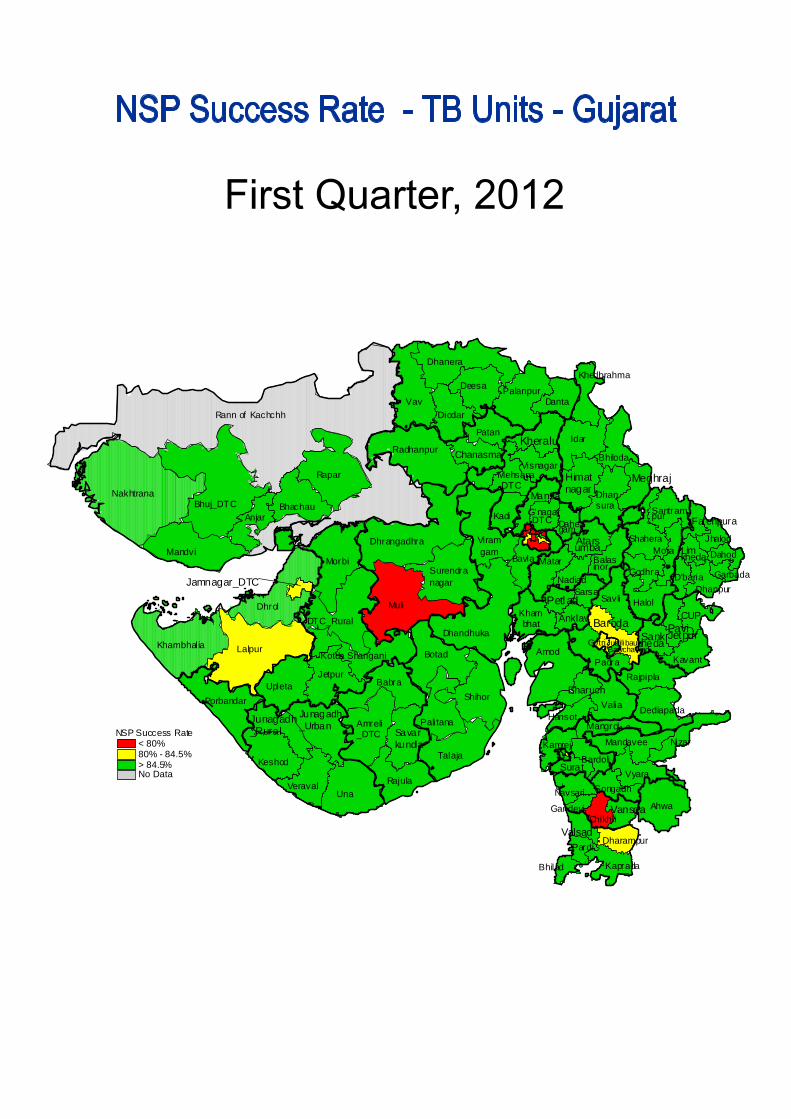
NSP Success Rate< 80%80% - 84.5%> 84.5%No Data
Revised National TB Control Programme
Dear Colleagues,
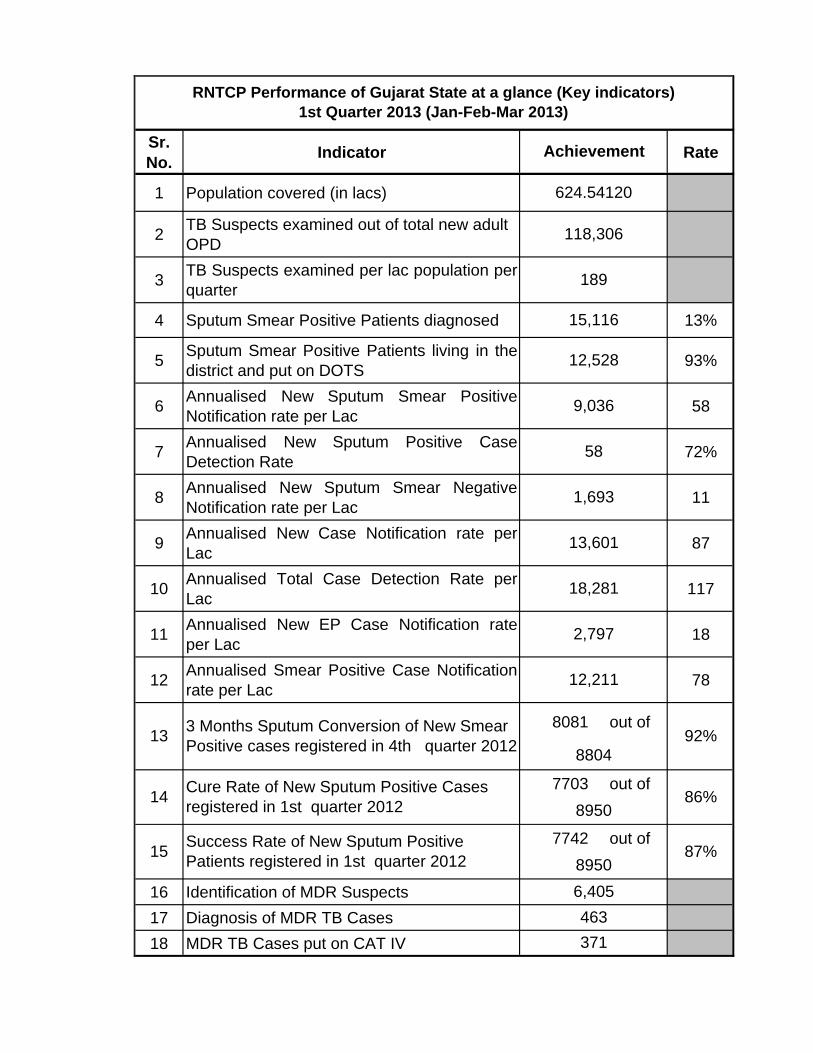
We are pleased to inform you that state of Gujarat is achieving twin objectives of RNTCP since 29 quarters and this has given more faith in the community for TB control efforts made by the state. RNTCP performance during 1st quarter 2013 During the quarter 118306 suspects were examined, 15116 sputum positive cases were diagnosed, and a total of 18281 all TB cases were registered for treatment. The annualized total case notification rate is 117 cases per 100,000 population. With a total of 9036 New Smear Positive cases being registered for treatment, the new smear positive TB case Notification Rate (annualized) for the 1st quarter 2013 is 58 per 100,000 population. In addition to this, 1693 new Smear Negative cases, 2797 New Extra Pulmonary cases registered for treatment in this quarter. The treatment success rate amongst the New Smear Positive pulmonary TB cases registered in the 1st Quarter 2012 is 87% and the Sputum Conversion rate of patients registered during 4th Quarter 2012 is 92%. In TB-HIV intensified services 94% patients were tested for HIV out of 18281 total patients registered during 1st quarter 2013. PMDT: During this quarter, among 6405 identified MDR-TB suspects 5989 MDR-TB suspects were tested for drug resistance. Total 463 patients were diagnosed as having drug resistant and eligible for Cat-IV drugs. Total 371 patients put on cat-IV drugs. Trainings, Supervision and Review meetings: In addition to quarterly review meeting, from state level two internal evaluations were conducted in the quarter for districts namely Ahmedabad Municipal Corporation and Rajkot. One batch of refresher training was organized for STLS during the quarter. Capacity building workshop on operational Research was organized at Vadodara. 40 faculties from 11 medical colleges of Gujarat actively participated in the workshop. As an outcome 13 concept papers on various research topics presented at the end of the workshop. NGO-PP & ACSM workshop of Gujarat State was carried out at State TB Training and Demonstration centre, Ahmedabad on January 28th, 2013 under directives from Central TB Division, GOI New Delhi. The aim of workshop was to review the status of ACSM and NGO-PP activities in the RNTCP in the state and to share and disseminate information and learning of successful NGO-PP and ACSM interventions among all stakeholders. Observation of World TB Day 2013 at Ahmedabad The World TB day 2013 was observed with the key messages of global theme: “Zero TB Deaths: Stop TB in my life time”. The key activities in this event included awards for appreciation of good performance among health personnel, NGOs & private practitioners and release of annual performance report ‘TB- Gujarat 2013’. This event was successful in increasing awareness among community regarding services available under programme and has brought visibility to tuberculosis control. In relation with World TB day, state officials organized live broadcast using SATCOM, (Bhaskaracharya Institute for Space Applications and Geo-informatics) for all health workers of Gujarat on RNTCP basics with Q&A session. As per approved state PIP 2013-14 Gujarat, benchmark for Annualized New Smear Positive Detection Rate of TB will be 75%; and Success Rate among New Smear Positive Treatment initiated on DOTS will be 90%. The performance will be assessed on the basis of NIKSHAY in near future, which needs to be undertaken on high priority by all.
Dr Pradip Patel I/C Director STDC
Ahmedabad (Gujarat)
Dr PV Dave State TB Officer
Gandhinagar (Gujarat)
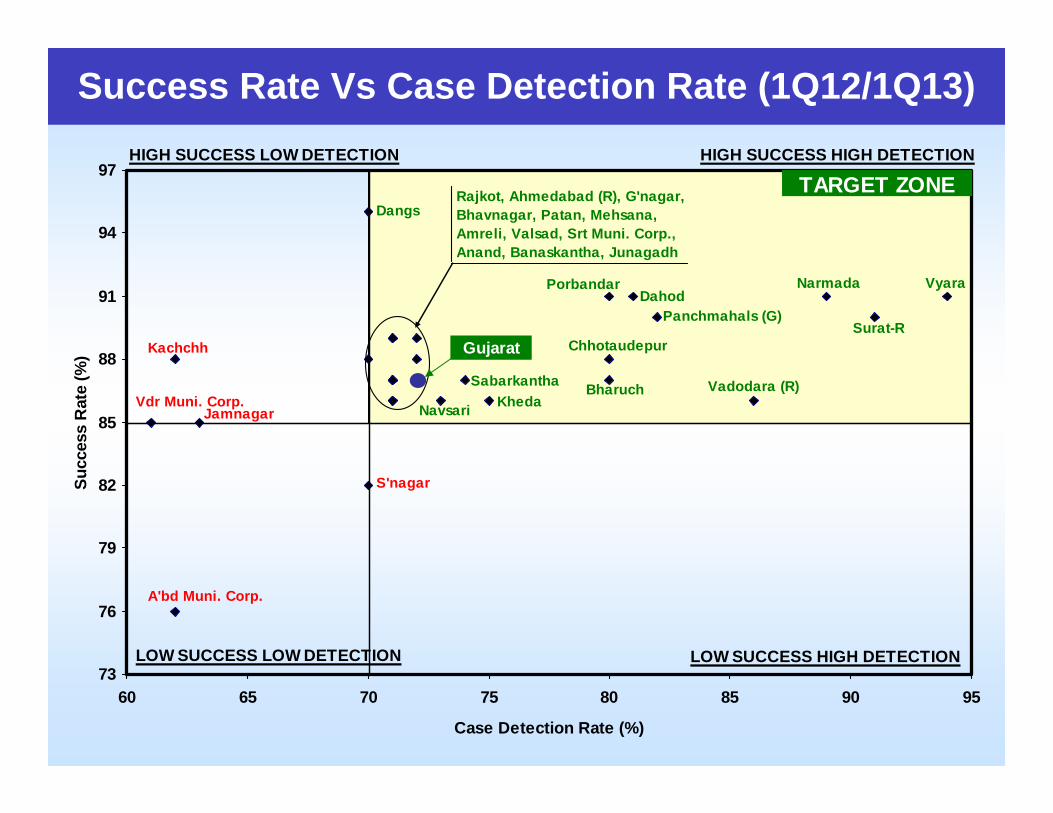
Success Rate Vs Case Detection Rate (3Q11/3Q12)
73
76
79
82
85
88
91
94
97
60 65 70 75 80 85 90 95
Case Detection Rate (%)
Succ
ess
Rat
e (%
)
Panchmahals (G)
Bharuch
Gujarat
HIGH SUCCESS HIGH DETECTIONHIGH SUCCESS LOW DETECTION
LOW SUCCESS LOW DETECTION LOW SUCCESS HIGH DETECTION
TARGET ZONE
VyaraNarmada
Rajkot, Ahmedabad (R), G'nagar, Bhavnagar, Patan, Mehsana, Amreli, Valsad, Srt Muni. Corp., Anand, Banaskantha, Junagadh
Dahod
Surat-R
Porbandar
Chhotaudepur
Kheda
A'bd Muni. Corp.
Dangs
Vadodara (R)Sabarkantha
Jamnagar Navsari
Kachchh
Vdr Muni. Corp.
S'nagar
Success Rate Vs Case Detection Rate (1Q12/1Q13)
Sr. No. Indicator Rate
1 Population covered (in lacs)
2 TB Suspects examined out of total new adult OPD
3 TB Suspects examined per lac population perquarter
4 Sputum Smear Positive Patients diagnosed 13%
5 Sputum Smear Positive Patients living in thedistrict and put on DOTS 93%
6 Annualised New Sputum Smear PositiveNotification rate per Lac 58
7 Annualised New Sputum Positive CaseDetection Rate 72%
8 Annualised New Sputum Smear NegativeNotification rate per Lac 11
9 Annualised New Case Notification rate perLac 87
10 Annualised Total Case Detection Rate perLac 117
11 Annualised New EP Case Notification rateper Lac 18
12 Annualised Smear Positive Case Notificationrate per Lac 78
8081 out of
7703 out of
7742 out of
16 Identification of MDR Suspects17 Diagnosis of MDR TB Cases18 MDR TB Cases put on CAT IV
RNTCP Performance of Gujarat State at a glance (Key indicators) 1st Quarter 2013 (Jan-Feb-Mar 2013)
Achievement
624.54120
1,693
118,306
189
15,116
12,528
9,036
58
18,281
13,601
12,211
86%8950
2,797
87%8950
92%8804
6,405463371
13 3 Months Sputum Conversion of New Smear Positive cases registered in 4th quarter 2012
15 Success Rate of New Sputum Positive Patients registered in 1st quarter 2012
14 Cure Rate of New Sputum Positive Cases registered in 1st quarter 2012
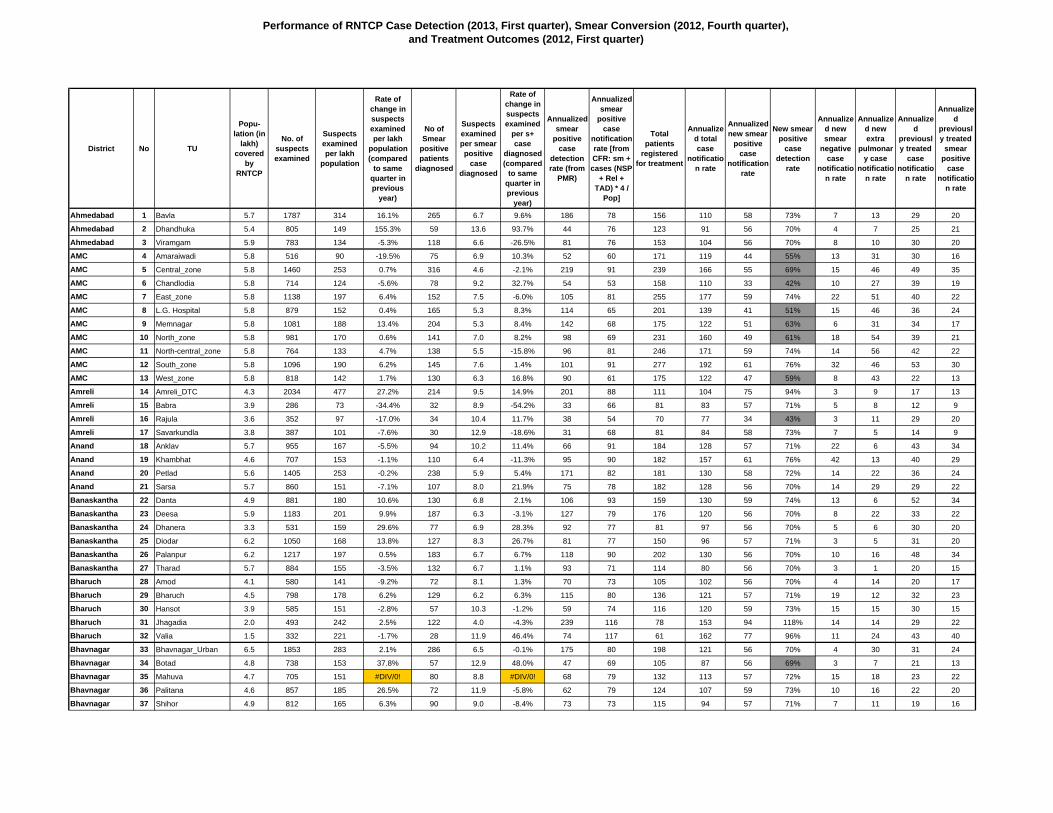
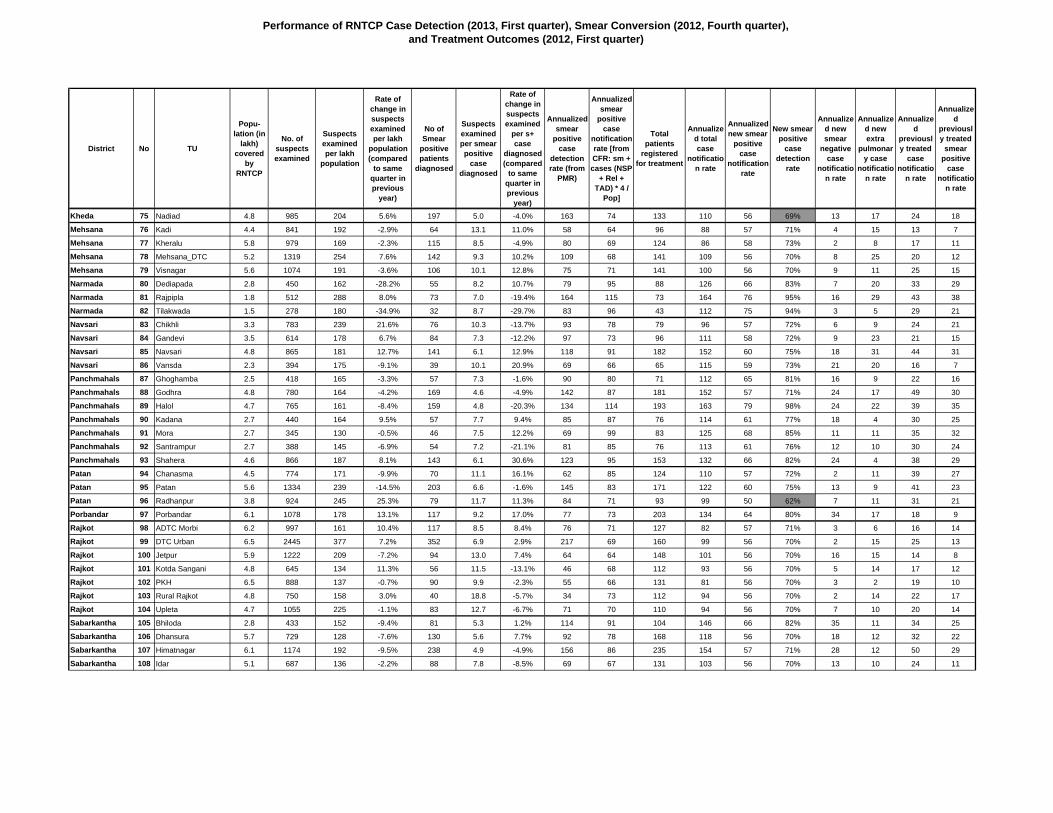
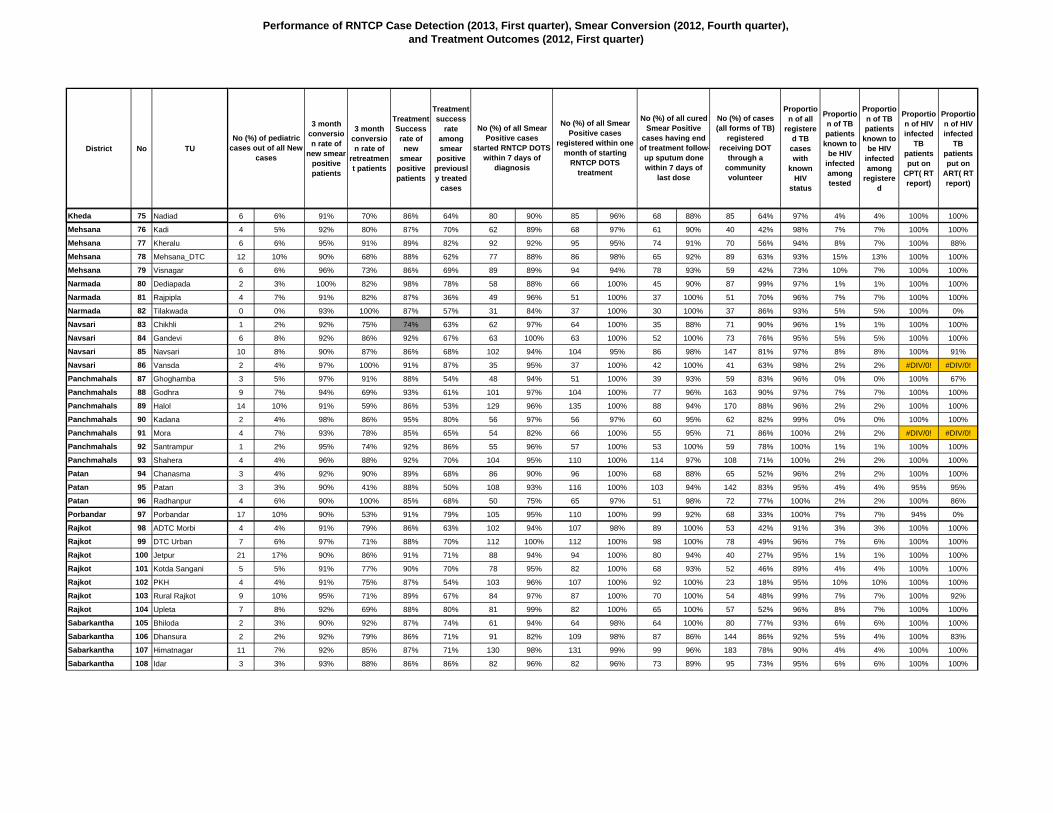
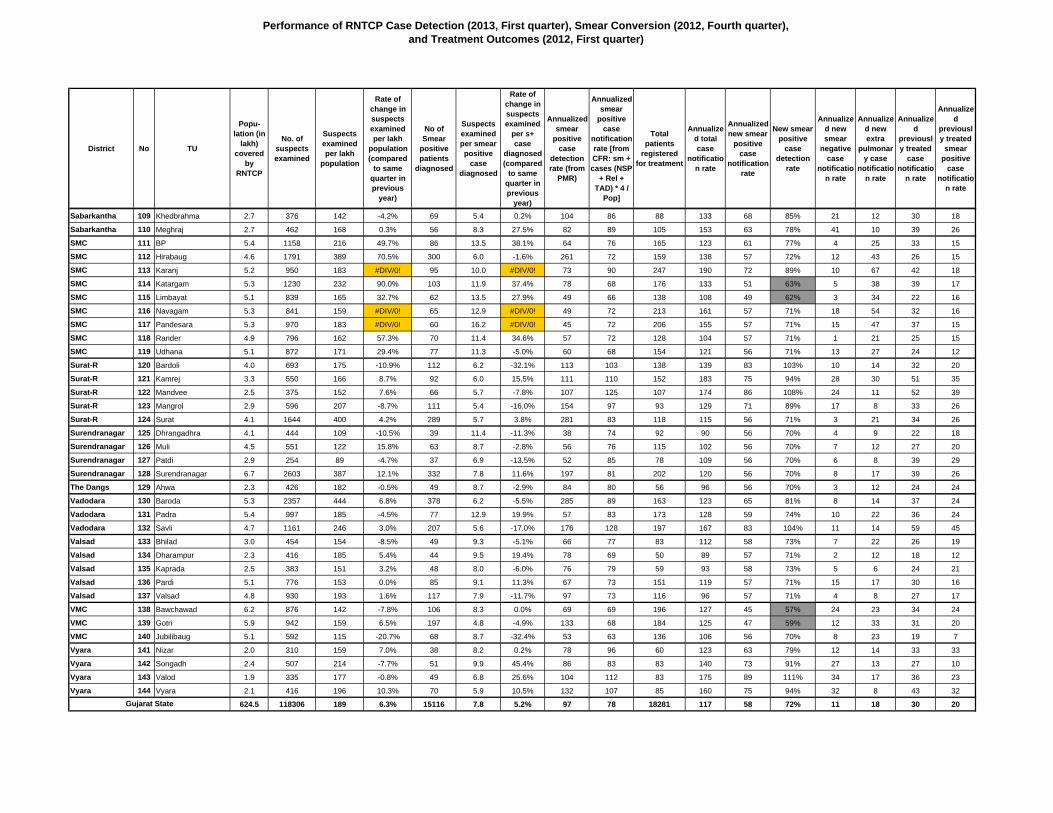
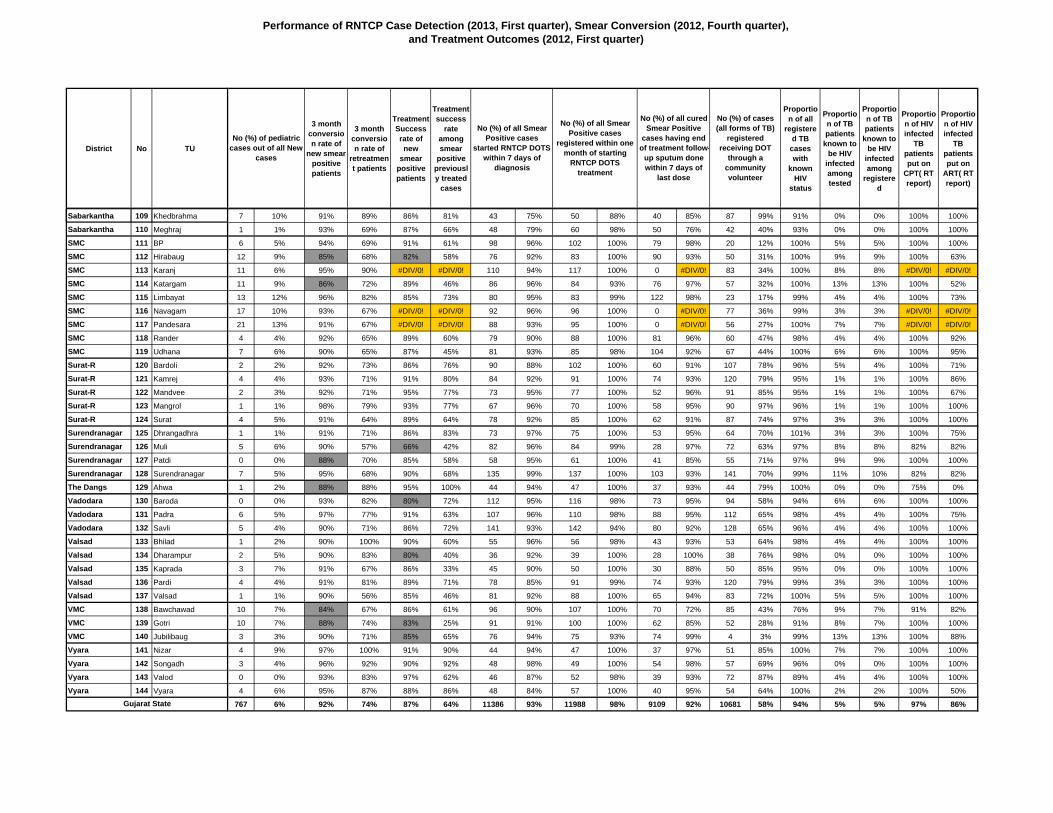
District
Population (in lakh)
covered by RNTCP
No. of suspects examined
Suspects examined per lakh
population
Rate of change in suspects
examined per lakh
population (compared to same quarter in previous
year)
No of Smear positive patients
diagnosed
Suspects examined per smear positive
case diagnosed
Rate of change in suspects
examined per s+ case
diagnosed (compared to same quarter in previous
year)
Annualized smear positive
case notification
rate (reported by RNTCP
DMCs)
Annualized smear positive
case notification rate [from CFR: sm +
cases (NSP + Rel + TAD) * 4
/ Pop]
Total patients
registered for
treatment
Annualized total case notificatio
n rate
Annualized new smear
positive case
notification rate
New smear positive
case Detection
rate
Annualized new smear
negative case
notification rate
Annualized new extra pulmonary
case notification
rate
Annualized previously
treated case notification
rate
Ahmedabad (R) 16.9 3375 199 25.85% 442 7.6 10.03% 104 77 432 102 57 71% 6 10 28
AMC 57.6 9447 164 1.72% 1544 6.1 3.92% 107 72 2128 148 50 62% 15 43 38
Amreli 15.7 3059 195 6.29% 310 9.9 -1.32% 79 70 343 88 57 71% 5 8 18
Anand 21.6 3927 182 -3.25% 549 7.2 5.92% 102 85 729 135 58 72% 22 18 37
Banaskantha 32.2 5746 178 7.76% 836 6.9 7.63% 104 81 882 109 57 71% 7 10 36
Bharuch 16.0 2788 174 -0.82% 408 6.8 2.85% 102 85 496 124 64 80% 13 15 29
Bhavnagar 29.8 5591 188 19.02% 632 8.8 9.55% 85 75 760 102 56 71% 7 16 23
Chhotaudepur 10.3 1835 177 5.64% 241 7.6 0.30% 93 96 299 116 64 80% 8 4 38
Dahod 22.0 5756 262 14.85% 579 9.9 11.36% 105 98 670 122 65 81% 8 10 38
Gandhinagar 14.4 3036 212 7.00% 330 9.2 6.18% 92 74 380 106 57 71% 7 13 29
Jamnagar 22.3 4151 186 5.39% 389 10.7 14.07% 70 66 554 99 50 63% 4 21 23
Junagadh 28.4 4925 174 11.43% 530 9.3 9.47% 75 70 639 90 57 72% 4 9 19
Kachchh 21.6 3703 171 5.08% 384 9.6 19.95% 71 62 450 83 49 62% 6 9 19
Kheda 23.8 3848 162 -0.40% 675 5.7 -8.31% 114 83 680 114 60 75% 15 10 30
Mehsana 21.0 4213 201 0.11% 427 9.9 6.58% 81 68 502 96 57 71% 6 14 19
Narmada 6.1 1240 203 -19.52% 160 7.8 -12.52% 105 101 204 134 71 89% 9 19 35
Navsari 13.8 2656 193 9.73% 340 7.8 2.08% 99 79 422 123 59 73% 13 22 29
Panchmahals 24.7 4002 162 -1.15% 685 5.8 -0.21% 111 94 833 135 66 82% 20 12 36
Patan 13.9 3032 218 -4.01% 352 8.6 7.60% 101 80 388 112 56 71% 8 10 37
Porbandar 6.1 1078 178 13.12% 117 9.2 17.01% 77 73 203 134 64 80% 34 17 18
Rajkot 39.3 8002 204 3.00% 832 9.6 0.09% 85 68 900 92 56 70% 5 11 19
Sabarkantha 25.1 3861 154 -6.31% 662 5.8 1.62% 105 81 831 132 59 74% 24 11 36
SMC 46.2 9447 205 41.90% 918 10.3 23.09% 80 73 1586 137 57 72% 9 40 31
Surat (R) 16.7 3858 231 -0.09% 670 5.8 -6.13% 160 102 608 145 73 91% 15 18 39
Surendranagar 18.2 3852 212 8.16% 471 8.2 4.62% 104 79 487 107 56 70% 7 13 32
The Dangs 2.3 426 182 -0.50% 49 8.7 -2.94% 84 80 56 96 56 70% 3 12 24
Vadodara (R) 15.4 4515 293 3.12% 662 6.8 -6.85% 172 99 533 138 69 86% 10 17 44
Valsad 17.6 2959 168 0.19% 343 8.6 -0.48% 78 74 459 104 57 72% 7 13 26
VMC 17.2 2410 140 -6.63% 371 6.5 -12.21% 86 67 516 120 49 61% 15 26 29
Vyara 8.3 1568 188 0.90% 208 7.5 20.38% 100 99 311 149 75 94% 26 13 35
Gujarat State 624.5 118306 189 6.3% 15116 7.8 5.2% 97 78 18281 117 58 72% 11 18 30
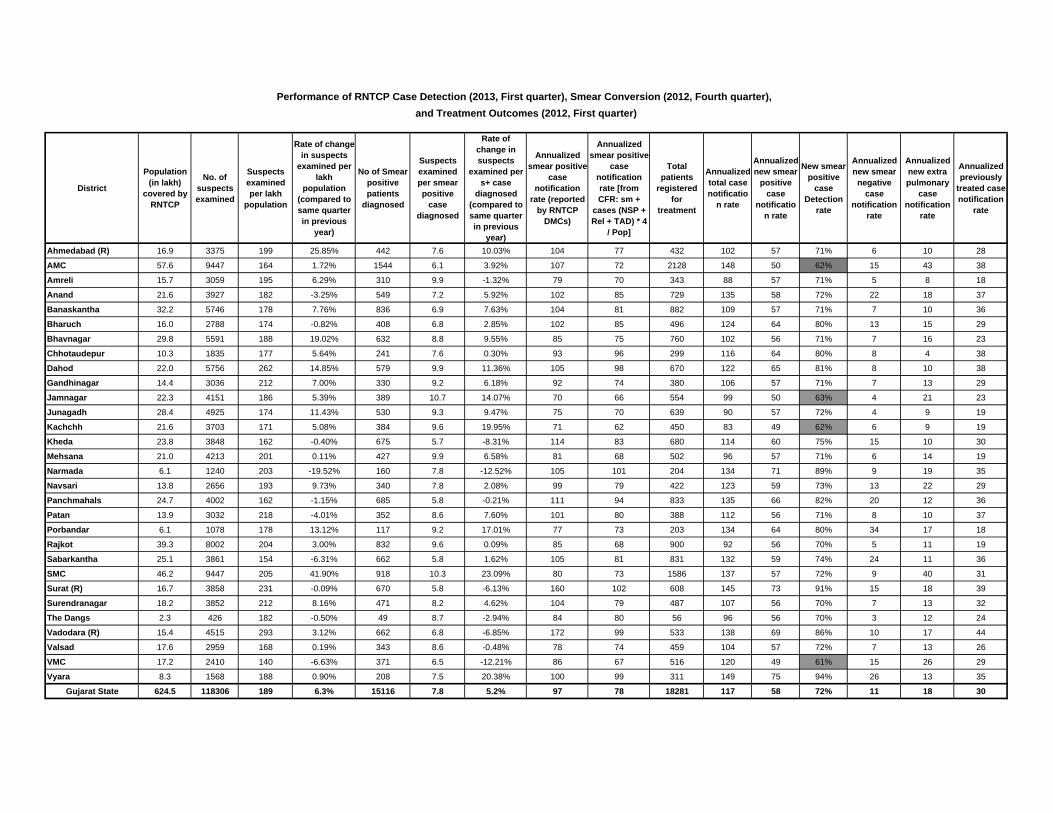
and Treatment Outcomes (2012, First quarter)Performance of RNTCP Case Detection (2013, First quarter), Smear Conversion (2012, Fourth quarter),
District
Ahmedabad (R)
AMC
Amreli
Anand
Banaskantha
Bharuch
Bhavnagar
Chhotaudepur
Dahod
Gandhinagar
Jamnagar
Junagadh
Kachchh
Kheda
Mehsana
Narmada
Navsari
Panchmahals
Patan
Porbandar
Rajkot
Sabarkantha
SMC
Surat (R)
Surendranagar
The Dangs
Vadodara (R)
Valsad
VMC
Vyara
Gujarat State
Annualized previously
treated smear
positive case
notification rate
3 month conversion rate of new
smear positive patients
3 month conversion
rate of retreatment
patients
NSP Success
Rate
Proportion of all
registered TB cases
with known status
Proportion of TB
patients known to be HIV infected
among tested
Proportion of TB
patients known to
be HIV infected among
registered
Proportion of HIV
infected TB patients put on
CPT( RT report)
Proportion of HIV
infected TB patients put on ART( RT
report)
20 14 4% 91% 73% 86% 289 89% 306 94% 214 87% 358 83% 95% 5% 5% 96% 70%
22 137 9% 85% 66% 76% 960 93% 1017 98% 693 86% 431 20% 89% 6% 5% 99% 83%
13 10 4% 92% 74% 89% 255 93% 269 99% 216 91% 240 70% 86% 4% 3% 100% 100%
28 20 4% 94% 81% 88% 431 94% 440 96% 377 94% 503 69% 83% 4% 3% 94% 85%
24 31 5% 93% 76% 89% 625 96% 647 99% 512 94% 665 75% 95% 3% 3% 100% 100%
21 12 3% 93% 81% 87% 303 89% 340 100% 243 87% 281 57% 93% 5% 5% 100% 100%
19 27 5% 94% 77% 87% 536 96% 556 99% 402 92% 529 70% 92% 4% 3% 100% 100%
32 5 2% 92% 74% 88% 229 92% 248 100% 162 88% 194 65% 100% 4% 4% 100% 100%
33 20 4% 94% 78% 91% 522 97% 531 99% 437 96% 399 60% 99% 5% 5% 100% 100%
17 12 4% 94% 73% 86% 250 94% 261 98% 207 95% 266 70% 99% 5% 5% 100% 89%
16 26 6% 91% 64% 85% 339 91% 349 94% 263 87% 377 68% 89% 6% 5% 100% 95%
13 28 6% 93% 69% 89% 484 97% 498 100% 383 91% 477 75% 99% 2% 2% 100% 100%
13 23 7% 90% 63% 88% 321 96% 330 99% 253 89% 328 73% 99% 4% 4% 63% 38%
23 17 3% 91% 69% 86% 445 90% 457 92% 383 89% 424 62% 96% 3% 3% 100% 100%
11 28 7% 93% 76% 87% 320 89% 343 96% 278 91% 258 51% 89% 10% 9% 100% 96%
29 6 4% 95% 85% 91% 138 90% 154 100% 112 96% 175 86% 96% 4% 4% 100% 86%
21 19 6% 92% 86% 86% 262 96% 268 98% 215 97% 332 79% 97% 5% 5% 100% 95%
29 37 6% 95% 77% 90% 547 94% 579 100% 486 96% 692 83% 98% 3% 3% 100% 96%
24 10 4% 91% 65% 87% 244 87% 277 99% 222 93% 279 72% 97% 3% 3% 97% 94%
9 17 10% 90% 53% 91% 105 95% 110 100% 99 92% 68 33% 100% 7% 7% 94% 0%
12 57 8% 93% 75% 88% 648 96% 671 100% 562 98% 357 40% 95% 6% 5% 100% 99%
22 26 4% 92% 84% 87% 455 89% 496 97% 413 89% 631 76% 92% 4% 4% 100% 97%
16 102 8% 92% 71% 87% 790 94% 833 99% 552 96% 493 31% 100% 7% 7% 100% 75%
28 13 3% 93% 72% 90% 392 92% 425 100% 306 93% 495 81% 96% 2% 2% 100% 83%
23 13 4% 92% 65% 82% 348 97% 357 100% 225 92% 332 68% 99% 8% 8% 89% 86%
24 1 2% 88% 88% 95% 44 94% 47 100% 37 93% 44 79% 100% 0% 0% 75% 0%
30 11 3% 93% 76% 86% 360 94% 368 97% 241 94% 334 63% 96% 5% 5% 100% 93%
17 11 3% 90% 78% 87% 295 90% 324 99% 240 93% 344 75% 98% 3% 3% 100% 100%
18 23 6% 87% 70% 85% 263 91% 282 98% 206 84% 141 27% 88% 10% 8% 97% 89%
24 11 5% 95% 89% 91% 186 90% 205 100% 170 96% 234 75% 96% 3% 3% 100% 88%
20 767 6% 92% 74% 87% 11386 93% 11988 98% 9109 92% 10681 58% 94% 4.8% 4.5% 97% 86%
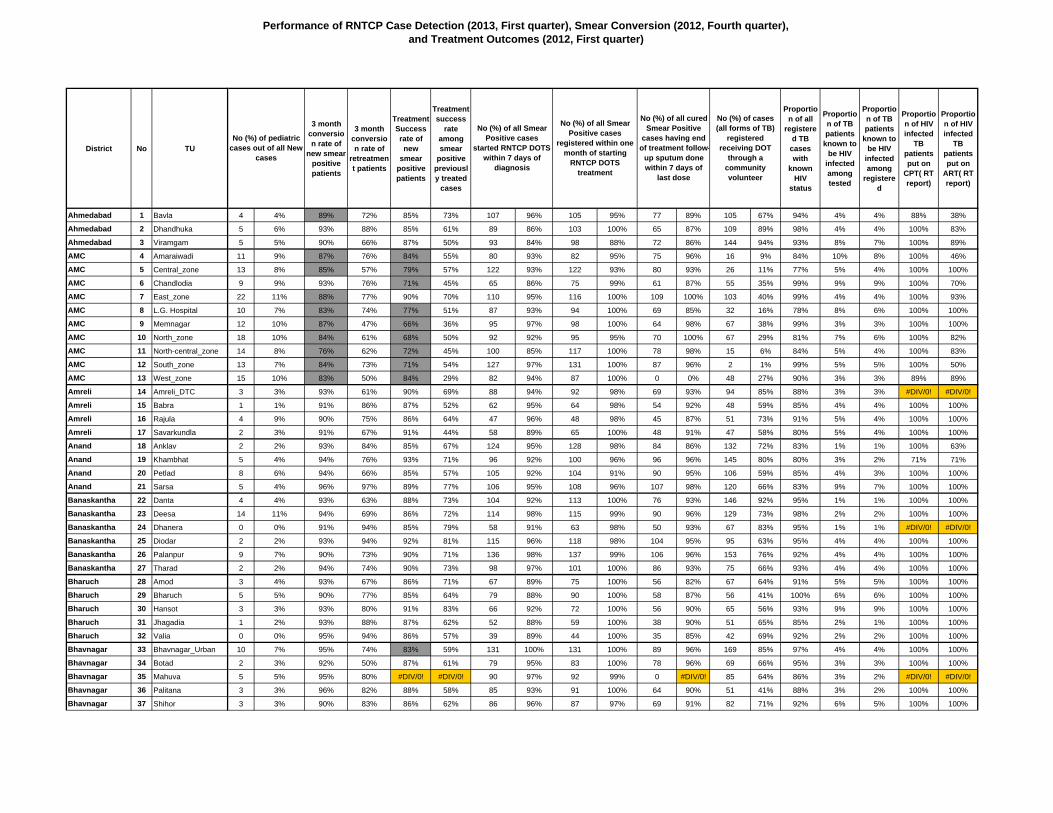
No (%) of all cured Smear Positive cases
having end of treatment follow- up
sputum done within 7 days of last dose
No (%) of cases (all forms of TB)
registered receiving DOT
through a community volunteer
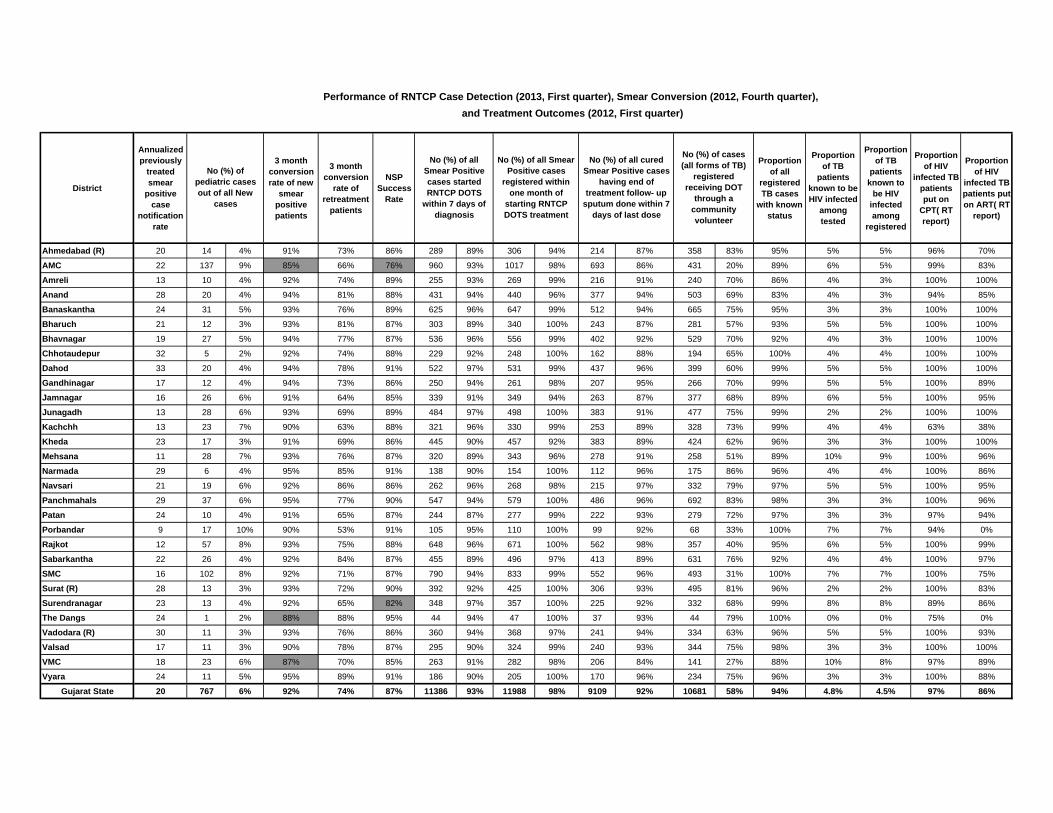
Performance of RNTCP Case Detection (2013, First quarter), Smear Conversion (2012, Fourth quarter), and Treatment Outcomes (2012, First quarter)
No (%) of pediatric cases out of all New
cases
No (%) of all Smear Positive cases started RNTCP DOTS
within 7 days of diagnosis
No (%) of all Smear Positive cases
registered within one month of
starting RNTCP DOTS treatment
Regist-ered Cure Comp-
leted Died Failure Defaulted
Trans out
Switch to CAT
IV
Regist-ered
Comp-leted Died Failure Default
edTrans
out
Switch to CAT
IV
Regist-ered
Comp-leted Died Failure Default
edTrans
out
Switch to CAT
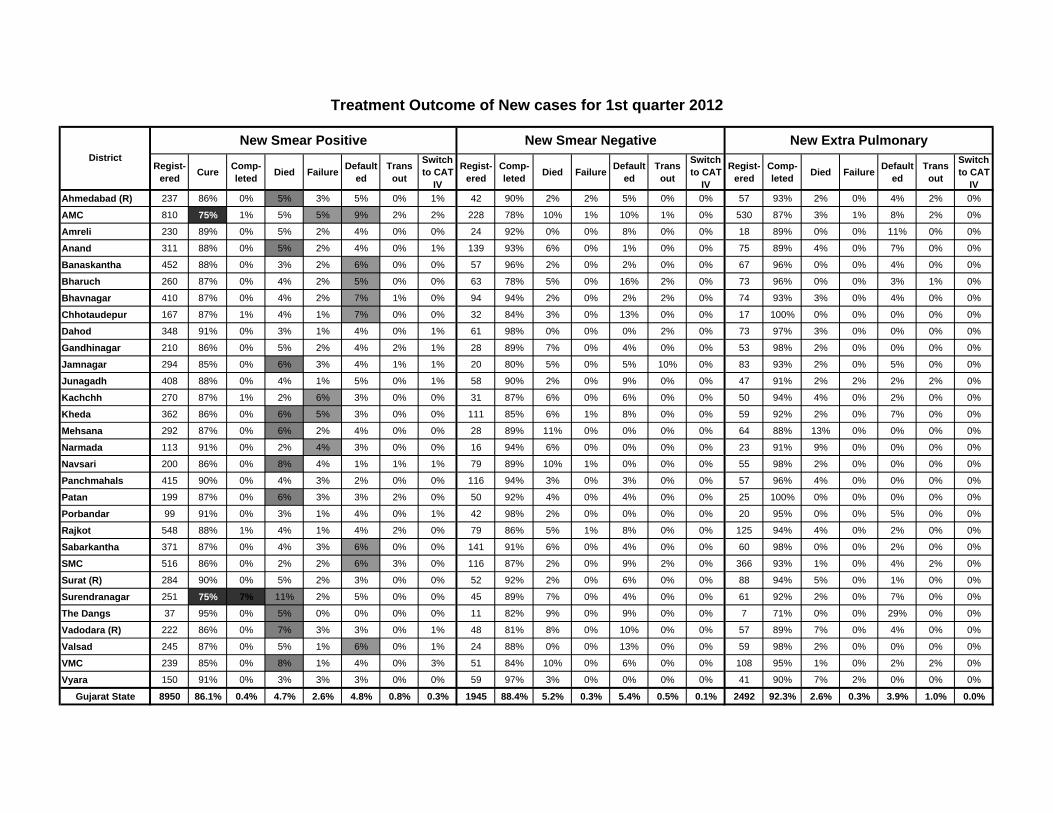
IVAhmedabad (R) 237 86% 0% 5% 3% 5% 0% 1% 42 90% 2% 2% 5% 0% 0% 57 93% 2% 0% 4% 2% 0%
AMC 810 75% 1% 5% 5% 9% 2% 2% 228 78% 10% 1% 10% 1% 0% 530 87% 3% 1% 8% 2% 0%
Amreli 230 89% 0% 5% 2% 4% 0% 0% 24 92% 0% 0% 8% 0% 0% 18 89% 0% 0% 11% 0% 0%
Anand 311 88% 0% 5% 2% 4% 0% 1% 139 93% 6% 0% 1% 0% 0% 75 89% 4% 0% 7% 0% 0%
Banaskantha 452 88% 0% 3% 2% 6% 0% 0% 57 96% 2% 0% 2% 0% 0% 67 96% 0% 0% 4% 0% 0%
Bharuch 260 87% 0% 4% 2% 5% 0% 0% 63 78% 5% 0% 16% 2% 0% 73 96% 0% 0% 3% 1% 0%
Bhavnagar 410 87% 0% 4% 2% 7% 1% 0% 94 94% 2% 0% 2% 2% 0% 74 93% 3% 0% 4% 0% 0%
Chhotaudepur 167 87% 1% 4% 1% 7% 0% 0% 32 84% 3% 0% 13% 0% 0% 17 100% 0% 0% 0% 0% 0%
Dahod 348 91% 0% 3% 1% 4% 0% 1% 61 98% 0% 0% 0% 2% 0% 73 97% 3% 0% 0% 0% 0%
Gandhinagar 210 86% 0% 5% 2% 4% 2% 1% 28 89% 7% 0% 4% 0% 0% 53 98% 2% 0% 0% 0% 0%
Jamnagar 294 85% 0% 6% 3% 4% 1% 1% 20 80% 5% 0% 5% 10% 0% 83 93% 2% 0% 5% 0% 0%
Junagadh 408 88% 0% 4% 1% 5% 0% 1% 58 90% 2% 0% 9% 0% 0% 47 91% 2% 2% 2% 2% 0%
Kachchh 270 87% 1% 2% 6% 3% 0% 0% 31 87% 6% 0% 6% 0% 0% 50 94% 4% 0% 2% 0% 0%
Kheda 362 86% 0% 6% 5% 3% 0% 0% 111 85% 6% 1% 8% 0% 0% 59 92% 2% 0% 7% 0% 0%
Mehsana 292 87% 0% 6% 2% 4% 0% 0% 28 89% 11% 0% 0% 0% 0% 64 88% 13% 0% 0% 0% 0%
Narmada 113 91% 0% 2% 4% 3% 0% 0% 16 94% 6% 0% 0% 0% 0% 23 91% 9% 0% 0% 0% 0%
Navsari 200 86% 0% 8% 4% 1% 1% 1% 79 89% 10% 1% 0% 0% 0% 55 98% 2% 0% 0% 0% 0%
Panchmahals 415 90% 0% 4% 3% 2% 0% 0% 116 94% 3% 0% 3% 0% 0% 57 96% 4% 0% 0% 0% 0%
Patan 199 87% 0% 6% 3% 3% 2% 0% 50 92% 4% 0% 4% 0% 0% 25 100% 0% 0% 0% 0% 0%
Porbandar 99 91% 0% 3% 1% 4% 0% 1% 42 98% 2% 0% 0% 0% 0% 20 95% 0% 0% 5% 0% 0%
Rajkot 548 88% 1% 4% 1% 4% 2% 0% 79 86% 5% 1% 8% 0% 0% 125 94% 4% 0% 2% 0% 0%
Sabarkantha 371 87% 0% 4% 3% 6% 0% 0% 141 91% 6% 0% 4% 0% 0% 60 98% 0% 0% 2% 0% 0%
SMC 516 86% 0% 2% 2% 6% 3% 0% 116 87% 2% 0% 9% 2% 0% 366 93% 1% 0% 4% 2% 0%
Surat (R) 284 90% 0% 5% 2% 3% 0% 0% 52 92% 2% 0% 6% 0% 0% 88 94% 5% 0% 1% 0% 0%
Surendranagar 251 75% 7% 11% 2% 5% 0% 0% 45 89% 7% 0% 4% 0% 0% 61 92% 2% 0% 7% 0% 0%
The Dangs 37 95% 0% 5% 0% 0% 0% 0% 11 82% 9% 0% 9% 0% 0% 7 71% 0% 0% 29% 0% 0%
Vadodara (R) 222 86% 0% 7% 3% 3% 0% 1% 48 81% 8% 0% 10% 0% 0% 57 89% 7% 0% 4% 0% 0%
Valsad 245 87% 0% 5% 1% 6% 0% 1% 24 88% 0% 0% 13% 0% 0% 59 98% 2% 0% 0% 0% 0%
VMC 239 85% 0% 8% 1% 4% 0% 3% 51 84% 10% 0% 6% 0% 0% 108 95% 1% 0% 2% 2% 0%
Vyara 150 91% 0% 3% 3% 3% 0% 0% 59 97% 3% 0% 0% 0% 0% 41 90% 7% 2% 0% 0% 0%
Gujarat State 8950 86.1% 0.4% 4.7% 2.6% 4.8% 0.8% 0.3% 1945 88.4% 5.2% 0.3% 5.4% 0.5% 0.1% 2492 92.3% 2.6% 0.3% 3.9% 1.0% 0.0%
New Extra Pulmonary
Treatment Outcome of New cases for 1st quarter 2012
DistrictNew Smear Positive New Smear Negative
Type of retreatment case Cured Success Died Failure Defaulted Transferr
ed outSwitch to
CAT IVNo.
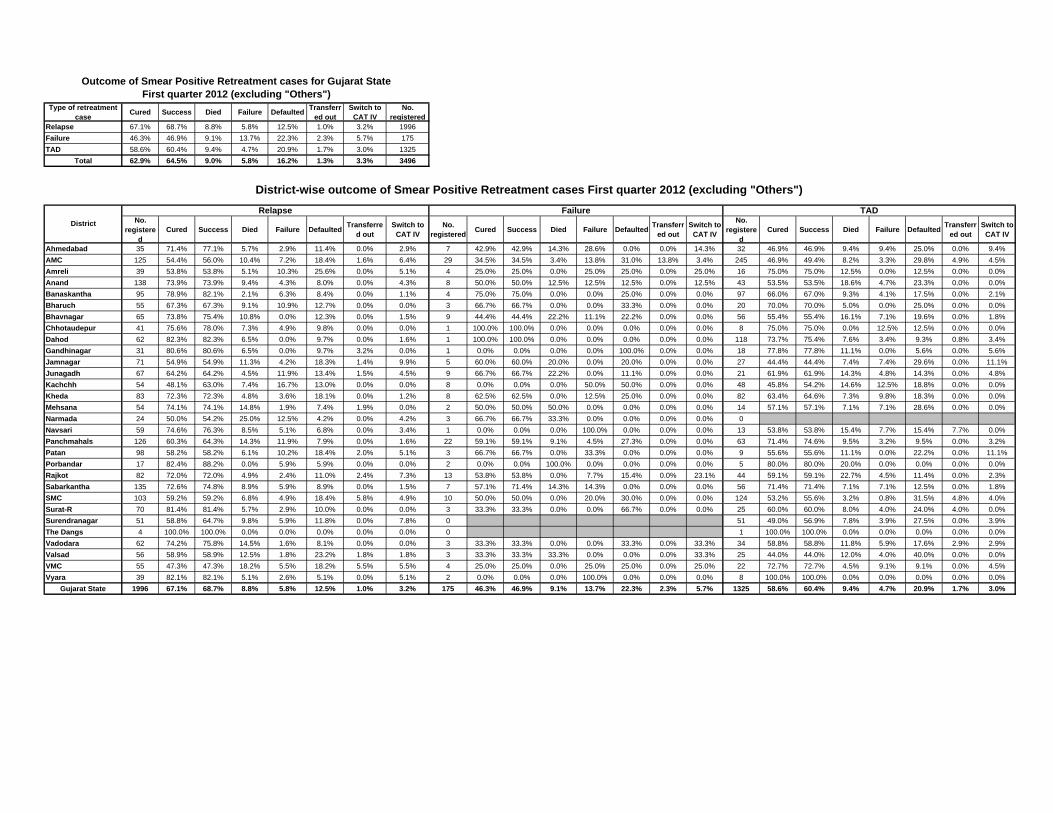
registeredRelapse 67.1% 68.7% 8.8% 5.8% 12.5% 1.0% 3.2% 1996Failure 46.3% 46.9% 9.1% 13.7% 22.3% 2.3% 5.7% 175TAD 58.6% 60.4% 9.4% 4.7% 20.9% 1.7% 3.0% 1325
Total 62.9% 64.5% 9.0% 5.8% 16.2% 1.3% 3.3% 3496
No. registere
dCured Success Died Failure Defaulted Transferre
d outSwitch to
CAT IVNo.
registered Cured Success Died Failure Defaulted Transferred out
Switch to CAT IV
No. registere
dCured Success Died Failure Defaulted Transferr
ed outSwitch to
CAT IV
Ahmedabad 35 71.4% 77.1% 5.7% 2.9% 11.4% 0.0% 2.9% 7 42.9% 42.9% 14.3% 28.6% 0.0% 0.0% 14.3% 32 46.9% 46.9% 9.4% 9.4% 25.0% 0.0% 9.4%AMC 125 54.4% 56.0% 10.4% 7.2% 18.4% 1.6% 6.4% 29 34.5% 34.5% 3.4% 13.8% 31.0% 13.8% 3.4% 245 46.9% 49.4% 8.2% 3.3% 29.8% 4.9% 4.5%Amreli 39 53.8% 53.8% 5.1% 10.3% 25.6% 0.0% 5.1% 4 25.0% 25.0% 0.0% 25.0% 25.0% 0.0% 25.0% 16 75.0% 75.0% 12.5% 0.0% 12.5% 0.0% 0.0%Anand 138 73.9% 73.9% 9.4% 4.3% 8.0% 0.0% 4.3% 8 50.0% 50.0% 12.5% 12.5% 12.5% 0.0% 12.5% 43 53.5% 53.5% 18.6% 4.7% 23.3% 0.0% 0.0%Banaskantha 95 78.9% 82.1% 2.1% 6.3% 8.4% 0.0% 1.1% 4 75.0% 75.0% 0.0% 0.0% 25.0% 0.0% 0.0% 97 66.0% 67.0% 9.3% 4.1% 17.5% 0.0% 2.1%Bharuch 55 67.3% 67.3% 9.1% 10.9% 12.7% 0.0% 0.0% 3 66.7% 66.7% 0.0% 0.0% 33.3% 0.0% 0.0% 20 70.0% 70.0% 5.0% 0.0% 25.0% 0.0% 0.0%Bhavnagar 65 73.8% 75.4% 10.8% 0.0% 12.3% 0.0% 1.5% 9 44.4% 44.4% 22.2% 11.1% 22.2% 0.0% 0.0% 56 55.4% 55.4% 16.1% 7.1% 19.6% 0.0% 1.8%Chhotaudepur 41 75.6% 78.0% 7.3% 4.9% 9.8% 0.0% 0.0% 1 100.0% 100.0% 0.0% 0.0% 0.0% 0.0% 0.0% 8 75.0% 75.0% 0.0% 12.5% 12.5% 0.0% 0.0%Dahod 62 82.3% 82.3% 6.5% 0.0% 9.7% 0.0% 1.6% 1 100.0% 100.0% 0.0% 0.0% 0.0% 0.0% 0.0% 118 73.7% 75.4% 7.6% 3.4% 9.3% 0.8% 3.4%Gandhinagar 31 80.6% 80.6% 6.5% 0.0% 9.7% 3.2% 0.0% 1 0.0% 0.0% 0.0% 0.0% 100.0% 0.0% 0.0% 18 77.8% 77.8% 11.1% 0.0% 5.6% 0.0% 5.6%Jamnagar 71 54.9% 54.9% 11.3% 4.2% 18.3% 1.4% 9.9% 5 60.0% 60.0% 20.0% 0.0% 20.0% 0.0% 0.0% 27 44.4% 44.4% 7.4% 7.4% 29.6% 0.0% 11.1%Junagadh 67 64.2% 64.2% 4.5% 11.9% 13.4% 1.5% 4.5% 9 66.7% 66.7% 22.2% 0.0% 11.1% 0.0% 0.0% 21 61.9% 61.9% 14.3% 4.8% 14.3% 0.0% 4.8%Kachchh 54 48.1% 63.0% 7.4% 16.7% 13.0% 0.0% 0.0% 8 0.0% 0.0% 0.0% 50.0% 50.0% 0.0% 0.0% 48 45.8% 54.2% 14.6% 12.5% 18.8% 0.0% 0.0%Kheda 83 72.3% 72.3% 4.8% 3.6% 18.1% 0.0% 1.2% 8 62.5% 62.5% 0.0% 12.5% 25.0% 0.0% 0.0% 82 63.4% 64.6% 7.3% 9.8% 18.3% 0.0% 0.0%Mehsana 54 74.1% 74.1% 14.8% 1.9% 7.4% 1.9% 0.0% 2 50.0% 50.0% 50.0% 0.0% 0.0% 0.0% 0.0% 14 57.1% 57.1% 7.1% 7.1% 28.6% 0.0% 0.0%Narmada 24 50.0% 54.2% 25.0% 12.5% 4.2% 0.0% 4.2% 3 66.7% 66.7% 33.3% 0.0% 0.0% 0.0% 0.0% 0Navsari 59 74.6% 76.3% 8.5% 5.1% 6.8% 0.0% 3.4% 1 0.0% 0.0% 0.0% 100.0% 0.0% 0.0% 0.0% 13 53.8% 53.8% 15.4% 7.7% 15.4% 7.7% 0.0%Panchmahals 126 60.3% 64.3% 14.3% 11.9% 7.9% 0.0% 1.6% 22 59.1% 59.1% 9.1% 4.5% 27.3% 0.0% 0.0% 63 71.4% 74.6% 9.5% 3.2% 9.5% 0.0% 3.2%Patan 98 58.2% 58.2% 6.1% 10.2% 18.4% 2.0% 5.1% 3 66.7% 66.7% 0.0% 33.3% 0.0% 0.0% 0.0% 9 55.6% 55.6% 11.1% 0.0% 22.2% 0.0% 11.1%Porbandar 17 82.4% 88.2% 0.0% 5.9% 5.9% 0.0% 0.0% 2 0.0% 0.0% 100.0% 0.0% 0.0% 0.0% 0.0% 5 80.0% 80.0% 20.0% 0.0% 0.0% 0.0% 0.0%Rajkot 82 72.0% 72.0% 4.9% 2.4% 11.0% 2.4% 7.3% 13 53.8% 53.8% 0.0% 7.7% 15.4% 0.0% 23.1% 44 59.1% 59.1% 22.7% 4.5% 11.4% 0.0% 2.3%Sabarkantha 135 72.6% 74.8% 8.9% 5.9% 8.9% 0.0% 1.5% 7 57.1% 71.4% 14.3% 14.3% 0.0% 0.0% 0.0% 56 71.4% 71.4% 7.1% 7.1% 12.5% 0.0% 1.8%SMC 103 59.2% 59.2% 6.8% 4.9% 18.4% 5.8% 4.9% 10 50.0% 50.0% 0.0% 20.0% 30.0% 0.0% 0.0% 124 53.2% 55.6% 3.2% 0.8% 31.5% 4.8% 4.0%Surat-R 70 81.4% 81.4% 5.7% 2.9% 10.0% 0.0% 0.0% 3 33.3% 33.3% 0.0% 0.0% 66.7% 0.0% 0.0% 25 60.0% 60.0% 8.0% 4.0% 24.0% 4.0% 0.0%Surendranagar 51 58.8% 64.7% 9.8% 5.9% 11.8% 0.0% 7.8% 0 51 49.0% 56.9% 7.8% 3.9% 27.5% 0.0% 3.9%The Dangs 4 100.0% 100.0% 0.0% 0.0% 0.0% 0.0% 0.0% 0 1 100.0% 100.0% 0.0% 0.0% 0.0% 0.0% 0.0%Vadodara 62 74.2% 75.8% 14.5% 1.6% 8.1% 0.0% 0.0% 3 33.3% 33.3% 0.0% 0.0% 33.3% 0.0% 33.3% 34 58.8% 58.8% 11.8% 5.9% 17.6% 2.9% 2.9%Valsad 56 58.9% 58.9% 12.5% 1.8% 23.2% 1.8% 1.8% 3 33.3% 33.3% 33.3% 0.0% 0.0% 0.0% 33.3% 25 44.0% 44.0% 12.0% 4.0% 40.0% 0.0% 0.0%VMC 55 47.3% 47.3% 18.2% 5.5% 18.2% 5.5% 5.5% 4 25.0% 25.0% 0.0% 25.0% 25.0% 0.0% 25.0% 22 72.7% 72.7% 4.5% 9.1% 9.1% 0.0% 4.5%Vyara 39 82.1% 82.1% 5.1% 2.6% 5.1% 0.0% 5.1% 2 0.0% 0.0% 0.0% 100.0% 0.0% 0.0% 0.0% 8 100.0% 100.0% 0.0% 0.0% 0.0% 0.0% 0.0%
Gujarat State 1996 67.1% 68.7% 8.8% 5.8% 12.5% 1.0% 3.2% 175 46.3% 46.9% 9.1% 13.7% 22.3% 2.3% 5.7% 1325 58.6% 60.4% 9.4% 4.7% 20.9% 1.7% 3.0%
TAD
District-wise outcome of Smear Positive Retreatment cases First quarter 2012 (excluding "Others")
Outcome of Smear Positive Retreatment cases for Gujarat StateFirst quarter 2012 (excluding "Others")
FailureDistrict
Relapse
0
500
1000
1500
2000
2500
3000
3500
4000
4500
5000
5500
6000
6500
7000
1Q07
2Q07
3Q07
4Q07
1Q08
2Q08
3Q08
4Q08
1Q09
2Q09
3Q09
4Q09
1Q10
2Q10
3Q10
4Q10
1Q11
2Q11
3Q11
4Q11
1Q12
2Q12
3Q12
4Q12
1Q13
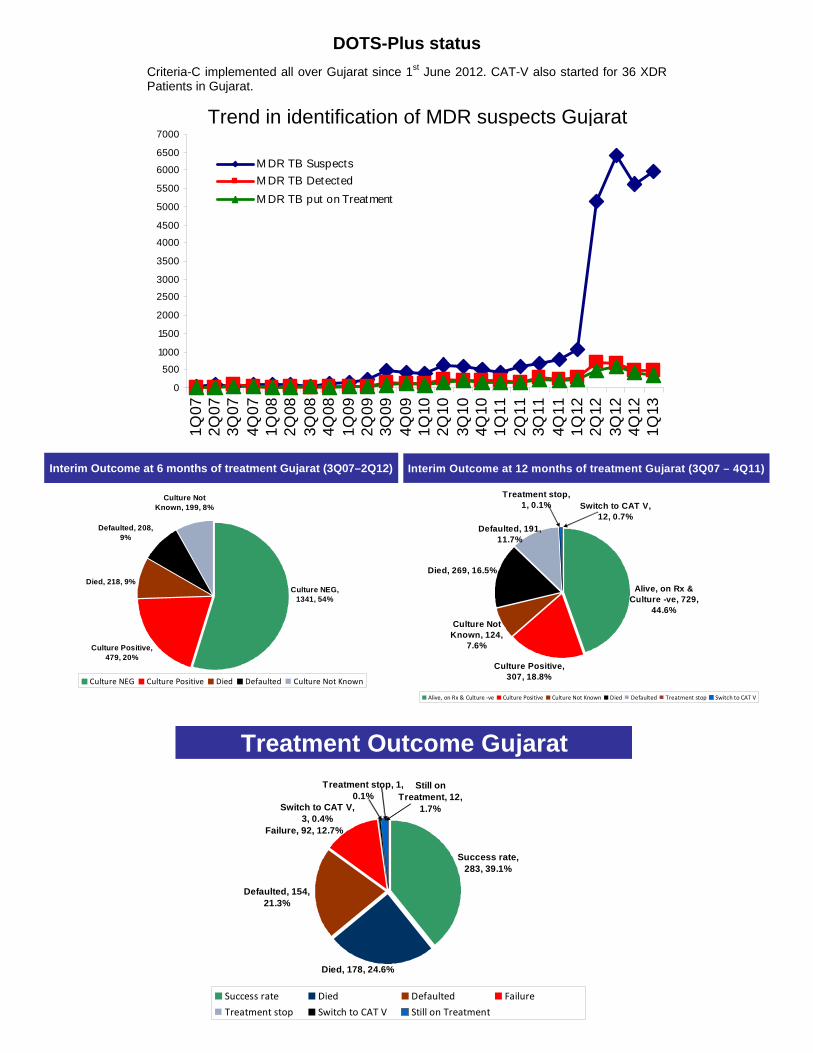
M DR TB SuspectsM DR TB DetectedM DR TB put on Treatment
Treatment Outcome Gujarat
Switch to CAT V, 3, 0.4%
Still on Treatment, 12,
1.7%
Died, 178, 24.6%
Defaulted, 154, 21.3%
Failure, 92, 12.7%
Success rate, 283, 39.1%
Treatment stop, 1, 0.1%
Success rate Died Defaulted Failure
Treatment stop Switch to CAT V Still on Treatment
Trend in identification of MDR suspects Gujarat
Interim Outcome at 6 months of treatment Gujarat (3Q07–2Q12)
Culture Not Known, 199, 8%
Culture NEG, 1341, 54%
Defaulted, 208, 9%
Died, 218, 9%
Culture Positive, 479, 20%
Culture NEG Culture Positive Died Defaulted Culture Not Known
Interim Outcome at 12 months of treatment Gujarat (3Q07 – 4Q11)
Treatment stop, 1, 0.1% Switch to CAT V,
12, 0.7%
Culture Positive, 307, 18.8%
Culture Not Known, 124,
7.6%
Died, 269, 16.5%
Alive, on Rx & Culture -ve, 729,
44.6%
Defaulted, 191, 11.7%
Alive, on Rx & Culture ‐ve Culture Positive Culture Not Known Died Defaulted Treatment stop Switch to CAT V
DOTS-Plus status
Criteria-C implemented all over Gujarat since 1st June 2012. CAT-V also started for 36 XDR Patients in Gujarat.
Sr. No. DISTRICT Total No.
of TUsTotal No. of DMCs
Total No. of PHIs other than DMCs
Total No. of Sputum
collection centres
Total No. of DOT
Centres/providers
TB Patient Provider Meetings
Community
Meetings
School based
activities
Sensitizations: PRI /
PPs/NGOs
etc
Outdoor publicity : Local folk/mass media campaign/
mela
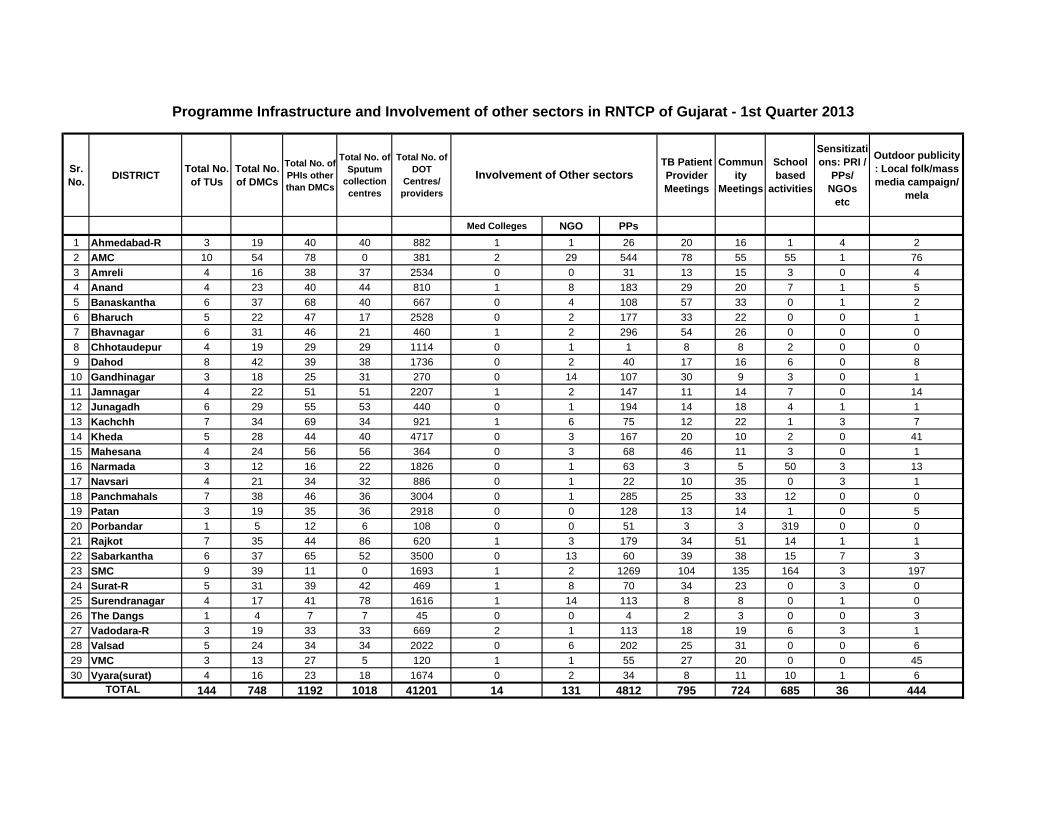
Med Colleges NGO PPs1 Ahmedabad-R 3 19 40 40 882 1 1 26 20 16 1 4 22 AMC 10 54 78 0 381 2 29 544 78 55 55 1 763 Amreli 4 16 38 37 2534 0 0 31 13 15 3 0 44 Anand 4 23 40 44 810 1 8 183 29 20 7 1 55 Banaskantha 6 37 68 40 667 0 4 108 57 33 0 1 26 Bharuch 5 22 47 17 2528 0 2 177 33 22 0 0 17 Bhavnagar 6 31 46 21 460 1 2 296 54 26 0 0 08 Chhotaudepur 4 19 29 29 1114 0 1 1 8 8 2 0 09 Dahod 8 42 39 38 1736 0 2 40 17 16 6 0 810 Gandhinagar 3 18 25 31 270 0 14 107 30 9 3 0 111 Jamnagar 4 22 51 51 2207 1 2 147 11 14 7 0 1412 Junagadh 6 29 55 53 440 0 1 194 14 18 4 1 113 Kachchh 7 34 69 34 921 1 6 75 12 22 1 3 714 Kheda 5 28 44 40 4717 0 3 167 20 10 2 0 4115 Mahesana 4 24 56 56 364 0 3 68 46 11 3 0 116 Narmada 3 12 16 22 1826 0 1 63 3 5 50 3 1317 Navsari 4 21 34 32 886 0 1 22 10 35 0 3 118 Panchmahals 7 38 46 36 3004 0 1 285 25 33 12 0 019 Patan 3 19 35 36 2918 0 0 128 13 14 1 0 520 Porbandar 1 5 12 6 108 0 0 51 3 3 319 0 021 Rajkot 7 35 44 86 620 1 3 179 34 51 14 1 122 Sabarkantha 6 37 65 52 3500 0 13 60 39 38 15 7 323 SMC 9 39 11 0 1693 1 2 1269 104 135 164 3 19724 Surat-R 5 31 39 42 469 1 8 70 34 23 0 3 025 Surendranagar 4 17 41 78 1616 1 14 113 8 8 0 1 026 The Dangs 1 4 7 7 45 0 0 4 2 3 0 0 327 Vadodara-R 3 19 33 33 669 2 1 113 18 19 6 3 128 Valsad 5 24 34 34 2022 0 6 202 25 31 0 0 629 VMC 3 13 27 5 120 1 1 55 27 20 0 0 4530 Vyara(surat) 4 16 23 18 1674 0 2 34 8 11 10 1 6
144 748 1192 1018 41201 14 131 4812 795 724 685 36 444TOTAL
Programme Infrastructure and Involvement of other sectors in RNTCP of Gujarat - 1st Quarter 2013
Involvement of Other sectors
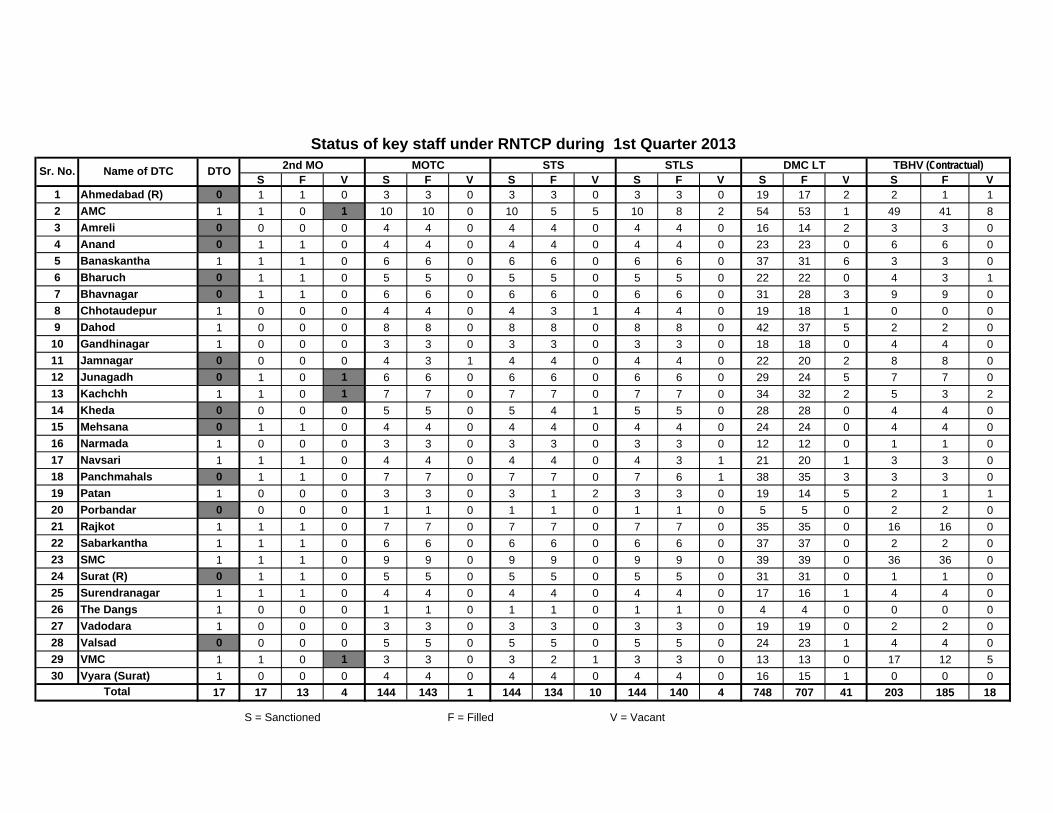
S F V S F V S F V S F V S F V S F V1 Ahmedabad (R) 0 1 1 0 3 3 0 3 3 0 3 3 0 19 17 2 2 1 12 AMC 1 1 0 1 10 10 0 10 5 5 10 8 2 54 53 1 49 41 83 Amreli 0 0 0 0 4 4 0 4 4 0 4 4 0 16 14 2 3 3 04 Anand 0 1 1 0 4 4 0 4 4 0 4 4 0 23 23 0 6 6 05 Banaskantha 1 1 1 0 6 6 0 6 6 0 6 6 0 37 31 6 3 3 06 Bharuch 0 1 1 0 5 5 0 5 5 0 5 5 0 22 22 0 4 3 17 Bhavnagar 0 1 1 0 6 6 0 6 6 0 6 6 0 31 28 3 9 9 08 Chhotaudepur 1 0 0 0 4 4 0 4 3 1 4 4 0 19 18 1 0 0 09 Dahod 1 0 0 0 8 8 0 8 8 0 8 8 0 42 37 5 2 2 0
10 Gandhinagar 1 0 0 0 3 3 0 3 3 0 3 3 0 18 18 0 4 4 011 Jamnagar 0 0 0 0 4 3 1 4 4 0 4 4 0 22 20 2 8 8 012 Junagadh 0 1 0 1 6 6 0 6 6 0 6 6 0 29 24 5 7 7 013 Kachchh 1 1 0 1 7 7 0 7 7 0 7 7 0 34 32 2 5 3 214 Kheda 0 0 0 0 5 5 0 5 4 1 5 5 0 28 28 0 4 4 015 Mehsana 0 1 1 0 4 4 0 4 4 0 4 4 0 24 24 0 4 4 016 Narmada 1 0 0 0 3 3 0 3 3 0 3 3 0 12 12 0 1 1 017 Navsari 1 1 1 0 4 4 0 4 4 0 4 3 1 21 20 1 3 3 018 Panchmahals 0 1 1 0 7 7 0 7 7 0 7 6 1 38 35 3 3 3 019 Patan 1 0 0 0 3 3 0 3 1 2 3 3 0 19 14 5 2 1 120 Porbandar 0 0 0 0 1 1 0 1 1 0 1 1 0 5 5 0 2 2 021 Rajkot 1 1 1 0 7 7 0 7 7 0 7 7 0 35 35 0 16 16 022 Sabarkantha 1 1 1 0 6 6 0 6 6 0 6 6 0 37 37 0 2 2 023 SMC 1 1 1 0 9 9 0 9 9 0 9 9 0 39 39 0 36 36 024 Surat (R) 0 1 1 0 5 5 0 5 5 0 5 5 0 31 31 0 1 1 025 Surendranagar 1 1 1 0 4 4 0 4 4 0 4 4 0 17 16 1 4 4 026 The Dangs 1 0 0 0 1 1 0 1 1 0 1 1 0 4 4 0 0 0 027 Vadodara 1 0 0 0 3 3 0 3 3 0 3 3 0 19 19 0 2 2 028 Valsad 0 0 0 0 5 5 0 5 5 0 5 5 0 24 23 1 4 4 029 VMC 1 1 0 1 3 3 0 3 2 1 3 3 0 13 13 0 17 12 530 Vyara (Surat) 1 0 0 0 4 4 0 4 4 0 4 4 0 16 15 1 0 0 0
17 17 13 4 144 143 1 144 134 10 144 140 4 748 707 41 203 185 18
Status of key staff under RNTCP during 1st Quarter 2013Sr. No. Name of DTC DTO 2nd MO MOTC STS STLS DMC LT TBHV (Contractual)
Total
S = Sanctioned F = Filled V = Vacant
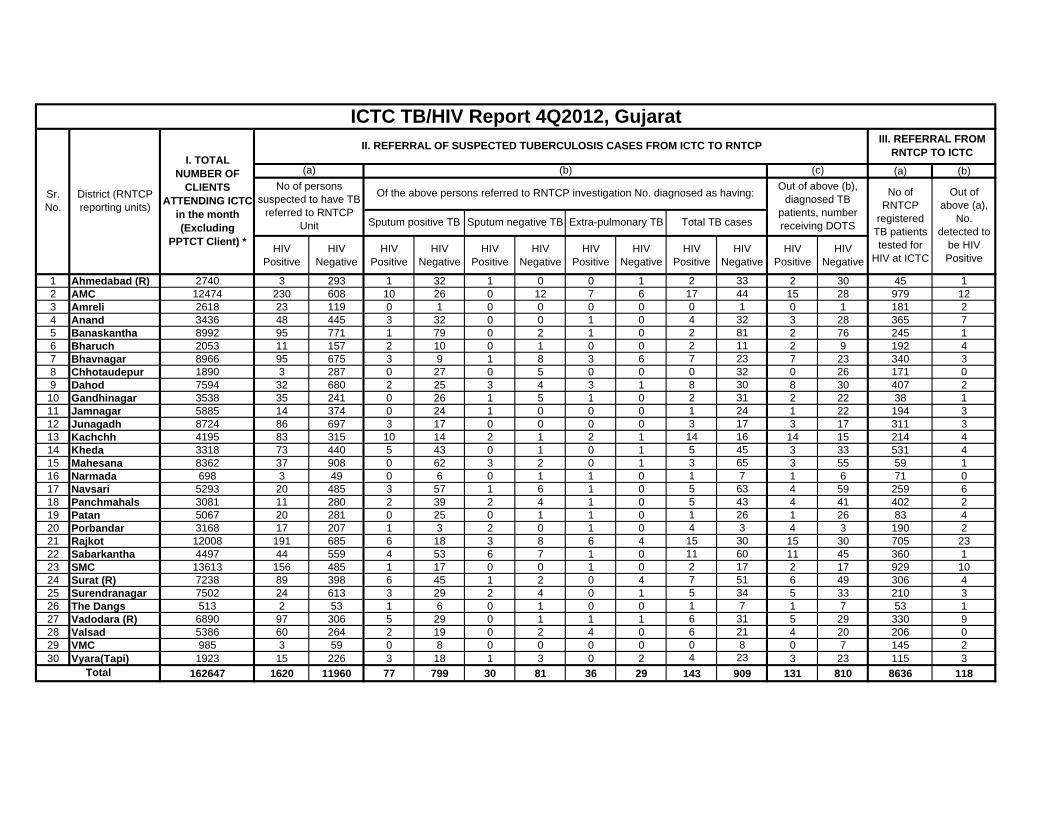
(a) (b)
HIV Positive
HIV Negative
HIV Positive
HIV Negative
HIV Positive
HIV Negative
HIV Positive
HIV Negative
HIV Positive
HIV Negative
HIV Positive
HIV Negative
1 Ahmedabad (R) 2740 3 293 1 32 1 0 0 1 2 33 2 30 45 12 AMC 12474 230 608 10 26 0 12 7 6 17 44 15 28 979 123 Amreli 2618 23 119 0 1 0 0 0 0 0 1 0 1 181 24 Anand 3436 48 445 3 32 0 0 1 0 4 32 3 28 365 75 Banaskantha 8992 95 771 1 79 0 2 1 0 2 81 2 76 245 16 Bharuch 2053 11 157 2 10 0 1 0 0 2 11 2 9 192 47 Bhavnagar 8966 95 675 3 9 1 8 3 6 7 23 7 23 340 38 Chhotaudepur 1890 3 287 0 27 0 5 0 0 0 32 0 26 171 09 Dahod 7594 32 680 2 25 3 4 3 1 8 30 8 30 407 2
10 Gandhinagar 3538 35 241 0 26 1 5 1 0 2 31 2 22 38 111 Jamnagar 5885 14 374 0 24 1 0 0 0 1 24 1 22 194 312 Junagadh 8724 86 697 3 17 0 0 0 0 3 17 3 17 311 313 Kachchh 4195 83 315 10 14 2 1 2 1 14 16 14 15 214 414 Kheda 3318 73 440 5 43 0 1 0 1 5 45 3 33 531 415 Mahesana 8362 37 908 0 62 3 2 0 1 3 65 3 55 59 116 Narmada 698 3 49 0 6 0 1 1 0 1 7 1 6 71 017 Navsari 5293 20 485 3 57 1 6 1 0 5 63 4 59 259 618 Panchmahals 3081 11 280 2 39 2 4 1 0 5 43 4 41 402 219 Patan 5067 20 281 0 25 0 1 1 0 1 26 1 26 83 420 Porbandar 3168 17 207 1 3 2 0 1 0 4 3 4 3 190 221 Rajkot 12008 191 685 6 18 3 8 6 4 15 30 15 30 705 2322 Sabarkantha 4497 44 559 4 53 6 7 1 0 11 60 11 45 360 123 SMC 13613 156 485 1 17 0 0 1 0 2 17 2 17 929 1024 Surat (R) 7238 89 398 6 45 1 2 0 4 7 51 6 49 306 425 Surendranagar 7502 24 613 3 29 2 4 0 1 5 34 5 33 210 326 The Dangs 513 2 53 1 6 0 1 0 0 1 7 1 7 53 127 Vadodara (R) 6890 97 306 5 29 0 1 1 1 6 31 5 29 330 928 Valsad 5386 60 264 2 19 0 2 4 0 6 21 4 20 206 029 VMC 985 3 59 0 8 0 0 0 0 0 8 0 7 145 230 Vyara(Tapi) 1923 15 226 3 18 1 3 0 2 4 23 3 23 115 3
162647 1620 11960 77 799 30 81 36 29 143 909 131 810 8636 118Total
Total TB cases
Of the above persons referred to RNTCP investigation No. diagnosed as having:
Sputum positive TB Sputum negative TB Extra-pulmonary TB
Sr. No.
District (RNTCP reporting units)
I. TOTAL NUMBER OF
CLIENTS ATTENDING ICTC
in the month (Excluding
PPTCT Client) *
II. REFERRAL OF SUSPECTED TUBERCULOSIS CASES FROM ICTC TO RNTCP
ICTC TB/HIV Report 4Q2012, GujaratIII. REFERRAL FROM
RNTCP TO ICTC
No of RNTCP
registered TB patients tested for
HIV at ICTC
Out of above (a),
No. detected to
be HIV Positive
(b)(a) (c)No of persons
suspected to have TB referred to RNTCP
Unit
Out of above (b), diagnosed TB
patients, number receiving DOTS
Sputum positive TB
Sputum negative TB
Extra-pulmonary TB
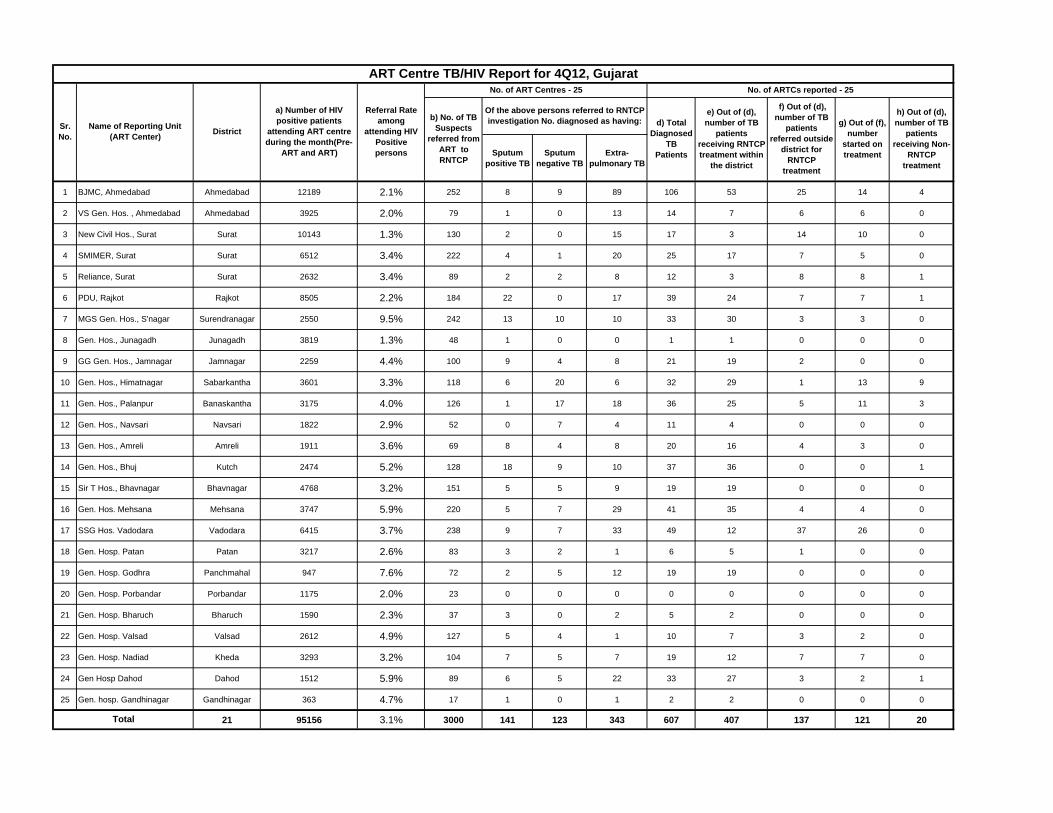
1 BJMC, Ahmedabad Ahmedabad 12189 2.1% 252 8 9 89 106 53 25 14 4
2 VS Gen. Hos. , Ahmedabad Ahmedabad 3925 2.0% 79 1 0 13 14 7 6 6 0
3 New Civil Hos., Surat Surat 10143 1.3% 130 2 0 15 17 3 14 10 0
4 SMIMER, Surat Surat 6512 3.4% 222 4 1 20 25 17 7 5 0
5 Reliance, Surat Surat 2632 3.4% 89 2 2 8 12 3 8 8 1
6 PDU, Rajkot Rajkot 8505 2.2% 184 22 0 17 39 24 7 7 1
7 MGS Gen. Hos., S'nagar Surendranagar 2550 9.5% 242 13 10 10 33 30 3 3 0
8 Gen. Hos., Junagadh Junagadh 3819 1.3% 48 1 0 0 1 1 0 0 0
9 GG Gen. Hos., Jamnagar Jamnagar 2259 4.4% 100 9 4 8 21 19 2 0 0
10 Gen. Hos., Himatnagar Sabarkantha 3601 3.3% 118 6 20 6 32 29 1 13 9
11 Gen. Hos., Palanpur Banaskantha 3175 4.0% 126 1 17 18 36 25 5 11 3
12 Gen. Hos., Navsari Navsari 1822 2.9% 52 0 7 4 11 4 0 0 0
13 Gen. Hos., Amreli Amreli 1911 3.6% 69 8 4 8 20 16 4 3 0
14 Gen. Hos., Bhuj Kutch 2474 5.2% 128 18 9 10 37 36 0 0 1
15 Sir T Hos., Bhavnagar Bhavnagar 4768 3.2% 151 5 5 9 19 19 0 0 0
16 Gen. Hos. Mehsana Mehsana 3747 5.9% 220 5 7 29 41 35 4 4 0
17 SSG Hos. Vadodara Vadodara 6415 3.7% 238 9 7 33 49 12 37 26 0
18 Gen. Hosp. Patan Patan 3217 2.6% 83 3 2 1 6 5 1 0 0
19 Gen. Hosp. Godhra Panchmahal 947 7.6% 72 2 5 12 19 19 0 0 0
20 Gen. Hosp. Porbandar Porbandar 1175 2.0% 23 0 0 0 0 0 0 0 0
21 Gen. Hosp. Bharuch Bharuch 1590 2.3% 37 3 0 2 5 2 0 0 0
22 Gen. Hosp. Valsad Valsad 2612 4.9% 127 5 4 1 10 7 3 2 0
23 Gen. Hosp. Nadiad Kheda 3293 3.2% 104 7 5 7 19 12 7 7 0
24 Gen Hosp Dahod Dahod 1512 5.9% 89 6 5 22 33 27 3 2 1
25 Gen. hosp. Gandhinagar Gandhinagar 363 4.7% 17 1 0 1 2 2 0 0 0
21 95156 3.1% 3000 141 123 343 607 407 137 121 20
e) Out of (d), number of TB
patients receiving RNTCP treatment within
the district
Referral Rate among
attending HIV Positive persons
g) Out of (f), number
started on treatment
h) Out of (d), number of TB
patients receiving Non-
RNTCP treatment
f) Out of (d), number of TB
patients referred outside
district for RNTCP
treatment
No. of ART Centres - 25
Total
ART Centre TB/HIV Report for 4Q12, Gujarat
b) No. of TB Suspects
referred from ART to RNTCP
Of the above persons referred to RNTCP investigation No. diagnosed as having: d) Total
Diagnosed TB
Patients
No. of ARTCs reported - 25
Sr. No.
Name of Reporting Unit (ART Center) District
a) Number of HIV positive patients
attending ART centre during the month(Pre-
ART and ART)
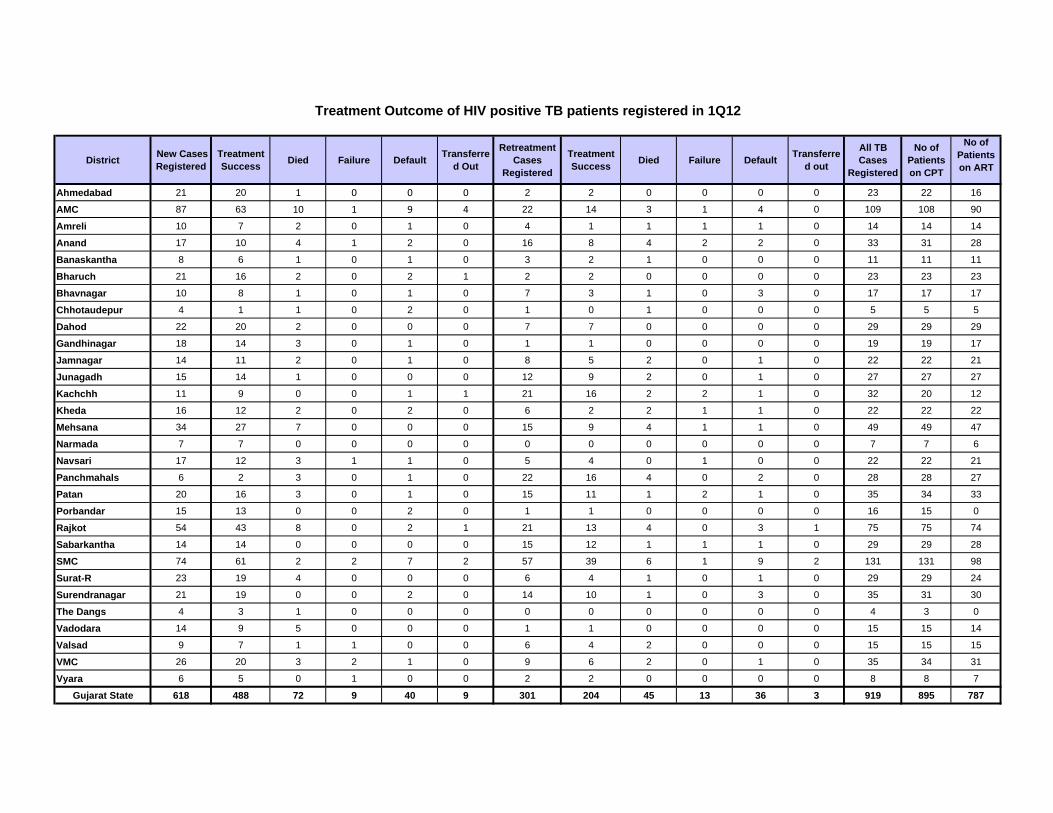
District New Cases Registered
Treatment Success Died Failure Default Transferre
d Out
Retreatment Cases
Registered
Treatment Success Died Failure Default Transferre
d out
All TB Cases
Registered
No of Patients on CPT
No of Patients on ART
Ahmedabad 21 20 1 0 0 0 2 2 0 0 0 0 23 22 16
AMC 87 63 10 1 9 4 22 14 3 1 4 0 109 108 90
Amreli 10 7 2 0 1 0 4 1 1 1 1 0 14 14 14
Anand 17 10 4 1 2 0 16 8 4 2 2 0 33 31 28
Banaskantha 8 6 1 0 1 0 3 2 1 0 0 0 11 11 11
Bharuch 21 16 2 0 2 1 2 2 0 0 0 0 23 23 23
Bhavnagar 10 8 1 0 1 0 7 3 1 0 3 0 17 17 17
Chhotaudepur 4 1 1 0 2 0 1 0 1 0 0 0 5 5 5
Dahod 22 20 2 0 0 0 7 7 0 0 0 0 29 29 29
Gandhinagar 18 14 3 0 1 0 1 1 0 0 0 0 19 19 17
Jamnagar 14 11 2 0 1 0 8 5 2 0 1 0 22 22 21
Junagadh 15 14 1 0 0 0 12 9 2 0 1 0 27 27 27
Kachchh 11 9 0 0 1 1 21 16 2 2 1 0 32 20 12
Kheda 16 12 2 0 2 0 6 2 2 1 1 0 22 22 22
Mehsana 34 27 7 0 0 0 15 9 4 1 1 0 49 49 47
Narmada 7 7 0 0 0 0 0 0 0 0 0 0 7 7 6
Navsari 17 12 3 1 1 0 5 4 0 1 0 0 22 22 21
Panchmahals 6 2 3 0 1 0 22 16 4 0 2 0 28 28 27
Patan 20 16 3 0 1 0 15 11 1 2 1 0 35 34 33
Porbandar 15 13 0 0 2 0 1 1 0 0 0 0 16 15 0
Rajkot 54 43 8 0 2 1 21 13 4 0 3 1 75 75 74
Sabarkantha 14 14 0 0 0 0 15 12 1 1 1 0 29 29 28
SMC 74 61 2 2 7 2 57 39 6 1 9 2 131 131 98
Surat-R 23 19 4 0 0 0 6 4 1 0 1 0 29 29 24
Surendranagar 21 19 0 0 2 0 14 10 1 0 3 0 35 31 30
The Dangs 4 3 1 0 0 0 0 0 0 0 0 0 4 3 0
Vadodara 14 9 5 0 0 0 1 1 0 0 0 0 15 15 14
Valsad 9 7 1 1 0 0 6 4 2 0 0 0 15 15 15
VMC 26 20 3 2 1 0 9 6 2 0 1 0 35 34 31
Vyara 6 5 0 1 0 0 2 2 0 0 0 0 8 8 7
Gujarat State 618 488 72 9 40 9 301 204 45 13 36 3 919 895 787
Treatment Outcome of HIV positive TB patients registered in 1Q12
Performance of RNTCP Case Detection (2013, First quarter), Smear Conversion (2012, Fourth quarter), and Treatment Outcomes (2012, First quarter)
District No TU
Popu-lation (in
lakh) covered
by RNTCP
No. of suspects examined
Suspects examined per lakh
population
Rate of change in suspects examined per lakh
population (compared
to same quarter in previous
year)
No of Smear
positive patients
diagnosed
Suspects examined per smear positive
case diagnosed
Rate of change in suspects examined
per s+ case
diagnosed (compared
to same quarter in previous
year)
Annualized smear
positive case
detection rate (from
PMR)
Annualized smear
positive case
notification rate [from CFR: sm + cases (NSP
+ Rel + TAD) * 4 /
Pop]
Total patients
registered for treatment
Annualized total case
notification rate
Annualized new smear
positive case
notification rate
New smear positive
case detection
rate
Annualized new smear
negative case
notification rate
Annualized new extra
pulmonary case
notification rate
Annualized
previously treated
case notificatio
n rate
Annualized
previously treated
smear positive
case notificatio
n rate
Ahmedabad 1 Bavla 5.7 1787 314 16.1% 265 6.7 9.6% 186 78 156 110 58 73% 7 13 29 20
Ahmedabad 2 Dhandhuka 5.4 805 149 155.3% 59 13.6 93.7% 44 76 123 91 56 70% 4 7 25 21
Ahmedabad 3 Viramgam 5.9 783 134 -5.3% 118 6.6 -26.5% 81 76 153 104 56 70% 8 10 30 20
AMC 4 Amaraiwadi 5.8 516 90 -19.5% 75 6.9 10.3% 52 60 171 119 44 55% 13 31 30 16
AMC 5 Central_zone 5.8 1460 253 0.7% 316 4.6 -2.1% 219 91 239 166 55 69% 15 46 49 35
AMC 6 Chandlodia 5.8 714 124 -5.6% 78 9.2 32.7% 54 53 158 110 33 42% 10 27 39 19
AMC 7 East_zone 5.8 1138 197 6.4% 152 7.5 -6.0% 105 81 255 177 59 74% 22 51 40 22
AMC 8 L.G. Hospital 5.8 879 152 0.4% 165 5.3 8.3% 114 65 201 139 41 51% 15 46 36 24
AMC 9 Memnagar 5.8 1081 188 13.4% 204 5.3 8.4% 142 68 175 122 51 63% 6 31 34 17
AMC 10 North_zone 5.8 981 170 0.6% 141 7.0 8.2% 98 69 231 160 49 61% 18 54 39 21
AMC 11 North-central_zone 5.8 764 133 4.7% 138 5.5 -15.8% 96 81 246 171 59 74% 14 56 42 22
AMC 12 South_zone 5.8 1096 190 6.2% 145 7.6 1.4% 101 91 277 192 61 76% 32 46 53 30
AMC 13 West_zone 5.8 818 142 1.7% 130 6.3 16.8% 90 61 175 122 47 59% 8 43 22 13
Amreli 14 Amreli_DTC 4.3 2034 477 27.2% 214 9.5 14.9% 201 88 111 104 75 94% 3 9 17 13
Amreli 15 Babra 3.9 286 73 -34.4% 32 8.9 -54.2% 33 66 81 83 57 71% 5 8 12 9
Amreli 16 Rajula 3.6 352 97 -17.0% 34 10.4 11.7% 38 54 70 77 34 43% 3 11 29 20
Amreli 17 Savarkundla 3.8 387 101 -7.6% 30 12.9 -18.6% 31 68 81 84 58 73% 7 5 14 9
Anand 18 Anklav 5.7 955 167 -5.5% 94 10.2 11.4% 66 91 184 128 57 71% 22 6 43 34
Anand 19 Khambhat 4.6 707 153 -1.1% 110 6.4 -11.3% 95 90 182 157 61 76% 42 13 40 29
Anand 20 Petlad 5.6 1405 253 -0.2% 238 5.9 5.4% 171 82 181 130 58 72% 14 22 36 24
Anand 21 Sarsa 5.7 860 151 -7.1% 107 8.0 21.9% 75 78 182 128 56 70% 14 29 29 22
Banaskantha 22 Danta 4.9 881 180 10.6% 130 6.8 2.1% 106 93 159 130 59 74% 13 6 52 34
Banaskantha 23 Deesa 5.9 1183 201 9.9% 187 6.3 -3.1% 127 79 176 120 56 70% 8 22 33 22
Banaskantha 24 Dhanera 3.3 531 159 29.6% 77 6.9 28.3% 92 77 81 97 56 70% 5 6 30 20
Banaskantha 25 Diodar 6.2 1050 168 13.8% 127 8.3 26.7% 81 77 150 96 57 71% 3 5 31 20
Banaskantha 26 Palanpur 6.2 1217 197 0.5% 183 6.7 6.7% 118 90 202 130 56 70% 10 16 48 34
Banaskantha 27 Tharad 5.7 884 155 -3.5% 132 6.7 1.1% 93 71 114 80 56 70% 3 1 20 15
Bharuch 28 Amod 4.1 580 141 -9.2% 72 8.1 1.3% 70 73 105 102 56 70% 4 14 20 17
Bharuch 29 Bharuch 4.5 798 178 6.2% 129 6.2 6.3% 115 80 136 121 57 71% 19 12 32 23
Bharuch 30 Hansot 3.9 585 151 -2.8% 57 10.3 -1.2% 59 74 116 120 59 73% 15 15 30 15
Bharuch 31 Jhagadia 2.0 493 242 2.5% 122 4.0 -4.3% 239 116 78 153 94 118% 14 14 29 22
Bharuch 32 Valia 1.5 332 221 -1.7% 28 11.9 46.4% 74 117 61 162 77 96% 11 24 43 40
Bhavnagar 33 Bhavnagar_Urban 6.5 1853 283 2.1% 286 6.5 -0.1% 175 80 198 121 56 70% 4 30 31 24
Bhavnagar 34 Botad 4.8 738 153 37.8% 57 12.9 48.0% 47 69 105 87 56 69% 3 7 21 13
Bhavnagar 35 Mahuva 4.7 705 151 #DIV/0! 80 8.8 #DIV/0! 68 79 132 113 57 72% 15 18 23 22
Bhavnagar 36 Palitana 4.6 857 185 26.5% 72 11.9 -5.8% 62 79 124 107 59 73% 10 16 22 20
Bhavnagar 37 Shihor 4.9 812 165 6.3% 90 9.0 -8.4% 73 73 115 94 57 71% 7 11 19 16
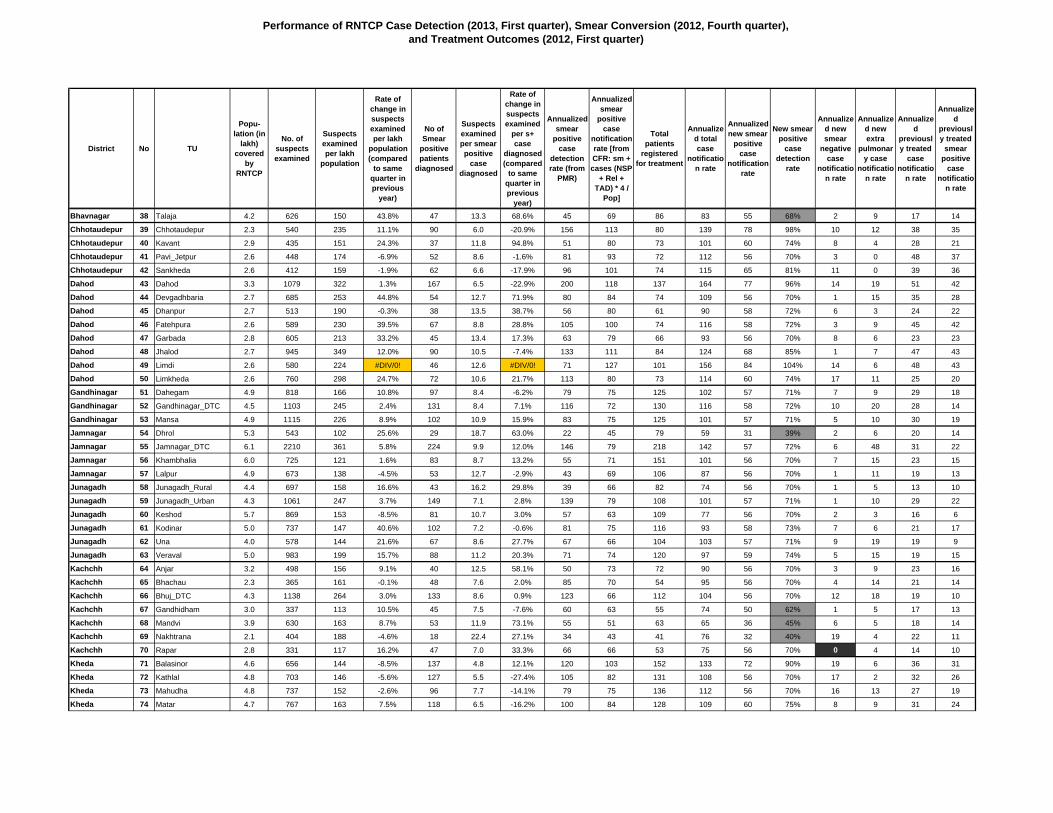
Performance of RNTCP Case Detection (2013, First quarter), Smear Conversion (2012, Fourth quarter), and Treatment Outcomes (2012, First quarter)
District No TU
Ahmedabad 1 Bavla
Ahmedabad 2 Dhandhuka
Ahmedabad 3 Viramgam
AMC 4 Amaraiwadi
AMC 5 Central_zone
AMC 6 Chandlodia
AMC 7 East_zone
AMC 8 L.G. Hospital
AMC 9 Memnagar
AMC 10 North_zone
AMC 11 North-central_zone
AMC 12 South_zone
AMC 13 West_zone
Amreli 14 Amreli_DTC
Amreli 15 Babra
Amreli 16 Rajula
Amreli 17 Savarkundla
Anand 18 Anklav
Anand 19 Khambhat
Anand 20 Petlad
Anand 21 Sarsa
Banaskantha 22 Danta
Banaskantha 23 Deesa
Banaskantha 24 Dhanera
Banaskantha 25 Diodar
Banaskantha 26 Palanpur
Banaskantha 27 Tharad
Bharuch 28 Amod
Bharuch 29 Bharuch
Bharuch 30 Hansot
Bharuch 31 Jhagadia
Bharuch 32 Valia
Bhavnagar 33 Bhavnagar_Urban
Bhavnagar 34 Botad
Bhavnagar 35 Mahuva
Bhavnagar 36 Palitana
Bhavnagar 37 Shihor
3 month conversion rate of
new smear positive patients
3 month conversion rate of
retreatment patients
Treatment Success rate of new
smear positive patients
Treatment success
rate among smear
positive previously treated
cases
Proportion of all
registered TB
cases with
known HIV
status
Proportion of TB patients
known to be HIV
infected among tested
Proportion of TB patients
known to be HIV
infected among
registered
Proportion of HIV infected
TB patients put on
CPT( RT report)
Proportion of HIV infected
TB patients put on
ART( RT report)
4 4% 89% 72% 85% 73% 107 96% 105 95% 77 89% 105 67% 94% 4% 4% 88% 38%
5 6% 93% 88% 85% 61% 89 86% 103 100% 65 87% 109 89% 98% 4% 4% 100% 83%
5 5% 90% 66% 87% 50% 93 84% 98 88% 72 86% 144 94% 93% 8% 7% 100% 89%
11 9% 87% 76% 84% 55% 80 93% 82 95% 75 96% 16 9% 84% 10% 8% 100% 46%
13 8% 85% 57% 79% 57% 122 93% 122 93% 80 93% 26 11% 77% 5% 4% 100% 100%
9 9% 93% 76% 71% 45% 65 86% 75 99% 61 87% 55 35% 99% 9% 9% 100% 70%
22 11% 88% 77% 90% 70% 110 95% 116 100% 109 100% 103 40% 99% 4% 4% 100% 93%
10 7% 83% 74% 77% 51% 87 93% 94 100% 69 85% 32 16% 78% 8% 6% 100% 100%
12 10% 87% 47% 66% 36% 95 97% 98 100% 64 98% 67 38% 99% 3% 3% 100% 100%
18 10% 84% 61% 68% 50% 92 92% 95 95% 70 100% 67 29% 81% 7% 6% 100% 82%
14 8% 76% 62% 72% 45% 100 85% 117 100% 78 98% 15 6% 84% 5% 4% 100% 83%
13 7% 84% 73% 71% 54% 127 97% 131 100% 87 96% 2 1% 99% 5% 5% 100% 50%
15 10% 83% 50% 84% 29% 82 94% 87 100% 0 0% 48 27% 90% 3% 3% 89% 89%
3 3% 93% 61% 90% 69% 88 94% 92 98% 69 93% 94 85% 88% 3% 3% #DIV/0! #DIV/0!
1 1% 91% 86% 87% 52% 62 95% 64 98% 54 92% 48 59% 85% 4% 4% 100% 100%
4 9% 90% 75% 86% 64% 47 96% 48 98% 45 87% 51 73% 91% 5% 4% 100% 100%
2 3% 91% 67% 91% 44% 58 89% 65 100% 48 91% 47 58% 80% 5% 4% 100% 100%
2 2% 93% 84% 85% 67% 124 95% 128 98% 84 86% 132 72% 83% 1% 1% 100% 63%
5 4% 94% 76% 93% 71% 96 92% 100 96% 96 96% 145 80% 80% 3% 2% 71% 71%
8 6% 94% 66% 85% 57% 105 92% 104 91% 90 95% 106 59% 85% 4% 3% 100% 100%
5 4% 96% 97% 89% 77% 106 95% 108 96% 107 98% 120 66% 83% 9% 7% 100% 100%
4 4% 93% 63% 88% 73% 104 92% 113 100% 76 93% 146 92% 95% 1% 1% 100% 100%
14 11% 94% 69% 86% 72% 114 98% 115 99% 90 96% 129 73% 98% 2% 2% 100% 100%
0 0% 91% 94% 85% 79% 58 91% 63 98% 50 93% 67 83% 95% 1% 1% #DIV/0! #DIV/0!
2 2% 93% 94% 92% 81% 115 96% 118 98% 104 95% 95 63% 95% 4% 4% 100% 100%
9 7% 90% 73% 90% 71% 136 98% 137 99% 106 96% 153 76% 92% 4% 4% 100% 100%
2 2% 94% 74% 90% 73% 98 97% 101 100% 86 93% 75 66% 93% 4% 4% 100% 100%
3 4% 93% 67% 86% 71% 67 89% 75 100% 56 82% 67 64% 91% 5% 5% 100% 100%
5 5% 90% 77% 85% 64% 79 88% 90 100% 58 87% 56 41% 100% 6% 6% 100% 100%
3 3% 93% 80% 91% 83% 66 92% 72 100% 56 90% 65 56% 93% 9% 9% 100% 100%
1 2% 93% 88% 87% 62% 52 88% 59 100% 38 90% 51 65% 85% 2% 1% 100% 100%
0 0% 95% 94% 86% 57% 39 89% 44 100% 35 85% 42 69% 92% 2% 2% 100% 100%
10 7% 95% 74% 83% 59% 131 100% 131 100% 89 96% 169 85% 97% 4% 4% 100% 100%
2 3% 92% 50% 87% 61% 79 95% 83 100% 78 96% 69 66% 95% 3% 3% 100% 100%
5 5% 95% 80% #DIV/0! #DIV/0! 90 97% 92 99% 0 #DIV/0! 85 64% 86% 3% 2% #DIV/0! #DIV/0!
3 3% 96% 82% 88% 58% 85 93% 91 100% 64 90% 51 41% 88% 3% 2% 100% 100%
3 3% 90% 83% 86% 62% 86 96% 87 97% 69 91% 82 71% 92% 6% 5% 100% 100%
No (%) of all Smear Positive cases
started RNTCP DOTS within 7 days of
diagnosis
No (%) of cases (all forms of TB)
registered receiving DOT
through a community volunteer
No (%) of all Smear Positive cases
registered within one month of starting
RNTCP DOTS treatment
No (%) of pediatric cases out of all New
cases
No (%) of all cured Smear Positive
cases having end of treatment follow-
up sputum done within 7 days of
last dose
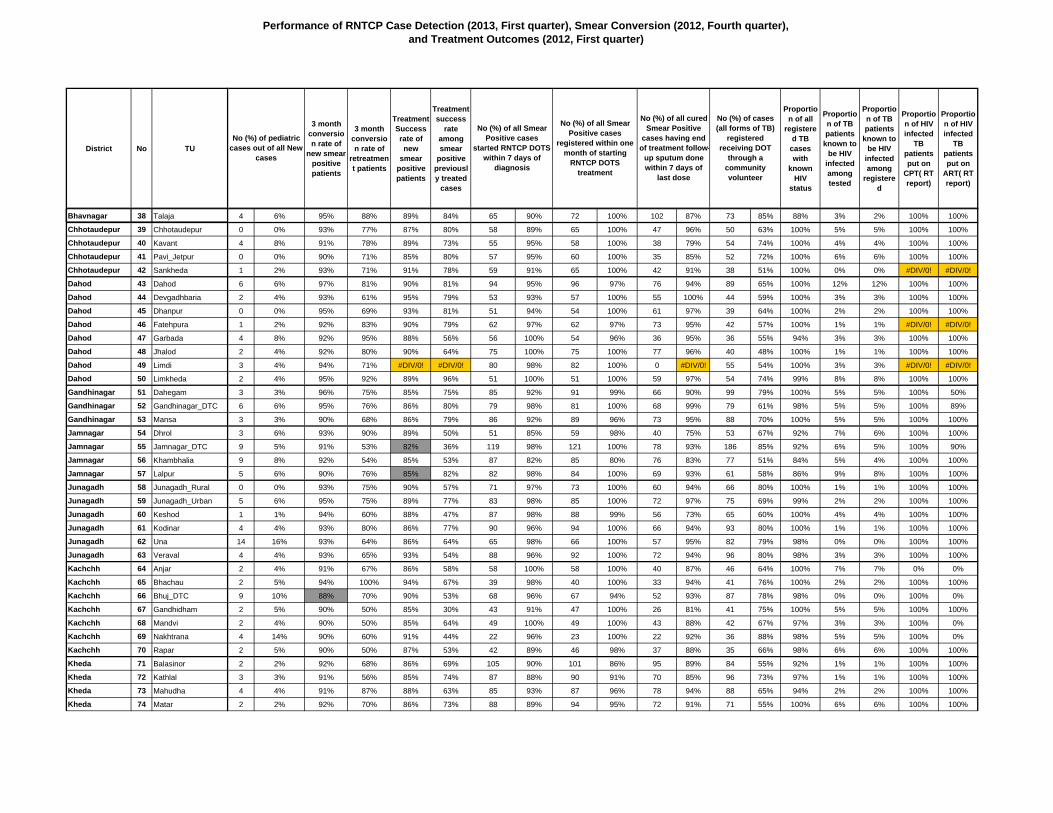
Performance of RNTCP Case Detection (2013, First quarter), Smear Conversion (2012, Fourth quarter), and Treatment Outcomes (2012, First quarter)
District No TU
Popu-lation (in
lakh) covered
by RNTCP
No. of suspects examined
Suspects examined per lakh
population
Rate of change in suspects examined per lakh
population (compared
to same quarter in previous
year)
No of Smear
positive patients
diagnosed
Suspects examined per smear positive
case diagnosed
Rate of change in suspects examined
per s+ case
diagnosed (compared
to same quarter in previous
year)
Annualized smear
positive case
detection rate (from
PMR)
Annualized smear
positive case
notification rate [from CFR: sm + cases (NSP
+ Rel + TAD) * 4 /
Pop]
Total patients
registered for treatment
Annualized total case
notification rate
Annualized new smear
positive case
notification rate
New smear positive
case detection
rate
Annualized new smear
negative case
notification rate
Annualized new extra
pulmonary case
notification rate
Annualized
previously treated
case notificatio
n rate
Annualized
previously treated
smear positive
case notificatio
n rate
Bhavnagar 38 Talaja 4.2 626 150 43.8% 47 13.3 68.6% 45 69 86 83 55 68% 2 9 17 14
Chhotaudepur 39 Chhotaudepur 2.3 540 235 11.1% 90 6.0 -20.9% 156 113 80 139 78 98% 10 12 38 35
Chhotaudepur 40 Kavant 2.9 435 151 24.3% 37 11.8 94.8% 51 80 73 101 60 74% 8 4 28 21
Chhotaudepur 41 Pavi_Jetpur 2.6 448 174 -6.9% 52 8.6 -1.6% 81 93 72 112 56 70% 3 0 48 37
Chhotaudepur 42 Sankheda 2.6 412 159 -1.9% 62 6.6 -17.9% 96 101 74 115 65 81% 11 0 39 36
Dahod 43 Dahod 3.3 1079 322 1.3% 167 6.5 -22.9% 200 118 137 164 77 96% 14 19 51 42
Dahod 44 Devgadhbaria 2.7 685 253 44.8% 54 12.7 71.9% 80 84 74 109 56 70% 1 15 35 28
Dahod 45 Dhanpur 2.7 513 190 -0.3% 38 13.5 38.7% 56 80 61 90 58 72% 6 3 24 22
Dahod 46 Fatehpura 2.6 589 230 39.5% 67 8.8 28.8% 105 100 74 116 58 72% 3 9 45 42
Dahod 47 Garbada 2.8 605 213 33.2% 45 13.4 17.3% 63 79 66 93 56 70% 8 6 23 23
Dahod 48 Jhalod 2.7 945 349 12.0% 90 10.5 -7.4% 133 111 84 124 68 85% 1 7 47 43
Dahod 49 Limdi 2.6 580 224 #DIV/0! 46 12.6 #DIV/0! 71 127 101 156 84 104% 14 6 48 43
Dahod 50 Limkheda 2.6 760 298 24.7% 72 10.6 21.7% 113 80 73 114 60 74% 17 11 25 20
Gandhinagar 51 Dahegam 4.9 818 166 10.8% 97 8.4 -6.2% 79 75 125 102 57 71% 7 9 29 18
Gandhinagar 52 Gandhinagar_DTC 4.5 1103 245 2.4% 131 8.4 7.1% 116 72 130 116 58 72% 10 20 28 14
Gandhinagar 53 Mansa 4.9 1115 226 8.9% 102 10.9 15.9% 83 75 125 101 57 71% 5 10 30 19
Jamnagar 54 Dhrol 5.3 543 102 25.6% 29 18.7 63.0% 22 45 79 59 31 39% 2 6 20 14
Jamnagar 55 Jamnagar_DTC 6.1 2210 361 5.8% 224 9.9 12.0% 146 79 218 142 57 72% 6 48 31 22
Jamnagar 56 Khambhalia 6.0 725 121 1.6% 83 8.7 13.2% 55 71 151 101 56 70% 7 15 23 15
Jamnagar 57 Lalpur 4.9 673 138 -4.5% 53 12.7 -2.9% 43 69 106 87 56 70% 1 11 19 13
Junagadh 58 Junagadh_Rural 4.4 697 158 16.6% 43 16.2 29.8% 39 66 82 74 56 70% 1 5 13 10
Junagadh 59 Junagadh_Urban 4.3 1061 247 3.7% 149 7.1 2.8% 139 79 108 101 57 71% 1 10 29 22
Junagadh 60 Keshod 5.7 869 153 -8.5% 81 10.7 3.0% 57 63 109 77 56 70% 2 3 16 6
Junagadh 61 Kodinar 5.0 737 147 40.6% 102 7.2 -0.6% 81 75 116 93 58 73% 7 6 21 17
Junagadh 62 Una 4.0 578 144 21.6% 67 8.6 27.7% 67 66 104 103 57 71% 9 19 19 9
Junagadh 63 Veraval 5.0 983 199 15.7% 88 11.2 20.3% 71 74 120 97 59 74% 5 15 19 15
Kachchh 64 Anjar 3.2 498 156 9.1% 40 12.5 58.1% 50 73 72 90 56 70% 3 9 23 16
Kachchh 65 Bhachau 2.3 365 161 -0.1% 48 7.6 2.0% 85 70 54 95 56 70% 4 14 21 14
Kachchh 66 Bhuj_DTC 4.3 1138 264 3.0% 133 8.6 0.9% 123 66 112 104 56 70% 12 18 19 10
Kachchh 67 Gandhidham 3.0 337 113 10.5% 45 7.5 -7.6% 60 63 55 74 50 62% 1 5 17 13
Kachchh 68 Mandvi 3.9 630 163 8.7% 53 11.9 73.1% 55 51 63 65 36 45% 6 5 18 14
Kachchh 69 Nakhtrana 2.1 404 188 -4.6% 18 22.4 27.1% 34 43 41 76 32 40% 19 4 22 11
Kachchh 70 Rapar 2.8 331 117 16.2% 47 7.0 33.3% 66 66 53 75 56 70% 0 4 14 10
Kheda 71 Balasinor 4.6 656 144 -8.5% 137 4.8 12.1% 120 103 152 133 72 90% 19 6 36 31
Kheda 72 Kathlal 4.8 703 146 -5.6% 127 5.5 -27.4% 105 82 131 108 56 70% 17 2 32 26
Kheda 73 Mahudha 4.8 737 152 -2.6% 96 7.7 -14.1% 79 75 136 112 56 70% 16 13 27 19
Kheda 74 Matar 4.7 767 163 7.5% 118 6.5 -16.2% 100 84 128 109 60 75% 8 9 31 24
Performance of RNTCP Case Detection (2013, First quarter), Smear Conversion (2012, Fourth quarter), and Treatment Outcomes (2012, First quarter)
District No TU
Bhavnagar 38 Talaja
Chhotaudepur 39 Chhotaudepur
Chhotaudepur 40 Kavant
Chhotaudepur 41 Pavi_Jetpur
Chhotaudepur 42 Sankheda
Dahod 43 Dahod
Dahod 44 Devgadhbaria
Dahod 45 Dhanpur
Dahod 46 Fatehpura
Dahod 47 Garbada
Dahod 48 Jhalod
Dahod 49 Limdi
Dahod 50 Limkheda
Gandhinagar 51 Dahegam
Gandhinagar 52 Gandhinagar_DTC
Gandhinagar 53 Mansa
Jamnagar 54 Dhrol
Jamnagar 55 Jamnagar_DTC
Jamnagar 56 Khambhalia
Jamnagar 57 Lalpur
Junagadh 58 Junagadh_Rural
Junagadh 59 Junagadh_Urban
Junagadh 60 Keshod
Junagadh 61 Kodinar
Junagadh 62 Una
Junagadh 63 Veraval
Kachchh 64 Anjar
Kachchh 65 Bhachau
Kachchh 66 Bhuj_DTC
Kachchh 67 Gandhidham
Kachchh 68 Mandvi
Kachchh 69 Nakhtrana
Kachchh 70 Rapar
Kheda 71 Balasinor
Kheda 72 Kathlal
Kheda 73 Mahudha
Kheda 74 Matar
3 month conversion rate of
new smear positive patients
3 month conversion rate of
retreatment patients
Treatment Success rate of new
smear positive patients
Treatment success
rate among smear
positive previously treated
cases
Proportion of all
registered TB
cases with
known HIV
status
Proportion of TB patients
known to be HIV
infected among tested
Proportion of TB patients
known to be HIV
infected among
registered
Proportion of HIV infected
TB patients put on
CPT( RT report)
Proportion of HIV infected
TB patients put on
ART( RT report)
No (%) of all Smear Positive cases
started RNTCP DOTS within 7 days of
diagnosis
No (%) of cases (all forms of TB)
registered receiving DOT
through a community volunteer
No (%) of all Smear Positive cases
registered within one month of starting
RNTCP DOTS treatment
No (%) of pediatric cases out of all New
cases
No (%) of all cured Smear Positive
cases having end of treatment follow-
up sputum done within 7 days of
last dose
4 6% 95% 88% 89% 84% 65 90% 72 100% 102 87% 73 85% 88% 3% 2% 100% 100%
0 0% 93% 77% 87% 80% 58 89% 65 100% 47 96% 50 63% 100% 5% 5% 100% 100%
4 8% 91% 78% 89% 73% 55 95% 58 100% 38 79% 54 74% 100% 4% 4% 100% 100%
0 0% 90% 71% 85% 80% 57 95% 60 100% 35 85% 52 72% 100% 6% 6% 100% 100%
1 2% 93% 71% 91% 78% 59 91% 65 100% 42 91% 38 51% 100% 0% 0% #DIV/0! #DIV/0!
6 6% 97% 81% 90% 81% 94 95% 96 97% 76 94% 89 65% 100% 12% 12% 100% 100%
2 4% 93% 61% 95% 79% 53 93% 57 100% 55 100% 44 59% 100% 3% 3% 100% 100%
0 0% 95% 69% 93% 81% 51 94% 54 100% 61 97% 39 64% 100% 2% 2% 100% 100%
1 2% 92% 83% 90% 79% 62 97% 62 97% 73 95% 42 57% 100% 1% 1% #DIV/0! #DIV/0!
4 8% 92% 95% 88% 56% 56 100% 54 96% 36 95% 36 55% 94% 3% 3% 100% 100%
2 4% 92% 80% 90% 64% 75 100% 75 100% 77 96% 40 48% 100% 1% 1% 100% 100%
3 4% 94% 71% #DIV/0! #DIV/0! 80 98% 82 100% 0 #DIV/0! 55 54% 100% 3% 3% #DIV/0! #DIV/0!
2 4% 95% 92% 89% 96% 51 100% 51 100% 59 97% 54 74% 99% 8% 8% 100% 100%
3 3% 96% 75% 85% 75% 85 92% 91 99% 66 90% 99 79% 100% 5% 5% 100% 50%
6 6% 95% 76% 86% 80% 79 98% 81 100% 68 99% 79 61% 98% 5% 5% 100% 89%
3 3% 90% 68% 86% 79% 86 92% 89 96% 73 95% 88 70% 100% 5% 5% 100% 100%
3 6% 93% 90% 89% 50% 51 85% 59 98% 40 75% 53 67% 92% 7% 6% 100% 100%
9 5% 91% 53% 82% 36% 119 98% 121 100% 78 93% 186 85% 92% 6% 5% 100% 90%
9 8% 92% 54% 85% 53% 87 82% 85 80% 76 83% 77 51% 84% 5% 4% 100% 100%
5 6% 90% 76% 85% 82% 82 98% 84 100% 69 93% 61 58% 86% 9% 8% 100% 100%
0 0% 93% 75% 90% 57% 71 97% 73 100% 60 94% 66 80% 100% 1% 1% 100% 100%
5 6% 95% 75% 89% 77% 83 98% 85 100% 72 97% 75 69% 99% 2% 2% 100% 100%
1 1% 94% 60% 88% 47% 87 98% 88 99% 56 73% 65 60% 100% 4% 4% 100% 100%
4 4% 93% 80% 86% 77% 90 96% 94 100% 66 94% 93 80% 100% 1% 1% 100% 100%
14 16% 93% 64% 86% 64% 65 98% 66 100% 57 95% 82 79% 98% 0% 0% 100% 100%
4 4% 93% 65% 93% 54% 88 96% 92 100% 72 94% 96 80% 98% 3% 3% 100% 100%
2 4% 91% 67% 86% 58% 58 100% 58 100% 40 87% 46 64% 100% 7% 7% 0% 0%
2 5% 94% 100% 94% 67% 39 98% 40 100% 33 94% 41 76% 100% 2% 2% 100% 100%
9 10% 88% 70% 90% 53% 68 96% 67 94% 52 93% 87 78% 98% 0% 0% 100% 0%
2 5% 90% 50% 85% 30% 43 91% 47 100% 26 81% 41 75% 100% 5% 5% 100% 100%
2 4% 90% 50% 85% 64% 49 100% 49 100% 43 88% 42 67% 97% 3% 3% 100% 0%
4 14% 90% 60% 91% 44% 22 96% 23 100% 22 92% 36 88% 98% 5% 5% 100% 0%
2 5% 90% 50% 87% 53% 42 89% 46 98% 37 88% 35 66% 98% 6% 6% 100% 100%
2 2% 92% 68% 86% 69% 105 90% 101 86% 95 89% 84 55% 92% 1% 1% 100% 100%
3 3% 91% 56% 85% 74% 87 88% 90 91% 70 85% 96 73% 97% 1% 1% 100% 100%
4 4% 91% 87% 88% 63% 85 93% 87 96% 78 94% 88 65% 94% 2% 2% 100% 100%
2 2% 92% 70% 86% 73% 88 89% 94 95% 72 91% 71 55% 100% 6% 6% 100% 100%
Performance of RNTCP Case Detection (2013, First quarter), Smear Conversion (2012, Fourth quarter), and Treatment Outcomes (2012, First quarter)
District No TU
Popu-lation (in
lakh) covered
by RNTCP
No. of suspects examined
Suspects examined per lakh
population
Rate of change in suspects examined per lakh
population (compared
to same quarter in previous
year)
No of Smear
positive patients
diagnosed
Suspects examined per smear positive
case diagnosed
Rate of change in suspects examined
per s+ case
diagnosed (compared
to same quarter in previous
year)
Annualized smear
positive case
detection rate (from
PMR)
Annualized smear
positive case
notification rate [from CFR: sm + cases (NSP
+ Rel + TAD) * 4 /
Pop]
Total patients
registered for treatment
Annualized total case
notification rate
Annualized new smear
positive case
notification rate
New smear positive
case detection
rate
Annualized new smear
negative case
notification rate
Annualized new extra
pulmonary case
notification rate
Annualized
previously treated
case notificatio
n rate
Annualized
previously treated
smear positive
case notificatio
n rate
Kheda 75 Nadiad 4.8 985 204 5.6% 197 5.0 -4.0% 163 74 133 110 56 69% 13 17 24 18
Mehsana 76 Kadi 4.4 841 192 -2.9% 64 13.1 11.0% 58 64 96 88 57 71% 4 15 13 7
Mehsana 77 Kheralu 5.8 979 169 -2.3% 115 8.5 -4.9% 80 69 124 86 58 73% 2 8 17 11
Mehsana 78 Mehsana_DTC 5.2 1319 254 7.6% 142 9.3 10.2% 109 68 141 109 56 70% 8 25 20 12
Mehsana 79 Visnagar 5.6 1074 191 -3.6% 106 10.1 12.8% 75 71 141 100 56 70% 9 11 25 15
Narmada 80 Dediapada 2.8 450 162 -28.2% 55 8.2 10.7% 79 95 88 126 66 83% 7 20 33 29
Narmada 81 Rajpipla 1.8 512 288 8.0% 73 7.0 -19.4% 164 115 73 164 76 95% 16 29 43 38
Narmada 82 Tilakwada 1.5 278 180 -34.9% 32 8.7 -29.7% 83 96 43 112 75 94% 3 5 29 21
Navsari 83 Chikhli 3.3 783 239 21.6% 76 10.3 -13.7% 93 78 79 96 57 72% 6 9 24 21
Navsari 84 Gandevi 3.5 614 178 6.7% 84 7.3 -12.2% 97 73 96 111 58 72% 9 23 21 15
Navsari 85 Navsari 4.8 865 181 12.7% 141 6.1 12.9% 118 91 182 152 60 75% 18 31 44 31
Navsari 86 Vansda 2.3 394 175 -9.1% 39 10.1 20.9% 69 66 65 115 59 73% 21 20 16 7
Panchmahals 87 Ghoghamba 2.5 418 165 -3.3% 57 7.3 -1.6% 90 80 71 112 65 81% 16 9 22 16
Panchmahals 88 Godhra 4.8 780 164 -4.2% 169 4.6 -4.9% 142 87 181 152 57 71% 24 17 49 30
Panchmahals 89 Halol 4.7 765 161 -8.4% 159 4.8 -20.3% 134 114 193 163 79 98% 24 22 39 35
Panchmahals 90 Kadana 2.7 440 164 9.5% 57 7.7 9.4% 85 87 76 114 61 77% 18 4 30 25
Panchmahals 91 Mora 2.7 345 130 -0.5% 46 7.5 12.2% 69 99 83 125 68 85% 11 11 35 32
Panchmahals 92 Santrampur 2.7 388 145 -6.9% 54 7.2 -21.1% 81 85 76 113 61 76% 12 10 30 24
Panchmahals 93 Shahera 4.6 866 187 8.1% 143 6.1 30.6% 123 95 153 132 66 82% 24 4 38 29
Patan 94 Chanasma 4.5 774 171 -9.9% 70 11.1 16.1% 62 85 124 110 57 72% 2 11 39 27
Patan 95 Patan 5.6 1334 239 -14.5% 203 6.6 -1.6% 145 83 171 122 60 75% 13 9 41 23
Patan 96 Radhanpur 3.8 924 245 25.3% 79 11.7 11.3% 84 71 93 99 50 62% 7 11 31 21
Porbandar 97 Porbandar 6.1 1078 178 13.1% 117 9.2 17.0% 77 73 203 134 64 80% 34 17 18 9
Rajkot 98 ADTC Morbi 6.2 997 161 10.4% 117 8.5 8.4% 76 71 127 82 57 71% 3 6 16 14
Rajkot 99 DTC Urban 6.5 2445 377 7.2% 352 6.9 2.9% 217 69 160 99 56 70% 2 15 25 13
Rajkot 100 Jetpur 5.9 1222 209 -7.2% 94 13.0 7.4% 64 64 148 101 56 70% 16 15 14 8
Rajkot 101 Kotda Sangani 4.8 645 134 11.3% 56 11.5 -13.1% 46 68 112 93 56 70% 5 14 17 12
Rajkot 102 PKH 6.5 888 137 -0.7% 90 9.9 -2.3% 55 66 131 81 56 70% 3 2 19 10
Rajkot 103 Rural Rajkot 4.8 750 158 3.0% 40 18.8 -5.7% 34 73 112 94 56 70% 2 14 22 17
Rajkot 104 Upleta 4.7 1055 225 -1.1% 83 12.7 -6.7% 71 70 110 94 56 70% 7 10 20 14
Sabarkantha 105 Bhiloda 2.8 433 152 -9.4% 81 5.3 1.2% 114 91 104 146 66 82% 35 11 34 25
Sabarkantha 106 Dhansura 5.7 729 128 -7.6% 130 5.6 7.7% 92 78 168 118 56 70% 18 12 32 22
Sabarkantha 107 Himatnagar 6.1 1174 192 -9.5% 238 4.9 -4.9% 156 86 235 154 57 71% 28 12 50 29
Sabarkantha 108 Idar 5.1 687 136 -2.2% 88 7.8 -8.5% 69 67 131 103 56 70% 13 10 24 11
Performance of RNTCP Case Detection (2013, First quarter), Smear Conversion (2012, Fourth quarter), and Treatment Outcomes (2012, First quarter)
District No TU
Kheda 75 Nadiad
Mehsana 76 Kadi
Mehsana 77 Kheralu
Mehsana 78 Mehsana_DTC
Mehsana 79 Visnagar
Narmada 80 Dediapada
Narmada 81 Rajpipla
Narmada 82 Tilakwada
Navsari 83 Chikhli
Navsari 84 Gandevi
Navsari 85 Navsari
Navsari 86 Vansda
Panchmahals 87 Ghoghamba
Panchmahals 88 Godhra
Panchmahals 89 Halol
Panchmahals 90 Kadana
Panchmahals 91 Mora
Panchmahals 92 Santrampur
Panchmahals 93 Shahera
Patan 94 Chanasma
Patan 95 Patan
Patan 96 Radhanpur
Porbandar 97 Porbandar
Rajkot 98 ADTC Morbi
Rajkot 99 DTC Urban
Rajkot 100 Jetpur
Rajkot 101 Kotda Sangani
Rajkot 102 PKH
Rajkot 103 Rural Rajkot
Rajkot 104 Upleta
Sabarkantha 105 Bhiloda
Sabarkantha 106 Dhansura
Sabarkantha 107 Himatnagar
Sabarkantha 108 Idar
3 month conversion rate of
new smear positive patients
3 month conversion rate of
retreatment patients
Treatment Success rate of new
smear positive patients
Treatment success
rate among smear
positive previously treated
cases
Proportion of all
registered TB
cases with
known HIV
status
Proportion of TB patients
known to be HIV
infected among tested
Proportion of TB patients
known to be HIV
infected among
registered
Proportion of HIV infected
TB patients put on
CPT( RT report)
Proportion of HIV infected
TB patients put on
ART( RT report)
No (%) of all Smear Positive cases
started RNTCP DOTS within 7 days of
diagnosis
No (%) of cases (all forms of TB)
registered receiving DOT
through a community volunteer
No (%) of all Smear Positive cases
registered within one month of starting
RNTCP DOTS treatment
No (%) of pediatric cases out of all New
cases
No (%) of all cured Smear Positive
cases having end of treatment follow-
up sputum done within 7 days of
last dose
6 6% 91% 70% 86% 64% 80 90% 85 96% 68 88% 85 64% 97% 4% 4% 100% 100%
4 5% 92% 80% 87% 70% 62 89% 68 97% 61 90% 40 42% 98% 7% 7% 100% 100%
6 6% 95% 91% 89% 82% 92 92% 95 95% 74 91% 70 56% 94% 8% 7% 100% 88%
12 10% 90% 68% 88% 62% 77 88% 86 98% 65 92% 89 63% 93% 15% 13% 100% 100%
6 6% 96% 73% 86% 69% 89 89% 94 94% 78 93% 59 42% 73% 10% 7% 100% 100%
2 3% 100% 82% 98% 78% 58 88% 66 100% 45 90% 87 99% 97% 1% 1% 100% 100%
4 7% 91% 82% 87% 36% 49 96% 51 100% 37 100% 51 70% 96% 7% 7% 100% 100%
0 0% 93% 100% 87% 57% 31 84% 37 100% 30 100% 37 86% 93% 5% 5% 100% 0%
1 2% 92% 75% 74% 63% 62 97% 64 100% 35 88% 71 90% 96% 1% 1% 100% 100%
6 8% 92% 86% 92% 67% 63 100% 63 100% 52 100% 73 76% 95% 5% 5% 100% 100%
10 8% 90% 87% 86% 68% 102 94% 104 95% 86 98% 147 81% 97% 8% 8% 100% 91%
2 4% 97% 100% 91% 87% 35 95% 37 100% 42 100% 41 63% 98% 2% 2% #DIV/0! #DIV/0!
3 5% 97% 91% 88% 54% 48 94% 51 100% 39 93% 59 83% 96% 0% 0% 100% 67%
9 7% 94% 69% 93% 61% 101 97% 104 100% 77 96% 163 90% 97% 7% 7% 100% 100%
14 10% 91% 59% 86% 53% 129 96% 135 100% 88 94% 170 88% 96% 2% 2% 100% 100%
2 4% 98% 86% 95% 80% 56 97% 56 97% 60 95% 62 82% 99% 0% 0% 100% 100%
4 7% 93% 78% 85% 65% 54 82% 66 100% 55 95% 71 86% 100% 2% 2% #DIV/0! #DIV/0!
1 2% 95% 74% 92% 86% 55 96% 57 100% 53 100% 59 78% 100% 1% 1% 100% 100%
4 4% 96% 88% 92% 70% 104 95% 110 100% 114 97% 108 71% 100% 2% 2% 100% 100%
3 4% 92% 90% 89% 68% 86 90% 96 100% 68 88% 65 52% 96% 2% 2% 100% 100%
3 3% 90% 41% 88% 50% 108 93% 116 100% 103 94% 142 83% 95% 4% 4% 95% 95%
4 6% 90% 100% 85% 68% 50 75% 65 97% 51 98% 72 77% 100% 2% 2% 100% 86%
17 10% 90% 53% 91% 79% 105 95% 110 100% 99 92% 68 33% 100% 7% 7% 94% 0%
4 4% 91% 79% 86% 63% 102 94% 107 98% 89 100% 53 42% 91% 3% 3% 100% 100%
7 6% 97% 71% 88% 70% 112 100% 112 100% 98 100% 78 49% 96% 7% 6% 100% 100%
21 17% 90% 86% 91% 71% 88 94% 94 100% 80 94% 40 27% 95% 1% 1% 100% 100%
5 5% 91% 77% 90% 70% 78 95% 82 100% 68 93% 52 46% 89% 4% 4% 100% 100%
4 4% 91% 75% 87% 54% 103 96% 107 100% 92 100% 23 18% 95% 10% 10% 100% 100%
9 10% 95% 71% 89% 67% 84 97% 87 100% 70 100% 54 48% 99% 7% 7% 100% 92%
7 8% 92% 69% 88% 80% 81 99% 82 100% 65 100% 57 52% 96% 8% 7% 100% 100%
2 3% 90% 92% 87% 74% 61 94% 64 98% 64 100% 80 77% 93% 6% 6% 100% 100%
2 2% 92% 79% 86% 71% 91 82% 109 98% 87 86% 144 86% 92% 5% 4% 100% 83%
11 7% 92% 85% 87% 71% 130 98% 131 99% 99 96% 183 78% 90% 4% 4% 100% 100%
3 3% 93% 88% 86% 86% 82 96% 82 96% 73 89% 95 73% 95% 6% 6% 100% 100%
Performance of RNTCP Case Detection (2013, First quarter), Smear Conversion (2012, Fourth quarter), and Treatment Outcomes (2012, First quarter)
District No TU
Popu-lation (in
lakh) covered
by RNTCP
No. of suspects examined
Suspects examined per lakh
population
Rate of change in suspects examined per lakh
population (compared
to same quarter in previous
year)
No of Smear
positive patients
diagnosed
Suspects examined per smear positive
case diagnosed
Rate of change in suspects examined
per s+ case
diagnosed (compared
to same quarter in previous
year)
Annualized smear
positive case
detection rate (from
PMR)
Annualized smear
positive case
notification rate [from CFR: sm + cases (NSP
+ Rel + TAD) * 4 /
Pop]
Total patients
registered for treatment
Annualized total case
notification rate
Annualized new smear
positive case
notification rate
New smear positive
case detection
rate
Annualized new smear
negative case
notification rate
Annualized new extra
pulmonary case
notification rate
Annualized
previously treated
case notificatio
n rate
Annualized
previously treated
smear positive
case notificatio
n rate
Sabarkantha 109 Khedbrahma 2.7 376 142 -4.2% 69 5.4 0.2% 104 86 88 133 68 85% 21 12 30 18
Sabarkantha 110 Meghraj 2.7 462 168 0.3% 56 8.3 27.5% 82 89 105 153 63 78% 41 10 39 26
SMC 111 BP 5.4 1158 216 49.7% 86 13.5 38.1% 64 76 165 123 61 77% 4 25 33 15
SMC 112 Hirabaug 4.6 1791 389 70.5% 300 6.0 -1.6% 261 72 159 138 57 72% 12 43 26 15
SMC 113 Karanj 5.2 950 183 #DIV/0! 95 10.0 #DIV/0! 73 90 247 190 72 89% 10 67 42 18
SMC 114 Katargam 5.3 1230 232 90.0% 103 11.9 37.4% 78 68 176 133 51 63% 5 38 39 17
SMC 115 Limbayat 5.1 839 165 32.7% 62 13.5 27.9% 49 66 138 108 49 62% 3 34 22 16
SMC 116 Navagam 5.3 841 159 #DIV/0! 65 12.9 #DIV/0! 49 72 213 161 57 71% 18 54 32 16
SMC 117 Pandesara 5.3 970 183 #DIV/0! 60 16.2 #DIV/0! 45 72 206 155 57 71% 15 47 37 15
SMC 118 Rander 4.9 796 162 57.3% 70 11.4 34.6% 57 72 128 104 57 71% 1 21 25 15
SMC 119 Udhana 5.1 872 171 29.4% 77 11.3 -5.0% 60 68 154 121 56 71% 13 27 24 12
Surat-R 120 Bardoli 4.0 693 175 -10.9% 112 6.2 -32.1% 113 103 138 139 83 103% 10 14 32 20
Surat-R 121 Kamrej 3.3 550 166 8.7% 92 6.0 15.5% 111 110 152 183 75 94% 28 30 51 35
Surat-R 122 Mandvee 2.5 375 152 7.6% 66 5.7 -7.8% 107 125 107 174 86 108% 24 11 52 39
Surat-R 123 Mangrol 2.9 596 207 -8.7% 111 5.4 -16.0% 154 97 93 129 71 89% 17 8 33 26
Surat-R 124 Surat 4.1 1644 400 4.2% 289 5.7 3.8% 281 83 118 115 56 71% 3 21 34 26
Surendranagar 125 Dhrangadhra 4.1 444 109 -10.5% 39 11.4 -11.3% 38 74 92 90 56 70% 4 9 22 18
Surendranagar 126 Muli 4.5 551 122 15.8% 63 8.7 -2.8% 56 76 115 102 56 70% 7 12 27 20
Surendranagar 127 Patdi 2.9 254 89 -4.7% 37 6.9 -13.5% 52 85 78 109 56 70% 6 8 39 29
Surendranagar 128 Surendranagar 6.7 2603 387 12.1% 332 7.8 11.6% 197 81 202 120 56 70% 8 17 39 26
The Dangs 129 Ahwa 2.3 426 182 -0.5% 49 8.7 -2.9% 84 80 56 96 56 70% 3 12 24 24
Vadodara 130 Baroda 5.3 2357 444 6.8% 378 6.2 -5.5% 285 89 163 123 65 81% 8 14 37 24
Vadodara 131 Padra 5.4 997 185 -4.5% 77 12.9 19.9% 57 83 173 128 59 74% 10 22 36 24
Vadodara 132 Savli 4.7 1161 246 3.0% 207 5.6 -17.0% 176 128 197 167 83 104% 11 14 59 45
Valsad 133 Bhilad 3.0 454 154 -8.5% 49 9.3 -5.1% 66 77 83 112 58 73% 7 22 26 19
Valsad 134 Dharampur 2.3 416 185 5.4% 44 9.5 19.4% 78 69 50 89 57 71% 2 12 18 12
Valsad 135 Kaprada 2.5 383 151 3.2% 48 8.0 -6.0% 76 79 59 93 58 73% 5 6 24 21
Valsad 136 Pardi 5.1 776 153 0.0% 85 9.1 11.3% 67 73 151 119 57 71% 15 17 30 16
Valsad 137 Valsad 4.8 930 193 1.6% 117 7.9 -11.7% 97 73 116 96 57 71% 4 8 27 17
VMC 138 Bawchawad 6.2 876 142 -7.8% 106 8.3 0.0% 69 69 196 127 45 57% 24 23 34 24
VMC 139 Gotri 5.9 942 159 6.5% 197 4.8 -4.9% 133 68 184 125 47 59% 12 33 31 20
VMC 140 Jubilibaug 5.1 592 115 -20.7% 68 8.7 -32.4% 53 63 136 106 56 70% 8 23 19 7
Vyara 141 Nizar 2.0 310 159 7.0% 38 8.2 0.2% 78 96 60 123 63 79% 12 14 33 33
Vyara 142 Songadh 2.4 507 214 -7.7% 51 9.9 45.4% 86 83 83 140 73 91% 27 13 27 10
Vyara 143 Valod 1.9 335 177 -0.8% 49 6.8 25.6% 104 112 83 175 89 111% 34 17 36 23
Vyara 144 Vyara 2.1 416 196 10.3% 70 5.9 10.5% 132 107 85 160 75 94% 32 8 43 32
624.5 118306 189 6.3% 15116 7.8 5.2% 97 78 18281 117 58 72% 11 18 30 20Gujarat State
Performance of RNTCP Case Detection (2013, First quarter), Smear Conversion (2012, Fourth quarter), and Treatment Outcomes (2012, First quarter)
District No TU
Sabarkantha 109 Khedbrahma
Sabarkantha 110 Meghraj
SMC 111 BP
SMC 112 Hirabaug
SMC 113 Karanj
SMC 114 Katargam
SMC 115 Limbayat
SMC 116 Navagam
SMC 117 Pandesara
SMC 118 Rander
SMC 119 Udhana
Surat-R 120 Bardoli
Surat-R 121 Kamrej
Surat-R 122 Mandvee
Surat-R 123 Mangrol
Surat-R 124 Surat
Surendranagar 125 Dhrangadhra
Surendranagar 126 Muli
Surendranagar 127 Patdi
Surendranagar 128 Surendranagar
The Dangs 129 Ahwa
Vadodara 130 Baroda
Vadodara 131 Padra
Vadodara 132 Savli
Valsad 133 Bhilad
Valsad 134 Dharampur
Valsad 135 Kaprada
Valsad 136 Pardi
Valsad 137 Valsad
VMC 138 Bawchawad
VMC 139 Gotri
VMC 140 Jubilibaug
Vyara 141 Nizar
Vyara 142 Songadh
Vyara 143 Valod
Vyara 144 Vyara
Gujarat State
3 month conversion rate of
new smear positive patients
3 month conversion rate of
retreatment patients
Treatment Success rate of new
smear positive patients
Treatment success
rate among smear
positive previously treated
cases
Proportion of all
registered TB
cases with
known HIV
status
Proportion of TB patients
known to be HIV
infected among tested
Proportion of TB patients
known to be HIV
infected among
registered
Proportion of HIV infected
TB patients put on
CPT( RT report)
Proportion of HIV infected
TB patients put on
ART( RT report)
No (%) of all Smear Positive cases
started RNTCP DOTS within 7 days of
diagnosis
No (%) of cases (all forms of TB)
registered receiving DOT
through a community volunteer
No (%) of all Smear Positive cases
registered within one month of starting
RNTCP DOTS treatment
No (%) of pediatric cases out of all New
cases
No (%) of all cured Smear Positive
cases having end of treatment follow-
up sputum done within 7 days of
last dose
7 10% 91% 89% 86% 81% 43 75% 50 88% 40 85% 87 99% 91% 0% 0% 100% 100%
1 1% 93% 69% 87% 66% 48 79% 60 98% 50 76% 42 40% 93% 0% 0% 100% 100%
6 5% 94% 69% 91% 61% 98 96% 102 100% 79 98% 20 12% 100% 5% 5% 100% 100%
12 9% 85% 68% 82% 58% 76 92% 83 100% 90 93% 50 31% 100% 9% 9% 100% 63%
11 6% 95% 90% #DIV/0! #DIV/0! 110 94% 117 100% 0 #DIV/0! 83 34% 100% 8% 8% #DIV/0! #DIV/0!
11 9% 86% 72% 89% 46% 86 96% 84 93% 76 97% 57 32% 100% 13% 13% 100% 52%
13 12% 96% 82% 85% 73% 80 95% 83 99% 122 98% 23 17% 99% 4% 4% 100% 73%
17 10% 93% 67% #DIV/0! #DIV/0! 92 96% 96 100% 0 #DIV/0! 77 36% 99% 3% 3% #DIV/0! #DIV/0!
21 13% 91% 67% #DIV/0! #DIV/0! 88 93% 95 100% 0 #DIV/0! 56 27% 100% 7% 7% #DIV/0! #DIV/0!
4 4% 92% 65% 89% 60% 79 90% 88 100% 81 96% 60 47% 98% 4% 4% 100% 92%
7 6% 90% 65% 87% 45% 81 93% 85 98% 104 92% 67 44% 100% 6% 6% 100% 95%
2 2% 92% 73% 86% 76% 90 88% 102 100% 60 91% 107 78% 96% 5% 4% 100% 71%
4 4% 93% 71% 91% 80% 84 92% 91 100% 74 93% 120 79% 95% 1% 1% 100% 86%
2 3% 92% 71% 95% 77% 73 95% 77 100% 52 96% 91 85% 95% 1% 1% 100% 67%
1 1% 98% 79% 93% 77% 67 96% 70 100% 58 95% 90 97% 96% 1% 1% 100% 100%
4 5% 91% 64% 89% 64% 78 92% 85 100% 62 91% 87 74% 97% 3% 3% 100% 100%
1 1% 91% 71% 86% 83% 73 97% 75 100% 53 95% 64 70% 101% 3% 3% 100% 75%
5 6% 90% 57% 66% 42% 82 96% 84 99% 28 97% 72 63% 97% 8% 8% 82% 82%
0 0% 88% 70% 85% 58% 58 95% 61 100% 41 85% 55 71% 97% 9% 9% 100% 100%
7 5% 95% 68% 90% 68% 135 99% 137 100% 103 93% 141 70% 99% 11% 10% 82% 82%
1 2% 88% 88% 95% 100% 44 94% 47 100% 37 93% 44 79% 100% 0% 0% 75% 0%
0 0% 93% 82% 80% 72% 112 95% 116 98% 73 95% 94 58% 94% 6% 6% 100% 100%
6 5% 97% 77% 91% 63% 107 96% 110 98% 88 95% 112 65% 98% 4% 4% 100% 75%
5 4% 90% 71% 86% 72% 141 93% 142 94% 80 92% 128 65% 96% 4% 4% 100% 100%
1 2% 90% 100% 90% 60% 55 96% 56 98% 43 93% 53 64% 98% 4% 4% 100% 100%
2 5% 90% 83% 80% 40% 36 92% 39 100% 28 100% 38 76% 98% 0% 0% 100% 100%
3 7% 91% 67% 86% 33% 45 90% 50 100% 30 88% 50 85% 95% 0% 0% 100% 100%
4 4% 91% 81% 89% 71% 78 85% 91 99% 74 93% 120 79% 99% 3% 3% 100% 100%
1 1% 90% 56% 85% 46% 81 92% 88 100% 65 94% 83 72% 100% 5% 5% 100% 100%
10 7% 84% 67% 86% 61% 96 90% 107 100% 70 72% 85 43% 76% 9% 7% 91% 82%
10 7% 88% 74% 83% 25% 91 91% 100 100% 62 85% 52 28% 91% 8% 7% 100% 100%
3 3% 90% 71% 85% 65% 76 94% 75 93% 74 99% 4 3% 99% 13% 13% 100% 88%
4 9% 97% 100% 91% 90% 44 94% 47 100% 37 97% 51 85% 100% 7% 7% 100% 100%
3 4% 96% 92% 90% 92% 48 98% 49 100% 54 98% 57 69% 96% 0% 0% 100% 100%
0 0% 93% 83% 97% 62% 46 87% 52 98% 39 93% 72 87% 89% 4% 4% 100% 100%
4 6% 95% 87% 88% 86% 48 84% 57 100% 40 95% 54 64% 100% 2% 2% 100% 50%
767 6% 92% 74% 87% 64% 11386 93% 11988 98% 9109 92% 10681 58% 94% 5% 5% 97% 86%
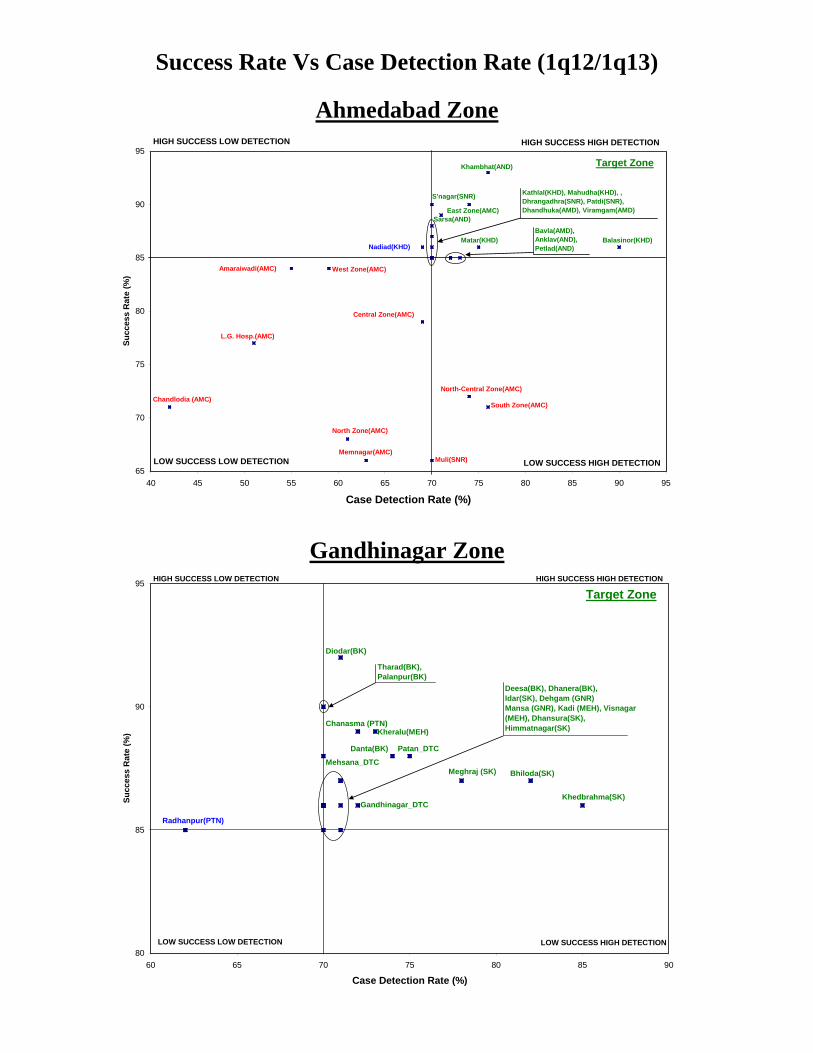
Success Rate Vs Case Detection Rate (1q12/1q13)
65
70
75
80
85
90
95
40 45 50 55 60 65 70 75 80 85 90 95
Case Detection Rate (%)
Succ
ess
Rat
e (%
)
Target Zone
HIGH SUCCESS HIGH DETECTIONHIGH SUCCESS LOW DETECTION
LOW SUCCESS LOW DETECTION LOW SUCCESS HIGH DETECTION
Central Zone(AMC)
South Zone(AMC)
Amaraiwadi(AMC)
Khambhat(AND)
Kathlal(KHD), Mahudha(KHD), ,Dhrangadhra(SNR), Patdi(SNR),Dhandhuka(AMD), Viramgam(AMD)
North-Central Zone(AMC)
Balasinor(KHD)
West Zone(AMC)
East Zone(AMC)
Memnagar(AMC)
L.G. Hosp.(AMC)
Chandlodia (AMC)
North Zone(AMC)
Matar(KHD)Bavla(AMD),Anklav(AND),Petlad(AND)
Muli(SNR)
Nadiad(KHD)
Sarsa(AND)
S'nagar(SNR)
80
85
90
95
60 65 70 75 80 85 90
Case Detection Rate (%)
Succ
ess
Rat
e (%
)
Meghraj (SK)
Target ZoneHIGH SUCCESS LOW DETECTION HIGH SUCCESS HIGH DETECTION
LOW SUCCESS LOW DETECTION LOW SUCCESS HIGH DETECTION
Patan_DTC
Deesa(BK), Dhanera(BK),Idar(SK), Dehgam (GNR)Mansa (GNR), Kadi (MEH), Visnagar (MEH), Dhansura(SK),Himmatnagar(SK)
Gandhinagar_DTC
Radhanpur(PTN)
Khedbrahma(SK)
Diodar(BK)
Tharad(BK),Palanpur(BK)
Kheralu(MEH)
Danta(BK)
Mehsana_DTCBhiloda(SK)
Chanasma (PTN)
Ahmedabad Zone
Gandhinagar Zone
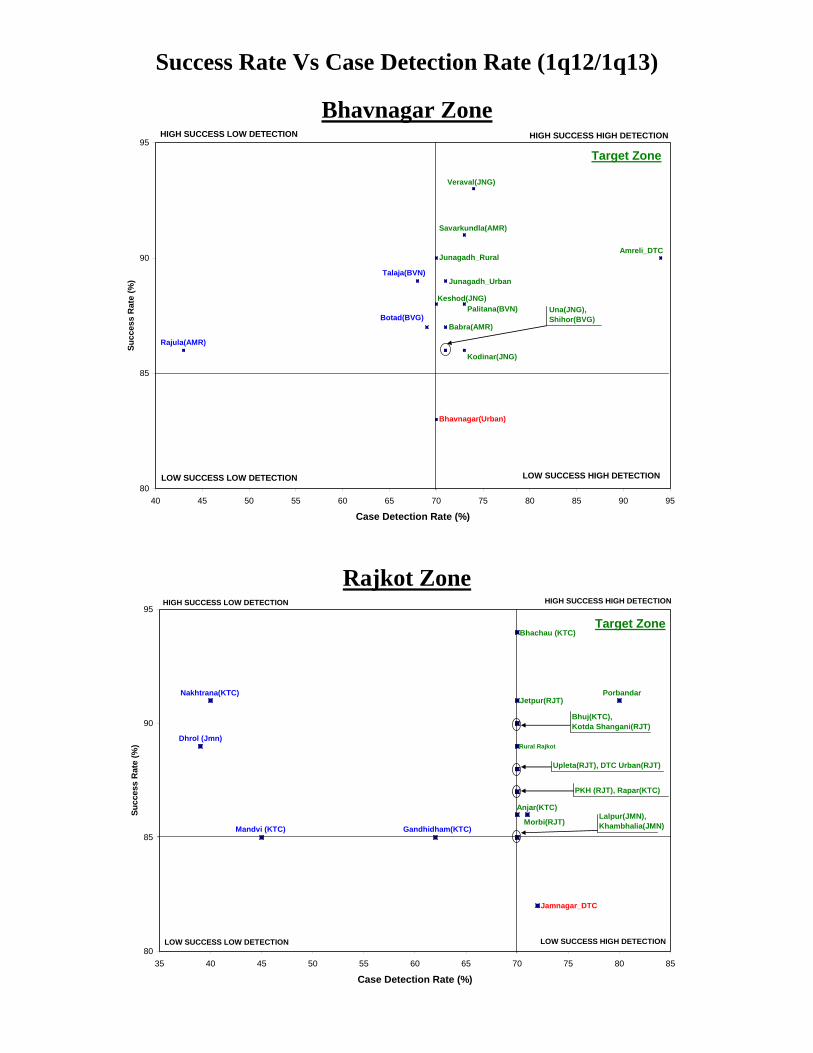
Success Rate Vs Case Detection Rate (1q12/1q13)
80
85
90
95
40 45 50 55 60 65 70 75 80 85 90 95
Case Detection Rate (%)
Succ
ess
Rat
e (%
)
Target Zone
HIGH SUCCESS LOW DETECTION HIGH SUCCESS HIGH DETECTION
LOW SUCCESS LOW DETECTION LOW SUCCESS HIGH DETECTION
Amreli_DTC
Junagadh_Urban
Veraval(JNG)
Una(JNG),Shihor(BVG)
Keshod(JNG)
Babra(AMR)
Savarkundla(AMR)
Palitana(BVN)
Kodinar(JNG)
Bhavnagar(Urban)
Rajula(AMR)
Botad(BVG)
Talaja(BVN)
Junagadh_Rural
80
85
90
95
35 40 45 50 55 60 65 70 75 80 85
Case Detection Rate (%)
Succ
ess
Rat
e (%
)
Target Zone
HIGH SUCCESS LOW DETECTION HIGH SUCCESS HIGH DETECTION
LOW SUCCESS LOW DETECTION LOW SUCCESS HIGH DETECTION
Dhrol (Jmn)
PorbandarNakhtrana(KTC)
Mandvi (KTC)
Anjar(KTC)Lalpur(JMN),Khambhalia(JMN)
Bhachau (KTC)
Jamnagar_DTC
Gandhidham(KTC)
Jetpur(RJT)
Bhuj(KTC), Kotda Shangani(RJT)
Rural Rajkot
Upleta(RJT), DTC Urban(RJT)
PKH (RJT), Rapar(KTC)
Morbi(RJT)
Bhavnagar Zone
Rajkot Zone
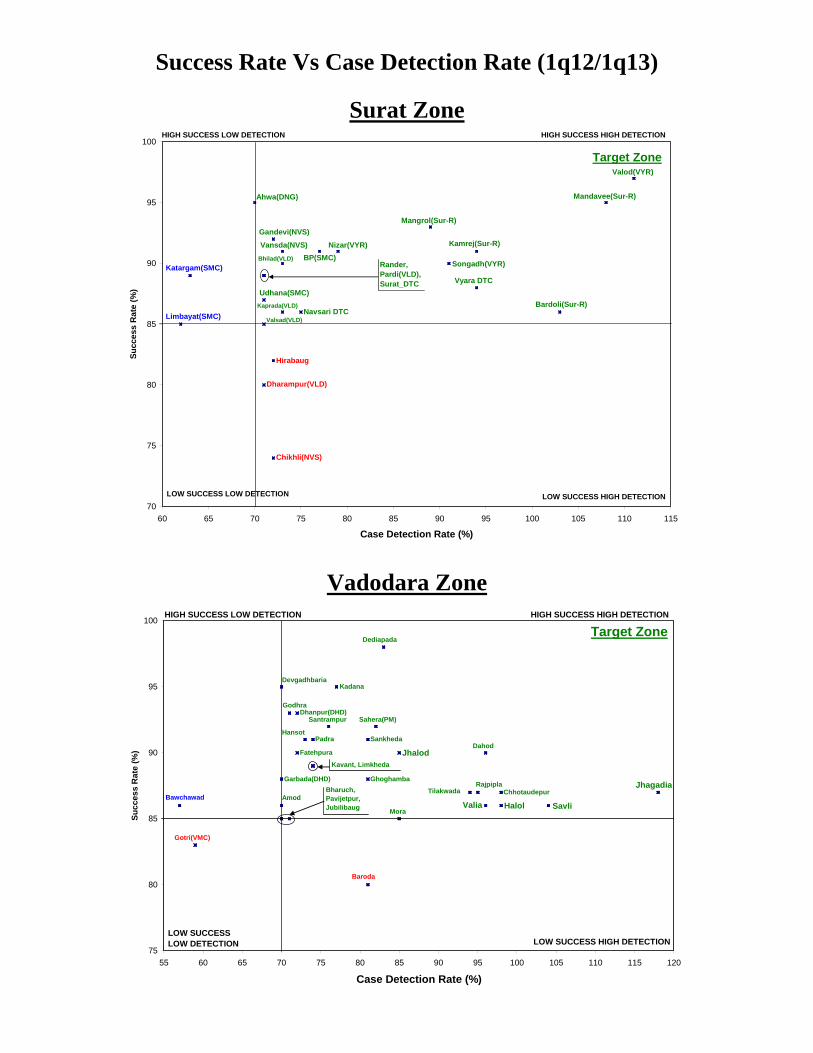
Success Rate Vs Case Detection Rate (1q12/1q13)
70
75
80
85
90
95
100
60 65 70 75 80 85 90 95 100 105 110 115
Case Detection Rate (%)
Succ
ess
Rat
e (%
)
Target Zone
HIGH SUCCESS LOW DETECTION HIGH SUCCESS HIGH DETECTION
LOW SUCCESS LOW DETECTION LOW SUCCESS HIGH DETECTION
Mangrol(Sur-R)
Vyara DTC
Valod(VYR)
Nizar(VYR) Kamrej(Sur-R)
Ahwa(DNG)
Bhilad(VLD) BP(SMC)Katargam(SMC)
Navsari DTC
Mandavee(Sur-R)
Bardoli(Sur-R)
Songadh(VYR)
Vansda(NVS)
Limbayat(SMC)
Hirabaug
Valsad(VLD)
Gandevi(NVS)
Udhana(SMC)Kaprada(VLD)
Chikhli(NVS)
Dharampur(VLD)
Rander,Pardi(VLD),Surat_DTC
75
80
85
90
95
100
55 60 65 70 75 80 85 90 95 100 105 110 115 120
Case Detection Rate (%)
Succ
ess
Rat
e (%
)
Target ZoneHIGH SUCCESS LOW DETECTION HIGH SUCCESS HIGH DETECTION
LOW SUCCESSLOW DETECTION LOW SUCCESS HIGH DETECTION
Sankheda
Sahera(PM)
Jhalod
ValiaMora
Rajpipla
Kadana
Garbada(DHD)
Tilakwada
Dediapada
Chhotaudepur
Hansot
JhagadiaBharuch,Pavijetpur,Jubilibaug
Kavant, Limkheda
SavliHalol
DahodPadra
Dhanpur(DHD)
Devgadhbaria
Santrampur
Godhra
Gotri(VMC)
Baroda
Bawchawad
Ghoghamba
Fatehpura
Amod
Surat Zone
Vadodara Zone
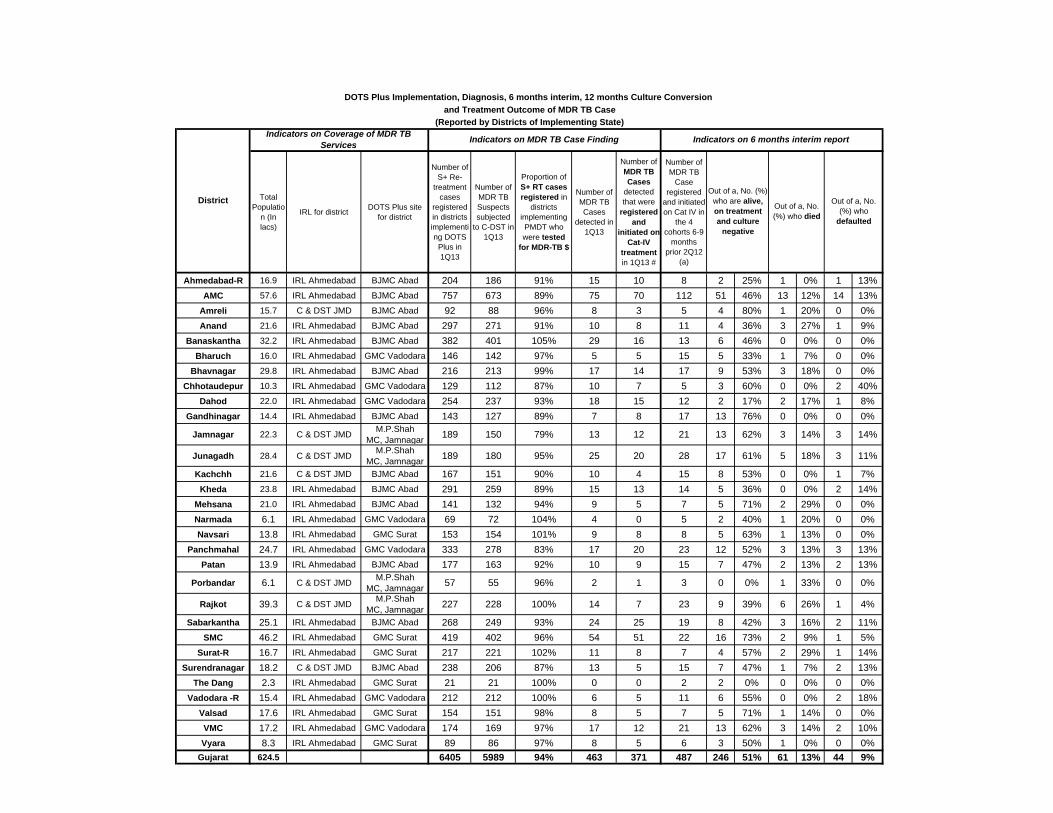
Total Populatio
n (In lacs)
IRL for district DOTS Plus site for district
Number of S+ Re-
treatment cases
registered in districts implementing DOTS
Plus in 1Q13
Number of MDR TB Suspects subjected
to C-DST in 1Q13
Proportion of S+ RT cases registered in
districts implementing PMDT who were tested
for MDR-TB $
Number of MDR TB Cases
detected in 1Q13
Number of MDR TB Cases
detected that were
registered and
initiated on Cat-IV
treatment in 1Q13 #
Number of MDR TB
Case registered
and initiated on Cat IV in
the 4 cohorts 6-9
months prior 2Q12
(a)
Ahmedabad-R 16.9 IRL Ahmedabad BJMC Abad 204 186 91% 15 10 8 2 25% 1 0% 1 13%AMC 57.6 IRL Ahmedabad BJMC Abad 757 673 89% 75 70 112 51 46% 13 12% 14 13%
Amreli 15.7 C & DST JMD BJMC Abad 92 88 96% 8 3 5 4 80% 1 20% 0 0%Anand 21.6 IRL Ahmedabad BJMC Abad 297 271 91% 10 8 11 4 36% 3 27% 1 9%
Banaskantha 32.2 IRL Ahmedabad BJMC Abad 382 401 105% 29 16 13 6 46% 0 0% 0 0%Bharuch 16.0 IRL Ahmedabad GMC Vadodara 146 142 97% 5 5 15 5 33% 1 7% 0 0%
Bhavnagar 29.8 IRL Ahmedabad BJMC Abad 216 213 99% 17 14 17 9 53% 3 18% 0 0%Chhotaudepur 10.3 IRL Ahmedabad GMC Vadodara 129 112 87% 10 7 5 3 60% 0 0% 2 40%
Dahod 22.0 IRL Ahmedabad GMC Vadodara 254 237 93% 18 15 12 2 17% 2 17% 1 8%Gandhinagar 14.4 IRL Ahmedabad BJMC Abad 143 127 89% 7 8 17 13 76% 0 0% 0 0%
Jamnagar 22.3 C & DST JMD M.P.ShahMC, Jamnagar 189 150 79% 13 12 21 13 62% 3 14% 3 14%
Junagadh 28.4 C & DST JMD M.P.ShahMC, Jamnagar 189 180 95% 25 20 28 17 61% 5 18% 3 11%
Kachchh 21.6 C & DST JMD BJMC Abad 167 151 90% 10 4 15 8 53% 0 0% 1 7%Kheda 23.8 IRL Ahmedabad BJMC Abad 291 259 89% 15 13 14 5 36% 0 0% 2 14%
Mehsana 21.0 IRL Ahmedabad BJMC Abad 141 132 94% 9 5 7 5 71% 2 29% 0 0%Narmada 6.1 IRL Ahmedabad GMC Vadodara 69 72 104% 4 0 5 2 40% 1 20% 0 0%Navsari 13.8 IRL Ahmedabad GMC Surat 153 154 101% 9 8 8 5 63% 1 13% 0 0%
Panchmahal 24.7 IRL Ahmedabad GMC Vadodara 333 278 83% 17 20 23 12 52% 3 13% 3 13%Patan 13.9 IRL Ahmedabad BJMC Abad 177 163 92% 10 9 15 7 47% 2 13% 2 13%
Porbandar 6.1 C & DST JMD M.P.ShahMC, Jamnagar 57 55 96% 2 1 3 0 0% 1 33% 0 0%
Rajkot 39.3 C & DST JMD M.P.ShahMC, Jamnagar 227 228 100% 14 7 23 9 39% 6 26% 1 4%
Sabarkantha 25.1 IRL Ahmedabad BJMC Abad 268 249 93% 24 25 19 8 42% 3 16% 2 11%SMC 46.2 IRL Ahmedabad GMC Surat 419 402 96% 54 51 22 16 73% 2 9% 1 5%
Surat-R 16.7 IRL Ahmedabad GMC Surat 217 221 102% 11 8 7 4 57% 2 29% 1 14%Surendranagar 18.2 C & DST JMD BJMC Abad 238 206 87% 13 5 15 7 47% 1 7% 2 13%
The Dang 2.3 IRL Ahmedabad GMC Surat 21 21 100% 0 0 2 2 0% 0 0% 0 0%Vadodara -R 15.4 IRL Ahmedabad GMC Vadodara 212 212 100% 6 5 11 6 55% 0 0% 2 18%
Valsad 17.6 IRL Ahmedabad GMC Surat 154 151 98% 8 5 7 5 71% 1 14% 0 0%VMC 17.2 IRL Ahmedabad GMC Vadodara 174 169 97% 17 12 21 13 62% 3 14% 2 10%Vyara 8.3 IRL Ahmedabad GMC Surat 89 86 97% 8 5 6 3 50% 1 0% 0 0%
Gujarat 624.5 6405 5989 94% 463 371 487 246 51% 61 13% 44 9%
DOTS Plus Implementation, Diagnosis, 6 months interim, 12 months Culture Conversion and Treatment Outcome of MDR TB Case
(Reported by Districts of Implementing State)
District
Indicators on Coverage of MDR TB Services Indicators on 6 months interim report
Out of a, No. (%) who are alive, on treatment and culture
negative
Out of a, No. (%) who died
Out of a, No. (%) who
defaulted
Indicators on MDR TB Case Finding
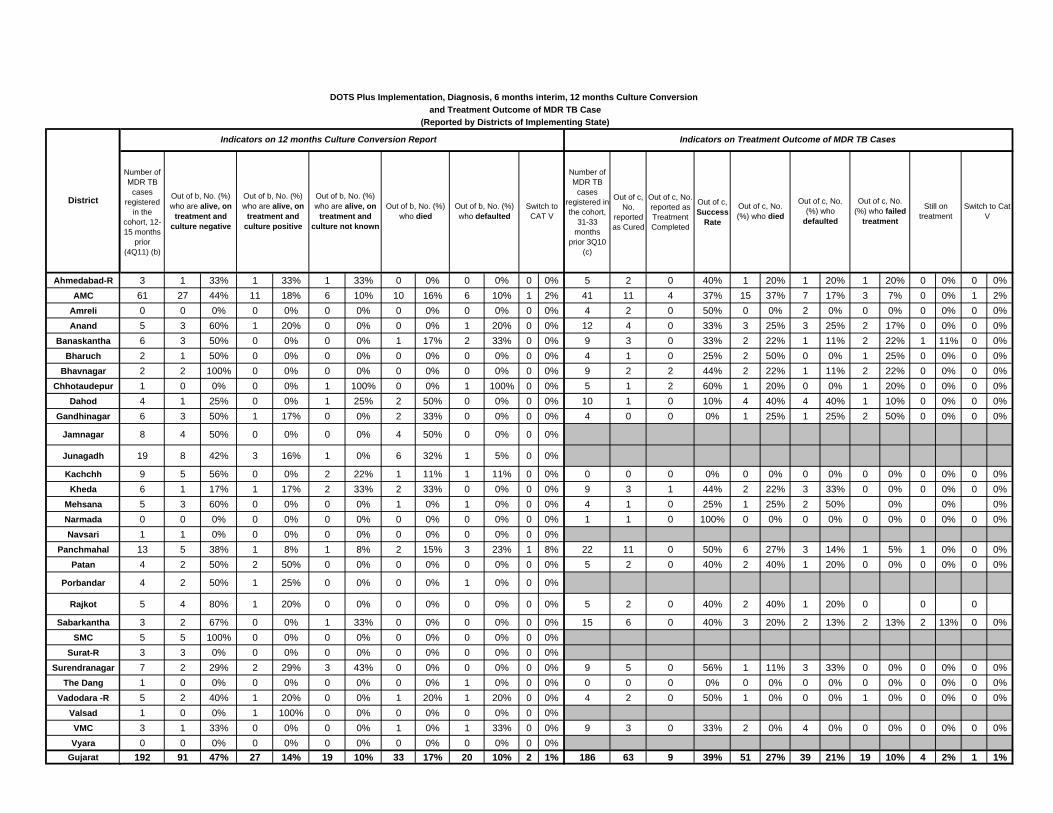
Ahmedabad-RAMC
AmreliAnand
BanaskanthaBharuch
BhavnagarChhotaudepur
DahodGandhinagar
Jamnagar
Junagadh
KachchhKheda
MehsanaNarmadaNavsari
PanchmahalPatan
Porbandar
Rajkot
SabarkanthaSMC
Surat-RSurendranagar
The DangVadodara -R
ValsadVMCVyara
Gujarat
District
Number of MDR TB
cases registered
in the cohort, 12-15 months
prior (4Q11) (b)
Number of MDR TB
cases registered in the cohort,
31-33 months
prior 3Q10 (c)
Out of c, No.
reported as Cured
Out of c, No. reported as Treatment Completed
Out of c, Success
Rate
3 1 33% 1 33% 1 33% 0 0% 0 0% 0 0% 5 2 0 40% 1 20% 1 20% 1 20% 0 0% 0 0%61 27 44% 11 18% 6 10% 10 16% 6 10% 1 2% 41 11 4 37% 15 37% 7 17% 3 7% 0 0% 1 2%0 0 0% 0 0% 0 0% 0 0% 0 0% 0 0% 4 2 0 50% 0 0% 2 0% 0 0% 0 0% 0 0%5 3 60% 1 20% 0 0% 0 0% 1 20% 0 0% 12 4 0 33% 3 25% 3 25% 2 17% 0 0% 0 0%6 3 50% 0 0% 0 0% 1 17% 2 33% 0 0% 9 3 0 33% 2 22% 1 11% 2 22% 1 11% 0 0%2 1 50% 0 0% 0 0% 0 0% 0 0% 0 0% 4 1 0 25% 2 50% 0 0% 1 25% 0 0% 0 0%2 2 100% 0 0% 0 0% 0 0% 0 0% 0 0% 9 2 2 44% 2 22% 1 11% 2 22% 0 0% 0 0%1 0 0% 0 0% 1 100% 0 0% 1 100% 0 0% 5 1 2 60% 1 20% 0 0% 1 20% 0 0% 0 0%4 1 25% 0 0% 1 25% 2 50% 0 0% 0 0% 10 1 0 10% 4 40% 4 40% 1 10% 0 0% 0 0%6 3 50% 1 17% 0 0% 2 33% 0 0% 0 0% 4 0 0 0% 1 25% 1 25% 2 50% 0 0% 0 0%
8 4 50% 0 0% 0 0% 4 50% 0 0% 0 0%
19 8 42% 3 16% 1 0% 6 32% 1 5% 0 0%
9 5 56% 0 0% 2 22% 1 11% 1 11% 0 0% 0 0 0 0% 0 0% 0 0% 0 0% 0 0% 0 0%6 1 17% 1 17% 2 33% 2 33% 0 0% 0 0% 9 3 1 44% 2 22% 3 33% 0 0% 0 0% 0 0%5 3 60% 0 0% 0 0% 1 0% 1 0% 0 0% 4 1 0 25% 1 25% 2 50% 0% 0% 0%0 0 0% 0 0% 0 0% 0 0% 0 0% 0 0% 1 1 0 100% 0 0% 0 0% 0 0% 0 0% 0 0%1 1 0% 0 0% 0 0% 0 0% 0 0% 0 0%13 5 38% 1 8% 1 8% 2 15% 3 23% 1 8% 22 11 0 50% 6 27% 3 14% 1 5% 1 0% 0 0%4 2 50% 2 50% 0 0% 0 0% 0 0% 0 0% 5 2 0 40% 2 40% 1 20% 0 0% 0 0% 0 0%
4 2 50% 1 25% 0 0% 0 0% 1 0% 0 0%
5 4 80% 1 20% 0 0% 0 0% 0 0% 0 0% 5 2 0 40% 2 40% 1 20% 0 0 0
3 2 67% 0 0% 1 33% 0 0% 0 0% 0 0% 15 6 0 40% 3 20% 2 13% 2 13% 2 13% 0 0%5 5 100% 0 0% 0 0% 0 0% 0 0% 0 0%3 3 0% 0 0% 0 0% 0 0% 0 0% 0 0%7 2 29% 2 29% 3 43% 0 0% 0 0% 0 0% 9 5 0 56% 1 11% 3 33% 0 0% 0 0% 0 0%1 0 0% 0 0% 0 0% 0 0% 1 0% 0 0% 0 0 0 0% 0 0% 0 0% 0 0% 0 0% 0 0%5 2 40% 1 20% 0 0% 1 20% 1 20% 0 0% 4 2 0 50% 1 0% 0 0% 1 0% 0 0% 0 0%1 0 0% 1 100% 0 0% 0 0% 0 0% 0 0%3 1 33% 0 0% 0 0% 1 0% 1 33% 0 0% 9 3 0 33% 2 0% 4 0% 0 0% 0 0% 0 0%0 0 0% 0 0% 0 0% 0 0% 0 0% 0 0%
192 91 47% 27 14% 19 10% 33 17% 20 10% 2 1% 186 63 9 39% 51 27% 39 21% 19 10% 4 2% 1 1%
DOTS Plus Implementation, Diagnosis, 6 months interim, 12 months Culture Conversion and Treatment Outcome of MDR TB Case
(Reported by Districts of Implementing State)
Out of b, No. (%) who died
Out of b, No. (%) who defaulted
Indicators on 12 months Culture Conversion Report
Switch to CAT V
Switch to Cat V
Indicators on Treatment Outcome of MDR TB Cases
Still on treatment
Out of b, No. (%) who are alive, on
treatment and culture negative
Out of c, No. (%) who failed
treatment
Out of c, No. (%) who died
Out of c, No. (%) who
defaulted
Out of b, No. (%) who are alive, on
treatment and culture positive
Out of b, No. (%) who are alive, on
treatment and culture not known
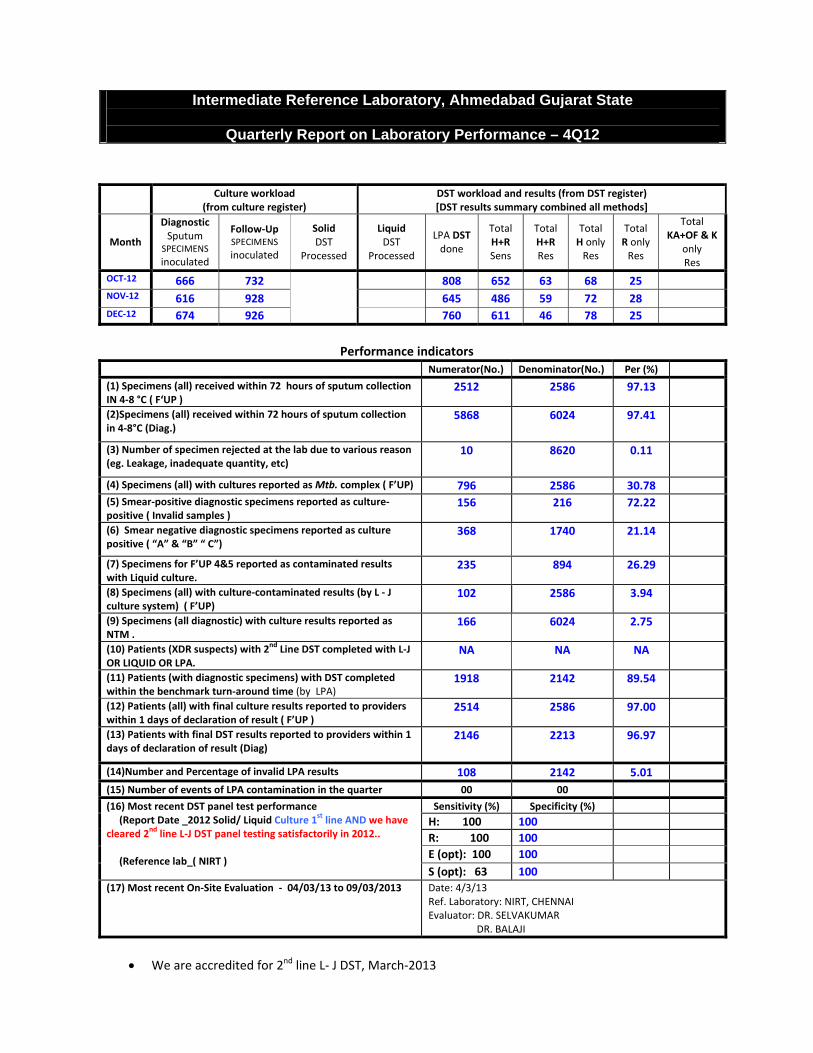
Intermediate Reference Laboratory, Ahmedabad Gujarat State
Quarterly Report on Laboratory Performance – 4Q12
Culture workload (from culture register)
DST workload and results (from DST register) [DST results summary combined all methods]
Month
Diagnostic Sputum
SPECIMENS inoculated
Follow‐Up SPECIMENS inoculated
Solid DST
Processed
Liquid DST
Processed
LPA DST done
Total H+R Sens
Total H+R Res
Total H only Res
Total R only Res
Total KA+OF & K
only Res
OCT‐12 666 732 808 652 63 68 25 NOV‐12 616 928 645 486 59 72 28 DEC‐12 674 926
760 611 46 78 25
Performance indicators
Numerator(No.) Denominator(No.) Per (%)
(1) Specimens (all) received within 72 hours of sputum collection IN 4‐8 °C ( F‘UP )
2512 2586 97.13
(2)Specimens (all) received within 72 hours of sputum collection in 4‐8°C (Diag.)
5868 6024 97.41
(3) Number of specimen rejected at the lab due to various reason (eg. Leakage, inadequate quantity, etc)
10 8620 0.11
(4) Specimens (all) with cultures reported as Mtb. complex ( F’UP) 796 2586 30.78 (5) Smear‐positive diagnostic specimens reported as culture‐positive ( Invalid samples )
156 216 72.22
(6) Smear negative diagnostic specimens reported as culture positive ( “A” & “B” “ C”)
368 1740 21.14
(7) Specimens for F’UP 4&5 reported as contaminated results with Liquid culture.
235 894 26.29
(8) Specimens (all) with culture‐contaminated results (by L ‐ J culture system) ( F’UP)
102 2586 3.94
(9) Specimens (all diagnostic) with culture results reported as NTM .
166 6024 2.75
(10) Patients (XDR suspects) with 2nd Line DST completed with L‐J OR LIQUID OR LPA.
NA NA NA
(11) Patients (with diagnostic specimens) with DST completed within the benchmark turn‐around time (by LPA)
1918 2142 89.54
(12) Patients (all) with final culture results reported to providers within 1 days of declaration of result ( F’UP )
2514 2586 97.00
(13) Patients with final DST results reported to providers within 1 days of declaration of result (Diag)
2146 2213 96.97
(14)Number and Percentage of invalid LPA results 108 2142 5.01
(15) Number of events of LPA contamination in the quarter 00 00
Sensitivity (%) Specificity (%) H: 100 100 R: 100 100 E (opt): 100 100
(16) Most recent DST panel test performance (Report Date _2012 Solid/ Liquid Culture 1st line AND we have cleared 2nd line L‐J DST panel testing satisfactorily in 2012.. (Reference lab_( NIRT )
S (opt): 63 100 (17) Most recent On‐Site Evaluation ‐ 04/03/13 to 09/03/2013 Date: 4/3/13
Ref. Laboratory: NIRT, CHENNAI Evaluator: DR. SELVAKUMAR DR. BALAJI
• We are accredited for 2nd line L‐ J DST, March‐2013
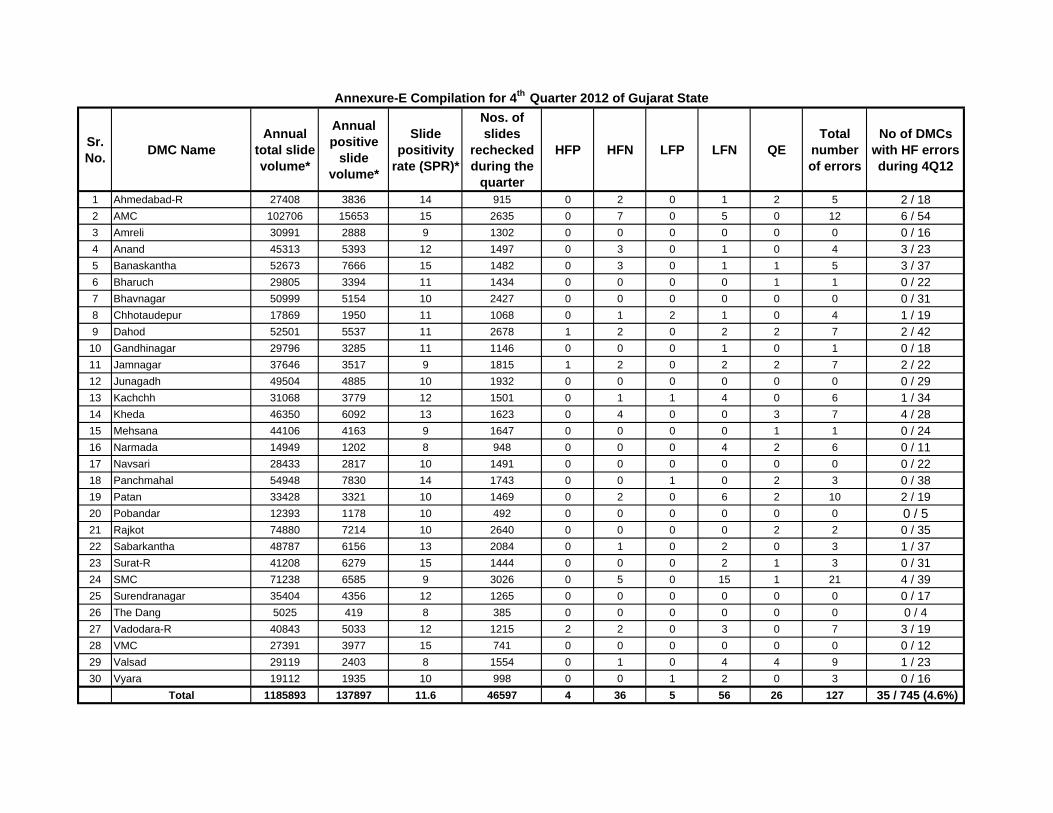
Sr. No. DMC Name
Annual total slide volume*
Annual positive
slide volume*
Slide positivity
rate (SPR)*
Nos. of slides
rechecked during the
quarter
HFP HFN LFP LFN QETotal
number of errors
No of DMCs with HF errors during 4Q12
1 Ahmedabad-R 27408 3836 14 915 0 2 0 1 2 5 2 / 182 AMC 102706 15653 15 2635 0 7 0 5 0 12 6 / 543 Amreli 30991 2888 9 1302 0 0 0 0 0 0 0 / 164 Anand 45313 5393 12 1497 0 3 0 1 0 4 3 / 235 Banaskantha 52673 7666 15 1482 0 3 0 1 1 5 3 / 376 Bharuch 29805 3394 11 1434 0 0 0 0 1 1 0 / 227 Bhavnagar 50999 5154 10 2427 0 0 0 0 0 0 0 / 318 Chhotaudepur 17869 1950 11 1068 0 1 2 1 0 4 1 / 199 Dahod 52501 5537 11 2678 1 2 0 2 2 7 2 / 42
10 Gandhinagar 29796 3285 11 1146 0 0 0 1 0 1 0 / 1811 Jamnagar 37646 3517 9 1815 1 2 0 2 2 7 2 / 2212 Junagadh 49504 4885 10 1932 0 0 0 0 0 0 0 / 2913 Kachchh 31068 3779 12 1501 0 1 1 4 0 6 1 / 3414 Kheda 46350 6092 13 1623 0 4 0 0 3 7 4 / 2815 Mehsana 44106 4163 9 1647 0 0 0 0 1 1 0 / 2416 Narmada 14949 1202 8 948 0 0 0 4 2 6 0 / 1117 Navsari 28433 2817 10 1491 0 0 0 0 0 0 0 / 2218 Panchmahal 54948 7830 14 1743 0 0 1 0 2 3 0 / 3819 Patan 33428 3321 10 1469 0 2 0 6 2 10 2 / 1920 Pobandar 12393 1178 10 492 0 0 0 0 0 0 0 / 521 Rajkot 74880 7214 10 2640 0 0 0 0 2 2 0 / 3522 Sabarkantha 48787 6156 13 2084 0 1 0 2 0 3 1 / 3723 Surat-R 41208 6279 15 1444 0 0 0 2 1 3 0 / 3124 SMC 71238 6585 9 3026 0 5 0 15 1 21 4 / 3925 Surendranagar 35404 4356 12 1265 0 0 0 0 0 0 0 / 1726 The Dang 5025 419 8 385 0 0 0 0 0 0 0 / 427 Vadodara-R 40843 5033 12 1215 2 2 0 3 0 7 3 / 1928 VMC 27391 3977 15 741 0 0 0 0 0 0 0 / 1229 Valsad 29119 2403 8 1554 0 1 0 4 4 9 1 / 2330 Vyara 19112 1935 10 998 0 0 1 2 0 3 0 / 16
Total 1185893 137897 11.6 46597 4 36 5 56 26 127 35 / 745 (4.6%)
Annexure-E Compilation for 4th Quarter 2012 of Gujarat State
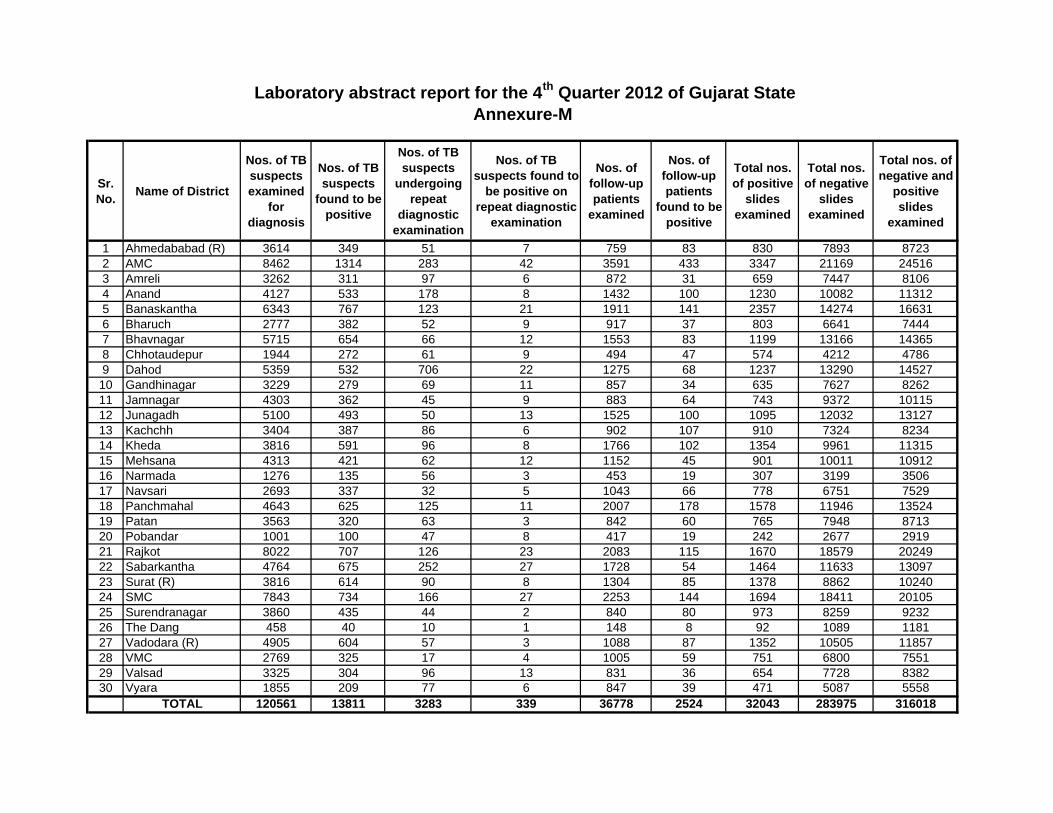
Sr. No. Name of District
Nos. of TB suspects examined
for diagnosis
Nos. of TB suspects
found to be positive
Nos. of TB suspects
undergoing repeat
diagnostic examination
Nos. of TB suspects found to
be positive on repeat diagnostic
examination
Nos. of follow-up patients
examined
Nos. of follow-up patients
found to be positive
Total nos. of positive
slides examined
Total nos. of negative
slides examined
Total nos. of negative and
positive slides
examined
1 Ahmedababad (R) 3614 349 51 7 759 83 830 7893 87232 AMC 8462 1314 283 42 3591 433 3347 21169 245163 Amreli 3262 311 97 6 872 31 659 7447 81064 Anand 4127 533 178 8 1432 100 1230 10082 113125 Banaskantha 6343 767 123 21 1911 141 2357 14274 166316 Bharuch 2777 382 52 9 917 37 803 6641 74447 Bhavnagar 5715 654 66 12 1553 83 1199 13166 143658 Chhotaudepur 1944 272 61 9 494 47 574 4212 47869 Dahod 5359 532 706 22 1275 68 1237 13290 14527
10 Gandhinagar 3229 279 69 11 857 34 635 7627 826211 Jamnagar 4303 362 45 9 883 64 743 9372 1011512 Junagadh 5100 493 50 13 1525 100 1095 12032 1312713 Kachchh 3404 387 86 6 902 107 910 7324 823414 Kheda 3816 591 96 8 1766 102 1354 9961 1131515 Mehsana 4313 421 62 12 1152 45 901 10011 1091216 Narmada 1276 135 56 3 453 19 307 3199 350617 Navsari 2693 337 32 5 1043 66 778 6751 752918 Panchmahal 4643 625 125 11 2007 178 1578 11946 1352419 Patan 3563 320 63 3 842 60 765 7948 871320 Pobandar 1001 100 47 8 417 19 242 2677 291921 Rajkot 8022 707 126 23 2083 115 1670 18579 2024922 Sabarkantha 4764 675 252 27 1728 54 1464 11633 1309723 Surat (R) 3816 614 90 8 1304 85 1378 8862 1024024 SMC 7843 734 166 27 2253 144 1694 18411 2010525 Surendranagar 3860 435 44 2 840 80 973 8259 923226 The Dang 458 40 10 1 148 8 92 1089 118127 Vadodara (R) 4905 604 57 3 1088 87 1352 10505 1185728 VMC 2769 325 17 4 1005 59 751 6800 755129 Valsad 3325 304 96 13 831 36 654 7728 838230 Vyara 1855 209 77 6 847 39 471 5087 5558
TOTAL 120561 13811 3283 339 36778 2524 32043 283975 316018
Laboratory abstract report for the 4th Quarter 2012 of Gujarat StateAnnexure-M
Preliminary findings of operational research: team Gujarat
1. Effect of family DOT on treatment success rates among new TB patients in children: a non-inferiority trial under Revised National TB Program, Gujarat, India
Background: World Health Organization recommends direct observation of therapy (DOT) to support Tuberculosis (TB) patients and ensure treatment completion. As per national programme guidelines in India, a DOT provider can be anybody who is acceptable and accessible to the patient and accountable to the health system, except a family member. This poses challenges among children with TB, who may be more comfortable taking medicines from their parents/family members than from unfamiliar DOT providers. There is no evidence from India if provision of DOT by a family member is inferior to standard practice. Methods: We conducted a non-inferiority trial to assess the effect of Family DOT on treatment success rates among children with newly diagnosed TB and registered between June-September 2012. All districts (n=30) in Gujarat state were randomly assigned to the intervention (n=15) or control group (n=15). In the intervention districts, adult family members were given the choice to become their child’s DOT provider. In the control districts, DOT was provided by a non-family member. We performed intention to treat analysis and compared treatment success rates (cured and treatment completed) between the two groups. Preliminary Results: A total of 624 children with newly diagnosed TB were registered during study period (359 in intervention district and 265 in non-intervention district). The two groups were similar with respect to baseline characteristics like age, sex, type of TB and initial body weight. Among the intervention and control groups respectively, the treatment success rates were 95.8% and 93.2% (p=0.15). Conclusion: DOT by a family member is not inferior to that by a non-family member among new TB patients in children and can attain international targets for treatment success under programme conditions. 2. Feasibility and yield of screening of patients with tuberculosis for diabetes
mellitus under National Tuberculosis Program in Anklav TB unit, Anand, Gujarat India
Background: People with Diabetes (DM) have 2-3 times higher risk of developing active TB than in those who do not have DM. DM patients with TB also experience more adverse TB treatment outcomes: with delayed sputum culture conversion, an increased risk of death during anti-TB treatment and an increased risk of recurrent disease after successful completion of treatment. However in programmatic setting it has not been evaluated whether it is feasible to screen the patients with TB for DM. Methods: All TB patients registered under RNTCP during Jan 2012 to September 2012, in Anklav TB unit, Anand, Gujarat were enrolled for study. Study objective was to determine: number (proportion) assessed for DM, prevalence of diabetes and pre-diabetes among cohort and to assess diagnostic delay for the same. Preliminary Results: Of 556 TB patients diagnosed and initiated on treatment in participating facilities, 553 (99.5%) were assessed for DM and 36 (6.5%) were found to have DM; of these, 14 (2.5%) had a previously known diagnosis of DM and 22 (4%) were newly diagnosed. 39 (7.0%) had impaired fasting glucose. Out of total diabetics 32 (94%) reached to DM care. Average 25 TB patients are needed to screen to find out new DM case and 9 TB patients are needed to screen to find out person with impaired glucose. There was a median(IQR) 5(0–28) days delay from starting of treatment to testing random blood sugar. There was a median(IQR) 3(1-7) days delay from testing fasting blood sugar after random blood sugar. The patient baseline characteristics like age, sex, type of TB and HIV status did not differ significantly among prevalent diabetic cases. Conclusion: This pilot project shows that it is important and feasible to screen patients with TB for DM in the routine setting, resulting in earlier identification of DM in some patients and opportunities for better management of comorbidity.
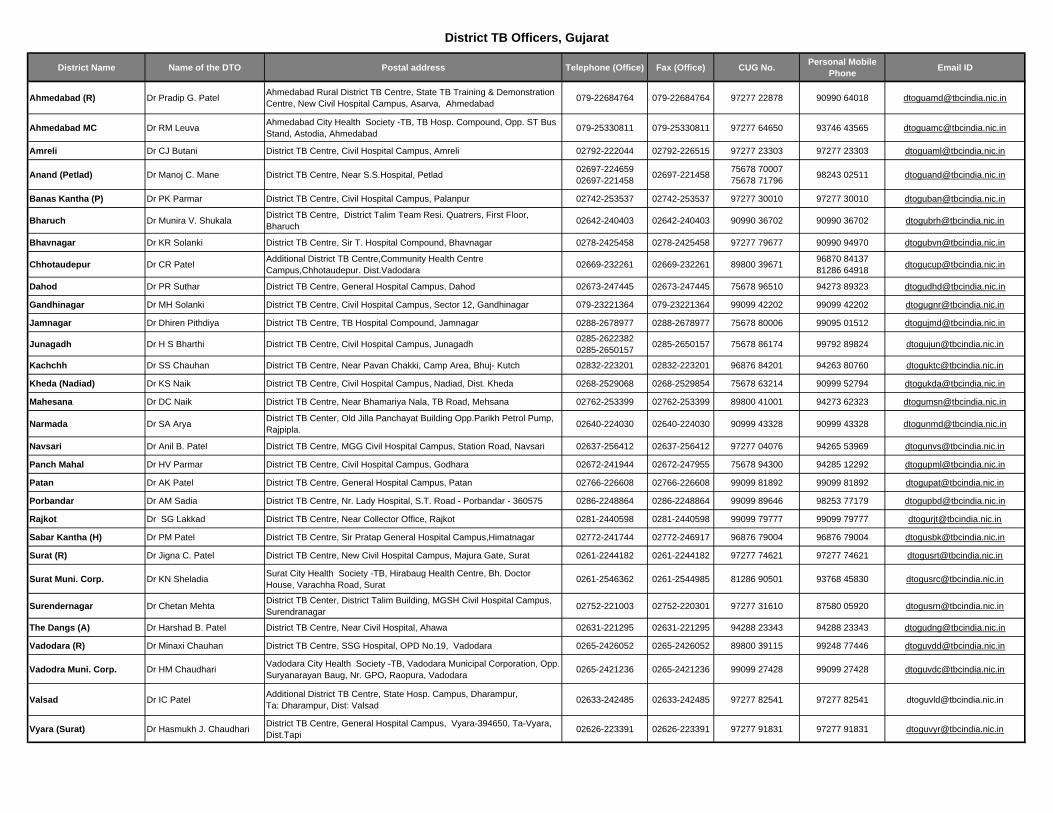
District TB Officers, Gujarat
District Name Name of the DTO Postal address Telephone (Office) Fax (Office) CUG No. Personal Mobile Phone Email ID
Ahmedabad (R) Dr Pradip G. Patel Ahmedabad Rural District TB Centre, State TB Training & Demonstration Centre, New Civil Hospital Campus, Asarva, Ahmedabad 079-22684764 079-22684764 97277 22878 90990 64018 [email protected]
Ahmedabad MC Dr RM Leuva Ahmedabad City Health Society -TB, TB Hosp. Compound, Opp. ST Bus Stand, Astodia, Ahmedabad 079-25330811 079-25330811 97277 64650 93746 43565 [email protected]
Amreli Dr CJ Butani District TB Centre, Civil Hospital Campus, Amreli 02792-222044 02792-226515 97277 23303 97277 23303 [email protected]
Anand (Petlad) Dr Manoj C. Mane District TB Centre, Near S.S.Hospital, Petlad 02697-22465902697-221458 02697-221458 75678 70007
75678 71796 98243 02511 [email protected]
Banas Kantha (P) Dr PK Parmar District TB Centre, Civil Hospital Campus, Palanpur 02742-253537 02742-253537 97277 30010 97277 30010 [email protected]
Bharuch Dr Munira V. Shukala District TB Centre, District Talim Team Resi. Quatrers, First Floor, Bharuch 02642-240403 02642-240403 90990 36702 90990 36702 [email protected]
Bhavnagar Dr KR Solanki District TB Centre, Sir T. Hospital Compound, Bhavnagar 0278-2425458 0278-2425458 97277 79677 90990 94970 [email protected]
Chhotaudepur Dr CR Patel Additional District TB Centre,Community Health Centre Campus,Chhotaudepur. Dist.Vadodara 02669-232261 02669-232261 89800 39671 96870 84137
81286 64918 [email protected]
Dahod Dr PR Suthar District TB Centre, General Hospital Campus, Dahod 02673-247445 02673-247445 75678 96510 94273 89323 [email protected]
Gandhinagar Dr MH Solanki District TB Centre, Civil Hospital Campus, Sector 12, Gandhinagar 079-23221364 079-23221364 99099 42202 99099 42202 [email protected]
Jamnagar Dr Dhiren Pithdiya District TB Centre, TB Hospital Compound, Jamnagar 0288-2678977 0288-2678977 75678 80006 99095 01512 [email protected]
Junagadh Dr H S Bharthi District TB Centre, Civil Hospital Campus, Junagadh 0285-2622382 0285-2650157 0285-2650157 75678 86174 99792 89824 [email protected]
Kachchh Dr SS Chauhan District TB Centre, Near Pavan Chakki, Camp Area, Bhuj- Kutch 02832-223201 02832-223201 96876 84201 94263 80760 [email protected]
Kheda (Nadiad) Dr KS Naik District TB Centre, Civil Hospital Campus, Nadiad, Dist. Kheda 0268-2529068 0268-2529854 75678 63214 90999 52794 [email protected]
Mahesana Dr DC Naik District TB Centre, Near Bhamariya Nala, TB Road, Mehsana 02762-253399 02762-253399 89800 41001 94273 62323 [email protected]
Narmada Dr SA Arya District TB Center, Old Jilla Panchayat Building Opp.Parikh Petrol Pump, Rajpipla. 02640-224030 02640-224030 90999 43328 90999 43328 [email protected]
Navsari Dr Anil B. Patel District TB Centre, MGG Civil Hospital Campus, Station Road, Navsari 02637-256412 02637-256412 97277 04076 94265 53969 [email protected]
Panch Mahal Dr HV Parmar District TB Centre, Civil Hospital Campus, Godhara 02672-241944 02672-247955 75678 94300 94285 12292 [email protected]
Patan Dr AK Patel District TB Centre, General Hospital Campus, Patan 02766-226608 02766-226608 99099 81892 99099 81892 [email protected]
Porbandar Dr AM Sadia District TB Centre, Nr. Lady Hospital, S.T. Road - Porbandar - 360575 0286-2248864 0286-2248864 99099 89646 98253 77179 [email protected]
Rajkot Dr SG Lakkad District TB Centre, Near Collector Office, Rajkot 0281-2440598 0281-2440598 99099 79777 99099 79777 [email protected]
Sabar Kantha (H) Dr PM Patel District TB Centre, Sir Pratap General Hospital Campus,Himatnagar 02772-241744 02772-246917 96876 79004 96876 79004 [email protected]
Surat (R) Dr Jigna C. Patel District TB Centre, New Civil Hospital Campus, Majura Gate, Surat 0261-2244182 0261-2244182 97277 74621 97277 74621 [email protected]
Surat Muni. Corp. Dr KN Sheladia Surat City Health Society -TB, Hirabaug Health Centre, Bh. Doctor House, Varachha Road, Surat 0261-2546362 0261-2544985 81286 90501 93768 45830 [email protected]
Surendernagar Dr Chetan Mehta District TB Center, District Talim Building, MGSH Civil Hospital Campus, Surendranagar 02752-221003 02752-220301 97277 31610 87580 05920 [email protected]
The Dangs (A) Dr Harshad B. Patel District TB Centre, Near Civil Hospital, Ahawa 02631-221295 02631-221295 94288 23343 94288 23343 [email protected]
Vadodara (R) Dr Minaxi Chauhan District TB Centre, SSG Hospital, OPD No.19, Vadodara 0265-2426052 0265-2426052 89800 39115 99248 77446 [email protected]
Vadodra Muni. Corp. Dr HM Chaudhari Vadodara City Health Society -TB, Vadodara Municipal Corporation, Opp. Suryanarayan Baug, Nr. GPO, Raopura, Vadodara 0265-2421236 0265-2421236 99099 27428 99099 27428 [email protected]
Valsad Dr IC Patel Additional District TB Centre, State Hosp. Campus, Dharampur, Ta: Dharampur, Dist: Valsad 02633-242485 02633-242485 97277 82541 97277 82541 [email protected]
Vyara (Surat) Dr Hasmukh J. Chaudhari District TB Centre, General Hospital Campus, Vyara-394650, Ta-Vyara, Dist.Tapi 02626-223391 02626-223391 97277 91831 97277 91831 [email protected]
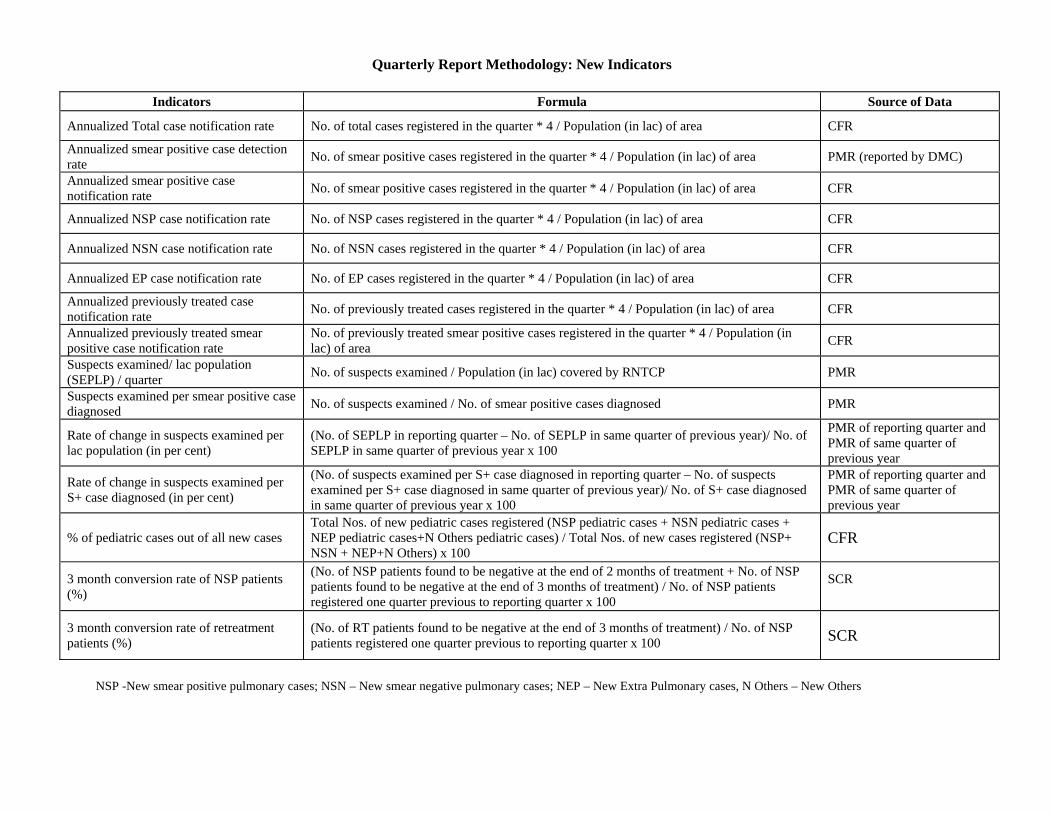
Quarterly Report Methodology: New Indicators
Indicators Formula Source of Data
Annualized Total case notification rate No. of total cases registered in the quarter * 4 / Population (in lac) of area CFR
Annualized smear positive case detection rate No. of smear positive cases registered in the quarter * 4 / Population (in lac) of area PMR (reported by DMC)
Annualized smear positive case notification rate No. of smear positive cases registered in the quarter * 4 / Population (in lac) of area CFR
Annualized NSP case notification rate No. of NSP cases registered in the quarter * 4 / Population (in lac) of area CFR
Annualized NSN case notification rate No. of NSN cases registered in the quarter * 4 / Population (in lac) of area CFR
Annualized EP case notification rate No. of EP cases registered in the quarter * 4 / Population (in lac) of area CFR
Annualized previously treated case notification rate No. of previously treated cases registered in the quarter * 4 / Population (in lac) of area CFR
Annualized previously treated smear positive case notification rate
No. of previously treated smear positive cases registered in the quarter * 4 / Population (in lac) of area CFR
Suspects examined/ lac population (SEPLP) / quarter No. of suspects examined / Population (in lac) covered by RNTCP PMR
Suspects examined per smear positive case diagnosed No. of suspects examined / No. of smear positive cases diagnosed PMR
Rate of change in suspects examined per lac population (in per cent)
(No. of SEPLP in reporting quarter – No. of SEPLP in same quarter of previous year)/ No. of SEPLP in same quarter of previous year x 100
PMR of reporting quarter and PMR of same quarter of previous year
Rate of change in suspects examined per S+ case diagnosed (in per cent)
(No. of suspects examined per S+ case diagnosed in reporting quarter – No. of suspects examined per S+ case diagnosed in same quarter of previous year)/ No. of S+ case diagnosed in same quarter of previous year x 100
PMR of reporting quarter and PMR of same quarter of previous year
% of pediatric cases out of all new cases Total Nos. of new pediatric cases registered (NSP pediatric cases + NSN pediatric cases + NEP pediatric cases+N Others pediatric cases) / Total Nos. of new cases registered (NSP+ NSN + NEP+N Others) x 100
CFR
3 month conversion rate of NSP patients (%)
(No. of NSP patients found to be negative at the end of 2 months of treatment + No. of NSP patients found to be negative at the end of 3 months of treatment) / No. of NSP patients registered one quarter previous to reporting quarter x 100
SCR
3 month conversion rate of retreatment patients (%)
(No. of RT patients found to be negative at the end of 3 months of treatment) / No. of NSP patients registered one quarter previous to reporting quarter x 100 SCR
NSP -New smear positive pulmonary cases; NSN – New smear negative pulmonary cases; NEP – New Extra Pulmonary cases, N Others – New Others
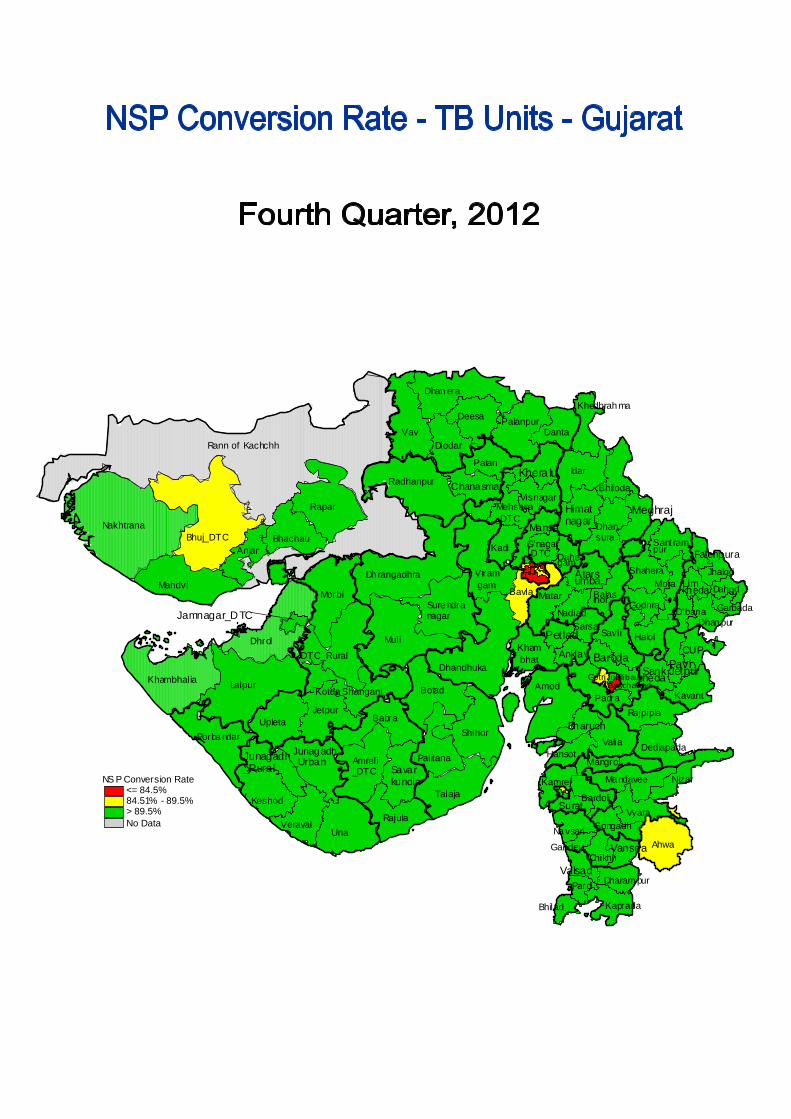
Rann of Kachchh
Lalpur
Nakhtrana
Muli
Vav
Una
Dhrol
Bhuj_DTC
Rapar
Morbi
Amod
Sure ndranagar
Idar
Botad
Shihor
Talaja
Mandvi
Dhandhuka
Dh rangadhra
Babra
Ahwa
Radhanpur
Dhan era
Khambhalia
JetpurUpleta
Savli
Valia
Rajula
DTC_Rural
Halol
Viramgam
Padra
Deesa Palanpur
Keshod
Porba ndar
Anjar
Diodar
Palitana
Veraval
Patan
BhachauKadi
Bavla
Amreli_DTC
Vyara
Danta
Rajpipla
Ma ndavee
Dhansura
Shahera
Bhiloda
KavantKotda Shangani
Mora
Kamrej
Balasinor
Dediapada
Khambhat
Visnagar
Kaprada
Bardoli
Godhra
Nizar
Sarsa
Matar
Hansot
SongadhNa vsari
Sant rampur
Chikhli
Jhalod
Pardi
Dhan pur
Khedbrah ma
Dahod
Dahegam
Bhilad
D'baria#
Jamnagar_DTC
Limkheda
Garbada
Bharuch
ValsadDharam pur
Gandevi Vansda
Savarkundla
Meghraj
Fatehpura
Himatnagar
Khera lu
G'nagar_DTC
Mehsana_DTC
Chanasma
Atarsumba
Nadiad
Petlad
Anklav
Sankheda
Pavi_Jetpur
CUPBaroda
Surat
MangrolJunagadh_UrbanJunagadh
_Rural
Mansa
GotriJubilibaugBawchawad
NS P Conversion Rate<= 84.5%84.51% - 89.5%> 89.5%No Data
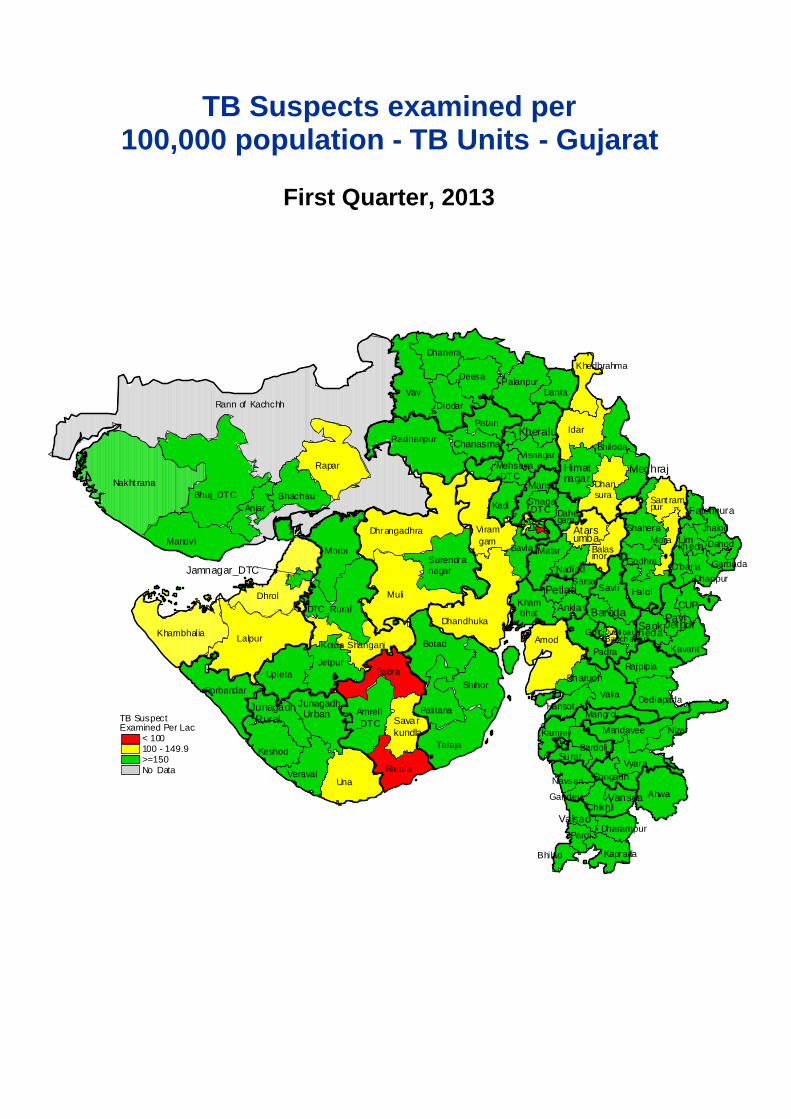
Rann of Kachchh
Lalpur
Nakht rana
Muli
Vav
Una
Dhrol
Bhuj_DTC
Rapar
Morbi
Amod
Surendranagar
Idar
Botad
Shihor
Talaja
Mandvi
Dhandhuka
Dhrangadhra
Babra
Ahwa
Radhanpur
Dhanera
Khambhalia
JetpurUpleta
Savli
Valia
Rajula
DTC_Rural
Halol
Viramgam
Padra
Deesa Palanpur
Keshod
Porbandar
Anjar
Diodar
Palitana
Veraval
Patan
BhachauKadi
Bavla
Amreli_DTC
Vyara
Danta
Rajpipla
Mandavee
Dhansura
Shahera
Bhiloda
KavantKotda Shangani
Mora
Kamrej
Balasinor
Dediapada
Khambhat
Visnagar
Kaprada
Bardoli
Godhra
Nizar
Sarsa
Matar
Hansot
SongadhNavsari
Sant rampur
Chikhli
Jhalod
Pardi
Dhanpur
Khedbrahma
Dahod
Dahegam
Bhilad
D'bar ia#
Jamnagar_DTC
Limkheda
Garbada
Bharuch
ValsadDharampur
Gandevi Vansda
Savarkundla
Meghraj
Fatehpura
Himatnagar
Kheralu
G'nagar_DTC
Mehsana_DTC
Chanasma
Atarsumba
Nadiad
Petlad
Anklav
Sankheda
Pavi_Jetpur
CUPBaroda
Surat
MangrolJunagadh_Urban
Junagadh_Rural
Mansa
Gotr iJubilibaugBawchawad
TB SuspectExamined Per Lac
< 100100 - 149.9>=150No Data
TB Suspects examined per100,000 population - TB Units - Gujarat
First Quarter, 2013
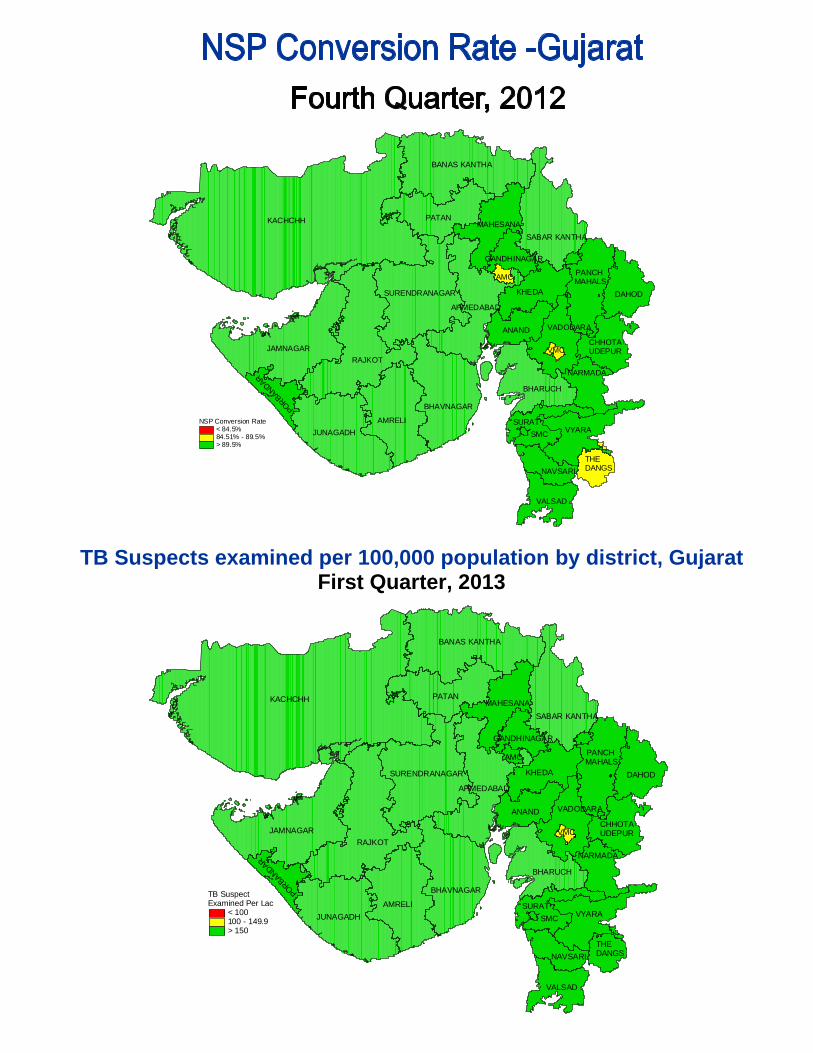
KACHCHH
RAJKOT
AMRELI
JAMNAGAR
PATAN
JUNAGADH
BANAS KANTHA
BHAVNAGAR
VYARA
AHMEDABAD
KHEDASURENDRANAGAR
BHARUCH
DAHOD
SABAR KANTHA
SURAT
ANAND
MAHESANA
VALSAD
VADODARA
PANCH MAHALS
NARMADA
NAVSARI
CHHOTA UDEPUR
PORBANDAR
THE DANGS
GANDHINAGAR
AMC
VMC
SMC
NSP Conversion Rate< 84.5%84.51% - 89.5%> 89.5%
KACHCHH
RAJKOT
AMRELI
JAMNAGAR
PATAN
JUNAGADH
BANAS KANTHA
BHAVNAGAR
VYARA
AHMEDABAD
KHEDASURENDRANAGAR
BHARUCH
DAHOD
SABAR KANTHA
SURAT
ANAND
MAHESANA
VALSAD
VADODARA
PANCH MAHALS
NARMADA
NAVSARI
CHHOTA UDEPUR
PORBANDAR
THE DANGS
GANDHINAGAR
AMC
VMC
SMC
TB Suspect Examined Per Lac
< 100100 - 149.9> 150
TB Suspects examined per 100,000 population by district, Gujarat First Quarter, 2013
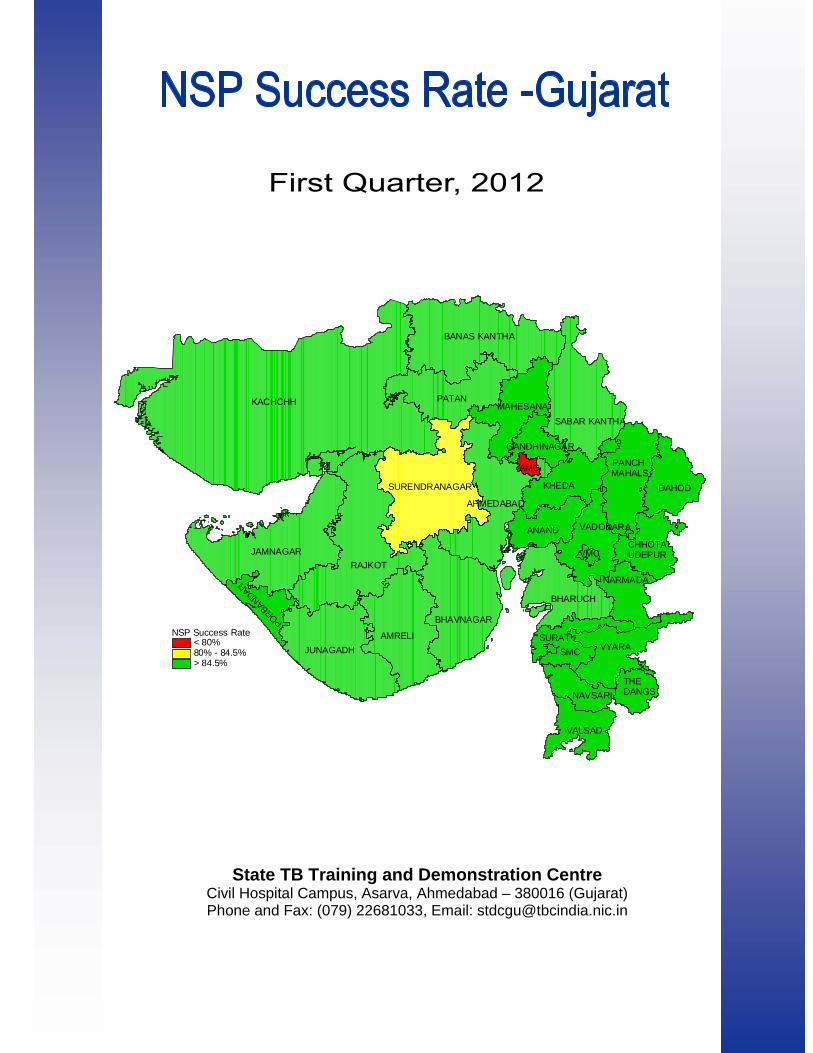
KACHCHH
RAJKOT
AMRELI
JAMNAGAR
PATAN
JUNAGADH
BANAS KANTHA
BHAVNAGAR
VYARA
AHMEDABAD
KHEDASURENDRANAGAR
BHARUCH
DAHOD
SABAR KANTHA
SURAT
ANAND
MAHESANA
VALSAD
VADODARA
PANCH MAHALS
NARMADA
NAVSARI
CHHOTA UDEPUR
PORBANDAR
THE DANGS
GANDHINAGAR
AMC
VMC
SMC
NSP Success Rate< 80%80% - 84.5%> 84.5%
State TB Training and Demonstration Centre Civil Hospital Campus, Asarva, Ahmedabad – 380016 (Gujarat) Phone and Fax: (079) 22681033, Email: [email protected]


![GSERC · v ankla kaduli mahijdi zab(sa) satun date: 11-12-2020 block name palitana sihor mahijva palitana mahljva talaja mahuva talaja vallbhipur mahuva tai-a]a jesar jesar ghogha](https://img.pdfslide.us/doc/110x75/60ba4a46870d7a68a920fde5/gserc-v-ankla-kaduli-mahijdi-zabsa-satun-date-11-12-2020-block-name-palitana.jpg)