Embed Size (px)
Citation preview

+
You Bet We Still Care!
The “A” Word Conference, Ryerson University
March 1, 2013

PD and professional
association membership
Job
Satisfaction
and future
plans
Types of
questions
employee
survey
Work experience and current
job
Education
Wages and working
conditions
Personal information
Recruitment and retention
Facilities, spaces and children

HR management
and planning
Finances
Types of
questions
employer
survey
Staffing
Recruitment
and retention
Governance
and facilities
Spaces and enrolment
Employeequestions for centre directors
Personal information

• Program
staff: 2,344
• Centre directors: 1,427
.
• Total responses to employer survey: 1,145
• Total responses to employee survey: 3,480
Recruitment questions:• Administrato
rs and owners not working in the programs: 437
• Centre directors from both surveys: 1,427
How Many Responded to the Surveys?

Are the results
representative?
Not structured to be a representative sample, but
type of returns generally reflect nature of programs across the
country and within PTs
42% of centres operated by an organization with more than one centre
73% non-profit and public; 26% commercial
54.5% operated programs in addition to full-day child care
77.4% of employers in urban centres, 19.3 % in rural centres
2.7% First Nations, Metis, Inuit governing body; 2.1% municipally operated

More than 98% female – median age: 38 yearsFirst language: 82% English, 6% French, 12% otherMedian years in the sector: 12; in current position: 3
Program Staff: Quick Facts
Median hours work/week: 37Participated in PD in past 12 months: 88.5%Worked in a unionized centre: 21.5%
Worked at second job: 25%Belonged to a child care organization: 52.5%

90% have some post-secondary ECE
75% college credential
65% two-year diploma or higher
10% one-year certificate
11% university degree
Program Staff: Post-secondary Early Childhood Education
4% have some other form of ECE credential


97.8% female – median age: 45 yearsFirst language: 78% English, 13.2% French, 8.9 % otherMore than 15 years in the sector: 62.9%; median years in current position: 6
Centre directors: quick facts
Median hours work/week: 40Participated in PD in past 12 months: 90.6%Worked at second job: 18.5%Belonged to a child care organization: 73%

90% have some post-secondary ECE
66% college credential
55% two-year diploma or higher
11% one-year certificate
20% university degree
Centre directors: Post-secondary Early Childhood Education
4% have some other form of ECE credential

Centre Directors
27.2% are counted in ratio all of the time
47.6% are counted in ratio part of the time
25.1% are never included in the ratio

WagesMedian gross hourly wages Program staff
Centre directors
Newfoundland and Labrador $14.00 $16.00
Prince Edward Island $15.00 $21.00
Nova Scotia $12.84 $17.56
New Brunswick $13.50 $15.00
Quebec $19.13 $32.64
Ontario $17.29 $22.50
Manitoba $16.00 $24.70
Saskatchewan $14.92 $22.14
Alberta $15.33 $20.00
British Columbia $17.00 $20.83
CANADA $16.50 $22.00

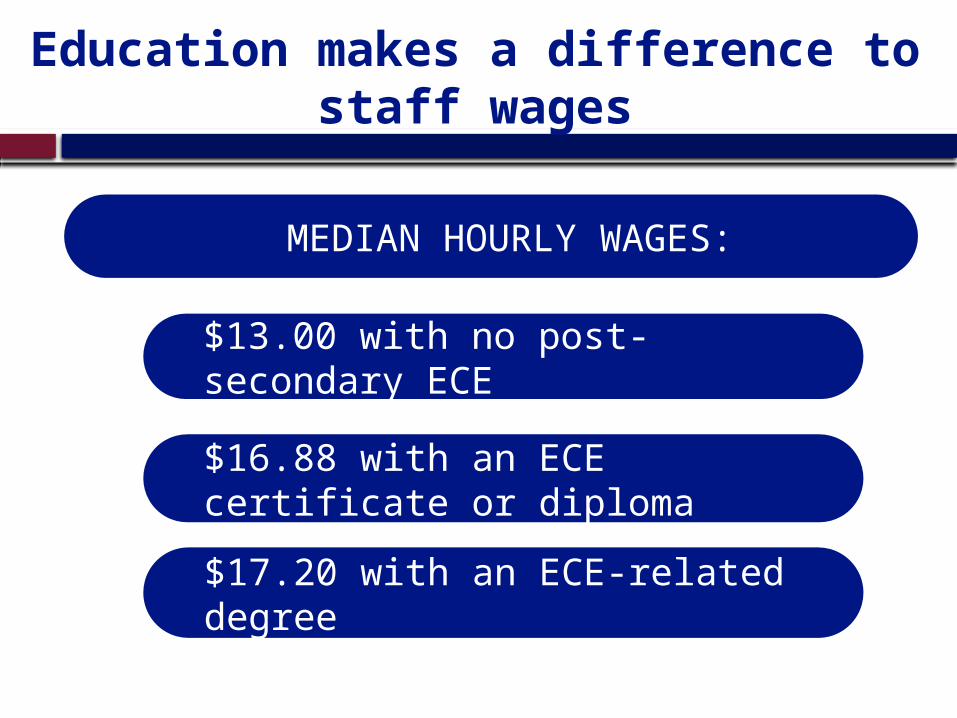
MEDIAN HOURLY WAGES:
$13.00 with no post-secondary ECE
$16.88 with an ECE certificate or diploma
$17.20 with an ECE-related degree
Education makes a difference to staff wages

MEDIAN HOURLY WAGES ARE HIGHER:
$20.11 for program staff
$25.55 for directors in a unionized centre
Unionization makes a difference to staff wages and benefits
Unionized staff are more than twice as likely to have more than three benefits (70.4% vs. 33%) than non-unionized staff

MEDIAN HOURLY WAGES, IN THE RATIO:
All of the time: $19.49
Some of the time: $22.00
None of the time: $25.86
Working in ratio makes a difference to directors’ wages

Benefits
Type of benefit
% with benefit
Non-union Union All staff
Additional medical coverage 39.6 78.4 47.9
Paid sick or personal leave days 55.3 88.6 62.5
Life and/or disability insurance 35.0 72.1 43.0
Top up maternity benefits 10.9 35.2 16.2
Pension plan or RRSP contribution 27.2 76 37.7

Written job description: 71.1%
Policy/procedure manual: 83.3%
Regular written performance appraisal: 51.1%
None of the above: 4.4%
Staff working in centres with selected personnel policies

U
Uneven access to benefits and resources

Parent feesMedian reported monthly fees 2012 ($)
Infant Toddler Pre-school
Newfoundland and Labrador - 740 762Prince Edward Island 696 566 544Nova Scotia 826 696 691New Brunswick 740 653 615Quebec 152 152 152Ontario 1,150 924 830Manitoba 631 432 431Saskatchewan 650 561 535Alberta 900 830 793British Columbia 1,047 907 761CANADA 761 696 674
NL: infant fees not reported due to small number of infant programs in that province

Percent of employers with the following recruitment
challenges
Lack of time to recruit
Applicant not satisfied with salary
Lack of money for recruiting
Applicants' lack of related work experience
Few or no applicants
Applicants' lack of skills
0% 10% 20% 30% 40% 50% 60% 70%


Aspects of job satisfaction for program staff
Wages
Benefits
Career
Work Load
Leadership
Hours Worked
Work Schedule
Overall satisfaction
0% 10% 20% 30% 40% 50% 60% 70% 80% 90%
Very Satisfied Somewhat Satisfied


Overall job satisfaction: program staff
Newfoundland and Labrador
Prince Edward Island
Nova Scotia
New Brunswick
Quebec
Ontario
Manitoba
Saskatchewan
Alberta
British Columbia
CANADA
0% 20% 40% 60% 80% 100% 120%
Very satisfied Somewhat satisfied


Percent of those looking for a new job
NL PE NS NB QC ON MB SK AB BC CAN0.0%
5.0%
10.0%
15.0%
20.0%
25.0%
30.0%
Directors Program Staff

Will you still be in this job in three years?
YES!
75% of program staff
82.4% of centre directors

Plans for program staff intending to be working in regulated child
care in three years
Not sure
Other
Open my own centre
More senior position - different centre
More senior position - same centre
Similar job - different centre
In current job
0% 10% 20% 30% 40% 50% 60%

Plans for program staff intending to leave regulated child care in
three next three years
Not sure
Retire
Home with my children
ECE job but not regulated child care
0% 10% 20% 30% 40% 50%

Multi-site operations ranged from 2-91 centres Non-profit organizations were more likely to hold multiple licenses than commercial operators (33% compared to 21%)Median wages in multi-site and single-site programs were similar except in SK and AB where they were higher
29% of multi-site employers expect to expand in next three years
Multi-site programs

What Does It All Mean?

Better?Worse?Trends?
Wages generally up; loss of benefits for some
Overall job satisfaction good
Recruitment challenges significant for some employers
Moving to the school system issue for Ontario
Growth in operators with multiple licenses
Increase in percentage with post-secondary ECE

Future research is needed - You Bet We Still Care! includes recommendations about:
Future research and analysis that may be addressed by the current data set:
Future methodological approaches to conduct this type of research in the ECEC sector
The need for ongoing, systematic data collection about the child care workforce

Prepare data set for public use and makeavailable through the Institute for Social Research at York University: http://www.isr.yorku.ca/contact/index.html
What now?
Further research and analysis in future if funds available
Consider the implications of the findings and how to use them