Embed Size (px)
Citation preview

+
Worcester Telegram & Gazette
+ Design
Landing Page Optimization
Site Sections
Search Engine Optimization
Mobile
Dashboards
+
Design
+Mission: Reduce Friction
Make it as easy as possible for users to find the content they want.
Direct people to content.
Goals: Increase page views Increase time on site Decrease bounce rate
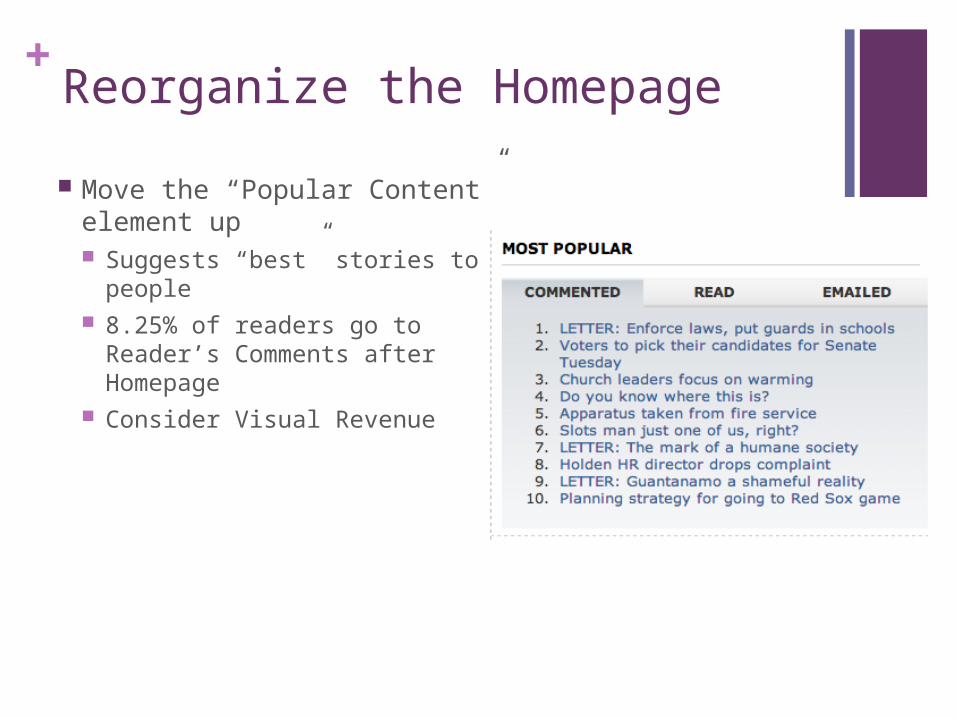
+Reorganize the Homepage
Move the “Popular Content” element up Suggests “best” stories to people 8.25% of readers go to Reader’s
Comments after Homepage Consider Visual Revenue
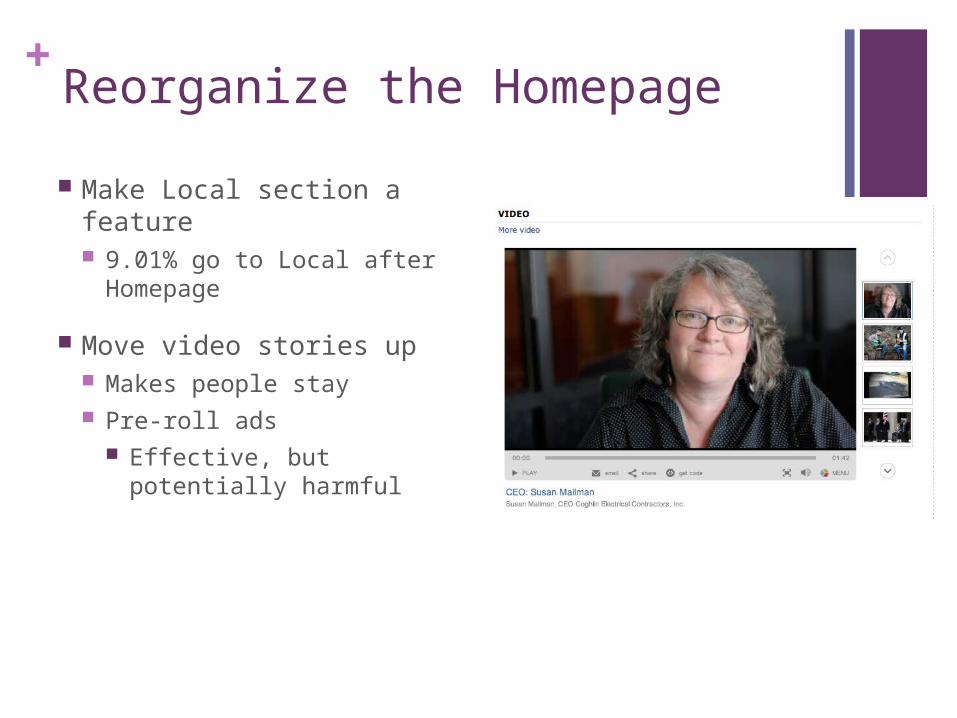
+Reorganize the Homepage
Make Local section a feature 9.01% go to Local after
Homepage
Move video stories up Makes people stay Pre-roll ads
Effective, but potentially harmful
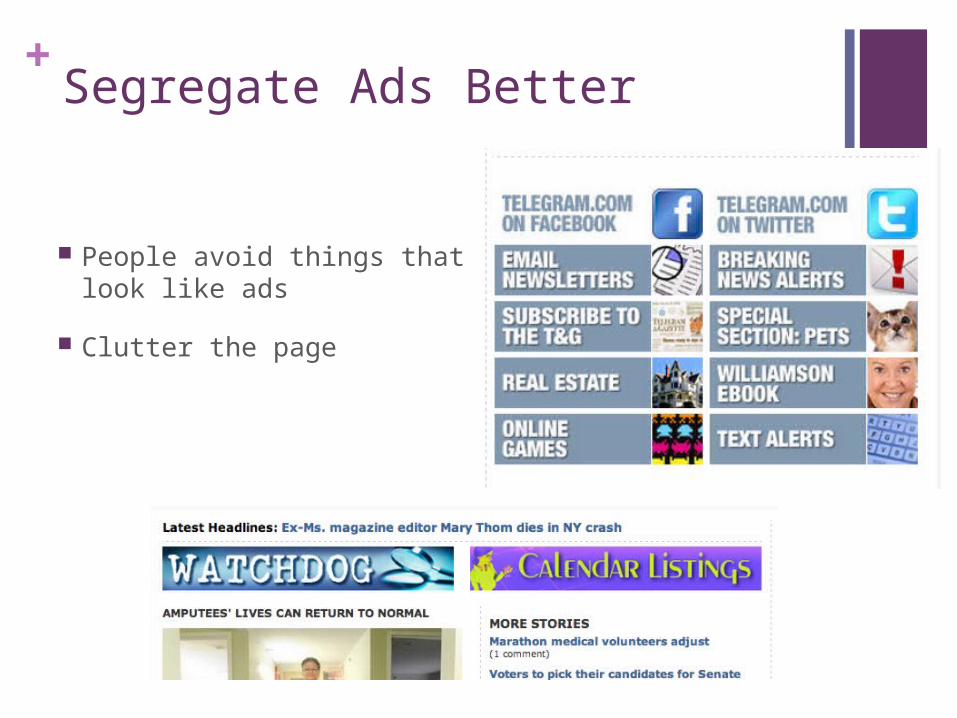
+Segregate Ads Better
People avoid things that look like ads
Clutter the page
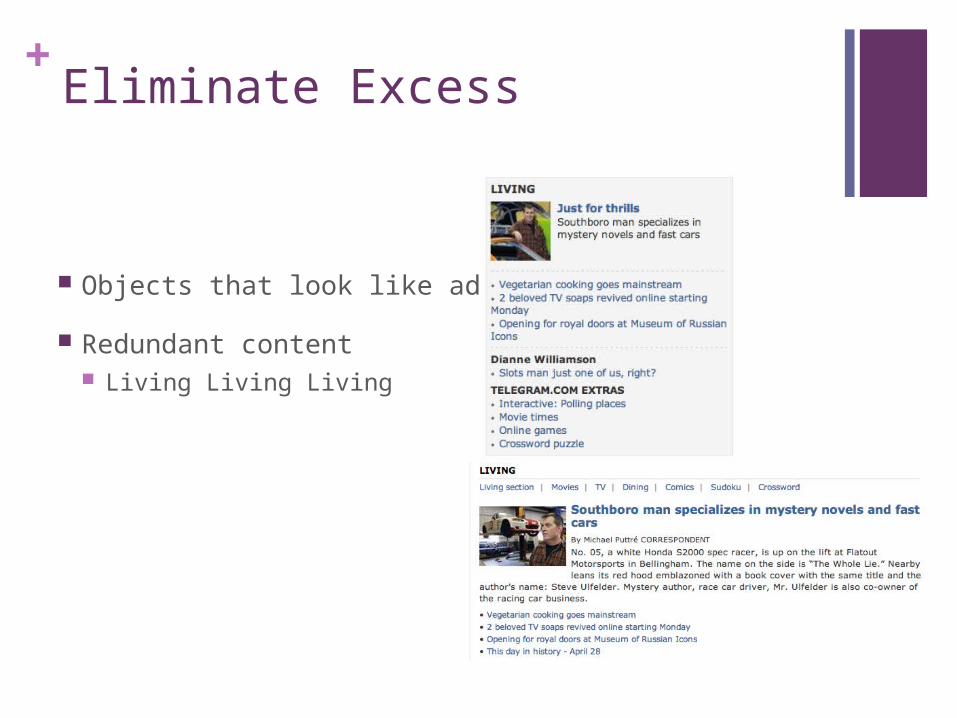
+Eliminate Excess
Objects that look like ads
Redundant content Living Living Living
+
+
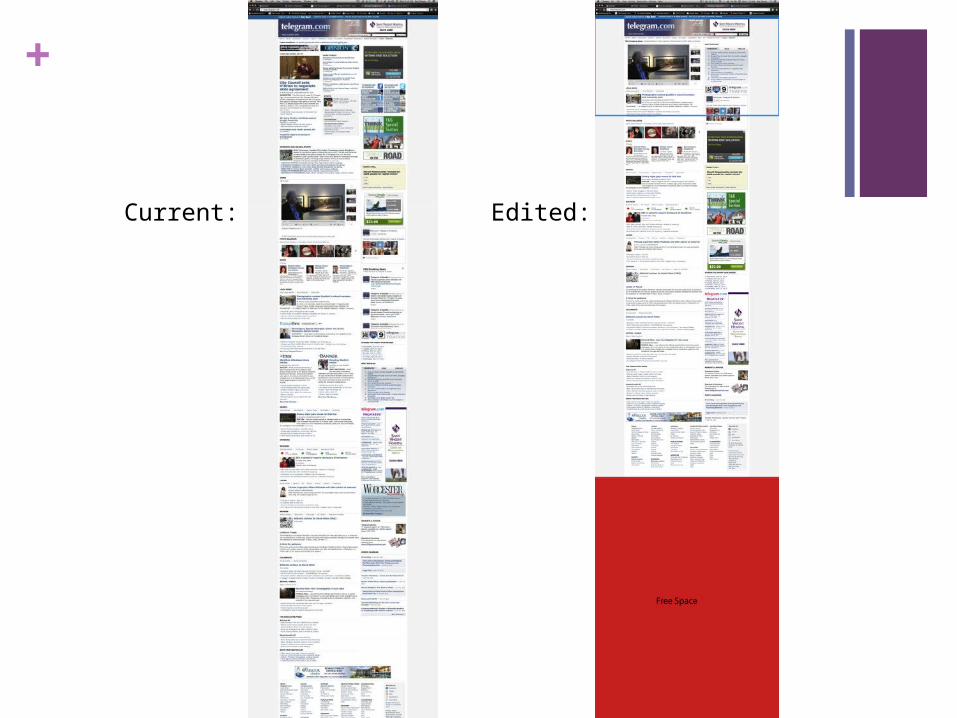
Current: Edited:
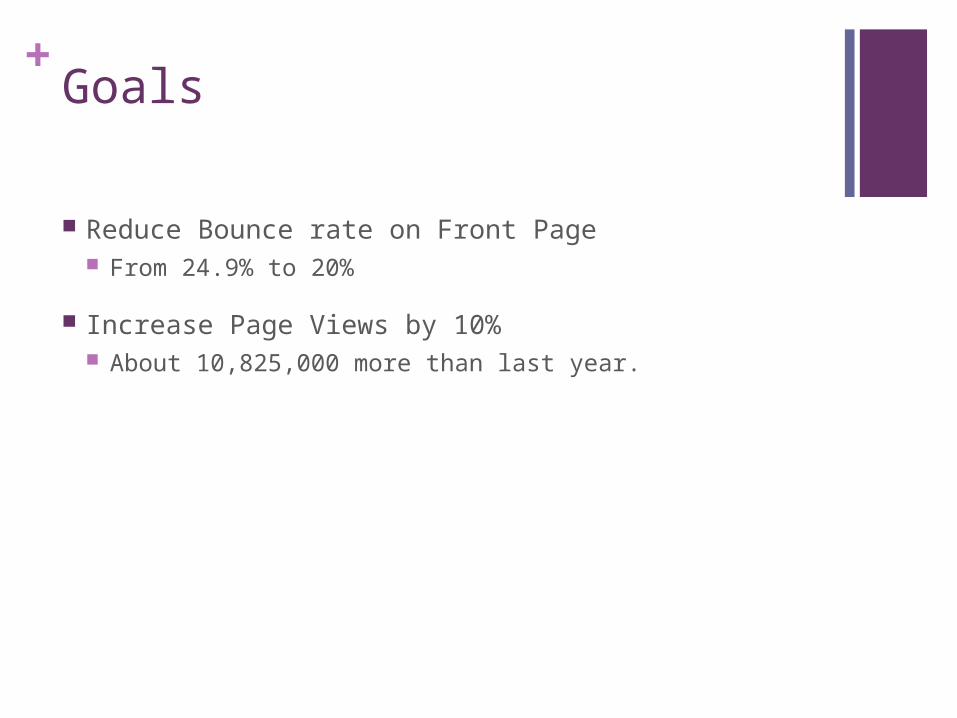
+Goals
Reduce Bounce rate on Front Page From 24.9% to 20%
Increase Page Views by 10% About 10,825,000 more than last year.
+Goals
Possible Revenue Increase:
$124,488- $248,975 a year

+
Mobile and Tablet
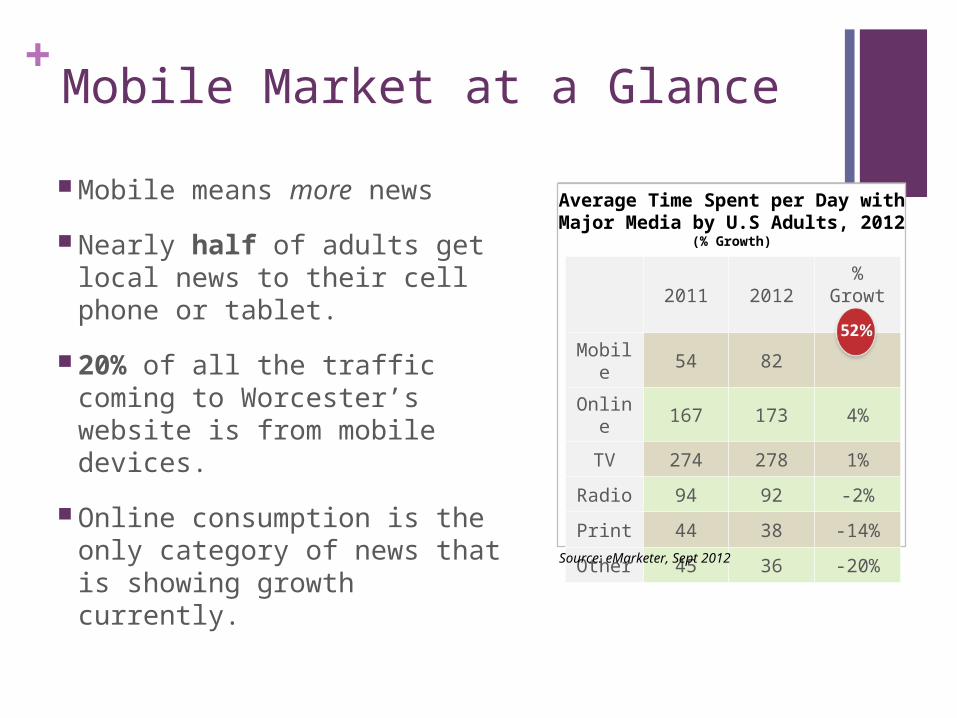
+Mobile Market at a Glance
Mobile means more news
Nearly half of adults get local news to their cell phone or tablet.
20% of all the traffic coming to Worcester’s website is from mobile devices.
Online consumption is the only category of news that is showing growth currently.
2011 2012%
Growth
Mobile
54 82
Online
167 173 4%
TV 274 278 1%
Radio 94 92 -2%
Print 44 38 -14%
Other 45 36 -20%
Average Time Spent per Day with Major Media by U.S Adults,
2012(% Growth)
Source: eMarketer, Sept 2012
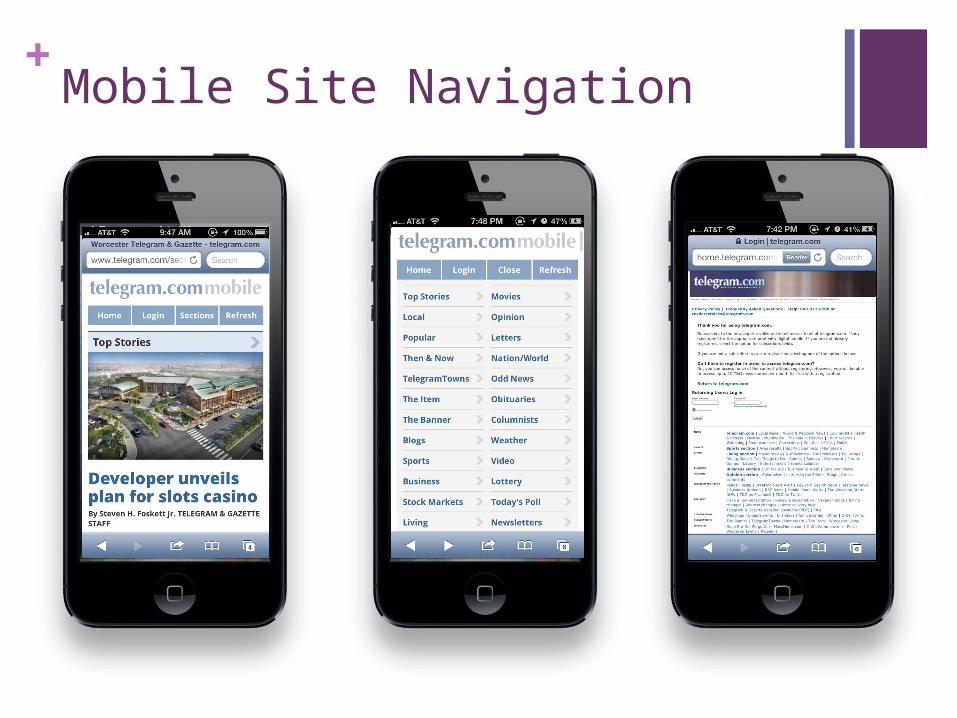
+Mobile Site Navigation
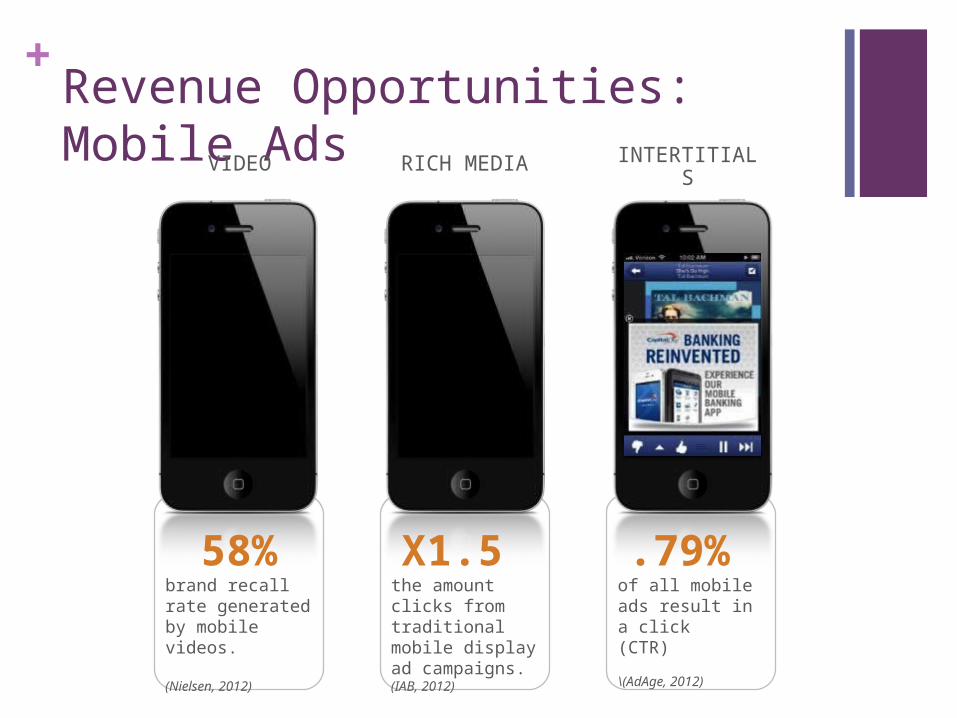
+Revenue Opportunities: Mobile Ads VIDEO INTERTITIALSRICH MEDIA
58%brand recall rate generated by mobile videos.
(Nielsen, 2012)
X1.5 the amount clicks from traditional mobile display ad campaigns.(IAB, 2012)
.79% of all mobile ads result in a click (CTR)
\(AdAge, 2012)
+Recommendations for Mobile Phones
Include geo-targeted push notifications or text messages.
Add a search feature (for user experience and SEO).
Incorporate social networking capability (easier login for
users.)
Optimize subscription process — near field communication as
payment.
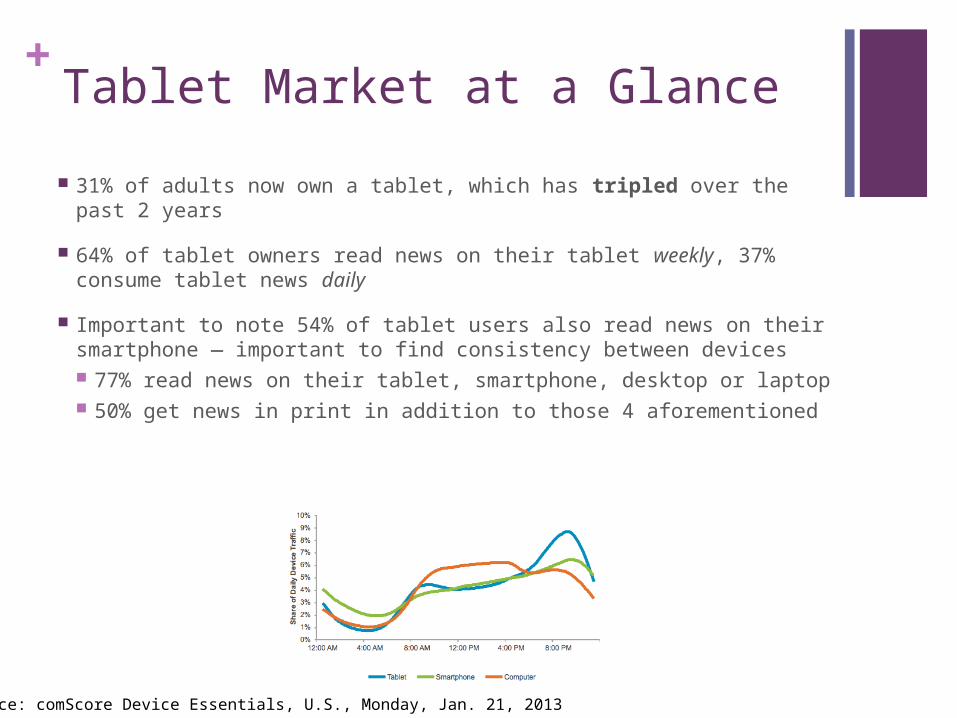
+Tablet Market at a Glance
31% of adults now own a tablet, which has tripled over the past 2 years
64% of tablet owners read news on their tablet weekly, 37% consume tablet news daily
Important to note 54% of tablet users also read news on their smartphone — important to find consistency between devices 77% read news on their tablet, smartphone, desktop or laptop 50% get news in print in addition to those 4 aforementioned
Source: comScore Device Essentials, U.S., Monday, Jan. 21, 2013
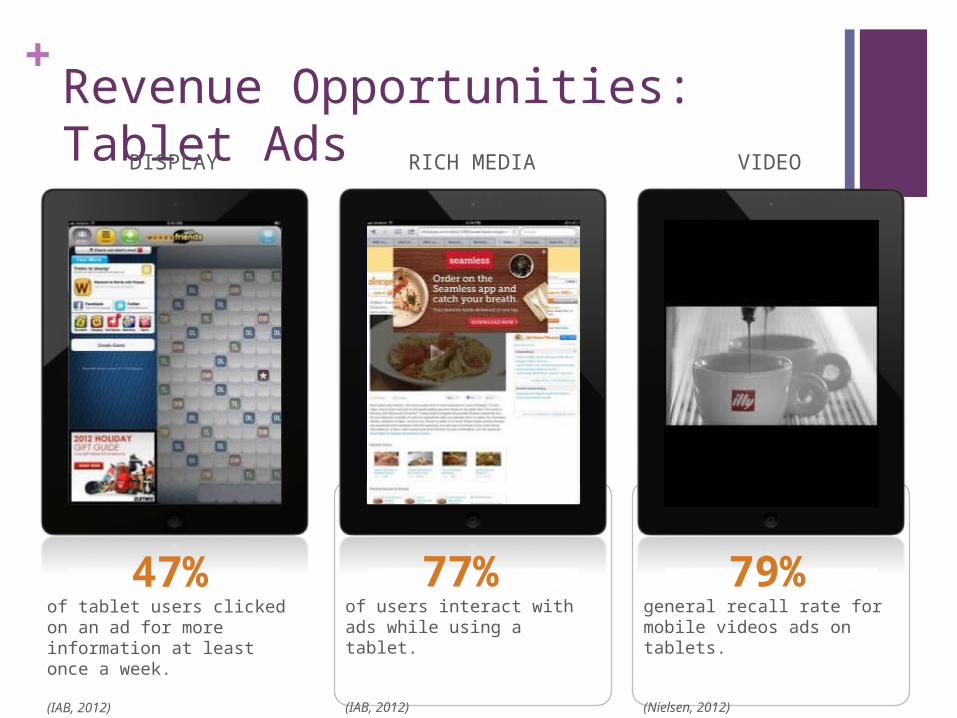
+Revenue Opportunities: Tablet AdsDISPLAY RICH MEDIA VIDEO
47%
of tablet users clicked on an ad for more information at least once a week.
(IAB, 2012)
77% of users interact with ads while using a tablet.
(IAB, 2012)
79%
general recall rate for mobile videos ads on tablets.
(Nielsen, 2012)
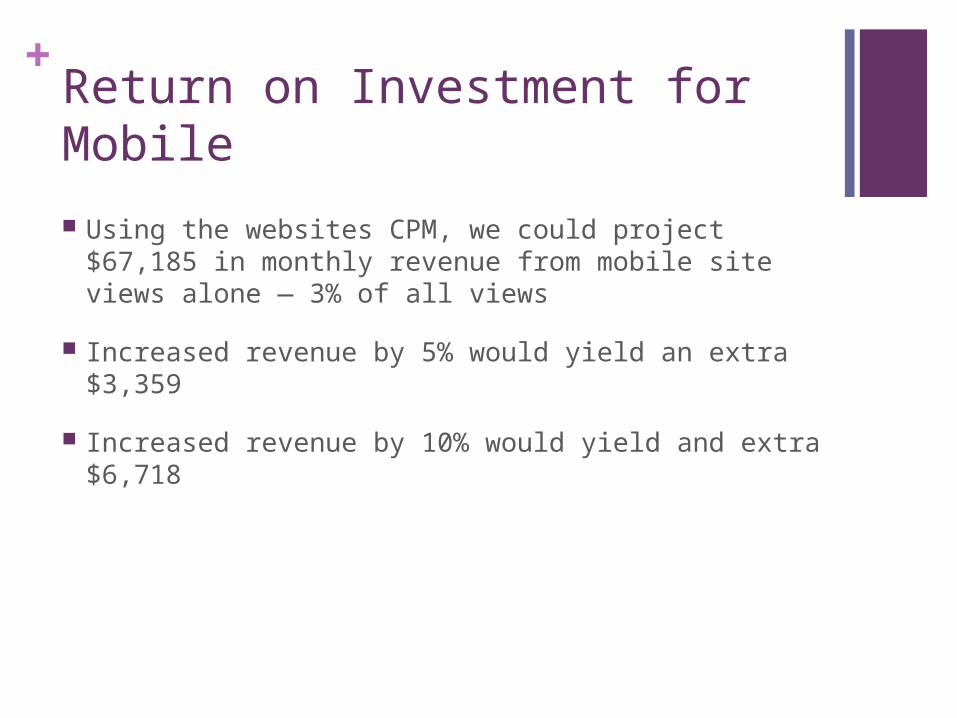
+Return on Investment for Mobile
Using the websites CPM, we could project $67,185 in monthly revenue from mobile site views alone — 3% of all views
Increased revenue by 5% would yield an extra $3,359
Increased revenue by 10% would yield and extra $6,718
+
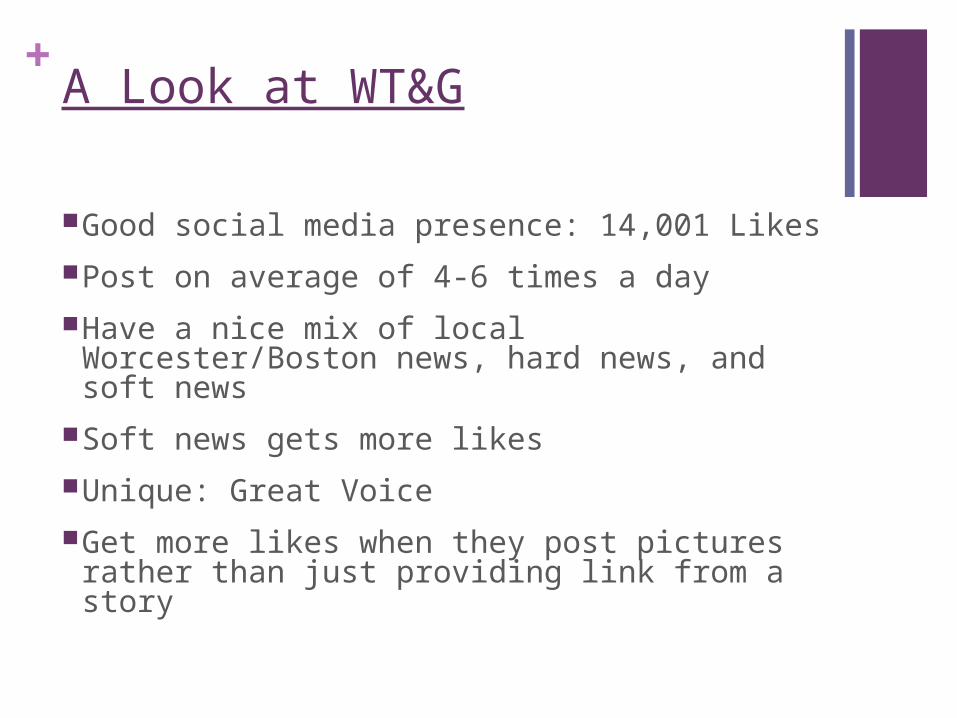
+A Look at WT&G
Good social media presence: 14,001 LikesPost on average of 4-6 times a dayHave a nice mix of local Worcester/Boston
news, hard news, and soft newsSoft news gets more likesUnique: Great Voice Get more likes when they post pictures
rather than just providing link from a story
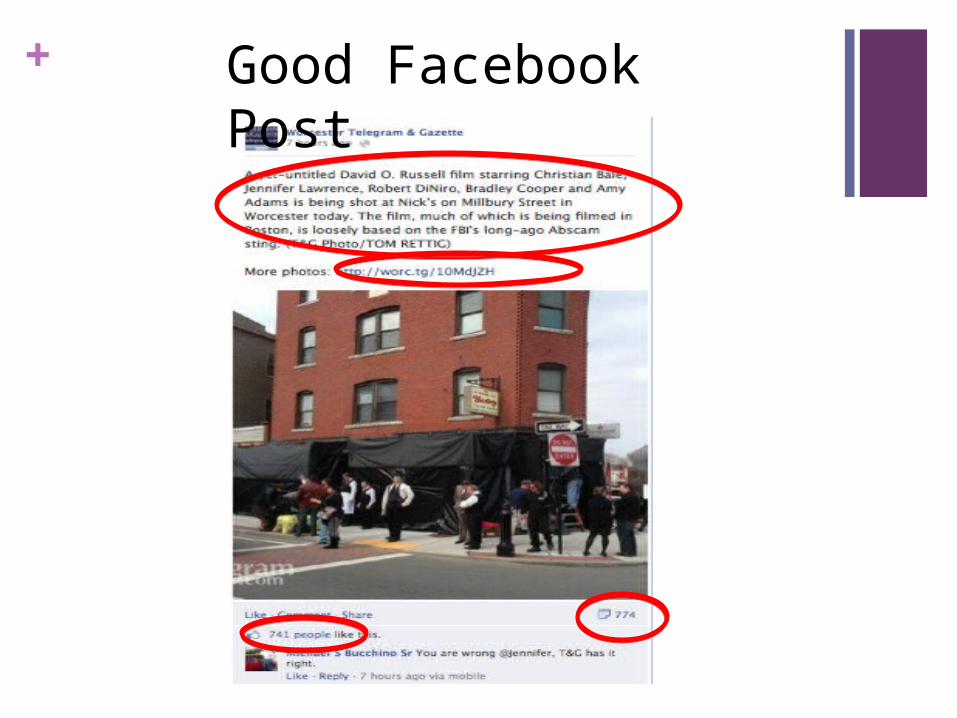
+ Good Facebook Post
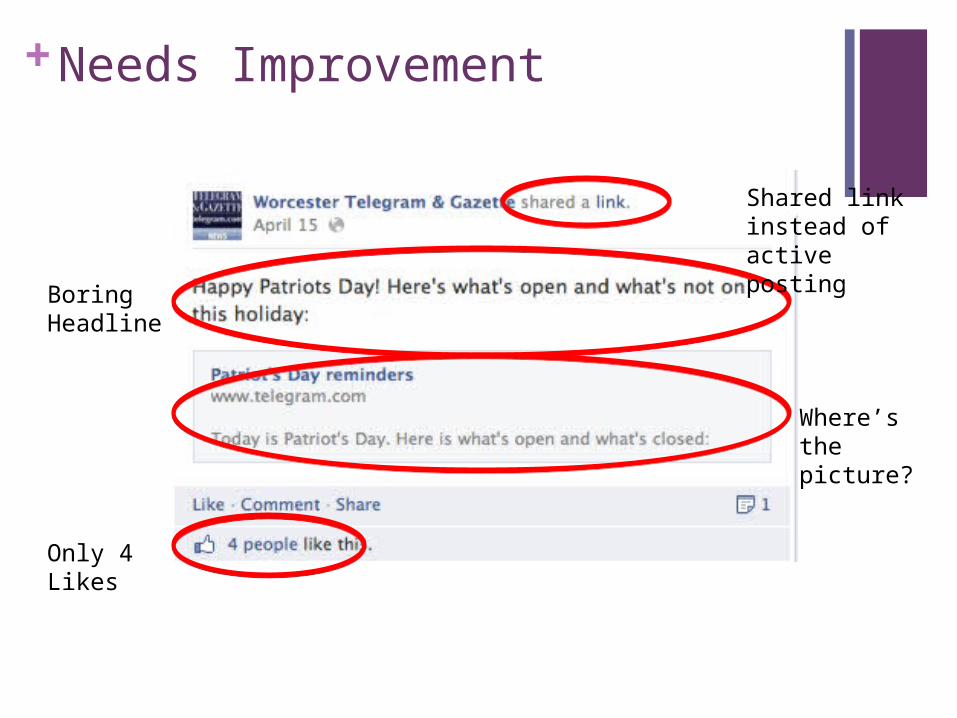
+ Needs Improvement
Only 4 Likes
Shared link instead of active posting
Boring Headline
Where’s the picture?
+Best Practices
• Post your own unique pictures with stories• Put faces on your cover photo: 1st thing people
see when they click on your page, pay more attention to this more then any other content on the wall
• Highlight your best posts: star and boost your posts
• Highlight at least once a week
+Recommendations
Reach is unlimited. Capitalize on national exposure and networks. For every 4 local posts, include 1 national post to help be put on the national scale
Be more persistent with Call of Actions ex. Like this!
More contests and giveaways could help draw traffic
Since low male traffic, include more sports posts
These will all help to increase traffic to your main website
+Strategic Goals
• Main Goal: Increase traffic by at least 10% each month
• Convert users to likes
• Secondary Goal: Encourage WT&G fans to make their friends like our page.
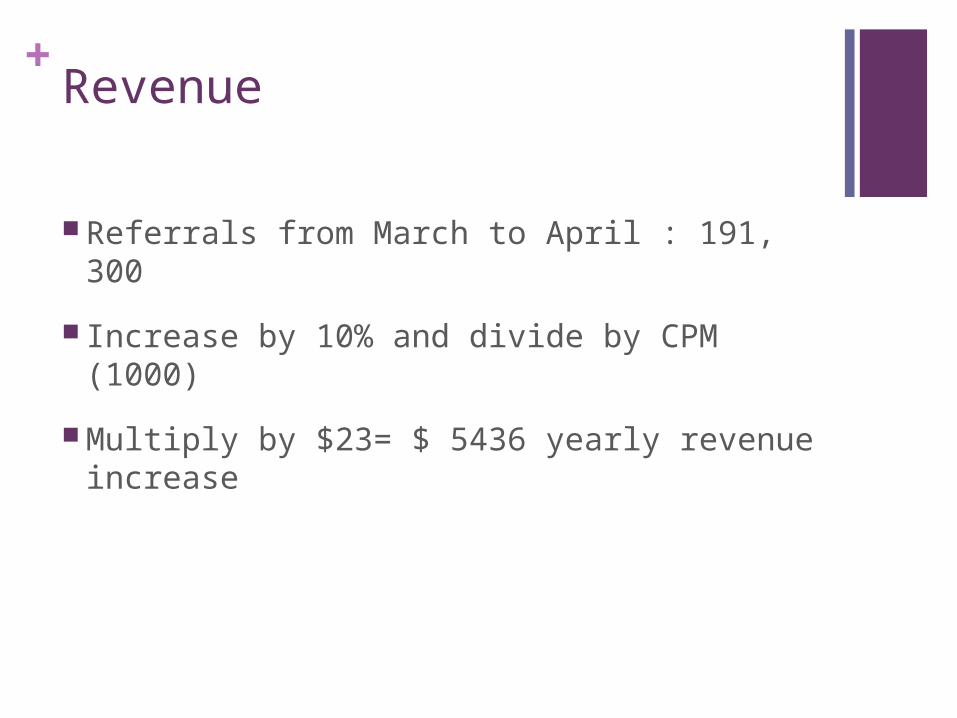
+Revenue
Referrals from March to April : 191, 300
Increase by 10% and divide by CPM (1000)
Multiply by $23= $ 5436 yearly revenue increase
+
Dashboards
+Choosing Metrics
Which metrics are the most important?
Which metrics are most directly associated with revenue?
Who will view these dashboards and how often?
What is the best way to visualize these metrics?
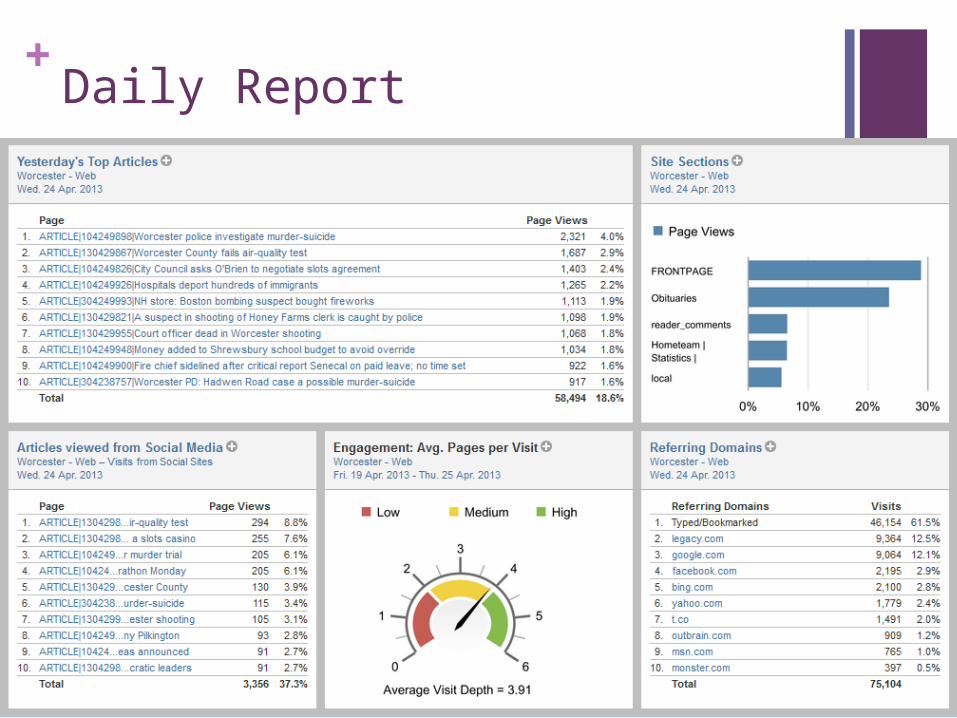
+Daily Report
+Using Dashboards: Best Practices
• Check dashboards regularly, on a time-frame that makes sense for your business.
• Use dashboards to test changes made to the site.
• Different dashboards will be important to different stakeholders – distribute them only to those who will find them most relevant.
• Change the dashboards to fit your needs – nobody knows your business like you do.

+
Conclusion
+Total Yearly Revenue Projection
$449,523.72 - $614,318.72