Embed Size (px)
Citation preview
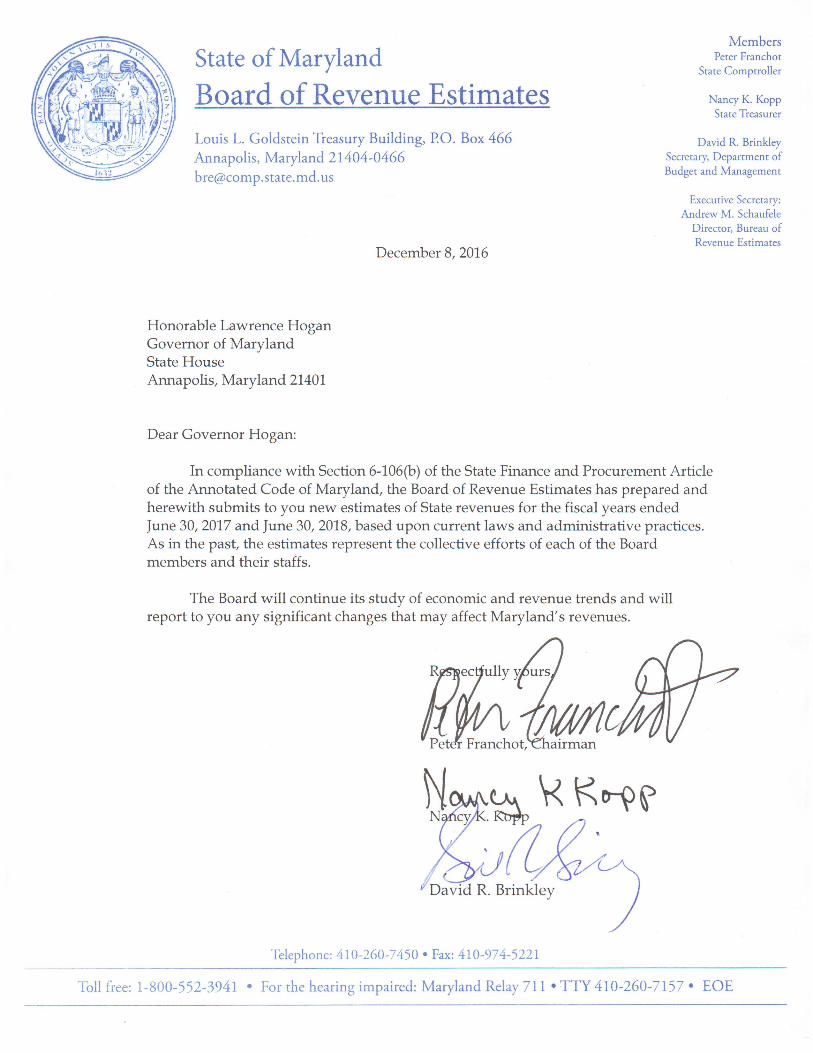


TABLE OF CONTENTS
EXECUTIVE SUMMARY
ACKNOWLEDGEMENTS
Revenue Monitoring Committee
ECONOMIC OUTLOOK
THE MARYLAND ECONOMY
GENERAL FUND REVENUES
Individual Income Tax
Corporate Income Tax
Sales and Use Taxes
Lottery
Business Franchise Taxes
Insurance Premium Tax
Estate and Inheritance Taxes
Hospital Patient Recoveries
Alcohol and Tobacco Excise Taxes
Court Revenues
Interest Earnings
Miscellaneous Revenues
Miscellaneous Agency Revenues
TRANSPORTATION REVENUES
CASINO REVENUES
FIVE YEAR GENERAL FUND FORECAST
FIVE YEAR CASINO REVENUE FORECAST
i
iii
1
5
13
17
20
22
25
26
27
27
28
28
29
29
29
30
31
32
33
36

[This Page Intentionally Left Blank]

i
Executive Summary The Board of Revenue Estimates submits revised general fund revenue estimates of $16.621 billion for fiscal year 2017 and $17.180 billion for fiscal year 2018. This translates into 2.6% and 3.4% year-over-year increases, respectively. Those rates of growth are generally sluggish with respect to historical pre-Great Recession general fund collections, though consistent with Maryland’s current and near-term economic climate. The fiscal year 2017 revision represents a decrease of $13.8 million while the fiscal year 2018 revision represents a decrease of $24.5 million from the September 2016 estimates. Furthermore, it should be noted that in the absence of certain one-time positive revenue impacts, the net adjustments would have been more profound. Although the adjustments result in a decrease to the revenue forecast on net, the big picture economic outlook remains generally unchanged from September 2016. Our expectation is for improving employment and wages as economic growth continues, but at a rate lower than in previous periods of economic expansion. While this is both a national and State issue, Maryland's performance is disproportionately impacted by both continuing federal budget sequestration and federal policy uncertainty. Employment growth is anticipated to increase from 1.5% in 2015 to 1.6% in 2016. Through October, the reported 2016 year-over-year growth rate from the Bureau of Labor Statistics is 1.8%. There is preliminary census-type data from the Department of Labor Licensing and Regulation that suggests the federal data, which is based on a survey, is slightly optimistic. Employment growth in 2017 is expected to slow as a result of the economy reaching full employment.
Maryland Board of Revenue Estimates’ Economic Forecast
Employment Aggregate
Wages Average Wages Personal Income Calendar
Year Sep 16
Dec 16 Sep 16 Dec 16
Sep 16
Dec 16
Sep 16
Dec 16
2015 1.5% 1.5% 3.9% 4.6% 2.4% 3.0% 4.0% 4.1% 2016 1.9% 1.6% 4.0% 3.3% 2.1% 1.7% 3.7% 3.3% 2017 1.0% 1.0% 3.9% 3.9% 2.9% 2.9% 4.4% 4.0% 2018 0.8% 0.8% 4.0% 4.0% 3.2% 3.2% 4.6% 4.2%
Additionally, we have amended our expected 2016 growth for aggregate wages and salaries to 3.3%. This is not a macroeconomic adjustment; rather, it is to adjust for what we believe is a pay period timing issue for the prior year. Given the one-time nature of the timing issue and the maturity of the employment expansion, we expect wage growth to increase to 3.9% in 2017. Average wage growth is also impacted by the timing issue before accelerating in both 2017 and 2018 as the labor market tightens and inflation materializes.

ii
Driving the net decrease in our total revenue forecast is a downward revision to corporate income tax revenue -- reductions of $81.8 million for fiscal year 2017 and $68.1 million for fiscal year 2018. It now appears that corporate income in tax year 2015 was weaker than initially expected. Consequently, many corporations overpaid in fiscal year 2016 and have since filed for refunds in fiscal year 2017. The number of refunds, and dollars per refund, has increased substantially this fiscal year. Furthermore, there were several large refunds of a one-time nature that are not expected to continue beyond fiscal year 2017. This explains why the reduction in fiscal year 2018 is smaller than in fiscal year 2017. Additionally, beyond fiscal year 2017, the outlook for corporate profits, and resulting tax revenue, has been reduced since our September forecast.
The increased revenues for the personal income tax are de minimis in amount, but
deserve some attention as the State’s largest source of revenue. Concealed within the above estimate for personal income is a component designed to measure income sourced from dividends, interest, and rent (DIR). While the prospect for near-term federal funds rate increases seems very likely, DIR was reduced as our expectation for the impact of those federal funds rate increases is diminished relative to September. That adjustment reduces the outlook for income tax net receipts; however, countering that reduction is an increase to the State’s share of income tax. This increase results from new information available with the closeout of tax year 2015 and serves to provide the modest increase. The sales tax, the State’s second largest source of general funds, is revised up modestly: $17.8 million for fiscal year 2017 and $15.9 million for fiscal year 2016. The relatively small revision reflects the fact that year-to-date collections are slightly better than our September estimate. Conversely, lottery revenue is revised down by $20.4 million in fiscal year 2017 and $18.7 million in fiscal year 2018. To date, sales growth has lagged our prior expectations, and payout rates have not favored the State. It is worth noting that the lottery estimate faces heightened uncertainty this year as it competes with the opening of the MGM casino in Prince George’s County. Business Franchise Taxes benefit from the slower than expected rollout of the Maryland Small Business Retirement Savings Program which would have reduced business filing fees. The extraordinary revenues of $47.4 million are the result of an overfunding of the Local Income Tax Reserve account as identified by the GAAP analysis for fiscal year 2016.
iii
State of MarylandBoard of Revenue Estimates
Members
Peter Franchot State Comptroller
Nancy K. Kopp State Treasurer
David R. Brinkley
Secretary, Department of Budget and Management
Executive Secretary:
Andrew Schaufele Director, Bureau of Revenue Estimates
Louis L. Goldstein Treasury Building, P.O. Box 466 Annapolis, Maryland 21404-0466 E-mail: [email protected]
The Board of Revenue Estimates thanks the following participants of the Revenue Monitoring
Committee for their assistance.
Andrew Schaufele, Chairman Director, Bureau of Revenue Estimates Office of the Comptroller Bernadette T. Benik Chief Deputy Treasurer State Treasurer’s Office Ryan Bishop, Senior Manager Office of Policy Analysis Department of Legislative Services Sharonne Bonardi Deputy Comptroller Office of the Comptroller Warren G. Deschenaux Executive Director Department of Legislative Services David Farkas, Revenue Policy Analyst Bureau of Revenue Estimates Office of the Comptroller Wayne Green, Director Revenue Administration Division Office of the Comptroller Mary Christine Jackman, Director Investments State Treasurer’s Office Christian Lund, Deputy Director Debt Management State Treasurer’s Office Jonathan Martin, Executive Director Office of Budget Analysis Department of Budget and Management
Nataliia Medynets, Revenue Policy Analyst Bureau of Revenue Estimates Office of the Comptroller Marc Nicole Deputy Secretary Department of Budget and Management Jessica Papaleonti, Director Budget & Financial Administration State Treasurer’s Office James Pasko, Manager Revenue Administration Division Office of the Comptroller Ryan Platner, Economist Office of Budget Analysis Department of Budget and Management Daniel Riley, Director Compliance Division Office of the Comptroller David Romans, Fiscal & Policy Coordinator Fiscal & Policy Analysis Department of Legislative Services Theresa M. Tuszynski, Economist Office of Policy Analysis Department of Legislative Services Linda Williams Financial Planning Manager Maryland Department of Transportation
Telephone: 410-260-7450
Toll free: 1-888-674-0017 • For the hearing impaired: Maryland Relay 711 • TTY 410-260-7157 • EOE

[This Page Intentionally Left Blank]
Economic Outlook In the nation as a whole, economic growth since the Great Recession remains muted. Moreover,
the fiscal drag from federal budget sequestration and ongoing federal policy uncertainty continue to restrain growth in Maryland and the region. In other words, the economic picture has not changed much, accordingly our outlook remains subdued relative to previous periods of economic expansion. It must be stressed that our outlook calls for improving employment and wages as growth continues, just not at the rates witnessed throughout the expansionary periods of the 1990s and 2000s.
The National Expansion and Business Investment
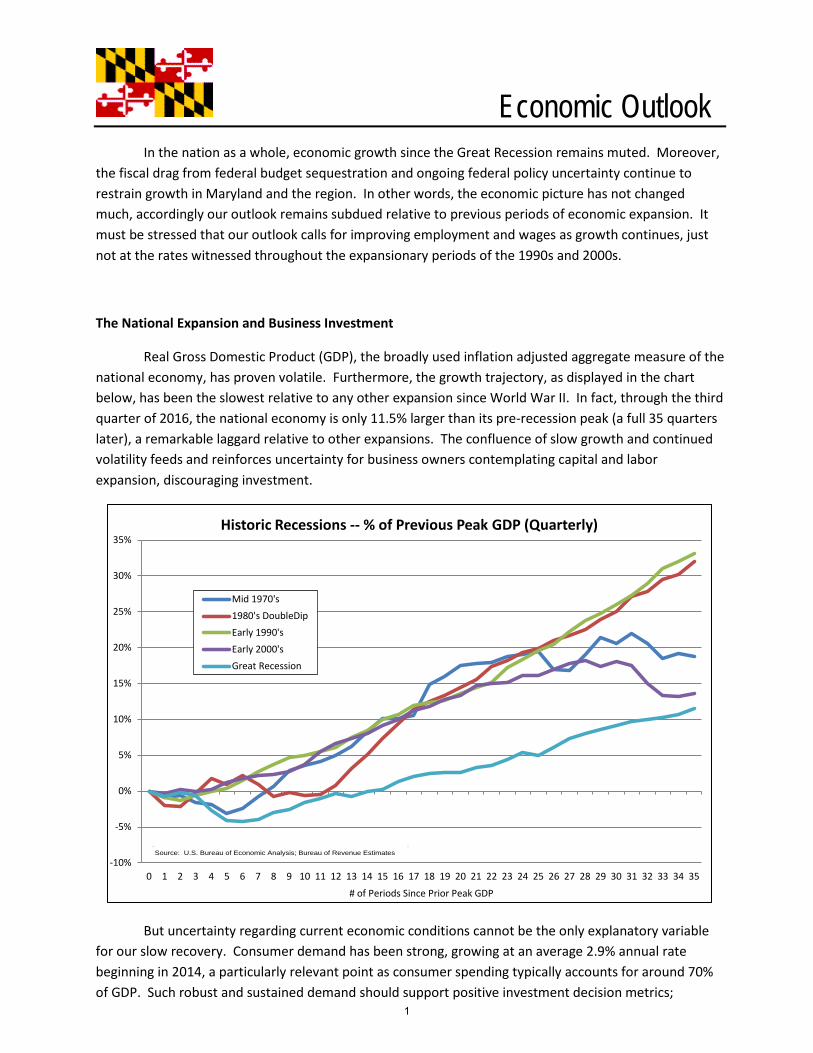
Real Gross Domestic Product (GDP), the broadly used inflation adjusted aggregate measure of the national economy, has proven volatile. Furthermore, the growth trajectory, as displayed in the chart below, has been the slowest relative to any other expansion since World War II. In fact, through the third quarter of 2016, the national economy is only 11.5% larger than its pre-recession peak (a full 35 quarters later), a remarkable laggard relative to other expansions. The confluence of slow growth and continued volatility feeds and reinforces uncertainty for business owners contemplating capital and labor expansion, discouraging investment.
But uncertainty regarding current economic conditions cannot be the only explanatory variable for our slow recovery. Consumer demand has been strong, growing at an average 2.9% annual rate beginning in 2014, a particularly relevant point as consumer spending typically accounts for around 70% of GDP. Such robust and sustained demand should support positive investment decision metrics;
-10%
-5%
0%
5%
10%
15%
20%
25%
30%
35%
0 1 2 3 4 5 6 7 8 9 10 11 12 13 14 15 16 17 18 19 20 21 22 23 24 25 26 27 28 29 30 31 32 33 34 35
# of Periods Since Prior Peak GDP
Historic Recessions -- % of Previous Peak GDP (Quarterly)
Mid 1970's1980's DoubleDipEarly 1990'sEarly 2000'sGreat Recession
Source: U.S. Bureau of Economic Analysis; Bureau of Revenue Estimates
1
however, it does not seem that companies are investing heavily in the future. Quite the opposite, companies are distributing cash to their investors at a relatively high instance through one-time measures such as stock buy backs or ongoing measures such as increased or new dividends.
A company, acting as a fiduciary for its owners, should only distribute cash to shareholders when it cannot determine an investment with a greater return. While this might be somewhat a function of the ever increasing need to meet short-term investor return requirements, it is also likely demonstrative of fewer investment opportunities. The latter is a point of particular concern and requires further examination.
The quantity of labor and the productivity of that labor generally sums up to the supply side of the economy. Contrary to what is often turned into a partisan political argument, the supply and demand sides of the economy are equally relevant and highly dependent upon one another. While there is no empirical consensus that defines the root cause of the recent economic sluggishness, it is likely a function of a reduced outlook for the labor force, the ability of that labor to grow production levels at previously experienced rates, and the subsequent impact those factors will have on demand.
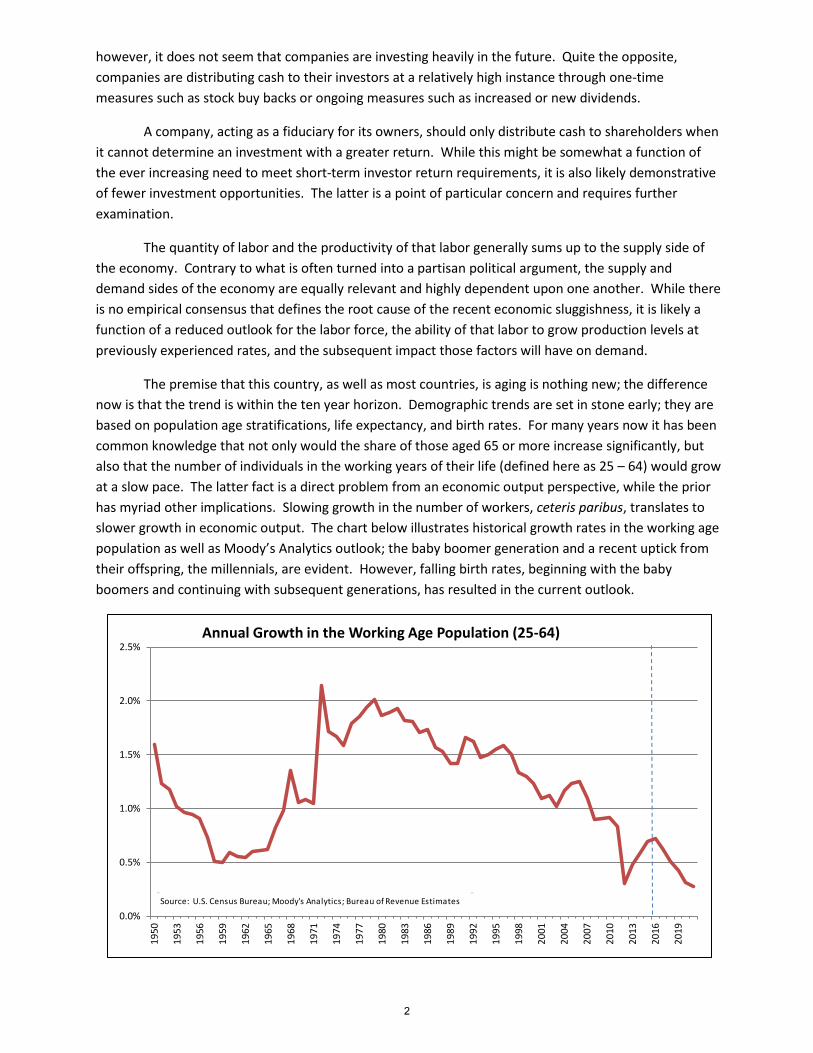
The premise that this country, as well as most countries, is aging is nothing new; the difference now is that the trend is within the ten year horizon. Demographic trends are set in stone early; they are based on population age stratifications, life expectancy, and birth rates. For many years now it has been common knowledge that not only would the share of those aged 65 or more increase significantly, but also that the number of individuals in the working years of their life (defined here as 25 – 64) would grow at a slow pace. The latter fact is a direct problem from an economic output perspective, while the prior has myriad other implications. Slowing growth in the number of workers, ceteris paribus, translates to slower growth in economic output. The chart below illustrates historical growth rates in the working age population as well as Moody’s Analytics outlook; the baby boomer generation and a recent uptick from their offspring, the millennials, are evident. However, falling birth rates, beginning with the baby boomers and continuing with subsequent generations, has resulted in the current outlook.
0.0%
0.5%
1.0%
1.5%
2.0%
2.5%
1950
1953
1956
1959
1962
1965
1968
1971
1974
1977
1980
1983
1986
1989
1992
1995
1998
2001
2004
2007
2010
2013
2016
2019
Annual Growth in the Working Age Population (25-64)
Source: U.S. Census Bureau; Moody's Analytics; Bureau of Revenue Estimates
2
The above could be offset by increased productivity, but that also seems to be an issue. Since World War II this country has witnessed extraordinary growth from this metric, a key reason that this country enjoys the relatively high standard of living that it does. Technological revolutions affecting industrial as well as office activities have dominated the economic landscape, resulting in outsized gains for the economy.
The cause of recent slowing in productivity is a highly debated issue amongst economists. One argument is that we have picked the proverbial low hanging fruit, meaning that marginal improvements made to technology at this point result in lesser gains than prior improvements; hence slower growth. Additionally, such technology is now relatively ubiquitous across industries and consumers alike.
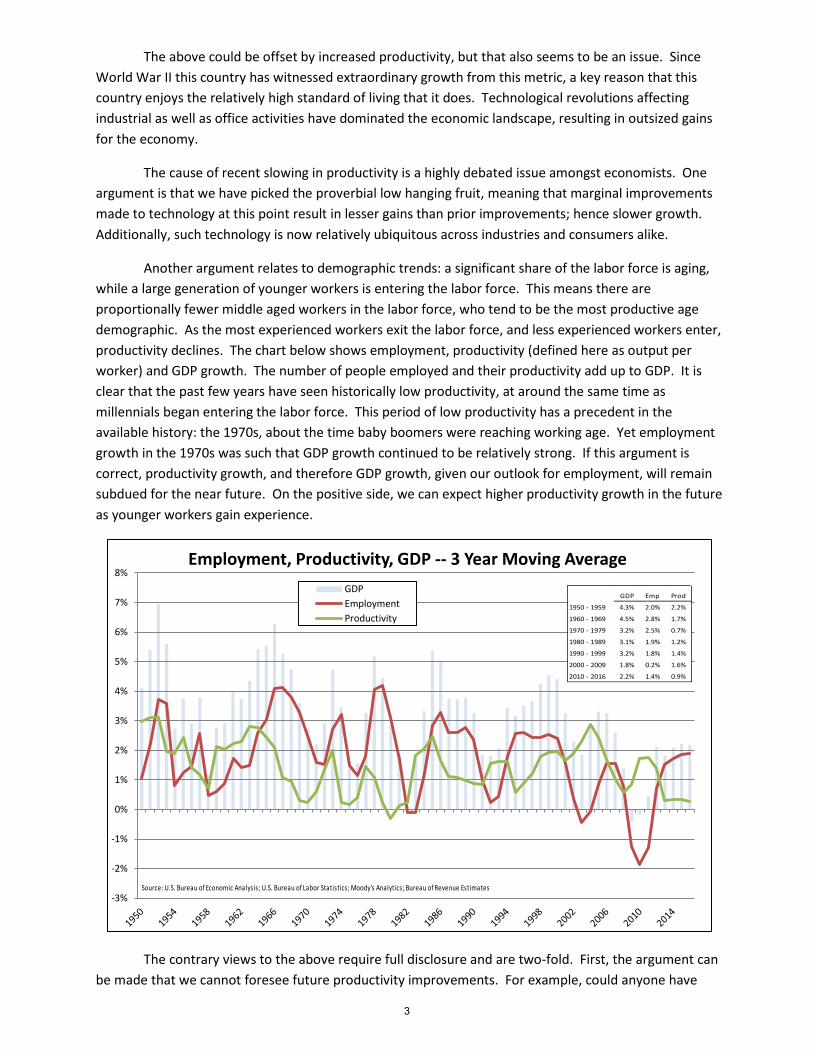
Another argument relates to demographic trends: a significant share of the labor force is aging, while a large generation of younger workers is entering the labor force. This means there are proportionally fewer middle aged workers in the labor force, who tend to be the most productive age demographic. As the most experienced workers exit the labor force, and less experienced workers enter, productivity declines. The chart below shows employment, productivity (defined here as output per worker) and GDP growth. The number of people employed and their productivity add up to GDP. It is clear that the past few years have seen historically low productivity, at around the same time as millennials began entering the labor force. This period of low productivity has a precedent in the available history: the 1970s, about the time baby boomers were reaching working age. Yet employment growth in the 1970s was such that GDP growth continued to be relatively strong. If this argument is correct, productivity growth, and therefore GDP growth, given our outlook for employment, will remain subdued for the near future. On the positive side, we can expect higher productivity growth in the future as younger workers gain experience.
The contrary views to the above require full disclosure and are two-fold. First, the argument can be made that we cannot foresee future productivity improvements. For example, could anyone have
-3%
-2%
-1%
0%
1%
2%
3%
4%
5%
6%
7%
8%Employment, Productivity, GDP -- 3 Year Moving Average
GDPEmploymentProductivity
Source: U.S. Bureau of Economic Analysis; U.S. Bureau of Labor Statistics; Moody's Analytics; Bureau of Revenue Estimates
GDP Emp Prod
1950 - 1959 4.3% 2.0% 2.2%
1960 - 1969 4.5% 2.8% 1.7%
1970 - 1979 3.2% 2.5% 0.7%
1980 - 1989 3.1% 1.9% 1.2%
1990 - 1999 3.2% 1.8% 1.4%
2000 - 2009 1.8% 0.2% 1.6%
2010 - 2016 2.2% 1.4% 0.9%
3
truly predicted the omnipresence of the internet? Therefore how could we discount the possibility for future innovation? Human ingenuity will result in some great new market or technological improvement, whether it is an energy revolution or something completely unimaginable at the moment. However, faith in the future is not a prudent basis for the near-term outlook. The second argument is that GDP is not accurately measuring the contribution of much of the new technology, particularly technology that is available for free (e.g., Facebook, etc.). It is not a simple endeavor to determine its value. To be sure, many of the websites and applications coming out of Silicon Valley type companies create great utility, but that does not mean they comparatively create the broad based economic value as, say, enterprise software systems did in the 1990s. Furthermore, non-monetary transactions are not part of the tax base, which means that the amount of value they create has little significance for the amount of tax revenue the state will collect.
The above supply side issues translate to the demand side, and vice-versa. Slower growth in workers also means slower growth in consumers. If the expectation is for GDP to grow slower in general because of productivity concerns, that will translate to lesser wage gains, another impediment to consumer spending. Additionally, recent above average unemployment may have temporarily eroded the ability of workers to demand higher wages, contributing to subdued wage growth. The result would be less incentive for employers to invest in labor saving technology that would boost productivity. Of course, many of our companies and their workers are operating in a global economy, not a national economy. Many developed nations are in similar or worse situations. Some are further along the road at this point in terms of aging populations. Increasing purchasing power in developing nations, even as their rapid expansions begin to slow a bit, have likely already been factored in; the large investments required to satisfy that demand have likely been made and further increases will only prove marginal in the forecast horizon.
Labor Market Improvements & Wage Growth
The national labor market continues to improve, albeit at a slower pace. After growing 2.1% in 2015, the number of jobs has grown 1.4% through November of this year. The unemployment rate has fallen to 4.6%. Lagging employment gains have been wage improvements. The average wage, defined as total wages divided by the total number of jobs, increased just 2.9% in 2015 and is up only 1.6% through the first two quarters of 2016. In several years after the Great Recession inflation adjusted average wage growth was negative, meaning consumers lost purchasing power.
However, wage gains typically do lag employment gains. This is a bright spot in the outlook; as we continue to add positions and bring individuals back into the labor market, the market will tighten and wage growth should increase. The concern at this point is that the job mix, or the types of jobs that are being created, has been heavily concentrated in positions below the national average wage. As a result, growth in average wages might remain muted relative to the normal gains accompanying a tightening labor market.
Gains in the national labor market have favored low-skilled service positions. Such positions are likely growing in order to satisfy demand from those consumers who have seen their incomes rise at healthy rates throughout this recovery: those that own capital and those in skilled positions. There is, of course, nothing wrong with the work or services performed by individuals in these lower-skilled
4

positions, but it will restrain wage growth. This may help reconcile the weak growth in GDP and the strong labor gains.
Maryland and Sequester
Maryland’s economic growth between 2012 and 2015 has been tepid at best, particularly relative to national growth. This coincides with federal budget sequestration. The private sector began to adjust payrolls immediately, even as the bill was being discussed in Congress. Actual austerity measures did not take effect until 2013, at which point the private and public sectors took another hit. The following chart illustrates the relative weakness of Maryland’s recovery over this period compared to the national recovery, a clear indication of the relative fiscal drag.
The chart on the following page may help to illustrate the timing of the impacts and might even offer a glimmer of hope. The data is somewhat esoteric, even for most economists, but it shows the growth in the value of intermediate inputs purchased by the federal government. Intermediate inputs represent the value of the private sector’s sales to the federal government, an important component to Maryland’s economy. While this data is not Maryland specific, we are far more affected than any other jurisdiction outside of Virginia and the District.
-6%
-4%
-2%
0%
2%
4%
6%
8%
10%
12%
14%Real GDP Growth for MD and US, Indexed to 4th Qtr 2007
US MD
Source: U.S. Bureau of Economic Analysis; Bureau of Revenue Estimates
Essentially Flat Line from 2011Q3 to 2014Q1
5
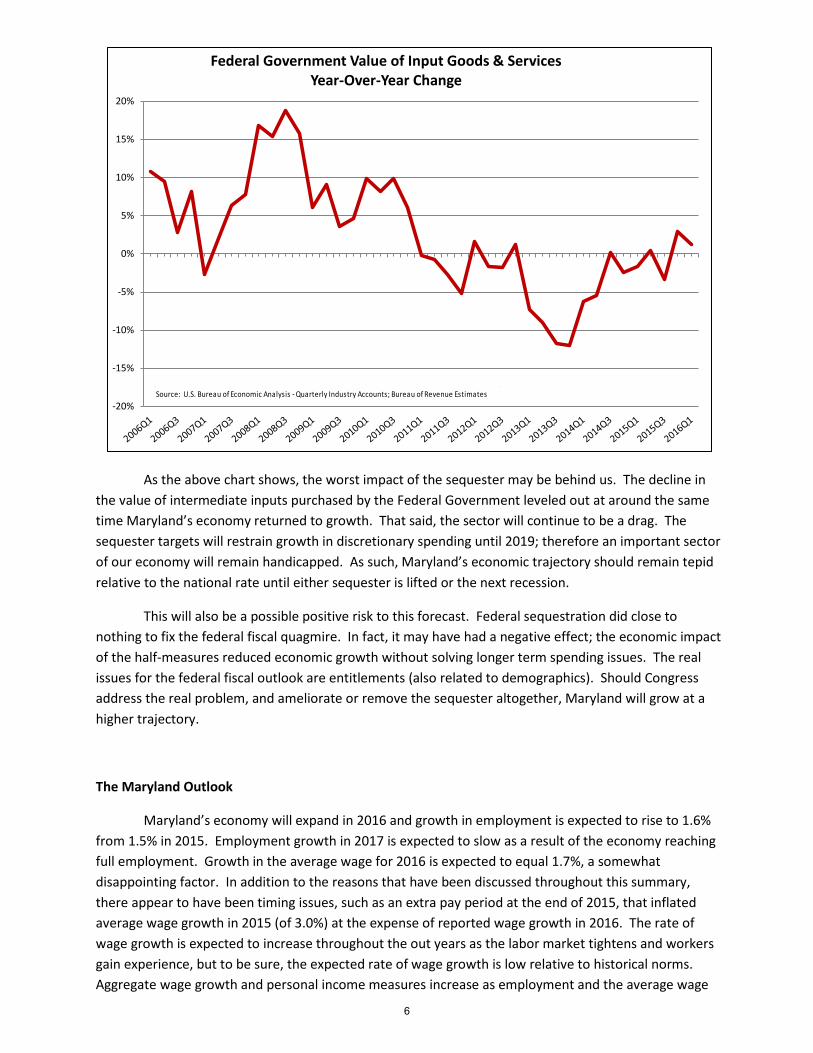
As the above chart shows, the worst impact of the sequester may be behind us. The decline in the value of intermediate inputs purchased by the Federal Government leveled out at around the same time Maryland’s economy returned to growth. That said, the sector will continue to be a drag. The sequester targets will restrain growth in discretionary spending until 2019; therefore an important sector of our economy will remain handicapped. As such, Maryland’s economic trajectory should remain tepid relative to the national rate until either sequester is lifted or the next recession.
This will also be a possible positive risk to this forecast. Federal sequestration did close to nothing to fix the federal fiscal quagmire. In fact, it may have had a negative effect; the economic impact of the half-measures reduced economic growth without solving longer term spending issues. The real issues for the federal fiscal outlook are entitlements (also related to demographics). Should Congress address the real problem, and ameliorate or remove the sequester altogether, Maryland will grow at a higher trajectory.
The Maryland Outlook
Maryland’s economy will expand in 2016 and growth in employment is expected to rise to 1.6% from 1.5% in 2015. Employment growth in 2017 is expected to slow as a result of the economy reaching full employment. Growth in the average wage for 2016 is expected to equal 1.7%, a somewhat disappointing factor. In addition to the reasons that have been discussed throughout this summary, there appear to have been timing issues, such as an extra pay period at the end of 2015, that inflated average wage growth in 2015 (of 3.0%) at the expense of reported wage growth in 2016. The rate of wage growth is expected to increase throughout the out years as the labor market tightens and workers gain experience, but to be sure, the expected rate of wage growth is low relative to historical norms. Aggregate wage growth and personal income measures increase as employment and the average wage
-20%
-15%
-10%
-5%
0%
5%
10%
15%
20%
Federal Government Value of Input Goods & Services Year-Over-Year Change
Source: U.S. Bureau of Economic Analysis - Quarterly Industry Accounts; Bureau of Revenue Estimates
6
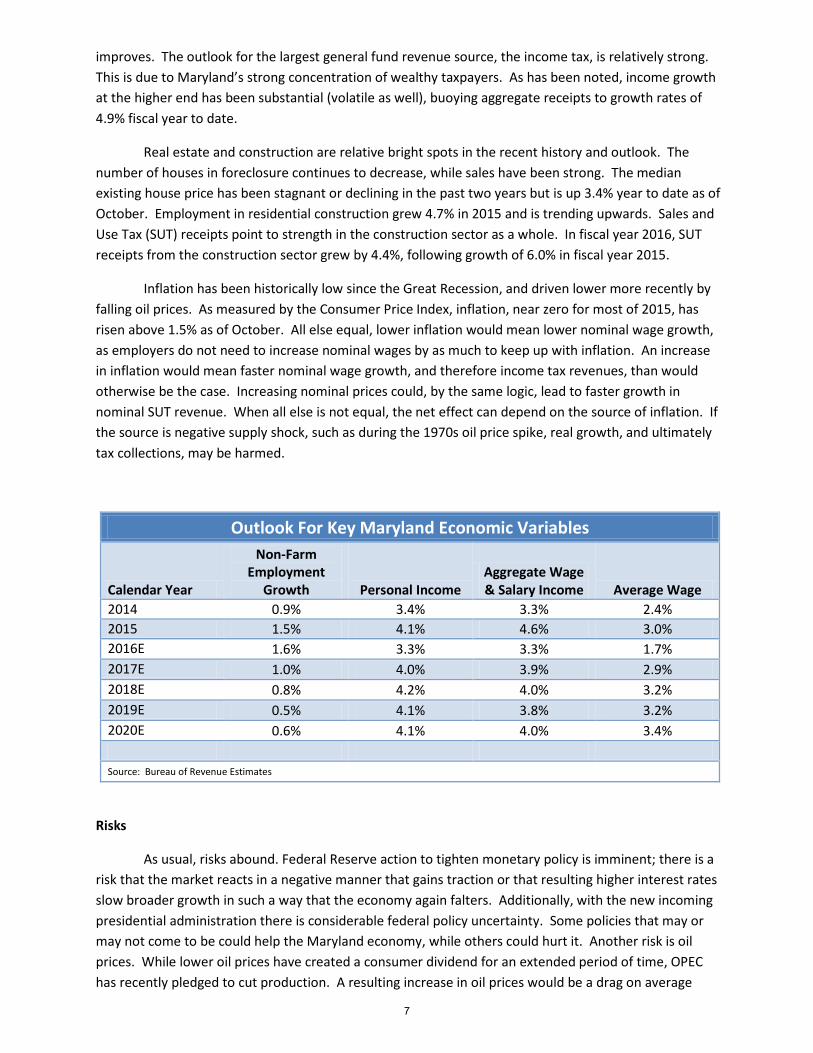
improves. The outlook for the largest general fund revenue source, the income tax, is relatively strong. This is due to Maryland’s strong concentration of wealthy taxpayers. As has been noted, income growth at the higher end has been substantial (volatile as well), buoying aggregate receipts to growth rates of 4.9% fiscal year to date.
Real estate and construction are relative bright spots in the recent history and outlook. The number of houses in foreclosure continues to decrease, while sales have been strong. The median existing house price has been stagnant or declining in the past two years but is up 3.4% year to date as of October. Employment in residential construction grew 4.7% in 2015 and is trending upwards. Sales and Use Tax (SUT) receipts point to strength in the construction sector as a whole. In fiscal year 2016, SUT receipts from the construction sector grew by 4.4%, following growth of 6.0% in fiscal year 2015.
Inflation has been historically low since the Great Recession, and driven lower more recently by falling oil prices. As measured by the Consumer Price Index, inflation, near zero for most of 2015, has risen above 1.5% as of October. All else equal, lower inflation would mean lower nominal wage growth, as employers do not need to increase nominal wages by as much to keep up with inflation. An increase in inflation would mean faster nominal wage growth, and therefore income tax revenues, than would otherwise be the case. Increasing nominal prices could, by the same logic, lead to faster growth in nominal SUT revenue. When all else is not equal, the net effect can depend on the source of inflation. If the source is negative supply shock, such as during the 1970s oil price spike, real growth, and ultimately tax collections, may be harmed.
Outlook For Key Maryland Economic Variables
Calendar Year
Non-Farm Employment
Growth Personal Income Aggregate Wage & Salary Income Average Wage
2014 0.9% 3.4% 3.3% 2.4% 2015 1.5% 4.1% 4.6% 3.0% 2016E 1.6% 3.3% 3.3% 1.7% 2017E 1.0% 4.0% 3.9% 2.9% 2018E 0.8% 4.2% 4.0% 3.2% 2019E 0.5% 4.1% 3.8% 3.2% 2020E 0.6% 4.1% 4.0% 3.4% Source: Bureau of Revenue Estimates
Risks
As usual, risks abound. Federal Reserve action to tighten monetary policy is imminent; there is a risk that the market reacts in a negative manner that gains traction or that resulting higher interest rates slow broader growth in such a way that the economy again falters. Additionally, with the new incoming presidential administration there is considerable federal policy uncertainty. Some policies that may or may not come to be could help the Maryland economy, while others could hurt it. Another risk is oil prices. While lower oil prices have created a consumer dividend for an extended period of time, OPEC has recently pledged to cut production. A resulting increase in oil prices would be a drag on average
7

consumer spending in Maryland. Where oil prices end up depends predominantly on the size of OPEC production cuts and the ability of shale oil producers in the United States to increase their output in response to a rise in prices.
Positive risks include the aforementioned reduction or abolition of federal sequester, as well as the expansion of the Panama Canal for the Port of Baltimore. The Panama Canal widening, which allows so called “post-Panamax ships” to navigate the Canal, permits large cargo ships to sail from Asia to the East Coast. Prior to the project’s completion in June 2016 that cargo was typically delivered to the West Coast and then transported by rail and road throughout the country. Baltimore is one of the few ports on the East Coast with the depth and infrastructure to handle these types of ships and will see increased need for labor and capital, of which the proposed expansion of the Howard Street rail tunnel is an example. Should there be a meaningful surge in activity and jobs, there will also be positive indirect and induced impacts.
8

[This Page Intentionally Left Blank]
9
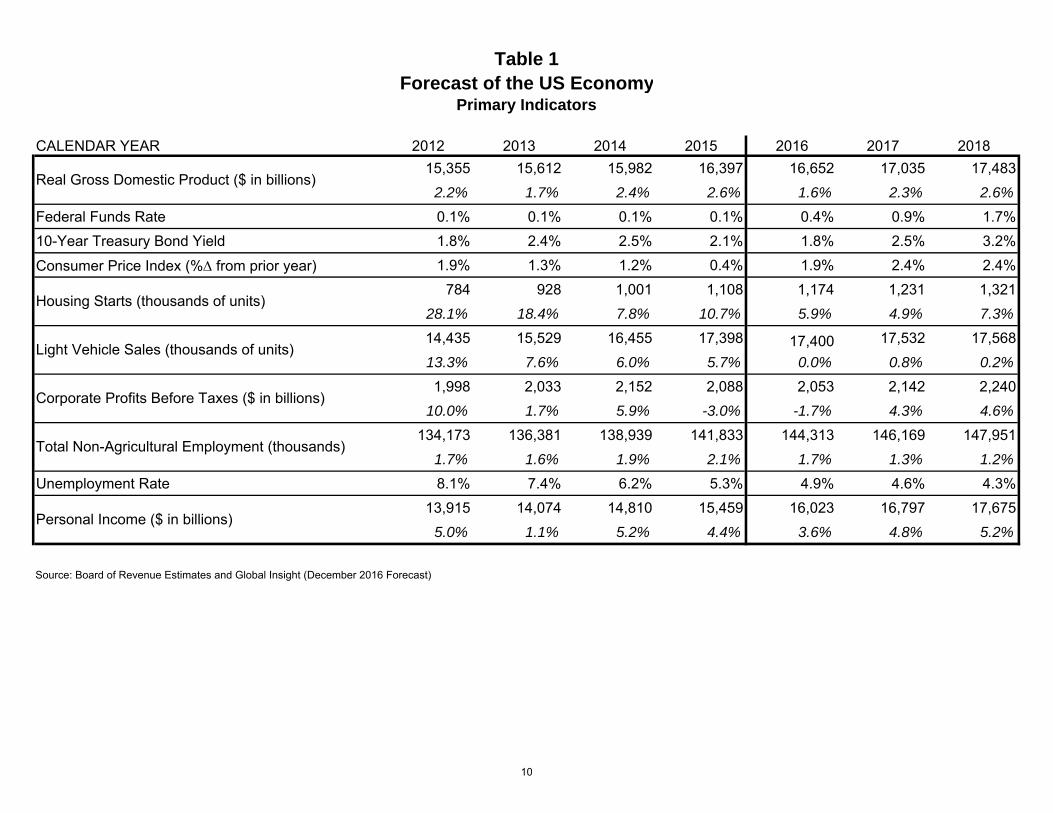
Table 1Forecast of the US Economy
Primary Indicators
CALENDAR YEAR 2012 2013 2014 2015 2016 2017 201815,355 15,612 15,982 16,397 16,652 17,035 17,483
2.2% 1.7% 2.4% 2.6% 1.6% 2.3% 2.6%Federal Funds Rate 0.1% 0.1% 0.1% 0.1% 0.4% 0.9% 1.7%10-Year Treasury Bond Yield 1.8% 2.4% 2.5% 2.1% 1.8% 2.5% 3.2%
Consumer Price Index (% from prior year) 1.9% 1.3% 1.2% 0.4% 1.9% 2.4% 2.4%784 928 1,001 1,108 1,174 1,231 1,321
28.1% 18.4% 7.8% 10.7% 5.9% 4.9% 7.3%14,435 15,529 16,455 17,398 17,400 17,532 17,56813.3% 7.6% 6.0% 5.7% 0.0% 0.8% 0.2%1,998 2,033 2,152 2,088 2,053 2,142 2,240
10.0% 1.7% 5.9% -3.0% -1.7% 4.3% 4.6%134,173 136,381 138,939 141,833 144,313 146,169 147,951
1.7% 1.6% 1.9% 2.1% 1.7% 1.3% 1.2%Unemployment Rate 8.1% 7.4% 6.2% 5.3% 4.9% 4.6% 4.3%
13,915 14,074 14,810 15,459 16,023 16,797 17,6755.0% 1.1% 5.2% 4.4% 3.6% 4.8% 5.2%
Source: Board of Revenue Estimates and Global Insight (December 2016 Forecast)
Personal Income ($ in billions)
Real Gross Domestic Product ($ in billions)
Housing Starts (thousands of units)
Light Vehicle Sales (thousands of units)
Corporate Profits Before Taxes ($ in billions)
Total Non-Agricultural Employment (thousands)
10
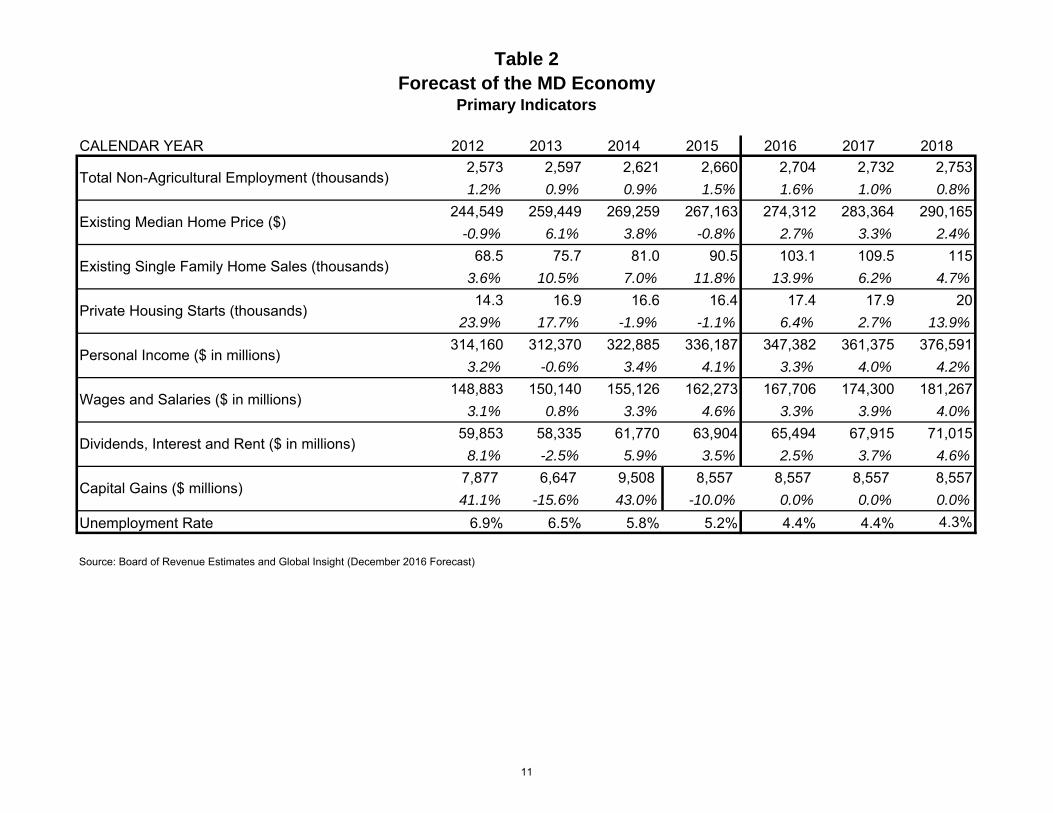
Table 2Forecast of the MD Economy
Primary Indicators
CALENDAR YEAR 2012 2013 2014 2015 2016 2017 20182,573 2,597 2,621 2,660 2,704 2,732 2,7531.2% 0.9% 0.9% 1.5% 1.6% 1.0% 0.8%
244,549 259,449 269,259 267,163 274,312 283,364 290,165-0.9% 6.1% 3.8% -0.8% 2.7% 3.3% 2.4%
68.5 75.7 81.0 90.5 103.1 109.5 1153.6% 10.5% 7.0% 11.8% 13.9% 6.2% 4.7%14.3 16.9 16.6 16.4 17.4 17.9 20
23.9% 17.7% -1.9% -1.1% 6.4% 2.7% 13.9%314,160 312,370 322,885 336,187 347,382 361,375 376,591
3.2% -0.6% 3.4% 4.1% 3.3% 4.0% 4.2%148,883 150,140 155,126 162,273 167,706 174,300 181,267
3.1% 0.8% 3.3% 4.6% 3.3% 3.9% 4.0%59,853 58,335 61,770 63,904 65,494 67,915 71,015
8.1% -2.5% 5.9% 3.5% 2.5% 3.7% 4.6%7,877 6,647 9,508 8,557 8,557 8,557 8,55741.1% -15.6% 43.0% -10.0% 0.0% 0.0% 0.0%
Unemployment Rate 6.9% 6.5% 5.8% 5.2% 4.4% 4.4% 4.3%
Source: Board of Revenue Estimates and Global Insight (December 2016 Forecast)
Wages and Salaries ($ in millions)
Dividends, Interest and Rent ($ in millions)
Capital Gains ($ millions)
Total Non-Agricultural Employment (thousands)
Existing Median Home Price ($)
Existing Single Family Home Sales (thousands)
Private Housing Starts (thousands)
Personal Income ($ in millions)
11

[This Page Intentionally Left Blank]
12
General Fund Revenues In preparing these estimates, all of the State’s revenue collecting agencies were
consulted. In addition, the Board of Revenue Estimates continued to rely on the Revenue Monitoring Committee, comprised of key State staff with revenue estimating knowledge or collection responsibility. The committee compared and considered alternative economic forecasts from national economic consulting firm Moody’s Analytics and Global Insight, and local economists at Sage Policy Group.
Table 3 shows detail on general fund and selected special fund revenue sources for fiscal years 2016 through 2018. Table 4 provides additional detail on general fund revenues. The sections which follow these tables provide more information on each of the state’s general fund revenue sources.
13
Table 3Selected Revenues
Fiscal Years 2016 - 2018
GENERAL FUND SPECIAL FUND TOTALFiscal Year Fiscal Year Fiscal Year Fiscal Year Fiscal Year Fiscal Year Fiscal Year Fiscal Year Fiscal Year
2016 2017 Revised 2018 2016 2017 Revised 2018 2016 2017 Revised 2018$ Thousands Actual Estimate Estimate Actual Estimate Estimate Actual Estimate EstimateINCOME TAXES
Individual 8,517,585 8,991,352 9,389,593 8,517,585 8,991,352 9,389,593Corporations 874,465 771,602 830,074 254,543 200,118 215,283 1,129,008 971,720 1,045,357
Total 9,392,050 9,762,953 10,219,667 254,543 200,118 215,283 9,646,594 9,963,071 10,434,949
SALES AND USE TAXES 4,444,481 4,592,595 4,741,168 59,759 69,083 69,774 4,504,241 4,661,678 4,810,942
STATE LOTTERY RECEIPTSLottery Games 529,754 492,309 505,178 102,091 109,175 109,248 631,845 601,484 614,427Casinos 519,211 622,529 746,275 519,211 622,529 746,275
Total 529,754 492,309 505,178 621,302 731,704 855,523 1,151,056 1,224,013 1,360,701
TRANSPORTATION REVENUESMotor Vehicle Fuel Tax 4,625 - - 1,006,712 1,033,040 1,048,493 1,011,337 1,033,040 1,048,493Motor Vehicle Licenses, Fees 778,248 793,482 794,386 778,248 793,482 794,386Motor Vehicle Titling Tax 860,416 882,000 895,000 860,416 882,000 895,000Maryland Transit Fees 156,579 159,988 167,606 156,579 159,988 167,606Maryland Port Fees 49,999 50,505 52,508 49,999 50,505 52,508Maryland Aviation Fees 229,993 234,389 237,076 229,993 234,389 237,076
Total 4,625 - - 3,081,947 3,153,404 3,195,069 3,086,572 3,153,404 3,195,069
OTHER REVENUESProperty Transfer Tax 115,367 62,771 46,028 76,383 140,463 168,802 191,750 203,234 214,830Business Franchises and Filing Fees 221,967 223,513 227,345 221,967 223,513 227,345State Tobacco Tax 395,279 393,827 392,214 395,279 393,827 392,214Tax on Insurance Companies 287,407 294,802 304,618 287,407 294,802 304,618Alcoholic Beverages Excises 31,946 32,947 33,365 31,946 32,947 33,365Estate & Inheritance Taxes 261,932 206,720 184,512 261,932 206,720 184,512Clerks of the Court 34,203 36,947 36,393 34,203 36,947 36,393District Courts 72,334 70,255 70,240 72,334 70,255 70,240Hospital Patient Recoveries 57,499 57,781 58,296 57,499 57,781 58,296Interest on Investments 15,008 20,000 35,000Miscellaneous Fees, Other Receipts 334,145 326,485 326,311
Total 1,827,086 1,726,047 1,714,320
Total Current Revenues 16,197,996 16,573,905 17,180,333
Extraordinary Revenues1 - 47,432 -
GRAND TOTAL 16,197,996 16,621,336 17,180,333 --- See Notes ---
1 The fiscal year 2016 GAAP audit of the Local Income Tax Reserve account found that the account was overfunded by $47.4 million
Notes: Includes all general fund revenues, all Transportation revenues and selected special fund taxes. In conjunction with Appendix B of the Fiscal Year 2016Budget Book, this table will comprise the official estimate of total state revenues.
--- See Notes ---
--- See Notes ---
14
Table 4Maryland General Fund Revenues
Fiscal Years 2016 - 2018
FY 2017 FY 2018
FY 2016 September December September December$ Thousands Actual Estimate Estimate Difference Growth Estimate Estimate Difference Growth INCOME TAXES:
Individual 8,517,585 8,963,525 8,991,352 27,827 5.6% 9,370,438 9,389,593 19,155 4.4%Corporation 874,465 853,356 771,602 (81,755) -11.8% 898,200 830,074 (68,126) 7.6%
Total 9,392,050 9,816,881 9,762,953 (53,928) 3.9% 10,268,638 10,219,667 (48,971) 4.7%
SALES AND USE TAXES 4,444,481 4,574,750 4,592,595 17,845 3.3% 4,725,297 4,741,168 15,871 3.2%
STATE LOTTERY 529,754 512,662 492,309 (20,353) -7.1% 523,889 505,178 (18,711) 2.6%
OTHER REVENUESBusiness Franchise Taxes 221,967 226,404 223,513 (2,891) 0.7% 193,099 227,345 34,246 1.7%Tax on Insurance Companies 287,407 294,802 294,802 - 2.6% 304,618 304,618 - 3.3%
Estate and Inheritance Taxes 261,932 207,815 206,720 (1,095) -21.1% 184,766 184,512 (254) -10.7%Tobacco Tax 395,279 393,479 393,827 348 -0.4% 391,864 392,214 350 -0.4%Alcoholic Beverages Excise Tax 31,946 32,390 32,947 558 3.1% 32,839 33,365 526 1.3%Motor Vehicle Fuel Tax 4,625 - - - -100.0% - - - #DIV/0!
District Courts 72,334 71,885 70,255 (1,630) -2.9% 71,870 70,240 (1,630) 0.0%Clerks of the Court 34,203 36,947 36,947 - 8.0% 36,239 36,393 153 -1.5%
Hospital Patient Recoveries 57,499 58,348 57,781 (567) 0.5% 58,348 58,296 (52) 0.9%Interest on Investments 15,008 20,000 20,000 - 33.3% 35,000 35,000 - 75.0%Miscellaneous 334,145 326,020 326,485 465 -2.3% 332,353 326,311 (6,042) -0.1%
Total 1,716,344 1,668,088 1,663,276 (4,812) -3.1% 1,640,995 1,668,292 27,297 0.3%
Total Current Revenues 16,082,630 16,572,382 16,511,134 (61,248) 2.7% 17,158,819 17,134,305 (24,514) 3.8%
Extraordinary Revenues1 - - 47,432 47,432 #DIV/0! - - - Transfer Tax Revenues2
115,367 62,771 62,771 - 46,028 46,028 - -26.7%
GRAND TOTAL 16,197,996 16,635,153 16,621,336 (13,817) 2.6% 17,204,847 17,180,333 (24,514) 3.4%
1 The fiscal year 2016 GAAP audit of the Local Income Tax Reserve account found that the account was overfunded by $47.4 million2 The Tax Property Article §13-209 has been been altered across several legislative sessions so as to provide various distributions to the general fund
15

[This Page Intentionally Left Blank]
16
0%
2%
4%
6%
8%
10%
12%
-3%
-2%
-1%
0%
1%
2%
3%
4%
5%
6%
FY 1
985
FY 1
986
FY 1
987
FY 1
988
FY 1
989
FY 1
990
FY 1
991
FY 1
992
FY 1
993
FY 1
994
FY 1
995
FY 1
996
FY 1
997
FY 1
998
FY 1
999
FY 2
000
FY 2
001
FY 2
002
FY 2
003
FY 2
004
FY 2
005
FY 2
006
FY 2
007
FY 2
008
FY 2
009
FY 2
010
FY 2
011
FY 2
012
FY 2
013
FY 2
014
FY 2
015
FY 2
016
Maryland Employment and Wage Growth
Employment Growth (L)
Wages plus Residence Adj (R)
Source: U.S. Bureau of Labor Statistics; U.S. Bureau of Economic Analysis; Bureau of Revenue Estimates
Individual Income Tax General fund estimates for the personal income tax are expected to increase 5.6% for fiscal year
2017 and 4.4% for fiscal year 2018. Certain technicalities originating in the effects of the “Wynne” case on the local income tax distribution as well as a timing issue related to withholding exaggerate underlying fundamentals for fiscal year 2017. In the absence of those items, approximate underlying general fund growth for fiscal year 2016 would have been 2.7% and estimated growth for fiscal year 2017 would be 3.3% (detail below). Furthermore, it is worth noting that fiscal year 2016 income tax proved the primary source of variance of the general fund estimate at closeout; the last official estimate had called for general fund growth of 5.2% whereas actual growth was a disappointing 2.1%. Several aspects of the components of that variance are instructive for understanding the estimates for fiscal years 2017 and 2018.
Withholding growth finished the fiscal year at only 3.4%. However, it seems clear that a calendar timing issue resulted in a smaller withholding accrual for fiscal year 2016 and a correspondingly larger withholding amount for the month of July, the first month of fiscal year 2017. The year-end withholding accrual is based on the tax period submitted by employers with their remittances; the accrual for fiscal year 2016 was down 19.2%, or $85.7 million. Further research showed that remittances attributable to June 2016 from many of the larger employers contained one fewer pay period whereas July 2017 appears to have an additional pay period. The practical impact is a non-economic shifting of revenue from fiscal year 2016 into fiscal year 2017. If we assume 0.0% growth for the fiscal year 2016 accrual and therefore shift $85.7 million between years, withholding growth in fiscal year 2016 would have been 4.1% and estimated withholding growth in fiscal year 2017 would be 3.7%.
Even considering the above distortion, withholding growth remains weak relative to prior economic expansions and particularly to periods of comparable employment growth. Fiscal year 2016’s employment growth of 1.8% was the strongest period of this expansion (see insert). Growth in Maryland’s wages and residence adjustment reached a post-Great Recession peak of 4.1% (residence adjustment is critical to Maryland as we are a net exporter of workers,
17

-100%
-50%
0%
50%
100%
150%
1983 1985 1987 1989 1991 1993 1995 1997 1999 2001 2003 2005 2007 2009 2011 2013 2015
Growth in Net Payments With Returns By Tax Year
Recession
Net Final/RefSource: Bureau of Revenue Estimates
notably high skilled workers to D.C. and Virginia). Of note is the gap between employment growth and wage growth. In general the gap between the two should be tight; the gap in this expansion illustrates the weak wage growth that has accompanied this economic expansion in Maryland and throughout the nation. The causes are myriad: concentrated job growth in lower paying industries; continued slack in the labor market; low inflation that serves to reduce the employer incentive to raise wages in order to maintain existing living standards; and weak and at times contracting productivity growth. While the gap that existed for several years following the recession in the early 1990s is smaller in relation to the current, it is interesting to note that that expansion also included a reduction in federal government spending, the so called “peace dividend,” an event somewhat comparable to today’s federal budget sequestration and the disproportionately negative impact it has had on Maryland relative to other states.
While withholding proved an important component of the fiscal year 2016 variance, the impact from net payments with returns was paramount. Net payments with returns is the summation of refunds and payments received with filing extensions or actual tax return filings. The figure is always negative as wage-earning taxpayers are generally over-withheld and a 13.0% interest rate accompanies
underpayment. Year-over-year growth for this component on a baseline tax year basis was 45.3% for tax year 2015 (see inset). Also of note, for clarity purposes the amount for tax year 2001 is cut out; year-over-year growth in that year was 371.9%. As the net amount is negative, growth in this component subtracts from revenue for the State. An examination of the vertical axis scale shows just how significant
the growth rates for this component can be.
Net payments with returns is the most volatile and difficult to estimate component of the income tax. It is believed that a contraction in capital gains income for tax year 2015 drove the significant increase which would mark the first year in which capital gains decreased while the stock market increased since 1994. Until actual data detailing the sources of income becomes available, it would be imprudent to rule out weak or negative growth from income derived from pass through entities (PTE) as a source of the increase. Both sources of income, capital gains and PTE, are concentrated within a small number of tax returns and may be impacted by unprecedented pressures related to the nature of this expansion.
18
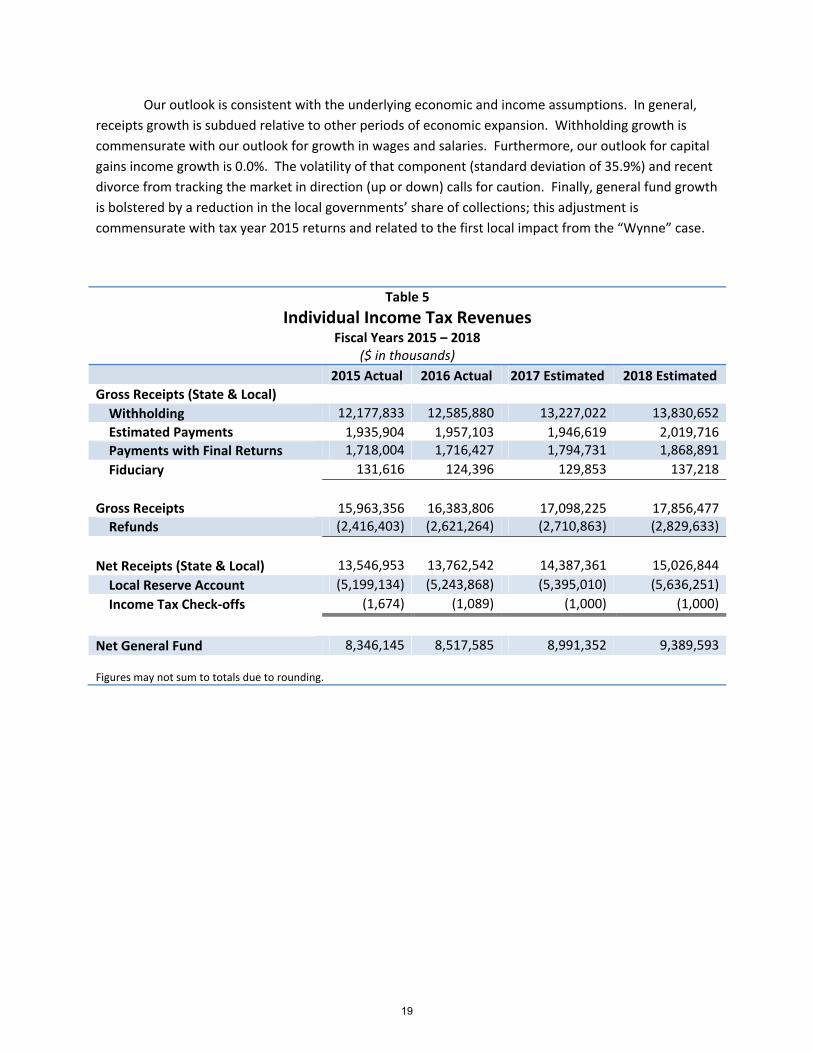
Our outlook is consistent with the underlying economic and income assumptions. In general, receipts growth is subdued relative to other periods of economic expansion. Withholding growth is commensurate with our outlook for growth in wages and salaries. Furthermore, our outlook for capital gains income growth is 0.0%. The volatility of that component (standard deviation of 35.9%) and recent divorce from tracking the market in direction (up or down) calls for caution. Finally, general fund growth is bolstered by a reduction in the local governments’ share of collections; this adjustment is commensurate with tax year 2015 returns and related to the first local impact from the “Wynne” case.
Table 5 Individual Income Tax Revenues
Fiscal Years 2015 – 2018 ($ in thousands)
2015 Actual 2016 Actual 2017 Estimated 2018 Estimated Gross Receipts (State & Local) Withholding 12,177,833 12,585,880 13,227,022 13,830,652 Estimated Payments 1,935,904 1,957,103 1,946,619 2,019,716 Payments with Final Returns 1,718,004 1,716,427 1,794,731 1,868,891 Fiduciary 131,616 124,396 129,853 137,218 Gross Receipts 15,963,356 16,383,806 17,098,225 17,856,477 Refunds (2,416,403) (2,621,264) (2,710,863) (2,829,633) Net Receipts (State & Local) 13,546,953 13,762,542 14,387,361 15,026,844 Local Reserve Account (5,199,134) (5,243,868) (5,395,010) (5,636,251) Income Tax Check-offs (1,674) (1,089) (1,000) (1,000) Net General Fund 8,346,145 8,517,585 8,991,352 9,389,593 Figures may not sum to totals due to rounding.
19
Corporate Income Tax General Fund corporate income tax revenues increased 12.5% to $874.5 million in fiscal year
2016. Gross receipts for fiscal year 2016 increased 11.0% while refunds increased 3.0%. Receipts were bolstered by an extraordinary court decision settled in favor of the State; however, underlying receipts growth remained strong. Nationally, corporate profits declined 6.7% in fiscal year 2016. Leading up to 2016, growth in corporate profits had fallen from historic highs earlier in the decade to relatively subdued levels compared to the previous two economic expansions. Growth in corporate profits is expected to be modest over the forecast horizon. National measures of corporate profits do not fully correlate with corporate income tax receipts in Maryland. This is partly due to timing issues related to the normal tax administration process, as well as differences in national income and tax accounting, and in the corporate tax base composition in Maryland compared to the nation as a whole.
Through November, net receipts are down 33.9%. Some of the decrease is due to the fact that fiscal year 2016 was an above average year for receipts growth. However, the bulk of the decrease is due to a substantial increase in refunds; through November, refunds are up 58.9%. There were some sizable refunds of a one-time nature, as well as refunds for film production credits that contributed to the large increase in refunds. Beyond those, it appears that corporate profits in 2015 were weaker than expected. As a result, many corporations likely overpaid for tax year 2015 (driving strong receipts growth in fiscal year 2016) and have since filed for refunds. For fiscal year 2017, net receipts are forecast to decrease 13.9%. General fund revenue is forecast to decrease 11.8%. The difference in the rates of decline is due to a statutory decrease in the share of net receipts that is distributed to the transportation trust fund, to the benefit of the general fund, for fiscal year 2017 and beyond. For fiscal year 2018, net receipts and general fund revenue are forecast to increase 7.6%.
20
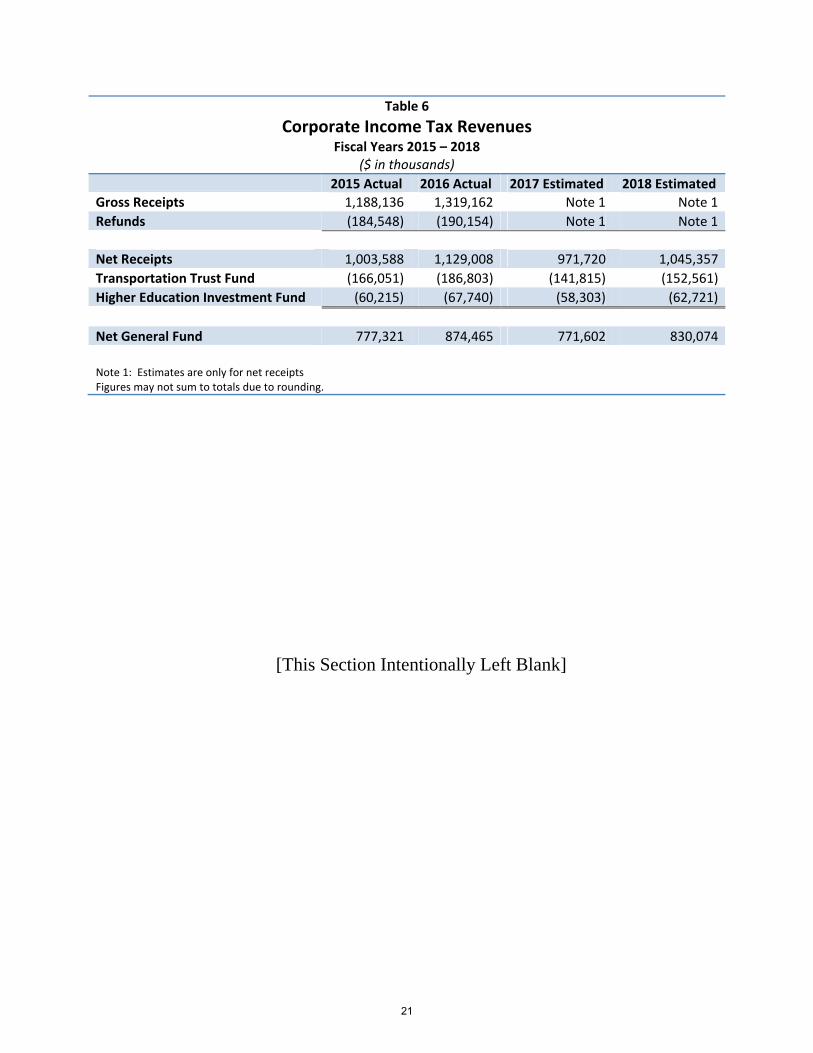
Table 6 Corporate Income Tax Revenues
Fiscal Years 2015 – 2018 ($ in thousands)
2015 Actual 2016 Actual 2017 Estimated 2018 Estimated Gross Receipts 1,188,136 1,319,162 Note 1 Note 1Refunds (184,548) (190,154) Note 1 Note 1 Net Receipts 1,003,588 1,129,008 971,720 1,045,357Transportation Trust Fund (166,051) (186,803) (141,815) (152,561)Higher Education Investment Fund (60,215) (67,740) (58,303) (62,721) Net General Fund 777,321 874,465 771,602 830,074 Note 1: Estimates are only for net receipts Figures may not sum to totals due to rounding.
[This Section Intentionally Left Blank]
21
Sales and Use Taxes The sales and use tax, the second largest source of revenues to the general fund, increased 2.5%
in fiscal year 2016 following 5.1% in fiscal year 2015. Growth in fiscal year 2015 was buoyed by Amazon’s establishment of nexus with the State. Growth for fiscal years 2017 and 2018 is expected to be 3.3% and 3.2%, respectively. The relatively small revision reflects the fact that year-to-date collections are slightly better than our September estimate.
The consumer segment, the largest component of the sales and use tax, grew by 4.0% in fiscal year 2016, compared to 5.9% in fiscal year 2015. Through October, the consumer segment is up 2.4% on a year-over-year basis. Growth of the consumer segment for fiscal years 2017 and 2018 is expected to be 2.3% and 3.2%, respectively. The forecast for this segment is unchanged from September.
The construction segment, the second largest component of the sales and use tax, continues to show strong growth, up 4.2% in fiscal year 2016. The construction industry has benefited from historically low mortgage interest rates and increasing housing demand. The share of first-time home buyers has been smaller relative to historical averages for myriad reasons, but has increased in 2016. Construction receipts are expected to finish fiscal year 2016 up 2.4%. Growth of the construction segment for fiscal years 2017 and 2018 is expected to be 3.7% and 3.9%, respectively.
Capital goods receipts cover a broad range of products, with some concentration in business inputs such as office furniture and technology equipment. As evidenced in the accompanying table, taxable capital investment has been volatile and lagging relative to prior economic expansions. Capital goods receipts growth for fiscal years 2017 and 2018 is expected to be 1.0% and 1.1%, respectively.
Utility receipts are composed of communications related sales and power sales to businesses. Communications equipment and voice services are taxable, data plans are not. Recently, the communications segment has been under pressure as pricing shifted towards data services and general voice services have become widely available through general merchandise and convenience stores. On the power side, low natural gas prices served to hold down prices charged to businesses. Despite these trends, growth has been positive as demand has continued to grow. As a whole, the utilities segment is up 8.1% through October, and is expected to grow 11.6% for the current fiscal year before slowing to 3.6% in fiscal year 2018.
It should be noted that the segments described above are becoming less descriptive each year. Goods that were sold at specialty stores are now sold at general retailers, leading the sale of some
22
goods to be attributable to different segments than in the past. An informative example is cell phones. In the past cell phones were largely sold through carriers and recognized as communications; but now cell phones are likely to be purchased at a general retailer and attributable to the consumer segment.
Table 7 Sales and Use Tax Revenues
Fiscal Years 2015 – 2018 ($ in thousands)
2015 Actual 2016 Actual 2017 Estimated 2018 Estimated Consumer 3,135,214 3,259,059 3,332,999 3,439,943Construction 592,863 619,063 641,938 666,741Capital Goods 297,261 287,600 292,996 296,084Utilities 390,093 359,886 401,782 416,411 Gross Collections 4,415,430 4,525,609 4,669,715 4,819,179 Assessments 10,508 11,718 12,011 12,311 Refunds (16,042) (33,085) (20,047) (20,548)Transportation Trust Fund (30,788) (30,780) (31,087) (31,398)Other (28,381) (28,980) (37,996) (38,376) Total General Fund 4,350,726 4,444,481 4,592,595 4,741,168 Figures may not sum to totals due to rounding.
23

[This Page Intentionally Left Blank]
24

Remaining Supporting Tables
Table 8A Traditional Lottery - Sales
Fiscal Years 2015 – 2018 ($ in thousands)
2015 Actual 2016 Actual 2017 Estimated 2018 Estimated Pick 3 240,911 241,570 241,690 241,785 Pick 4 276,958 280,783 282,162 285,476 Multimatch 34,511 31,095 25,655 25,424 Instant/5 Card Cash 552,588 617,200 636,332 655,770 Keno/Racetrax 457,656 478,648 479,100 485,138 Bonus Match 5 21,321 20,612 19,778 19,684 MegaMillions/Powerball 171,529 216,743 175,621 178,611 Instant Ticket Lottery Machines1 41,400 9,829 10,369 10,525 Cash4Life/Monopoly Millionaires 1,593 11,959 15,000 15,150 Gross Sales 1,798,465 1,908,438 1,885,707 1,917,562 Note 1: Sales accounting for Instant Ticket Lottery Machines was changed to “net after payout” basis beginning fiscal year 2016 Figures may not sum to totals due to rounding.
[This Section Intentionally Left Blank]
25

Table 8B Traditional Lottery - Revenues
Fiscal Years 2015 – 2018 ($ in thousands)
2015 Actual 2016 Actual 2017 Estimated 2018 Estimated Pick 3 101,080 96,202 99,565 98,293 Pick 4 119,508 135,225 111,765 118,955 Multimatch 12,323 11,089 9,108 9,027 Instant/5 Card Cash 93,985 102,020 104,540 107,748 Keno/Racetrax 120,452 122,979 122,712 124,609 Bonus Match 5 7,609 6,968 6,683 6,841 MegaMillions/Powerball 70,047 89,490 72,024 73,382 Instant Ticket Lottery Machines1 297 595 628 637 Cash4Life/Monopoly Millionaires 599 3,924 6,348 6,750 Gross Revenue 525,901 568,492 533,371 546,242 Less: Stadium Authority Revenue (20,000) (40,000) (40,000) (40,000) Less: Veteran’s Trust Fund Revenue (34) (60) (63) (64) Misc. Year End Adjustments 622 1,321 Less: MD Intl Race Fund (1,000) (1,000) Net General Fund 506,493 529,753 492,308 505,178 Figures may not sum to totals due to rounding.
Table 9 Business Franchise Tax Revenues
Fiscal Years 2015 – 2018 ($ in thousands)
2015 Actual 2016 Actual 2017 Estimated 2018 Estimated Public Service Company Franchise Tax 136,022 137,537 137,395 139,504 Filing Fees 89,676 84,430 86,119 87,841 Net General Fund 225,699 221,967 223,513 227,345
26
Table 10 Insurance Premium Tax Revenues
Fiscal Years 2015 – 2018 ($ in thousands)
2015 Actual
2016 Actual
2017 Estimated
2018 Estimated
Insurance Premium Tax 329,028 320,228 329,739 339,618 Less: MD Health Benefit Exchange Distributions (12,978) (32,821) (34,937) (35,000) Net General Fund 316,050 287,407 294,802 304,618
Table 11 Estate and Inheritance Tax Revenues
Fiscal Years 2015 – 2018 ($ in thousands)
2015 Actual 2016 Actual 2017 Estimated 2018 Estimated Collateral Inheritance Tax 48,689 54,912 51,617 52,237 Direct Inheritance Tax 66 89 85 150 Estate Tax 194,662 206,931 155,017 132,125 Net General Fund 243,418 261,932 206,720 184,512
[This Section Intentionally Left Blank]
27
Table 12 Hospital Patient Recoveries
Fiscal Years 2015 – 2018 ($ in thousands)
2015 Actual 2016 Actual 2017 Estimated 2018 Estimated Medicaid - 22,661 20,592 20,909 Medicare 9,312 8,168 9,490 9,732 Insurance and Sponsors 4,646 5,420 2,751 2,707 13,958 36,250 32,834 33,348 Disproportionate Share - 21,249 21,206 21,206 Medicaid Cost Settlements 3,741 3,741 Not Separated1 51,225 Net General Fund 65,182 57,499 57,781 58,296 Note 1: Medicaid and Disproportionate Share were not separated for accounting purposes in fiscal year 2015 Figure may not sum to totals due to rounding
Table 13 Excise Tax Revenues Fiscal Years 2015 – 2018
($ in thousands) 2015
Actual 2016
Actual 2017
Estimated 2018
Estimated Cigarette Tax 357,724 360,468 358,319 356,528 Other Tobacco Products Tax 33,739 34,812 35,508 35,686 Net General Fund Tobacco 391,463 395,279 393,827 392,214 Distilled Spirits Tax 15,931 16,538 17,398 17,659 Wine Tax 6,358 6,348 6,632 6,785 Beer Tax 8,667 8,741 8,592 8,592 Miscellaneous Licenses 351 404 413 419 Subtotal Alcoholic Beverages Taxes 31,306 32,032 33,035 33,455 Less: MD Wine and Grape Promotion Fund - (86) (88) (90) Net General Fund Alcoholic Beverages 31,306 31,946 32,947 33,365 Figures may not sum to totals due to rounding.
28

Table 14 General Fund Court Revenues
Fiscal Years 2015 – 2018 ($ in thousands)
2015 Actual 2016 Actual 2017 Estimated 2018 Estimated District Courts 77,702 72,334 70,255 70,240 Clerks of the Court 34,433 34,203 36,947 36,393
Table 15 General Fund Interest Earnings
Fiscal Years 2015 – 2018 ($ in thousands)
2015 Actual 2016 Actual 2017 Estimated 2018 Estimated Interest Earnings 10,709 15,008 20,000 35,000
Table 16 Miscellaneous Revenues
Fiscal Years 2015 – 2018 ($ in thousands)
2015 Actual
2016 Actual
2017 Estimated
2018 Estimated
Recording Organization & Capitalization Fees 13,370 14,117 14,516 14,878 Excess Fees of Office (1,165) 688 688 688 Unclaimed Property 98,883 91,199 86,000 86,000 Local Income Tax Reimbursement 13,891 15,257 14,724 15,018 Uninsured Motorist Penalty Fees 54,145 48,696 50,000 51,084 State Admissions & Amusement Tax 8,737 - - - Federal Retiree Drug Subsidy 15,696 16,385 13,200 13,200 Tobacco Conversion Program Bond Repayment 3,323 3,823 3,823 3,823 Miscellaneous Revenues and Transfers 1,263 4,276 1,000 1,000 Net General Fund 208,144 194,440 183,951 185,691
Figures may not sum to totals due to rounding.
29

Table 17 Miscellaneous Agency Revenues
Fiscal Years 2015 – 2018 ($ in thousands)
2015 Actual 2016 Actual 2017 Estimated 2018 Estimated PSC Fines, Citations and Filing Fees 180 425 341 346 Legislature 43 22 35 36 Workers’ Compensation 53 60 55 55 Public Defender 2,172 2,088 2,114 2,157 Attorney General 33,540 30,443 31,391 31,785 Executive & Administrative Control 11,757 14,525 7,822 8,000 Financial & Revenue Administration 22,658 20,973 15,320 15,612 Budget & Fiscal Administration 16,158 4,459 4,506 3,706 General Services - - - - Natural Resources 127 122 132 133 Agriculture 139 66 104 104 Health & Mental Hygiene 54,884 29,647 42,905 43,449 Human Resources 925 1,376 1,262 1,278 Labor, Licensing & Regulation 11,116 9,538 13,655 10,749 Public Safety & MD State Police 14,733 14,151 14,550 14,768 Public Education 14,771 7,979 5,423 5,477 Housing and Community Development (545) 1,277 364 370 Business & Economic Development 3,697 512 408 412 Environment 837 641 717 724 Juvenile Services 1 1 1 1 Alcoholic Beverage Licenses 1,341 1,400 1,428 1,457 Net General Fund 188,584 139,704 142,534 140,621 Figures may not sum to totals due to rounding.
30
Table 18 Transportation Revenues
Fiscal Years 2015 – 2018 ($ in thousands)
2015 Actual 2016 Actual
2017 Estimated
2018 Estimated
Department of Transportation Registrations 376,513 381,344 389,500 387,600 Licenses 52,675 53,604 54,400 56,200 Med-Evac Surcharge 69,683 71,479 73,008 72,652 Trauma Physician Services Surcharge 11,999 12,316 12,579 12,518 Miscellaneous Motor Vehicle Fees 187,209 193,238 195,890 196,517 Vehicle Emission Inspection Fees 33,849 31,617 33,205 33,699 Security Interest Filing Fees – Special Funds 11,770 12,473 12,700 12,800 Hauling Fees 10,020 10,628 10,600 10,700 Special License Tags – Special Funds 5,117 5,017 5,100 5,200 Titling Tax 795,510 860,416 882,000 895,000 Sales Tax on – Rental Vehicles 30,788 30,780 31,087 31,398 Special Distribution Tax 1,585,133 1,662,912 1,700,069 1,714,284 Motor Fuel Vehicle Tax 745,100 717,836 722,700 729,100 Road Tax 6,322 6,431 6,500 6,500 Decals & Permits 109 101 - - Sales Tax Equivalent 146,312 257,066 273,099 269,292 Indexing 25,749 36,435 37,241 50,101 923,592 1,017,869 1,039,540 1,054,993 Total 2,508,725 2,680,781 2,739,609 2,769,277 Figures may not sum to totals due to rounding.
[This Section Intentionally Left Blank]
31
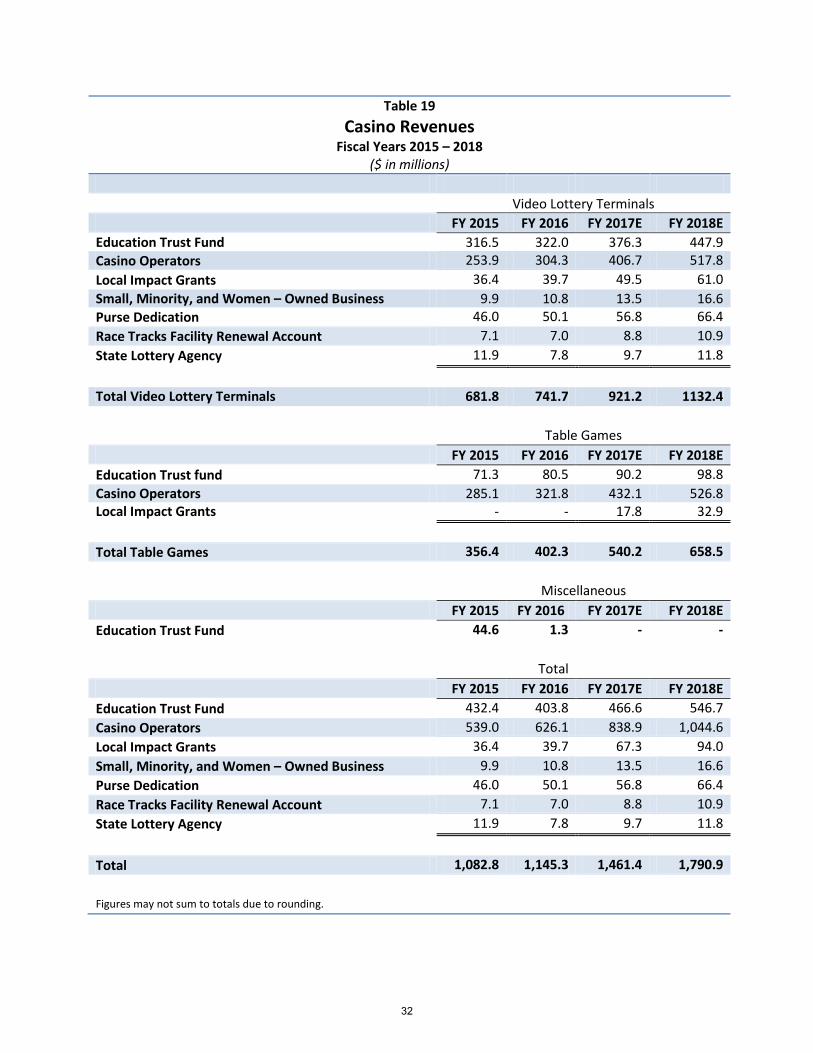
Table 19 Casino Revenues
Fiscal Years 2015 – 2018 ($ in millions)
Video Lottery Terminals FY 2015 FY 2016 FY 2017E FY 2018E Education Trust Fund 316.5 322.0 376.3 447.9 Casino Operators 253.9 304.3 406.7 517.8 Local Impact Grants 36.4 39.7 49.5 61.0 Small, Minority, and Women – Owned Business 9.9 10.8 13.5 16.6 Purse Dedication 46.0 50.1 56.8 66.4 Race Tracks Facility Renewal Account 7.1 7.0 8.8 10.9 State Lottery Agency 11.9 7.8 9.7 11.8 Total Video Lottery Terminals 681.8 741.7 921.2 1132.4 Table Games FY 2015 FY 2016 FY 2017E FY 2018E Education Trust fund 71.3 80.5 90.2 98.8 Casino Operators 285.1 321.8 432.1 526.8 Local Impact Grants - - 17.8 32.9 Total Table Games 356.4 402.3 540.2 658.5 Miscellaneous FY 2015 FY 2016 FY 2017E FY 2018E Education Trust Fund 44.6 1.3 - - Total FY 2015 FY 2016 FY 2017E FY 2018E Education Trust Fund 432.4 403.8 466.6 546.7 Casino Operators 539.0 626.1 838.9 1,044.6 Local Impact Grants 36.4 39.7 67.3 94.0 Small, Minority, and Women – Owned Business 9.9 10.8 13.5 16.6 Purse Dedication 46.0 50.1 56.8 66.4 Race Tracks Facility Renewal Account 7.1 7.0 8.8 10.9 State Lottery Agency 11.9 7.8 9.7 11.8 Total 1,082.8 1,145.3 1,461.4 1,790.9 Figures may not sum to totals due to rounding.
32

Five Year Forecast
These estimates are based on current economic outlook for the U.S. and Maryland economies. The broader economic situation and outlook remains positive yet subdued. Economic growth since the most recent recession has been lower than in the economic expansions of the 1990s and 2000s, and is forecast to remain so. The labor market is increasingly close to reaching full employment. This is expected to lead to more bargaining power for labor, and upward pressure on wages, the largest segment of personal income. The longer run forecast is shaped by demographic trends, particularly the aging of the population. As a result, a lesser proportion of the population will be working age, defined here as 25 to 64 years old. All else equal, this means employment growth, and therefore output growth, will slow. Additionally, a large generation of new workers has just recently entered the labor force. Such workers are typically less productive than more experienced workers; but productivity should increase as they gain experience.
Risks to the forecast include federal policy and spending uncertainty, monetary policy, as well as geopolitical risk. Federal spending caps, often referred to as the federal sequestration, have been raised since their imposition in 2013, but still constrain spending. At the time of this forecast, the Federal Reserve is anticipated to increase its benchmark interest rate; however, the timing of future rate increases and their effect on the economy is less certain. The price of oil has been relatively low since the end of 2014, but OPEC, a cartel of oil producing nations, has recently agreed to a production cut that may lead to higher prices. Given increased domestic production, the United States economy is less vulnerable to oil price movements, as higher prices incentivize domestic producers to increase their output.
33
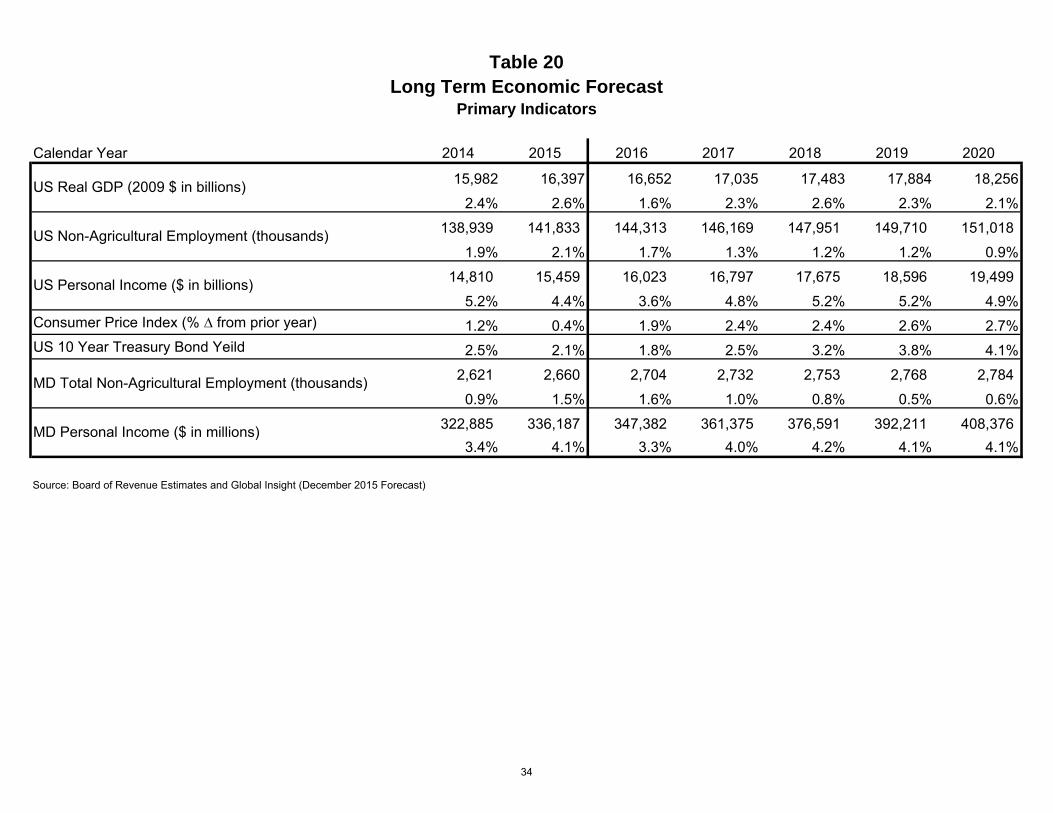
Table 20Long Term Economic Forecast
Primary Indicators
Calendar Year 2014 2015 2016 2017 2018 2019 2020
15,982 16,397 16,652 17,035 17,483 17,884 18,256
2.4% 2.6% 1.6% 2.3% 2.6% 2.3% 2.1%
138,939 141,833 144,313 146,169 147,951 149,710 151,018
1.9% 2.1% 1.7% 1.3% 1.2% 1.2% 0.9%
14,810 15,459 16,023 16,797 17,675 18,596 19,499
5.2% 4.4% 3.6% 4.8% 5.2% 5.2% 4.9%Consumer Price Index (% ∆ from prior year) 1.2% 0.4% 1.9% 2.4% 2.4% 2.6% 2.7%US 10 Year Treasury Bond Yeild 2.5% 2.1% 1.8% 2.5% 3.2% 3.8% 4.1%
2,621 2,660 2,704 2,732 2,753 2,768 2,784
0.9% 1.5% 1.6% 1.0% 0.8% 0.5% 0.6%
322,885 336,187 347,382 361,375 376,591 392,211 408,376 3.4% 4.1% 3.3% 4.0% 4.2% 4.1% 4.1%
Source: Board of Revenue Estimates and Global Insight (December 2015 Forecast)
US Real GDP (2009 $ in billions)
US Non-Agricultural Employment (thousands)
US Personal Income ($ in billions)
MD Total Non-Agricultural Employment (thousands)
MD Personal Income ($ in millions)
34
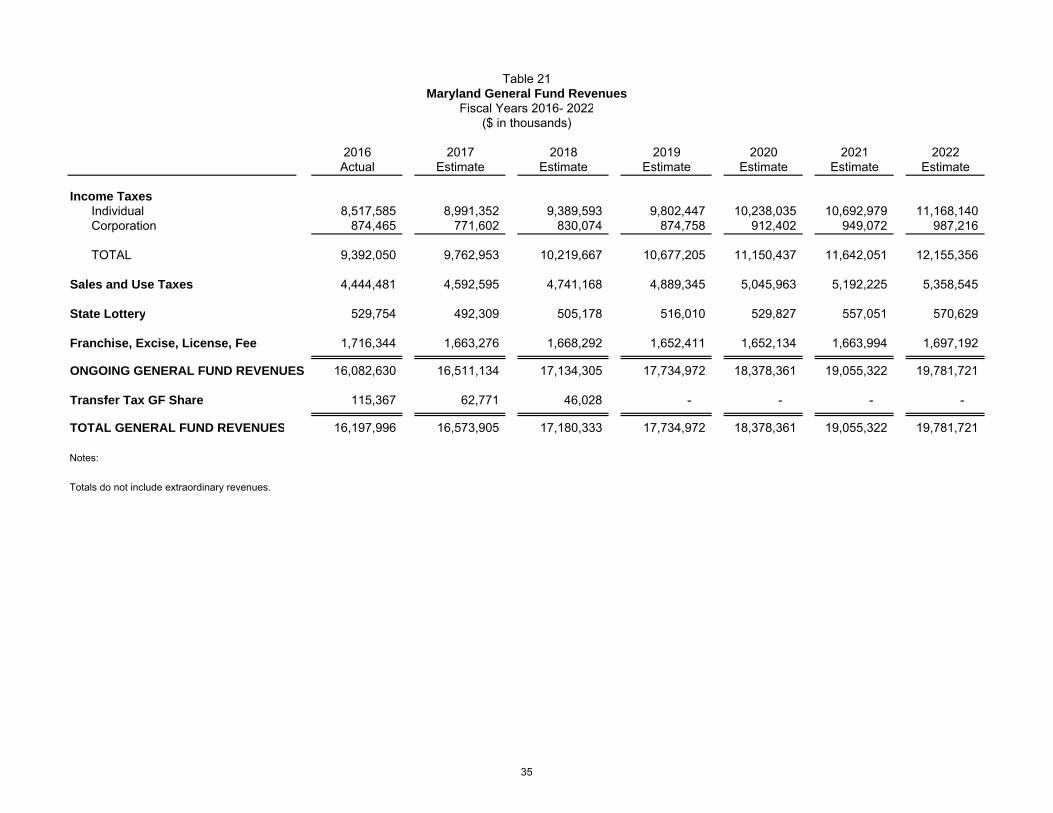
2016 2017 2018 2019 2020 2021 2022Actual Estimate Estimate Estimate Estimate Estimate Estimate
Income TaxesIndividual 8,517,585 8,991,352 9,389,593 9,802,447 10,238,035 10,692,979 11,168,140Corporation 874,465 771,602 830,074 874,758 912,402 949,072 987,216
TOTAL 9,392,050 9,762,953 10,219,667 10,677,205 11,150,437 11,642,051 12,155,356
Sales and Use Taxes 4,444,481 4,592,595 4,741,168 4,889,345 5,045,963 5,192,225 5,358,545
State Lottery 529,754 492,309 505,178 516,010 529,827 557,051 570,629
Franchise, Excise, License, Fee 1,716,344 1,663,276 1,668,292 1,652,411 1,652,134 1,663,994 1,697,192
ONGOING GENERAL FUND REVENUES 16,082,630 16,511,134 17,134,305 17,734,972 18,378,361 19,055,322 19,781,721
Transfer Tax GF Share 115,367 62,771 46,028 - - - -
TOTAL GENERAL FUND REVENUES 16,197,996 16,573,905 17,180,333 17,734,972 18,378,361 19,055,322 19,781,721
Notes:
Totals do not include extraordinary revenues.
Table 21Maryland General Fund Revenues
Fiscal Years 2016- 2022($ in thousands)
35
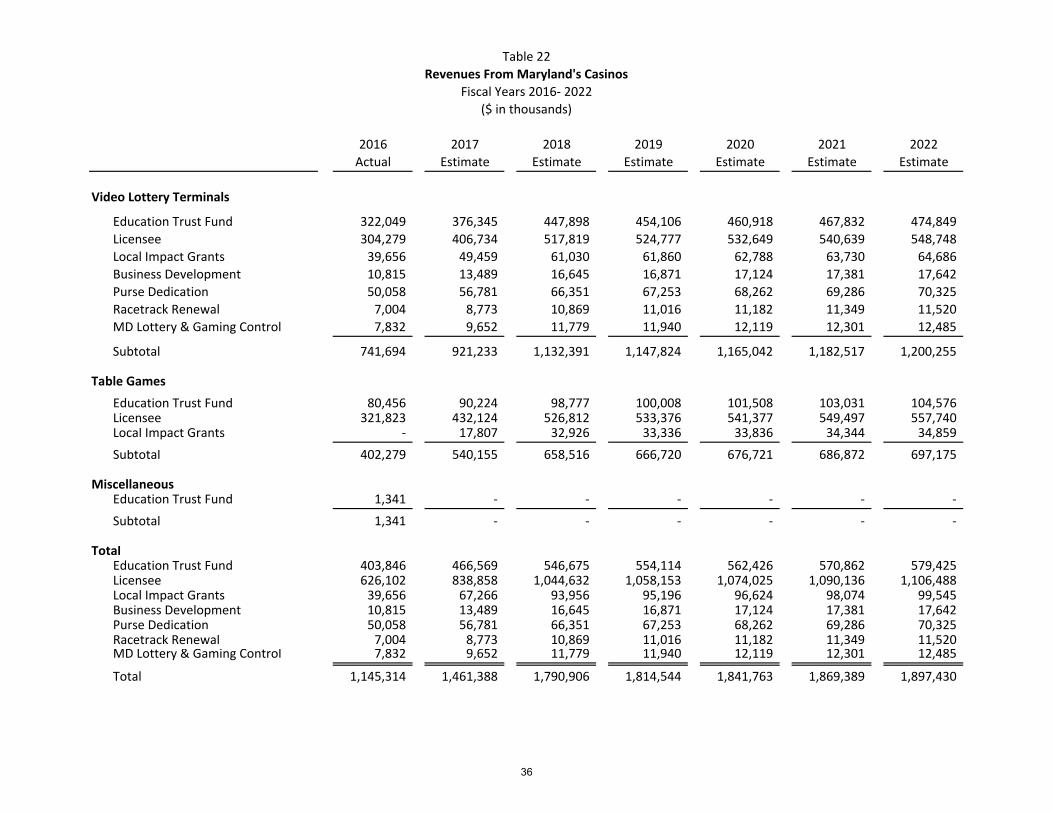
2016 2017 2018 2019 2020 2021 2022Actual Estimate Estimate Estimate Estimate Estimate Estimate
Video Lottery Terminals
Education Trust Fund 322,049 376,345 447,898 454,106 460,918 467,832 474,849 Licensee 304,279 406,734 517,819 524,777 532,649 540,639 548,748 Local Impact Grants 39,656 49,459 61,030 61,860 62,788 63,730 64,686 Business Development 10,815 13,489 16,645 16,871 17,124 17,381 17,642 Purse Dedication 50,058 56,781 66,351 67,253 68,262 69,286 70,325 Racetrack Renewal 7,004 8,773 10,869 11,016 11,182 11,349 11,520 MD Lottery & Gaming Control 7,832 9,652 11,779 11,940 12,119 12,301 12,485
Subtotal 741,694 921,233 1,132,391 1,147,824 1,165,042 1,182,517 1,200,255
Table GamesEducation Trust Fund 80,456 90,224 98,777 100,008 101,508 103,031 104,576 Licensee 321,823 432,124 526,812 533,376 541,377 549,497 557,740 Local Impact Grants - 17,807 32,926 33,336 33,836 34,344 34,859 Subtotal 402,279 540,155 658,516 666,720 676,721 686,872 697,175
MiscellaneousEducation Trust Fund 1,341 - - - - - - Subtotal 1,341 - - - - - -
TotalEducation Trust Fund 403,846 466,569 546,675 554,114 562,426 570,862 579,425 Licensee 626,102 838,858 1,044,632 1,058,153 1,074,025 1,090,136 1,106,488 Local Impact Grants 39,656 67,266 93,956 95,196 96,624 98,074 99,545 Business Development 10,815 13,489 16,645 16,871 17,124 17,381 17,642 Purse Dedication 50,058 56,781 66,351 67,253 68,262 69,286 70,325 Racetrack Renewal 7,004 8,773 10,869 11,016 11,182 11,349 11,520 MD Lottery & Gaming Control 7,832 9,652 11,779 11,940 12,119 12,301 12,485
Total 1,145,314 1,461,388 1,790,906 1,814,544 1,841,763 1,869,389 1,897,430
Table 22Revenues From Maryland's Casinos
Fiscal Years 2016- 2022($ in thousands)
36