Embed Size (px)
Citation preview
UNIT II DEMAND & SUPPLY ANALYSIS
Demand - Types of demand - Determinants of demand - Demand function - Demandelasticity - Demand forecasting - Supply - Determinants of supply - Supply function -Supply elasticity.
Introduction to MarketWhen most people think of a market, they think of a physical place, like their
neighborhood supermarket, complete with shoppers and shelves stocked with a wide range of goods. In economics, however, a market need not be a physical location. Where you have buyers and sellers of a particular product or service, you have a market.
A market is any place where the sellers of a particular good or service can meet with the buyers of that goods and service where there is a potential for a transaction to take place. The buyers must have something they can offer in exchange for there to be a potential transaction.
In economics, a market is a group of buyers and sellers of a specific good or service. A market usually does not refer to a physical location for the buying and selling of products. "Harper Collins Dictionary of Economics" points out that economists use the word "market" to describe a mechanism of exchange between buyers and sellers of a good or service.
In a market, sellers offer their goods and services, for which they set a price, often with an eye towards offering lower prices or better products and services than their competitors. Buyers, meanwhile, vote with their dollars, purchasing the products they want from the sellers that offer the best product in terms of price and quality. If a seller raises prices without offering a significantly better product or service, consumers are free to take their business to a competing firm.
DEMANDIn Economics, use of the word ‘demand’ is made to show the relationship between the
prices of a commodity and the amounts of the commodity which consumers want to purchase at those price.Definition of Demand: “Demand is defines as the want, need or desire which is backed by willingness and ability to buy a particular commodity in a given period of time.”Bober defines, “By demand we mean the various quantities of given commodity or service which consumers would buy in one market in a given period of time at various prices, or at various incomes, or at various prices of related goods.”Demand for product implies:a) desires to acquire it,b) willingness to pay for it, andc) Ability to pay for it.
All three must be checked to identify and establish demand. For example : A poor man’s desires to stay in a five-star hotel room and his willingness to pay rent for that room is not ‘demand’, because he lacks the necessary purchasing power; so it is merely his wishful thinking. Similarly, a miser’s desire for and his ability to pay for a car is not ‘demand’, because he does not have the necessary willingness to pay for a car. One may also come across a well-established person who processes both the willingness and the ability to pay for higher education. But he has really no desire to have it; he pays the fees for a regular cause, and eventually does not attend his
classes. Thus, in an economics sense, he does not have a ‘demand’ for higher education degree/diploma.
It should also be noted that the demand for a product–-a commodity or a service–has no meaning unless it is stated with specific reference to the time, its price, price of is related goods, consumers’ income and tastes etc. This is because demand, as is used in Economics, varies with fluctuations in these factors.
To say that demand for an Atlas cycle in India is 60,000 is not meaningful unless it is stated in terms of the year, say 1983 when an Atlas cycle’s price was around Rs. 800, competing cycle’s prices were around the same, a scooter’s prices was around Rs. 5,000. In 1984, the demand for an Atlas cycle could be different if any of the above factors happened to be different. For example, instead of domestic (Indian), market, one may be interested in foreign (abroad) market as well. Naturally the demand estimate will be different. Furthermore, it should be noted that a commodity is defined with reference to its particular quality/brand; if its quality/brand changes, it can be deemed as another commodity.
To sum up, we can say that the demand for a product is the desire for that product backed by willingness as well as ability to pay for it. It is always defined with reference to a particular time, place, price and given values of other variables on which it depends.Characteristics of Demand: There are thus three main characteristics of demand in economics. (i) Willingness and ability to pay. Demand is the amount of a commodity for which a consumer has the willingness and also the ability to buy. (ii) Demand is always at a price. If we talk of demand without reference to price, it will be meaningless. The consumer must know both the price and the commodity. He will then be able to tell the quantity demanded by him. (iii) Demand is always per unit of time. The time may be a day, a week, a month, or a year.Determinants of Demand:
In general, following factors determine market demand for a product or service:1. Price of the product2. Price of the related goods-substitutes, complements and supplements3. Level of consumers income4. Consumers taste and preference5. Advertisement of the product6. Consumers’ expectations about future price and supply position7. Demonstration effect or ‘band-wagon effect’8. Consumer-credit facility9. Population of the country10. Distribution pattern of national income.
1. Price of the ProductThe price of a product is one of the most important determinants of demand in the long
run and the only determinant in the short run. The price and quantity demanded are inversely related to each other. The law of demand states that the quantity demanded of a good or a product, which its consumers would like to buy per unit of time, increases when its price falls, and decreases when its price increases, provided the other factors remain’ same. The assumption
‘other factors remaining same’ implies that income of the consumers, prices of the substitutes and complementary goods, consumer’s taste and preference and number of consumers remain unchanged. The price-demand relationship assumes a much greater significance in the oligopolistic market in which outcome of price war between a firm and its rivals determines the level of success of the firm. The firms have to be fully aware of price elasticity of demand for their own products and that of rival firm’s goods.2. Price of the Related Goods or Products
The demand for a good is also affected by the change in the price of its related goods. The related goods may be the substitutes or complementary goods.
Substitutes: Two goods are said to. be substitutes of each other if a change in price of one good affects the demand for the other in the same direction. For instance goods X and Y are considered as substitutes for each other if a rise in the price of X increase demand for Y, and vice versa. Tea and coffee, hamburgers and hot-dog, alcohol and drugs are some examples of substitutes in case of consumer goods by definition, the relation between demand for a product and price of its substitute is of positive nature. When, price of the substitute of a product (tea) falls (or increase), the demand for the product falls (or increases).
Complementary Goods: A good is said to be a complement for another when it complements the use of the other or when the two goods are used together in such a way that their demand changes (increases or decreases) simultaneously. For example, petrol is a complement to car and scooter, butter and jam to bread, milk and sugar to tea and coffee, mattress to cot, etc. Two goods are termed as complementary to each other. If an increase in the price of one causes a decrease in demand for the other. By definition, there is an inverse relation between the demand for a good and the price of its complement. For instance, an increase in the price of petrol causes a decrease in the demand for car and other petrol-run vehicles and vice versa while other thing’s remaining constant.3. Consumers Income
Income is the basic determinant of market demand since it determines the purchasing power of a consumer. Therefore, people with higher current disposable income spend a larger amount on goods and services than those with lower income. Income-demand relationship is of more varied nature than that between demand and its other determinants. While other determinants of demand, e.g., product’s own price and the price of its substitutes, are more significant in the short-run, income as a determinant of demand is equally important in both short run and long run. Before proceeding further to discuss income-demand relationships, it will be useful to note that consumer goods of different nature have different kinds of relationship with consumers having different levels of income. Hence, the managers need to be fully aware of the kinds of goods they are dealing with and their relationship with the income of consumers, particularly about the assessment of both existing and prospective demand for a product.4. Consumer’s Taste and PreferenceConsumer’s taste and preference play an important role in determining demand for a product. Taste and preference depend, generally, on the changing life-style, social customs, religious values attached to a good habit of the people. Change in these factors changes consumer’s taste and preferences. As a result, consumers reduce or give up the consumption of some goods and add new ones to their consumption pattern. For example, following the change in fashion, people switch their consumption pattern from cheaper, old-fashioned goods to costlier ‘mod’ goods, as long as price differentials are proportionate with their preferences. Consumers are prepared to
pay higher prices for ‘mod goods’ even if their virtual utility is the same as that of old-fashioned goods. The manufacturers of goods and services that are subject to frequent change in fashion and style, can take advantage of this situation in two ways:
1. They can make quick profits by designing new models of their goods and popularizing them through advertisement, and
2. They can plan production in a better way and can even avoid over-production if they keep an eye on the changing fashions5. Advertisement ExpenditureAdvertisement costs are incurred with the objective of increasing the demand for the goods. This is done in the following ways: By informing the potential consumers about the availability of the goods. By showing its superiority to the rival goods. By influencing consumers choice against the rival goods, and By setting fashions and changing tastes.
The impact of such effects shifts the demand curve upward to the right. In other words, when other factors’ remain same, the expenditure on advertisement increases the volume of sales to the same extent.The relationship between demand and advertisement cost is based on the following assumptions:
Consumers are fairly sensitive and responsive to various modes of advertisement. The rival firms do not react to the advertisements made by a firm. The level of demand has not already reached the saturation point. Advertisement beyond this
point will make only marginal impact on demand. Per unit cost of advertisement added to the price does not make the price prohibitive for
consumers, as compared particularly to the price of substitutes. Others determinants of demand, e.g., income and tastes, etc., are not operating in the reverse
direction.In the absence of these conditions, the advertisement effect on sales may be unpredictable.6. Consumers’ ExpectationsConsumers’ expectations regarding the future prices, income and supply position of goods play an important role in determining the demand for goods and services in the short run. If consumers expect a rise in the price of a storable good, they would buy more of it at its current price with a view to avoiding the possibility of price rise future. On the contrary, if consumers expect a fall in the price of certain goods, they postpone their purchase with a view to take advantage of lower prices in future, mainly in case of non-essential goods. This behavior of consumers reduces the current demand for the goods whose prices are expected to decrease in future. Similarly, an expected increase in income increases the demand for a product. For example, announcement of dearness allowance, bonus and revision of pay scale induces increase in current purchases. Besides, if scarcity of certain goods is expected by the consumers on account of reported fall in future production, strikes on a large scale and diversion of civil supplies towards the military use causes the current demand for such goods to increase more if their prices show an upward trend. Consumer demand more for future consumption and profiteers demand more to make money out of expected scarcity.
7. Demonstration EffectWhen new goods or new models of existing ones appear in the market, rich people buy them first. For instance, when a new model of car appears in the market, rich people would mostly be the first buyer, LED TV sets and Blu-Ray Drives were first seen in the houses of the rich families some people buy new goods or new models of goods because they have genuine need for them. Some others do so because they want to exhibit their affluence. But once new goods come in fashion, many households buy them not because they have a genuine need for them but because their neighbors have bought the same goods. The purchase made by the latter category of the buyers are made out of such feelings as jealousy, competition, equality in the peer group, social inferiority and the desire to raise their social status. Purchases made on account of these factors are the result of what economists call ‘demonstration effect’ or the ‘Band-wagon-effect’. These effects have a positive effect on demand. On the contrary, when goods become the thing of common use, some people, mostly rich, decrease or give up the consumption of such goods. This is known as ‘Snob Effect’. It has a negative effect’on the demand for the related goods.8. Consumer-Credit FacilityAvailability of credit to the consumers from the sellers, banks, relations and friends encourages the consumers to buy more than what they would buy in the absence of credit availability. Therefore, the consumers who can borrow more can consume more than those who cannot borrow. Credit facility affects mostly the demand for durable goods, particularly those, which require bulk payment at the time of purchase.9. Population of the CountryThe total domestic demand for a good of mass consumption depends also on the size of the population. Therefore, larger the population larger will be the demand for a product, when price, per-capita income, taste and preference are given. With an increase or decrease in the size of population, employment percentage remaining the same, demand for the product will either increase or decrease.10. Distribution of National IncomeThe level of national income is the basic determinant of the market demand for a good. Apart from this, the distribution pattern of the national income is also an important determinant for demand of a good. If national income is evenly distributed, market demand for normal goods will be the largest. If national income is unevenly distributed, i.e., if majority of population belongs to the lower income groups, market demand for essential goods, including inferior ones, will be the largest whereas the demand for other kinds of goods will be relatively less.
TYPES OF GOODSFor the purpose of income-demand analysis, goods and services maybe grouped under four broad categories, which ate: (a) essential consumer goods, (b) inferior goods, (c) normal goods, and (d) prestige or luxury goods. To understand all these terms, it is essential to understand the relationship between income and different kinds of goods.
1. Essential Consumer Goods (ECG): The goods and services of this category are called ‘basic needs’ and are consumed by all persons of a society such as food-grains, salt, vegetable oils, matches, cooking fuel, a minimum clothing and housing. Quantity demanded for these goods increases with increase in consumer’s income but only up to certain limit, even though the total expenditure may increase in accordance with the quality of goods consumed, other factors
remaining the same. Consumer’s demand for essential goods increases only until a particular income level. It tends to saturate beyond this level of income.
2. Inferior goods: Inferior goods are those goods whose demand decreases with the increase in consumer’s income. For example millet is inferior to wheat and rice; coarse, textiles are inferior to refined ones, kerosene is inferior to cooking gas and travelling by bus is inferior to travelling by taxi. The relation between income and demand for an inferior good is under the assumption that other determinants of demand remain the same demand for such goods rises only up to a certain level of income, and declines as income increases beyond this level.
3. Normal goods: Normal goods are those goods whose demand increases with increase in the consumer income. For example, clothing’s household furniture and automobiles. Demand for such goods increases with the increases in consumer income but at different rates at different levels of income. Demand for normal goods increases rapidly with the increase in the consumer’s income but slows down with further increase in income. Up to certain level of income the relation between income and demand for all type of goods is similar. The difference is of only degree.Therefore, it is important to view the income-demand relations in the light of the nature of product and the level of consumer’s income.
4. Giffen goods
In some poor countries, the people often live on a basic diet of rice which is very cheap plus a few more expensive vegetables or some much more expensive meat or fish. In such societies, if the price of rice rises then the people may well decide to buy more in order to substitute it for the more expensive vegetables and meat. There has been an increase in demand in response to an increase in price. Sir Robert Giffen fist noticed this phenomenon. In the 19th century, he saw that the demand for potatoes increased in response to the rises in the price of potatoes caused by the great potato famines in Ireland. Hence products of this kind are known as Giffen goods. Examples of Giffen goods are difficult to find in richer countries.
5. Veblen goods
Products such as perfumes, expensive cars, jewellery, works of art and designer clothes may be regarded as Veblen goods. With these products, a rise in price is often interpreted by the consumer as an increase in quality or ostentation and so they may decide to buy more, thinking that they are buying a superior product. There may be psychological factors at work. The economist Veblen carried out research into this and concluded that the price of a product conveyed more than just value information for the consumer; it also represented status and exclusivity. These products which appear to experience rising demand with rising price are known as Veblen goods.
TYPES OF DEMANDThe different types of demand are1) Direct and Derived Demands Direct demand refers to demand for goods meant for final consumption; it is the demand for consumers’ goods like food items, readymade garments and houses. By contrast, derived demand refers to demand for goods which are needed for further production; it is the demand for producers’ goods like industrial raw materials, machine tools and equipment.
Thus the demand for an input or what is called a factor of production is a derived demand; its demand depends on the demand for output where the input enters. In fact, the quantity of demand for the final output as well as the degree of substitutability/complementary between inputs would determine the derived demand for a given input.For example, the demand for gas in a fertilizer plant depends on the amount of fertilizer to be produced and substitutability between gas and coal as the basis for fertilizer production. However, the direct demand for a product is not contingent upon the demand for other products.
2) Complementary and competing Demand:
Commodities are substitutes if one can be used in place of the other. Substitute goods serve the same purpose and therefore compete for the consumers’ income. They are said to have competitive demand because of the fact that they compete for the consumers’ income. Examples of substitute goods are Milo and bournvita, butter and margarine and others. A change in the price of one affects the demand for the other. If for instance there is an increase in the price of butter, demand for margarine will increase which will ultimately increase the price of margarine, provided the supply of margarine does not change. On the other hand a decrease in the price of butter will lead to a decrease in the demand for margarine, and hence a fall in its price, given the supply.
Joint or Complementary Demand
Two or more goods are said to be jointly demanded when they must be consumed together to provide a given level of satisfaction. Some examples are cars and fuel, compact disc players and CD. There are perfect complementary goods and imperfect For perfect complementary goods, the consumer practically cannot do without the other. An example is cars and fuel. For complementary demand, a change in the price of one good affects the demand for the other. If there should be an increase in the price of compact disc players, there will be a decrease in the demand for discs, other things being equal.
3) Domestic and Industrial Demands The example of the refrigerator can be restated to distinguish between the demand for domestic consumption and the demand for industrial use. In case of certain industrial raw materials which are also used for domestic purpose, this distinction is very meaningful.For example, coal has both domestic and industrial demand, and the distinction is important from the standpoint of pricing and distribution of coal.4) Autonomous and Induced Demand When the demand for a product is tied to the purchase of some parent product, its demand is called induced or derived.For example, the demand for cement is induced by (derived from) the demand for housing. As stated above, the demand for all producers’ goods is derived or induced. In addition, even in the realm of consumers’ goods, we may think of induced demand. Consider the complementary items like tea and sugar, bread and butter etc. The demand for butter (sugar) may be induced by the purchase of bread (tea). Autonomous demand, on the other hand, is not derived or induced. Unless a product is totally independent of the use of other products, it is difficult to talk about autonomous demand. In the present world of dependence, there is hardly any autonomous
demand. Nobody today consumers just a single commodity; everybody consumes a bundle of commodities. Even then, all direct demand may be loosely called autonomous.5) Perishable and Durable Goods’ Demands Both consumers’ goods and producers’ goods are further classified into perishable/non-durable/single-use goods and durable/non-perishable/repeated-use goods. The former refers to final output like bread or raw material like cement which can be used only once. The latter refers to items like shirt, car or a machine which can be used repeatedly. In other words, we can classify goods into several categories: single-use consumer goods, single-use producer goods, durable-use consumer goods and durable-use producer’s goods. This distinction is useful because durable products present more complicated problems of demand analysis than perishable products. Non-durable items are meant for meeting immediate (current) demand, but durable items are designed to meet current as well as future demand as they are used over a period of time. So, when durable items are purchased, they are considered to be an addition to stock of assets or wealth. Because of continuous use, such assets like furniture or washing machine, suffer depreciation and thus call for replacement. Thus durable goods demand has two varieties – replacement of old products and expansion of total stock. Such demands fluctuate with business conditions, speculation and price expectations. Real wealth effect influences demand for consumer durables.6) New and Replacement Demands This distinction follows readily from the previous one. If the purchase or acquisition of an item is meant as an addition to stock, it is a new demand. If the purchase of an item is meant for maintaining the old stock of capital/asset, it is replacement demand. Such replacement expenditure is to overcome depreciation in the existing stock.Producers’ goods like machines. The demand for spare parts of a machine is replacement demand, but the demand for the latest model of a particular machine (say, the latest generation computer) is anew demand. In course of preventive maintenance and breakdown maintenance, the engineer and his crew often express their replacement demand, but when a new process or a new technique or anew product is to be introduced, there is always a new demand.You may now argue that replacement demand is induced by the quantity and quality of the existing stock, whereas the new demand is of an autonomous type. However, such a distinction is more of degree than of kind. For example, when demonstration effect operates, a new demand may also be an induced demand. You may buy a new VCR, because your neighbor has recently bought one. Yours is a new purchase, yet it is induced by your neighbor’s demonstration.7) Final and Intermediate Demands This distinction is again based on the type of goods- final or intermediate. The demand for semi-finished products, industrial raw materials and similar intermediate goods are all derived demands, i.e., induced by the demand for final goods. In the context of input-output models, such distinction is often employed.8) Individual and Market Demands This distinction is often employed by the economist to study the size of the buyers’ demand, individual as well as collective. A market is visited by different consumers, consumer differences depending on factors like income, age, sex etc. They all react differently to the prevailing market price of a commodity. For example, when the price is very high, a low-income buyer may not buy anything, though a high income buyer may buy something. In such a case, we may distinguish between the demand of an individual buyer and that of the market which is the
market which is the aggregate of individuals. You may note that both individual and market demand schedules (and hence curves, when plotted) obey the law of demand. But the purchasing capacity varies between individuals. For example, A is a high income consumer, B is a middle-income consumer and C is in the low-income group. This information is useful for personalized service or target-group-planning as a part of sales strategy formulation.9) Total Market and Segmented Market Demands This distinction is made mostly on the same lines as above. Different individual buyers together may represent a given market segment; and several market segments together may represent the total market. For example, the Hindustan Machine Tools may compute the demand for its watches in the home and foreign markets separately; and then aggregate them together to estimate the total market demand for its HMT watches. This distinction takes care of different patterns of buying behavior and consumers’ preferences in different segments of the market. Such market segments may be defined in terms of criteria like location, age, sex, income, nationality, and so on10) Company and Industry Demands An industry is the aggregate of firms (companies). Thus the Company’s demand is similar to an individual demand, whereas the industry’s demand is similar to aggregated total demand. You may examine this distinction from the standpoint of both output and input.For example, you may think of the demand for cement produced by the Cement Corporation of India (i.e., a company’s demand), or the demand for cement produced by all cement manufacturing units including the CCI (i.e., an industry’s demand). Similarly, there may be demand for engineers by a single firm or demand for engineers by the industry as a whole, which is an example of demand for an input. You can appreciate that the determinants of a company’s demand may not always be the same as those of an industry’s. The inter-firm differences with regard to technology, product quality, financial position, market (demand) share, market leadership and competitiveness- all these are possible explanatory factors. In fact, a clear understanding of the relation between company and industry demands necessitates an understanding of different market structures.
Demand Function
Demand function is a comprehensive formulation which specifies the factors that influence the demand for the product. What can be those factors which affect the demand?For example,Dx = D (Px, Py, Pz, B, W, A, E, T, O) Here Dx, stands for demand for item x (say, a car)Px, its own price (of the car)Py, the price of its substitutes (other brands/models)Pz, the price of its complements (like petrol)B, the income (budget) of the purchaser (user/consumer)W, the wealth of the purchaserA, the advertisement for the product (car)E, the price expectation of the userT, taste or preferences of userO, all other factors.
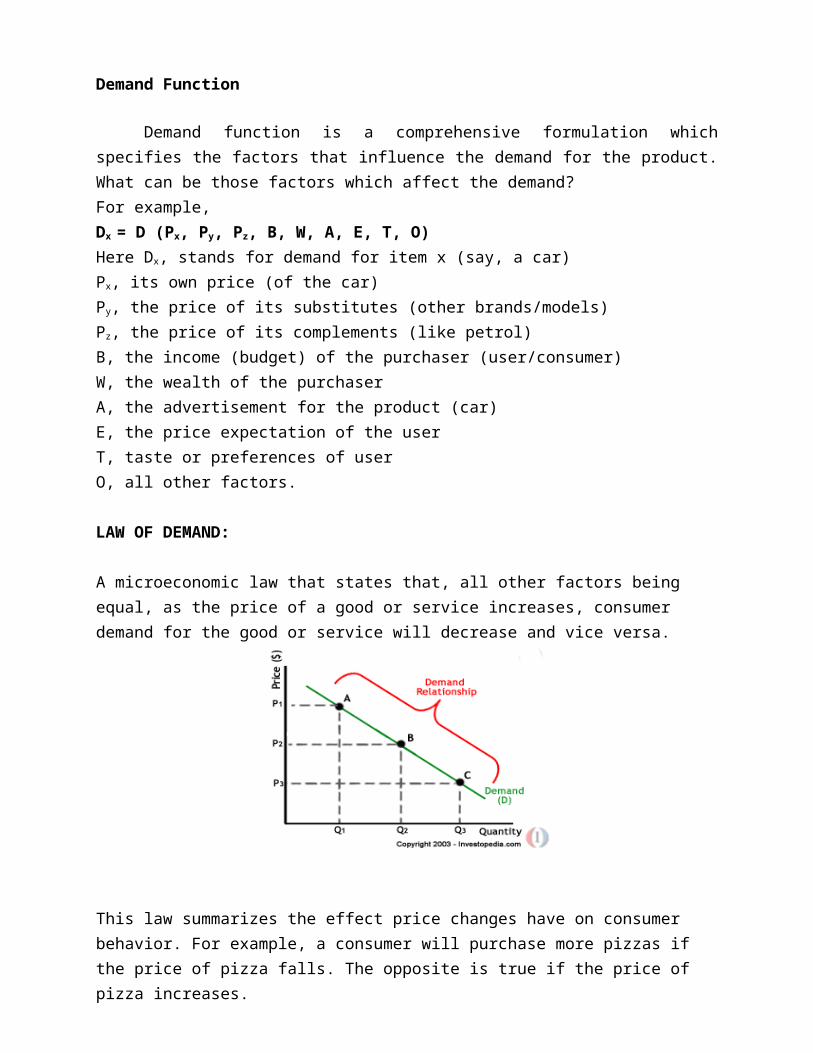
LAW OF DEMAND:
A microeconomic law that states that, all other factors being equal, as the price of a good or service increases, consumer demand for the good or service will decrease and vice versa.
This law summarizes the effect price changes have on consumer behavior. For example, a consumer will purchase more pizzas if the price of pizza falls. The opposite is true if the price of pizza increases.
Assumptions of Law of Demand: There are three main assumptions of the Law: (i) There should not be any change in the tastes of the consumers for goods (T). (ii) The purchasing power of the typical consumer must remain constant (M). (iii) The price of all other commodities should not vary (Po). Example of Law of Demand: If there is a change, in the above and other assumptions, the law may not hold true. For example, according to the law of demand, other things being equal quantity demanded increases with a fall in price and diminishes with rise to price. Now let us suppose that price of tea comes down from $40 per pound to $20 per pound. The demand for tea may not increase, because there has taken place a change in the taste of consumers or the price of coffee has fallen down as compared to tea or the purchasing power of the consumers has decreased, etc., etc. From this we find that demand responds to price inversely only, if other thing remains constant. Otherwise, the chances are that, the quantity demanded may not increase with a fall in price or vice-versa. Demand, thus, is a negative relationship between price and quantity.
Reasons behind the Law of Demand/Demand Curve is Negatively Sloped
The demand curve generally slopes downward from left to right. It has a negative slope because the two important variables price and quantity work in opposite direction. As the price of a commodity decreases, the quantity demanded increases over a specified period of time, and vice versa, other things remaining constant. The fundamental reasons for demand curve to slope downward are as follows: (i) Law of diminishing marginal utility: The law of demand is based on the law of diminishing marginal utility. According to the cardinal utility approach, when a consumer purchases more units of a commodity, its marginal utility declines. The consumer, therefore, will purchase more units of that commodity only if its price falls. Thus a decrease in price brings about an increase, in demand. The demand curve, therefore, is downward sloping. (ii) Income effect: Other things being equal, when the price of a commodity decreases, the real income or the purchasing power of the household increases. The consumer is now in a position to purchase more commodities with the same income. The demand for a commodity thus increases not only from the existing buyers but also from the new buyers who were earlier unable to purchase at higher price. When at a lower price, there is a greater demand for a commodity by the households; the demand curve is bound to slope downward from left to right. (iii) Substitution effect: The demand curve slopes downward from left to right also because of the substitution effect. For instance, the price of meat falls and the prices of other substitutes say poultry and beef remain constant. Then the households would prefer to purchase meat because it is now relatively cheaper. The increase in demand with a fall in the price of meat will move the demand curve downward from left to right. (iv) Price Effect/Entry of new buyers: When the price of a commodity falls, its demand not only increases from the old buyers but the new buyers also enter the market. The combined result of the income and substitution effect is that demand extends, ceteris paribus, as the .price falls. The demand curve slopes downward from left to right.
EXCEPTIONS OF LAW OF DEMAND: Though as a rule when the prices of normal goods rise, the demand then decreases but there may be a few cases where the law may not operate.i)Giffen goods: Some special varieties of inferior goods are termed as Giffen goods. Cheaper varieties of this category like bajra, cheaper vegetable like potato come under this category. Sir Robert Giffen or Ireland first observed that people used to spend more their income on inferior goods like potato and less of their income on meat. But potatoes constitute their staple food. When the price of potato increased, after purchasing potato they did not have so many surpluses to buy meat. So the rise in price of potato compelled people to buy more potato and thus raised the demand for potato. This is against the law of demand. This is also known as Giffen paradox.ii) Snob Appeal or Veblen Effect: Veblen Goods are good which have a snob value status. The Veblen effect is named after the economist Thorstein Veblen, who invented the concepts of conspicuous consumption A few goods like diamonds etc are purchased by the rich and wealthy sections of the society. The prices of these goods are so high that they are beyond the reach of the common man. The higher the price of the diamond the higher the prestige value of it. So when price of these goods falls, the consumers think that the prestige value of these goods comes
down. So quantity demanded of these goods falls with fall in their price. So the law of demand does not hold good here. iii)Demonstration Effect/ Bandwagon effectDemonstration effects are effects on the behavior of individuals caused by observation of the actions of others and their consequences. A psychological phenomenon whereby people do something primarily because other people are doing it, regardless of their own beliefs, which they may ignore or override. In politics, the bandwagon effect might cause citizens to vote for the person who appears to have more popular support because they want to belong to the majority.
(iv) Speculation/ Future Expectation of Prices: There are some commodities whose prices are expected to change in future. People demand more when price of the commodity continues rising. People apprehend a further rise in price in the future. To escape the further rise in price, they hurry to buy more even at a high price. The fear of price rise in future makes him buy more at a higher price. On the other hand they buy less at fewer prices with a hope of further fall in future. Thus this expectation or speculation constitutes another exception to the Law of Demand
v) Insignificant Proportion of Income Spent:
Things of very low value and limited use like salt and matchbox do not show any impact on price on their demand. The reason is that the amount spent on these goods is very small and even a large increase in their price has very negligible impact on money spent. Secondly these goods have limited use, such as even if salt is sold free, people will not increase its consumption.
vi) Goods with no Substitutes:
For the goods which have no substitute, such as lifesaving drugs, petrol and diesel, people have no option but to buy them, whatever be the price; hence demand does not show any effect of price change. There is no substitute to Indian railway hence whatever be the fare it remains the dominant mode of transport for people and goods.
vii)Ignorance about quality:-
Usually consumers judge the quality of a commodity from its price. A high priced commodity is thought to have higher value than that of a low priced commodity.
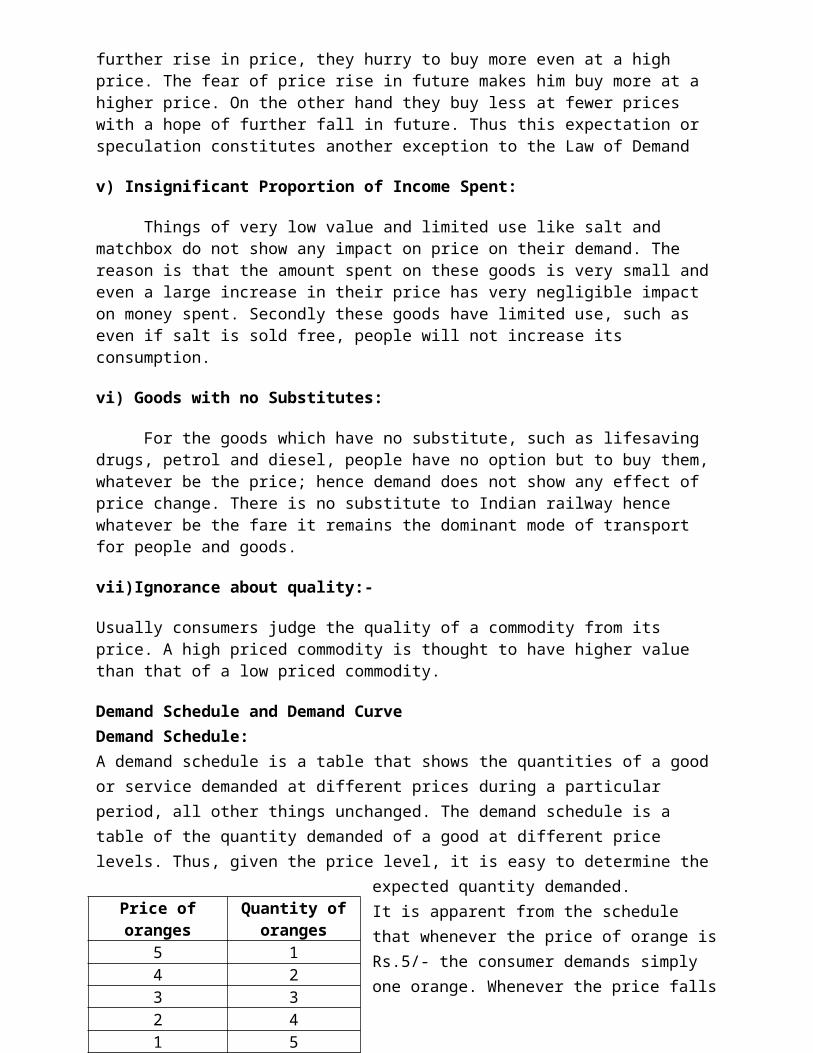
Demand Schedule and Demand CurveDemand Schedule:A demand schedule is a table that shows the quantities of a good or service demanded at different prices during a particular period, all other things unchanged. The demand schedule is a table of the quantity demanded of a good at different price levels. Thus, given the price level, it is easy to determine the expected quantity demanded.
It is apparent from the schedule that whenever the price of orange is Rs.5/- the consumer demands simply one orange. Whenever the price falls to Rs.4 he demands for 2 oranges. Whenever the price falls further to Rs. 3, he demands for 3 oranges. Therefore, whenever the price of a commodity falls, the demand
Price of oranges Quantity of oranges
5 14 23 32 41 5
for that commodity rises and vice-versa. The demand schedule for most products will show a reduction in quantity demanded as the price increases.
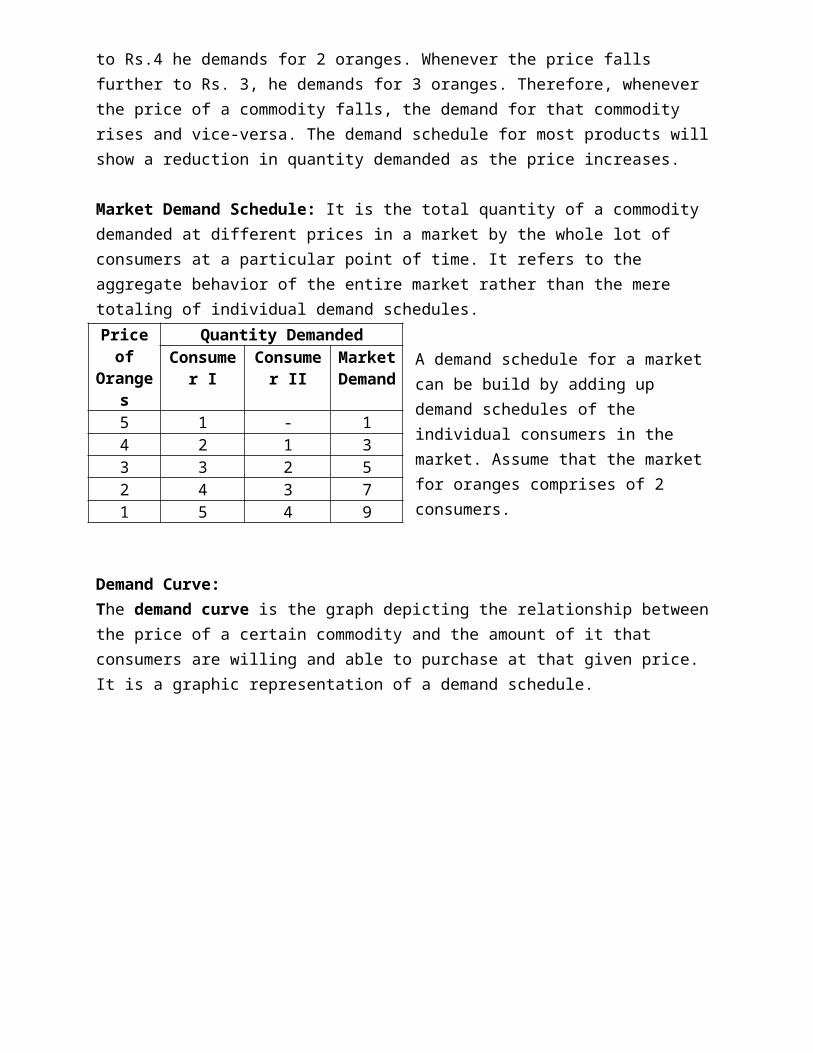
Market Demand Schedule: It is the total quantity of a commodity demanded at different prices in a market by the whole lot of consumers at a particular point of time. It refers to the aggregate behavior of the entire market rather than the mere totaling of individual demand schedules.
A demand schedule for a market can be build by adding up demand schedules of the individual consumers in the market. Assume that the market for oranges comprises of 2 consumers.
Demand Curve:The demand curve is the graph depicting the relationship between the price of a certain commodity and the amount of it that consumers are willing and able to purchase at that given price. It is a graphic representation of a demand schedule.
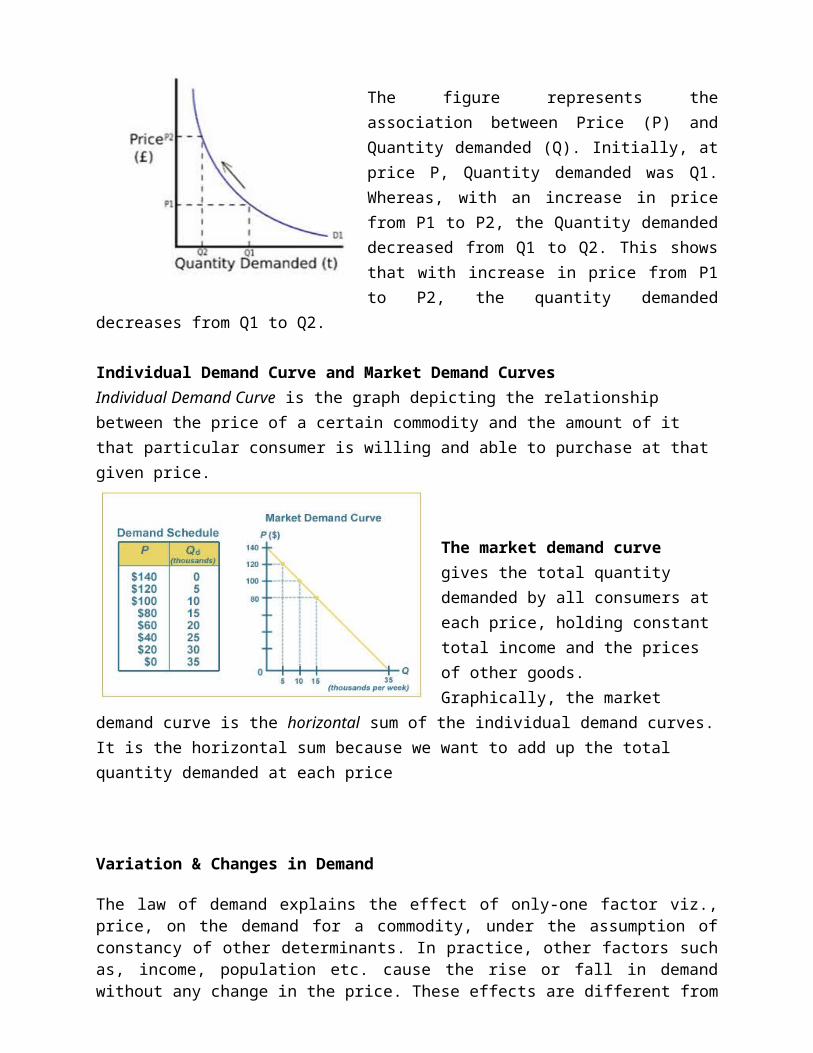
The figure represents the association between Price (P) and Quantity demanded (Q). Initially, at price P, Quantity demanded was Q1. Whereas, with an increase in price from P1 to P2, the Quantity demanded decreased from Q1 to Q2. This shows that with increase in price from P1 to P2, the quantity demanded decreases from Q1 to Q2.
Individual Demand Curve is the graph depicting the relationship between the price of a certain commodity and the amount of it that particular consumer is willing and able to purchase at that given price.
The market demand curve gives the total quantity demanded by all consumers at each price, holding constant total income and the prices of other goods.Graphically, the market demand curve is the horizontal sum of the individual demand curves. It is the horizontal sum because we want to add up the total quantity demanded at each price
Price of Oranges
Quantity DemandedConsume
r IConsumer
IIMarket Demand
5 1 - 14 2 1 33 3 2 52 4 3 71 5 4 9
Variation & Changes in Demand
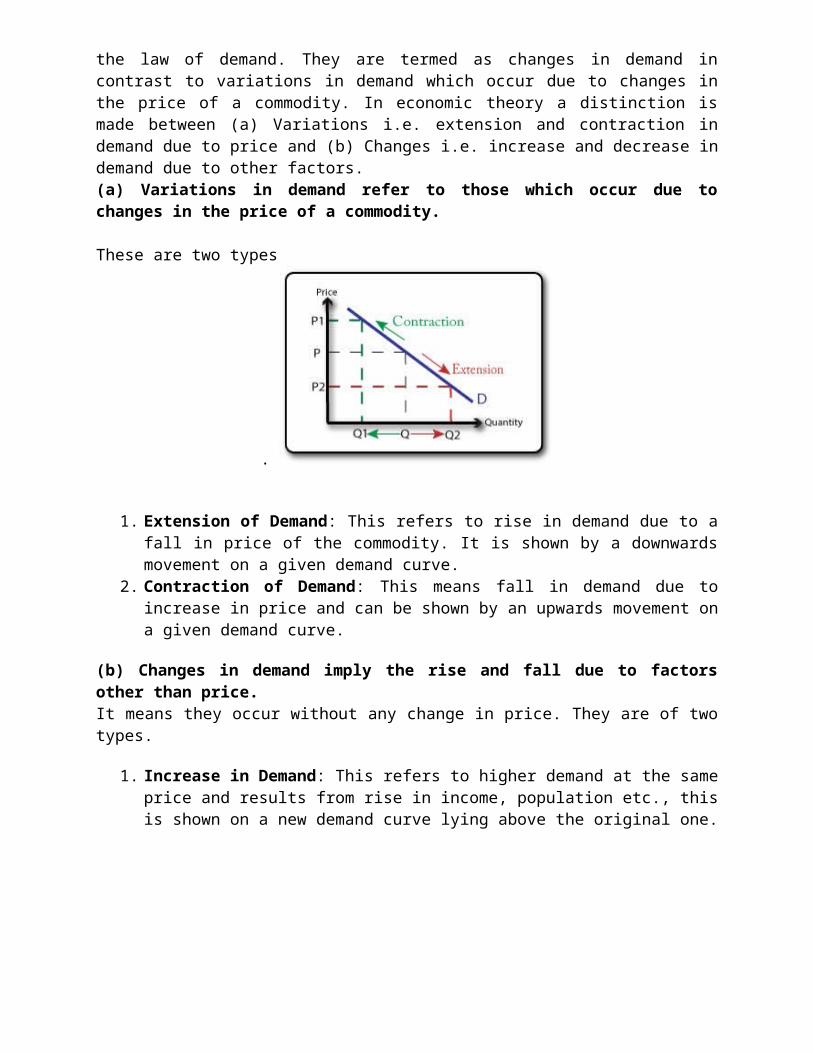
The law of demand explains the effect of only-one factor viz., price, on the demand for a commodity, under the assumption of constancy of other determinants. In practice, other factors such as, income, population etc. cause the rise or fall in demand without any change in the price. These effects are different from the law of demand. They are termed as changes in demand in contrast to variations in demand which occur due to changes in the price of a commodity. In economic theory a distinction is made between (a) Variations i.e. extension and contraction in demand due to price and (b) Changes i.e. increase and decrease in demand due to other factors.(a) Variations in demand refer to those which occur due to changes in the price of a commodity.
These are two types
.
1. Extension of Demand: This refers to rise in demand due to a fall in price of the commodity. It is shown by a downwards movement on a given demand curve.
2. Contraction of Demand: This means fall in demand due to increase in price and can be shown by an upwards movement on a given demand curve.
(b) Changes in demand imply the rise and fall due to factors other than price.It means they occur without any change in price. They are of two types.
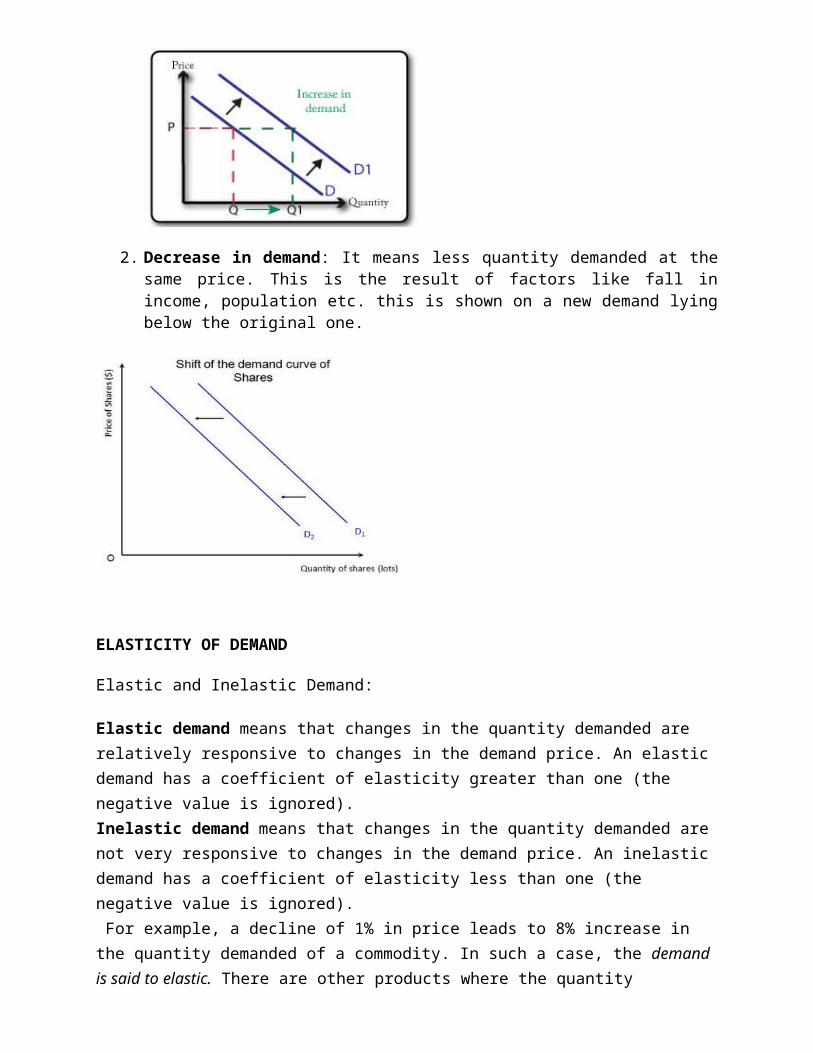
1. Increase in Demand: This refers to higher demand at the same price and results from rise in income, population etc., this is shown on a new demand curve lying above the original one.
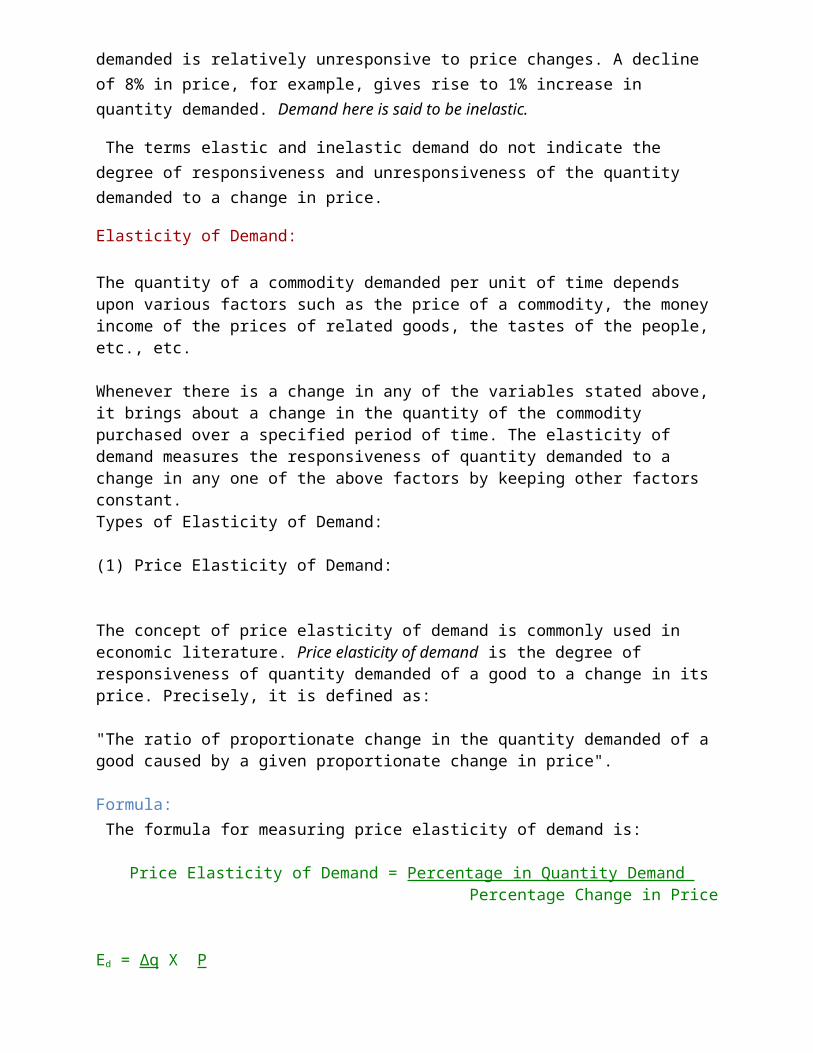
2. Decrease in demand: It means less quantity demanded at the same price. This is the result of factors like fall in income, population etc. this is shown on a new demand lying below the original one.
ELASTICITY OF DEMAND
Elastic and Inelastic Demand:
Elastic demand means that changes in the quantity demanded are relatively responsive to changes in the demand price. An elastic demand has a coefficient of elasticity greater than one (the negative value is ignored).Inelastic demand means that changes in the quantity demanded are not very responsive to changes in the demand price. An inelastic demand has a coefficient of elasticity less than one (the negative value is ignored). For example, a decline of 1% in price leads to 8% increase in the quantity demanded of a commodity. In such a case, the demand is said to elastic. There are other products where the quantity demanded is relatively unresponsive to price changes. A decline of 8% in price, for example, gives rise to 1% increase in quantity demanded. Demand here is said to be inelastic.
The terms elastic and inelastic demand do not indicate the degree of responsiveness and unresponsiveness of the quantity demanded to a change in price.
Elasticity of Demand: The quantity of a commodity demanded per unit of time depends upon various factors such as the price of a commodity, the money income of the prices of related goods, the tastes of the people, etc., etc. Whenever there is a change in any of the variables stated above, it brings about a change in the quantity of the commodity purchased over a specified period of time. The elasticity of demand measures the responsiveness of quantity demanded to a change in any one of the above factors by keeping other factors constant. Types of Elasticity of Demand:
(1) Price Elasticity of Demand:
The concept of price elasticity of demand is commonly used in economic literature. Price elasticity of demand is the degree of responsiveness of quantity demanded of a good to a change in its price. Precisely, it is defined as: "The ratio of proportionate change in the quantity demanded of a good caused by a given proportionate change in price". Formula: The formula for measuring price elasticity of demand is:
Price Elasticity of Demand = Percentage in Quantity Demand Percentage Change in Price
Ed = Δq X P Δp Q
Types of Price Elasticity of Demand
(1) Perfectly Elastic Demand:
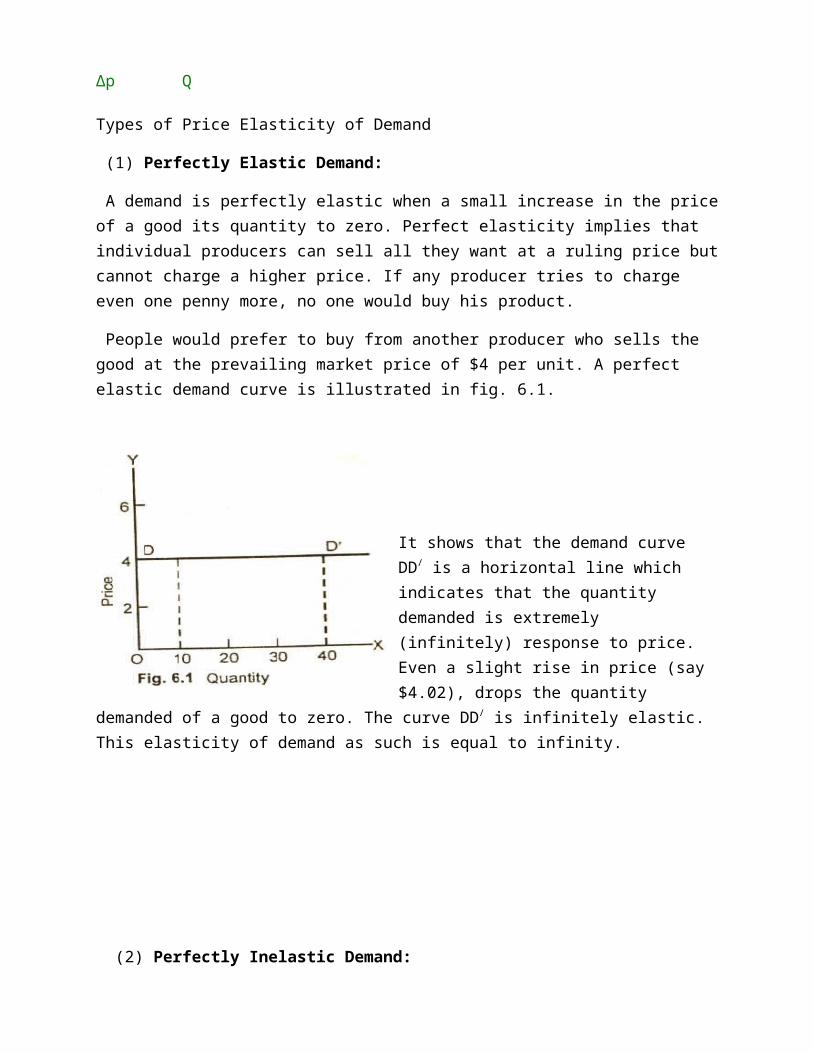
A demand is perfectly elastic when a small increase in the price of a good its quantity to zero. Perfect elasticity implies that individual producers can sell all they want at a ruling price but cannot charge a higher price. If any producer tries to charge even one penny more, no one would buy his product.
People would prefer to buy from another producer who sells the good at the prevailing market price of $4 per unit. A perfect elastic demand curve is illustrated in fig. 6.1.
It shows that the demand curve DD/ is a horizontal line which indicates that the quantity demanded is extremely (infinitely) response to price. Even a slight rise in price (say $4.02), drops the quantity demanded of a good to zero. The curve DD/ is infinitely elastic. This elasticity of demand as such is equal to infinity.
(2) Perfectly Inelastic Demand:
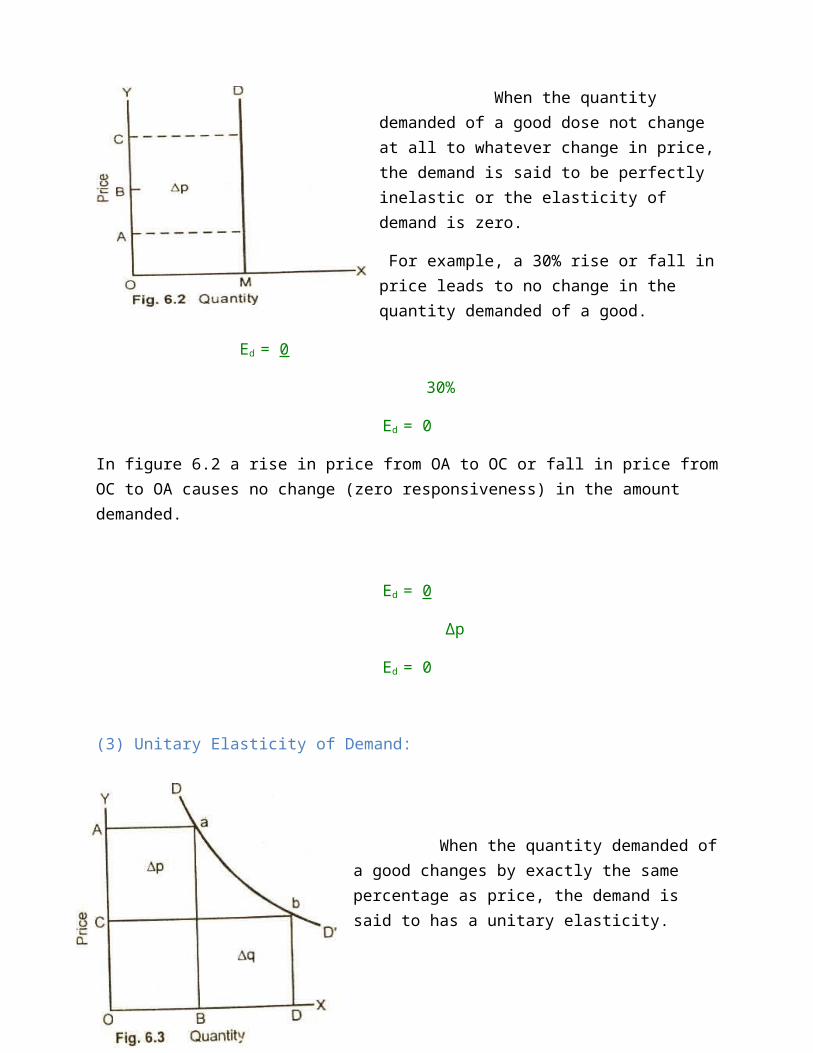
When the quantity demanded of a good dose not change at all to whatever change in price, the demand is said to be perfectly inelastic or the elasticity of demand is zero.
For example, a 30% rise or fall in price leads to no change in the quantity demanded of a good.
Ed = 0
30%
Ed = 0
In figure 6.2 a rise in price from OA to OC or fall in price from OC to OA causes no change (zero responsiveness) in the amount demanded.
Ed = 0
Δp
Ed = 0
(3) Unitary Elasticity of Demand:
When the quantity demanded of a good changes by exactly the same percentage as price, the demand is said to has a unitary elasticity.
For example, a 30% change in price leads to 30% change quantity demand = 30% / 30% = 1.
One or a one percent change in price causes a response of exactly a one percent change in the quantity demand.
In this figure (6.3) DD/ demand curve with unitary elasticity shows that as the price falls from OA to OC, the quantity demanded increases from OB to OD. On DD/ demand curve, the percentage change in price brings about an exactly equal percentage in quantity at all points a, b. The demand curve of elasticity is, therefore, a rectangular hyperbola.
Ed = %∆q
%∆p
Ed = 1
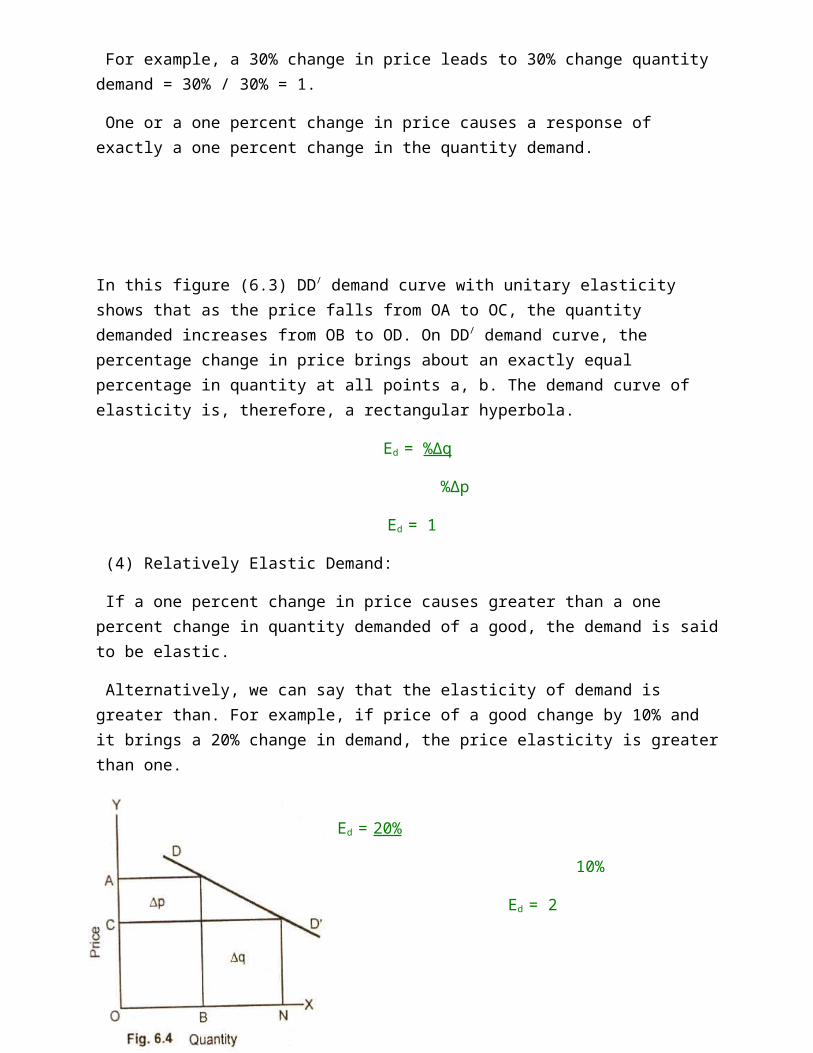
(4) Relatively Elastic Demand:
If a one percent change in price causes greater than a one percent change in quantity demanded of a good, the demand is said to be elastic.
Alternatively, we can say that the elasticity of demand is greater than. For example, if price of a good change by 10% and it brings a 20% change in demand, the price elasticity is greater than one.
Ed = 20%
10%
Ed = 2
In figure (6.4) DD/ curve is relatively elastic along its entire length. As the price falls from OA to OC, the demand of the good extends from OB to ON i.e., the increase in quantity demanded is more than proportionate to the fall in price.
Ed = %∆q
%∆p
Ed > 1
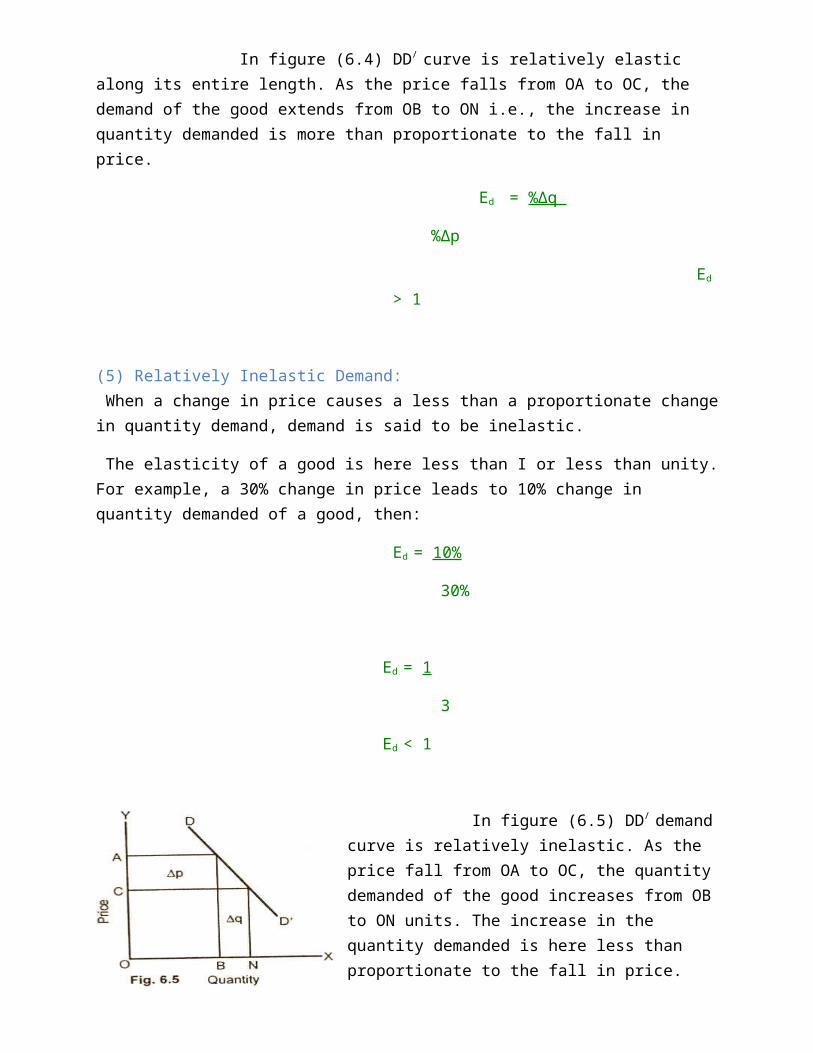
(5) Relatively Inelastic Demand: When a change in price causes a less than a proportionate change in quantity demand, demand is said to be inelastic.
The elasticity of a good is here less than I or less than unity. For example, a 30% change in price leads to 10% change in quantity demanded of a good, then:
Ed = 10%
30%
Ed = 1
3
Ed < 1
In figure (6.5) DD/ demand curve is relatively inelastic. As the price fall from OA to OC, the quantity demanded of the good increases from OB to ON units. The increase in the quantity demanded is here less than proportionate to the fall in price.
(2) Income Elasticity of Demand:
Income is an important variable affecting the demand for a good. When there is a change in the level of income of a consumer, there is a change in the quantity demanded of a good, other factors remaining the same. The degree of change or responsiveness of quantity demanded of a good to a change in the income of a consumer is called income elasticity of demand. Income elasticity of demand can be defined as: "The ratio of percentage change in the quantity of a good purchased, per unit of time to a percentage change in the income of a consumer". Formula: The formula for measuring the income elasticity of demand is the percentage change in demand for a good divided by the percentage change in income. Putting this in symbol gives.
Ey = Percentage Change in Demand Percentage Change in Income
Simplified formula:
Ey = Δq X P Δp Q Types: When the income of a person increases, his demand for goods also changes depending upon whether the good is a normal good or an inferior good. For normal goods, the value of elasticity is greater than zero but less than one. Goods with an income elasticity of less than 1 are called
inferior goods. For example, people buy more food as their income rises but the % increase in its demand is less than the % increase in income. (3) Cross Elasticity of Demand: Definition and Explanation: The concept of cross elasticity of demand is used for measuring the responsiveness of quantity demanded of a good to changes in the price of related goods. Cross elasticity of demand is defined as: "The percentage change in the demand of one good as a result of the percentage change in the price of another good". Formula: The formula for measuring, cross, elasticity of demand is:
Exy = % Change in Quantity Demanded of Good X % Change in Price of Good Y
The numerical value of cross elasticity depends on whether the two goods in question are substitutes, complements or unrelated. Types and Example: (i) Substitute Goods. When two goods are substitute of each other, such as coke and Pepsi, an increase in the price of one good will lead to an increase in demand for the other good. The numerical value of goods is positive. For example there are two goods. Coke and Pepsi which are close substitutes. If there is increase in the price of Pepsi called good y by 10% and it increases the demand for Coke called good X by 5%, the cross elasticity of demand would be:
Exy = %Δqx / %Δpy = 0.2 Since Exy is positive (E > 0), therefore, Coke and Pepsi are close substitutes. (ii) Complementary Goods. However, in case of complementary goods such as car and petrol, cricket bat and ball, a rise in the price of one good say cricket bat by 7% will bring a fall in the demand for the balls (say by 6%). The cross elasticity of demand which are complementary to each other is, therefore, 6% / 7% = 0.85 (negative). (iii) Unrelated Goods. The two goods which a re unrelated to each other, say apples and pens, if the price of apple rises in the market, it is unlikely to result in a change in quantity demanded of pens. The elasticity is zero of unrelated goods.
Supply
Supply
The buyers' demand for goods is not the only factor determining market prices and quantities. The sellers' supply of goods also plays a role in determining market prices and quantities. Like the buyers' demand, the sellers' supply can be represented in three different ways: by a supply schedule, by a supply curve, and algebraically. An example of a supply schedule for a certain good X is given in Table 1 , and the corresponding supply curve is drawn in Figure 1 . Note that as the price of good X increases, the quantity supplied of good X increases. This kind of behavior on the part of sellers is in accordance with the law of supply.
Figure 1Supply curve for good X
TABLE 1 Supply Schedule for Good X
Price of good XQuantity supplied
0 0
1 2
2 4
3 6
4 8
5 10Law of supply:
What Does Law Of Supply Mean?A microeconomic law stating that, all other factors being equal, as the price of a good or service increases, the quantity of goods or services offered by suppliers’ increases and vice versa.
As the price of a good increase, suppliers will attempt to maximize profits by increasing the quantity of the product sold. There is direct relationship between the price of a commodity and its quantity offered fore sale over a specified period of time. When the price of a goods rises, other things remaining the same, its quantity which is offered for sale increases as and price falls, the amount available for sale decreases. This relationship between price and the quantities which suppliers are prepared to offer for sale is called the law of supply
Elasticity of Supply:
Elasticity of supply works similarly. If a change in price results in a big change in the amount supplied, the supply curve appears flatter and is considered elastic. Elasticity in this case would be greater than or equal to one. Elastic Supply: Elasticity of supply represents the extent of change in supply in response to a change in price. If the amount supplied is highly responsive to a change in price, the supply is said to be elastic.
Inelastic Supply:
If the amount offered for sale is less affected by price change, then the supply is said to be inelastic.
CHANGES IN SUPPLY:
There are TWO types of change in supply;
1. Movement ALONG the supply curve2. SHIFTS in the supply curve
A movement ALONG the supply curve
A movement along the supply curve is caused by a change in PRICE of the good or service. For instance, an increase in the price of the good results in an EXTENSION of supply (quantity supplied will increase), whilst a decrease in price causes a CONTRACTION of supply (quantity supplied will decrease).
Movement in Supply:
Like a movement along the demand curve, a movement along the supply curve means that the supply relationship remains consistent. Therefore, a movement along the supply curve will occur when the price of the good changes and the quantity supplied changes in accordance to the original supply relationship. In other words, a movement occurs when a change in quantity supplied is caused only by a change in price, and vice versa.
Shifts in supply:
A SHIFT in the supply curve
A shift in the supply curve is caused by a change in any non-price determinant of supply. The curve can shift to the right or left.
A rightward shift represents an increase in the quantity supplied (at all prices) S1 to S2, whilst a leftward shift represents a decrease in the quantity supplied (at all prices). S1 to S3.
The movements can be caused by the following;
1. Change in costs of production - if the costs of production increase then the potential profit will fall. This will cause producers to look at alternative goods to produce. Therefore, an increase in the costs of production will cause a leftward shift in the supply curve.2. Role of technology - if the degree of technology employed in production increases then firms will be able to make more goods with their given level of inputs (factors of production). Therefore, an improvement in technology causes the supply curve to shift to the right.
ELASTICITY OF SUPPLYPrice Elasticity of Supply: Definition and Explanation: Price elasticity of demand measures the degree of responsiveness of demand for a product due to a change in the price of that product. "Price elasticity of supply measures how responsive producers are to a change in the price of good. It is defined as a measure of the responsiveness of quantity supplied to change in price". Measurement and Formula: It is measured by dividing the percentage change in quantity supplied by the percentage change in price. Thus the Percentage Method formula is:
Es = Percentage Change in Quantity Supplied Percentage Change in Price
It can also be written as:
Es = ΔQ/Q ΔP/P
Es = ΔQ x P ΔP Q Just like demand, supply can also be elastic or inelastic.
TYPES OF PRICE ELASTICITY OF SUPPLY: There are five degrees of price elasticity of supply.
(1) Infinitely Elastic Supply:
When the amount supplied at the ruling price is infinite, we say the supply is infinitely elastic. An infinitely elastic supply curve is a horizontal straight line as is shown in the figure 7.1.In this diagram 7,1, when the price is OP, the producer supplies an infinite amount of goods if the price falls slightly below OP then nothing will be supplied by him.
(2) Elastic Supply:
When the percentage change in the amount of a good supplied is greater than the percentage change in price that generated it. the supply is then said to be elastic supply. For example, if the price of oranges increases from $5 to $6 and the quantity supplied rises from 150 to 600 oranges, the supply will be elastic.In the diagram 7.2 SS/ supply curve is elastic and the numerical value for elasticity is greater than 1.
(3) Unitary Elasticity:
When the percentage change in the quantity supplied is exactly equal to percentage change in price that evoked it, the supply is said to have elasticity equal to unity, the elasticity of supply is equal to 1. In the diagram 7.3 SS/ supply curve drawn through the origin has unit
elasticity of supply
(4) Inelastic Supply: When the percentage change in the quantity supplied is less than the percentage change in the price that generated it, the supply is said to be inelastic. The inelasticity of supply is less than 1.
In this figure 7.4 SS/ supply curve (which is steeper than the elastic supply curve) shows that with a significant change in price, the quantity offered for sale is not very much affected.
(5) Perfectly Inelastic Supply:
In perfectly inelastic-supply, the quantity supplied does not change as price changes. The elasticity of supply in other words is zero. For example, if the price of a painting by an artist who has died, rises from $10 thousand to $50 thousand, the supply of the painting cannot be increased. Diagram 7.5 shows the perfectly inelastic supply.
MARKET EQUILIBRIUM:A situation in which the supply of an item is exactly equal to its demand. Since there is neither surplus nor shortage in the market, price tends to remain stable in this situation. When the supply and demand curves intersect, the market is in equilibrium. This is where the quantity demanded and quantity supplied are equal. The corresponding price is the equilibrium price or market-clearing price, the quantity is the equilibrium quantity.
Surplus and shortage:
If the market price is above the equilibrium price, quantity supplied is greater than quantity demanded, creating a surplus. Market price will fall.
Example: if you are the producer, you have a lot of excess inventory that cannot sell. Will you put them on sale? It is most likely yes. Once you lower the price of your product, your product’s quantity demanded will rise until equilibrium is reached. Therefore, surplus drives price down.
If the market price is below the equilibrium price, quantity supplied is less than quantity demanded, creating a shortage. The market is not clear. It is in shortage. Market price will rise because of this shortage.
Example: if you are the producer, your product is always out of stock. Will you raise the price to make more profit? Most for-profit firms will say yes. Once you raise the price of your product, your product’s quantity demanded will drop until equilibrium is reached. Therefore, shortage drives price up.
If a surplus exist, price must fall in order to entice additional quantity demanded and reduce quantity supplied until the surplus is eliminated. If a shortage exists, price must rise in order to entice additional supply and reduce quantity demanded until the shortage is eliminated.
Shifts in the demand and supply curves alter market equilibrium. On the demand side, any factor which makes the demand curve shift to the right (without affecting the supply curve) will increase the equilibrium price and quantity.
Changes in Supply and Demand
When supply and demand curves shift, this results in changes to the equilibrium price and quantity. If there is an increase in demand (a shift to the right of the demand curve, as might occur with higher incomes, higher prices for a substitute good, or stronger tastes for the product in question), both the equilibrium price and equilibrium quantity will increase. A decrease in demand will entail reductions in the equilibrium price and quantity. If there is an increase in supply (a shift to the right of the supply curve, as might occur with improved technology or reduction in the prices of inputs), this will result in a decline in the equilibrium price and an
increase in the equilibrium quantity. Conversely, a decrease in supply will raise the equilibrium price and lower the equilibrium quantity.
You can see these changes by starting with a simple supply and demand graph showing an initial equilibrium, and then drawing the new demand or supply curve and observing the new equilibrium point. In order to do well in this course, you will need to become proficient at drawing supply and demand graphs and using them to determine the consequences of changes in demand, supply, or both.
The four basic changes (increase in demand, decline in demand, increase in supply, reduction in supply) are illustrated in the diagrams below. Note that in each case, there is a movement along the curve for the aspect that does not change. That is, when demand increases, there is an increase in the quantity supplied (movement along the supply curve) as the market moves from the initial equilibrium price to the new equilibrium price. Likewise, when there is an increase in supply, there is an increase in the quantity demanded (downward movement along the demand curve).
1. An increase in demand
2. A decline in demand
If there is an increase in demand (a shift to the right of the demand curve, as might occur with higher incomes, higher prices for a substitute good, or stronger tastes for the product in question), both the equilibrium price and equilibrium quantity will increase
A decrease in demand will entail reductions in the equilibrium price and quantity.
3. An increase in supply
If there is an increase in supply (a shift to the right of the supply curve, as might occur with improved technology or reduction in the prices of inputs), this will result in a decline in the equilibrium price and an increase in the equilibrium quantity. Conversely, a decrease in supply will raise the equilibrium price and lower the equilibrium quantity.
4. A decline in supply
Simultaneous Changes in Demand and SupplyWhat happens to the equilibrium price and quantity when both demand and supply increase? It depends on which change is larger. In Panel A of Figure 3.13, the increase in demand is larger than the increase in supply, meaning the demand curve shifts by a larger amount than the supply curve. The market equilibrium moves from point a to point b, and the equilibrium price increases from $8 to $9. This is sensible because an increase in demand tends to pull the price up, while an increase in supply tends to push the price down. If demand increases by a larger amount, the upward pull will bestronger than the downward push, and the price will rise.
Simultanous Increase in demand and supply results in a right ward shift in demand curve and supply curve, leading to a new equilibrium point( the intersection point of demand and new supply curve). The changes in both demand and supply is a real market situation, The supply and demand curve changes as a result of change in market conditions.
· With the simultaneous increase in demand and supply, demand and supply curves shift rightward.
· The new equilibrium point is E1
· Here, It would result in rise in price P1 and increase in quanity demanded Q1.