Embed Size (px)
Citation preview
Ecology – AQA GCSE GraspIT - Questions
A. Adaptation, interdependence and competition
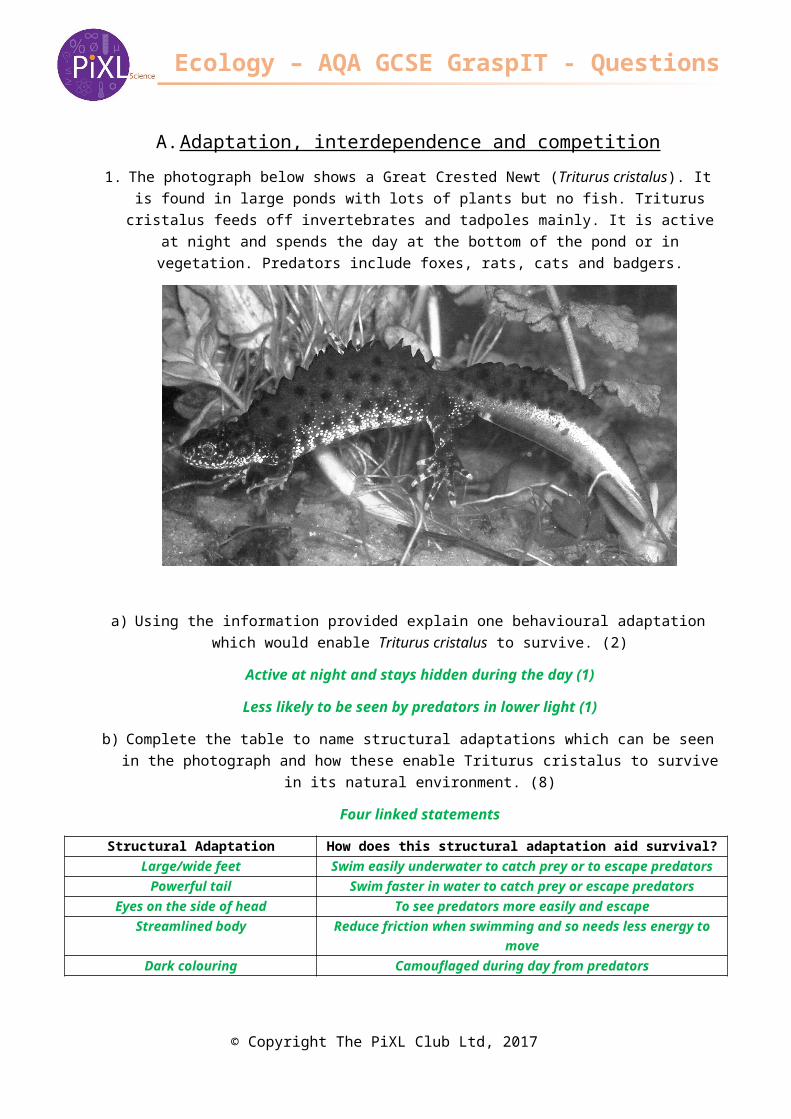
1. The photograph below shows a Great Crested Newt (Triturus cristalus). It is found in large ponds with lots of plants but no fish. Triturus cristalus feeds off invertebrates and tadpoles mainly. It is active at night and spends the day at the bottom of the pond or in vegetation. Predators include
foxes, rats, cats and badgers.
a) Using the information provided explain one behavioural adaptation which would enable Triturus cristalus to survive. (2)
Active at night and stays hidden during the day (1)
Less likely to be seen by predators in lower light (1)
b) Complete the table to name structural adaptations which can be seen in the photograph and how these enable Triturus cristalus to survive in its natural environment. (8)
Four linked statements
Structural Adaptation How does this structural adaptation aid survival?Large/wide feet Swim easily underwater to catch prey or to escape predators
Powerful tail Swim faster in water to catch prey or escape predatorsEyes on the side of head To see predators more easily and escape
Streamlined body Reduce friction when swimming and so needs less energy to move
Dark colouring Camouflaged during day from predators
c) An ideal habitat for a population of Great Crested newts is where many ponds are found close to each other separated by grassland. Suggest the benefits of having several ponds close to each other. (3)Ability to find a mate to reproduceIf one pond becomes polluted or unsuitable there are options to relocateIsolation genetically does not occur within the population Less competition for space, food, mates
© Copyright The PiXL Club Ltd, 2017
Ecology – AQA GCSE GraspIT - Questions
d) Describe 3 biotic factors which may affect a population of Great Crested Newts. (3)Availability of foodNew predators arrivingNew pathogens
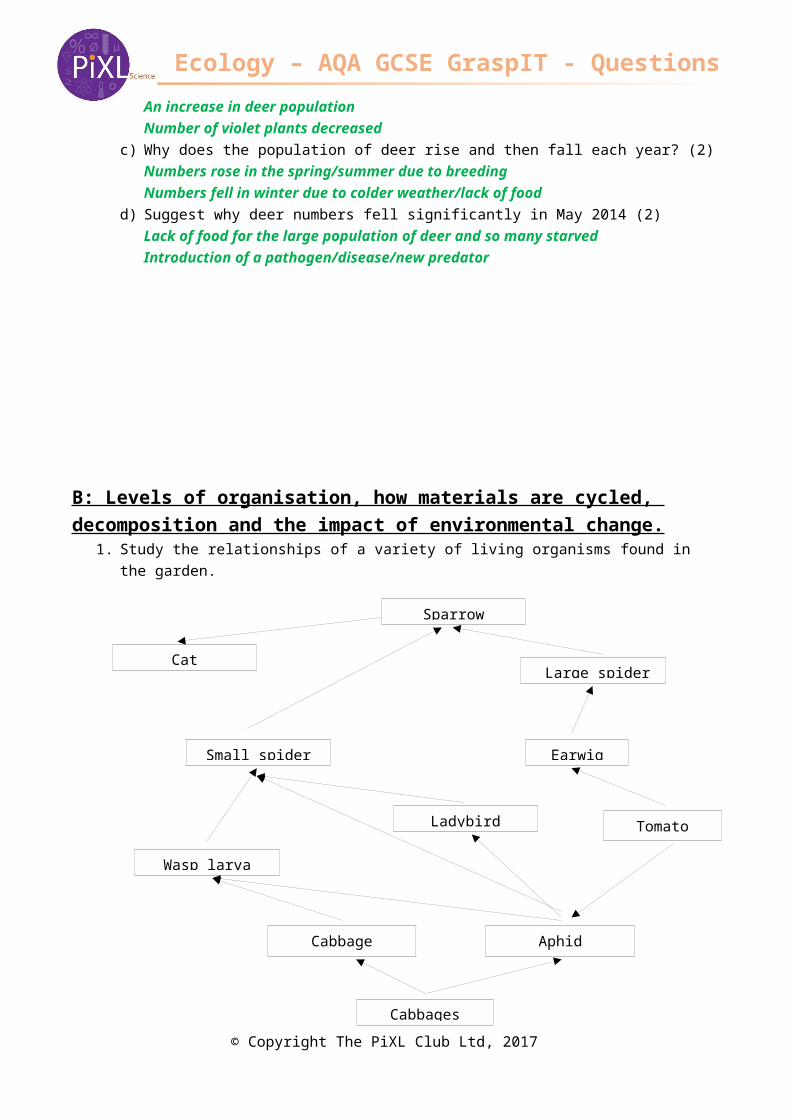
2. Dunsbury Park is home to a small herd of red deer which feed on grass, tree bark and the new shoots of plants. A rare type of violet plant is found to occur on the land in shaded woodland. Wolves roamed wild in the area and were predators of deer. The landowner wanted to preserve the herd of deer and so began to shoot the wolves when they came onto his land. By the end of 2013, all the wolves were killed.
Number of organisms
May 2010
Nov 2010
May 2011
Nov 2011
May 2012
Nov 2012
May 2013
Nov 2013
May 2014
Deer 2302 2130 2370 2267 2705 2690 2752 2712 1946
Violet plants 24 21 23 16 5 2 4 1 0
a) Use the graph paper and a suitable method to display the data about the population of red deer from 2010 to 2014. (4)(Remember to add labels). Bar chart (1) Axis labelled (1) Bars plotted correctly (1) Gap between bars (1)
a) Use the information to estimate when the Landowner began shooting wolves. (1)Between November 2011 and May 2012
b) What effect did the decision to shoot the wolves appear to have on the community? (2) An increase in deer populationNumber of violet plants decreased
c) Why does the population of deer rise and then fall each year? (2)Numbers rose in the spring/summer due to breedingNumbers fell in winter due to colder weather/lack of food
d) Suggest why deer numbers fell significantly in May 2014 (2)Lack of food for the large population of deer and so many starvedIntroduction of a pathogen/disease/new predator
© Copyright The PiXL Club Ltd, 2017
Ecology – AQA GCSE GraspIT - Questions
B: Levels of organisation, how materials are cycled, decomposition and the impact of environmental change.
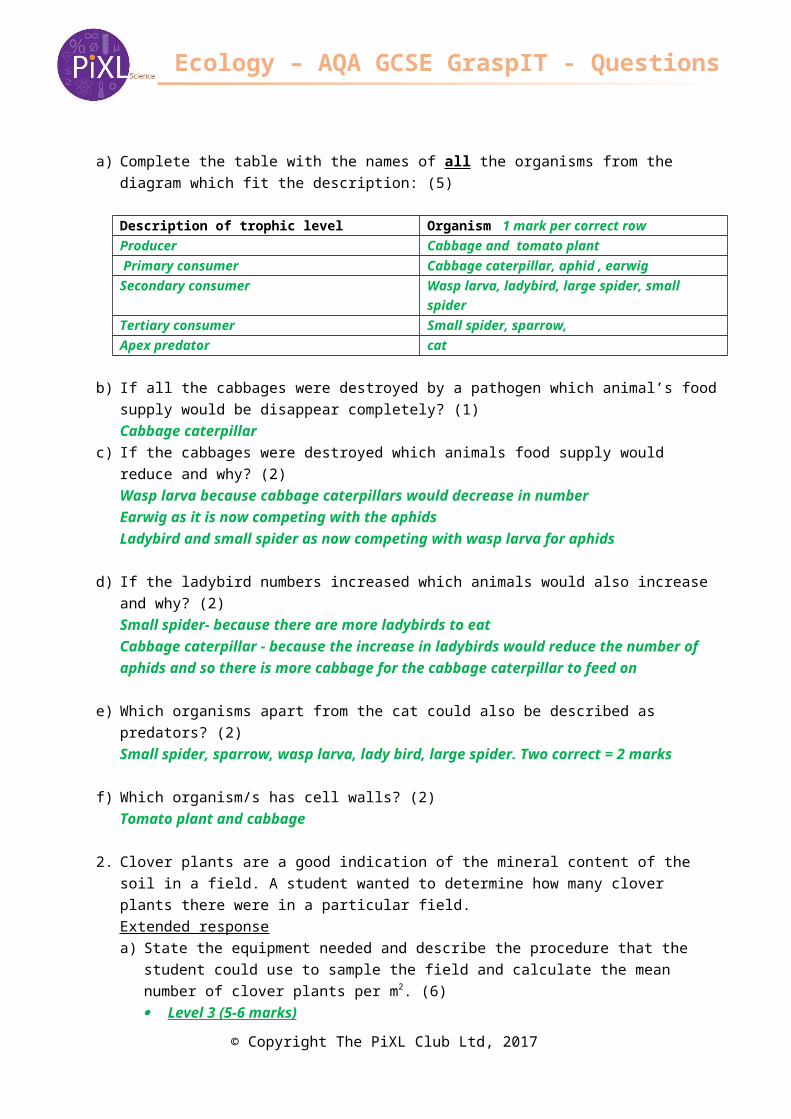
1. Study the relationships of a variety of living organisms found in the garden.
a) Complete the table with the names of all the organisms from the diagram which fit the description: (5)
Description of trophic level Organism 1 mark per correct rowProducer Cabbage and tomato plant Primary consumer Cabbage caterpillar, aphid , earwigSecondary consumer Wasp larva, ladybird, large spider, small spiderTertiary consumer Small spider, sparrow,Apex predator cat
b) If all the cabbages were destroyed by a pathogen which animal’s food supply would be disappear completely? (1)Cabbage caterpillar
c) If the cabbages were destroyed which animals food supply would reduce and why? (2)Wasp larva because cabbage caterpillars would decrease in numberEarwig as it is now competing with the aphidsLadybird and small spider as now competing with wasp larva for aphids
d) If the ladybird numbers increased which animals would also increase and why? (2)Small spider- because there are more ladybirds to eatCabbage caterpillar - because the increase in ladybirds would reduce the number of aphids and so there is more cabbage for the cabbage caterpillar to feed on
© Copyright The PiXL Club Ltd, 2017
Cabbages
Cabbage caterpillar Aphid
Tomato plant
Earwig
Large spider
Sparrow
Wasp larva
Ladybird
Small spider
Cat
Ecology – AQA GCSE GraspIT - Questions
e) Which organisms apart from the cat could also be described as predators? (2)Small spider, sparrow, wasp larva, lady bird, large spider. Two correct = 2 marks
f) Which organism/s has cell walls? (2)Tomato plant and cabbage
2. Clover plants are a good indication of the mineral content of the soil in a field. A student wanted to determine how many clover plants there were in a particular field. Extended responsea) State the equipment needed and describe the procedure that the student could use to sample
the field and calculate the mean number of clover plants per m2. (6) Level 3 (5-6 marks)
A logical plan that INCLUDES most equipment that will allow the mean number of clover plants per m2 to be calculated AND describes how to do this correctly.
Level 2 (3-4 marks) A plan that INCLUDES some equipment that will allow the mean number of clover plants per m2 to be calculated AND describes how to do this with most of the steps in the correct order.
Level 1 (1-2 marks) Simple plan that lists some equipment that will allow the mean number of clover plants per m2 to be calculated OR describes how to do this with most of the steps in the correct order.
Indicative content
Equipment required:Metre tapeQuadrat 1m x1mRandom number table
Procedure:Find the area of the field using the measuring tape by measuring the length and width in metres and calculating area (length x width)Use the random number table to make decisions on where to place the quadrat.Place the quadrat on the floor and count how many clover plants can be seen inside the frame. Record this.Repeat until 10% of the area of the field has been sampled as a minimum.Divide the total number of plants by the number of quadrats recorded to calculate the mean number of clover plants per m 2 in this field.
b) How could the student estimate how many clover plants were in the field? (2)Find the area of the field Calculate: area of field x mean number of clover plants per quadrat
3. A scientist placed a transect line across the field and recorded the percentage cover of each plant found in the quadrat at 2 metre intervals.
© Copyright The PiXL Club Ltd, 2017
Ecology – AQA GCSE GraspIT - Questions
Why did the scientist use this method rather than the random sampling technique? (2)Transect method will show if there are any differences in individual plant cover/density across the field.Differences may occur due to variations in the environment across the field.
Extended Response question
4. Explain how carbon is cycled in the natural environment. (6)
Level 3 (5-6 marks) A detailed and coherent explanation is given which logically links the processes of photosynthesis, respiration, digestion, combustion and decay with explanations of how carbon is cycled.
Level 2 (3-4 marks) A number of relevant points made linking processes and the cycling of carbon naturally usually in a logical sequence
Level 1 (1-2 marks) Some relevant points made regarding the cycling of carbon in nature with no logical structure.
Biology ContentPhotosynthesis removes carbon dioxide from the atmosphere. to make glucose which contains carbon. Some of this carbon will be converted into plant biomass and fixed. Plant and animal respiration release carbon dioxide into the atmosphere from glucose.Animals eat and digest plants which contain carbon compounds and convert this into biomass. Decomposers secrete enzymes into the environment and cause dead plant and animal material to decompose. This releases carbon dioxide into the atmosphere. Decomposers respire releasing carbon dioxide into the atmosphere.Combustion of fossil fuels/peat releases carbon dioxide into the atmosphere.
Biology only questions
5. Mrs Smith’s farm keeps a herd of cows for milk production which produce a large volume of faeces every day whilst being milked. She is considering purchasing a biogas generator to process the faeces and organic waste from the farm.
© Copyright The PiXL Club Ltd, 2017
Ecology – AQA GCSE GraspIT - Questions
a) Describe how a biogas generator works. (4)Four from:Faeces are fed into the generatorAnaerobic bacteria in the generator Ferment the waste and release biogas/methaneBiogas/methane is collectedSolids settle and can be run off to use as fertiliser on the land
b) List three reasons why it is better to process the animal faeces than to wash it away with a hose. (3)Three from:Methane is not released into the atmosphereUseful products can be collected and used for fuelConditions in the digester can be controlledReduction in pollution to the environment/ local waterways/eutrophication
c) The instructions for the biogas generator suggest the optimum temperature for operation is between 33 and 360C. Explain why this is important for maintaining the maximum output of biogas. (2)Two linked statements:Optimum temperature is required for anaerobic bacteria to digest waste effectively.Enzymes which digest the waste function much slower in lower temperatures because collisions between enzyme and substrate are less successful and less frequent.Enzymes denature if temperature gets too high.
Extended response question6. Design an experiment to investigate the effect of temperature on the growth of mould on bread.
Include an equipment list, method and risk assessment in the answer. (6)
Level 3 (5-6 marks) A logical plan that INCLUDES most equipment that will allow the effect of temperature on the growth of bread mould to be investigated AND describes how to do this correctly AND includes an appropriate risk assessment.
Level 2 (3-4 marks) A plan that INCLUDES some equipment that will allow the effect of temperature on the growth of bread mould to be investigated AND describes how to do this with most steps in the correct order AND includes an appropriate risk assessment.Level 1 (1-2 marks)Simple plan that lists some equipment that will allow will allow the effect of temperature on the growth of bread mould to be investigated OR describes how to do this with most steps in the correct order AND includes a simple risk assessment.
C. Biodiversity and the effect on the human interaction on ecosystems.
© Copyright The PiXL Club Ltd, 2017
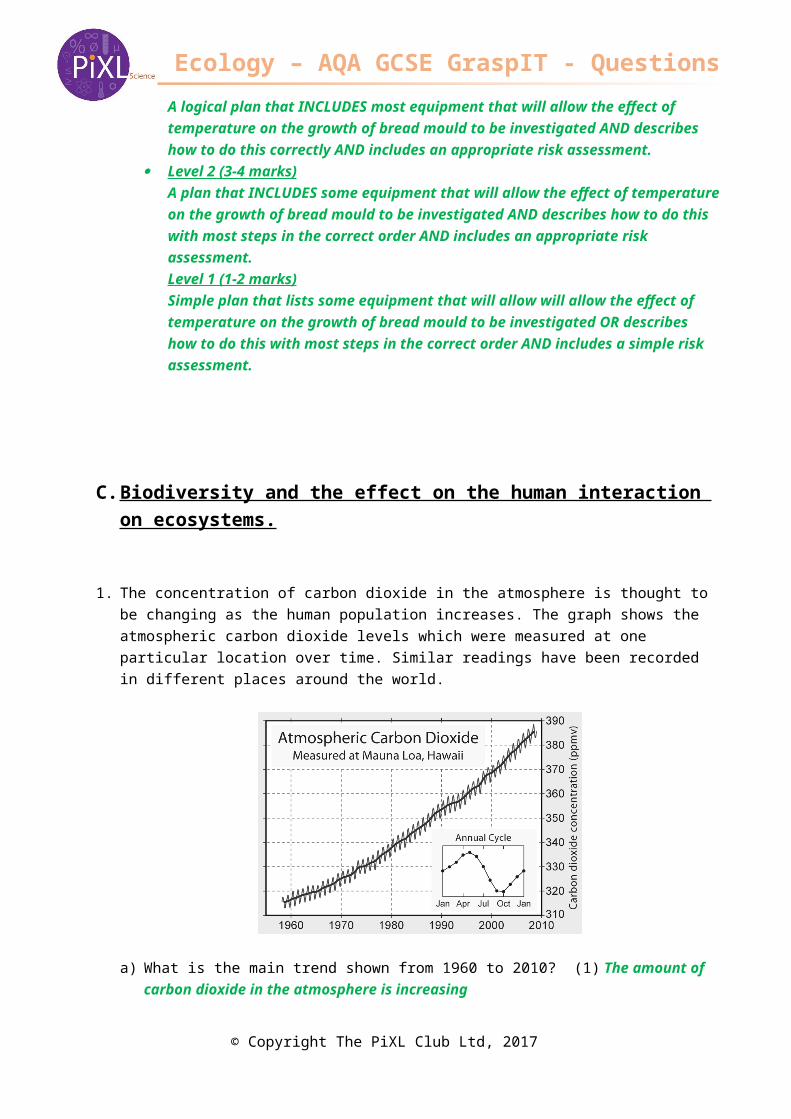
Ecology – AQA GCSE GraspIT - Questions1. The concentration of carbon dioxide in the atmosphere is thought to be changing as the human
population increases. The graph shows the atmospheric carbon dioxide levels which were measured at one particular location over time. Similar readings have been recorded in different places around the world.
a) What is the main trend shown from 1960 to 2010? (1) The amount of carbon dioxide in the atmosphere is increasing
b) Calculate the increase in mean carbon dioxide concentration between 1970 and 2000. (3)Reads off correct value for 1970 mean carbon dioxide concentration (accept a figure between 367 and 369 ppmv)
Reads off correct value for 2000 mean carbon dioxide concentration (accept a figure of 324-326ppmv)
Calculates the difference by subtracting 1970 figure from 2000 figure (use figures from above)e.g. 368- 325 = 43 carbon dioxide concentration ppmv.
To gain full 3 marks, the units ppmv must be stated after the correct answer.
c) Suggest why the carbon dioxide concentration changes during the year? (2)
Two from:In winter more fuel is being burned for heating so more carbon dioxide in the atmosphere. Less photosynthesis occurring in the winter months as less leaves on tree so less carbon dioxide is removed from the atmosphere by photosynthesis.Or vice versa for summer months.
d) Scientists discovered evidence of an extinct plant by analysing peat layers in a waterlogged Scottish bog. They found pollen in layers that were over 600 years old.Explain why the pollen was so well preserved. (2)Anaerobic conditions in the peat bog prevent decay occurring
e) Explain the effect that mixing peat with soil in a garden will have on gases in the atmosphere?(3) Mixing with soil will bring the peat into contact with oxygencausing decay of the original plant material to occurincreasing the amount of carbon dioxide released
© Copyright The PiXL Club Ltd, 2017
Ecology – AQA GCSE GraspIT - Questions2. Farming can decrease the biodiversity of an area. Explain how this can occur and suggest what can
be done to improve the situation. (4)Two relevant statements which both explain how the practice reduces biodiversity AND what could be done to reduce the impact.
Use of pesticides and herbicides will reduce biodiversity by killing animals or plants which the farmer does not want eating the crop. Use of GM crops which require less chemicals to be added. Protection of rare habitats by fencing them off.
Growing one crop over a large expanse of land – reintroduce hedges or natural boundaries to fields to enable wildlife to survive. Grow several crops in an area.
Use of fertiliser- run off into waterways can pollute the water and kill animals or plants which rely on the water. Use less artificial fertiliser and more natural fertiliser, reduce the amount that is applied so run off is more controlled.
D. Trophic levels in an ecosystem (biology only)
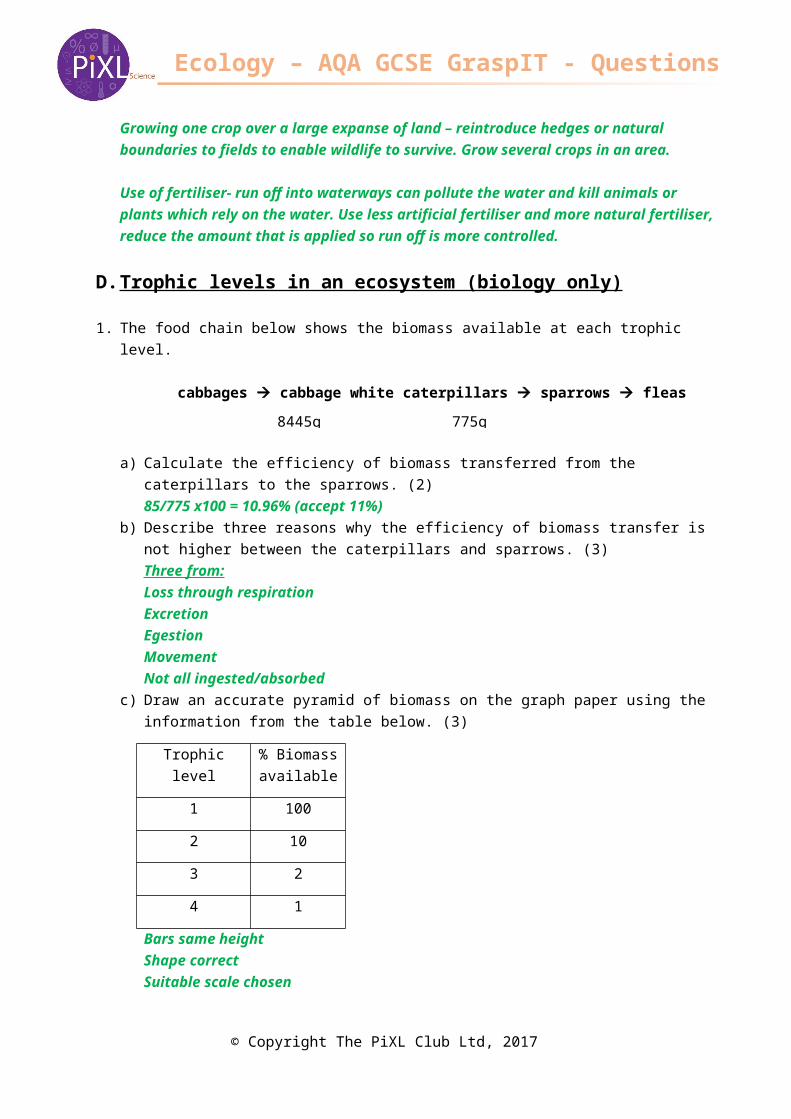
1. The food chain below shows the biomass available at each trophic level.
cabbages cabbage white caterpillars sparrows fleas
a) Calculate the efficiency of biomass transferred from the caterpillars to the sparrows. (2)85/775 x100 = 10.96% (accept 11%)
b) Describe three reasons why the efficiency of biomass transfer is not higher between the caterpillars and sparrows. (3)Three from:Loss through respirationExcretionEgestionMovementNot all ingested/absorbed
c) Draw an accurate pyramid of biomass on the graph paper using the information from the table below. (3)
Trophic level % Biomass available
1 100
2 10
3 2
4 1
Bars same heightShape correctSuitable scale chosen
© Copyright The PiXL Club Ltd, 2017
8445g 775g 85g 2g
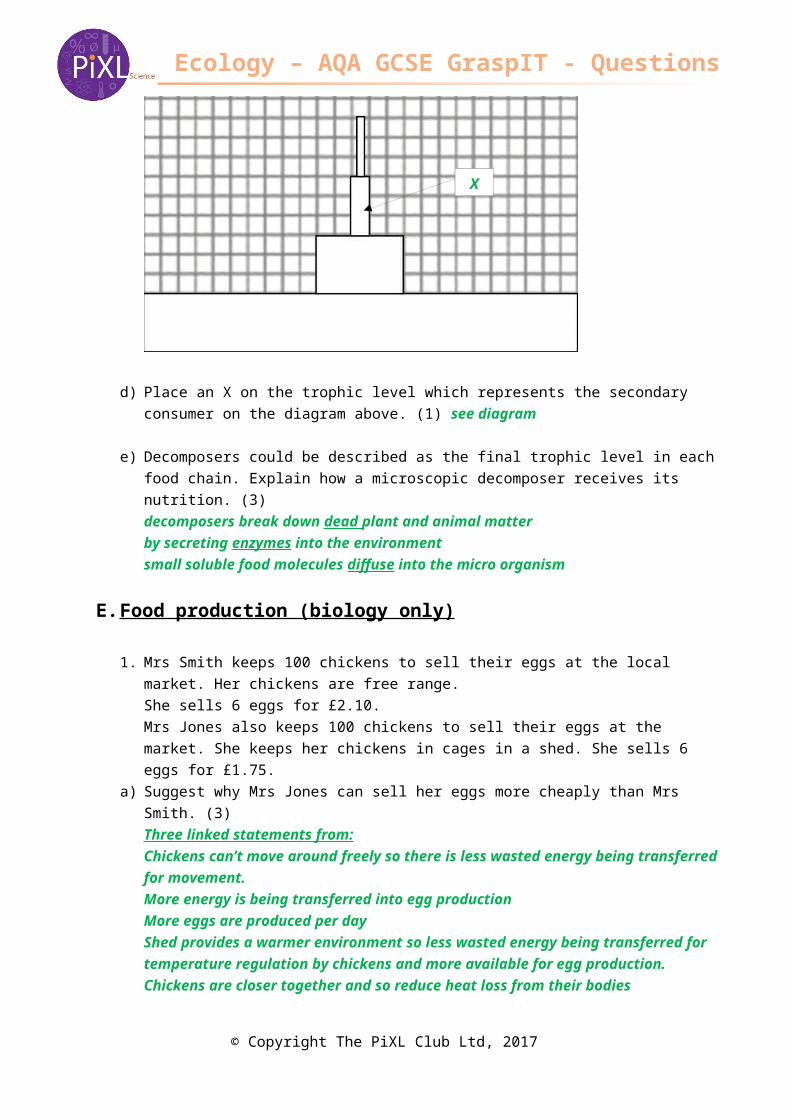
X
Ecology – AQA GCSE GraspIT - Questions
d) Place an X on the trophic level which represents the secondary consumer on the diagram above. (1) see diagram
e) Decomposers could be described as the final trophic level in each food chain. Explain how a microscopic decomposer receives its nutrition. (3) decomposers break down dead plant and animal matterby secreting enzymes into the environmentsmall soluble food molecules diffuse into the micro organism
E. Food production (biology only)
1. Mrs Smith keeps 100 chickens to sell their eggs at the local market. Her chickens are free range.She sells 6 eggs for £2.10. Mrs Jones also keeps 100 chickens to sell their eggs at the market. She keeps her chickens in cages in a shed. She sells 6 eggs for £1.75.
a) Suggest why Mrs Jones can sell her eggs more cheaply than Mrs Smith. (3)Three linked statements from:Chickens can’t move around freely so there is less wasted energy being transferred for movement.More energy is being transferred into egg productionMore eggs are produced per dayShed provides a warmer environment so less wasted energy being transferred for temperature regulation by chickens and more available for egg production.Chickens are closer together and so reduce heat loss from their bodies
b) Mrs Jones uses chicken feed which is high in protein and low in fibre. Explain how this helps increase the efficiency of biomass transfer. (2)Protein is required for growth so the higher the food content the faster the chicken will grow.Low fibre means less energy is transferred to digest the food
2. India is a country which is growing economically yet there is still widespread poverty and hunger.
© Copyright The PiXL Club Ltd, 2017
X
Ecology – AQA GCSE GraspIT - QuestionsIndia has one of the largest areas of cultivated land used for food production in the world. In 2012, India was the world’s largest producer of milk, pulses and spices but also had over 30% of its rural population living in poverty. The human population of India continues to increase year on year.
The table below shows the quantity of foods exported from India in mega tonnes (MT)
(Information taken from www.foodsecurityportal.org/india)
a) Calculate the increase in soybean exports from 2010 to 2013. Express the answer as a percentage. (2)2010 = 14 491MT2013= 138 609 MTIncrease is 138 609 – 14 491 = 124 118 MT (1 mark)
124 118 / 14 491 x100 = 856.5% increase in soybean exports (2 marks)
b) Suggest reasons why India exports food rather than use it to feed people who are starving in India. (2) Two linked statementsGet a higher price from another country so helps the economyUse the extra money for buying agricultural inputs/more seedPeople in India don’t want to eat soybean
Extended response questionc) A genetically modified plant called short-duration rice has been developed. These plants
produce smaller grains of rice in higher yields in 100 days. Unmodified plants take 130 days to produce a crop of larger rice grains but in smaller amounts. Suggest why this GM crop could improve food security in countries like India. (6)Level 3 (5-6 marks)Several varied and coherent explanations are given which logically link food security with short duration rice. Level 2 (3-4 marks)A number of relevant points made linking food security and short grain rice usually in a logical sequenceLevel 1 (1-2 marks)Some relevant points made regarding food security or short grain rice with no logical structure.
Biology content (or any other reasonable suggestions which link to food security)Can produce more rice in a shorter time so can sustain food availability.Higher yielding plants mean the land is being used as efficiently as possible for food production.
© Copyright The PiXL Club Ltd, 2017
Ecology – AQA GCSE GraspIT - QuestionsCan grow more than one crop a year so increasing amount of food available in a year.Could export some rice because more is produced and keep the rest for local use.Money from the exports could buy new seed/machinery/animals.If one crop fails due to pests/pathogens/poor climate conditions there is time to sow another crop in the year and increase chance of producing food for the population.The increasing birth rate means the country needs to produce more food per year with the same amount of land. Short duration rice enables this to happen.
© Copyright The PiXL Club Ltd, 2017