Embed Size (px)
Citation preview
Study of Ambient Air Quality Status on Urban Roads using Air Quality Index -A Case of Jaipur City (Rajasthan, India)
Jayshri Kala a , Prof. Gunwant Sharma b, Prof. Sudhir Kumar b, Dr. Satish Pipralia c
(a) Junior Scientific Officer, Rajasthan State Pollution Control Board, Jaipur, Rajasthan
(b) Department of Civil Engineering, Malaviya National Institute of Technology Jaipur
(c) Department of Architecture and Planning, Malaviya National Institute of Technology Jaipur
Corresponding author, E mail: [email protected]
ABSTRACT
An attempt has been made in this investigation to ascertain ambient air quality on major arterial
roads of Jaipur city in the form of Air Quality Index (AQI). Monitoring stations were set up at
thirty five strategic locations on all arterial roads of the study area after gaining knowledge
about their traffic characteristics and analyzed the air samples from various monitoring
locations, the results are being compared with permissible standards as specified in Gazette of
India Notification Extraordinary Part III, Section-4, Year 2009 and subsequently computed the
air quality index. The results reveal that gaseous pollutants such as SO2 and NOx are within the
permissible limits and particulate matter is the predominant cause of air pollution in the study
area. More than half the total numbers of locations have severe air pollution while another one-
third suffer from heavy air pollution.
Key Words: Jaipur City, Ambient air quality, Air quality index
Acknowledgements:
1. Central Pollution Control Board, New Delhi, India
2. Dr. D. N. Pandey, Member Secretary; Rajasthan State Pollution Control Board, Jaipur,
Rajasthan, India.
1. Introduction
The presence of high density of population and industries in the cities lead to vehicular,
domestic, and industrial emissions that subsequently affect the urban environmental conditions
adversely. Air quality scenario in most of the Indian cities presents a grim picture as more than
90 per cent of the national monitoring stations have recorded particulate concentrations
exceeding the WHO recommended guidelines (TERI 2003). Urban transport is the single
largest cause of air pollution in Indian cities (IIR 2006). In the light of the above facts an
attempt has been made in this investigation to study the air pollution due to urban transport in
Jaipur city.
2. Study Area
Jaipur, the capital city of Rajasthan State in India, is the tenth most populous city of the
country. It is located at 260 54’N latitude and 75049’E longitude and experiences a continental
type of climate. The city witness extreme temperatures both in summer as well as in winters
and low to moderate relative humidity. The highest mean monthly maximum temperature of
40.6º C is recorded in May and the lowest mean monthly temperature of 8.3º C is recorded in
January. The city is well connected by rail, road, and air transportation network to rest of the
country. The city lies on Ahmedabad rail route of Western railways and is connected with three
national highways. While two national highways, i.e., NH-8 and NH-11 pass through the city,
NH-12 leading to Jabalpur starts from the city.
The transport system of Jaipur city is mainly road based. The city is served by eleven major
arterial spines. Seven out of these eleven arterial roads witness traffic volume in access of the
traffic carrying capacity, which implies heavy traffic flow on these roads during peak hours.
Heterogeneity of traffic, lack of lane discipline, inadequate public transportation system, and
exponential increase in personal modes of transport are some of reasons for congestion on these
roads. Two-wheeler is the predominant vehicle mode in Jaipur city and its share in total number
of registered vehicles is at 76 per cent, followed by Four-wheelers, which constitute 16 per
cent, and buses constitute only one per cent of the total registered vehicles in Jaipur city (CMPJ
2008). The growth trend of registered vehicles in the city reveals that the average annual
growth of passenger vehicles stands at 14.26 per cent for the period 2001-2011 (RTO, Jaipur).
3. Materials and Methods
Monitoring stations were set up at thirty five strategic locations on all arterial roads of the study
area after gaining knowledge about their traffic characteristics. The monitoring was conducted
by a team of central laboratory of the State Pollution Control Board of Rajasthan and the
investigator being the member of the monitoring team collected and analyzed the air samples
from various monitoring locations. Sampling was done in the summer months (March-June
2011 ) with a view to cover the peak traffic hours of morning (9:00AM-1:00PM) and evening
(4:00PM - 8:00 PM) of the day. The APM 460 NL respirable dust sampler manufactured by
Envirotech Ins. Pvt. Ltd. was used for sampling purpose. The samplers were installed in the
breathing zone (1.5 m). The flow rate of air was kept in the range of 1.0 -1.3 m3/min. The size
classification of the particulate was achieved through a cyclone installed in the sampler which
separates the respirable (PM10) and non-respirable fractions. The particle sized less than10
Figure 1: Description of the Study Area
microns were collected on the filter papers; whereas, SPM larger than 10 microns was collected
in the separate sampling bottle, also called as dust collector. Further, the air was passed through
the impingers, housed in separate enclosure containing absorbing solution for SO2 and NO x in
series, at a flow rate 1.00 liter/min. A constant temperature was also maintained during
sampling with the help of an icebox and samples were stored at a temperature below 5C.
Modified West and Gaeke Method has been used for computing SO2 while Jacob and
Hochheiser (Modified Na-Arsenite Method) Method has been used for computing NOx in the
collected samples. The air quality parameters such as Suspended particulate matter (SPM),
Respirable suspended particulate matter (RSPM), SO2 and NOx have been studied in this
investigation and the results are presented in the subsequent paragraphs, in sequel. The details
of locations and the values of air quality parameters along with their air quality index is
presented in Appendix-1
4. Suspended particulate matter (SPM)
Suspended matter is of a major concern and they typically consist of dust, fumes, and smoke.
These particles when breathed in cause lung damage and respiratory problems. It is therefore,
considered important to study this air quality parameter and the results are presented in Table 1,
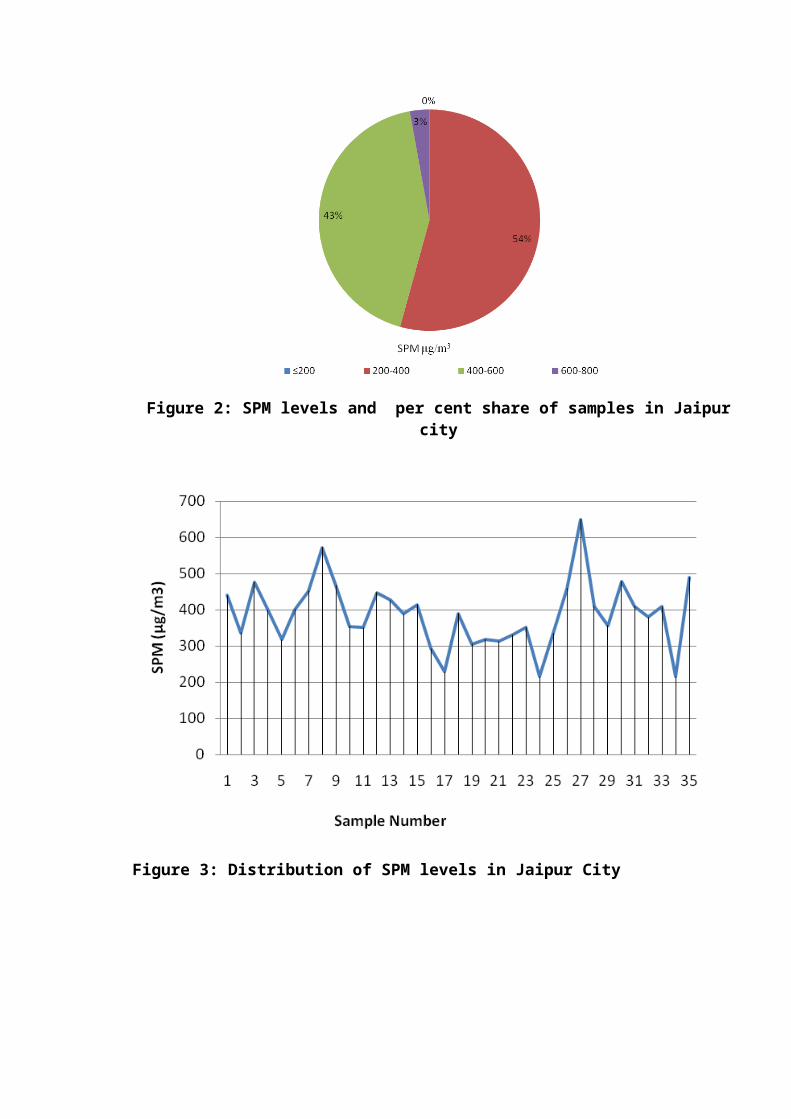
Figure 2 and Figure 3
It is evident from the Table1 and Figure 2 that a little more than half (54 per cent) the total
number of locations have SPM level between 200-400 µg/m3 while another two-fifth (43 per
cent) locations have SPM level between 400-600 µg/m3 . It is observed further that Transport
Nagar has the maximum SPM level of 650 µg/m3 while Figure 3 reveals that there is no
location which has SPM level less than or equal to 200 µg/m3 . It is therefore important to note
that all locations in the study area have SPM level beyond the permissible limits as specified in
the standards.
Table 1: Distribution of SPM Level in Jaipur City
Serial No. SPM µg/m3 No. of Samples Per cent Distribution
1 ≤200 0 02 200-400 19 543 400-600 15 434 600-800 1 3
Total 35 100
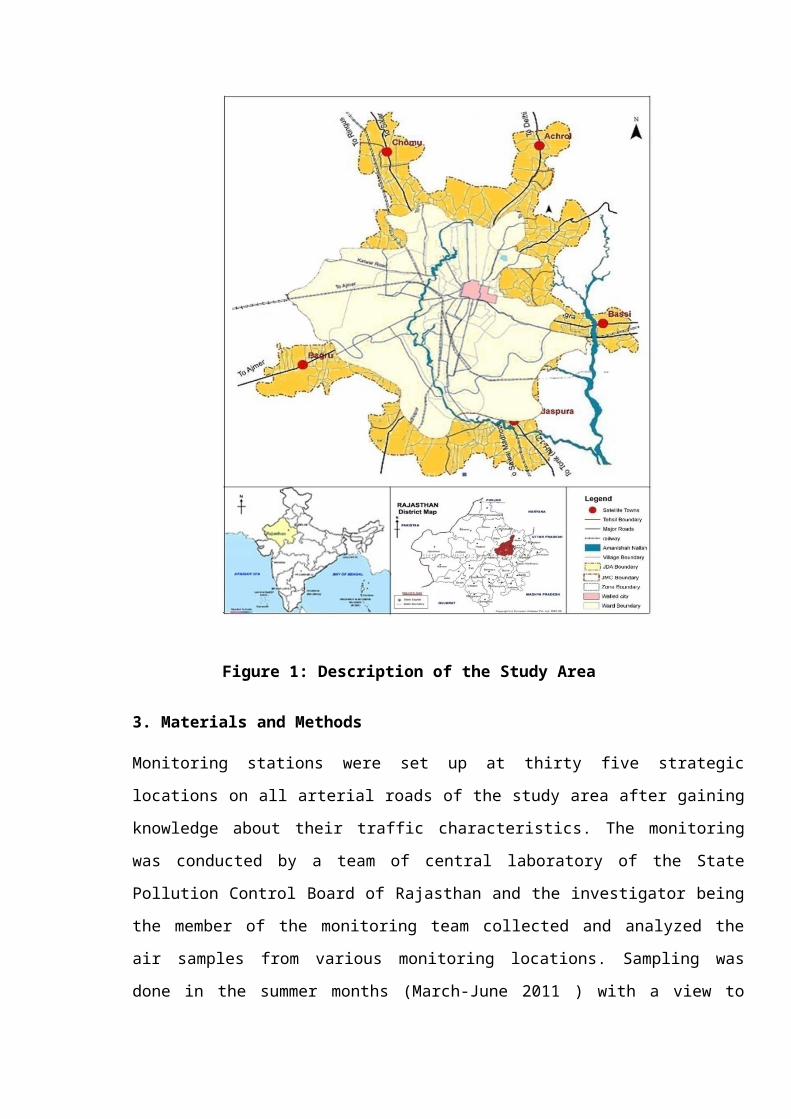
Figure 2: SPM levels and per cent share of samples in Jaipur city
Figure 3: Distribution of SPM levels in Jaipur City
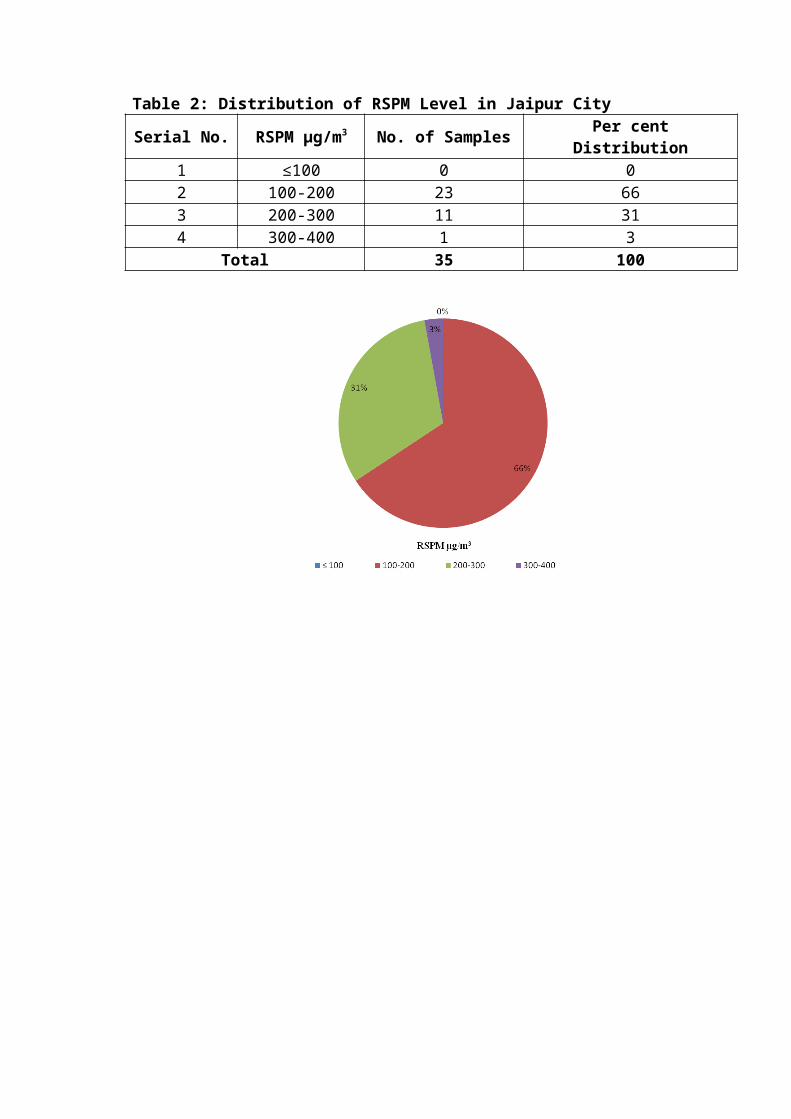
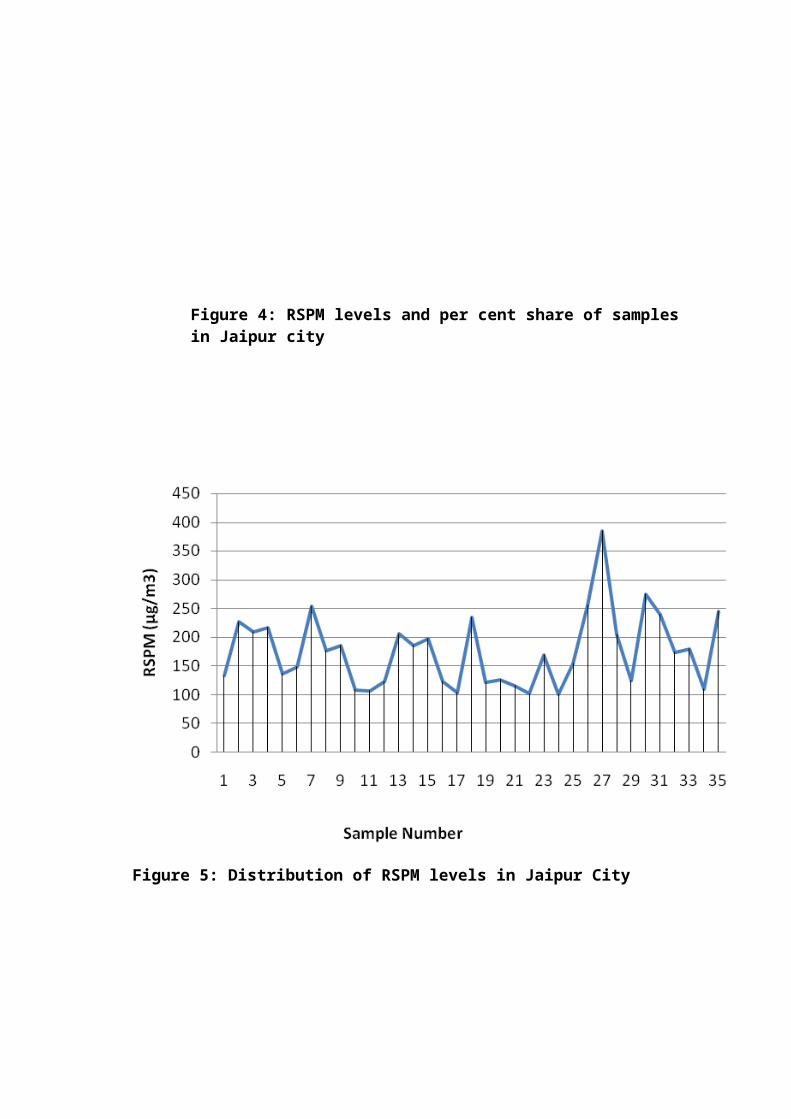
5. Respirable suspended particulate matter (RSPM)
Respirable suspended particulate matter (RSPM) is the suspended particles less than 10
micrometer. As these particulates are small enough to be breathed in readily, they are even
more detrimental to human health as compared to suspended particulate matter. The particulate
matter less than 2.5 micrometers or less are specifically more harmful as they cannot be
expelled from the body, therefore, they cause long-term ailments such as lung cancer, asthma
and acute respiratory symptoms, chronic bronchitis, some type of birth defects as well as
premature deaths. Given the above facts, it was considered to examine this air quality
parameter and the results are presented in Table 2 and Figure 4 and Figure 5.
The ambient air of the study area ranged between 101-385 µg/m3. It is observed from the Table
2 and Figure 4 that two-third (66 per cent) of the total locations have RSPM level between 100-
200 µg/m3 while another three-tenth (31 per cent) locations have RSPM level between 200 -
300 µg/m3 and only one location (Transport Nagar intersection ) has RSPM level more than
300 µg/m3. As per the Gazette of India Notification Extraordinary Part III, Section-4, Year
2009. Standard for respirable suspended particulate matter is 100µg/m3; it is important to note
that no location has the RSPM level within the standard while 23 locations of the study areas
are having RSPM level twice of the prescribed limit and 12 locations are having three times
higher RSPM level than the standards.
Table 2: Distribution of RSPM Level in Jaipur City
Serial No. RSPM µg/m3 No. of Samples Per cent Distribution
1 ≤100 0 02 100-200 23 663 200-300 11 314 300-400 1 3
Total 35 100
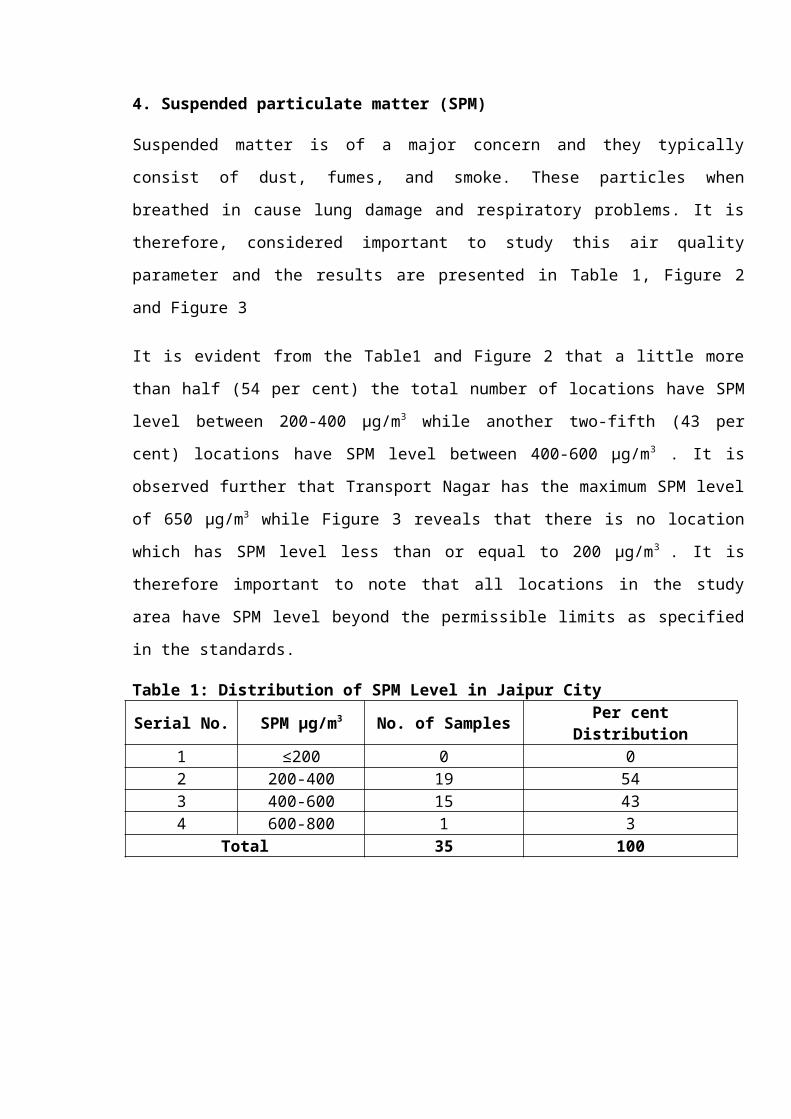
Figure 5: Distribution of RSPM levels in Jaipur City
6. Sulphur dioxide (SO2)
Sulphur di oxide in the ambient air causes irritation of the eyes, nose, throat and skin. Its irritant
properties are caused due to the rapidity with which it forms sulfurous acid on contact with
moist memebranes. Its prolonged exposure causes varied kinds of acute respiratory symptoms
such as aggravated coughing inflammation of the respiratory tract etc.; having the above
knowledge, it was considered important to study this air quality parameter and the results are
presented in Table 3 and Figure 6 and Figure 7.
Figure 4: RSPM levels and per cent share of samples in Jaipur city
SO2 levels in the ambient air of the study area ranged between 4.40-9.10 µg/m3. It is observed
fom the Table and Figure that half (51 per cent) the total number of monitored locations has
SO2 concentration level of 6.00-8.00 µg/m3 while little more than two-fifth(43 per cent)
locations have 4.00-6.00 µg/m3 SO2 concentration and the remainder locations has SO2 levels
more than 8.00 µg/m3. The maximum SO2 concentration is observed Near Riddhi Siddhi on
Gopalpura Byepass and Railway Station, where the level of concentrations is 8.19µg/m3,
9.10µg/m3, respectively.
Table 3: Distribution of Sulphur dioxide (SO2) Level in Jaipur City
Serial No. RSPM µg/m3 No. of Samples Per cent Distribution
1 4.00-6,00 15 432 6.00-8.00 18 513 8.00-10.00 02 06
Total 35 100
Figure 6: SO2 levels and per cent share of samples in Jaipur city
Figure 7: Distribution of SO2 levels in Jaipur City
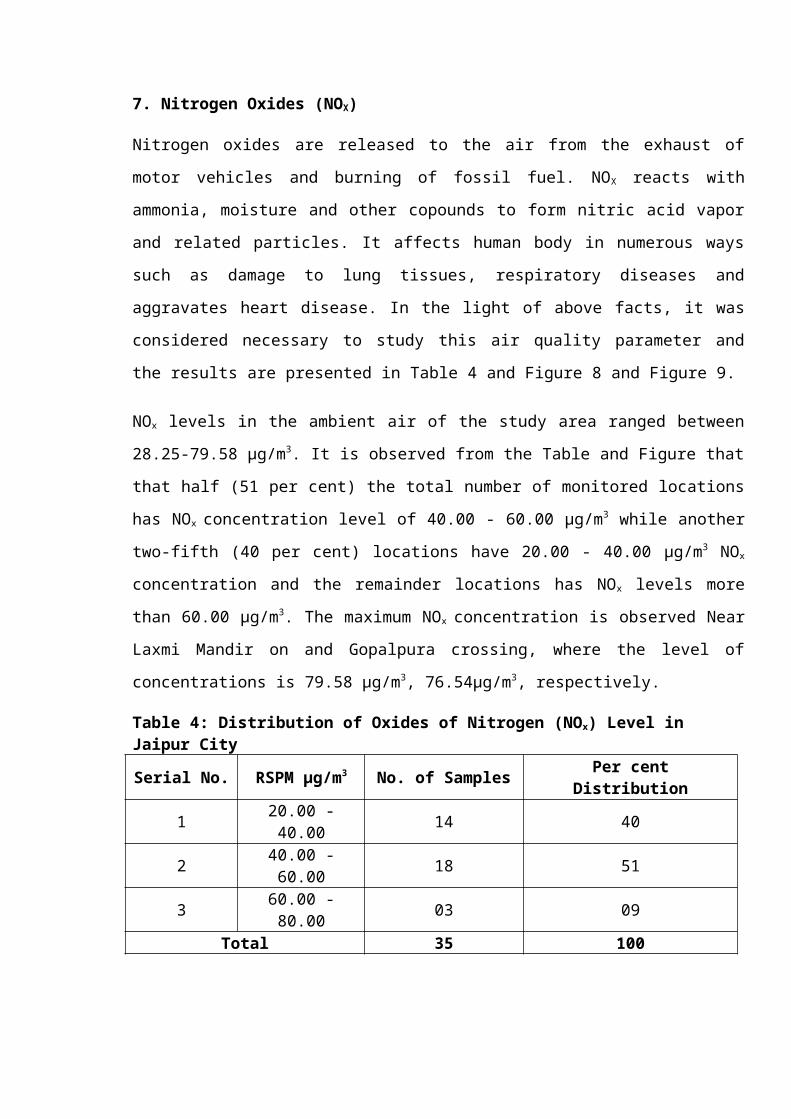
7. Nitrogen Oxides (NOX)
Nitrogen oxides are released to the air from the exhaust of motor vehicles and burning of fossil
fuel. NOX reacts with ammonia, moisture and other copounds to form nitric acid vapor and
related particles. It affects human body in numerous ways such as damage to lung tissues,
respiratory diseases and aggravates heart disease. In the light of above facts, it was considered
necessary to study this air quality parameter and the results are presented in Table 4 and Figure
8 and Figure 9.
NOx levels in the ambient air of the study area ranged between 28.25-79.58 µg/m3. It is
observed from the Table and Figure that that half (51 per cent) the total number of monitored
locations has NOx concentration level of 40.00 - 60.00 µg/m3 while another two-fifth (40 per
cent) locations have 20.00 - 40.00 µg/m3 NOx concentration and the remainder locations has
NOx levels more than 60.00 µg/m3. The maximum NOx concentration is observed Near Laxmi
Mandir on and Gopalpura crossing, where the level of concentrations is 79.58 µg/m3,
76.54µg/m3, respectively.
Table 4: Distribution of Oxides of Nitrogen (NOx) Level in Jaipur City
Serial No. RSPM µg/m3 No. of Samples Per cent Distribution
1 20.00 - 40.00 14 40
2 40.00 - 60.00 18 513 60.00 - 80.00 03 09
Total 35 100
Figure 8: NOx levels and per cent share of samples in Jaipur city
Figure 9: Distribution of Oxides of Nitrogen (NOx) Level in Jaipur City
Having analyzed the concentration of individual air pollutants , an attempt has further been
made to compute air quality index of various locations in the study area and is presented in the
subsequent section.
8. Air Quality Index
The cumulative effect of concentration of individual pollutants in ambient air is often expressed
through a single value in the form of air quality index (AQI). The index has been computed by
using the following equation (Anand, Ashish and Upendra Pandel, 2011):
AQI = 1/4{(SPMactual/SPMstandard)+(RSPMactual /RSPMstandard)+(SO2 actual/SO2 standard)+(SO2 actual / SO2
standard) } x 100
The AQI values so derived was divided into five categories (Rao and Rao 1989) i.e. 0 -25 =
Clean Air, 26-50 = Light air pollution, 51-75 = Moderate air pollution, 76-100 = Heavy air
pollution and the value above 100 signifies severe air pollution; and the results are presented in
Table 5 and Figure 10 and Figure 11.
Computation results reveal that AQI values in the study area range from 58.38 to195.09. It is
observed from the Table 5 and Figure 10 and Figure 11 that all the locations have the air
quality index values of more than 50 and the one-sixth (17 per cent) of the total number of
locations have air quality index between 51-75 range, which indicates moderate air pollution,
while three-tenth (31 per cent) locations have air quality index value between 76-100 range,
which signifies the heavy air pollution in those locations. It is surprising to know that more
than half (52 percent) of the total number of locations has index value above 100, which
implies severe air pollution in those locations.
Table 5: Range and Distribution of Air Quality in Jaipur CitySerial No. Range Category No.of location Per cent Distribution
1 0-25 Clean air 0 02 26-50 Light air pollution 0 0
3 51-75 Moderate air pollution 6 17
4 76-100 Heavy air pollution 11 31
5 >100 Severe air pollution 18 52
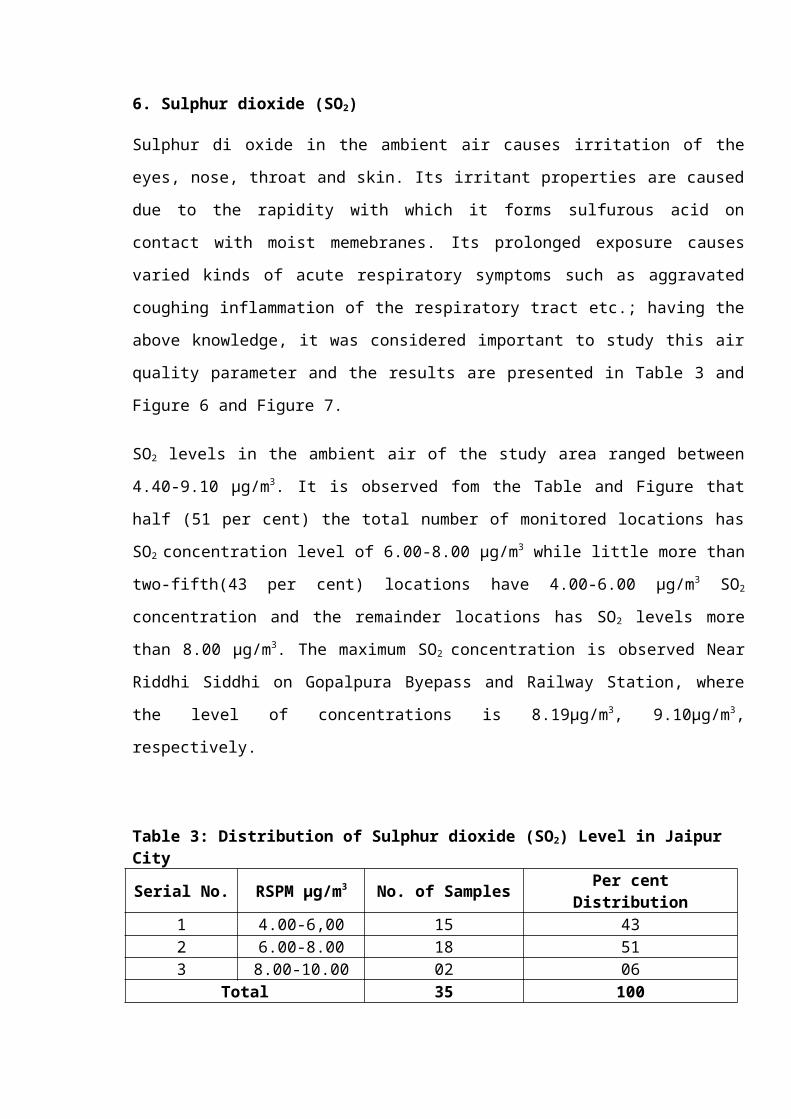
Figure 10: Air Quality Index and per cent share of samples in Jaipur city
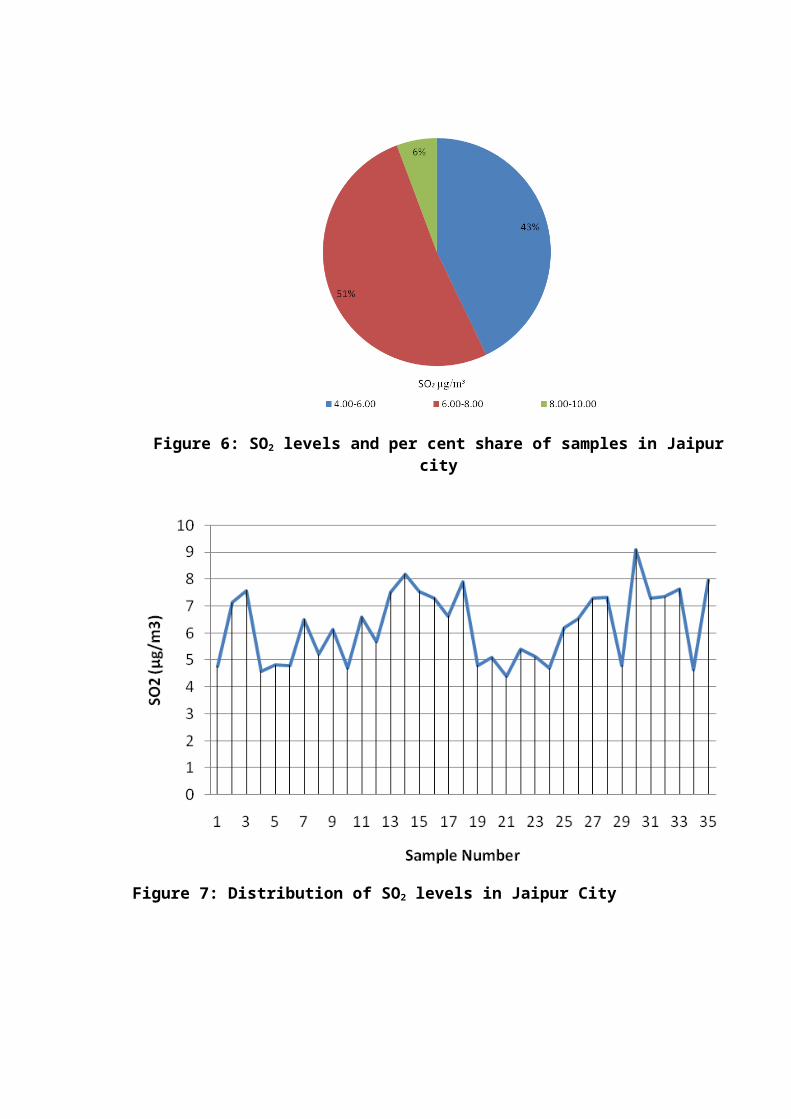
Figure 11: Distribution of Air Quality in Jaipur City
9. Conclusion
An attempt has been made in this investigation to ascertain air quality on major arterial roads of
Jaipur city. Monitoring stations were set up at thirty five strategic locations on all arterial roads
of the study area after gaining knowledge about their traffic characteristics and analyzed the air
samples from various monitoring locations, the results are being compared with permissible
standards as specified in Gazette of India Notification Extraordinary Part III, Section-4, Year
2009 and subsequently computed the air quality index. The results reveal that more than half
the total numbers of locations have severe air pollution while another one-third (31 per cent)
suffer from heavy air pollution. However, it is largely attributed to high SPM and RSPM levels.
Nevertheless, study quantifies the pollution level arising due to growing number of vehicles,
which is the predominant source of air pollution in the study area. It follows from the research
that adequate pollution abatement measures coupled with vehicle retirement policy is essential
to bring down pollution levels in the study area.
References
1. Comprehensive Mobility Plan Jaipur 2008, Jaipur development Authority, Jaipur.2. Office Records, Rajasthan Transport Office 20113. Rao M N, Rao H V N 1989, Air Pollution, Tata McGraw Hill Publishing Company
Limited, New Delhi.4. Kumar. A., Garg A., Pandel U., 2011:A Study of Ambient Air Quality Status in Jaipur
City (Rajasthan, India), Using Air Quality Index. Nature and Science, 2011;9(6).5. Central Pollution Control Board, MOEF 2009, Gazette of India Notification
Extraordinary Part III, Section-4, Year 20096. Tata Energy Research Institute (TERI), 2003, Green India 2047, Renewed, New Delhi7. 3i Network, 2006, India Infrastructure Report: Urban Infrastructure, Oxford University
Press, New Delhi, India8. World Health Organization, 1999, Guidelines for Air Quality.9. State Pollution Control Board Annual Reports of various years.
APPENDIX-1
COMPARATIVE STATEMENT OF AIR QUALITY RESULTS AT DIFFERENT LOCATIONS, JAIPUR CITYS.No. Place of Collection ↓ RSPM SPM SO2 NOX
Standard → 100 (µg/m3) (Previously 200 µg/m3) 80 (µg/m3) 80 (µg/m3) AQI
1 OTS Crossing,J.L.N Marg 133 440 4.77 33.26 100.13
2 North-West side of Khanda Manak Chauk Bari Choupar 227 336 7.14 48.78 116.23
3 Police Booth Rambagh Circle 210 477 7.58 41.84 127.57
4 Mahila Hospital, Sanganeri Gate 217 398 4.59 40.02 117.945 Sanganeri Gate 137 317 4.82 49.45 90.836 Narayan singh circle 149 401 4.81 34.01 99.517 Gopal Pura crossing 254 452 6.52 76.54 145.968 New Sanganer Road Sodala 177 572 5.21 32.49 127.539 Chhoti Chaupur 186 468 6.14 45.09 121.01
10 Ram Nivas Garden 109 354 4.72 35.51 84.07
11 Maharao Shekha circle (Chomu Pulia) 107 351 6.61 48.96 87.99
12 22 Godam (Jyotibaphoole circle) 124 447 5.69 33.43 99.10
13 After Bridge, Gopalpura Byepass, Jaipur (Raj.) 206 426 7.52 44.40 121.03
14 Near Riddhi Siddhi, Gopalpura Byepass, Jaipur (Raj.) 186 389 8.19 43.58
111.39
15 Near Gurjar ki Thadi, Gopalpura Byepass, Jaipur (Raj.) 198 414 7.56 42.51
116.78
16 Near B-2 Byepass, Near JVVNL Office, Jaipur (Raj.) 124 292 7.30 38.94 81.87
17 After Tonk Road Crossing, B-2 Byepass, Jaipur(Raj.) 104 227 6.63 33.56 67.04
18 Collectrate Circle, Jaipur 235 390 7.90 42.10 123.13
19 Shastri Nagar Circle, Near Kanwatiya Hospital, Jaipur. 122 305 4.80 28.39 79.00
20 Vaishali Nagar & Khatipura Intersection, 127 318 5.10 32.10 83.13
Jaipur.21 NBC Intersection, Jaipur. 116 313 4.40 31.20 79.25
22 Sanjay Circle, Jhotwara, Jaipur. 102 330 5.40 42.69 81.7823 Subhash Chauk, Jaipur. 170 352 5.12 40.18 100.6624 Nahari ka Naka, Jaipur. 101 215 4.70 31.10 63.3125 Delhi Byepass, Jaipur. 155 335 6.20 28.25 91.3926 Near Laxmi Mandir, Jaipur. 256 458 6.54 79.58 148.16
27 Transport Nagar Intersection, Jaipur. 385 650 7.29 69.53 201.5128 Ajmerigate, Jaipur. 205 410 7.34 43.78 118.4829 Statue Circle, Jaipur. 125 356 4.80 32.50 87.4130 Railway Station, Jaipur. 275 478 9.10 52.52 147.7631 Govt. Hostle, Jaipur. 240 410 7.30 45.46 127.7432 After Sanganer Pulia,Jaipur. 174 380 7.35 46.21 107.74
33 Before Sanganer Pulia, Jaipur. 180 408 7.64 48.74 113.6234 Intersection Phagi, Jaipur 110 215 4.64 28.74 64.8135 Chandpole,Jaipur 245 490 7.98 45.34 139.16


![STUDY NOTES: GENERAL KNOWLEDGEprepareforchemistry.weebly.com/.../study_notes.docx · Web viewSTUDY NOTES: GENERAL KNOWLEDGE] ... American Open Tennis Novac Jokkowiter. ... Pakistan](https://img.pdfslide.us/doc/110x75/5a70b6e07f8b9a9d538c3a07/study-notes-general-knowledgeprepareforchemistryweeblycomstudynotesdocxdoc.jpg)