Embed Size (px)
Citation preview
Sinclair Community CollegeContinuous Improvement Annual Update 2012-13
Please submit to your dean and the Provost’s Office no later than Oct. 1, 2013
Department: 0575 – Industrial Engineering, 0576 – Operations Technology
Year of Last Program Review: FY 2011-2012
Year of Next Program Review: FY 2016-2017
Section I: Department Trend Data, Interpretation, and Analysis
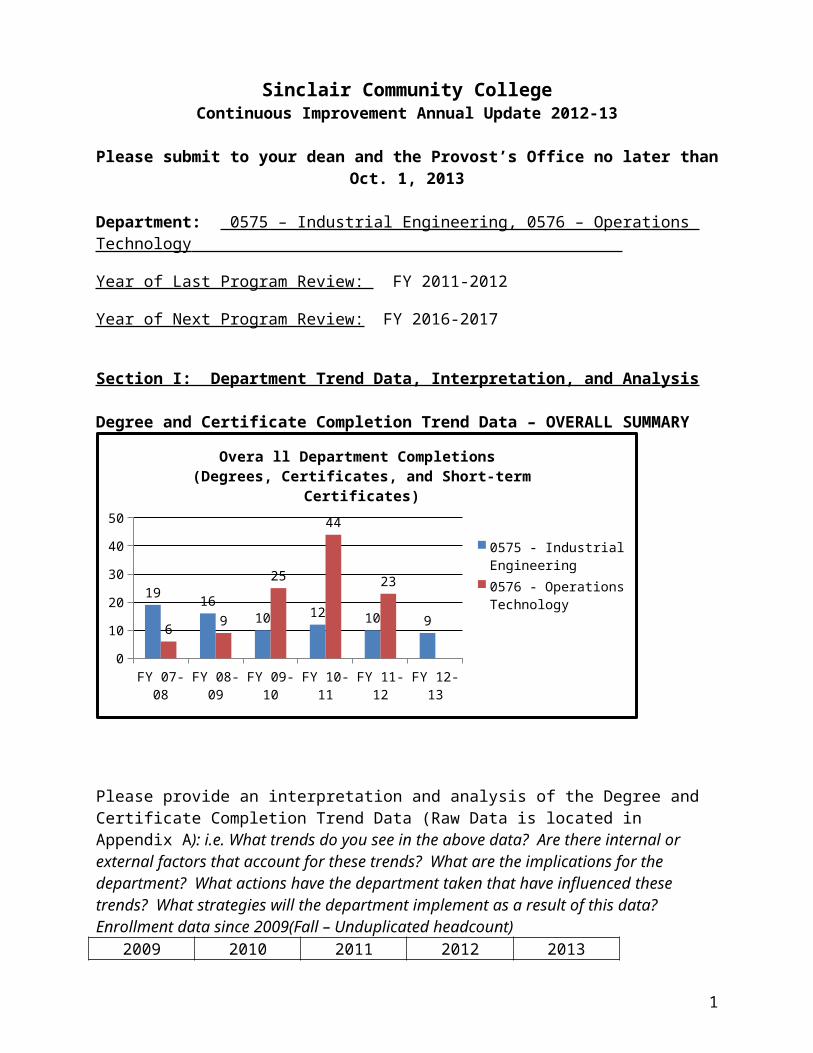
Degree and Certificate Completion Trend Data – OVERALL SUMMARY
FY 07-08 FY 08-09 FY 09-10 FY 10-11 FY 11-12 FY 12-1305
101520253035404550
1916
10 12 10 96
9
25
44
23
Overa ll Department Completions (Degrees, Certificates, and Short-term Certificates)
0575 - Industrial Engineering0576 - Operations Technology
Please provide an interpretation and analysis of the Degree and Certificate Completion Trend Data (Raw Data is located in Appendix A): i.e. What trends do you see in the above data? Are there internal or external factors that account for these trends? What are the implications for the department? What actions have the department taken that have influenced these trends? What strategies will the department implement as a result of this data? Enrollment data since 2009(Fall – Unduplicated headcount)
2009 2010 2011 2012 2013298 220 170 151 204
The graduation numbers for both degrees and certificates have been:08-09 09-10 10-11 11-12 12-13
Degrees 8 16 21 21 7Certificates 25 18 27 16 13Total degrees/Certificates
33 35 48 37 20
1
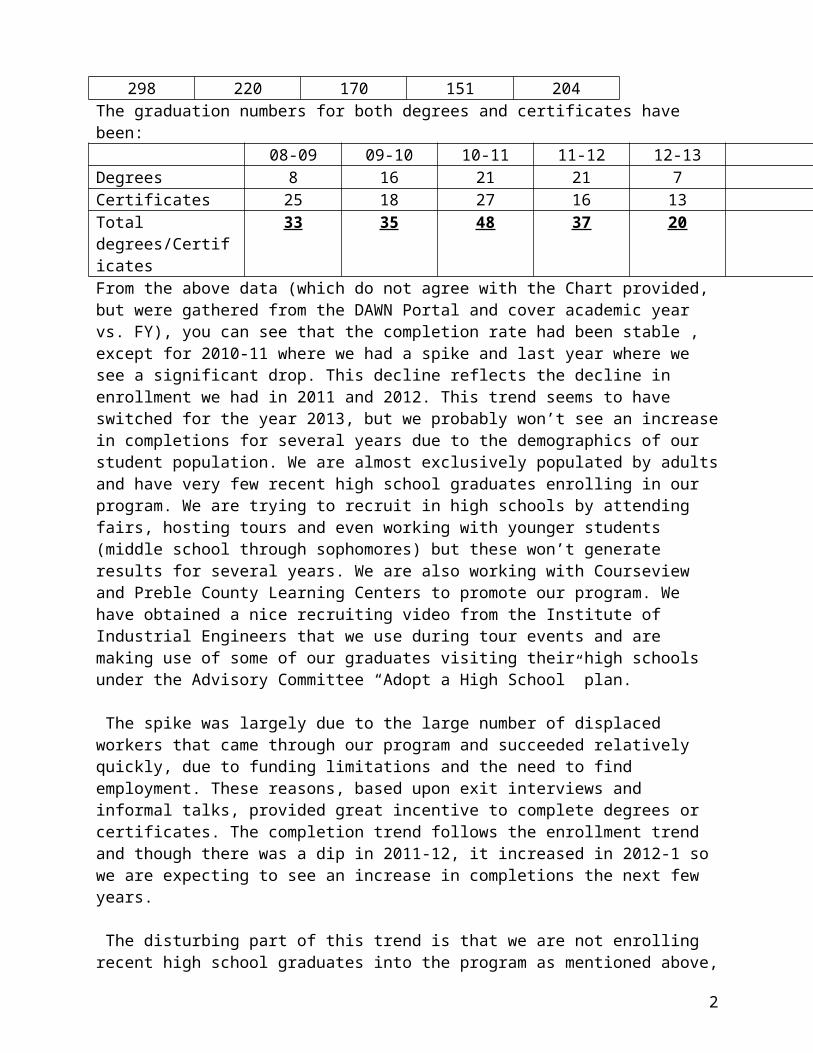
From the above data (which do not agree with the Chart provided, but were gathered from the DAWN Portal and cover academic year vs. FY), you can see that the completion rate had been stable , except for 2010-11 where we had a spike and last year where we see a significant drop. This decline reflects the decline in enrollment we had in 2011 and 2012. This trend seems to have switched for the year 2013, but we probably won’t see an increase in completions for several years due to the demographics of our student population. We are almost exclusively populated by adults and have very few recent high school graduates enrolling in our program. We are trying to recruit in high schools by attending fairs, hosting tours and even working with younger students (middle school through sophomores) but these won’t generate results for several years. We are also working with Courseview and Preble County Learning Centers to promote our program. We have obtained a nice recruiting video from the Institute of Industrial Engineers that we use during tour events and are making use of some of our graduates visiting their high schools under the Advisory Committee “Adopt a High School” plan.
The spike was largely due to the large number of displaced workers that came through our program and succeeded relatively quickly, due to funding limitations and the need to find employment. These reasons, based upon exit interviews and informal talks, provided great incentive to complete degrees or certificates. The completion trend follows the enrollment trend and though there was a dip in 2011-12, it increased in 2012-1 so we are expecting to see an increase in completions the next few years.
The disturbing part of this trend is that we are not enrolling recent high school graduates into the program as mentioned above, but are relying upon older adults who have some work experience and are trying to upgrade their skills for a new career. We, as a department, have offered more independent study classes to allow the displaced workers and working adults a chance to complete their degrees or certificates before their funding runs out or the jobs they are seeking are filled. This is not the way the system is designed, since most of our courses require hands-on activities in a team environment. The faculty took a large lead and provided virtually the same amount of face to face contact in most classes offered as independent study (due to low enrollment) as they would in normally run classes, for less compensation than normal. This leads us to try to gain enough enrollment to offer classes only in the normal mode. We are working closely with the people that service displaced workers and welcome these workers into our program, including Sinclair resources and The Job Center.
Since we recognize the need to attract younger, recent high school graduates into the career field (along with more minorities and women), we are targeting specific high schools with our Advisory Committee and their plan (generated through our “Compression Planning Session”) to “adopt a high school” in which an Advisory member, a faculty member, and a recent graduate (preferably from the school being visited) to visit the school and make a sales pitch to students in the engineering or related programs. We are also talking to students in DEV classes that are not sure about their majors, along with trying to work with other Engineering Technology programs to encourage them to have some OPT classes on their curriculum. This has been successful with CAM and Automotive. We are working with Admissions whenever possible to participate in High School career days and working with the Tech Prep office to generate an OPT Pathway for Tech Prep students. We were working with the DRMA
2
(Dayton Region Manufacturers Association) using their BOTS program (student competition with custom-built, remote-controlled robots) as a way to get to students, but DRMA dropped BOTS , but it was picked up by some local industries. We are looking to reinstitute the old OPT manufacturing contest in a modified, one day format to show students what a career in OPT is all about. The BOTS may be a part of that program, and I have one of our Adjuncts using this in a class he is teaching at Ponitz.
We have surveyed our current students to see how they were attracted to the program. The vast majority (70+%) said it was through word of mouth referral from friends or family. Some said it was from the website and some mentioned Career Services/Advising. As a group (faculty, students, Advisory Committee) we are working these areas. One of the disturbing finds was the The Jobs center was refusing funding for students seeking degrees or certificates in Quality related fields, stating there were no opportunities available in the Dayton Area, contrary to what our data show. We are working with The Jobs Center to fix this.
Another disturbing trend, especially in light of the new State of Ohio funding formulas is the number of students (adults) taking selected OPT courses for the content they contain, not necessarily seeking a certificate or a degree. We are trying to convince them to expand their outlook, but this has been difficult. What has been successful is their referring the friends and co-workers to take our courses.
3
Course Success Trend Data – OVERALL SUMMARY
FY 07-08 FY 08-09 FY 09-10 FY 10-11 FY 11-12 FY 12-13 0.0%
10.0%20.0%30.0%40.0%50.0%60.0%70.0%80.0%90.0%
100.0%100.0%
0.0% 0.0% 0.0% 0.0% 0.0%
Overall Department Success Rates
0575 - Industrial EngineeringLHSCOLLEGEWIDE
FY 07-08 FY 08-09 FY 09-10 FY 10-11 FY 11-12 FY 12-13 0.0%
10.0%20.0%30.0%40.0%50.0%60.0%70.0%80.0%90.0%
100.0%89.6% 87.8% 87.6% 88.8% 89.2% 88.1%
Overall Department Success Rates
0576 - Operations TechnologyLHSCOLLEGEWIDE
Please provide an interpretation and analysis of the Course Success Trend Data (Raw Data is located in Appendix A). Looking at the success rate data provided in the Appendix for each course, please discuss trends for high enrollment courses, courses used extensively by other departments, and courses where there have been substantial changes in success.
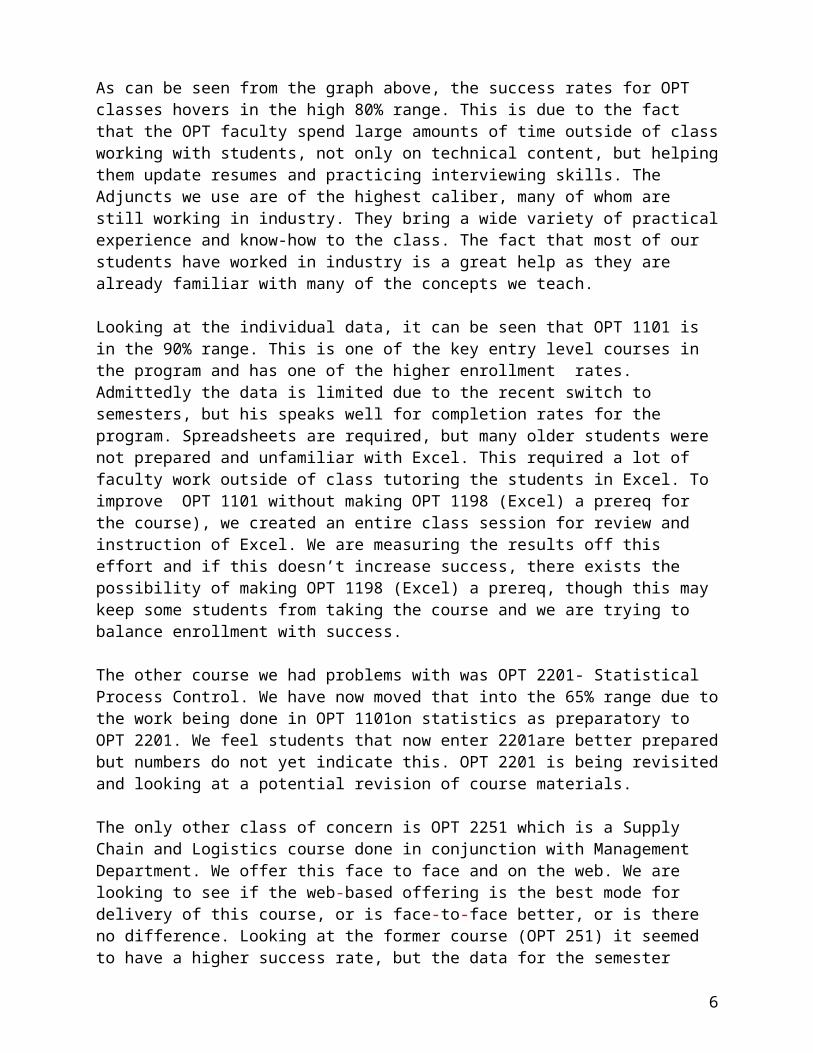
As can be seen from the graph above, the success rates for OPT classes hovers in the high 80% range. This is due to the fact that the OPT faculty spend large amounts of time outside of class working with students, not only on technical content, but helping them update resumes and practicing interviewing skills. The Adjuncts we use are of the
4
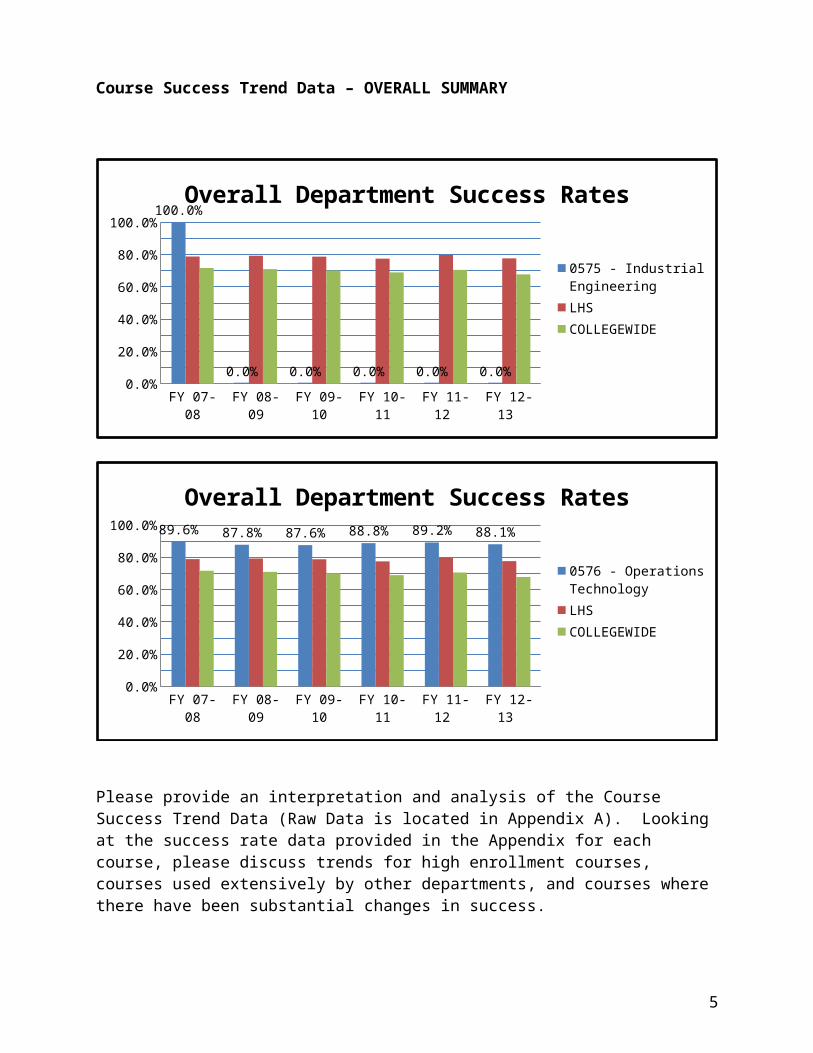
highest caliber, many of whom are still working in industry. They bring a wide variety of practical experience and know-how to the class. The fact that most of our students have worked in industry is a great help as they are already familiar with many of the concepts we teach.
Looking at the individual data, it can be seen that OPT 1101 is in the 90% range. This is one of the key entry level courses in the program and has one of the higher enrollment rates. Admittedly the data is limited due to the recent switch to semesters, but his speaks well for completion rates for the program. Spreadsheets are required, but many older students were not prepared and unfamiliar with Excel. This required a lot of faculty work outside of class tutoring the students in Excel. To improve OPT 1101 without making OPT 1198 (Excel) a prereq for the course), we created an entire class session for review and instruction of Excel. We are measuring the results off this effort and if this doesn’t increase success, there exists the possibility of making OPT 1198 (Excel) a prereq, though this may keep some students from taking the course and we are trying to balance enrollment with success.
The other course we had problems with was OPT 2201- Statistical Process Control. We have now moved that into the 65% range due to the work being done in OPT 1101on statistics as preparatory to OPT 2201. We feel students that now enter 2201are better prepared but numbers do not yet indicate this. OPT 2201 is being revisited and looking at a potential revision of course materials. The only other class of concern is OPT 2251 which is a Supply Chain and Logistics course done in conjunction with Management Department. We offer this face to face and on the web. We are looking to see if the web-based offering is the best mode for delivery of this course, or is face-to-face better, or is there no difference. Looking at the former course (OPT 251) it seemed to have a higher success rate, but the data for the semester offerings is a little lower than expected, but the sample size is small. We expect this to reach pre-semester levels.
The courses used by other departments (besides OPT 2251) are OPT 1100 (Metrology), OPT 2211 (Industrial Risk Management), OPT 2205 (Manufacturing Processes), OPT 2206 (Value Analysis) and OPT 1130 (Lean Operations) all have high success rates and generally positive feedback about content and instructors. We plan no substantial changes there.
Being a small department with dedicated experienced faculty, we take the time to get to know our students, help them through difficulties and generally provide a feeling of “family”. That is why we maintain such a high degree of contact with our graduates, but we will be using the services and surveys conducted by RAR to support and enhance the informal data we have and are gathering. We in fact, were contacted by RAR to see if we could contact former students and help get them to complete the surveys.
5
Please provide any additional data and analysis that illustrates what is going on in the department (examples might include accreditation data, program data, benchmark data from national exams, course sequence completion, retention, demographic data, data on placement of graduates, graduate survey data, etc.)
Please see Accreditation information under “Improvement Efforts” at the end of this report.
Also, one of the main hurdles is the fact that University of Dayton has eliminated their Engineering Technology programs. This was a useful enrollment tool to be able to offer high school students the chance for dual enrollment and financial scholarships at UD. However the demographic shift of our student population seems to indicate that many are not seeking enrollment at UD. It is too early to tell how this will impact the program, but we are monitoring the situation closely.
6
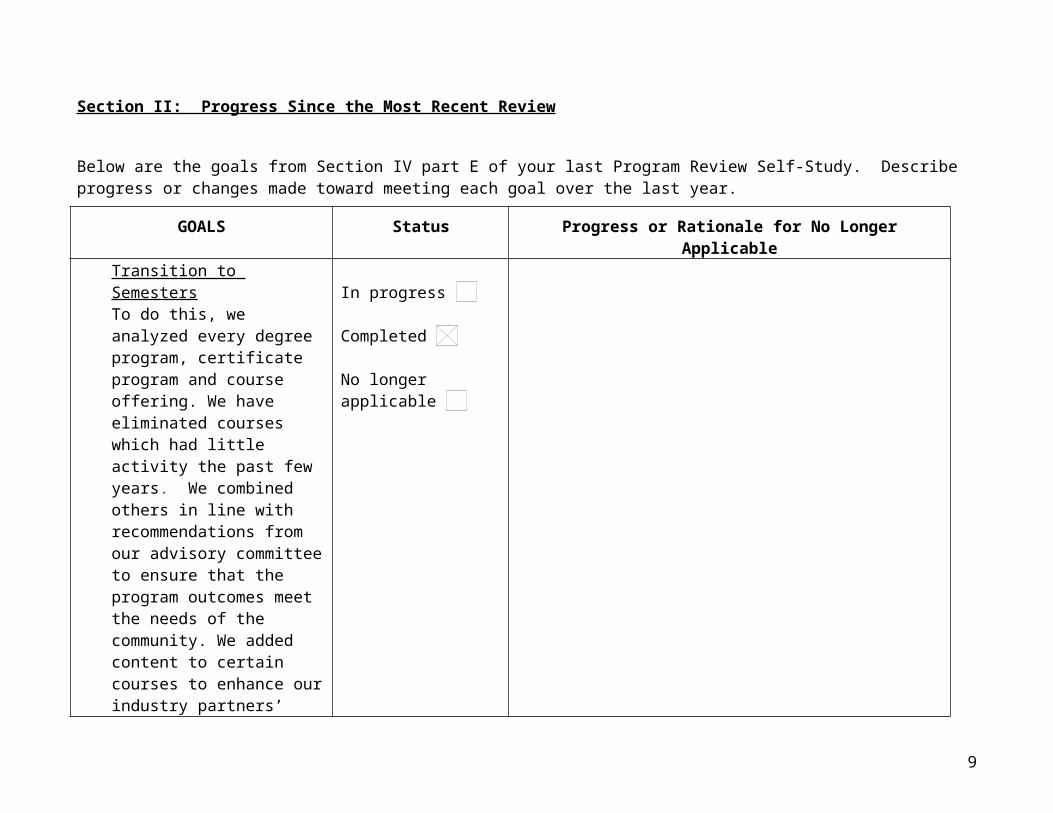
Section II: Progress Since the Most Recent Review
Below are the goals from Section IV part E of your last Program Review Self-Study. Describe progress or changes made toward meeting each goal over the last year.
GOALS Status Progress or Rationale for No Longer ApplicableTransition to SemestersTo do this, we analyzed every degree program, certificate program and course offering. We have eliminated courses which had little activity the past few years. We combined others in line with recommendations from our advisory committee to ensure that the program outcomes meet the needs of the community. We added content to certain courses to enhance our industry partners’ needs, and we created a course in quality control (OPT 1112 -World Class Quality Systems and Procedures) to ensure that students get a basic understanding of the quality process and procedures needed in today’s business environment. The higher level quality courses (OPT 2221,
In progress
Completed
No longer applicable
7

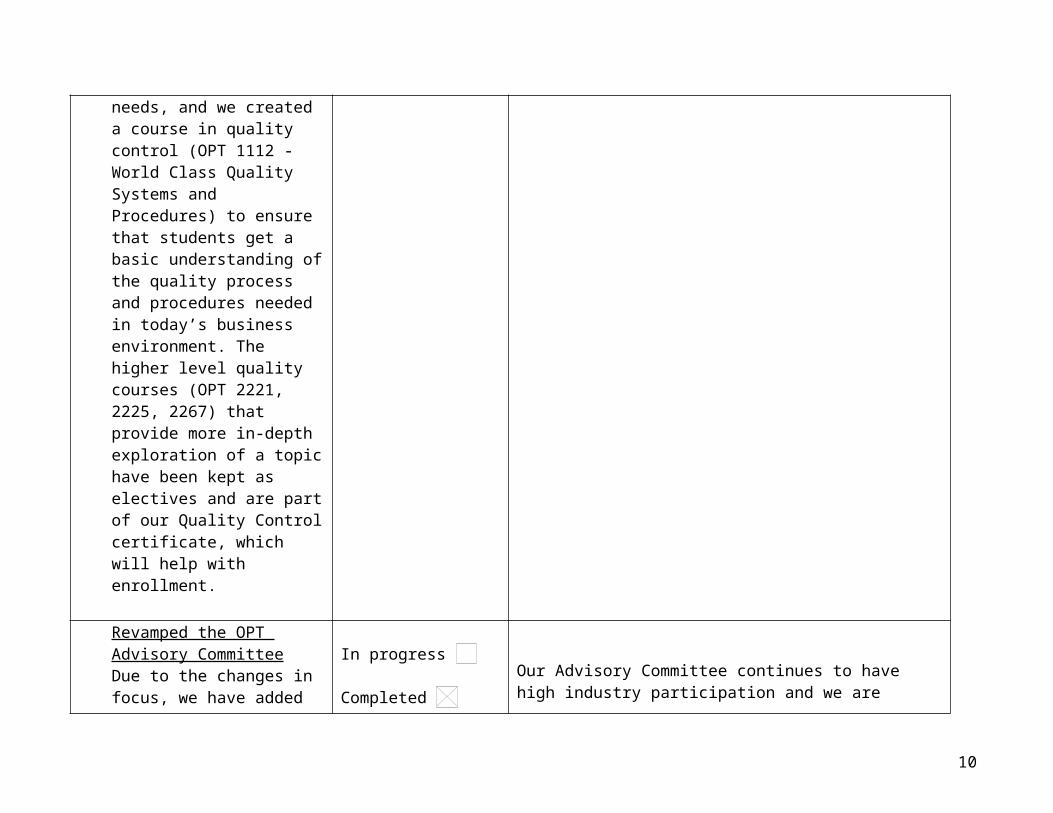
2225, 2267) that provide more in-depth exploration of a topic have been kept as electives and are part of our Quality Control certificate, which will help with enrollment.
Revamped the OPT Advisory CommitteeDue to the changes in focus, we have added more non-manufacturing representatives on this committee. We have also added recent graduates of the OPT program. They bring valuable information about how well our programs prepare them for the workplace.
In progress
Completed
No longer applicable
Our Advisory Committee continues to have high industry participation and we are continuing to update and keep it current.
CertificatesWe will offer under semesters those certificates we offer under quarters and will use this as a strategy to recruit more adult students into the program. And hopefully this will encourage more companies to send employees for additional or continuing education.
In progress
Completed
No longer applicable
Our focus is shifting towards adults seeking skills to enhance their employability. We are working with companies that we know offer tuition reimbursement. This is where many of our current students come from.
8
Learning CentersWe are pursuing the opportunities of offering OPT classes at two of Sinclair’s Learning Centers, particularly Courseview and Preble County. They offer potential for growth of the program. In particular, we will address this issue with our OPT Advisory Committee members who are from Warren County.
In progress
Completed
No longer applicable
We are working with both Courseview and Preble County Learning Centers to provide some OPT offerings. Most of these are in conjunction with our initiatives in Computer Aided Manufacturing.
Additional Articulation AgreementsWe currently have an agreement with UD on the OPTIO program that will continue. We also have an agreement for the base OPT program with Purdue University-Richmond in their Organization and Leadership Program. We have made initial contact with Ohio University and are actively pursuing that opportunity. We will continue to seek other partners.
In progress
Completed
No longer applicable
As mentioned above, the fact that University of Dayton has eliminated their Engineering Technology programs could have a serious effect on us. We are no longer focusing on UD (who was our main partner) and looking at other avenues for our students.
More Minority Students and Women into the ProgramAppendix F illustrates that the
In progress We are doing both items mentioned and have a recruiting
9
vast majority of OPT students are white males. We will continue to work with with local high schools, particularly the Ponitz Career Technology Center, to attract more minorities and will continue to work with WISTEM to attract more women into the programs.
Completed
No longer applicable
program aimed at more women and minorities. Still the results are not showing much progress.
More involvement with DRMA and their Extreme BOTS competition.We are a member of the DRMA (Dayton Region Manufacturers Association) and are involved with their Extreme Bots competition.This competition is designed to interest students in careers in manufacturing. In addition to being a “fun” activity, the participants see a connection to a career, particularly in the Industrial Engineering Technology/Quality field.
In progress
Completed
No longer applicable
DRMA is eliminating their involvement with BOTS effective this October. We are considering restarting the old Industrial Engineering manufacturing contest. We are also considering if we could somehow integrate BOTS into this approach. BOTS has been picked up by private industry local high schools and is still an option. We are looking at ways to make the “Manufacturing Day” a one day event, without tying it to a class.
10
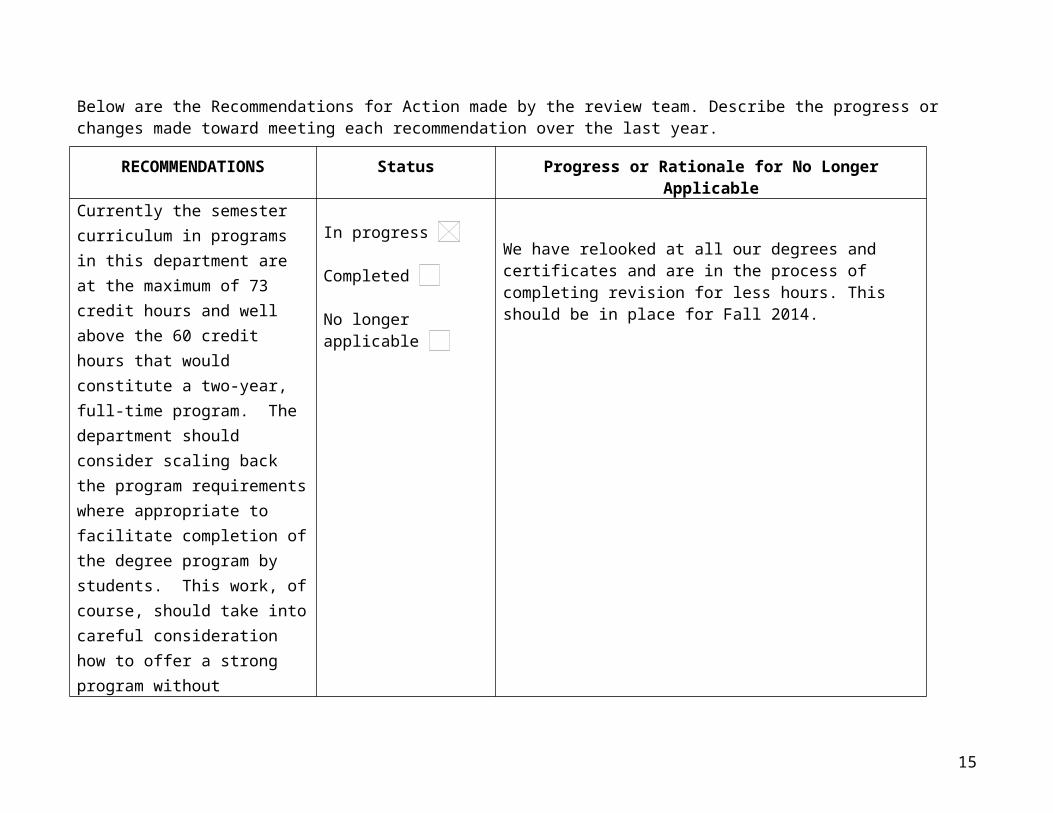
Below are the Recommendations for Action made by the review team. Describe the progress or changes made toward meeting each recommendation over the last year.
RECOMMENDATIONS Status Progress or Rationale for No Longer ApplicableCurrently the semester curriculum in programs in this department are at the maximum of 73 credit hours and well above the 60 credit hours that would constitute a two-year, full-time program. The department should consider scaling back the program requirements where appropriate to facilitate completion of the degree program by students. This work, of course, should take into careful consideration how to offer a strong program without compromising quality of student learning and their professional preparedness.
In progress
Completed
No longer applicable
We have relooked at all our degrees and certificates and are in the process of completing revision for less hours. This should be in place for Fall 2014.
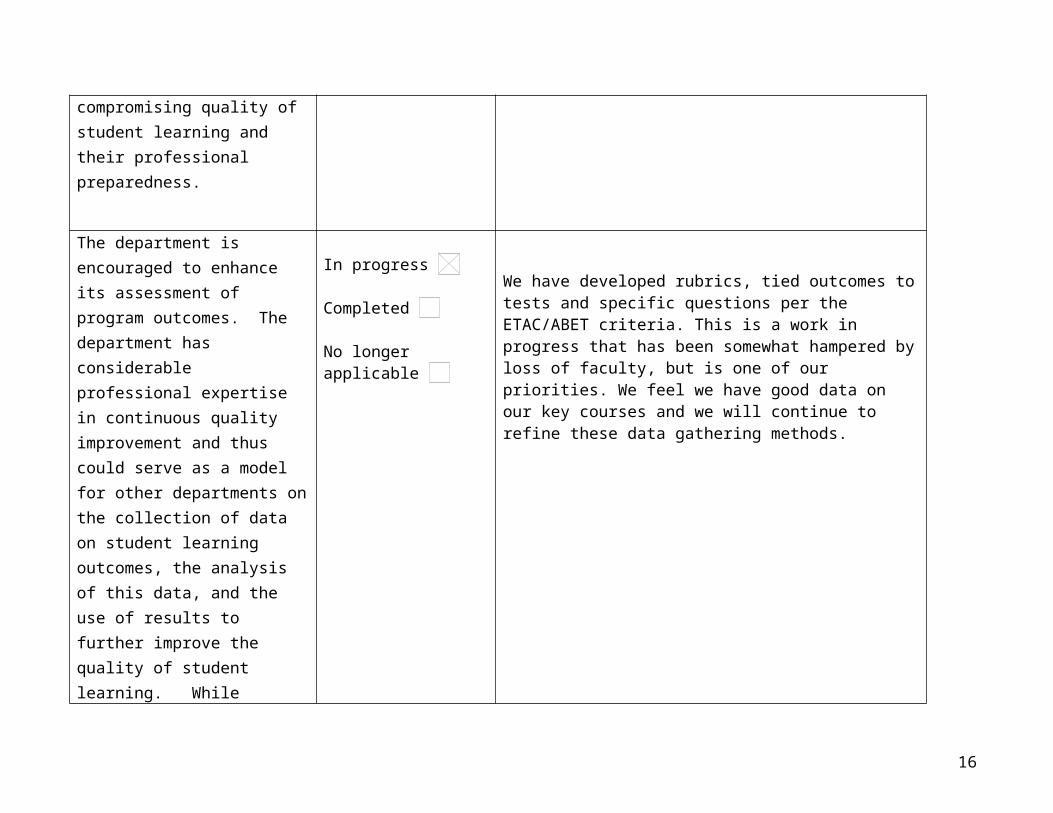
The department is encouraged to enhance its assessment of program outcomes. The department has considerable professional expertise in continuous quality improvement
In progress
Completed
No longer applicable
We have developed rubrics, tied outcomes to tests and specific questions per the ETAC/ABET criteria. This is a work in progress that has been somewhat hampered by loss of faculty, but is one of our priorities. We feel we have good data on our key courses and we will continue to
11
and thus could serve as a model for other departments on the collection of data on student learning outcomes, the analysis of this data, and the use of results to further improve the quality of student learning. While anecdotal information from students is a valued qualitative source of information about students’ experience in OPT, there is a need for a much more focused and systematic approach to evidence of student learning outcomes, an issue also cited in the TAC/ABET review.
refine these data gathering methods.
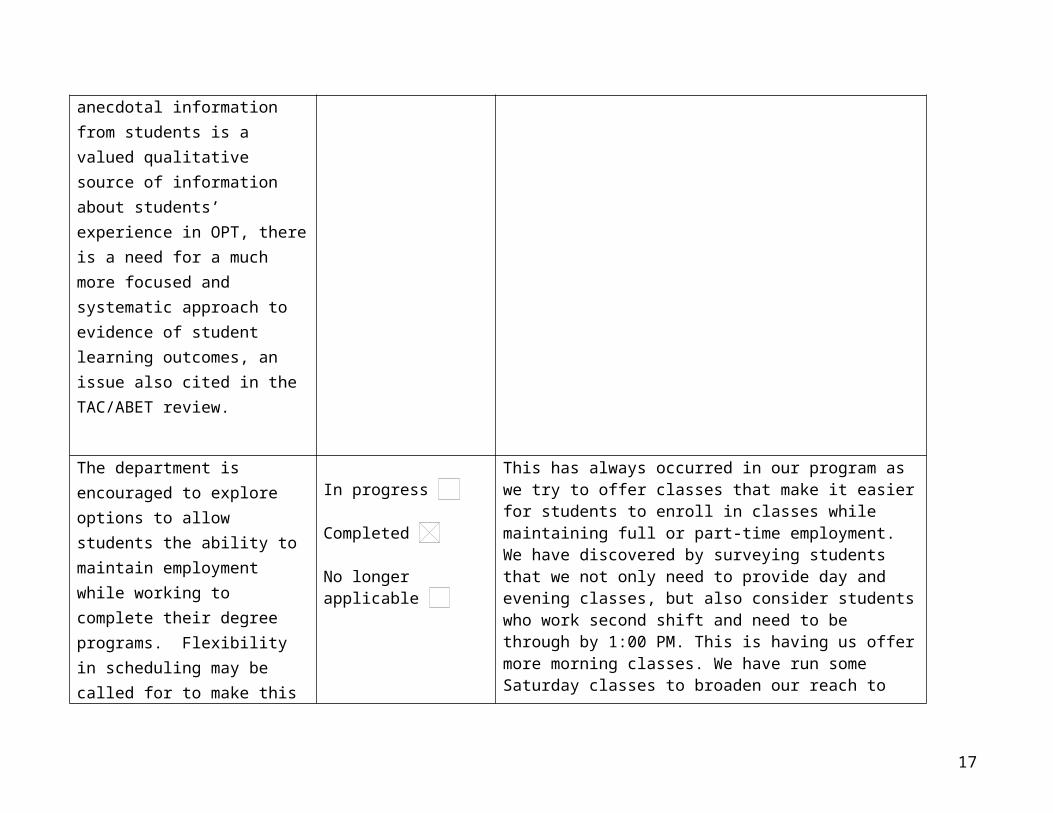
The department is encouraged to explore options to allow students the ability to maintain employment while working to complete their degree programs. Flexibility in scheduling may be called for to make this a reality for some of our students in these programs who also work full-time.
In progress
Completed
No longer applicable
This has always occurred in our program as we try to offer classes that make it easier for students to enroll in classes while maintaining full or part-time employment. We have discovered by surveying students that we not only need to provide day and evening classes, but also consider students who work second shift and need to be through by 1:00 PM. This is having us offer more morning classes. We have run some Saturday classes to broaden our reach to students, but these have not proven popular.
12
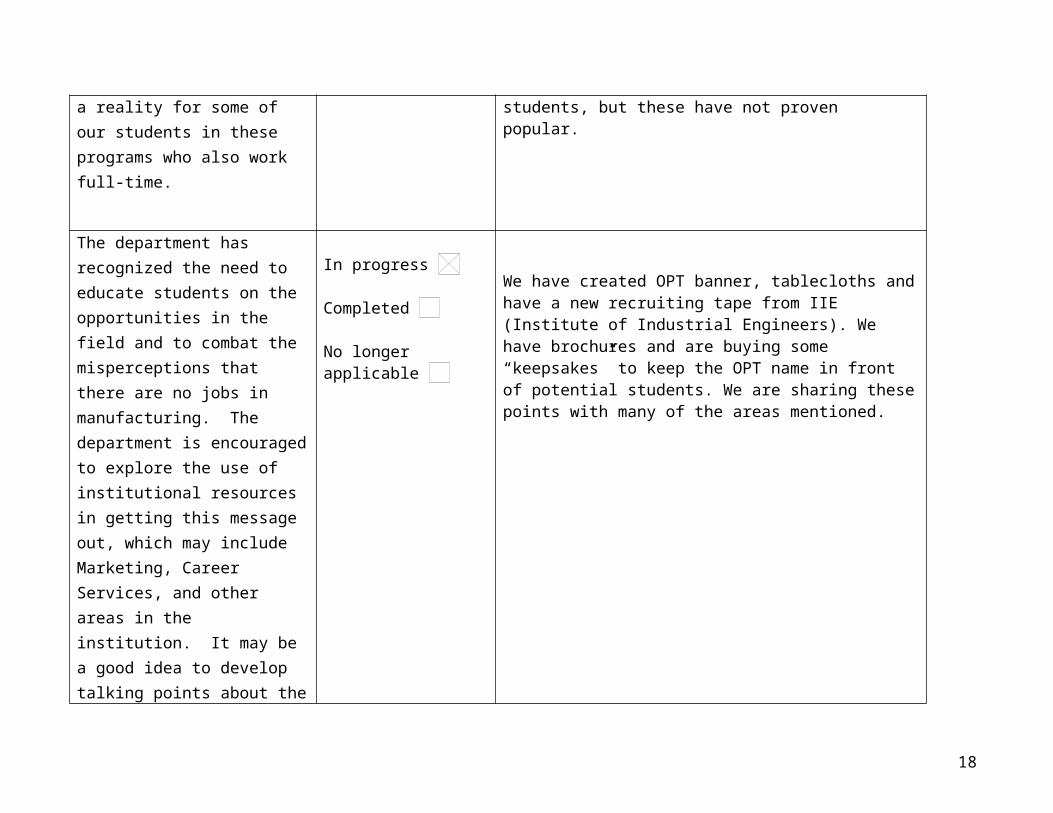
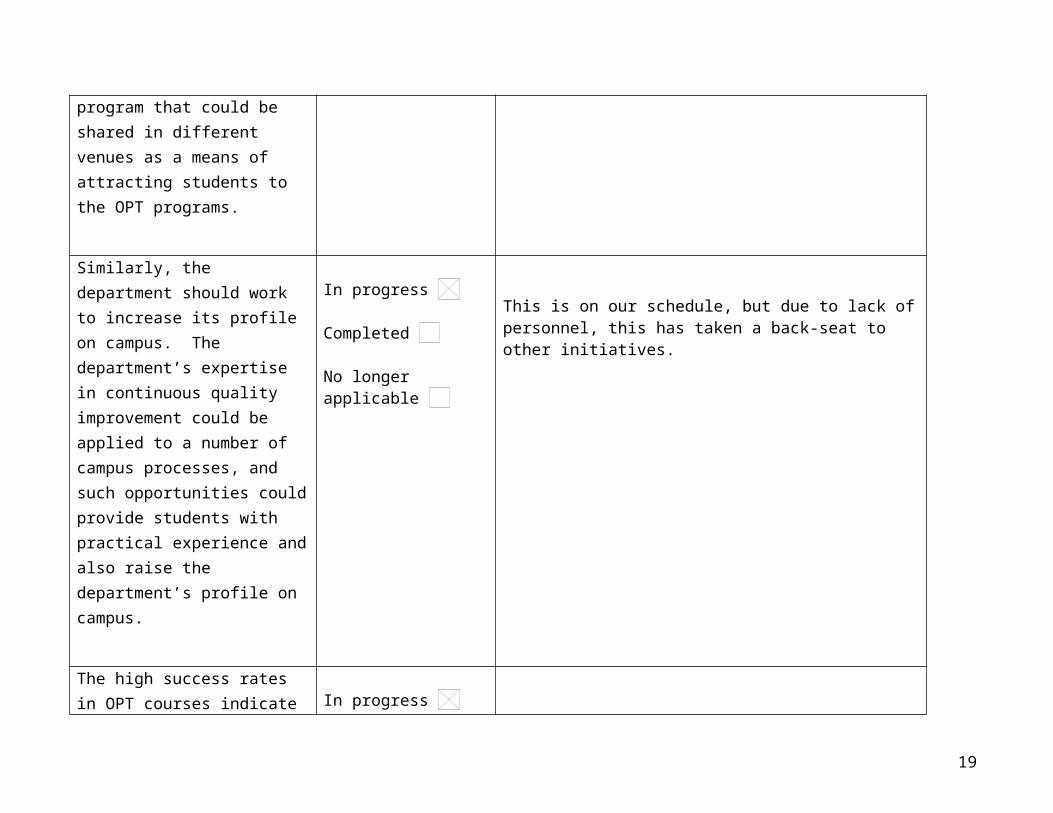
The department has recognized the need to educate students on the opportunities in the field and to combat the misperceptions that there are no jobs in manufacturing. The department is encouraged to explore the use of institutional resources in getting this message out, which may include Marketing, Career Services, and other areas in the institution. It may be a good idea to develop talking points about the program that could be shared in different venues as a means of attracting students to the OPT programs.
In progress
Completed
No longer applicable
We have created OPT banner, tablecloths and have a new recruiting tape from IIE (Institute of Industrial Engineers). We have brochures and are buying some “keepsakes” to keep the OPT name in front of potential students. We are sharing these points with many of the areas mentioned.
Similarly, the department should work to increase its profile on campus. The department’s expertise in continuous quality improvement could be applied to a number of campus processes, and such opportunities could provide students with practical experience and also raise the
In progress
Completed
No longer applicable
This is on our schedule, but due to lack of personnel, this has taken a back-seat to other initiatives.
13
department’s profile on campus.
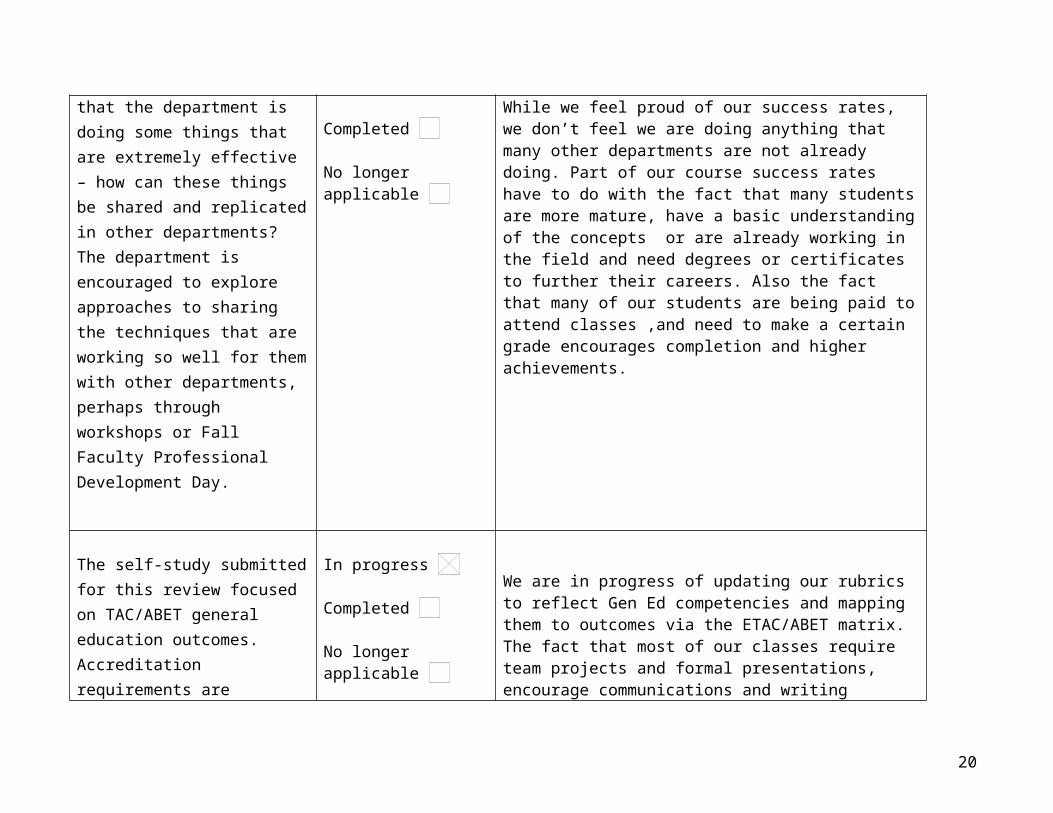
The high success rates in OPT courses indicate that the department is doing some things that are extremely effective – how can these things be shared and replicated in other departments? The department is encouraged to explore approaches to sharing the techniques that are working so well for them with other departments, perhaps through workshops or Fall Faculty Professional Development Day.
In progress
Completed
No longer applicable
While we feel proud of our success rates, we don’t feel we are doing anything that many other departments are not already doing. Part of our course success rates have to do with the fact that many students are more mature, have a basic understanding of the concepts or are already working in the field and need degrees or certificates to further their careers. Also the fact that many of our students are being paid to attend classes ,and need to make a certain grade encourages completion and higher achievements.
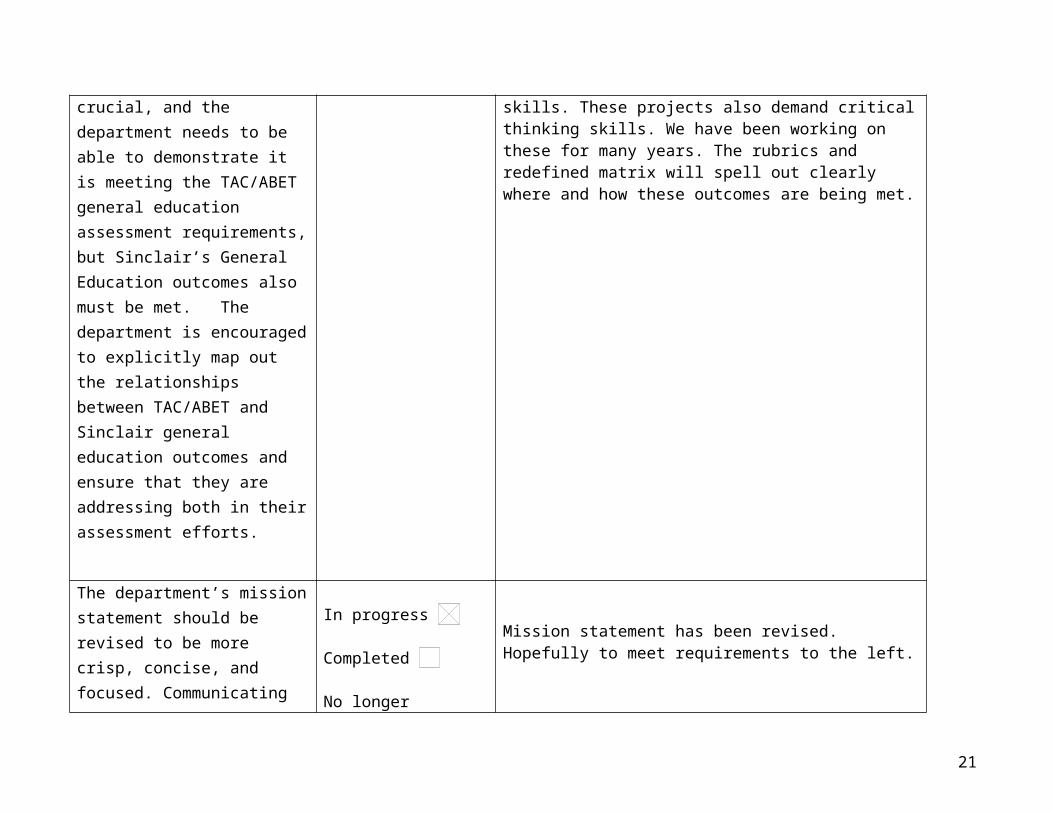
The self-study submitted for this review focused on TAC/ABET general education outcomes. Accreditation requirements are crucial, and the department needs to be able to demonstrate it is meeting the TAC/ABET general education assessment requirements, but Sinclair’s General Education outcomes
In progress
Completed
No longer applicable
We are in progress of updating our rubrics to reflect Gen Ed competencies and mapping them to outcomes via the ETAC/ABET matrix. The fact that most of our classes require team projects and formal presentations, encourage communications and writing skills. These projects also demand critical thinking skills. We have been working on these for many years. The rubrics and redefined matrix will spell out clearly where and how these outcomes are being met.
14
also must be met. The department is encouraged to explicitly map out the relationships between TAC/ABET and Sinclair general education outcomes and ensure that they are addressing both in their assessment efforts.
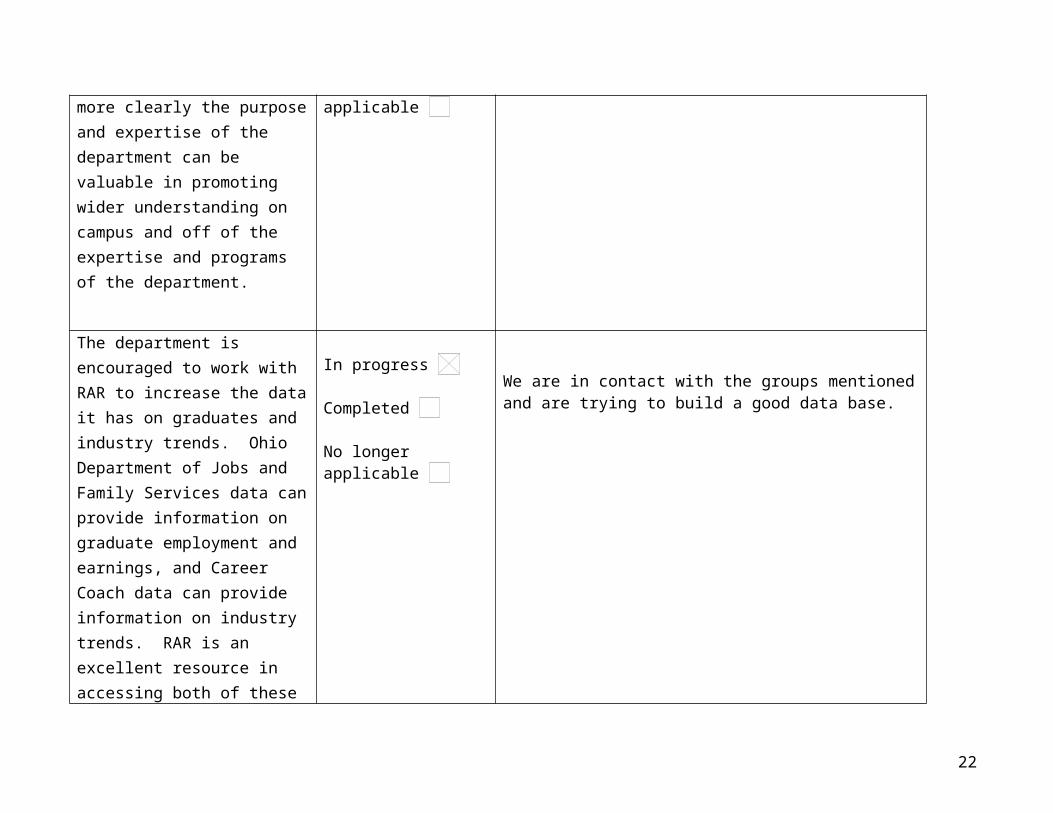
The department’s mission statement should be revised to be more crisp, concise, and focused. Communicating more clearly the purpose and expertise of the department can be valuable in promoting wider understanding on campus and off of the expertise and programs of the department.
In progress
Completed
No longer applicable
Mission statement has been revised. Hopefully to meet requirements to the left.
The department is encouraged to work with RAR to increase the data it has on graduates and industry trends. Ohio Department of Jobs and Family Services data can provide information on graduate employment and earnings, and
In progress
Completed
No longer applicable
We are in contact with the groups mentioned and are trying to build a good data base.
15
Career Coach data can provide information on industry trends. RAR is an excellent resource in accessing both of these sources of data.
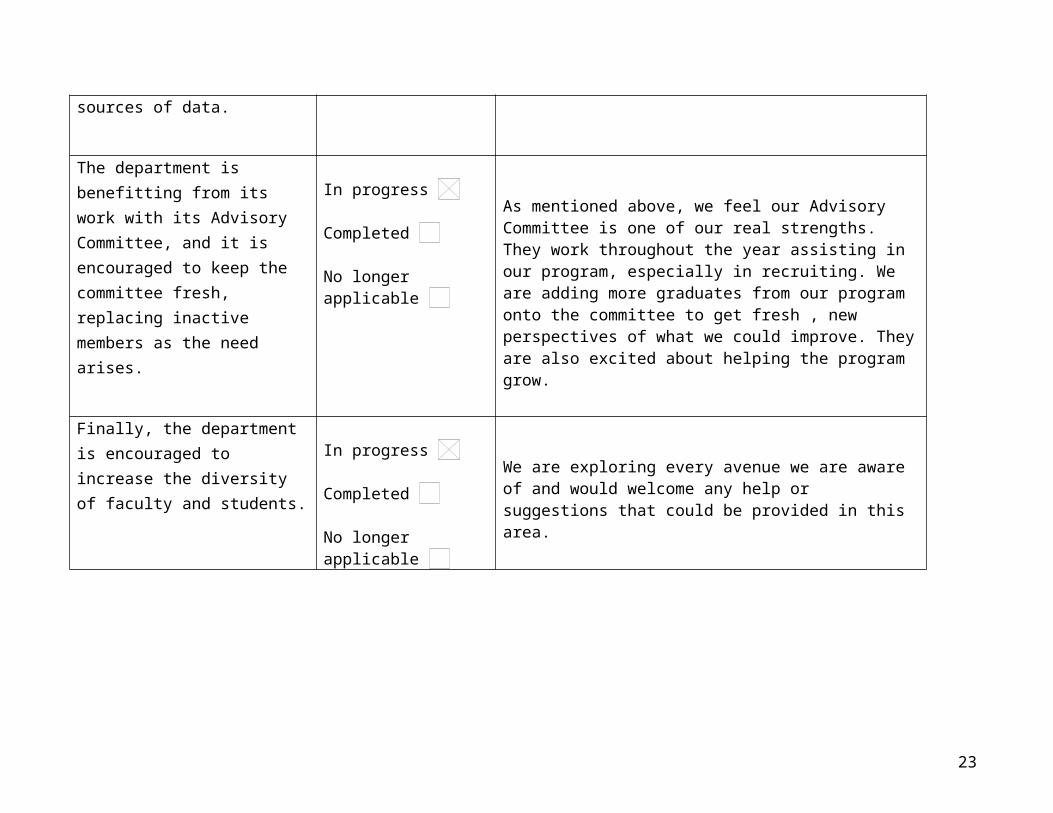
The department is benefitting from its work with its Advisory Committee, and it is encouraged to keep the committee fresh, replacing inactive members as the need arises.
In progress
Completed
No longer applicable
As mentioned above, we feel our Advisory Committee is one of our real strengths. They work throughout the year assisting in our program, especially in recruiting. We are adding more graduates from our program onto the committee to get fresh , new perspectives of what we could improve. They are also excited about helping the program grow.
Finally, the department is encouraged to increase the diversity of faculty and students.
In progress
Completed
No longer applicable
We are exploring every avenue we are aware of and would welcome any help or suggestions that could be provided in this area.
16
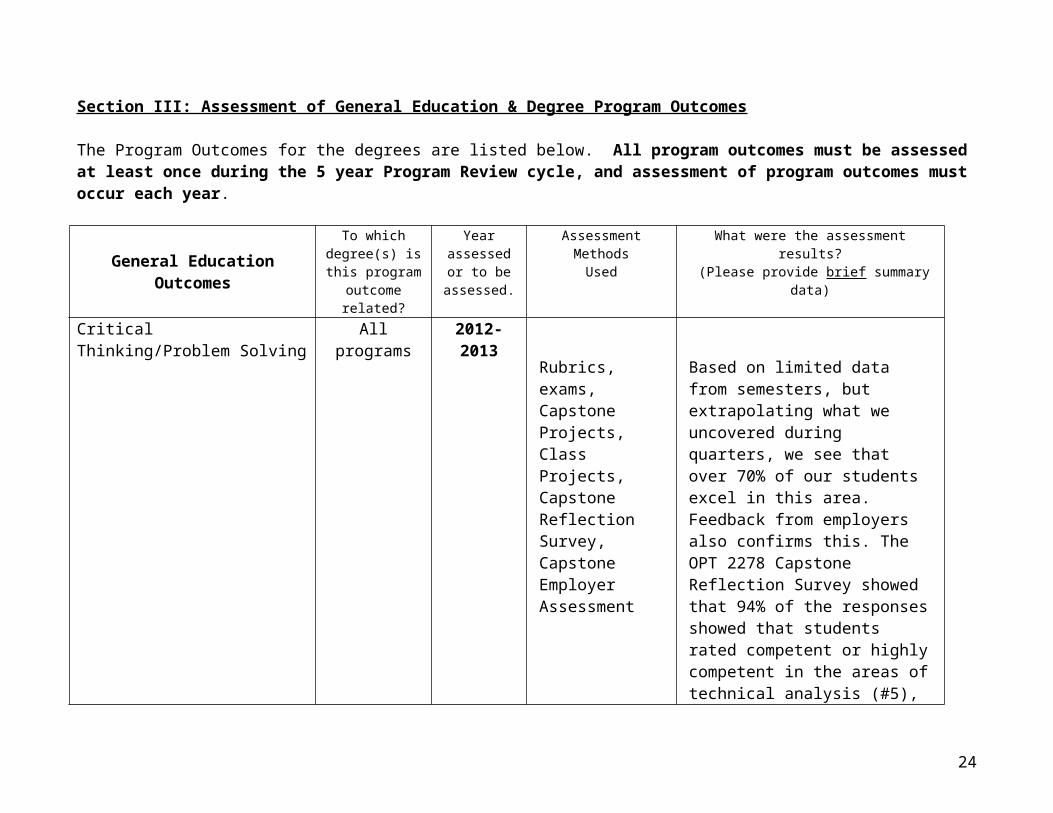
Section III: Assessment of General Education & Degree Program Outcomes
The Program Outcomes for the degrees are listed below. All program outcomes must be assessed at least once during the 5 year Program Review cycle, and assessment of program outcomes must occur each year.
General Education OutcomesTo which
degree(s) is this program outcome
related?
Year assessed or to be
assessed.
Assessment MethodsUsed
What were the assessment results? (Please provide brief summary data)
Critical Thinking/Problem Solving
All programs 2012-2013
Rubrics, exams, Capstone Projects, Class Projects, Capstone Reflection Survey, Capstone Employer Assessment
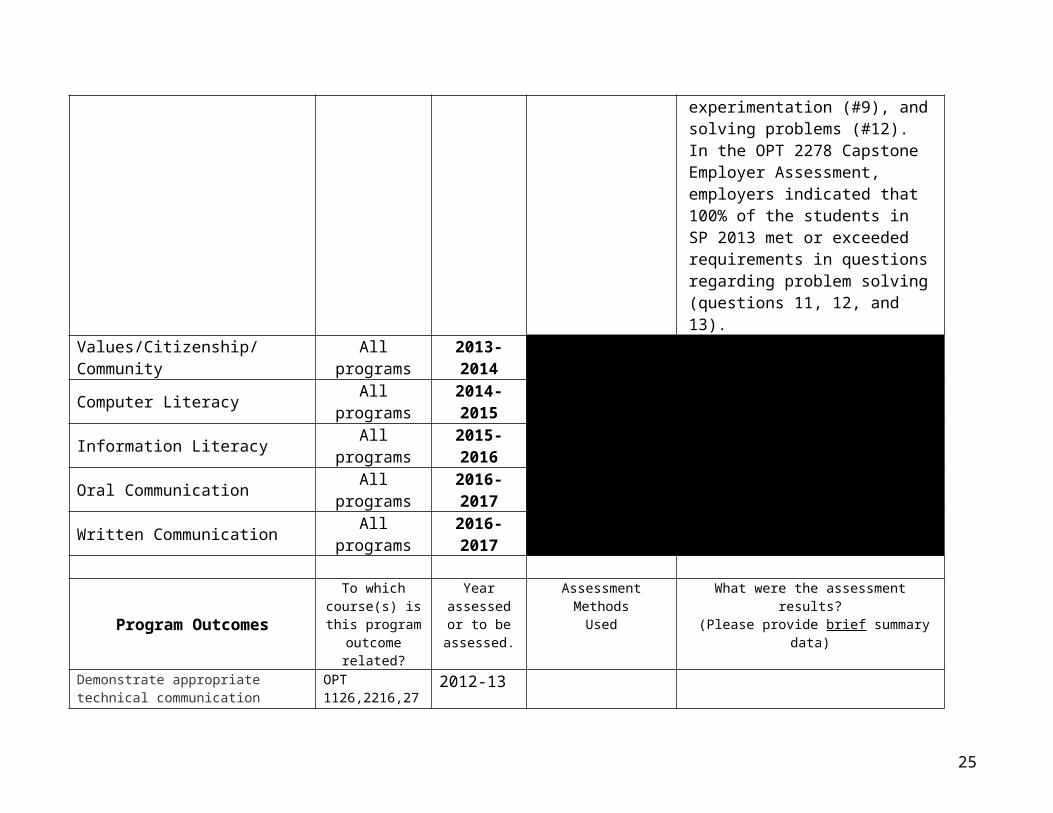
Based on limited data from semesters, but extrapolating what we uncovered during quarters, we see that over 70% of our students excel in this area. Feedback from employers also confirms this. The OPT 2278 Capstone Reflection Survey showed that 94% of the responses showed that students rated competent or highly competent in the areas of technical analysis (#5), experimentation (#9), and solving problems (#12). In the OPT 2278 Capstone Employer Assessment, employers indicated that 100% of the students in SP 2013 met or exceeded requirements in questions regarding problem solving (questions 11, 12, and 13).
Values/Citizenship/Community All programs 2013-2014Computer Literacy All programs 2014-2015Information Literacy All programs 2015-2016
17
Oral Communication All programs 2016-2017Written Communication All programs 2016-2017
Program OutcomesTo which
course(s) is this program outcome
related?
Year assessed or to be
assessed.
Assessment MethodsUsed
What were the assessment results? (Please provide brief summary data)
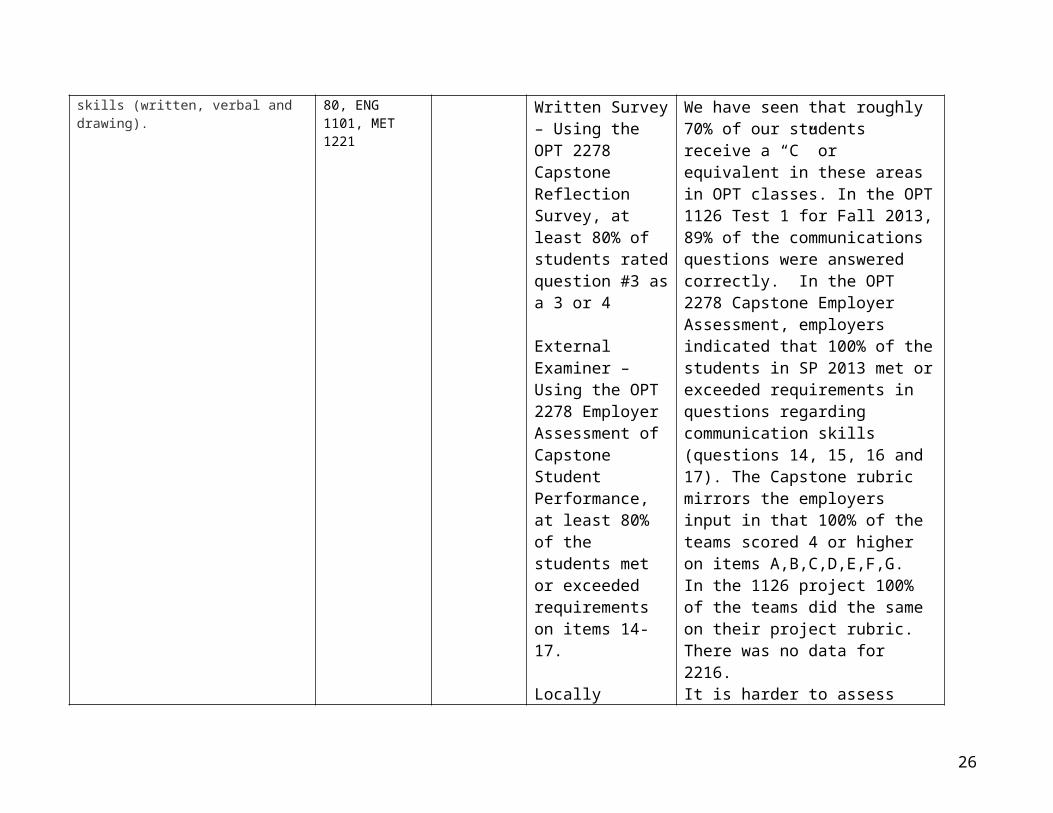
Demonstrate appropriate technical communication skills (written, verbal and drawing).
OPT 1126,2216,2780, ENG 1101, MET 1221
2012-13
Written Survey – Using the OPT 2278 Capstone Reflection Survey, at least 80% of students rated question #3 as a 3 or 4
External Examiner – Using the OPT 2278 Employer Assessment of Capstone Student Performance, at least 80% of the students met or exceeded requirements on items 14-17.
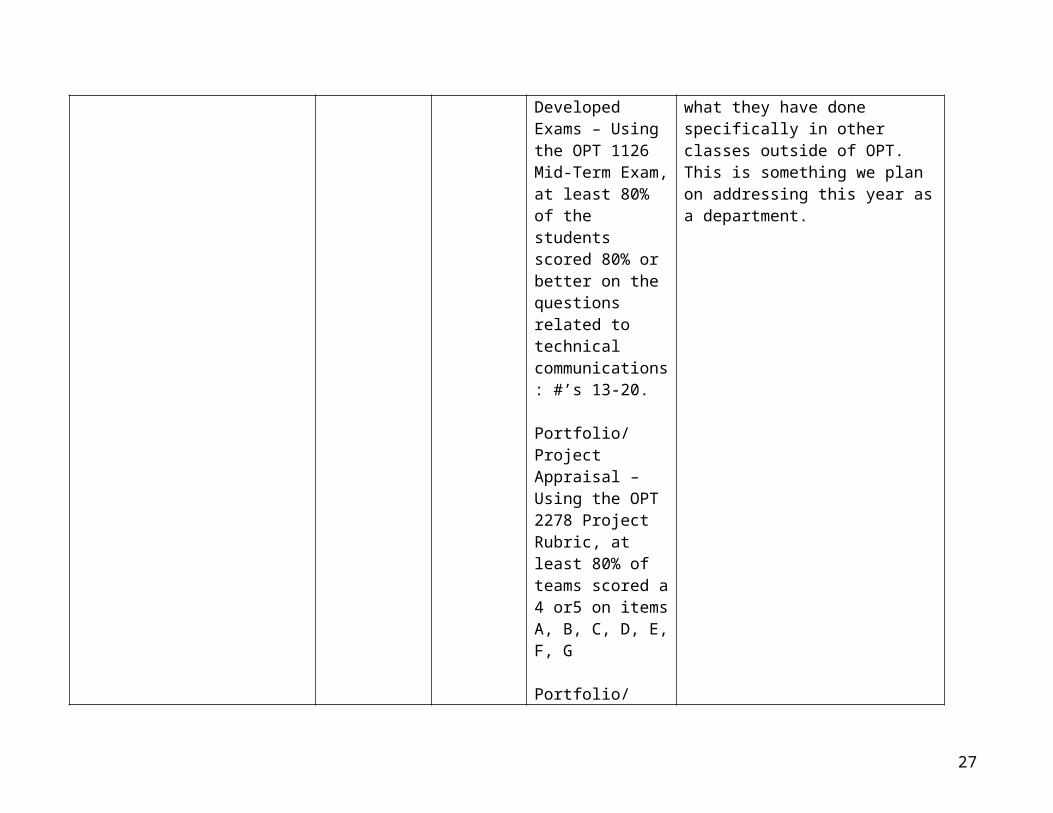
Locally Developed Exams – Using the OPT 1126 Mid-Term Exam, at least 80% of the students scored 80% or better
We have seen that roughly 70% of our students receive a “C” or equivalent in these areas in OPT classes. In the OPT 1126 Test 1 for Fall 2013, 89% of the communications questions were answered correctly. In the OPT 2278 Capstone Employer Assessment, employers indicated that 100% of the students in SP 2013 met or exceeded requirements in questions regarding communication skills (questions 14, 15, 16 and 17). The Capstone rubric mirrors the employers input in that 100% of the teams scored 4 or higher on items A,B,C,D,E,F,G.In the 1126 project 100% of the teams did the same on their project rubric.There was no data for 2216.It is harder to assess what they have done specifically in other classes outside of OPT. This is
18
on the questions related to technical communications: #’s 13-20.
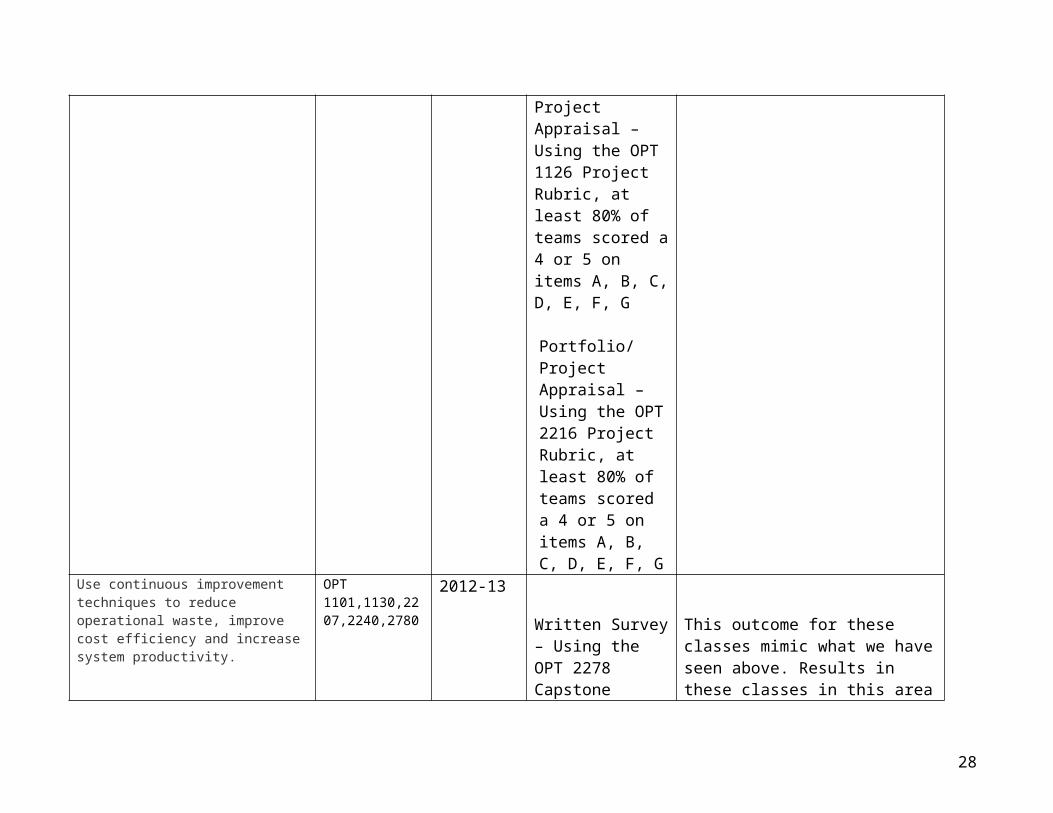
Portfolio/Project Appraisal – Using the OPT 2278 Project Rubric, at least 80% of teams scored a 4 or5 on items A, B, C, D, E, F, G
Portfolio/Project Appraisal – Using the OPT 1126 Project Rubric, at least 80% of teams scored a 4 or 5 on items A, B, C, D, E, F, G
Portfolio/Project Appraisal – Using the OPT 2216 Project Rubric, at least 80% of teams scored a 4 or 5 on items A, B, C, D, E, F, G
something we plan on addressing this year as a department.
Use continuous improvement techniques to reduce operational waste, improve cost efficiency
OPT 1101,1130,2207,2240,2780
2012-13
19
and increase system productivity.
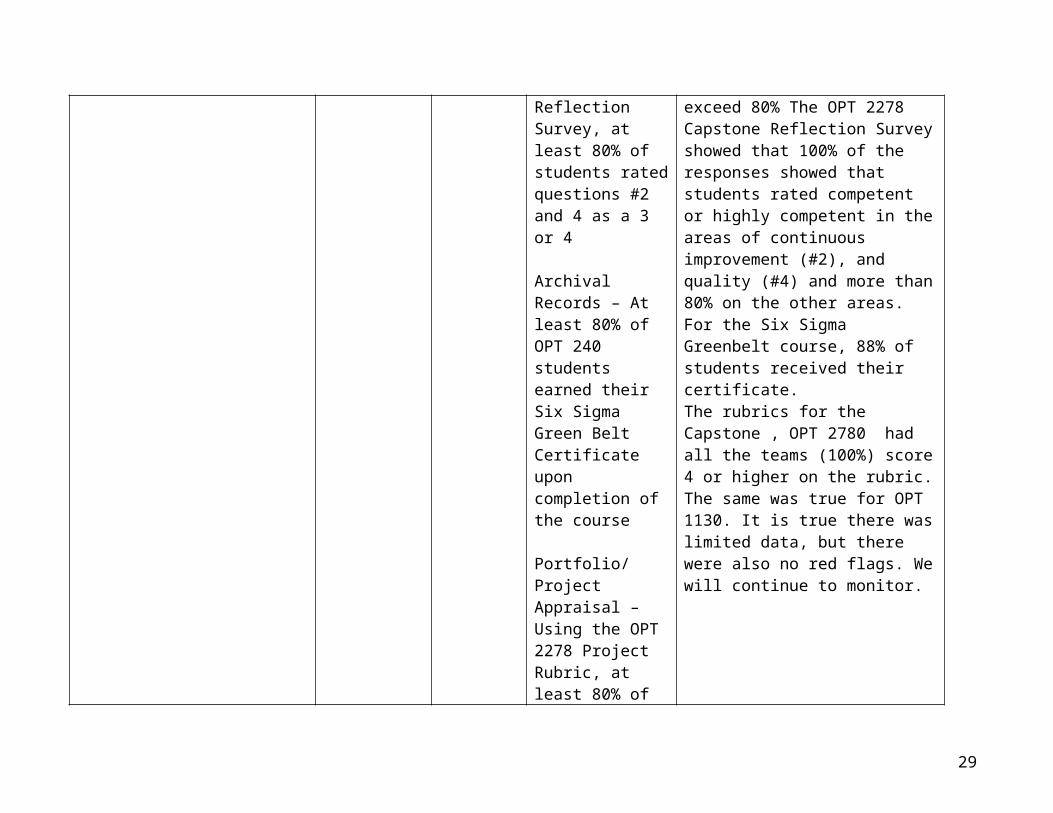
Written Survey – Using the OPT 2278 Capstone Reflection Survey, at least 80% of students rated questions #2 and 4 as a 3 or 4
Archival Records – At least 80% of OPT 240 students earned their Six Sigma Green Belt Certificate upon completion of the course
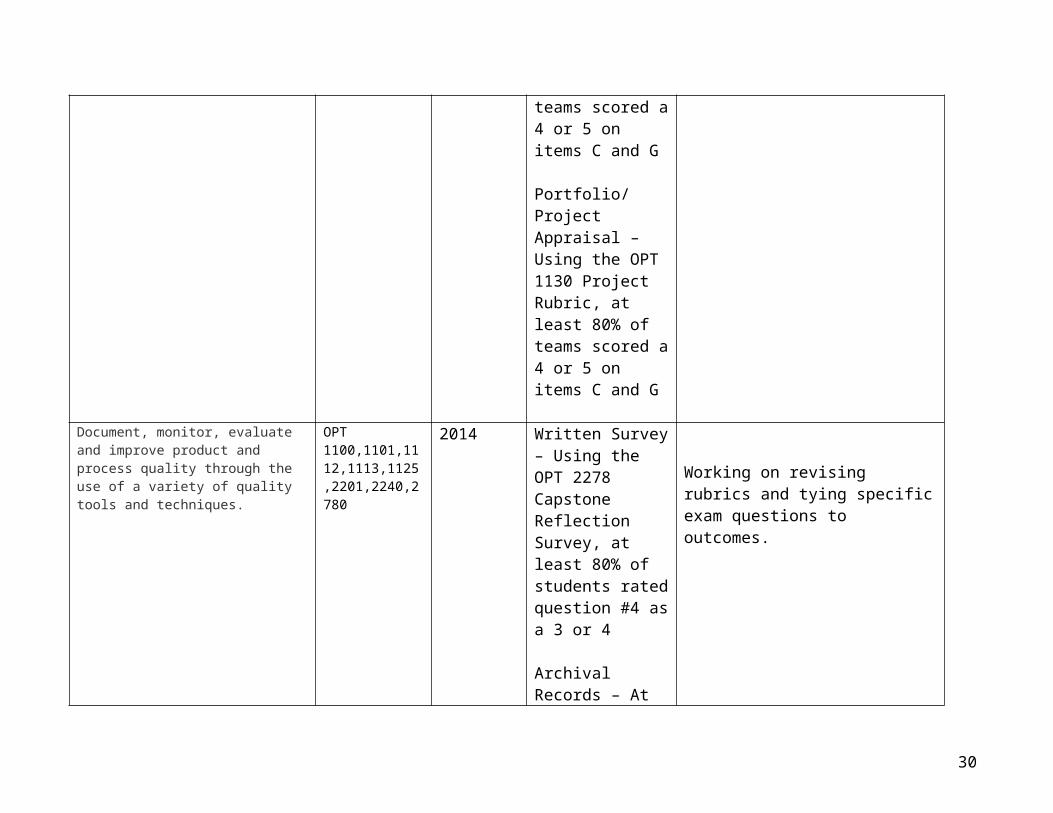
Portfolio/Project Appraisal – Using the OPT 2278 Project Rubric, at least 80% of teams scored a 4 or 5 on items C and G
Portfolio/Project Appraisal – Using the OPT 1130 Project Rubric, at least 80% of teams scored a 4 or 5 on items C and G
This outcome for these classes mimic what we have seen above. Results in these classes in this area exceed 80% The OPT 2278 Capstone Reflection Survey showed that 100% of the responses showed that students rated competent or highly competent in the areas of continuous improvement (#2), and quality (#4) and more than 80% on the other areas.For the Six Sigma Greenbelt course, 88% of students received their certificate.The rubrics for the Capstone , OPT 2780 had all the teams (100%) score 4 or higher on the rubric. The same was true for OPT 1130. It is true there was limited data, but there were also no red flags. We will continue to monitor.
20
Document, monitor, evaluate and improve product and process quality through the use of a variety of quality tools and techniques.
OPT 1100,1101,1112,1113,1125,2201,2240,2780
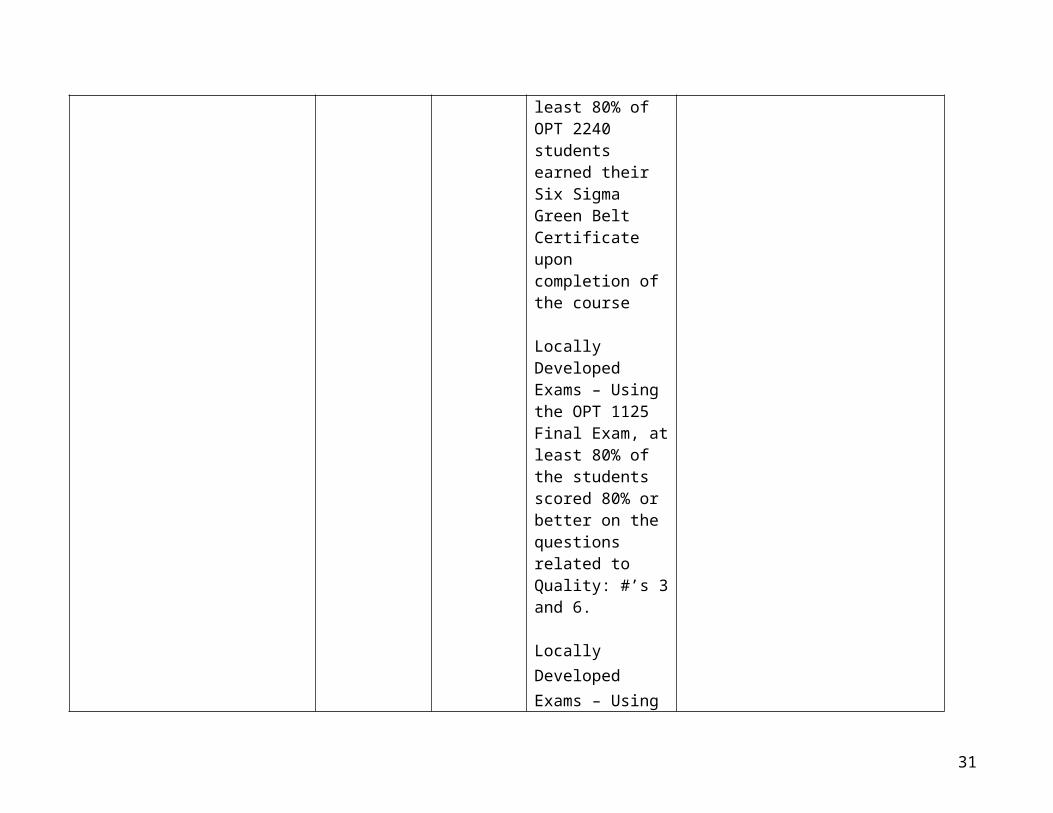
2014 Written Survey – Using the OPT 2278 Capstone Reflection Survey, at least 80% of students rated question #4 as a 3 or 4
Archival Records – At least 80% of OPT 2240 students earned their Six Sigma Green Belt Certificate upon completion of the course
Locally Developed Exams – Using the OPT 1125 Final Exam, at least 80% of the students scored 80% or better on the questions related to Quality: #’s 3 and 6.
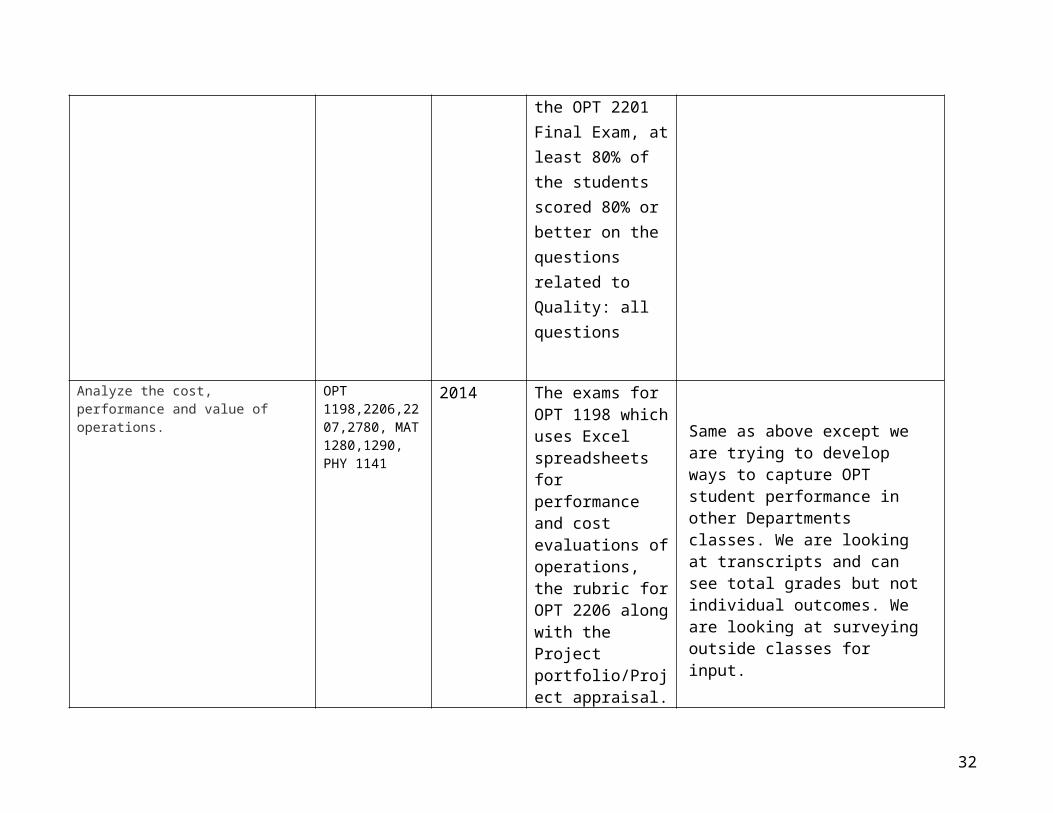
Locally Developed Exams – Using the OPT 2201 Final Exam, at least 80% of the students scored 80% or better
Working on revising rubrics and tying specific exam questions to outcomes.
21
on the questions related to Quality: all questions
Analyze the cost, performance and value of operations.
OPT 1198,2206,2207,2780, MAT 1280,1290, PHY 1141
2014 The exams for OPT 1198 which uses Excel spreadsheets for performance and cost evaluations of operations, the rubric for OPT 2206 along with the Project portfolio/Project appraisal. We expect at least 80% of the students to score 4 or higher on the rubric , 80% of the students to score 80% on the simulation project and make at least a 50% cost improvement.. There will be a written survey from the students on the OPT 22780 Capstone Reflection Survey and 80% of the students should
Same as above except we are trying to develop ways to capture OPT student performance in other Departments classes. We are looking at transcripts and can see total grades but not individual outcomes. We are looking at surveying outside classes for input.
22
score question #5 a 3 or higher. The External Examiner for this Capstone (usually the employer) should rate 80% of the students as having met or exceeded the requirements on items 4,5,11,12,13,20,21,22. In addition, the Capstone Portfolio/Project Appraisal should see at least 80% of the teams score a 4 or higher on items C and G.interaction: all questions.
Demonstrate principles of human integration into technical operations through ergonomics, workplace safety and supervision.
OPT 1101,1110,1125,1126,2205,2216,2780,COM 2206/2211, MET 2711,OTM SOC, OTM HUM
2015 Written Survey – Using the OPT 2278 Capstone Reflection Survey, at least 80% of students rated questions 3,6, 7, 8 as a 3 or 4
Same as above except we are trying to develop ways to capture OPT student performance in other Departments classes. We are looking at transcripts and can see
23
External Examiner – Using the OPT 2278 Employer Assessment of Capstone Student Performance, at least 80% of the students met or exceeded requirements on items 3, 8, 10, 18, 19.
Archival Records – At least 80% of OPT 2205 students earned their OSHA 10 Hour Card upon completion of the course
Locally Developed Exams – Using the OPT 1126 Final Exam, at least 80% of the students scored 80% or better on the questions related to human interaction: all questions.
total grades but not individual outcomes. We are looking at surveying outside classes for input.
24
Portfolio/Project Appraisal – Using the OPT 1126 Project Rubric, at least 80% of teams scored a 4 or 5 on items A, B, C, E, and G.
Demonstrate the math and science skills required for Industrial Engineering Technology functions.
MAT 1280,1290 PHY 1141,1142 OPT 2201,2208
2016 Locally Developed Exams – Using the OPT 2208 Final Exam, at least 80% of the students scored 80% or better on the questions related to Engineering Economics calculations:
Locally Developed Exams – Using the OPT 2201 Final Exam, at least 80% of the students scored 80% or better on the questions related to Quality calculations:
Locally Developed
Same as above except we are trying to develop ways to capture OPT student performance in other Departments classes. We are looking at transcripts and can see total grades but not individual outcomes. We are looking at surveying outside classes for input.
25
Exams – Using the MAT 1290 Final Exam, at least 80% of the students scored 80% or better.
26
General Education Outcomes
A. Are changes planned as a result of the assessment of general education outcomes? If so, what are those changes?
Based on results, no changes are planned at this time.
B. How will you determine whether those changes had an impact?
Program Outcomes
A. Are changes planned as a result of the assessment of program outcomes? If so, what are those changes?
Not at this time, but as the implications of UD’s Technology move more clearly into focus, we will be monitoring the situation closely.
B. How will you determine whether those changes had an impact?
Improvement Efforts
A. What were the results of changes that were planned in the last Annual Update? Are further changes needed based on these results?
We seem to be on track and do not plan anything additional at this time.
B. Are there any other improvement efforts that have not been discussed in this Annual Update submission?
Replacing retiring faculty and their experience is a real challenge along with the enrollment picture. We need to be able to justify new faculty based on enrollment, therefore enrollment must increase to attain new faculty. Much of the workload is dependent upon having enough resources available to do the work.
27
APPENDIX – PROGRAM COMPLETION AND SUCCESS RATE DATA
Degree and Certificate Completion
Division Department
Department Name Program FY 07-08
FY 08-09
FY 09-10
FY 10-11
FY 11-12
FY 12-13
SME 0575 Industrial Engineering IET.AAS 5 2 2 . 1 .SME 0575 Industrial Engineering IETMO.AAS 6 2 . 1 1 .SME 0575 Industrial Engineering IETMOTP.AAS 1 2 . 1 . .SME 0575 Industrial Engineering IETP.AAS 3 3 1 2 . .SME 0575 Industrial Engineering OPT.AAS 2 3 4 6 5 3SME 0575 Industrial Engineering OPT.S.AAS . . . . . 2SME 0575 Industrial Engineering PCET.AAS 1 . . . . .SME 0575 Industrial Engineering QASO.AAS 1 1 . . . .SME 0575 Industrial Engineering QCT.CRT . 1 3 2 3 4SME 0575 Industrial Engineering SET.AAS . 1 . . . .SME 0575 Industrial Engineering SRM.AAS . 1 . . . .SME 0576 Operations Technology CTIM.S.STC . . . . . 2SME 0576 Operations Technology CTIM.STC 1 3 4 23 11 3SME 0576 Operations Technology MET.AAS . . 1 . . .SME 0576 Operations Technology MM.S.STC . . . . . 1SME 0576 Operations Technology MM.STC 2 1 4 5 3 2SME 0576 Operations Technology MTCAL.STC . 1 2 2 2 2SME 0576 Operations Technology OPTIO.AAS . 2 8 9 3 .SME 0576 Operations Technology OPTIO.S.AAS . . . . . 2SME 0576 Operations Technology OPTMO.AAS . 1 6 4 4 3SME 0576 Operations Technology OPTMO.S.AAS . . . . . 1SME 0576 Operations Technology QET.AAS 3 1 . 1 . .
28
Course Success Rates
Department Department Name Course FY 07-08
FY 08-09
FY 09-10
FY 10-11
FY 11-12 FY 12-13
0575 Industrial Engineering IET-206100.0
% . . . . .
0575 Industrial Engineering IET-270100.0
% . . . . .
0575 Industrial Engineering IET-278100.0
% . . . . .0576 Operations Technology OPT-100 78.2% 83.7% 84.5% 71.7% 79.4% .0576 Operations Technology OPT-101 84.0% 85.3% 72.7% 80.2% 77.6% 100.0%
0576 Operations Technology OPT-105 .100.0
% 92.4% 93.1% 100.0% .
0576 Operations Technology OPT-107 80.0%100.0
% . . . .
0576 Operations Technology OPT-110 95.5% 92.6% 95.7%100.0
% 91.7% .0576 Operations Technology OPT-1100 . . . . . 80.0%0576 Operations Technology OPT-1101 . . . . . 92.5%
0576 Operations Technology OPT-111100.0
%100.0
% 85.7%100.0
% 100.0% .0576 Operations Technology OPT-1110 . . . . . 94.1%0576 Operations Technology OPT-1112 . . . . . 87.5%0576 Operations Technology OPT-1113 . . . . . 100.0%
0576 Operations Technology OPT-112100.0
%100.0
% 97.5% 94.4% 83.3% .0576 Operations Technology OPT-1125 . . . . . 66.7%0576 Operations Technology OPT-1126 . . . . . 66.7%
0576 Operations Technology OPT-113 .100.0
%100.0
% 92.9% 93.8% .0576 Operations Technology OPT-1130 . . . . . 96.0%0576 Operations Technology OPT-117 100.0 . . . . .
29
%0576 Operations Technology OPT-1198 . . . . . 76.5%0576 Operations Technology OPT-125 93.6% 76.5% 92.6% 93.8% 82.1% 100.0%0576 Operations Technology OPT-126 90.2% 78.8% 92.6% 90.0% 88.5% 100.0%
0576 Operations Technology OPT-128 85.4% 82.5%100.0
% . . .0576 Operations Technology OPT-130 97.3% 96.2% 95.7% 89.1% 100.0% .0576 Operations Technology OPT-132 82.8% 96.7% . . . .
0576 Operations Technology OPT-133 92.9%100.0
%100.0
% . . .
0576 Operations Technology OPT-136100.0
% . .100.0
% 100.0% .0576 Operations Technology OPT-161 90.9% 71.4% 70.0% . . .
0576 Operations Technology OPT-162100.0
% 71.4% 70.0% . . .
0576 Operations Technology OPT-163100.0
%100.0
% . . . .
0576 Operations Technology OPT-190100.0
% .100.0
% . . .0576 Operations Technology OPT-198 84.2% 92.1% 79.3% 97.1% 66.7% .0576 Operations Technology OPT-201 71.4% 60.3% 60.4% 77.4% 80.0% .
0576 Operations Technology OPT-202 85.7%100.0
% . . . .
0576 Operations Technology OPT-204100.0
% 92.3% .100.0
% 100.0% 100.0%0576 Operations Technology OPT-205 96.3% 95.2% 91.8% 95.2% 83.3% .
0576 Operations Technology OPT-206100.0
% 92.3%100.0
% 90.6% 100.0% .
0576 Operations Technology OPT-207 84.6% 67.6% 80.8%100.0
% 88.9% .
0576 Operations Technology OPT-208 84.2% 87.5% 85.7%100.0
% 100.0% .0576 Operations Technology OPT-209 85.2% 81.8% 100.0 100.0 85.7% .
30
% %0576 Operations Technology OPT-211 . 77.9% 83.6% 83.6% 94.9% 100.0%
0576 Operations Technology OPT-212100.0
%100.0
% 95.7% 92.9% 100.0% 100.0%
0576 Operations Technology OPT-216 87.5%100.0
%100.0
%100.0
% 100.0% .
0576 Operations Technology OPT-217100.0
% . .100.0
% . .0576 Operations Technology OPT-2201 . . . . . 63.6%0576 Operations Technology OPT-2205 . . . . . 94.7%0576 Operations Technology OPT-2206 . . . . . 100.0%0576 Operations Technology OPT-2207 . . . . . 100.0%0576 Operations Technology OPT-2208 . . . . . 83.3%
0576 Operations Technology OPT-221 88.9% . .100.0
% . .0576 Operations Technology OPT-2211 . . . . . 90.5%0576 Operations Technology OPT-2221 . . . . . 100.0%0576 Operations Technology OPT-2223 . . . . . 100.0%0576 Operations Technology OPT-2225 . . . . . 100.0%0576 Operations Technology OPT-223 85.7% 72.2% 78.9% 93.1% 100.0% .0576 Operations Technology OPT-2240 . . . . . 87.7%
0576 Operations Technology OPT-225100.0
%100.0
% . 88.5% 66.7% .0576 Operations Technology OPT-2251 . . . . . 64.7%0576 Operations Technology OPT-2267 . . . . . 100.0%0576 Operations Technology OPT-2297 . . . . . 100.0%0576 Operations Technology OPT-240 91.1% 96.6% 94.0% 94.1% 93.3% .
0576 Operations Technology OPT-251 . . 66.7%100.0
% 80.0% .
0576 Operations Technology OPT-261100.0
% . . . . .0576 Operations Technology OPT-265 90.9% 50.0% . . . .
31
0576 Operations Technology OPT-266 66.7%100.0
% 87.5% 84.6% 71.4% .0576 Operations Technology OPT-267 . . . 50.0% 100.0% .
0576 Operations Technology OPT-270 66.7%100.0
%100.0
% . 100.0% .
0576 Operations Technology OPT-277100.0
%100.0
%100.0
%100.0
% 100.0% .
0576 Operations Technology OPT-278100.0
% 92.3%100.0
%100.0
% 100.0% .0576 Operations Technology OPT-2780 . . . . . 85.7%
0576 Operations Technology OPT-297 98.9% 98.6%100.0
% 97.5% 100.0% .
32