Embed Size (px)
Citation preview

Compilation of Submitted Inputs
to the Progress Reportto the Fifth North Sea Conference
__________________________________________________________________________
Further Reduction of Nutrient Inputs to the North Sea

Compilation of Submitted Inputs – Further reduction of nutrient inputs to the North Sea
The North Sea SecretariatJanuary 2002
2

Reports submitted on further reduction of nutrient inputs to the North Sea
IntroductionIn order to collect information for the Progress Report to the 5th North Sea Conference the secretariat circulated an electronic reporting format (HARP-NUT) to North Sea states in December 2000. Requests for reporting on other action points from the Esbjerg Declaration was sent to the relevant countries and organizations in March 2001. This document comprises responses received.
CONSSO and the OSPAR Eutrophication Committee (EUC) decided to use data from the year 2000 for reporting on the 50 % reduction target. The latest deadline for submitting national reports was 1 December 2001.
Reports regarding the other action points from the Esbjerg Declaration have been received from all relevant countries. The quality of the submitted reports is mostly satisfactory. The responses are structured according to reporting body and paragraphs in the Esbjerg Declaration chapter IV (in square brackets). These reports are presented in Part I of this document.
National reports on the 50 % reduction target have been received from all countries. The reports are presented in Part II of this document.
List of Content
Part I: Inputs received on action points from the Esbjerg Declaration.............................21. Sensitive areas/Urban Waste Water Directive/Nitrate Directive.........................................42. Agricultural policies......................................................................................................... 103. Balanced fertilisation........................................................................................................ 134. Atmospheric deposition and ammonia emission...............................................................15Part II: Inputs of nutrients using the HARP-NUT Guidelines.........................................241. France.............................................................................................................................. 252. UK................................................................................................................................ …313. Belgium……………………………………………………………………………………414. Denmark…………………………………………………………………………………...475. Germany…………………………………………………………………………………...666. Norway…………………………………………………………………………………….897. Sweden…………………………………………………………………………………...1048. Switzerland……………………………………………………………………………….1229. The Netherlands………………………………………………………………………….129
1

Compilation of Submitted Inputs – Further reduction of nutrient inputs to the North Sea
Compilation of Submitted Inputs
Further reduction of nutrient inputs to the North Sea
Part I:Inputs received on action points from
the Esbjerg Declaration
2

Compilation of Submitted Inputs – Further reduction of nutrient inputs to the North Sea
Table 1: Inputs received on action points from the Esbjerg Declaration
Issue Reference to article in ED
Reporting body Remarks
Sensitive areasUrban Waste Water
31 i France
Norway
United Kingdom
31 ii European Commission
31 iii European Commission
Agricultural policies
36 i and ii European Commission
Norway
Switzerland
Balanced fertilisation
37 OSPAR
Atmospheric deposition
38 i European Commission
Norway
Switzerland
38 ii UN-ECE
Ammonia emissions
38 iii OSPAR
Transparent reporting
67 European Environmental AgencyEuropean Commission
Norway HARP-NUT Guidelines
3

Compilation of Submitted Inputs – Further reduction of nutrient inputs to the North Sea
1. Sensitive areas/Urban Waste Water Directive/Nitrates Directive
Therefore the Ministers AGREE to remain committed to reach the reduction targets set by the previous Conferences and to strengthen the implementation of measures as soon as possible. Fundamental elements in fulfilling these goals in the EU and European Economic Area are, inter alia:
i. to apply in the North Sea and its catchment the measures for sensitive areas under the Urban Waste Water Directive and to apply the measures for vulnerable zones under the conditions of the Nitrates Directive, including the criterion of contribution to pollution as mentioned in Article 3 of the Nitrates Directive.
These measures will be implemented for the whole North Sea and its catchment, except for those parts of the North Sea where comprehensive scientific studies, to be delivered by 1997, demonstrate to the satisfaction of the Committees set up under the respective Directives or the relevant European Economic Area body that nutrient inputs do not cause eutrophication effects or contribute to such effects in other parts of the North Sea.
It is expected that these measures will, in newly identified areas, be applied as soon as technically possible after 1998;
ii. full implementation of Council Directive 91/271/EEC on Urban Waste Water Treatment in accordance with the timetable stipulated therein or as amended in the future; and
iii. action to achieve the reduction for nitrate losses from agriculture under the national action plans required by Council Directive 91/676/EEC. These states will take complementary action necessary to meet the commitment in coordination with these action plans.
In parallel, Member States to EU will endeavour to optimise the application of existing EU wide provisions, i.e. Regulation 2078/92 on agri-environmental measures and Regulation 1756/92 on set-aside schemes, to this end. [31]
European Commission:
Urban Waste Water Treatment Directive (91/271/EEC)
The Directive on waste water treatment1, which was adopted by the Council in 1991, aims to protect the environment from the adverse effects of the discharge of urban wastewater biodegradable waste water from the food-processing industry. The main obligation imposed by the Directive concerns the establishment of waste water collection and treatment systems.
Ten years after the adoption of this directive, the vast majority of Member States show major delays and shortcomings in its implementation. 37 large cities are still discharging untreated waste water into the environment, and many others are discharging large quantities of effluent after inadequate treatment. Almost all Member States are very slow in providing the Commission with information about the treatment of city sewage in their country. 1 Directive 91/271/EC on waste water treatment
4

Compilation of Submitted Inputs – Further reduction of nutrient inputs to the North Sea
Commenting on the importance of the Directive Commissioner Wallström said: “The environment of the EU would look different if legislation was enforced in Member States. Waste water treatment, for example, makes the difference between good and bad bathing water and thereby directly affects people’s health.“ She continued: “Member States are also setting a bad example and sending a deplorable message to the candidate countries, which are being criticised for not transposing EU environmental legislation quickly enough.”
Most Member States fail to implement
There are three major deadlines in the Directive. The first was 31 December 1998 by which date all agglomerations with more than 10,000
inhabitants2 discharging their effluent into or upstream of an area regarded as sensitive should have been equipped with a stringent collection and treatment system.
By the end of 2000 – nine years after adoption – Member States should have established secondary collection and treatment systems (usually biological treatment) in agglomerations with more than 15,000 inhabitants.
The final deadline is 31 December 2005 for the establishment of appropriate secondary treatment in small agglomerations.
Most Member States have major shortcomings with regards with all these deadlines and with the identification of sensitive areas.
Major delays in implementation. For the 3,247 agglomerations with more than 10,000 inhabitants which are in sensitive areas and where Member States should introduce more stringent treatment, only Denmark and Austria are close to compliance with the 1998 deadline. In addition, even if a considerable number of the 542 large European cities of more than 150,000 inhabitants are equipped with adequate treatment, 37 are discharging all their wastewater into the environment without prior treatment, 72 discharge a large proportion of their wastewater without treatment or after inadequate treatment, while for 131 others no complete information has been given to the Commission.
Identification of sensitive areas. Member States have proceeded in a restrictive fashion when designating sensitive areas and have not taken into account the fact that discharged wastewater migrates and contributes to an increase in the level of pollution of downstream water. The choice of the treatment level for a town should take into account the degree of sensitivity of the receiving water bodies situated further (and sometimes much further) downstream from the towns concerned. The incomplete designation of sensitive areas results in an under-assessment of the wastewater treatment targets for many agglomerations, which are sometimes very large, e.g. London, Paris, Athens and Dublin.
Member States slow in providing information
During 1999 and 2000 - on the basis of the information transmitted by the Member States - Commission staff has checked the degree of compliance with the first requirements of the Directive. Information from the European Environment Agency confirms that where efforts have been made to implement the Directive the result is a significant improvement in the water quality of many European rivers and lakes. Nevertheless, the situation remains
2 Inhabitant = the equivalent to the average daily pollution produced by one person per day.
5
Compilation of Submitted Inputs – Further reduction of nutrient inputs to the North Sea
worrying with regard to the eutrophication of the seawater of the North Sea, the Baltic Sea and the Adriatic Sea.
However, the Commission's work has been slowed down, in some case substantially, by the delays with which almost all Member States have provided the information. In addition, France and Germany have not given any information at all about the situation with regard to the treatment of their urban wastewater as at 31 December 1998.
Commissioner Wallström said: “This is an unconstructive attitude which is a barrier to transparency and proper information for the public.”
This situation of the individual states is as follows:
FranceThe decision against France concerns several failures relating to sensitive areas. These include the identification of areas in 1999 that should have been identified by the end of 1993, France’s overly restrictive approach to fixing criteria for identifying sensitive areas, and the failure to ensure - by the end of 1998 - necessary standards governing discharging into sensitive areas.
GermanyThe procedure against Germany relates to remaining inadequacies in German legislation to give effect to the Directive. Legislation in place in Saxony-Anhalt sets 1 January 2004 as the deadline for more stringent treatment concerning discharges into sensitive areas. The correct deadline should have been 31 December 1998. In addition, several pieces of German legislation (in particular for Mecklenburg-Vorpommern and Northrhine-Westfalia) fail to correctly implement the monitoring requirements of the Directive. The decision taken is to send a supplementary Reasoned Opinion, to take account of developments since an earlier Reasoned Opinion was sent on 28 October 1999.
United KingdomAction is being taken against the United Kingdom because of ongoing failures to identify sensitive areas, in particular for waters that are eutrophic or in danger of eutrophication. Furthermore, difficulties have been experienced with regard to the review of sensitive and less sensitive areas in Northern Ireland. It was decided that the Commission and the UK authorities will take contact to discuss these outstanding points.
New and traditional tools to improve implementation
To achieve better implementation the Commission will continue to check and help ensure compliance. It will also continue to apply traditional measures such as infringement proceedings for any failure to comply with the requirements of the Directive.
The Commission is also encouraging Member States to implement the Directive by granting financial aid under the Structural and Cohesion Funds. It is also active in the accession candidate countries via the ISPA (Financial Instrument for Structural Policies for Pre-Accession). Furthermore, it will grant financial aid conditional on stringent compliance with the requirements in the Directive.
In addition, in the next few years the Commission will step up these activities with regard to local and regional decision makers, authorities and bodies by raising awareness among the
6

Compilation of Submitted Inputs – Further reduction of nutrient inputs to the North Sea
general public, activating networks of cities and by means of technical assistance to help small and medium-sized agglomerations comply by 2005.
Commissioner Wallström has also announced that she will launch a transparent and comprehensive discussion on urban water management. This discussion will address in particular preventive action at source by raising the awareness of water consumers, utilisation of the end products of treatment, and rainwater management. All the stakeholders - towns and cities, NGO's, water industries, consumers, and national, regional and local administrations - will be involved in this discussion.
She said: “It is important to change behaviour in order to put an end to the policy of ‘putting everything downs the drains’ which cannot be justified by the existence of a water-purification station. In addition, domestic, urban and industrial water consumers, who in recent years have learnt to sort their waste, should also learn to treat water as a precious commodity”.
Maps
Maps identifying sensitive areas, cities in conformity with the Directive and the situation of all large cities in the Member States are available on the Internet at the following address:http://europa.eu.int/comm/environment/whatsnew.htm
7

Compilation of Submitted Inputs – Further reduction of nutrient inputs to the North Sea
Annex 1
Cities with more than 150.000 inhabitants without waste water treatment
Since France and Germany have not informed the Commission on the treatment situation in their large cities, the Commission could not undertake an analysis of the situation.
Belgium Brussels The City of Brussels did not have any waste water treatment at all on 31 December 1998. The first treatment plant to be constructed has been treating one third of waste water at secondary level since the autumn 2000, i.e. below the level required by the Directive. The second treatment plant in Brussels is at the planning stage and will not be operational before 2004-2005.
United Kingdom Dundee Projects of work are in progress in certain of those cities.
Sunderland/Whitburn
Middelsborouhg
Hull
Bedington
Torbay
Portsmouth
Brigthon
Hastings
Dover/Folkstone
8

Compilation of Submitted Inputs – Further reduction of nutrient inputs to the North Sea
Annex I1
Cities with more than 10.000 inhabitants affected by a sensitive area and organic load
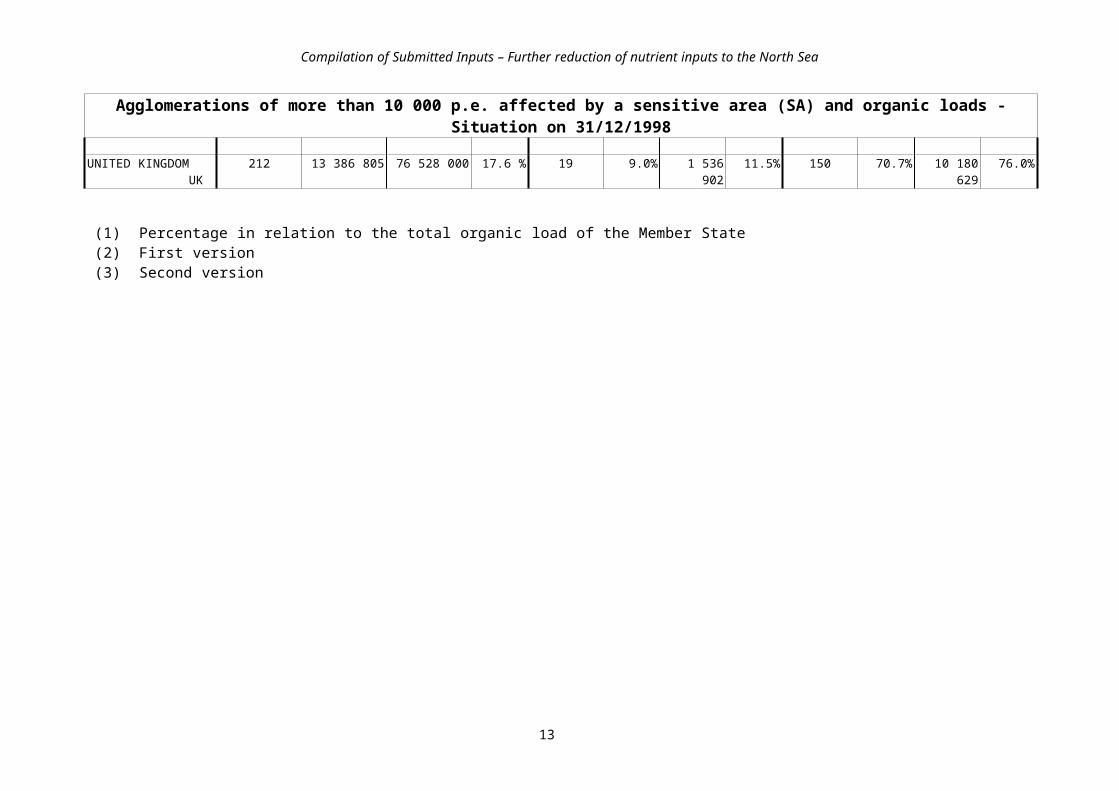
Agglomerations of more than 10 000 p.e. affected by a sensitive area (SA) and organic loads - Situation on 31/12/1998
Member States AGGLOMERATIONS CONCERNED IN CONFORMITY NOT IN CONFORMITYNumber SA load Total load Number Load Number Load
of agglom. (p.e.) (p.e.) % 1 of agglom. % (p.e.) % of agglom. % (p.e.) %BELGIUM B 189 7 801 350 9 164 000 85.1 % 12 6.3% 468 081 6.0% 177 93.7% 7 333 268 94.0%
DENMARK DK 125 6 876 605 8 393 000 81.9 % 123 98.4% 6 848 167 99.6% 2 1.6% 28 439 0.4%
GERMANY D 1685 109 831 358 141 458 400 77.6 %
FRANCE F 267 17 868 530 70 510 000 25.3 %
IRELAND IRL 11 237 000 3 918 000 6.0 % 7 63.6% 135 000 57.0% 4 36.4% 102 000 43.0%
LUXEMBOURG L 11 764 500 914 000 83.6 % - - - - - - - -
NETHERLANDS NL 263 15 473 498 17 218 000 89.9 % - - - - - - - -
FINLAND FI 85 4 352 317 4 550 000 95.7 % 11 12.9% 478 360 11.0% 74 87.1% 3 873 957 89.0%
SWEDEN S 144 7 263 240 7 496 000 96.9 % 34 23.6% 2 451 910 33.8% 110 76.4% 4 811 330 66.2%
UNITED KINGDOM UK
212 13 386 805 76 528 000 17.6 % 19 9.0% 1 536 902 11.5% 150 70.7% 10 180 629 76.0%
(1) Percentage in relation to the total organic load of the Member State(2) First version(3) Second version
9

Compilation of Submitted Inputs – Further reduction of nutrient inputs to the North Sea
Nitrates Directive
Text will be drafted later.
France: France is asked to study and comment the proposed text from UK.
Norway: Norway agrees on the proposed text from UK.
UK: Text proposal in response to Article 31.i of Esbjerg Declaration:
Action under this article has effectively been taken up in the ongoing work within OSPAR to assess the eutrophication status of the various parts OSPAR maritime area through application of the Comprehensive Procedure. This is reported separately under Section B of the Nutrients section of the [5NSC] Progress Report.
2. Agricultural policies
The Ministers therefore INVITE the European Commission, Norway and Switzerland to examine their agricultural policies, and to this end:i. to consider how agricultural policies and policies for rural development, including
market policies and aid policies, can contribute to the objective of reducing losses of nutrients; and
ii. to ensure that these policies are adjusted and implemented to reach this objective. [36 i and ii]
European Commission:NutrientsAgri-environmentThe European Commission recently prepared for a committee of Member States and Parliament a report on the state of application of Regulation (EEC) 2078/92 on agricultural production methods compatible with the requirements of the protection of the environment and the maintenance of the countryside (Council Regulation EEC/2078/92 has recently been repealed by Coucil Regulation EC/1257/1999 on support for rural development, containing the provisions for the current programming period, on which no evaluation data are yet available). As this report is a working document not in the public domain, this analysis is an abstract of the essential elements pertaining to reduction in nutrient inputs.The section of the report on input reduction, which inter alia seeks to minimize use of inputs and to promote organic farming covers a series of programmes, addresses reduced use of fertilizer and plant protection products. While three of these Member States are not OSPAR contracting parties, their experience could be instructive.
The results described are of various national programmes to implement the Regulation, which provides for premium payments to encourage environmentally friendly farming to cover income foregone, costs incurred and an incentive to provide environmental services.So far the Regulation has been applied to 20 % of all agricultural land cover in the EU. There is nevertheless much variation as it includes more than 50 % of the arable land in L, A, FIN and S, more than 25 % in D, 10-25 % in F, IRL, I, P, and UK and less than 5 % in B, DK,
10

Compilation of Submitted Inputs – Further reduction of nutrient inputs to the North Sea
EL, E sand NL. As the application of the programmes is not yet widespread in many Member States, the results indicate their potentiality rather than substantive achievement. The lack of uptake is often cited to be due to low level of payments.
In Italy, integrated production is applied to perennial crops such as vines, fruits and olives and to annual crops of various grains. Fertilizer inputs are estimated to have been reduced by 30-48 % respectively by participating farmers in the region Emiglia Romagna.
In Sachsen, Germany, it was found that a 20 % decrease in N input lead to yield decreases of 17 % and 20 % in 1995 and 1996 for winter crops (wheat, barley, rye, rape and silage wheat). For grassland a 33 % decrease from 150 kg to 100 kg N/ha in N-input lead to a 14 % yield decrease. Overall the authorities estimate a reduction of residual nitrate in soil to 116 kg N/ha.
In Denmark, a 69 % reduction was recorded by the participating farmers which given the low coverage of the programme meant very little (positive) environmental impact overall. Interestingly while the purpose of the programme was to reduce nitrate leaching, the major benefit was in enhancing biodiversity.
In Finland, with the national programme covering 90 % of cultivated area, the potential nutrient reduction of water courses is considered to have reached its objective with 30 % less P input and 10 % less N-input as well as a cessation of winter spreading of manure. Reduced livestock density has also lead to reduced leaching of nitrates.
In the UK, fertilizer use fell by 10-40 kg N/ha on average where target values of 120 kg N/ha of inorganic nitrogen and 175 kg N/ha manure were established.
As regards the significance of actual fertilizer reduction, the environmental benefit will vary depending on the type of soil and leaching therefrom as well as uptake by the crops such that the quantified change in use gives a somewhat uncertain indication of the likely change in stress on the environment.
It is premature to comment on the potentiality of programmes on extensification of livestock given the lower level of implementation.
ConclusionThis regulation is likely to make a greater contribution to nutrient reduction from agriculture if it were to be applied broadly in all Member States. Nevertheless, it is clear that substantive measures to reduce eutrophication must be taken in the framework of the nitrates and urban waste water directives which implementation requires considerable recourse to infringement proceedings.
Norway:1. The Report No. 64 to the Stortinget (1991-92) concerning Norway's implementation of
the North Sea Declarations gave a broad and comprehensive assessment of measures and instruments in the Agricultural sector. Integration of environmental concerns in the Agricultural policy have been re-examined two times during the last decade. The report No. 8 Agriculture in development (1992-93) to the Stortinget established comprehensive environmental principles in the agricultural policy for sustainable development. And furthermore, The North Sea Declarations were considered as a basic challenge for
11

Compilation of Submitted Inputs – Further reduction of nutrient inputs to the North Sea
reduction of waterpollution. The report to the Stortinget No. 19 (1999-2000) concerning Norwegian Agriculture and food production gave basis for more ecological oriented agricultural production and also a basis for introducing extensive environmental planning system on the farm level. Combined use of legal and economic instruments supported with information and control has been an important strategy. In addition, to get better knowledge of the effectiveness of measures institutions are engaged for research and development of various measures and more environmental sound practices. Monitoring of the discharges of nutrients from agricultural catchments has been run over a period of 15 years.
2. A Result Control system is developed and run on yearly basis to estimate and evaluate the effects of implemented measures. The system consists of three steps:1) Data collection and collocation are operated by Statistics of Norway.2) Modelling of discharge of nutrients from agriculture is carried out of Norwegian
Centre for Soil and Environmental Research and The Norwegian Institute for Water Research.
3) The evaluation of results and further administrative decisions and dimensions of measures necessary to achieve politically given coals are a part of the negotiations between the Government and the Farmers Unions in the Agreement of Agriculture. Thus assessment and adjustment of the policy and the use of instruments are done each year.
Switzerland:
Progress on the implementation of Paragraph 36 i, ii ED
In the revised Federal Law on Agriculture (Agricultural Policy 2002) ecological aspects in general and also the objectives to reduce nutrient inputs into waters are fully considered, e.g.:
Reduced prize support to farmers. Prize support will decrease within 5 years (2003) of about 33%;
For to get any direct payment, farmers have to fulfil requirements concerning fertilising, soil protection, crop rotation, crop protection and extensification (1999);
Special programme of measures for catchments with high nitrate content in ground water and in surface waters (1999).
The result of the Programme Agricultural Policy 2002 is examined this year (2001). Of the basis of this examination, the Federal Council should decide the next programme for a perod of for years.
3. Balanced fertilisation
12
Compilation of Submitted Inputs – Further reduction of nutrient inputs to the North Sea
The Ministers RECALL that many North Sea Member States agreed at IMM93 to aim to achieve balanced fertilisation for nitrogen and phosphorus in agricultural production by the year 2000 or 2002 at the latest, subject to an agreement on definitions.
The Ministers NOTE the progress in OSPAR in establishing an operational definition of balanced fertilisation. They ENCOURAGE OSPAR to proceed urgently with its work to establish such an operational definition. They NOTE that in many geographical areas there is a tension between meeting the nutrient needs of crops and the need to limit soil enrichment and losses of nutrients to the aquatic and atmospheric environments to environmentally acceptable levels. They EMPHASISE that the operational definition should resolve this tension at the appropriate geographical level. They further EMPHASISE that the protection of the environment should be given high priority. They finally AGREE that the concept of balanced fertilisation should take account of the principles in the further strategy to combat and prevent eutrophication in the North Sea.[37]
13

Compilation of Submitted Inputs – Further reduction of nutrient inputs to the North Sea
OSPAR:Section C, issues not covered in sections A and B:As far as I can see, there are only two issues to be addressed in the NSC Progress Report not covered in the sections A and B: balanced fertilisation and ammonia emissions.
Balanced fertilisation (cf. ED §37):In 1996, OSPAR endorsed an agreement reached at PRAM 1996 that:
a. as a starting point, the following definition should be considered for further discussion on the definition of balanced fertilisation: "Balanced Fertilisation" means the supply of nutrients, from any source:(i) which does not exceed the requirement of the crops; and(ii) where the resulting soil enrichment and losses of nutrients to the aquatic and
atmospheric environment are at environmentally acceptable levels;
b. Contracting Parties, which could not accept this definition, submit explanations of their reservations, together with constructive proposals on how these reservations could be lifted, to NUT 1996. (Cf. OSPAR 96/17/1, §3.68)
At NUT 1996, it became apparent that there was no scope for solving the different views and opinions of Contracting Parties in order to establish a commonly agreed definition of balanced fertilisation. NUT therefore agreed that:
a. this conclusion should be reported to HOD November 1996 with a recommendation to delete topic 14 ("to adopt a Decision/Recommendation on balanced fertilisation") from the programme of work for MMC 1997;
b. Contracting Parties should submit to NUT 1997 proposals which might help NUT to find a new start in the discussion on a BEP for agriculture (e.g. on issues and measures, which would form part of such a BEP, or on how to address the concept of "balanced fertilisation" in a larger context). (Cf. NUT 96/15/1, §6.5)
HOD November 1996 noted the outcome of NUT 1996 and agreed that "there was at present no scope for finding a commonly agreed definition of balanced fertilisation and, consequently, no way of preparing an OSPAR measure on this issue. Nevertheless, MMC 1997 should be informed about OSPAR's past and present work with regard to balanced fertilisation, together with an outline for the future approach to be taken." To this end, the Chairman of OSPAR undertook to present a document for consideration at HOD May 1997, which would include a text proposal for inclusion in the Ministerial Declaration from MMC 1997 (cf. HOD(2) 96/13/1, §§5.7-5.8).
After further discussion, the Section on Eutrophication of the Sintra Statement contains a simple reference to balanced fertilisation as follows:
"as one of the main elements of the source-oriented actions promote good housekeeping in industry and sewage treatment and good agricultural practice, ecological agriculture and balanced fertilisation;"
The issue of balanced fertilisation is addressed in §3.5.a(ii) of the OSPAR Strategy to Combat Eutrophication as a basic requirement of the 'source oriented approach':
14

Compilation of Submitted Inputs – Further reduction of nutrient inputs to the North Sea
"the promotion of good housekeeping in industry and sewage treatment and of good agricultural practice and ecological agriculture including proper use of the approach of aiming to strike a balance between the amounts of nutrients in the fertilizer applied and the requirements of the crop, and that proper attention is given to ammonia emissions;"
In the context of discussions regarding measures with respect to agriculture, further discussion took place at NUT 1997 cf. NUT 97/13/1, §§4.6-4.11), NEUT 1998 (cf. NEUT 98/98/15/1, §§8.6-8.11), NEUT 1999 (cf. NEUT 99/15/1, §§7.4-7.7) and EUC 2000 (cf. EUC 00/15/1, §§8.1-8.5).
EUC 2000 agreed that it should consider the need for possible additional measures with respect to agriculture in the light of the outcome of the examination of:
a. a consideration of the need for further work on PARCOM Recommendation 92/7 (planned for the 2002/2003 intersessional period);
b. the reporting on the implementation of PARCOM Recommendation 92/7 (planned for the 2001/2002 intersessional period); (cf. EUC 00/15/1, §§8.4-8.5).
4. Atmospheric deposition and ammonia emissions
The Ministers furthermore AFFIRM that they consider atmospheric deposition to contribute substantially to the anthropogenic input of nitrogen to the North Sea. The Ministers EMPHASIZE the agreement already stated at the IMM93 Statement of Conclusions concerning atmospheric deposition and:
i. INVITE the European Commission, Norway and Switzerland to continue to progress the work on limiting atmospheric emissions of nitrogen oxides including emissions from the transportation sector;
ii. INVITE the Commission to the UN-ECE Convention on Long-range Transboundary Air Pollution to pursue its work on reductions of emissions of nitrogen oxides, especially with regard to the North Sea; and
iii. NOTE that OSPAR in its Progress Report<8> to the 4NSC has reported that ammonia emissions represent 30 to 50 per cent of the total emission of nitrogen to the atmosphere. In order therefore to meet the need for an overall reduction of ammonia emissions as seen by some North Sea States, the Ministers therefore INVITE OSPAR in cooperation with other appropriate bodies to consider the justification for further reduction targets for the different sources of ammonia emissions e.g. livestock production, and in the light of a justification to consider BEPs for the reduction of these emissions.[38]
European Commisson: Atmospheric deposition not covered in the submitted EU report.
Norway:
15

Compilation of Submitted Inputs – Further reduction of nutrient inputs to the North Sea
Limiting atmospheric emissions of nitrogen oxides from sources in Norway
1. NOX emissions in Norway, sources and major trends The main sources of NOx emissions in Norway are coastal shipping and fisheries with 40 % of the emissions, road traffic 25% and the oil/gas industry offshore with almost 20 % of the emissions in 1999.
The overall NOx emissions decreased in the period 1987 – 1992 from 229.000 to 208.000 tonnes due to reduced economic activity and the introduction of tighter emission standards for vehicles. From 1992 to 1999 emissions increased to 230.000 tonnes, due to increased activity in the transportation sector, especially navigation and aviation and increased flaring offshore. This was about 1000 tonnes over the figures for 1987, and the obligation according to the Sophia Protocol.
The projection towards 2010 shows a decrease, a.o because of already approved tighter emission standards for vehicles.
16

Compilation of Submitted Inputs – Further reduction of nutrient inputs to the North Sea
2. International agreementsNorway was one of the countries which signed the Sophia protocol in 1988 with the commitment to stabilize NOx emissions at 1987 levels by 1994. Twelve countries, a.o Norway went beyond this and undertook to reduce the emissions by 30 percent from 1986 levels by 1998. Norwegian NOx emissions were consistently below the 1987 levels until as recently as 1998 only to exceed them for the first time in 1999. The target of 30 per cent reductions by 1998 was not met.
The Gothenburg Protocol implies that Norway has undertaken to reduce its emissions to156 000 tonnes nitrogen oxides (NOx) in 2010. This corresponds to a reduction of 28 per cent compared with the 1990 level, or 74.000 tonnes below the level in 1999.
3. InstrumentsTo limit the emissions of NOx a number of instruments has been used. The most important has been or are; Implementation of tighter emission standards for road traffic
1985: ECE- standard (R15-04) 1989: US 87 standard for light vehicles1993: EURO 1 standard for heavy duty vehicles1996: EURO II ” ” ”1997: EU standard for light vehicles2000: Auto-Oil I standard
Implementation of 88/609/ECE standards for big stationary combustion plants.
17

Compilation of Submitted Inputs – Further reduction of nutrient inputs to the North Sea
NOx reduction program for vessels in coastal navigation.ing financial and technical support to improvements. The program 1996-2000 gave financial support and technical assistance to measures for reduction of NOx emissions from vessels in coastal navigation and resulted in a reduction of 1400 tonnes of NOx/year.
Implementation of IMO (International Maritime Organisation) emission standards for new engines in ships; Technical Code on Control of Emission of Nitrogen Oxides from Marine Diesel Engines
Funding of measures to lower the emissions from domestic ferries A cross sectorial analysis of possible measures to reduce the emissions of NOx was carried
out in 1999. The analysis comprised both cost and effect of measures and showed that a reduction of about 30 % compared with the 1990 level can be obtained in 2010 with reasonable costs. Reductions up to 75 % are technical possible. This analysis will be useful in the further process to fulfil the commitments of the Gothenburg Protocol. However, the realization of these measures is dependent on introduction of new instruments.
Reduction of NOx Emissions in Norway – Analysis of Abatement Measures for the End-year
2010, SFT report 99:13, ISBN: 82-7655-175-0
18

Compilation of Submitted Inputs – Further reduction of nutrient inputs to the North Sea
Other policies and instruments aiming at targets like reductions of emissions of green house gases, noise and improvements of local air quality can in many cases also lead to lower NOx emissions.
Examples are;
Tigtening of criteria/standards for air quality, comprising a.o NOx;- 1992 SFT’s criteria for air quality from 1992; 100 ug/m3, - 1997 limits triggering of the need for monitoring (200 ug/m3) or action (300 ug/m3 - 1998 National targets and standards for air quality; 150 ug/m3 which is under EU’s
suggested standards of 200 ug/m3
All the instruments above are part of already approved policy and are therefor together deciding for the development of the NOx emissions as described above (base line)
Additional instruments will be necessary to realize the measures for a further reduction of the national emissions for compliance with the Gothenburg Protocol.
OSPAR:Ammonia emissions (cf. ED §38iii)
At NUT 1996, the comment was made that "this overview (cf. NUT 96/9/1) indicated that ammonia from agriculture contributed to the atmospheric emissions, and the resulting deposition, of nutrients. Taking into account that the draft OSPAR measure on the Reduction of Nutrient Inputs from Agriculture, which should be presented to NUT 1997, should address ammonia emissions (cf. § 6.9 d (v)) and that considerable amount of work and action concerning ammonia emissions was being carried out by other international organisations (e.g. CLRTAP, EMEP), there was currently no justification or need for further work on reduction measures to be initiated within the framework of OSPAR. However, the re-assessment of the need and scope for additional reduction measures on ammonia emissions should be a part of the effectiveness assessment of such an OSPAR measure on the Reduction of Nutrient Inputs from Agriculture" (cf. NUT 96/15/1, §9.11.b)
At NUT 97 some further discussion took place but no concrete action was agreed upon (cf. NUT 97/13/1, §§8.13-8.14).
Further discussion took place in the context of a discussion regarding measures with respect to agriculture (cf. §§10-11 above). The reduction of ammonia emissions is also mentioned in the OSPAR Strategy to Combat Eutrophication (see also §9 above).
Switzerland:
Progress on the implementation of Paragraph 38 i, ii ED
In 2001 a mileage, weight and emission-dependent tax for heavy duty vehicles was introduced. Switzerland also adopted the tight exhaust standards of the EU for light duty vehicles (EURO 3 as from 2000, EURO 4 as from 2005) and for heavy duty vehicles (EURO 3 as from 2000, EURO 4 as from 2005, EURO 5 as from 2008). They will lower atmospheric emissions of nitrogen oxides substantially. An incentive tax on non-renewable energy and an energy fee to promote renewable energy use were rejected in a public vote in 2000. Large
19

Compilation of Submitted Inputs – Further reduction of nutrient inputs to the North Sea
infrastructure projects to enhance capacity and attractiveness of public transport and to transfer freight traffic from the road to the rail are being carried out.
UN-ECE:Progress report on work done to pursue reductions of emission of nitrogen oxides within the framework of the Convention on Long-range Transboundary Air Pollution to the fifth North Sea Conference on the Ministerial Declaration on the Protection of the North Sea.
20

Compilation of Submitted Inputs – Further reduction of nutrient inputs to the North Sea
I The 1988 NOx ProtocolEmissions of nitrogen oxides are covered by the 1988 Sofia Protocol to the 1979 Convention on Long-range Transboundary Air Pollution on the Control of Emissions of Nitrogen Oxides or their Transboundary Fluxes. This Sofia Protocol had, as of 15 March 2001, 28 Parties. Its main obligation requires Parties to stabilize by 1994 their NOx emissions at 1987 levels, but Parties may choose an alternative base year. The Implementation Committee established under the Convention to review compliance by Parties with their Protocol obligations reviewed the implementation of this obligation in 2000 and reported the following results to the Executive Body for the Convention:
“The emission reduction obligation for the Parties to the NOx Protocol (paragraph 1 of article 2) is to control and/or reduce their total annual emissions of nitrogen oxides or their transboundary fluxes so that these, at the latest by 31 December 1994, do not exceed such emissions for 1987. At its fourteenth session in December 1996, the Executive Body confirmed its understanding that the obligation "should be taken to mean that emission levels for the years after 1994 should not exceed those specified in that paragraph."
Official submissions suggest that this requirement has not been met in several of the years 1994 - 1998 by 3 of the [in 2000] 27 Parties to the Protocol. The following Parties are in non-compliance with the obligation of paragraph 1 of article 2 of the Protocol:
- Ireland ratified the Protocol in 1994. Its emissions were 4 % above the 1987 level in 1996, 3 % in 1997 and 6 % in 1998;
- Spain’s emissions were 21 % above the 1987 level in 1994 and 1995 and 19 % in 1996. No data has yet been reported for subsequent years;
- The United States of America specified a different base year (1978) when it signed the Protocol, with the consequence that its obligation became to control and/or reduce its total annual emissions of nitrogen oxides or their transboundary fluxes so that these, at the latest by 31 December 1994, did not exceed 1978 level (21,830 kt). In addition, it had to ensure that its national average annual transboundary fluxes or national average annual emissions for the period from 1 January 1987 to 1 January 1996 did not exceed those for the calendar year 1987. Emission data provided by the United States of America shows that it did not achieve stabilization of emissions at 1978 levels in 1994. Its emissions were 5 % above the 1978 level in 1994, 4 % in 1995, 2 % in 1996, 3 % in 1997 and 1 % in 1998. Additionally, the average of its annual emissions in the period 1 January 1987 to 1 January 1996 (22,128 kt) was above its emissions in 1987 (20,689 kt).
Under paragraph 1 (b) of article 8 of the Protocol, Parties are required to report annually their levels of national emissions of nitrogen oxides. Since the following Parties have not reported emission data for the base year, it has not been possible to assess their compliance for any year:- Greece has not provided emissions data for the base year;- Luxembourg has submitted no emission data for the base year (1987), nor for the years
1991, 1992, and 1993; - The Russian Federation has reported partial data for the base year (1987), not covering
all sources. (The absence of complete data may affect the Russian Federation’s compliance with its emission-related obligations.);
- The European Community has not reported NOx emissions for any year.
The following Parties have not reported emission data for the most recent year (1998):
21

Compilation of Submitted Inputs – Further reduction of nutrient inputs to the North Sea
- Finland, France, Hungary and Slovakia have submitted only preliminary data;- Italy, Liechtenstein, Spain and Ukraine have not reported any data.”
At the meeting of the Executive Body and with reference to the above text, the delegation of the United States indicated that it had experienced national implementation problems with the diesel engine manufacturers. This had required a reassessment of NOx emission estimates. New emission estimates had been reported for recent years, but not yet for the base year of the Sofia Protocol. With updated emission estimates also for the base year, the United States would still have to be considered to have been in non-compliance in 1994 by 1.2 to 3 %, but was back in compliance since. The delegation would submit more detailed information to the secretariat.
II 1999 Protocol to Abate Acidification, Eutrophication and Ground-level OzoneAs a second step to the Sofia Protocol, the Executive Body for the Convention conducted negotiations on further reductions of nitrogen oxides to control the environmental effects related to this pollutant. As a result of these deliberations and based on elaborate scientific and technical work, it adopted in 1999 the Gothenburg Protocol to the 1979 Convention on Long-range Transboundary Air Pollution to Abate Acidification, Eutrophication and Ground-level Ozone. 31 Parties to the Convention signed this Protocol.
The Protocol deals with the environmental and health effects related to NOx and consequently covers obligations related also to other air pollutants responsible for these effects. It sets emission ceilings for 2010 for four pollutants: sulphur, NOx, VOCs and ammonia. These ceilings were negotiated on the basis of scientific assessments of pollution effects and abatement options. Countries whose emissions have a more severe environmental or health impact and whose emissions are relatively cheap to reduce will have to make the biggest cuts. Once the Protocol is fully implemented, Europe’s sulphur emissions should be cut by at least 63%, its NOx emissions by 41%, its VOC emissions by 40% and its ammonia emissions by 17% compared to 1990.
The Protocol also sets tight limit values for specific emission sources (e.g. combustion plant, electricity production, dry cleaning, cars and lorries) and requires best available techniques to be used to keep emissions down. VOC emissions from such products as paints or aerosols will also have to be cut. Finally, farmers will have to take specific measures to control ammonia emissions. Guidance documents adopted together with the Protocol provide a wide range of abatement techniques and economic instruments for the reduction of emissions in the relevant sectors, including transport.
It has been estimated that once the Protocol is implemented, the area in Europe with excessive levels of acidification will shrink from 93 million hectares in 1990 to 15 million hectares. That with excessive levels of eutrophication will fall from 165 million hectares in 1990 to 108 million hectares. The number of days with excessive ozone levels will be halved. Consequently, it is estimated that life-years lost as a result of the chronic effects of ozone exposure will be about 2,300,000 lower in 2010 than in 1990, and there will be approximately 47,500 fewer premature deaths resulting from ozone and particulate matter in the air. The exposure of vegetation to excessive ozone levels will be 44 % down on 1990.
22

Compilation of Submitted Inputs – Further reduction of nutrient inputs to the North Sea
III Development of overall nitrogen oxides emissionsBased on emission data officially submitted by June 2000 (interpolating for missing data), the picture shown in the figure below emerges. The emissions of NOx are characterized by relatively high releases in the late 1980s and an easing-off in the 1990s. The reduction is 15% between 1980 and 1998.
Figure. Emissions of nitrogen oxides in the EMEP area 1980-2010 (millions of tonnes as NO2)
23

Compilation of Submitted Inputs – Further reduction of nutrient inputs to the North Sea
Compilation of Submitted Inputs
Further reduction of nutrient inputs to the North Sea
Part II:Inputs of nutrients using HARP-NUT Guidelines
24

Compilation of Submitted Inputs – Further reduction of nutrient inputs to the North Sea
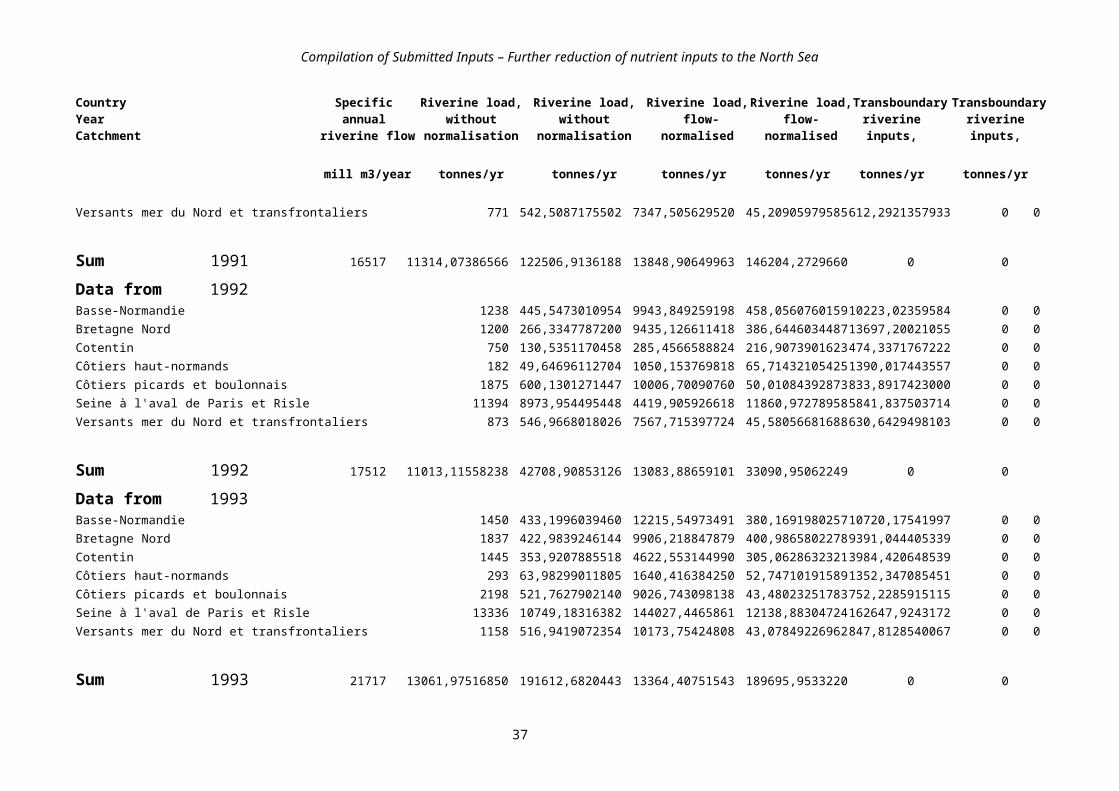
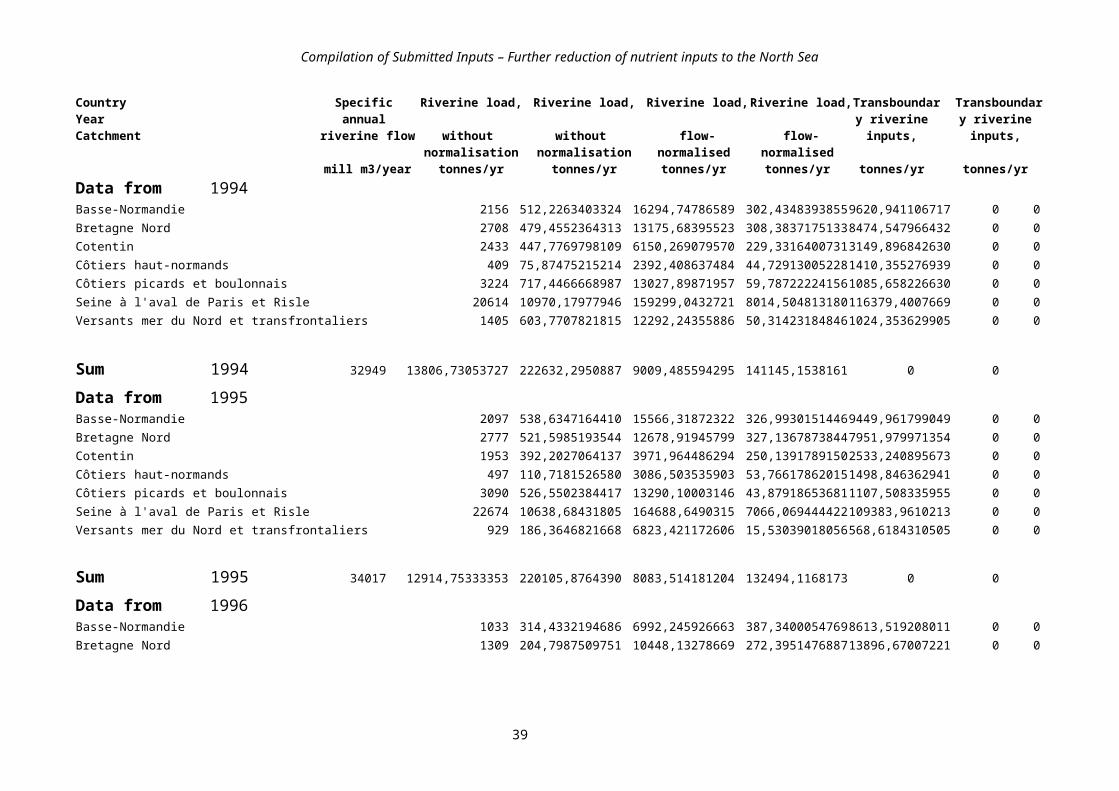
Data on nutrient inputs submitted from France
figures (tonnes/year)Country Specific Riverine load, Riverine load, Riverine load, Riverine load, Transboundary TransboundaryYear annual without without flow- flow- riverine riverine Catchment riverine flow normalisation normalisation normalised normalised inputs, inputs,
mill m3/year tonnes/yr tonnes/yr tonnes/yr tonnes/yr tonnes/yr tonnes/yr FranceData from 1990Basse-Normandie 772 278,7241397462 6011,205190562 459,6655270855 9913,543207469 0 0Bretagne Nord 1248 215,0340236470 7295,759466888 300,1044144146 10182,06135655 0 0Cotentin 531 84,32186881731 224,5258543929 197,6604272627 526,3151414134 0 0Côtiers haut-normands 201 52,33188179609 1122,805519299 62,71428029017 1345,564837951 0 0Côtiers picards et boulonnais 1748 368,9205363364 8622,500861624 30,74337802803 718,5417384687 0 0Seine à l'aval de Paris et Risle 10527 10853,66414619 83698,91197857 15527,77339127 119743,6847863 0 0Versants mer du Nord et transfrontaliers 584 306,0958970479 6478,689586129 25,50799142066 539,8907988441 0 0
Sum 1990 15611 12159,09249358 113454,3984574 16604,16940977 142969,6018670 0 0
Data from 1991Basse-Normandie 634 188,2973006675 4518,914586406 378,0039660906 9071,652275580 0 0Bretagne Nord 1210 187,4881101389 7608,336833235 269,9598659617 10955,07117848 0 0Cotentin 506 91,16305303599 198,6283844642 224,4272747693 488,9878687975 0 0Côtiers haut-normands 207 67,68061781129 1151,047680228 78,95335296448 1342,763655459 0 0Côtiers picards et boulonnais 1723 482,3577127152 7984,122068279 40,19647605960 665,3435056899 0 0Seine à l'aval de Paris et Risle 11466 9754,578353745 93698,35843666 12812,15650399 123068,1623462 0 0
17. august 2001 Page 1 of 5
25

Compilation of Submitted Inputs – Further reduction of nutrient inputs to the North Sea
Country Specific Riverine load, Riverine load, Riverine load, Riverine load, Transboundary TransboundaryYear annual without without flow- flow- riverine riverine Catchment riverine flow normalisation normalisation normalised normalised inputs, inputs,
mill m3/year tonnes/yr tonnes/yr tonnes/yr tonnes/yr tonnes/yr tonnes/yr
Versants mer du Nord et transfrontaliers 771 542,5087175502 7347,505629520 45,20905979585 612,2921357933 0 0
Sum 1991 16517 11314,07386566 122506,9136188 13848,90649963 146204,2729660 0 0
Data from 1992Basse-Normandie 1238 445,5473010954 9943,849259198 458,0560760159 10223,02359584 0 0Bretagne Nord 1200 266,3347787200 9435,126611418 386,6446034487 13697,20021055 0 0Cotentin 750 130,5351170458 285,4566588824 216,9073901623 474,3371767222 0 0Côtiers haut-normands 182 49,64696112704 1050,153769818 65,71432105425 1390,017443557 0 0Côtiers picards et boulonnais 1875 600,1301271447 10006,70090760 50,01084392873 833,8917423000 0 0Seine à l'aval de Paris et Risle 11394 8973,954495448 4419,905926618 11860,97278958 5841,837503714 0 0Versants mer du Nord et transfrontaliers 873 546,9668018026 7567,715397724 45,58056681688 630,6429498103 0 0
Sum 1992 17512 11013,11558238 42708,90853126 13083,88659101 33090,95062249 0 0
Data from 1993Basse-Normandie 1450 433,1996039460 12215,54973491 380,1691980257 10720,17541997 0 0Bretagne Nord 1837 422,9839246144 9906,218847879 400,9865802278 9391,044405339 0 0Cotentin 1445 353,9207885518 4622,553144990 305,0628632321 3984,420648539 0 0Côtiers haut-normands 293 63,98299011805 1640,416384250 52,74710191589 1352,347085451 0 0Côtiers picards et boulonnais 2198 521,7627902140 9026,743098138 43,48023251783 752,2285915115 0 0Seine à l'aval de Paris et Risle 13336 10749,18316382 144027,4465861 12138,88304724 162647,9243172 0 0Versants mer du Nord et transfrontaliers 1158 516,9419072354 10173,75424808 43,07849226962 847,8128540067 0 0
Sum 1993 21717 13061,97516850 191612,6820443 13364,40751543 189695,9533220 0 0
17. august 2001 Page 2 of 5
26

Compilation of Submitted Inputs – Further reduction of nutrient inputs to the North Sea
Country Specific Riverine load, Riverine load, Riverine load, Riverine load, Transboundar TransboundarYear annual y riverine y riverine Catchment riverine flow without without flow- flow- inputs, inputs,
normalisation normalisation normalised normalised mill m3/year tonnes/yr tonnes/yr tonnes/yr tonnes/yr tonnes/yr tonnes/yr
Data from 1994Basse-Normandie 2156 512,2263403324 16294,74786589 302,4348393855 9620,941106717 0 0Bretagne Nord 2708 479,4552364313 13175,68395523 308,3837175133 8474,547966432 0 0Cotentin 2433 447,7769798109 6150,269079570 229,3316400731 3149,896842630 0 0Côtiers haut-normands 409 75,87475215214 2392,408637484 44,72913005228 1410,355276939 0 0Côtiers picards et boulonnais 3224 717,4466668987 13027,89871957 59,78722224156 1085,658226630 0 0Seine à l'aval de Paris et Risle 20614 10970,17977946 159299,0432721 8014,504813180 116379,4007669 0 0Versants mer du Nord et transfrontaliers 1405 603,7707821815 12292,24355886 50,31423184846 1024,353629905 0 0
Sum 1994 32949 13806,73053727 222632,2950887 9009,485594295 141145,1538161 0 0
Data from 1995Basse-Normandie 2097 538,6347164410 15566,31872322 326,9930151446 9449,961799049 0 0Bretagne Nord 2777 521,5985193544 12678,91945799 327,1367873844 7951,979971354 0 0Cotentin 1953 392,2027064137 3971,964486294 250,1391789150 2533,240895673 0 0Côtiers haut-normands 497 110,7181526580 3086,503535903 53,76617862015 1498,846362941 0 0Côtiers picards et boulonnais 3090 526,5502384417 13290,10003146 43,87918653681 1107,508335955 0 0Seine à l'aval de Paris et Risle 22674 10638,68431805 164688,6490315 7066,069444422 109383,9610213 0 0Versants mer du Nord et transfrontaliers 929 186,3646821668 6823,421172606 15,53039018056 568,6184310505 0 0
Sum 1995 34017 12914,75333353 220105,8764390 8083,514181204 132494,1168173 0 0
Data from 1996Basse-Normandie 1033 314,4332194686 6992,245926663 387,3400054769 8613,519208011 0 0Bretagne Nord 1309 204,7987509751 10448,13278669 272,3951476887 13896,67007221 0 0
17. august 2001 Page 3 of 5
27

Compilation of Submitted Inputs – Further reduction of nutrient inputs to the North Sea
Country Specific Riverine load, Riverine load, Riverine load, Riverine load, Transboundary TransboundaryYear annual without without flow- flow- riverine riverine Catchment riverine flow normalisation normalisation normalised normalised inputs, inputs,
mill m3/year tonnes/yr tonnes/yr tonnes/yr tonnes/yr tonnes/yr tonnes/yr
Cotentin 728 203,7871099901 1513,728194817 348,5521764528 2589,041362268 0 0Côtiers haut-normands 176 32,16200468250 1043,908888225 44,19988907410 1434,632496280 0 0Côtiers picards et boulonnais 1533 316,1543430529 8334,334042415 26,34619525441 694,5278368679 0 0Seine à l'aval de Paris et Risle 11718 8458,248727191 100194,7559019 10870,49801545 128769,7879692 0 0Versants mer du Nord et transfrontaliers 366 349,3650604766 2976,115349125 29,11375503972 248,0096124271 0 0
Sum 1996 16863 9878,949215837 131503,2210899 11978,44518444 156246,1885572 0 0
Data from 1997Basse-Normandie 1042 247,5526412334 7244,177281431 302,5465653703 8853,474333823 0 0Bretagne Nord 1118 185,1466343468 6388,379686976 288,4235038386 9951,889537013 0 0Cotentin 1164 264,5915198233 3115,434398052 283,3121786444 3335,860904859 0 0Côtiers haut-normands 144 31,96050975608 99,56456261165 53,46189255144 166,5464659011 0 0Côtiers picards et boulonnais 1433 327,6637397150 4385,176852604 27,30531164292 365,4314043837 0 0Seine à l'aval de Paris et Risle 13129 9337,382026787 105501,3456579 10710,29179972 121013,5982462 0 0Versants mer du Nord et transfrontaliers 390 158,4665486996 1078,388568300 13,20554572496 89,86571402500 0 0
Sum 1997 18420 10552,76362036 127812,4670079 11678,54679750 143776,6666062 0 0
Data from 1998Basse-Normandie 1615 343,6462624391 12384,62845408 270,7790173034 9758,574118232 0 0Bretagne Nord 2216 377,7703411735 23007,40848050 296,9158777063 18083,11595217 0 0Cotentin 1980 402,3981405470 14776,59638680 253,2404430346 9299,326807155 0 0Côtiers haut-normands 216 33,19726927241 194,9004645148 37,17903391709 218,2773203782 0 0Côtiers picards et boulonnais 887 151,5956450019 12,63297041683 0 0Seine à l'aval de Paris et Risle 16879 8804,342268502 5269,546706798 7855,553782642 4701,680864167 0 0
17. august 2001 Page 4 of 5
28

Compilation of Submitted Inputs – Further reduction of nutrient inputs to the North Sea
Country Specific Riverine load, Riverine load, Riverine load, Riverine load, Transboundary TransboundaryYear annual without without flow- flow- riverine riverine Catchment riverine flow normalisation normalisation normalised normalised inputs, inputs,
mill m3/year tonnes/yr tonnes/yr tonnes/yr tonnes/yr tonnes/yr tonnes/yr
Versants mer du Nord et transfrontaliers 790 60,8357917008 2124,224292902 5,0696493084 177,0186910752 0 0
Sum 1998 24583 10173,78571863 57757,30478561 8731,370774328 42237,99375318 0 0
Data from 1999Basse-Normandie 1280 323,0733580588 10165,05683930 321,2333061485 10107,16214823 0 0Bretagne Nord 2506 370,6911616245 23940,29677739 257,6408196202 16639,18194501 0 0Cotentin 2022 425,0884261619 14644,25419775 261,9368943520 9023,700078816 0 0Côtiers haut-normands 295 61,15764624850 333,5082555849 49,96168541119 272,4538233512 0 0Côtiers picards et boulonnais 1141 177,1450813550 14,76209011291 0 0Seine à l'aval de Paris et Risle 18862 13726,94068480 5220,272447843 10959,86657255 4167,970913143 0 0Versants mer du Nord et transfrontaliers 913 28,04936104927 1600,195228481 2,337446754106 133,3496023734 0 0
Sum 1999 27019 15112,14571930 55903,58374636 11867,73881494 40343,81851093 0 017. august
Further reporting from France by clicking on the icon below20
29

Compilation of Submitted Inputs – Further reduction of nutrient inputs to the North Sea
ggg
Background to the Reductions of Inputs of Nutrients reported by the UK
This paper complements the estimates of reductions in the inputs (waterborne loads via the aquatic pathway) of the nutrients nitrogen (N) and phosphorus (P) reported by the UK to the 5NSC. It provides background information on the sources of data and describes the methods used to assess reductions. The reliability and limitations of the data are considered. The information provided in this background documentation should not be used out of the context in which it has been supplied.
General AspectsThe aim is to provide best estimates of UK reductions in the inputs of N and P since 1985. This is in the context of the reports made to the 5NSC by other North Sea States that have identified marine eutrophication problem areas and are, therefore, subject to the commitment to achieve 50% reductions in inputs over the period 1985 to 1995. (The outcome of the current assessment of eutrophication status of the OSPAR maritime area - under the Common Procedure - will determine the extent to which the UK will be subject to the 50% reduction commitment).
Additionally, information is provided on inputs and reductions of N and P from the Thames catchment (ICES Zone 12). This is to update Table 3.4.5 of the Progress Report to the 4NSC and to fulfil the recommendation of OSPAR 2000 in respect of reporting nutrient inputs via major North Sea rivers (ref section 9.13 of Summary Record OSPAR 2000).
Generally, in estimating reductions in inputs, the load approach has been used, ie one of the two basic methods for reporting contained in the HARP NUT Guidelines. (The load approach accords with the method used by the UK in its reporting of baseline estimates to the 3NSC and Thames inputs to the 4NSC).
Table 1 below provides an overall summary of reductions achieved in inputs of nutrients for the UK and for the Thames catchment respectively. More detailed information relating to the inputs and emissions data and any trends is given in the following section and in Annexes 1-5. Table 1: Reductions 1985-1999 in UK Inputs of Nutrients for ‘All UK’ and Thames Catchments
CatchmentArea
1985 InputNitrogen
1985 InputPhosphorus
1999 InputNitrogen
1999 InputPhosphorus
ReductionNitrogen
ReductionPhosphorus
kt/year kt/year kt/year kt/year % %
All UK 319 58.4 355 33.0 -11 (A) 43Thames 40.5 10.9 29.0 6.0 28 45
Note (A): 1985 base line figure appears to be an underestimate, so the indicated increase will be a worst case. The data for 1990-1999 indicate no underlying change in inputs of nitrogen.
31

Compilation of Submitted Inputs – Further reduction of nutrient inputs to the North Sea
Data and Assessment MethodUse has been made of the most recent OSPAR RID data for riverine and direct inputs to supplement the data already reported in 1990 (3NSC) and 1995 (4NSC). Only Total-N and Orthophosphate-P data is available for the 1985 baseline year. Although more detailed nutrient information became available in the 1990s, in order to be consistent over the period 1985-1999, the assessment of reductions is based on the pattern of change in the inputs of Total-N and Orthophosphate-P. Data abstracted from the relevant sources is given in Annexes 1, 2, 4 and 3.
It is recognised that there is variability in any estimates for a given year due to natural factors, such as weather. There may be other variability due to refinements in analytical techniques or gaps in reporting. Also, estimates for a given year are likely to be more reliable towards the end of the time series than at the beginning (when there was little or no basis for comparing estimates and checking for anomalies). In order to limit the effect of such variability, consideration has been given to the whole time series of data available and a smoothed curve determined for each series of nutrient inputs. More is given on the refinement of this graphical technique below.
As noted above, direct and riverine inputs of nutrients are both taken into account in UK input reduction estimates. Diffuse inputs direct to the sea, eg inputs via leaching and surface water run off downstream of the riverine monitoring point have not been allowed for. This leads to a small (order 10%) under-estimation of the true annual inputs. As this under-estimation is consistent year on year, it such it should not materially affect the estimates of reductions in inputs.
As most results for nutrients monitoring are above the level of detection (LOD), there is no significant difference in the upper and lower estimates reported to OSPAR. In view of this, only upper estimates have been used in this assessment of reductions.
Generally, it is acknowledged within OSPAR that any individual direct or riverine input estimate is only accurate to within +/- 30-50%. The aggregation of individual estimates and “smoothing” such aggregated estimates over a period will increase precision. Generally, even with such mitigating factors it would be unwise to assume that any “smoothed” estimate of input is better than +/-10% in its accuracy. It follows that any estimate of reduction has the same order of reliability.
A factor affecting riverine estimates is the variability arising due to flow variation. In the UK, the 1990s have been marked by extremes in riverine flow rate, with 1996 and 1997 being well below average and 1998 and 1999 being well above average. This introduces variability for UK riverine input estimates of the order +/- 20%. Because of flow extremes, inputs for 1996 and 1997 are likely to be under-estimates and inputs for 1998 and 1999 are likely to be over-estimates. An abstract of riverine flow data reported to OSPAR is given in Annex 1.
In order to compensate for this flow related variation, a simple flow adjustment of riverine inputs has been applied. This involves dividing the riverine input for a given year by a flow-weighting factor (produced by dividing the long term average (LTA) flow by the actual flow for the given year). This adjustment has been applied to the input data from 1991 to 1999, these being the years that flow data have been reported to OSPAR under RID. The charts given in Annexes 2, 3, 4 and 5 show how the inputs vary before and after flow adjustment.
For Total-N and Orthophosphate-P, where UK 1985 baseline input estimates have been reported to the 3NSC, a smoothed curve was drawn to reflect the flow adjusted inputs but constrained to pass through the 1985 estimate. Reduction estimates for these substances are based on the “smoothed” estimate for 1999. The smoothed curves and reduction estimates are given in Annexes 3 and 5.
32

Compilation of Submitted Inputs – Further reduction of nutrient inputs to the North Sea
Although for the more recent data sets, direct and riverine estimates were derived, UK reduction estimates are based on the total (riverine plus direct) inputs. This is because the original 1985 estimates that are available are total input estimates. Also, for assessing national reductions, there is no general benefit to be gained by considering reductions of direct and riverine inputs separately. However, it is worth noting that direct inputs of N and P from the UK have decreased by about 30% and 35% respectively over the period 1990-1999.
The above approach of considering inputs to assess UK reductions is subject to any limitations in the 1985 baseline estimates. From the consideration of UK annual input estimates throughout the 1990s, it would appear that the 1985 input of nitrogen is probably an underestimate. Consequently, the 11% increase in nitrogen indicated is very much a worst case estimate. Consideration of the more consistent inputs data over the period 1991-1999 would indicate that there has probably been no significant underlying change in overall inputs of nitrogen since 1985.
ThamesReductions in nutrient inputs relating to the Thames catchment are given in Table 1 above. The Table in Annex 6 provides the data on inputs and flows in the same format as Table 3.4.5 of the Progress Report to the 4NSC. The additional input data, for the period 1994-1999, is that reported to OSPAR for ICES Zone 12. The chart in Annex 6 shows how flows and inputs have varied. A smoother curve has been added to indicate the underlying pattern of change in the inputs of nitrogen, which have been highly variable in recent years.
Conclusions
1. GeneralInput estimates are valuable in that they provide an annual estimate of the net aquatic input of nutrients to the marine environment from both point and diffuse land based sources. Typically for the UK, nitrogen and phosphorus inputs are of the order 350kt/year and 35kt/year respectively. In addition to the absolute value of input, inputs data allows the year on year variation to be evaluated. In respect of riverine inputs, this variation is significant. For nitrogen, UK riverine inputs varied in the range 200-340 kt/year during the 1990s.
2. UK (National) ReductionsFrom the analysis of flow adjusted inputs of Total-N and Orthophosphate-P, UK inputs of nitrogen would appear to have increased by 11% and the inputs of phosphorus have reduced by 43%.
The 11% increase indicated above is very much a worst case. This is due to limitations in the 1985 baseline estimate. Consideration of the more consistent inputs data over the period 1991-1999 would indicate that there has been no significant underlying change in overall inputs of nitrogen since 1985.
Flow variations have lead to wide variations in the riverine inputs of nitrogen and phosphorus, especially in recent years.
Direct (sewage and industrial) inputs of both nitrogen and phosphorus have reduced by about 30% and 35% respectively over the period 1990-1999 for which the related OSPAR RID inputs data is available.
33

Compilation of Submitted Inputs – Further reduction of nutrient inputs to the North Sea
3. Thames (ICES Zone 12) ReductionsSince 1985, there has been a reduction in inputs of both nitrogen and phosphorus from the Thames catchment. Not taking into account the wide flow related variations, actual reductions were 15% and 35% respectively. Consideration of “smoothed” inputs (which balance out the inter-annual variations), indicates that over the period 1985-1999 the reductions in inputs of nitrogen and phosphorus were of the order 28% and 45% respectively.
34

Compilation of Submitted Inputs – Further reduction of nutrient inputs to the North Sea
35

Compilation of Submitted Inputs – Further reduction of nutrient inputs to the North Sea
36
Compilation of Submitted Inputs – Further reduction of nutrient inputs to the North Sea
37
Compilation of Submitted Inputs – Further reduction of nutrient inputs to the North Sea
38
Compilation of Submitted Inputs – Further reduction of nutrient inputs to the North Sea
39
Compilation of Submitted Inputs – Further reduction of nutrient inputs to the North Sea
40

Compilation of Submitted Inputs – Further reduction of nutrient inputs to the North Sea
Report from BelgiumCatchment description summary report – national figures
Catchment name Catchment Lake River Total Long term Water Water Populatio
Area Surface Surface n annual flow
Meuse 13824 0 0 2451043 5500
Rhine 767 0 0 33371 0
Scheldt 0 0 0 7670422 4244,8
Seine 79 0 0 2292 0
Whole country 0 0 0 0 0
Sum Belgium 14670 0 0 10157128 9744,8
Retention in surface waters summary report – national figures (tonnes/year)
Country Tot-N Tot-N Tot-N Tot-P Tot-P Tot-P Tot-N Tot-Year Coastal Unmonitore Monitored Coastal Unmonitore Monitored PCatchment area d inland area d inland
inland inlandBelgiumData from 2000Meuse 0 5939 0 0 1014 0 5939 1014Rhine 0 0 0 0 0 0 0 0Scheldt 0 2140 0 0 271 0 2140 271Seine 0 0 0 0 0 0 0 0
41

Compilation of Submitted Inputs – Further reduction of nutrient inputs to the North Sea
Sum 2000 0 8079 0 0 1285 0 8079 1285
Riverine load summary report - national figures (tonnes/year)
Country Specific Riverine load, Riverine load, Riverine load, Riverine load, Transboundar TransboundarYear annual y riverine y riverine Catchment riverine flow without without flow- flow- inputs, inputs,
normalisation normalisation normalised normalised mill m3/year tonnes/yr tonnes/yr tonnes/yr tonnes/yr tonnes/yr tonnes/yr
BelgiumData from 2000Meuse 5500 0 0 0 0 9384 448Rhine 0 0 0 0 0 0 0Scheldt 4245 4670 52286 0 0 48968 3722Seine 0 0 0 0 0 0 0
Sum 2000 9745 4670 52286 0 0 58352 4170
All anthropogenic sources nitrogen (tonnes/year)
Country WWTP Industry Aquaculture Households Diffuse Sum Year sources
Belgium2000 30668,09 4324,06 84 1350,11 0 36426,26
42

Compilation of Submitted Inputs – Further reduction of nutrient inputs to the North Sea
All anthropogenic sources phosphorous (tonnes/year)
Country WWTP Industry Aquaculture Households Diffuse Sum Year sources
Belgium2000 7309,64 602,26 13,9 203,73 0 8129,53
Aquaculture summary report
Country Tot- N Tot-N Tot- N Tot-P Tot-P Tot-P Tot-N Tot-P Year Coastal Inland Inland Coasta Inland Inland Catchment monitore unmonitore l monitore unmonitore
areaBelgiumData from 2000Whole country 0 84 0 0 13,9 0 84 13,9
Sum 2000 0 84 0 0 13,9 0 84 13,9
Sewage works and sewerage summary report (tonnes/year)
Country Tot-N Tot-N Tot-N Tot-P Tot- P Tot-P Tot-N Tot-P Year Coastal Inland Inland Coastal Inland Inland Catchment name area monitored unmonitored area monitored unmonitore
dBelgiumData from 2000
Meuse 0 6734,01 0 0 1024,84 0 6734,01 1024,84
43

Compilation of Submitted Inputs – Further reduction of nutrient inputs to the North Sea
Rhine 0 71 0 0 10 0 71 10Scheldt 0 23862,08 0 0 3274,8 0 23862,08 6274,8Seine 0 1 0 0 0 0 1 0Sum 2000 0 30668,09 0 0 4309,64 0 30668,09 7309,64
Households not connected to public sewerage summary report - national figures (tonnes/year)
Country Tot-N Tot-N Tot-N Tot-P Tot-P Tot-P Tot-N Tot-P Year Coastal Inland Inland Coastal Inland Inland Catchment name area monitored unmonitored area monitored unmonitore
d
Data from 2000Meuse 0 348,67 0 0 40,9 0 348,67 40,9Rhine 0 22 0 0 2 0 22 2Scheldt 0 978,44 0 0 160,83 0 978,44 160,83Seine 0 1 0 0 0 0 1 0Sum 2000 0 1350,11 0 0 203,73 0 1350,11 203,73
Industrial plants report – National figures (tonnes/year)
Country Tot-N Tot-N Tot-N Tot-P Tot-P Tot-P Tot-N Tot-P Year Coastal Inland Inland Coastal Inland Inland Catchment area monitored unmonitored area monitored unmonitorename dData from 2000Catchment area Meuse
Cookeries/refineries 0 103,83 0 0 0,2 0 103,83 0,2
44

Compilation of Submitted Inputs – Further reduction of nutrient inputs to the North Sea
Fertiliser industry 0 4,92 0 0 108,05 0 4,92 108,05Food/drink related industry 0 119,08 0 0 24,9 0 119,08 24,9Org. chemical/bio-chemical 0 56,16 0 0 5,63 0 56,16 5,63Other sectors 0 200,22 0 0 6,84 0 200,22 6,84Pulp/paper industry 0 100,75 0 0 11,61 0 100,75 11,61Waste processing industry 0 75,59 0 0 1,16 0 75,59 1,16Sum Meuse 0 660,55 0 0 158,39 0 660,55 158,39
Catchment area Scheldt
Cookeries/refineries 0 237,04 0 0 7,36 0 237,04 7,36Fertiliser industry 0 341,46 0 0 12,73 0 341,46 12,73Food/drink related industry 0 422,29 0 0 187,5 0 422,29 187,5Org. chemical/bio-chemical 0 1529,34 0 0 150,89 0 1529,34 150,89Other sectors 0 1008,54 0 0 82,63 0 1008,54 82,63
Industry Pulp/paper industry 0 1,4 0 0 -0,9 0 1,4 -0,9Waste processing industry 0 123,44 0 0 3,66 0 123,44 3,66Sum Scheldt 0 3663,51 0 0 443,87 0 3663,51 443,87
Sum 2000 0 4324,06 0 0 602,26 0 4324,06 602,26
Diffuse losses summary report (surface water) – national figures (tonnes/year))
Country Normalised Tot-N Tot-P Tot-N Tot-P Tot- N Tot-P Tot-N Tot-P Tot-N Tot-PYear or Agric Agric Dir. Dir. Other Other Backgr Backgr (Agric (Agric +Catchment dep. dep. +
Dir. dep Dir. dep + +
Other - Other -BelgiumData from 2000
45

Compilation of Submitted Inputs – Further reduction of nutrient inputs to the North Sea
Meuse 14098,7 775,1 0 0 0 0 0 0 14098,7 775,1Rhine 449 36 0 0 0 0 0 0 449 36Scheldt 31012,2 1501,85 0 0 0 0 0 0 31012,2 1501,85Seine 0 0 0 0 0 0 0 0 0 0
Sum 2000 45559,9 2312,95 0 0 0 0 0 0 45559,9 2312,95
Sent by e-mail:
1985-N-Agriculture= 39580 t1985-N-Industry=29280 t1985-N-Households=31960 t
1995-N-Agriculture=36386 t1995-N-Industry=15274 t1995-N-Households=31764 t
1985-P-Agriculture=2470 t1985-P-Industry=5460 t1985-P-Households=9870 t
1995-P-Agriculture=1680 t1995-P-Industry=3370 t1995-P-Households=4810 t
Note that the figures for 1995 have been verified in 1998 (because we reported estimations made in 1993 to the Fourth North Sea Conference) but the P figures for 1995 have not been verified after 1995.
ALL the Belgian data are year specific. Belgium does not carries out the normalisation procedure (because this procedure is only optional in the RID Programme of OSPAR if my understanding is right).As far as the HARP data are concerned, because the HARP Guideline makes reference to the RID, we understand that providing normalized data is an option only (the non option is the agreement to provide year specific data).
46
Compilation of Submitted Inputs – Further reduction of nutrient inputs to the North Sea
Report from DenmarkCatchment description summary report – national figures
Catchment name Catchment Lake River Total Long term Water Water Populatio
Area Surface Surface n annual flow
Mar 11-12 1810 19,62 0 122610 846
Mar 13 3485 37,54 0 149334 1612
Mar 14-15 341 2,02 0 9649 68
Mar 16 5180 17,49 0 321396 2239
Mar 2 1098 2,47 0 75355 369
Mar 30 139 0 0 4475 41
Mar 31-32-33 2079 7,74 0 435672 401
Mar 34 725 7,73 0 42253 203
Mar 35 3498 74,67 0 344055 1343
Mar 36 743 2,98 0 36617 196
Mar 37 7608 92,13 0 542440 2556
Mar 38-39 1057 1,97 0 93320 376
Sum Denmark 27763 266,36 0 2177176 10250
Retention in surface waters summary report – national figures (tonnes/year)
Country Tot-N Tot-N Tot-N Tot-P Tot-P Tot-P Tot-N Tot-Year Coastal Unmonitore Monitored Coastal Unmonitore Monitored PCatchment area d inland area d inland
inland inland
47
Compilation of Submitted Inputs – Further reduction of nutrient inputs to the North Sea
DenmarkData from 2000Mar 11-12 0 0 283 0 0 1,9 0 0Mar 13 0 0 542 0 0 3,6 0 0Mar 14-15 0 0 29 0 0 0,2 0 0Mar 16 0 0 264 0 0 1,6 0 0Mar 2 0 0 36 0 0 0,2 0 0Mar 30 0 0 0 0 0 0 0 0Mar 31-32-33 0 0 263 0 0 -5,5 0 0Mar 34 0 0 112 0 0 0,7 0 0Mar 35 0 0 1201 0 0 9,1 0 0Mar 36 0 0 43 0 0 0,3 0 0Mar 37 0 0 1350 0 0 9 0 0Mar 38-39 0 0 28 0 0 0,2 0 0
Sum 2000 0 0 4151 0 0 21,3 0 0
Riverine load summary report - national figures (tonnes/year)
Country Specific Riverine load, Riverine load, Riverine load, Riverine load, Transboundar TransboundarYear annual y riverine y riverine Catchment riverine flow without without flow- flow- inputs, inputs,
normalisation normalisation normalised normalised mill m3/year tonnes/yr tonnes/yr tonnes/yr tonnes/yr tonnes/yr tonnes/yr
DenmarkData from 1991Mar 11-12 811 77 3251 89 3766 0 0Mar 13 1466 130 5529 151 6404 0 0Mar 14-15 52 4 569 4,6 659 0 0Mar 16 1916 303 9497 351 11000 0 0Mar 2 292 94 1985 118 2498 0 0Mar 30 33 2 186 2 210 0 0Mar 31-32-33 447 150 3069 169 3463 0 0
48

Compilation of Submitted Inputs – Further reduction of nutrient inputs to the North Sea
Mar 34 138 15 859 17 969 0 0Mar 35 1174 148 4529 167 5111 0 0Mar 36 164 17 990 19 1117 0 0Mar 37 2294 327 15633 369 17642 0 0Mar 38-39 283 41 1796 46 2027 0 0
Sum 1991 9070 1308 47893 1502,6 54866 0 0
Data from 1992Mar 11-12 827 69 4165 75 4515 0 0
13 Mar 13 1668 128 7436 139 8161 0 0Mar 14-15 69 7 803 7,6 871 0 0Mar 16 1990 252 11883 273 12882 0 0Mar 2 297 80 2303 98 2834 0 0Mar 30 32 2 221 23 252 0 0Mar 31-32-33 375 96 3312 109 3777 0 0Mar 34 120 10 853 11 973 0 0Mar 35 1241 124 4982 141 5681 0 0Mar 36 152 22 1532 25 1747 0 0Mar 37 2286 332 17861 379 20369 0 0Mar 38-39 287 30 2056 34 2345 0 0
Sum 1992 9344 1152 57407 1314,6 64407 0 0
Data from 1993Mar 11-12 770 84 3256 90 3488 0 0Mar 13 1519 117 6110 125 6546 0 0Mar 14-15 60 9 542 10 581 0 0Mar 16 2257 257 11583 275 12409 0 0Mar 2 269 62 1998 84 2709 0 0Mar 30 34 4 238 45 268 0 0Mar 31-32-33 380 121 3972 136 4467 0 0Mar 34 168 13 862 14 969 0 0Mar 35 1254 121 5299 136 5959 0 0Mar 36 163 28 1675 31 1884 0 0Mar 37 2243 304 15789 342 17756 0 0
13. Mar 38-39 311 40 2169 45 2439 0 0
Sum 1993 9428 1160 53493 1333 59475 0 0
49

Compilation of Submitted Inputs – Further reduction of nutrient inputs to the North Sea
Data from 1994Mar 11-12 1027 130 4599 104 3672 0 0Mar 13 2022 172 7763 137 6199 0 0Mar 14-15 111 37 863 30 689 0 0Mar 16 3019 344 13941 275 11132 0 0Mar 2 466 121 3165 95 2479 0 0Mar 30 53 10 342 76 261 0 0Mar 31-32-33 633 130 5161 99 3942 0 0Mar 34 252 25 1325 19 1012 0 0Mar 35 1736 194 7408 148 5659 0 0Mar 36 234 49 2082 37 1590 0 0Mar 37 3302 508 21378 388 16331 0 0Mar 38-39 501 92 3148 70 2405 0 0
Sum 1994 13356 1812 71175 1478 55371 0 0
Data from 1995Mar 11-12 880 70 3303 64 3042 0 0Mar 13 1845 150 6329 138 5830 0 0Mar 14-15 90 29 419 27 386 0 0Mar 16 2541 300 10935 276 10072 0 0Mar 2 363 87 2300 87 2313 0 0Mar 30 42 6 202 6 187 0 0
Mar 31-32-33 458 105 3455 97 3202 0 0Mar 34 208 19 1137 18 1054 0 0Mar 35 1534 154 5824 143 5398 0 0Mar 36 235 34 1845 32 1710 0 0Mar 37 2677 369 17320 342 16054 0 0Mar 38-39 378 64 1920 57 1780 0 0
Sum 1995 11251 1387 54989 1287 51028 0 0
Data from 1996Mar 11-12 504 31 1853 54 3222 0 0Mar 13 1030 89 3900 155 6780 0 0Mar 14-15 19 1,6 277 2,8 482 0 0Mar 16 1284 157 5836 273 10147 0 0Mar 2 237 54 1590 80 2369 0 0Mar 30 32 4 142 6 211 0 0Mar 31-32-33 131 47 674 70 1000 0 0
50

Compilation of Submitted Inputs – Further reduction of nutrient inputs to the North Sea
Mar 34 142 16 858 24 1273 0 0Mar 35 965 92 3060 122 4542 0 0Mar 36 166 24 1310 36 1944 0 0Mar 37 1746 262 10507 389 15594 0 0Mar 38-39 272 38 1336 56 1983 0 0
Sum 1996 6528 815,6 31343 1267,8 49547 0 0
Data from 1997Mar 11-12 572 39 2044 62 3253 0 0
Mar 13 1093 74 3385 118 5387 0 0Mar 14-15 18 2,7 297 4,3 473 0 0Mar 16 1417 163 6152 259 9790 0 0Mar 2 245 52 1481 77 2207 0 0Mar 30 31 4 140 6 199 0 0Mar 31-32-33 178 44 885 62 1257 0 0Mar 34 141 15 949 21 1347 0 0Mar 35 1040 113 3183 160 4520 0 0Mar 36 164 21 1162 30 1650 0 0Mar 37 1790 257 11387 365 16168 0 0Mar 38-39 266 41 1303 58 1850 0 0
Sum 1997 6955 825,7 32368 1222,3 48101 0 0
Data from 1998Mar 11-12 862 67 3368 66 3302 0 0Mar 13 1574 113 5530 111 5422 0 0Mar 14-15 61 10 363 9,8 356 0 0Mar 16 2535 288 12039 282 11804 0 0Mar 2 415 66 2863 58 2517 0 0Mar 30 40 6 287 6 273 0 0Mar 31-32-33 516 82 4044 78 3845 0 0Mar 34 235 18 1291 17 1227 0 0Mar 35 1362 154 5452 146 5183 0 0Mar 36 189 31 1643 29 1562 0 0Mar 37 263 347 17171 330 16324 0 0
13 Mar 38-39 418 64 2710 61 2576 0 0
Sum 1998 8470 1246 56761 1193,8 54391 0 0
51

Compilation of Submitted Inputs – Further reduction of nutrient inputs to the North Sea
Data from 1999Mar 11-12 1127 98 4055 80 3303 0 0Mar 13 1864 160 6086 130 4958 0 0Mar 14-15 118 12 273 9,8 222 0 0Mar 16 2937 413 14092 336 11479 0 0Mar 2 564 128 3129 83 2025 0Mar 30 60 12 295 9 230 0 0Mar 31-32-33 481 76 3128 59 2443 0 0Mar 34 350 24 1554 19 1214 0 0Mar 35 1580 187 6908 146 5394 0 0Mar 36 255 46 1968 36 1537 0 0Mar 37 3298 479 19552 374 15268 0 0Mar 38-39 541 113 2712 88 2118 0 0
Sum 1999 13175 1748 63752 1369,8 50191 0 0
Data from 2000Mar 11-12 1084 112 3992 97 3463 0 0Mar 13 2037 146 6544 127 5676 0 0Mar 14-15 73 9 225 8 195 0 0Mar 16 2494 278 10509 241 9116 0 0Mar 2 539 113 2782 76 1882 0 0Mar 30 57 9 238 6 161 0 0Mar 31-32-33 414 71 2418 58 1963 0 0Mar 34 271 9 896 7 727 0 0Mar 35 1545 176 6027 143 4893 0 0Mar 36 239 39 1774 32 1440 0 0Mar 37 3290 483 19324 392 15689 0 0Mar 38-39 498 87 2183 71 1772 0 0
Sum 2000 12541 1532 56912 1258 46977 0 0
All anthropogenic sources nitrogen (tonnes/year)
Country WWTP Industry Aquaculture Households Diffuse Sum Year sources
52

Compilation of Submitted Inputs – Further reduction of nutrient inputs to the North Sea
Denmark2000 1980,8 483,984 1106,047 1253,8 38166,8 42991,431
All anthropogenic sources phosphorous (tonnes/year)
Country WWTP Industry Aquaculture Households Diffuse Sum Year sources
Denmark2000 207,2 38,3694 84,659 287,85 987,09 1605,1684
dAquaculture summary report
Country Tot- N Tot-N Tot- N Tot-P Tot-P Tot-P Tot-N Tot-P Year Coastal Inland Inland Coasta Inland Inland Catchment monitore unmonitore l monitore unmonitore
areaDenmarkData from 2000Mar 11-12 0 96,236 0 0 6,201 0 96,236 6,201Mar 13 45,8 378,668 0 4,1 28,971 0 378,714 28,975Mar 14-15 0 0 0 0 0 0 0 0Mar 16 0 283,226 0 0 22,265 0 283,226 22,265Mar 2 2,7 10,026 0,9 0,733 0 12,726 1,633Mar 30 0 0 0 0 0 0 0 0Mar 31-32-33 0 0 0 0 0 0 0 0Mar 34 0 0 0 0 0 0 0 0Mar 35 0 90,808 0 0 6,49 0 90,808 6,49Mar 36 0 21,43 0 0 1,942 0 21,43 1,942Mar 37 0,3 217,224 0 0 16,717 0 217,524 16,717Mar 38-39 0 5,383 0 0 0,436 0 5,383 0,436
Sum 2000 48,8 1103,001 0 5 83,755 0 1106,047 84,659
53

Compilation of Submitted Inputs – Further reduction of nutrient inputs to the North Sea
Sewage works and sewerage summary report (tonnes/year) national /year)Country Tot-N Tot-N Tot-N Tot-P Tot- P Tot-P Tot-N Tot-P Year Coastal Inland Inland Coastal Inland Inland Catchment name area monitored unmonitored area monitored unmonitore
dDenmarkData from 2000
Mar 11-12 0,7 155,5 0 0,1 12,3 0 156,2 12,4Mar 13 9,4 116,2 0 1,2 9,7 0 125,6 10,9Mar 14-15 0 0,8 0 0 0,1 0 0,8 0,1Mar 16 94,1 289,2 0 3,8 41,8 0 383,3 45,6Mar 2 18,4 175,2 0 5,1 11,4 0 193,6 16,5Mar 30 5,8 0 0 1,3 0 0 5,8 1,3Mar 31-32-33 74,1 151,3 0 14 24,4 0 225,4 38,4Mar 34 19,3 27,4 0 2,1 4,2 0 46,7 6,3Mar 35 3,1 328,3 0 0,2 23,1 0 331,4 23,3Mar 36 45,4 12,2 0 1,6 1,3 0 57,6 2,9Mar 37 202,1 252,3 0 22,7 26,8 0 454,4 49,5Mar 38-39 93,1 15 0 12,7 2,7 0 0 0Sum 2000 565,5 1523,4 0 64,8 157,8 0 1980,8 207,2
Households not connected to public sewerage summary report - national figures (tonnes/year) Country Tot-N Tot-N Tot-N Tot-P Tot-P Tot-P Tot-N Tot-P Year Coastal Inland Inland Coastal Inland Inland Catchment name area monitored unmonitored area monitored unmonitore
d
DenmarkData from 2000Mar 11-12 0 28,6 0 0 6,5 0 28,6 6,5Mar 13 0 52,9 0 0 12 0 52,9 12
54

Compilation of Submitted Inputs – Further reduction of nutrient inputs to the North Sea
Mar 14-15 0 2,7 0 0 0,6 0 2,7 0,6Mar 16 0 85,1 0 0 19,7 0 85,1 19,7Mar 2 0 16,5 0 0 3,7 0 16,5 3,7Mar 30 0 0,2 0 0 0,05 0 0,2 0,05Mar 31-32-33 810 40,1 0 185 9,2 0 850,1 194,2Mar 34 0 10,8 0 0 2,4 0 10,8 2,4Mar 35 0 58,8 0 0 13,4 0 58,8 13,4Mar 36 0 11,8 0 0 2,7 0 11,8 2,7Mar 37 0 127 0 0 28,8 0 127 28,8Mar 38-39 0 9,3 0 0 3,8 0 9,3 3,8Sum 2000 810 443,8 0 185 102,85 0 1253,8 287,85
Industrial plants report – National figures (tonnes/year)ar)Country Tot-N Tot-N Tot-N Tot-P Tot-P Tot-P Tot-N Tot-P Year Coastal Inland Inland Coastal Inland Inland Catchment area monitored unmonitored area monitored unmonitorename dIndustry DenmarkData from 2000Catchment area Mar 11-12
Org. chemical/bio-chemical 31,3 0 0 0 9,9 0 31,3 9,9Sum Mar 11-12 31,3 0 0 0 9,9 0 31,3 9,9
Catchment area Mar 13
Food/drink related industry 0 3,7 0 0 0,76 0 3,7 0,76Other sectors 0 4,2 0 0 0,84 0 4,2 0,84Pulp/paper industry 0 1,18 0 0 0,08 0 1,18 0,08Sum Mar 13 0 9,08 0 0 1,68 0 9,08 1,68
Catchment area Mar 14-15
Other sectors 0 0,25 0 0 0,006 0 0,25 0,006Sum Mar 14-15 0 0,25 0 0 0,006 0 0,25 0,006
55

Compilation of Submitted Inputs – Further reduction of nutrient inputs to the North Sea
Catchment area Mar 16
Food/drink related industry 91,8 8,5 0 0,52 1,13 0 100,3 1,65
12. mars 2002 Page 1 of 3
56

Compilation of Submitted Inputs – Further reduction of nutrient inputs to the North Sea
Country Tot-N Tot-N Tot-N Tot-P Tot-P Tot-P Tot-N Tot-P Year Coastal Inland Inland Coastal Inland Inland Catchment area monitored unmonitored area monitored unmonitorename dIndustry Waste processing industry 0 0 0 0 0,009 0 0 0,009Sum Mar 16 91,8 8,5 0 0,52 1,139 0 100,3 1,659
Catchment area Mar 2
Food/drink related industry 55,2 0 0 5,6 0 0 55,2 5,6Other sectors 0 0,125 0 0 0 0 0,125 0Sum Mar 2 55,2 0,125 0 5,6 0 0 55,325 5,6
Catchment area Mar 30
0 0 0 0 0 0 0 0Sum Mar 30 0 0 0 0 0 0 0 0
Catchment area Mar 31-32-33
Food/drink related industry 0,2 0 0 0,9 0 0 0,2 0,09Org. chemical/bio-chemical 0,18 0,7 0 0,001 0 0 0,88 0,001Other sectors 0 3,72 0 0 0,136 0 3,72 0,136Sum Mar 31-32-33 0,38 4,42 0 0,901 0,136 0 4,8 0,227
Catchment area Mar 34
Food/drink related industry 4,47 0 0 0,19 0 0 4,47 0,19Org. chemical/bio-chemical 14,9 0 0 2,6 0 0 14,9 2,6Sum Mar 34 19,37 0 0 2,79 0 0 19,37 2,79
Catchment area Mar 35
Food/drink related industry 16,1 0 0 0,155 0 0 16,1 0,155
12. mars 2002 Page 2 of 3
57

Compilation of Submitted Inputs – Further reduction of nutrient inputs to the North Sea
Country Tot-N Tot-N Tot-N Tot-P Tot-P Tot-P Tot-N Tot-P Year Coastal Inland Inland Coastal Inland Inland Catchment area monitored unmonitored area monitored unmonitorename dIndustry Pulp/paper industry 0,513 0 0 0,0054 0 0 0,513 0,0054Sum Mar 35 16,613 0 0 0,1604 0 0 16,613 0,1604
Catchment area Mar 36
Other sectors 0,256 0 0 0 0 0 0,256 0Sum Mar 36 0,256 0 0 0 0 0 0,256 0
Catchment area Mar 37
Food/drink related industry 59,3 0 0 5,6 0 0 59,3 5,6Other sectors 4,23 0 0 1,157 0 0 4,23 1,157Sum Mar 37 63,53 0 0 6,757 0 0 63,53 6,757
Catchment area Mar 38-39
Food/drink related industry 183,16 0 0 9,59 0 0 183,16 9,59Sum Mar 38-39 183,16 0 0 9,59 0 0 183,16 9,59
Sum 2000 461,609 22,375 0 26,3184 12,861 0 483,984 38,3694
Diffuse losses summary report (surface water) – national figures (tonnes/year))Country Normalised Tot-N Tot-P Tot-N Tot-P Tot- N Tot-P Tot-N Tot-P Tot-N Tot-PYear or Agric Agric Dir. Dir. Other Other Backgr Backgr (Agric (Agric +Catchment dep. dep. +
Dir. dep Dir. dep + +
Other - Other -DenmarkData from 2000Mar 11-12 Year specific 3973 82 0 0 0 0 391 13,6 3582 68,4Mar 11-12 Normalised 3470 77 0 0 0 0 339 11,8 3131 65,2Mar 13 Normalised 5701 91 0 0 0 0 653 22,5 5048 68,5
58

Compilation of Submitted Inputs – Further reduction of nutrient inputs to the North Sea
Mar 13 Year specific 6519 93 0 0 0 0 753 26 5766 67Mar 14-15 Normalised 219 8,7 0 0 0 0 66,2 2,3 152,8 6,4Mar 14-15 Year specific 250 8,9 0 0 0 0 76,3 2,6 173,7 6,3Mar 16 Normalised 8782 170 0 0 0 0 978 34 7804 136Mar 16 Year specific 10038 176 0 0 0 0 1127 39 8911 137Mar 2 Normalised 1772 66 0 0 0 0 160 5,5 1612 60,5Mar 2 Year specific 2602 98 0 0 0 0 237 8,2 2365 89,8Mar 30 Normalised 193 7,3 0 0 0 0 24 0,81 169 6,49Mar 30 Year specific 238 9 0 0 0 0 30 1 208 8Mar 31-32-33 Normalised 2681 176 0 0 0 0 365 12,7 2316 163,3Mar 31-32-33 Year specific 2450 23 0 0 0 0 450 15,6 2000 7,4Mar 34 Normalised 792 3,2 0 0 0 0 127 4,5 665 -1,3Mar 34 Year specific 868 1,9 0 0 0 0 157 5,5 711 -3,6
12. mars 2002 Page 1 of 2
59

Compilation of Submitted Inputs – Further reduction of nutrient inputs to the North Sea
Country Normalised Tot-N Tot-P Tot-N Tot-P Tot- N Tot-P Tot-N Tot-P Tot-N Tot-PYear or Agric Agric Dir. Dir. Other Other Backgr Backgr (Agric (Agric +Catchment dep. dep. +
Dir. dep Dir. dep + +
Other - Other -Mar 35 Normalised 5488 116 0 0 0 0 6140 21 -652 95Mar 35 Year specific 6701 130 0 0 0 0 756 26 5945 104Mar 36 Normalised 1443 28 0 0 0 0 131 4,5 1312 23,5Mar 36 Year specific 1765 32 0 0 0 0 161 5,6 1604 26,4Mar 37 Year specific 20000 400 0 0 0 0 1624 56 18376 344Mar 37 Normalised 16341 348 0 0 0 0 1319 45 15022 303Mar 38-39 Normalised 1773 67 0 0 0 0 186 6,5 1587 60,5Mar 38-39 Year specific 2168 79 0 0 0 0 229 8 1939 71
Sum 2000 106227 2291 0 0 0 0 16479,5 378,21 89747,5 1912,79
60
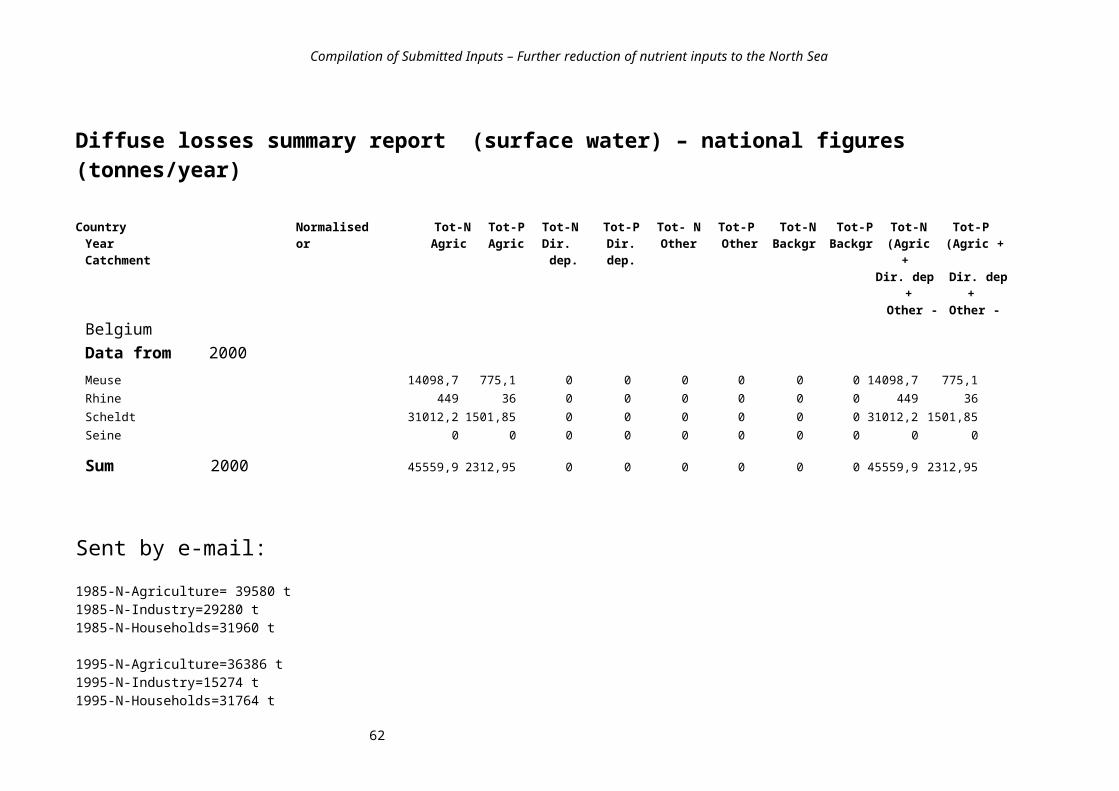
Compilation of Submitted Inputs – Further reduction of nutrient inputs to the North Sea
Spildevand: Danmark KVÆLSTOF FOSFOR
Ferskvand Regnvands- Spredt Ferskvand Regnvands- Spredt
ton Renseanlæg Industri betinget bebyggelse Dambrug I alt tonRenseanlæg Industri betinget
bebyggelse Dambrug I alt
1981-88 6700 240 570 1610 2200 11320 1981-88 2100 100 170 470 400 32401989 6700 236 570 1595 2189 11290 1989 1770 18 140 460 239 26271990 6341 225 850 1250 1952 10618 1990 1323 18 210 420 216 21871991 5961 152 685 1061 1729 9588 1991 961 14 182 371 169 16971992 5311 106 620 1245 1535 8817 1992 742 6 156 286 140 13301993 4119 108 711 1296 1372 7606 1993 524 7 179 297 115 11221994 3961 96 836 1198 1378 7469 1994 454 7 212 273 119 10651995 3451 121 619 1137 1385 6713 1995 410 4 158 261 106 9391996 2763 104 443 1140 1212 5662 1996 324 3 112 262 93 7941997 2436 55 569 1121 1227 5408 1997 263 3 145 258 92 7611998 2710 66 723 989 1241 11317 1998 274 4 190 226 92 15461999 2705 38 752 966 1127 5588 1999 258 4 195 220 83 7602000 2475 27 592 976 1195 5265 2000 248 4 150 222 91 715
61

Compilation of Submitted Inputs – Further reduction of nutrient inputs to the North Sea
Direkte Regnvands- Spredt Direkte Regnvands- Spredt
ton Renseanlæg Industri betinget bebyggelse Havbrug I alt tonRenseanlæg Industri betinget
bebyggelse Havbrug I alt
1981-88 12300 4760 430 20 300 17810 1981-88 3900 3300 90 5 40 73351989 11300 4742 240 12 322 16616 1989 2700 1177 59 5 44 39851990 10544 3862 232 12 332 14982 1990 2391 632 56 3 40 31221991 9148 3845 235 12 266 13506 1991 1838 563 62 3 36 25021992 7760 4079 261 12 361 22297 1992 1521 418 67 3 37 36421993 6666 2467 314 12 365 9824 1993 1238 238 78 3 39 15961994 6280 2641 371 12 306 9610 1994 1120 313 94 3 32 15621995 5487 2350 248 4 350 8439 1995 827 201 65 1 37 11311996 3642 1625 185 3 331 5786 1996 580 117 47 0 35 7791997 2420 1745 232 1 269 4667 1997 403 142 57 0 30 6321998 2454 1363 242 3 291 4353 1998 327 121 62 1 33 5441999 2429 824 223 4 291 3771 1999 324 66 56 1 33 4802000 2179 871 169 5 326 3550 2000 295 54 43 1 36 429
62

Compilation of Submitted Inputs – Further reduction of nutrient inputs to the North Sea
Spildevand i alt Regnvands- Spredt Spildevand i alt Regnvands- Spredt
ton Renseanlæg Industri betinget bebyggelse Dambrug I alt tonRenseanlæg Industri betinget
bebyggelse Dambrug I alt
1981-88 19000 5000 1000 1630 2500 29130 1981-88 6000 3400 260 475 440 105751989 18000 4978 810 1607 2511 27906 1989 4470 1195 199 465 283 66121990 16885 4087 1082 1262 2284 25600 1990 3714 650 266 423 256 53091991 15109 3997 920 1073 1995 23094 1991 2799 577 244 374 205 41991992 13071 4185 881 1257 1896 21290 1992 2263 424 223 289 177 33761993 10785 2575 1025 1308 1737 34509 1993 1762 245 257 300 154 53451994 10241 2737 1207 1210 1684 17079 1994 1574 320 306 276 151 26271995 8938 2471 867 1141 1735 15152 1995 1237 205 223 262 143 20701996 6405 1729 628 1143 1543 11448 1996 904 120 159 262 128 15731997 4856 1800 801 1122 1496 10075 1997 666 145 202 258 122 13931998 5164 1429 965 992 1532 10082 1998 601 125 252 227 125 13301999 5134 862 975 970 1418 9359 1999 582 70 251 221 116 12402000 4654 898 761 981 1521 8815 2000 543 58 193 223 127 1144
63

Compilation of Submitted Inputs – Further reduction of nutrient inputs to the North Sea
Samlede udledninger via vandløb og direkte udledninger fra Danmark
Fosfor Q-vægtet Q-vægtet Havbrug Total
hav (ton) via vandløb direkte i alt vandløb mgP/l i alt mgP/l kg/ha inkl. havb.
1981-88 4200 5750 9950 0,258 0,612 0,98 40 99901989 2862 3972 6834 0,265 0,633 0,67 44 68781990 3569 3099 6668 0,255 0,476 0,83 40 67081991 2327 2499 4826 0,183 0,380 0,54 36 48621992 1964 2048 4012 0,156 0,318 0,46 39 40511993 2039 1584 3623 0,146 0,259 0,47 38 36611994 2963 1529 4492 0,151 0,229 0,69 32 45241995 2190 1132 3322 0,140 0,213 0,51 37 33591996 1228 746 1974 0,150 0,241 0,29 35 20091997 1220 602 1822 0,137 0,205 0,28 30 18521998 2087 511 2598 0,134 0,167 0,49 33 26311999 2587 446 3033 0,141 0,165 0,60 33 30662000 2123 394 2517 0,129 0,153 0,49 35 2552
1989-2000 2263 1547 3810 0,163 0,274 0,53 36 3846
64

Compilation of Submitted Inputs – Further reduction of nutrient inputs to the North Sea
Kvælstof Q-vægtet Q-vægtet Havbrug Total
hav (ton) via vandløb direkte i altvandløb mgN/l i alt mgN/l kg/ha
inkl. havb.
1981-88 109000 16700 125700 6,7 7,7 25,3 350 1260501989 61883 16659 78542 5,7 7,3 14,4 322 788641990 97058 14890 111948 6,9 8,0 22,6 332 1122801991 78468 13494 91962 6,2 7,2 18,2 265 922271992 91721 12459 104180 7,3 8,3 21,3 361 1045411993 98163 9687 107840 7,0 7,7 22,8 366 1082061994 119071 9299 128370 6,1 6,6 27,7 306 1286761995 84400 8446 92846 5,4 5,9 19,6 351 931971996 42541 5445 47986 5,2 5,9 9,9 332 483181997 45427 4398 49825 5,1 5,6 10,6 267 500921998 96573 4062 100635 6,2 6,5 22,4 291 1009261999 97711 3482 101193 5,3 5,5 22,7 291 1014842000 79791 3245 83036 4,9 5,1 18,5 326 83362
1989-2000 82734 8797 91530 6,0 6,6 19,2 317,5 91848
65

Compilation of Submitted Inputs – Further reduction of nutrient inputs to the North Sea
Report from Germany
66

Compilation of Submitted Inputs – Further reduction of nutrient inputs to the North Sea
67
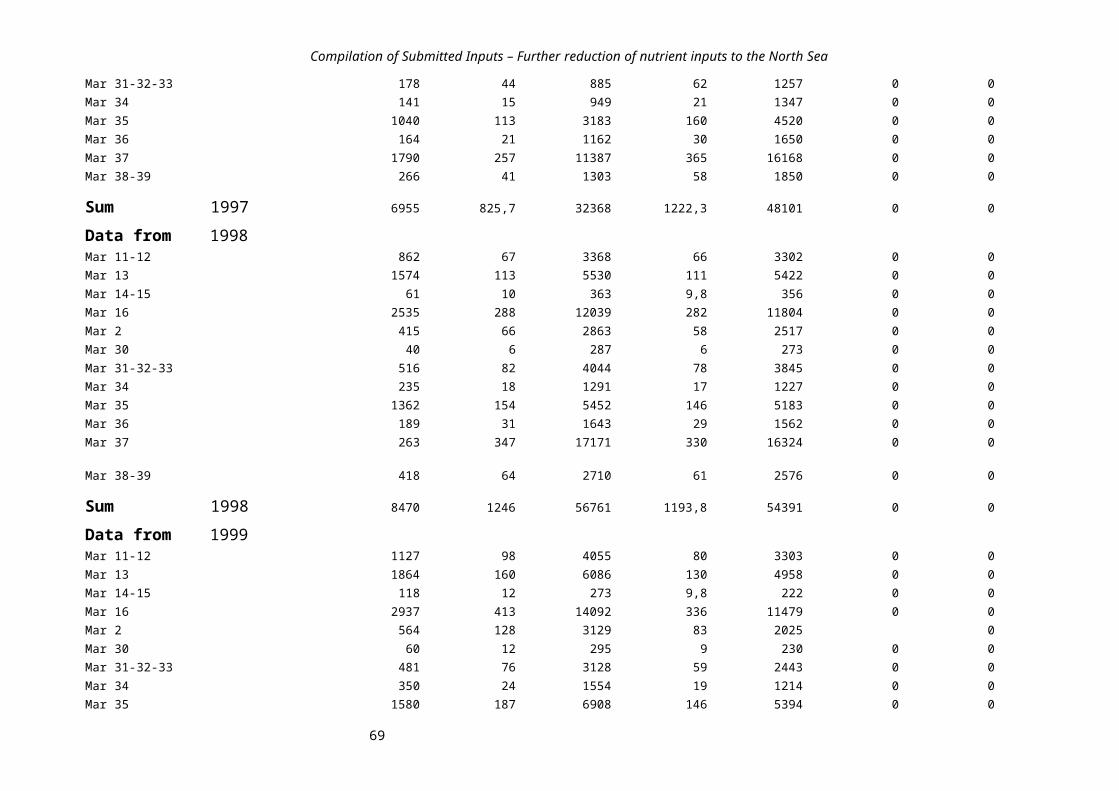
Compilation of Submitted Inputs – Further reduction of nutrient inputs to the North Sea
68
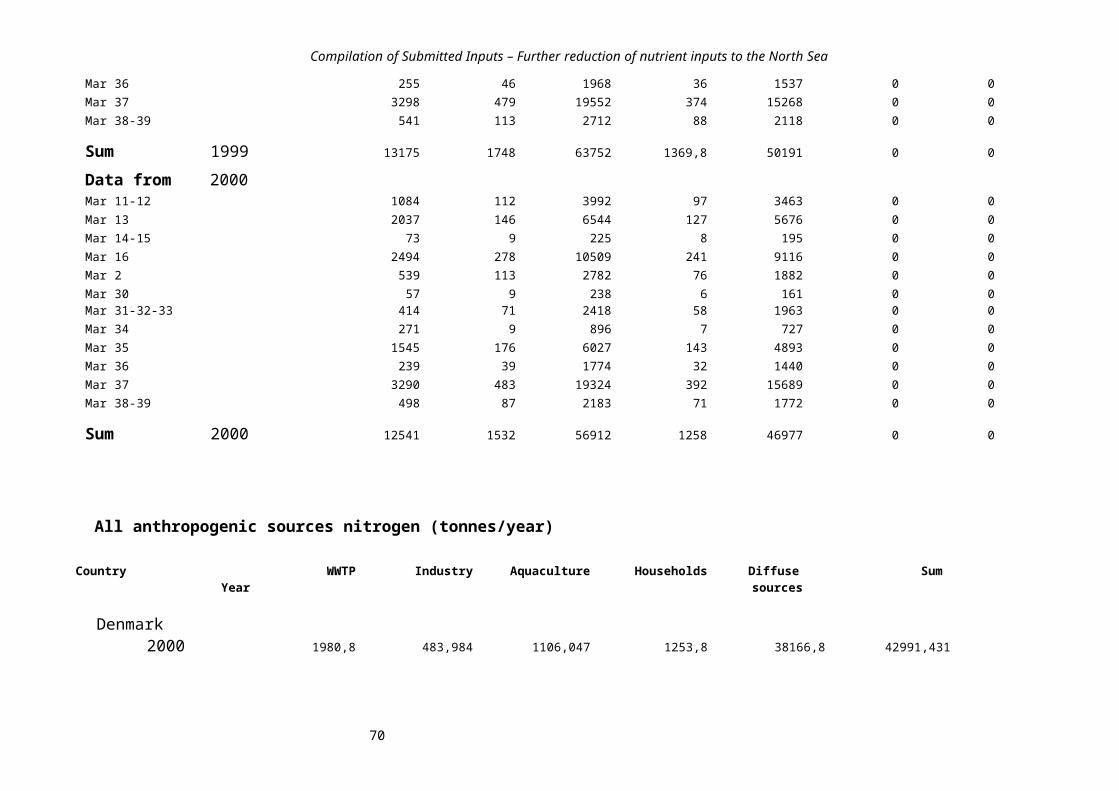
Compilation of Submitted Inputs – Further reduction of nutrient inputs to the North Sea
69

Compilation of Submitted Inputs – Further reduction of nutrient inputs to the North Sea
70
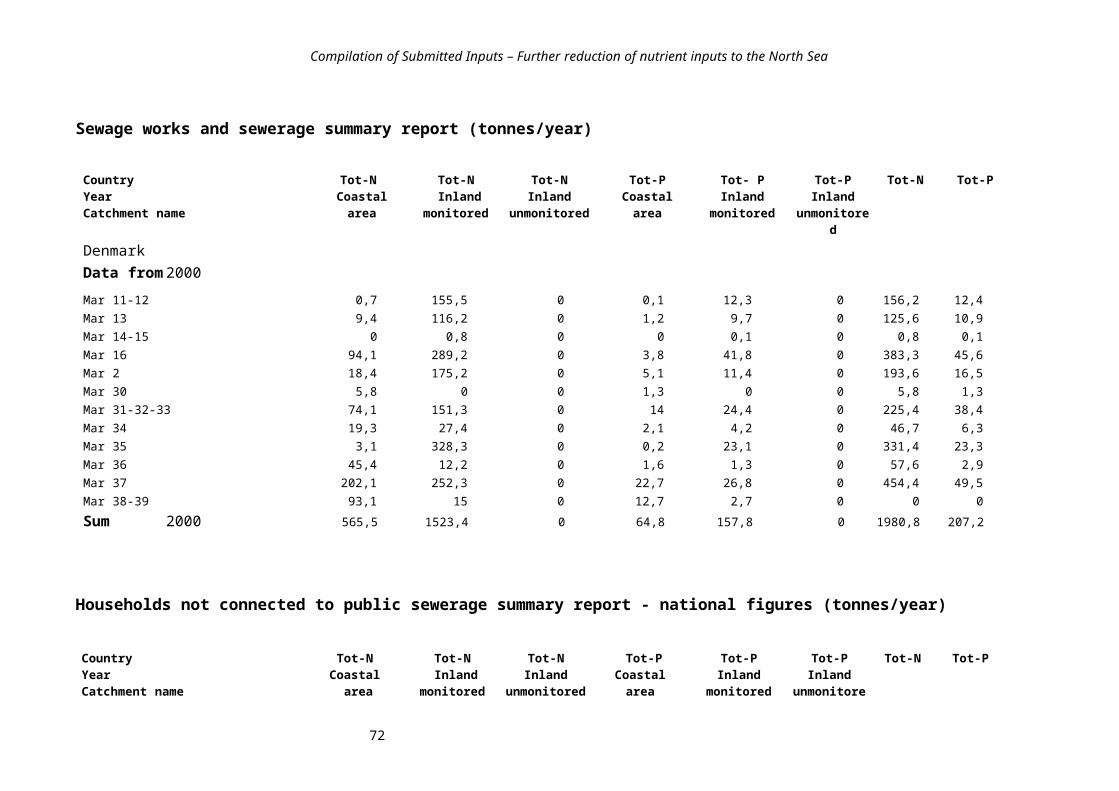
Compilation of Submitted Inputs – Further reduction of nutrient inputs to the North Sea
71

Compilation of Submitted Inputs – Further reduction of nutrient inputs to the North Sea
72

Compilation of Submitted Inputs – Further reduction of nutrient inputs to the North Sea
73

Compilation of Submitted Inputs – Further reduction of nutrient inputs to the North Sea
74

Compilation of Submitted Inputs – Further reduction of nutrient inputs to the North Sea
75

Compilation of Submitted Inputs – Further reduction of nutrient inputs to the North Sea
76

Compilation of Submitted Inputs – Further reduction of nutrient inputs to the North Sea
77

Compilation of Submitted Inputs – Further reduction of nutrient inputs to the North Sea
78

Compilation of Submitted Inputs – Further reduction of nutrient inputs to the North Sea
Click on icon to open German reporting Excel file
79

Compilation of Submitted Inputs – Further reduction of nutrient inputs to the North Sea
Report from Norway
Catchment description summary report - national figures
Catchment name Catchment Lake River Total Long term Water Water Populatio
Area Surface Surface n annual flow
Alta 56648 339 0 6450 7,487
Drammenselva 17539 652 0 22970 26,743
Glomma 47541 1943 0 133130 60,324
Numedalslågen 7253 254 0 19890 10,082
Orkla 45792 1703 0 63850 5,374
Orreelva 9765 525 0 25590 333
Otra 13755 607 0 19800 12,841
Skienselva 12902 1022 0 15700 22,611
Suldalslågen 28446 1034 0 42980 7,422
Vefsna 47387 1056 0 41020 15,62
Sum Norway 287028 9135 0 391380 501,504
Retention in surface waters summary report - national figures (tonnes/year)
Tot-N Tot-N Tot-N Tot-P Tot-P Tot-P Tot-N Tot-Year Coastal Unmonitore Monitored Coastal Unmonitore Monitored P
80

Compilation of Submitted Inputs – Further reduction of nutrient inputs to the North Sea
Catchment area d inland area d inlandinland inland
1985
Alta 33,4 0,0 0,0 9,6 0,0 0,0 33,4 9,6
Drammenselva 0,0 0,0 832,5 0,9 0,0 146,0 832,5 146,9
Glomma 789,4 0,0 1753,0 113,4 0,0 350,1 2542,4 463,5
Numedalslågen 0,6 0,0 107,5 0,5 0,0 30,1 108,1 30,6
Orkla 418,3 0,0 0,0 88,3 0,0 0,0 418,3 88,3
Orreelva 240,3 0,0 28,9 33,4 0,0 9,4 269,2 42,8
Otra 238,6 0,0 144,4 36,5 0,0 12,6 383,0 49,1
Skienselva 34,2 0,0 737,3 0,2 0,0 105,0 771,5 105,2
Suldalslågen 211,5 0,0 0,0 26,8 0,0 0,0 211,5 26,8
Vefsna 73,7 0,0 5,4 32,7 0,0 1,2 79,1 33,9
2040,0 0,0 3609,1 342,3 0,0 654,5 5649,0 996,7
2000
Alta 35,0 0,0 0,0 9,3 0,0 0,0 35,0 9,3
Drammenselva 233,5 403,9 0,0 0,0 0,0 93,5 637,4 94,2
Glomma 644,5 1450,6 0,0 63,2 0,0 229,0 2095,1 291,7
Numedalslågen 5,4 94,0 0,0 4,5 0,0 18,8 99,4 21,9
Orkla 4301,9 0,0 0,0 69,6 0,0 0,0 4301,9 82,6
81
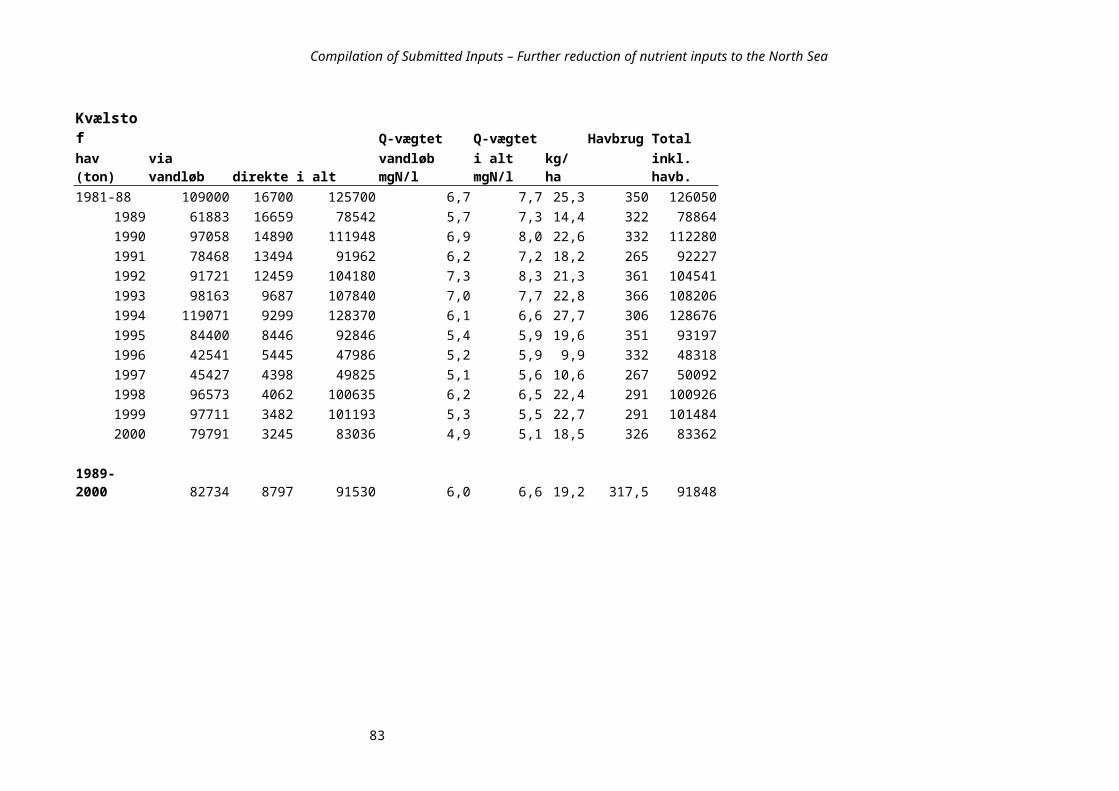
Compilation of Submitted Inputs – Further reduction of nutrient inputs to the North Sea
Orreelva 298,7 43,8 0,0 43,1 0,0 7,2 342,5 49,2
Otra 222,0 163,1 0,0 28,4 0,0 11,1 385,2 39,8
Skienselva 26,8 561,0 0,0 5,5 0,0 73,6 587,8 79,2
Suldalslågen 201,1 0,0 0,0 18,1 0,0 0,0 201,1 17,1
Vefsna 27,0 0,0 0,0 33,2 0,0 0,3 27,0 50,2
5995,9 2716,5 0,0 274,9 0,0 433,5 8712,4 735,1
Riverine load summary report - national figures (tonnes/year)
Country Specific Riverine load, Riverine load, Riverine load, Riverine load, Transboundar TransboundarYear annual y riverine y riverine Catchment riverine flow without without flow- flow- inputs, inputs,
normalisation normalisation normalised normalised mill m3/year tonnes/yr tonnes/yr tonnes/yr tonnes/yr tonnes/yr tonnes/yr
NorwayData from 1985
Alta3276 31 622 25 519 0 0Drammenselva 10686 108 3836 99 3504 0 0Glomma 27427 485 14837 389 11911 0 0Numedalslågen 3616 57 766 58 780 0 0Orkla 2113 30 754 28 700 0 0Orreelva 68 7 96 12 174 0 0Otra 3988 35 1254 41 1474 0 0Skienselva 7767 50 3106 53 3301 0 0Suldalslågen 1705 5 376 8 598 0 0
82

Compilation of Submitted Inputs – Further reduction of nutrient inputs to the North Sea
Vefsna 4734 23 814 28 980 0 0
Sum 1985 65380 835 26466 746 23944
Data from 2000Alta 3051 104 761 76 558 0 0Drammenselva 13712 186 6212 137 4576 0 0Glomma 31252 834 1773 577 12261 0 0 Numedalslågen 5267 255 2804 180 1980 0 0Orkla 1672 34 647 32 627 0 0Orreelva 151 14 320 14 330 0 0Otra 6768 109 2017 79 1460 0 0Skienselva 12718 84 4027 60 2881 0 0Suldalslågen 1662 6 398 13 782 0 0Vefsna 6014 23 657 23 655 0 0
Sum 2000 82267 1654 35578 1195 26114 0 0 2 of 2
All anthropogenic sources - tonnes N
Country WWTP Industry Aquaculture Households Diffuse Sum Year sources
Norway1985 16912 8038 1688 4533 37331 685022000 13164 3824 22901 3247 33625 76761
All anthropogenic sources - tonnes P
Country WWTP Industry Aquaculture Households Diffuse Sum
83
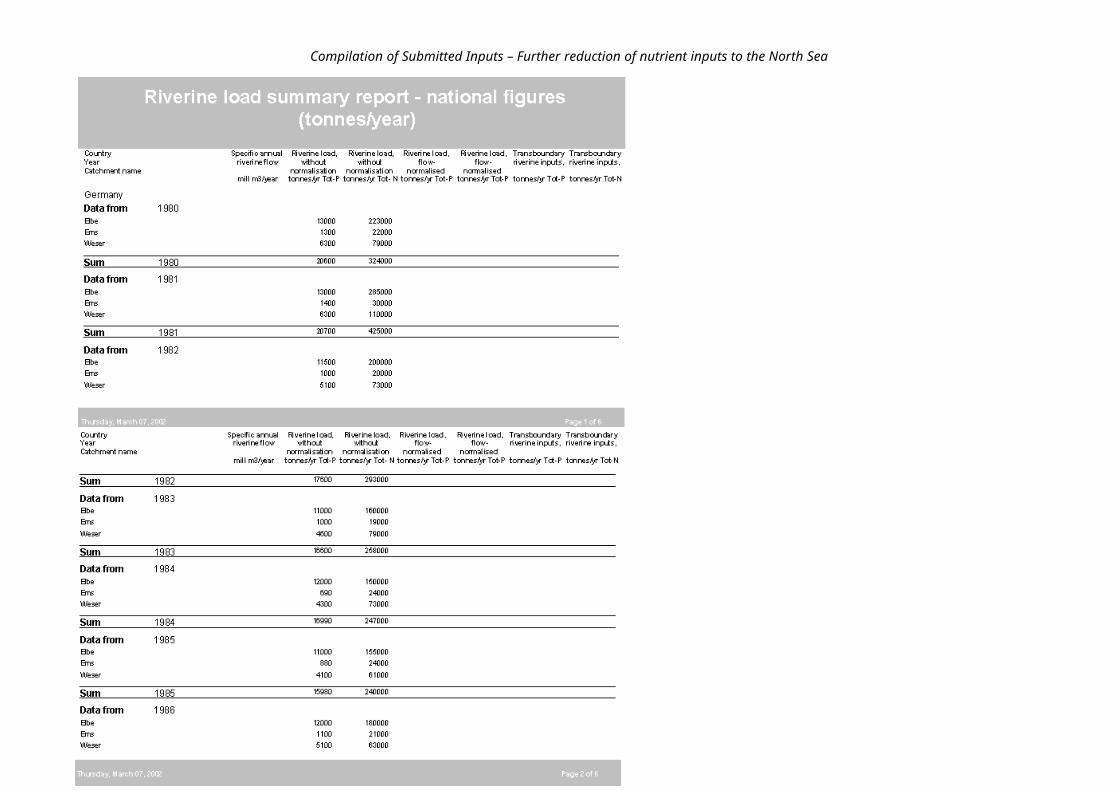
Compilation of Submitted Inputs – Further reduction of nutrient inputs to the North Sea
Year sources
Norway1985 2082 361 355 718 1198 47142000 826 196 4823 342 1120 7307
Aquaculture summary report - national figures (tonnes/year)
Country Tot- N Tot-N Tot- N Tot-P Tot-P Tot-P Tot-N Tot-P Year Coastal Inland Inland Coasta Inland Inland Catchment monitore unmonitore l monitore unmonitore
areaNorwayData from 1985Alta 23,472 0 0 4,957 0 0 23,472 4,957Drammenselva 0,255 0 0 0,051 0 0 0,255 0,051Glomma 0,058 0 0 0,011 0 0 0,058 0,011Numedalslågen 0 0 0 0 0 0 0 0Orkla 524,117 0 0 110,081 0 0 524,117 110,081Orreelva 56,964 0 0 12,058 0 0 56,964 12,058Otra 1,205 0 0 0,26 0 0 1,205 0,26Skienselva 0,098 0 0 0,019 0 0 0,098 0,019Suldalslågen 647,933 0 0 136,555 0 0 647,933 136,555Vefsna 433,985 0 0 91,574 0 0 433,985 91,574
Sum 1985 1688,087 0 0 355,566 0 0 1688,087 355,566
Data from 2000Alta 1707,258 0 0 362,253 0 0 1707,258 362,253Drammenselva 0 7,443 0 0 1,508 0 7,443 1,508Glomma 0,098 2,235 0 0,019 0,425 0 2,333 0,444
84

Compilation of Submitted Inputs – Further reduction of nutrient inputs to the North Sea
Orkla 5582,58 0 0 1178,563 0 0 5582,58 1178,563Orreelva 1263,224 0 0 267,717 0 0 1263,224 267,717Otra 37,834 0 0 7,896 0 0 37,834 7,896Skienselva 1,467 0,045 0,031 0,28 0,008 0,005 1,543 0,293Suldalslågen 8365,965 0 0 1736,966 0 0 8365,965 1736,966Vefsna 5933,377 0,166 0 1267,611 0,032 0 5933,543 1267,643
Sum 2000 22891,803 9,889 0,031 4821,305 1,973 0,005 22901,723 4823,283
Sewage works and sewerage summary report - national figures (tonnes/year)
Country Tot-N Tot-N Tot-N Tot-P Tot- P Tot-P Tot-N Tot-P Year Coastal Inland Inland Coastal Inland Inland Catchment name area monitored unmonitored area monitored unmonitore
dNorwayData from 1985
Alta 227 15 4 40 3 1 245 44Drammenselva 149 455 332 25 37 37 936 100Glomma 4063 2229 379 180 162 69 6672 412Numedalslågen 994 187 0 173 22 0 1181 195Orkla 1999 31 26 352 4 5 2056 361Orreelva 914 74 0 167 14 0 989 180Otra 742 124 0 123 18 0 866 141Skienselva 233 326 297 33 30 55 857 118Suldalslågen 1917 12 0 317 2 0 1928 319Vefsna 1120 8 54 202 1 8 1182 212Sum 1985 12358 3461 1092 1612 293 175 16912 2082
Data from 2000
Alta 368 10 0 46 1 0 378 47Drammenselva 182 343 181 3 3 2 706 8
85

Compilation of Submitted Inputs – Further reduction of nutrient inputs to the North Sea
Glomma 2210 1629 370 46 16 7 4209 69Numedalslågen 580 93 0 15 1 0 674 16Orkla 2159 10 0 209 0 0 2169 210Orreelva 681 88 52 52 1 7 821 60Otra 595 26 0 32 0 0 620 32Skienselva 122 126 231 2 4 3 479 9Suldalslågen 1890 39 0 214 5 0 1930 219Vefsna 1174 4 0 156 0 0 1178 156Sum 2000 9961 2368 834 775 31 19 13164 826
Households not connected to public sewerage summary report - national figures
Country Tot-N Tot-N Tot-N Tot-P Tot-P Tot-P Tot-N Tot-P Year Coastal Inland Inland Coastal Inland Inland Catchment name area monitored unmonitored area monitored unmonitore
d
NorwayData from 1985Alta 82 6 3 10 1 0 92 12Drammenselva 27 260 19 4 35 3 305 42Glomma 190 678 32 34 101 6 899 141Numedalslågen 123 69 0 18 11 0 191 29Orkla 955 20 10 158 3 1 984 163Orreelva 238 14 0 40 2 0 253 43Otra 205 31 0 32 5 0 236 37Skienselva 38 91 19 6 14 3 148 22Suldalslågen 752 8 0 124 1 0 759 125Vefsna 653 8 5 102 1 1 666 104Sum 1985 3263 1185 88 528 174 14 4533 718
Data from 2000Alta 37 3 17 3 0 2 57 5Drammenselva 15 173 10 2 12 1 198 14
86

Compilation of Submitted Inputs – Further reduction of nutrient inputs to the North Sea
Glomma 149 474 35 16 41 4 658 61Numedalslågen 143 35 0 18 3 0 178 20
Orkla 550 12 10 64 1 1 572 66Orreelva 148 11 0 15 1 0 160 16Otra 149 19 0 14 1 0 167 16Skienselva 26 68 4 3 7 0 98 10Suldalslågen 618 8 0 68 1 0 626 69Vefsna 513 7 13 62 1 2 533 65Sum 2000 2348 810 89 265 68 10 3247 342
Industrial plants report - national figures (tonnes/year)
Country Tot-N Tot-N Tot-N Tot-P Tot-P Tot-P Tot-N Tot-P Year Coastal Inland Inland Coastal Inland Inland Catchment area monitored unmonitored area monitored unmonitorename dIndustry NorwayData from 1985Catchment area Alta
Other sectors 1 0 0 1 0 0 1 1Sum Alta 1 0 0 1 0 0 1 1
Catchment area Drammenselva
Other sectors 0 40 21 0 4 0 62 4Sum Drammenselva 0 40 21 0 4 0 62 4
Catchment area Glomma
Other sectors 687 8 122 74 18 15 817 106Sum Glomma 687 8 122 74 18 15 817 106
87

Compilation of Submitted Inputs – Further reduction of nutrient inputs to the North Sea
Catchment area Numedalslågen
Other sectors 42 0 0 2 0 0 42 2Sum Numedalslågen 42 0 0 2 0 0 42 2 Catchment area Orkla
Other sectors 140 0 4 27 0 1 144 28Sum Orkla 140 0 4 27 0 1 144 28
Catchment area Orreelva
Other sectors 48 9 0 2 1 0 57 3Sum Orreelva 48 9 0 2 1 0 57 3
Catchment area Otra
Other sectors 0 39 0 2 8 0 39 10Sum Otra 0 39 0 2 8 0 39 10
Catchment area Skienselva
Other sectors 4300 500 37 33 0 8 4837 41Sum Skienselva 4300 500 37 33 0 8 4837 41
Catchment area Suldalslågen
Other sectors 658 0 0 29 0 0 659 29Sum Suldalslågen 658 0 0 29 0 0 659 29
Catchment area Vefsna
Other sectors 1380 0 0 137 0 0 1380 137Sum Vefsna 1380 0 0 137 0 0 1380 137
Sum 1985 7256 596 184 307 31 24 8038 361
13 Data from 2000Catchment area Drammenselva
Other sectors 37 0 0 0 0 0 37 0Pulp/paper industry 0 202 0 0 4 0 202 4Sum Drammenselva 37 202 0 0 4 0 239 4
88

Compilation of Submitted Inputs – Further reduction of nutrient inputs to the North Sea
Catchment area Glomma
Food/drink related industry 0 0 0 0 13 0 0 13Org. chemical/bio-chemical 0 2 0 0 1 0 2 1Other sectors 103 2 0 1 1 0 106 2Pulp/paper industry 59 128 44 22 20 4 230 46Waste processing industry 0 12 0 0 1 0 12 1Sum Glomma 162 144 44 23 36 4 350 63
Catchment area Numedalslågen
Cookeries/refineries 0 0 0 6 0 0 0 6Org. chemical/bio-chemical 3 0 0 1 0 0 3 1Other sectors 44 0 0 7 0 0 44 7Pulp/paper industry 42 0 0 5 0 0 42 5Waste processing industry 7 0 0 0 0 0 7 0Sum Numedalslågen 96 0 0 19 0 0 96 19
Catchment area Orkla
Cookeries/refineries 1 0 0 0 0 0 1 0Food/drink related industry 6 0 0 1 0 0 6 1 Other sectors 187 0 0 1 0 0 187 1Pulp/paper industry 146 0 0 21 0 0 146 21Sum Orkla 340 0 0 23 0 0 340 23
Catchment area Orreelva
Cookeries/refineries 1 0 0 0 0 0 1 0Other sectors 37 0 0 1 0 0 37 1Sum Orreelva 38 0 0 1 0 0 38 1
Catchment area Otra
Food/drink related industry 0 0 0 0 0 0 0 0Org. chemical/bio-chemical 4 0 0 0 0 0 4 0Other sectors 0 0 0 0 0 0 0 0Pulp/paper industry 4 25 0 2 1 0 29 3Sum Otra 8 25 0 2 1 0 33 3
Catchment area Skienselva
89

Compilation of Submitted Inputs – Further reduction of nutrient inputs to the North Sea
Fertiliser industry 758 0 0 4 0 0 758 4Food/drink related industry 0 4 0 0 1 0 4 1Org. chemical/bio-chemical 0 0 0 1 0 0 0 1Other sectors 0 0 0 0 0 0 0 0Pulp/paper industry 0 82 0 0 7 0 82 7Sum Skienselva 758 86 0 5 8 0 844 13
Catchment area Suldalslågen Cookeries/refineries 988 0 0 0 0 0 988 0Food/drink related industry 0 0 0 0 0 0 0 1Org. chemical/bio-chemical 322 0 0 41 0 0 322 41Other sectors 0 0 0 0 0 0 0 0Waste processing industry 5 0 0 0 0 0 5 0Sum Suldalslågen 1315 0 0 41 0 0 1315 42
Catchment area Vefsna
Food/drink related industry 0 0 0 0 0 0 0 0Org. chemical/bio-chemical 569 0 0 26 0 0 569 26Other sectors 0 0 0 0 1 0 0 2Waste processing industry 0 0 0 0 0 0 0 0Sum Vefsna 569 0 0 26 1 0 569 28
Sum 2000 3323 457 44 140 50 4 3824 196
Diffuse losses summary report (surface water) - national figures (tonnes/year)
Country Normalised Tot-N Tot-P Tot-N Tot-P Tot- N Tot-P Tot-N Tot-P Tot-N Tot-PYear or Agric Agric Dir. Dir. Other Other Backgr Backgr (Agric (Agric +Catchment dep. dep. +
Dir. dep Dir. dep + +
Other - Other -Norway
90

Compilation of Submitted Inputs – Further reduction of nutrient inputs to the North Sea
Data from 1985Alta Normalised 151 5 34 0 4318 228 4318 228 185 5Alta Year specific 126 5 28 0 3602 192 3602 192 154 5Drammenselva Normalised 2280 75 261 4 1952 80 1952 80 2541 79Drammenselva Year specific 2083 69 239 3 1783 81 1783 81 2322 72Glomma Year specific 9739 341 719 18 4719 264 4719 264 10458 359Glomma Normalised 12132 424 895 23 5878 310 5878 310 13027 447Numedalslågen Year specific 2244 75 80 3 979 36 979 36 2324 78Numedalslågen Normalised 2205 74 79 3 962 34 962 34 2284 77Orkla Normalised 6520 248 656 15 8550 278 8550 278 7176 263Orkla Year specific 6051 230 609 14 7935 264 7935 264 6660 244Orreelva Year specific 5035 175 2161 8 5849 130 5849 130 7196 183Orreelva Normalised 2801 97 1202 4 3255 61 3255 61 4003 101Otra Year specific 1071 31 888 2 4890 110 4890 110 1959 33Otra Normalised 911 26 756 1 4161 81 4161 81 1667 27Skienselva Year specific 747 22 616 2 2650 107 2650 107 1363 24Skienselva Normalised 703 21 580 2 2494 75 2494 75 1283 23
Suldalslågen Year specific 3668 161 1777 5 16102 188 16102 188 5445 166Suldalslågen Normalised 2308 102 1118 3 10133 107 10133 107 3426 105Vefsna Year specific 1849 81 245 5 5486 258 5486 258 2094 86Vefsna Normalised 1535 67 204 4 4556 207 4556 207 1739 71
Sum 1985 64159 2329 13147 119 100254 3091 100254 3091 77306 2448
Data from 2000Alta Normalised 149 5 35 3 4318 228 4318 228 184 8Alta Year specific 167 6 39 3 4821 255 4821 255 206 9Drammenselva Normalised 1707 49 249 13 1938 80 1938 80 1956 62Drammenselva Year specific 2398 69 349 18 2723 112 2723 112 2747 87Glomma Year specific 13559 423 1254 60 8239 435 8239 435 14813 483Glomma Normalised 9552 298 884 42 5805 307 5805 307 10436 340Numedalslågen Year specific 2725 83 115 7 1315 48 1315 48 2840 90Numedalslågen Normalised 1904 58 81 5 919 34 919 34 1985 63Orkla Normalised 6603 246 676 21 12110 278 12110 278 7279 267Orkla Year specific 5630 210 577 18 10325 237 10325 237 6207 228
91

Compilation of Submitted Inputs – Further reduction of nutrient inputs to the North Sea
Orreelva Year specific 3413 118 1513 20 4037 75 4037 75 4926 138Orreelva Normalised 2747 95 1218 16 3250 60 3250 60 3965 111Otra Year specific 1114 30 1109 21 6008 116 6008 116 2223 51Otra Normalised 772 21 768 15 4161 81 4161 81 1540 36Skienselva Year specific 835 22 884 43 3839 115 3839 115 1719 65Skienselva Normalised 542 14 574 28 2491 75 2491 75 1116 42Suldalslågen Year specific 2712 118 1334 17 11959 126 11959 126 4046 135
Suldalslågen Normalised 2298 100 1131 14 10135 107 10135 107 3429 114Vefsna Year specific 1606 69 224 11 4752 219 4752 219 1830 80Vefsna Normalised 1523 66 212 11 4505 207 4505 207 1735 77
Sum 2000 61956 2100 13226 386 107650 3195 107650 3195 75182 2486
92

Compilation of Submitted Inputs – Further reduction of nutrient inputs to the North Sea
3. mars
Statens forurensningstilsynPostboks 8100 Dep,
0032 Oslo 1
Deres ref 1998/291 - 61 Vår ref 1998/03392-18 Dato 19.09.01
Rapportering til 5. Nordsjøkonferanse - Næringssalter.Det vises til brev av 5.09.01 der det anmodes om rapportering på artikkel 36 i Esbjærg erklæringen. Rapporteringen skal være en kort omtale av utviklingen i arbeidet med å redusere tap av næringssalter fra landbruket.
Det er tatt utgangspunkt i utformingen av de 2 punktene i artikkel 36.
The Report No 64 to Stortinget (1991-92) concerning Norway's implementation of the North Sea Declarations gave a comprehensive assessment of measures and instruments in the Agricultural sector. Integration of environmental concerns in the Agricultural policy has been re-examined twice during the last decade.
The report No 8 Agriculture in development (1992-93) to Stortinget established environmental principles for sustainable development. The North Sea Declarations were considered as a basic challenge for reduction of water pollution. The report to Stortinget No 19 (1999-2000) concerning Norwegian Agriculture and food production gave basis for more ecological oriented agricultural production and also a basis for introducing comprehensive environmental planning system on the farm level.
Combined use of legal and economic instruments supported with information and control has been an important strategy to reduce pollution. Monitoring of the discharges of nutrients from agricultural catchments has been run over a period of 15 years. A Result Control system is developed and run on a yearly basis to estimate and evaluate the effects of implemented measures to reduce losses of nutrients from agriculture. The system consists of three steps:
Data collection and collocation are operated by Statistics of Norway.
93

Compilation of Submitted Inputs – Further reduction of nutrient inputs to the North Sea
Modelling of discharge of nutrients from agriculture is carried out of Norwegian Centre for Soil and Environmental Research and The Norwegian Institute for Water Research.
The evaluation of results and further administrative decisions and dimensions of measures necessary to achieve politically given goals are a part of the negotiations between the Government and the Farmers Unions in the Agreement of Agriculture. Thus assessment and adjustment of the policy and the use of instruments are done each year.
The reduction of N losses from agriculture has been calculated to 24 % during the period 1985 - 2000, whereas the reduction of P losses is 32 %. The relative reductions (in %) are related to the anthropogenic part of the agricultural nutrient losses. The loss estimates relate to normalised losses (long-term mean losses).
The reductions in the losses of N and P from agriculture have been estimated based on the results of different research projects and field investigations, and the date from Statistics Norway. Measures include soil tillage methods, catch crops, various aspects related to nutrient management (fertilisers and manure), drainage and surface water management, changes in crop composition and technical improvements of point sources in agriculture (silage and manure storages). Statistics Norway provides data on the regional implementation of various measures in agriculture. Detailed descriptions of methods and results are given in Eggestad & Vagstad, 2001: Losses of Nitrogen and Phosphorus from agriculture in the North Sea Convention area of Norway. Jordforsk Technical Report.
Further reductions in both N and P losses are possible. For nitrogen, the potentials are mainly associated with further increase in conservation tillage including the use of catch crops on arable land and more efficient use of nutrient in livestock feeding and plant production. Appropriate governmental instruments have already been established to enhance further decreases in the nutrient losses
The nutrient discharge estimates are linked directly to empirical data through calibration and validation against measured nutrient losses in several small agricultural catchments in different agro-ecological regions in South Eastern Norway. This ensures the reliability of the discharge estimates.
Med hilsen
Ragnar Mjelde Eivind BergUnderdirektør Rådgiver
94

Compilation of Submitted Inputs – Further reduction of nutrient inputs to the North Sea
Report from Sweden2001-12-06
REPORT ON NUTRIENTS TO THE 5th NORTH SEA CONFERENCE
As clearly has been stated earlier, SEPA has during 2000 and 2001 run a project called TRK (Tranport, Retention och Källfördelning, ”Transport, Retention and Source Apportionment”) for the reporting of the HELCOM PLC 4 Project, and also RID 2000/5 th NSC. The Project is mainly aimed at investigation of diffuse sources.
The latest OSPAR EUC-meeting however stressed the necessity of reporting the nutrient load to the Kattegat and Skagerrak earlier.
The report of Sweden is hereby submitted in the format (HARP-NUT) agreed upon.The results of the investigation of the diffuse sources will be sent as soon as there is available an English version of the
project.
e.o.
Anders Widell
95

Compilation of Submitted Inputs – Further reduction of nutrient inputs to the North Sea
Environmental Data Section 2001-12-19Anders Widell
Secretariat 5th North Sea Conference Comments to Draft Chapter SixReduction of Nutrient Inputs to the North SeaComments from Sweden.
The tables 2 to 6 have been scrutinized and compared to stated background documents, i.e HARP NUT Guidelines, duly filled in as requested with the exception of diffuse sources, as these have been extensively studied in a project, TRK, running in 2000 and 2001 with reporting date 2001-12-31, and earlier Swedish reports to OSPAR.
There are some data in these tables that must be changed and commented upon.
Table 2: seems to be OK.
Table 3: the figure 7200 tonnes for tot-N in 1985 should be compared to the given figure for 1987, 9200 tonnes. The following clarification should be inserted in “remarks”: The Swedish figure of 7200 tonnes tot-N from wwtp.s is considered low. A more correct figure is 9000 tonnes, which corresponds better to the figure of 1987, 9200 tonnes. This gives a reduction rate of 32 %.
Clarification:The figure was based on mostly estimated values from the wwtp.s, founded on the calculation 11g N/p,d and a reduction of 30
% in the average wwtp. Later investigations have shown that 12 g N/p,d and a reduction of 20 % in the average wwtp is more correct. If a correction factor of 12/11x0,8/07 is applied on the figure 7200 the result will be 9000.
The results of Sweden given in HARP tables are partly missing or put in the wrong columns in the following tables.
Table 4: first column 3288, second column 1995 (OK), third column –39 %, fourth column 216, fifth column 143, sixth column –34 %.
Table 5: first column 76, second column 62, third column –14 %, fourth column 10, fifth column 9 (OK), sixth column –10 %.
Table 6: first column 1630 (OK), second column 855 (OK), third column –48 %, fourth column 118, fifth column 88 (OK), sixth column –25 %.
Table 7: Please recalculate the figures of phosphorus. An average reduction of 0 % is not possible as the various reductions from tables 2 – 6 are 31 %, 36 %, 34 %, 10 % and 25 %. The reductions were taken at source!!!
96

Compilation of Submitted Inputs – Further reduction of nutrient inputs to the North Sea
Overall suggestion: As You already have stated that the figures from Sweden are from different years (but no explanations) there is no reason not to have them inserted to the tables. There should also be an explanation that some countries before 1985 had a lot of measures aimed at reduction of nutrients, mainly phosphorus, mostly in municipal treatment plants.
97

Compilation of Submitted Inputs – Further reduction of nutrient inputs to the North Sea
Environmental Data Section 2002-01-02Anders Widell
Secretariat 5th North Sea Conference Comments to Draft Chapter SixReduction of Nutrient Inputs to the North SeaComments from Sweden.
The tables 2 to 6 have been scrutinized and compared to stated background documents, i.e HARP NUT Guidelines, duly filled in as requested with the exception of diffuse sources, as these have been extensively studied in a project, TRK, running in 2000 and 2001 with reporting date 2001-12-31, and earlier Swedish reports to OSPAR.
There are some data in these tables that must be changed and commented upon.
Table 2: seems to be OK.
Table 3: The figures for wwtp.s should be:for total N, year 1985: 9200, year 2000: 5446, reduction 41 %for total P, year 1985: 262, year 2000: 157, reduction 40 %References: 1985: Statistics Sweden, Report Na 22 SM 9901, covers the discharges in 1987, but the discharges in 1985 is not deemed to
be smaller, rather larger, as further measures against the more apparent eutrophication problems started at that time.2000: Statistics Sweden, Report MI XX SM 01YY, covers the discharges in 2000. Not yet published.
Table 4: The figures for households should be:for total N, year 1985: 3288, year 2000: 1995, reduction 39 %for total P, year 1985: 216, year 2000: 143, reduction 34 %References:1985 and 2000: Statistics over population connected and not connected to wwtp.s from Statistics Sweden, Reports Na 11 SM
9201 and Na 11 SM 9701.
Table 5: The figures for aquaculture should be:for total N, year 1985: 76, year 2000: 62, reduction 19 %for total P, year 1985: 10, year 2000: 9 , reduction 9 %References: Statistics from Statistics Sweden, calculations from Swedish EPA.
Table 6: The figures for industries should befor total N, year 1985: 1169, year 2000: 855, reduction 27 %
98

Compilation of Submitted Inputs – Further reduction of nutrient inputs to the North Sea
for total P, year 1985: 118, year 2000: 88, reduction 25 % References: Reports from Swedish EPA, Report 5154 (Discharges from pulp- and paper industries in 2000), similar earlier
reports and other compilations.
Table 7: The recalculated figures should be:for total N, year 1985: 31390, year 2000: 17460, reduction 44 %
for total P, year 1985: 996, year 2000: 667, reduction 33 %
There should also be an explanation that some countries before 1985 had a lot of measures aimed at reduction of nutrients, mainly phosphorus, mostly in municipal treatment plants.
99

Compilation of Submitted Inputs – Further reduction of nutrient inputs to the North Sea
Comments to the Swedish load figures as reported to 5th NSC
DIRECT DISCHARGESMethods of measurement and calculation used:
Municipal sewage waterThe municipal sewage treatment plants in Sweden have different levels of sampling procedures depending on their sizes, as
shown in the following table:
Table 1.
Size of treatment plant (pe) Parameter Frequency ofanalyses
201 - 2 000 Tot-P, Tot-N 8 dp/year201 - 2 000 BOD7 and CODCr 8 and 4 dp/year2 001- 10 000 Tot-P, Tot-N 2 dp/month2 001- 10 000 BOD7, CODCr 2 dp/month10 001- 20 000 Tot-P 2 dp/month10 001- 20 000 NH4-N, Tot-N 2 dp/month10 001- 20 000 BOD7, CODCr 2 dp/month
> 20 000 Tot-P 1 wp/week> 20 000 NH4-N, Tot-N 1 dp/week> 20 000 BOD7 1 dp/week> 20 000 CODCr 2 wp/month> 20 000 Hg, Cd, Pb, Cu,
Zn, Cr and Ni 1 wp/month
dp = daily, continuous sampling proportional to the flow during 24 hrs.wp = weekly, continuous sampling proportional to the flow
The calculation of the pollution load from the larger cities (>20 000 pe) is based upon at least 25 samples/year. The water flow through the treatment plants is measured continuosly. The pollution load is calculated as the product of annual flow and flow weighted concentration. Thus the reported pollution load from the municipal treatment plants is considered to be a fairly correct assumption of the true discharges.
100

Compilation of Submitted Inputs – Further reduction of nutrient inputs to the North Sea
The overflows of the larger municipalities are usually included in the figures given above.
The chemical analyses were performed in accordance to Nordic standard.
Tot-N and tot-P: Potassium peroxodisulphate digestion, autoanalyzer.Zn and Cu: Graphite oven AAS.Pb, Cd and Hg: Graphite oven AAS.
Industrial effluents
Methods of measurement and calculation used, including information on the concentration upon which the measurement is based:
pulp- and paper: Tot P and tot-N, once a week.Metals, once a month.
refinery : Metals, sampling four times a year for 5 days/week.
chemical plants: P and N, random samples weekly.
The analyses were performed in accordance to Swedish and Nordic standards and have been described above.
RIVERINE INPUTSMAIN RIVERS AND SOME MINOR RIVERS
Methods of measurement and calculation used:
Monthly sampling for water chemistry analysis. Daily measurement of flow. Transport was calculated as daily Q x linear interpolation of concentrations.
N and P analysis as described above. Cu and Zn graphite oven AAS.
101

Compilation of Submitted Inputs – Further reduction of nutrient inputs to the North Sea
Cd and Pb freeze drying (concentrating), graphite oven AAS.
The load from minor rivers and the coastal areas between the rivers are presented.
MINOR RIVERS NOT MEASURED AND COASTAL AREAS Methods of measurement and estimation used:
The estimations are based upon the monitoring results of the "neighbourhood" rivers. Weighted coefficients has been calculated for the different minor rivers and coastal areas reported
102

Compilation of Submitted Inputs – Further reduction of nutrient inputs to the North Sea
Catchment description summary report - national figures
Catchment name Catchment Lake River Total Long term Water Water Populatio
Area Surface Surface n annual flow
094/095 (67 %) 138 0 10100
094/095 - 107/108
095 Vege å 489 0 43000 160
095/096 1 0 0
096 Rönne å 1897 3 88100 741
096/097 153 0 12900
097 Stensån 286 3 7100 128
097/098 11 0 1900
097/098 - 107/108
098 Lagan 6452 598 118900 2705
098/099 2 0 0
099 Genevadsån 123 2 4700 128
099,100,102,104,106,107
099/100 9 0 1200
100 Fylleån 395 14 9000 237
100/101 6 0 6300
101 Nissan 2686 140 82800 1347
101/102 185 0 25300
102 Suseån 450 7 7600 234
102/103 17 0 4900
103 Ätran 3342 206 65600 1851
103/104 313 8 39300
103

Compilation of Submitted Inputs – Further reduction of nutrient inputs to the North Sea
104 Himleån 202 6 8200 120
104/105 38 0 1900
105 Viskan 2202 132 121200 1259
105/106 307 5 16000
106 Rolfsån 694 66 27100 376
106/107 0 0 0
107 Kungsbackaån 304 21 37400 150
107/108 240 2 126200
108 Göta älv 50117 9276 821900 18443
108, 108/109 - 112108/109 1365 22 134400
108/109 - 111/112
109 Bäveån 301 18 21300 128
109/110 280 2 21600
110 Örekilsälven 1340 57 14500 748
110/111 955 3 40700
111 Strömsån 256 10 4900 142
111/112 157 3 3200
112 Enningdalsälven 782 66 3100 496
Sum Sweden 76495 10670 1932300 29393
Retention in surface waters summary report - national figures (tonnes/year)
Country Tot-N Tot-N Tot-N Tot-P Tot-P Tot-P Tot-N Tot-Year Coastal Unmonitore Monitored Coastal Unmonitore Monitored PCatchment area d inland area d inland
inland inland
104

Compilation of Submitted Inputs – Further reduction of nutrient inputs to the North Sea
Data from (No submitted data)
Sum
Riverine load summary report - national figures (tonnes/year)
Country Specific Riverine load, Riverine load, Riverine load, Riverine load, Transboundar TransboundarYear annual y riverine y riverine Catchment riverine flow without without flow- flow- inputs, inputs,
normalisation normalisation normalised normalised mill m3/year tonnes/yr tonnes/yr tonnes/yr tonnes/yr tonnes/yr tonnes/yr
SwedenData from 2000094/095 (67 %) 47 4 272095 Vege å 233 11,8 905095/096 0,02 1,9096 Rönne å 725 45,9 2695096/097 72 3,7 283097 Stensån 4 6,9 530097/098 - 107/108 662 19,8 1601098 Lagan 2995 60,2 3105099,100,102,104,106,107 2 35,4 2525101 Nissan 1703 36,1 1574103 Ätran 2239 45,4 2415105 Viskan 1640 63,2 1773108 Göta älv 23967 415 20355108/109 - 111/112 2397 105 2453109 Bäveån 252 11,1 250110 Örekilsälven 1198 52,5 1224
13.f 2
105

Compilation of Submitted Inputs – Further reduction of nutrient inputs to the North Sea
Specific Riverine load, Riverine load, Riverine load, Riverine load, Transboundar TransboundarYear annual y riverine y riverine Catchment riverine flow without without flow- flow- inputs, inputs,
normalisation normalisation normalised normalised mill m3/year tonnes/yr tonnes/yr tonnes/yr tonnes/yr tonnes/yr tonnes/yr
111 Strömsån 227 10 234112 Enningdalsälven 725 9,2 507
Sum 2000 39088 935,22 42702,9 2 of 2
All anthropogenic sources - tonnes N
Country WWTP Industry Aquaculture Households Diffuse Sum Year sources
Sweden1995 0 0 0 1995 0 19951998 6194 0 0 0 0 61941999 0 0 61,5 0 0 61,52000 0 854,8 0 0 0 854,8
All anthropogenic sources - tonnes P
Country WWTP Industry Aquaculture Households Diffuse Sum Year sources
Sweden1995 0 0 0 143 0 1431998 218 0 0 0 0 218
106

Compilation of Submitted Inputs – Further reduction of nutrient inputs to the North Sea
1999 0 0 9,1 0 0 9,12000 0 88,4 0 0 0 88,4
Aquaculture summary report - national figures (tonnes/year)
Country Tot- N Tot-N Tot- N Tot-P Tot-P Tot-P Tot-N Tot-P Year Coastal Inland Inland Coasta Inland Inland Catchment monitore unmonitore l monitore unmonitore
areaSwedenData from 1999094/095 - 107/108 0 0 0 0 0 0 1,5 0,2108, 108/109 - 112 0 0 0 0 0 0 60 8,9
Sum 1999 0 0 0 0 0 0 61,5 9,1
Sewage works and sewerage summary report - national figures (tonnes/year)
Country Tot-N Tot-N Tot-N Tot-P Tot- P Tot-P Tot-N Tot-P Year Coastal Inland Inland Coastal Inland Inland Catchment name area monitored unmonitored area monitored unmonitore
dSwedenData from 1998
094/095 (67 %) 0 0 0 0 0 0 0 0095 Vege å 0 69 0 0 1 0 69 1095/096 0 0 0 0 0 0 0 0096 Rönne å 3 122 0 51 0 0 125 51096/097 23 0 0 0 0 0 23 0097 Stensån 0 0 0 0 0 0 0 0
107

Compilation of Submitted Inputs – Further reduction of nutrient inputs to the North Sea
097/098 16 0 0 0 0 0 16 0098 Lagan 12 228 0 1 3 0 240 4098/099 0 0 0 0 0 0 0 0099 Genevadsån 0 0 0 0 0 0 0 0099/100 0 0 0 0 0 0 0 0100 Fylleån 0 0 0 0 0 0 0 0100/101 0 0 0 0 0 0 0 0101 Nissan 117 132 0 5 1 0 249 6101/102 9 0 0 1 0 0 9 1102 Suseån 0 6 0 0 0 0 6 0102/103 0 0 0 0 0 0 0 0
13. mars 2002 Page 1 of 2
108

Compilation of Submitted Inputs – Further reduction of nutrient inputs to the North Sea
Country Tot-N Tot-N Tot-N Tot-P Tot- P Tot-P Tot-N Tot-P Year Coastal Inland Inland Coastal Inland Inland Catchment name area monitored unmonitored area monitored unmonitore
d103 Ätran 0 239 0 0 2 0 239 2103/104 118 0 0 5 0 0 118 5104 Himleån 0 0 0 0 0 0 0 0104/105 0 0 0 0 0 0 0 0105 Viskan 0 340 0 0 11 0 340 11105/106 16 0 0 1 0 0 16 1106 Rolfsån 0 5 0 0 0 0 5 0106/107 0 0 0 0 0 0 0 0107 Kungsbackaån 105 0 0 3 0 0 105 3107/108 23 0 0 1 0 0 23 1108 Göta älv 1712 2542 0 64 63 0 4254 127108/109 111 10 0 2 0 0 121 2109 Bäveån 93 0 0 1 0 0 93 1109/110 9 0 0 0 0 0 9 0110 Örekilsälven 0 10 0 0 0 0 10 0110/111 102 12 0 2 0 0 114 2111 Strömsån 0 0 0 0 0 0 0 0111/112 10 0 0 0 0 0 10 0112 Enningdalsälven 0 0 0 0 0 0 0 0Sum 1998 2479 3715 0 137 81 0 6194 218
Households not connected to public sewerage summary report - national figures
Country Tot-N Tot-N Tot-N Tot-P Tot-P Tot-P Tot-N Tot-P Year Coastal Inland Inland Coastal Inland Inland Catchment name area monitored unmonitored area monitored unmonitore
d
109

Compilation of Submitted Inputs – Further reduction of nutrient inputs to the North Sea
SwedenData from 1995094/095 (67 %) 0 0 0 0 0 0 14 1,1095 Vege å 0 0 0 0 0 0 35 2,7095/096 0 0 0 0 0 0 0 0096 Rönne å 0 0 0 0 0 0 112 8,4096/097 0 0 0 0 0 0 17 1,3097 Stensån 0 0 0 0 0 0 19 1,3097/098 0 0 0 0 0 0 0 0098 Lagan 0 0 0 0 0 0 190 13,6098/099 0 0 0 0 0 0 0 0099 Genevadsån 0 0 0 0 0 0 9 0,7099/100 0 0 0 0 0 0 1 0,1100 Fylleån 0 0 0 0 0 0 15 1,1100/101 0 0 0 0 0 0 0 0101 Nissan 0 0 0 0 0 0 74 5,3101/102 0 0 0 0 0 0 12 0,9102 Suseån 0 0 0 0 0 0 20 1,4102/103 0 0 0 0 0 0 1 0,1
103 Ätran 0 0 0 0 0 0 120 8,4103/104 0 0 0 0 0 0 30 2,1104 Himleån 0 0 0 0 0 0 22 1,5104/105 0 0 0 0 0 0 8 0,6105 Viskan 0 0 0 0 0 0 139 9,7105/106 0 0 0 0 0 0 43 3,1106 Rolfsån 0 0 0 0 0 0 62 4,3106/107 0 0 0 0 0 0 0 0107 Kungsbackaån 0 0 0 0 0 0 41 3107/108 0 0 0 0 0 0 29 2,1108 Göta älv 0 0 0 0 0 0 523 37,4108/109 0 0 0 0 0 0 237 17,1109 Bäveån 0 0 0 0 0 0 23 1,6109/110 0 0 0 0 0 0 41 2,9110 Örekilsälven 0 0 0 0 0 0 45 3,2110/111 0 0 0 0 0 0 80 5,7
110

Compilation of Submitted Inputs – Further reduction of nutrient inputs to the North Sea
111 Strömsån 0 0 0 0 0 0 9 0,6111/112 0 0 0 0 0 0 9 0,6112 Enningdalsälven 0 0 0 0 0 0 15 1,1Sum 1995 0 0 0 0 0 0 1995 143
Industrial plants report - national figures(tonnes/year)
Country Tot-N Tot-N Tot-N Tot-P Tot-P Tot-P Tot-N Tot-P Year Coastal Inland Inland Coastal Inland Inland Catchment area monitored unmonitored area monitored unmonitorename dIndustry SwedenData from 2000Catchment area 096 Rönne å
Pulp/paper industry 0 9 0 0 0,2 0 9 0,2Sum 096 Rönne å 0 9 0 0 0,2 0 9 0,2
Catchment area 098 Lagan
Pulp/paper industry 0 11 0 0 0,7 0 11 0,7Sum 098 Lagan 0 11 0 0 0,7 0 11 0,7
Catchment area 101 Nissan
Pulp/paper industry 0 28 0 0 2,8 0 28 2,8Sum 101 Nissan 0 28 0 0 2,8 0 28 2,8
Catchment area 105/106
Pulp/paper industry 101 0 0 22 0 0 101 22Sum 105/106 101 0 0 22 0 0 101 22
111

Compilation of Submitted Inputs – Further reduction of nutrient inputs to the North Sea
Country Tot-N Tot-N Tot-N Tot-P Tot-P Tot-P Tot-N Tot-P
Year Coastal Inland Inland Coastal Inland Inland Catchment area monitored unmonitored area monitored unmonitorename dIndustry Catchment area 108 Göta älv
Pulp/paper industry 0 620 0 0 58 0 620 58Sum 108 Göta älv 0 620 0 0 58 0 620 58
Catchment area 108/109
Cookeries/refineries 22,6 0 0 0,4 0 0 22,6 0,4Org. chemical/bio-chemical 53,2 0 0 3,7 0 0 53,2 3,7Sum 108/109 75,8 0 0 4,1 0 0 75,8 4,1
Catchment area 110/111
Cookeries/refineries 10 0 0 0,6 0 0 10 0,6Sum 110/111 10 0 0 0,6 0 0 10 0,6
Sum 2000 186,8 668 0 26,7 61,7 0 854,8 88,4
Diffuse losses summary report (surface water) - national figures (tonnes/year)
Country Normalised Tot-N Tot-P Tot-N Tot-P Tot- N Tot-P Tot-N Tot-P Tot-N Tot-PYear or Agric Agric Dir. Dir. Other Other Backgr Backgr (Agric (Agric +Catchment dep. dep. +
Dir. dep Dir. dep + +
Other - Other -
112

Compilation of Submitted Inputs – Further reduction of nutrient inputs to the North Sea
Data from (Figures submitted at an earlier stage have been used)
Sum
113

Compilation of Submitted Inputs – Further reduction of nutrient inputs to the North Sea
Report from SwitzerlandCatchment description summary report - national figures
Catchment name Catchment Lake River Total Long term Water Water Populatio
Area Surface Surface n annual flow
Rhine downstream lakes 9500 0 0,86 3000000 32324
Sum Switzerland 9500 0 0,86 3000000 32324
Retention in surface waters summary report - national figures (tonnes/year)
Country Tot-N Tot-N Tot-N Tot-P Tot-P Tot-P Tot-N Tot-Year Coastal Unmonitore Monitored Coastal Unmonitore Monitored PCatchment area d inland area d inland
inland inland
Data from (No submitted data)
Sum
Riverine load summary report - national figures (tonnes/year)
114

Compilation of Submitted Inputs – Further reduction of nutrient inputs to the North Sea
Country Specific Riverine load, Riverine load, Riverine load, Riverine load, Transboundar TransboundarYear annual y riverine y riverine Catchment riverine flow without without flow- flow- inputs, inputs,
normalisation normalisation normalised normalised mill m3/year tonnes/yr tonnes/yr tonnes/yr tonnes/yr tonnes/yr tonnes/yr
Data from (No submitted data)
Sum
All anthropogenic sources - tonnes N
Country WWTP Industry Aquaculture Households Diffuse Sum Year sources
Switzerland1985 18000 1000 0 1000 1886 218862000 12300 800 30 100 8444 21674
All anthropogenic sources - tonnes P
Country WWTP Industry Aquaculture Households Diffuse Sum Year sources
Switzerland1985 2300 153 0 250 320 30232000 900 20 3 10 147 1080
115

Compilation of Submitted Inputs – Further reduction of nutrient inputs to the North Sea
Aquaculture summary report - national figures (tonnes/year)
Country Tot- N Tot-N Tot- N Tot-P Tot-P Tot-P Tot-N Tot-P Year Coastal Inland Inland Coasta Inland Inland Catchment monitore unmonitore l monitore unmonitore
areaSwitzerlandData from 2000Rhine downstream lakes 0 30 0 0 3 0 30 3
Sum 2000 0 30 0 0 3 0 30 3
Sewage works and sewerage summary report - national figures (tonnes/year)
Country Tot-N Tot-N Tot-N Tot-P Tot- P Tot-P Tot-N Tot-P Year Coastal Inland Inland Coastal Inland Inland Catchment name area monitored unmonitored area monitored unmonitore
dSwitzerlandData from 1985
Rhine downstream lakes 0 18000 0 0 2300 0 18000 2300Sum 1985 0 18000 0 0 2300 0 18000 2300
Data from 2000
Rhine downstream lakes 0 12300 0 0 900 0 12300 900Sum 2000 0 12300 0 0 900 0 12300 900
116

Compilation of Submitted Inputs – Further reduction of nutrient inputs to the North Sea
Households not connected to public sewerage summary report - national figures
Country Tot-N Tot-N Tot-N Tot-P Tot-P Tot-P Tot-N Tot-P Year Coastal Inland Inland Coastal Inland Inland Catchment name area monitored unmonitored area monitored unmonitore
d
SwitzerlandData from 1985Rhine downstream lakes 0 1000 0 0 250 0 1000 250Sum 1985 0 1000 0 0 250 0 1000 250
Data from 2000Rhine downstream lakes 0 100 0 0 10 0 100 10Sum 2000 0 100 0 0 10 0 100 10
Industrial plants report - national figures (tonnes/year)
Country Tot-N Tot-N Tot-N Tot-P Tot-P Tot-P Tot-N Tot-P Year Coastal Inland Inland Coastal Inland Inland Catchment area monitored unmonitored area monitored unmonitorename dIndustry SwitzerlandData from 1985Catchment area Rhine downstream lakes
0 1000 0 0 153 0 1000 153
117
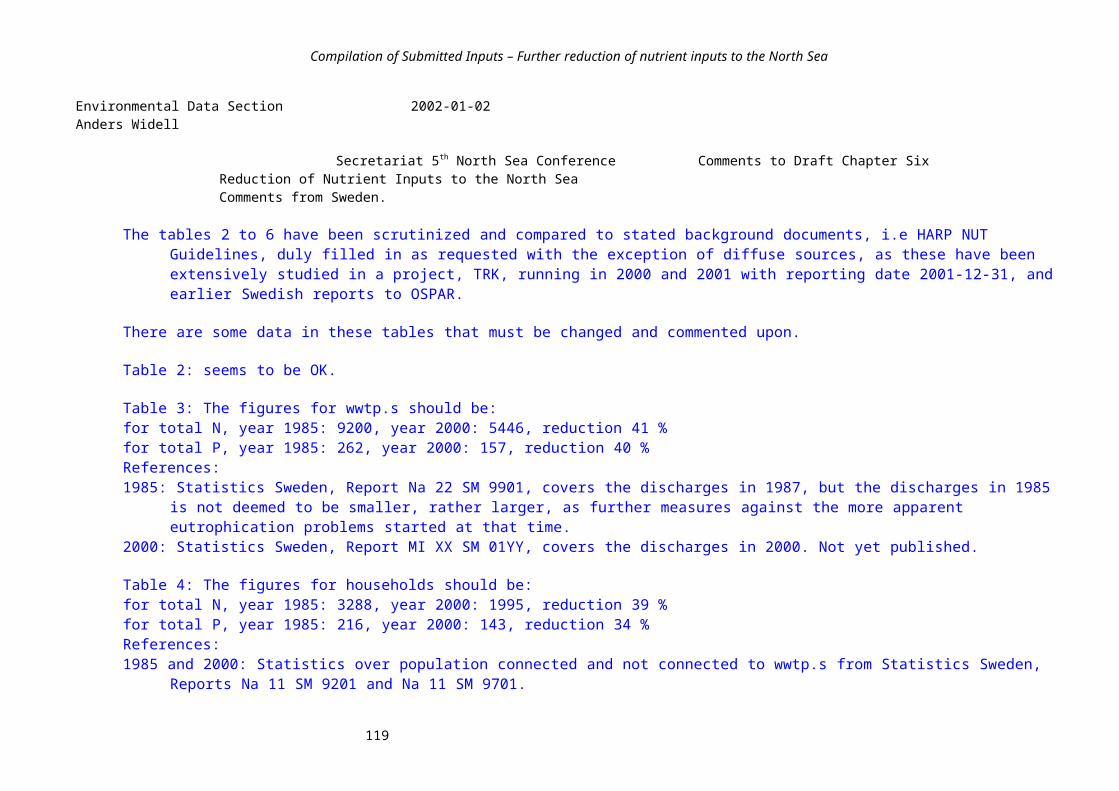
Compilation of Submitted Inputs – Further reduction of nutrient inputs to the North Sea
Sum Rhine downstream 0 1000 0 0 153 0 1000 153
Sum 1985 0 1000 0 0 153 0 1000 153
Data from 2000Catchment area Rhine downstream lakes
0 800 0 0 20 0 800 20Sum Rhine downstream 0 800 0 0 20 0 800 20
Sum 2000 0 800 0 0 20 0 800 20
Diffuse losses summary report (surface water) - national figures (tonnes/year)
Country Normalised Tot-N Tot-P Tot-N Tot-P Tot- N Tot-P Tot-N Tot-P Tot-N Tot-PYear or Agric Agric Dir. Dir. Other Other Backgr Backgr (Agric (Agric +Catchment dep. dep. +
Dir. dep Dir. dep + +
Other - Other -SwitzerlandData from 1985Rhine downstream lakes Normalised 10802 408 206 6 604 4 9726 98 1886 320
Sum 1985 10802 408 206 6 604 4 9726 98 1886 320
Data from 2000Rhine downstream lakes Normalised 11446 272 162 5 1565 8 4729 138 8444 147
Sum 2000 11446 272 162 5 1565 8 4729 138 8444 147
118

Compilation of Submitted Inputs – Further reduction of nutrient inputs to the North Sea
Swiss Delegation in CONSSO Bern, 20 December 2002
5NSC Progress Report Chap. 6
Nutrients – Total of all anthropogenic sources, background load and overall total(the same figures are used for different sources as submitted in the reporting format!)
Switzerland Nitrogen (tonnes N/year)
1985 % 2000 %
WWTP 18‘000 57 12‘300 47
Industry 1000 3 800 3
Aquaculture --- 30 0
Hauseholds 1000 3 100 0
Diffuse Sources 11‘612 37 13‘173 50
Total anthropogenic sources
31‘612 100 26‘403 100
Background Load 9726 4729
Overall TOTAL 41‘338 31‘132
Switzerland Phosphorus (tonnes P/year)
119

Compilation of Submitted Inputs – Further reduction of nutrient inputs to the North Sea
1985 % 2000 %
WWTP 2300 74 900 74
Industry 153 5 20 2
Aquaculture --- 3 0
Hauseholds 250 8 10 1
Diffuse Sources 418 13 285 23
Total anthropogenic sources
3121 100 1218 100
Background Load 98 138
Overall TOTAL 3219 1356
120

Compilation of Submitted Inputs – Further reduction of nutrient inputs to the North Sea
Report from the Netherlands Catchment description summary report – national figures
Catchment name Catchment Lake River Total Long term Water Water Populatio
Area Surface Surface n annual flow
Ems 0 3,78 0 557270 0
Meuse 0 19,2 253,54 3678119 24756
Rhine 0 2253,18 176,62 11140738 42101
Scheldt 0 153,59 1,9 384073 4005
Sum Netherlands 0 2429,75 432,06 15760200 70862
Retention in surface waters summary report – national figures (tonnes/year)
Country Tot-N Tot-N Tot-N Tot-P Tot-P Tot-P Tot-N Tot-Year Coastal Unmonitore Monitored Coastal Unmonitore Monitored PCatchment area d inland area d inland
inland inland
Data from (No information)
Sum
121

Compilation of Submitted Inputs – Further reduction of nutrient inputs to the North Sea
Riverine load summary report - national figures (tonnes/year)
Country Specific Riverine load, Riverine load, Riverine load, Riverine load, Transboundar TransboundarYear annual y riverine y riverine Catchment riverine flow without without flow- flow- inputs, inputs,
normalisation normalisation normalised normalised mill m3/year tonnes/yr tonnes/yr tonnes/yr tonnes/yr tonnes/yr tonnes/yr
NetherlandsData from 1985Ems 0 0 0 0 0 0 0Meuse 0 0 0 0 0 3100 28500Rhine 0 33000 400000 0 0 36200 392000Scheldt 0 4000 34500 0 0 4000 34500
Sum 1985 0 37000 434500 0 0 43300 455000
Data from 1999Ems 0 0 0 0 0 0 0Meuse 0 4200 111000 0 0 3640 38560Rhine 0 9800 145000 0 0 18700 300700Scheldt 0 2200 33600 0 0 2200 33600
Sum 1999 0 16200 289600 0 0 24540 372860
All anthropogenic sources nitrogen (tonnes/year)
Country WWTP Industry Aquaculture Households Diffuse Sum Year sources
Netherlands
122

Compilation of Submitted Inputs – Further reduction of nutrient inputs to the North Sea
1985 38410 19529 0 8481 10403000 104694201999 31000 4631,3 0 665 6075264 6111560,3
All anthropogenic sources phosphorous (tonnes/year)
Country WWTP Industry Aquaculture Households Diffuse Sum Year sources
Netherlands1985 10800 13422 0 1773 820000 8459951999 3000 3383,7 0 72 470000 476455,7
Aquaculture summary report
Country Tot- N Tot-N Tot- N Tot-P Tot-P Tot-P Tot-N Tot-P Year Coastal Inland Inland Coasta Inland Inland Catchment monitore unmonitore l monitore unmonitore
area
Data from (No submitted data)
Sum
123

Compilation of Submitted Inputs – Further reduction of nutrient inputs to the North Sea
Sewage works and sewerage summary report (tonnes/year)
Country Tot-N Tot-N Tot-N Tot-P Tot- P Tot-P Tot-N Tot-P Year Coastal Inland Inland Coastal Inland Inland Catchment name area monitored unmonitored area monitored unmonitore
dNetherlandsData from 1985
Ems 0 0 1550 0 0 330 1550 330Meuse 0 8970 0 0 2530 0 8970 2530Rhine 3890 23180 0 80 7610 0 27070 7690Scheldt 0 0 820 0 0 250 820 250Sum 1985 3890 32150 2370 80 10140 580 38410 10800
Data from 1999
Ems 0 0 1130 0 0 60 1130 60Meuse 0 6890 0 0 730 0 6890 730Rhine 3890 17270 0 140 1900 0 21120 2040Scheldt 0 0 1860 0 0 170 1860 170Sum 1999 3890 24160 2990 140 2630 230 31000 3000
Households not connected to public sewerage summary report - national figures (tonnes/year)
Country Tot-N Tot-N Tot-N Tot-P Tot-P Tot-P Tot-N Tot-P Year Coastal Inland Inland Coastal Inland Inland Catchment name area monitored unmonitored area monitored unmonitore
d
NetherlandsData from 1985
124

Compilation of Submitted Inputs – Further reduction of nutrient inputs to the North Sea
Ems 0 0 300 0 0 63 300 63Meuse 0 1979 0 0 414 0 1979 414Rhine 0 5995 0 0 1253 0 5995 1253Scheldt 0 0 207 0 0 43 207 43Sum 1985 0 7974 507 0 1667 106 8481 1773
Data from 1999Ems 0 0 24 0 0 3 24 3Meuse 0 155 0 0 17 0 155 17Rhine 0 470 0 0 50 0 470 50Scheldt 0 0 16 0 0 2 16 2Sum 1999 0 625 40 0 67 5 665 72
Country Tot-N Tot-N Tot-N Tot-P Tot-P Tot-P Tot-N Tot-P Year Coastal Inland Inland Coastal Inland Inland Catchment area monitored unmonitored area monitored unmonitorename dIndustry NetherlandsData from 1985Catchment area Ems
Food/drink related industry 0 0 3404 0 0 262 3404 262Org. chemical/bio-chemical 0 0 1201 0 0 3 1201 3Other sectors 0 0 284 0 0 2 284 2Pulp/paper industry 0 0 240 0 0 0,4 240 0,4Sum Ems 0 0 5129 0 0 267,4 5129 267,4
Catchment area Meuse
Food/drink related industry 0 141 0 0 14 0 141 14Org. chemical/bio-chemical 0 447 0 0 7 0 447 7Other sectors 0 2342 0 0 86 0 2342 86Pulp/paper industry 0 136 0 0 0,2 0 136 0,2Sum Meuse 0 3066 0 0 107,2 0 3066 107,2
125

Compilation of Submitted Inputs – Further reduction of nutrient inputs to the North Sea
Catchment area Rhine
Cookeries/refineries 0 715 0 0 55 0 715 55
13. mars 2002 Page 1 of 4
126

Compilation of Submitted Inputs – Further reduction of nutrient inputs to the North Sea
Country Tot-N Tot-N Tot-N Tot-P Tot-P Tot-P Tot-N Tot-P Year Coastal Inland Inland Coastal Inland Inland Catchment area monitored unmonitored area monitored unmonitorename dIndustry Fertiliser industry 0 2244 0 0 5127 0 2244 5127Food/drink related industry 112 725 0 29 317 0 837 346Org. chemical/bio-chemical 0 1802 0 0 173 0 1802 173Other sectors 1621 1660 0 9 6813 0 3281 6821Pulp/paper industry 0 686 0 0 26 0 686 26Waste processing industry 0 77 0 0 0,4 0 77 0,4Sum Rhine 1733 7909 0 38 12511,4 0 9642 12548,4
Catchment area Scheldt
Cookeries/refineries 0 0 91 0 0 0 91 0Fertiliser industry 0 0 333 0 0 83 333 83Food/drink related industry 0 0 122 0 0 31 122 31Org. chemical/bio-chemical 0 0 471 0 0 23 471 23Other sectors 0 0 604 0 0 361 604 361Pulp/paper industry 0 0 71 0 0 1 71 1Sum Scheldt 0 0 1692 0 0 499 1692 499
Sum 1985 1733 10975 6821 38 12618,6 766,4 19529 13422
Data from 1999Catchment area Ems
Food/drink related industry 0 0 43 0 0 6 43 6Org. chemical/bio-chemical 0 0 109 0 0 0,1 109 0,1Other sectors 0 0 49 0 0 1 49 1Pulp/paper industry 0 0 38 0 0 12 38 12Sum Ems 0 0 239 0 0 19,1 239 19,1
13. mars 2002 Page2 of 4
127

Compilation of Submitted Inputs – Further reduction of nutrient inputs to the North Sea
Industrial plants report – National figures (tonnes/year)
Country Tot-N Tot-N Tot-N Tot-P Tot-P Tot-P Tot-N Tot-P Year Coastal Inland Inland Coastal Inland Inland Catchment area monitored unmonitored area monitored unmonitorename dIndustry Catchment area Meuse
Food/drink related industry 0 77 0 0 56 0 77 56Org. chemical/bio-chemical 0 21 0 0 6 0 21 6Other sectors 0 731 0 0 16 0 731 16Pulp/paper industry 0 36 0 0 4 0 36 4Sum Meuse 0 865 0 0 82 0 865 82
Catchment area Rhine
Cookeries/refineries 0 445 0 0 5 0 445 5Fertiliser industry 0 868 0 0 1974 0 868 1974Food/drink related industry 30 213 0 19 136 0 243 155Org. chemical/bio-chemical 0 306 0 0 19 0 306 19Other sectors 831 376 0 20 951 0 1208 970Pulp/paper industry 2 100 0 0,3 21 0 102 21,3Waste processing industry 0 64 0 0 0,3 0 64 0,3Sum Rhine 863 2372 0 39,3 3106,3 0 3236 3144,6
Catchment area Scheldt
Cookeries/refineries 0 0 0,3 0 0 0 0,3 0Fertiliser industry 0 0 61 0 0 16 61 16Food/drink related industry 0 0 110 0 0 87 110 87Org. chemical/bio-chemical 0 0 58 0 0 3 58 3Other sectors 0 0 17 0 0 15 17 15Waste processing industry 0 0 45 0 0 17 45 17
13. mars 2002 Page 3 of 4
128

Compilation of Submitted Inputs – Further reduction of nutrient inputs to the North Sea
Country Tot-N Tot-N Tot-N Tot-P Tot-P Tot-P Tot-N Tot-P Year Coastal Inland Inland Coastal Inland Inland Catchment area monitored unmonitored area monitored unmonitorename dIndustry Sum Scheldt 0 0 291,3 0 0 138 291,3 138
Sum 1999 863 3237 530,3 39,3 3188,3 157,1 4631,3 3383,7
Diffuse losses summary report (surface water) – national figures (tonnes/year))
Country Normalised Tot-N Tot-P Tot-N Tot-P Tot- N Tot-P Tot-N Tot-P Tot-N Tot-PYear or Agric Agric Dir. Dir. Other Other Backgr Backgr (Agric (Agric +Catchment dep. dep. +
Dir. dep Dir. dep + +
Other - Other -Data from 1985Ems Normalised 519000 41000 106 0 0 0 0 0 519106 41000Meuse Normalised 2076000 164000 2183 0 0 0 0 0 2078183 164000Rhine Normalised 7266000 574000 19465 0 0 0 0 0 7285465 574000Scheldt Normalised 519000 41000 1246 0 0 0 0 0 520246 41000
Sum 1985 10380000 820000 23000 0 0 0 0 0 10403000 820000
Data from 1999Ems Normalised 303500 23500 24 0 0 0 0 0 303524 23500Meuse Normalised 1214000 94000 500 0 0 0 0 0 1214500 94000Rhine Normalised 4249000 329000 4455 0 0 0 0 0 4253455 329000Scheldt Normalised 303500 23500 285 0 0 0 0 0 303785 23500
Sum 1999 6070000 470000 5264 0 0 0 0 0 6075264 470000
129