Embed Size (px)
Citation preview

Reactive Power Procurement: Lessons from Around the World
By
Karim L. Anaya1 and Michael G. Pollitt23
Energy Policy Research Group,Judge Business School, University of Cambridge,
Trumpington Street, CB2 1AG
Abstract
This paper explores the international experience in the procurement of reactive power and other electricity ancillary services. It involves system operators from different jurisdictions including Australia, the United States and Great Britain. The paper evaluates the different procurement mechanisms and related compensation schemes. In addition, it also appraises a novel approach (from the Power Potential initiative in the UK) for contracting reactive power services from distributed energy resources (DER) using a market-based mechanism. The conceptual auction design applicable to the procurement of reactive power is also discussed. Our findings suggest that competition in reactive power is very limited in comparison with other ancillary services such as frequency regulation and capacity reserves. The introduction of more market oriented mechanisms and resources (such as DER) for acquiring reactive and active power services by the system operator opens new opportunities and new ways to deal with voltage stability issues. Power Potential brings the opportunity to trial the technical and commercial solution, new roles and new interactions required in the introduction of a competitive reactive power market.
1. Introduction Reactive power is necessary to maintain the local electricity network voltage within the required limits to secure the proper operation of the electrical power equipment. Reactive power represents one of the ancillary services that system operators need to procure in order to control and balance the transmission system. The increase of renewable electricity generation leads to higher demand of reactive power (Dierkes et al., 2014). The upward trend of distributed energy resources (DER) 4 is
1 Corresponding author, email: [email protected] Email: [email protected] The authors would like to acknowledge the support from AEMO, CAISO, ISO-NE, NYISO, PJM, SCE, UK Power Networks and National Grid in the provision of relevant information and clarifications. The authors also acknowledge the financial support of National Grid via the Electricity Network Innovation Competition (NIC) Power Potential Project. The views expressed herein are those of the authors and do not reflect the views of the EPRG or any other organisation that is also involved in the Power Potential project.4 DER has been usually associated with facilities connected to the distribution system (NERC, 2017; FERC, 2018a). NYISO has proposed a more open definition but keeping at the same time the concept of small resource (limited capacity). DER are defined as “resources qualified to participate in NYISO’s Energy, Ancillary Services, and/or Capacity markets that are (1) capable of changing its load, or (ii) capable of injecting 20 MW
1

challenging both the transmission and distribution systems by altering traditional grid operation. The transition to a more decentralised and flexible energy system reflected in the adoption of specific national/state policies (e.g. DER Roadmaps in New York, DER Action Plan in California) and the declining cost of DER technologies are contributing to DER expansion. DER (aggregated or individual connected) often has dual participation, in wholesale and retail electricity markets, which allows it to deliver greater benefits due to the provision of multiple services, including ancillary services such as reactive power (NYISO, 2017b).
This study looks at the international experience in the management and procurement of reactive power and its support to the system operation as an ancillary service. We look at system operators from Australia, USA and GB. It also explores a pioneering initiative (the Power Potential trial) that is being implemented by National Grid (the Transmission Electricity System Operator for GB) and UK Power Networks (the largest DNO in GB). Power Potential seeks to contract with DER for the provision of reactive and active power services in the southern region of GB using a competitive mechanism (i.e. auctions). Some specific lessons are identified for the future procurement of reactive power by system operators from DER using market-based mechanisms.
The structure of this paper is as follows. Section 2 discusses the basics of reactive power, its role as an ancillary service, key upgrades in network codes that enhance DER reactive power capabilities and the future role of DER in reactive power support and other markets. Section 3 explores current methods for managing and procuring reactive power by selected system operators in Australia, the USA and GB. Section 4 describes the Power Potential initiative. Section 5 discusses the main findings of this study and lessons for the procurement of reactive power using market-based mechanisms. Section 6 concludes.
2. About Reactive Power 2.1 The Basics of Reactive Power
There are two types of power in an AC power supply system, reactive power and active power (real or true power). In contrast with active power (expressed in Watts), reactive power (expressed in Volt-Amperes Reactive) does not involve a transfer of energy. Reactive power is transferred from the source to the load and then returns from the load to the source, then the average power supplied is zero. This means contrary to active power, reactive power is positive during one half cycle and negative during another half cycle on the AC waveform (Chapman, 2005). Reactive power (Q) is produced in an AC circuit when the current and voltage waveforms are not in phase. This dephasing reduces the active power (P) output5. Then, reactive power compensation is required to keep the system voltage within appropriate limits. These limits can be controlled by devices with leading power factor – PF (increasing system voltage) or lagging PF (lowering system voltage). In the first case reactive power is supplied to the system and in the second one reactive power is consumed by the device6. Among the sources that can generate or absorb reactive power are `generators (by
or less onto the transmission and/or distribution system, at the NYISO’s direction” (NYISO, 2017b, p.10).5 S2=P2+Q2 (Eq .1 ), where S: apparent power (MVA). If the dephasing is zero then P=S otherwise, P<S.
6 PF=PS
(Eq .2 ), S=I∗V (Eq .3 ) , then from (Eq 1, 2): Q=( PPF )∗(1−P F2 )0.5,where S: apparent
power (MVA), P: real power (MW), Q: reactive power (Mvar), I: current, V: voltage. If PF=1 then I and V are in phase and Q=0. If a generator operates with a PF of 0.95 leading it means that the generator exports 0.3 Mvar (leading reactive power) to the system for every MW of real power produced. On the other hand, if the
2

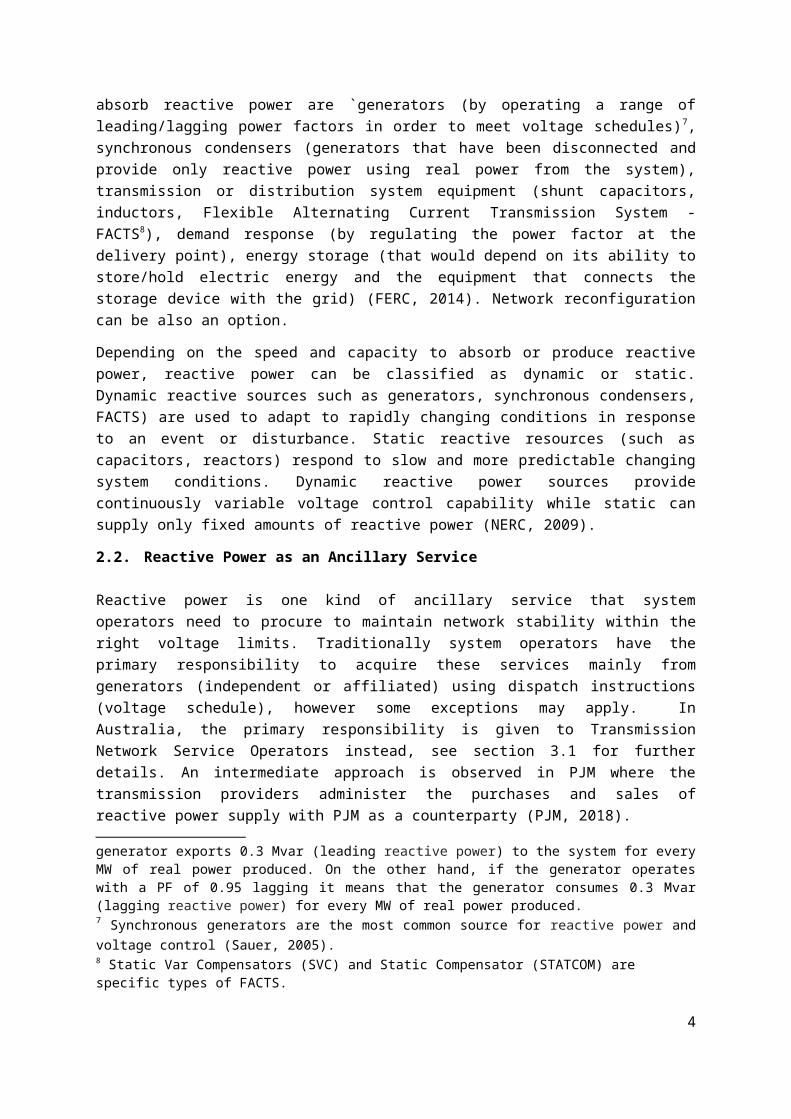
operating a range of leading/lagging power factors in order to meet voltage schedules) 7, synchronous condensers (generators that have been disconnected and provide only reactive power using real power from the system), transmission or distribution system equipment (shunt capacitors, inductors, Flexible Alternating Current Transmission System - FACTS8), demand response (by regulating the power factor at the delivery point), energy storage (that would depend on its ability to store/hold electric energy and the equipment that connects the storage device with the grid) (FERC, 2014). Network reconfiguration can be also an option.
Depending on the speed and capacity to absorb or produce reactive power, reactive power can be classified as dynamic or static. Dynamic reactive sources such as generators, synchronous condensers, FACTS) are used to adapt to rapidly changing conditions in response to an event or disturbance. Static reactive resources (such as capacitors, reactors) respond to slow and more predictable changing system conditions. Dynamic reactive power sources provide continuously variable voltage control capability while static can supply only fixed amounts of reactive power (NERC, 2009).
2.2. Reactive Power as an Ancillary Service
Reactive power is one kind of ancillary service that system operators need to procure to maintain network stability within the right voltage limits. Traditionally system operators have the primary responsibility to acquire these services mainly from generators (independent or affiliated) using dispatch instructions (voltage schedule), however some exceptions may apply. In Australia, the primary responsibility is given to Transmission Network Service Operators instead, see section 3.1 for further details. An intermediate approach is observed in PJM where the transmission providers administer the purchases and sales of reactive power supply with PJM as a counterparty (PJM, 2018).
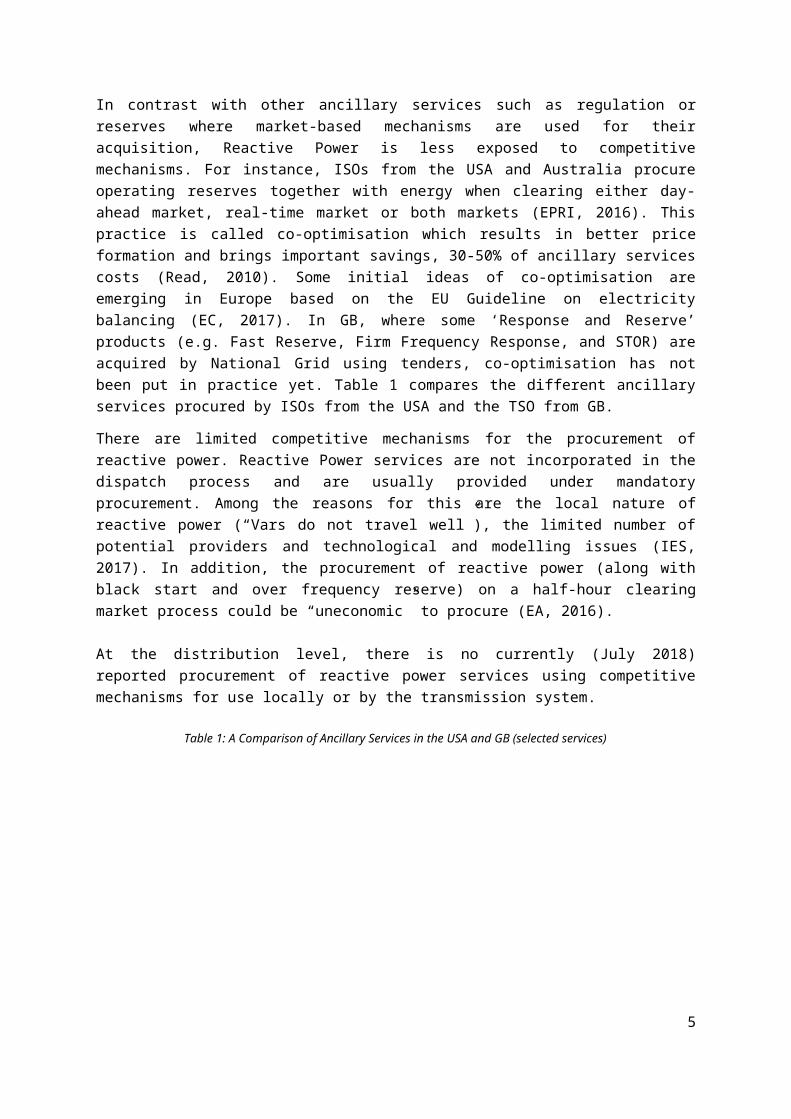
In contrast with other ancillary services such as regulation or reserves where market-based mechanisms are used for their acquisition, Reactive Power is less exposed to competitive mechanisms. For instance, ISOs from the USA and Australia procure operating reserves together with energy when clearing either day-ahead market, real-time market or both markets (EPRI, 2016). This practice is called co-optimisation which results in better price formation and brings important savings, 30-50% of ancillary services costs (Read, 2010). Some initial ideas of co-optimisation are emerging in Europe based on the EU Guideline on electricity balancing (EC, 2017). In GB, where some ‘Response and Reserve’ products (e.g. Fast Reserve, Firm Frequency Response, and STOR) are acquired by National Grid using tenders, co-optimisation has not been put in practice yet. Table 1 compares the different ancillary services procured by ISOs from the USA and the TSO from GB.
There are limited competitive mechanisms for the procurement of reactive power. Reactive Power services are not incorporated in the dispatch process and are usually provided under mandatory procurement. Among the reasons for this are the local nature of reactive power (“Vars do not travel well”), the limited number of potential providers and technological and modelling issues (IES, 2017). In addition, the procurement of reactive power (along with black start and over frequency reserve) on a half-hour clearing market process could be “uneconomic” to procure (EA, 2016).
generator operates with a PF of 0.95 lagging it means that the generator consumes 0.3 Mvar (lagging reactive power) for every MW of real power produced. 7 Synchronous generators are the most common source for reactive power and voltage control (Sauer, 2005).8 Static Var Compensators (SVC) and Static Compensator (STATCOM) are specific types of FACTS.
3
At the distribution level, there is no currently (July 2018) reported procurement of reactive power services using competitive mechanisms for use locally or by the transmission system.
Table 1: A Comparison of Ancillary Services in the USA and GB (selected services)
GBAncillary service markets and names CAISO ISO-NE MISO PJM SPP NYISO ERCOT NG (2)
Regulation RT DA,RT RT (1) DA,RT
Regulation Up DA,RT DA,RT DA
Regulation Down DA,RT DA,RT DA
Regulation (performance) RT NA
Regulation Up Mileage DA,RT DA,RT
Regulation Down Mileage DA,RT DA,RT
Regulation Service RT
Regulation movement DA,RT
Regulating Mileage DA,RT
Frequency responseMandatory frequency response
Firm Frequency Response (dynamic) monthly tenders
Firm Frequency Response (static) monthly tenders
Spinning reserve DA,RT DA,RT DA,RT DA,RT
Ten-minute spinning reserve RT, F
Synchronised reserve RT
Responsive reserve DA
Non-spinning reserve DA,RT DA,RT DA
Ten-minute non-spinning reserve RT, F
Quick start RT
Thirty-minute operating reserve RT, F
Supplemental reserve (3) DA,RT RT (4) DA,RT
Ramp reserves (5) RT DA,RT
ReserveBM startup
Fast reserve monthly tenders
Optional Reserve ServicesShort term operating reserve (Committed) 3 tenders/y
Short term operating reserve (Flexible) 3 tenders/y
Short term operating reserve (Premium Flexible) 3 tenders/y
Reactive power (voltage support)Mandatory reactive power service
Enhanced reactive power service (6) semestral tenders
Black start NAmarket-based mechanis ms (tenders ) Markets : DA: Day Ahea d, RT: Rea l Time, F: Forward (pre-DA), NA: No avai lable
other (cost-bas ed, l ost opportunity cost, revenue-bas ed, manda tory)
(1): Regulati on in PJM is provided by a combination of resources fol lowing 2 s ignals : RegA (s low respons e) and RegD (quick respons e).
(2): Simpl ifi ed l i s t of AS as of Dec. 2017, (3): Provi ded by onl ine or off-l ine res ources in MISO/PJM, (4): PJM us es a day-ahead s chedul ing res erve
in addition to the RT for suppl emental reserve (30min), (5): Ramp product: Up and Down Ramp Ca pa bi l ity (MISO), Flexible Ra mping (CAISO).
(6): Not currently active for procurement. The ful l l i s t of removed products can be found a t NG (2017c) and NG (2018c).
Source: Anaya and Pol l itt (2017, p. 31 ), ISO-NE (2018), NG (2017a ), Potomac Economics (2017).
USA
Regu
latio
n/Fr
eque
ncyR
espo
nse
Rese
rves
Oth
ers
However, this could change in the near future when a more active role for distribution system operators (DSOs) and more coordination between DSOs and transmission system operators (TSOs) are expected for the procurement of non-frequency ancillary services (e.g. voltage control, black
4
start). Reactive power at the distribution level is instead managed via connection agreements by limiting the values of power factors in agreement with the national or state regulation on Network Codes (i.e. Distribution Code in GB, Interconnection Handbook in California) and also through financial incentives. 2.3 Adaptation of Codes that favour Reactive Power Support
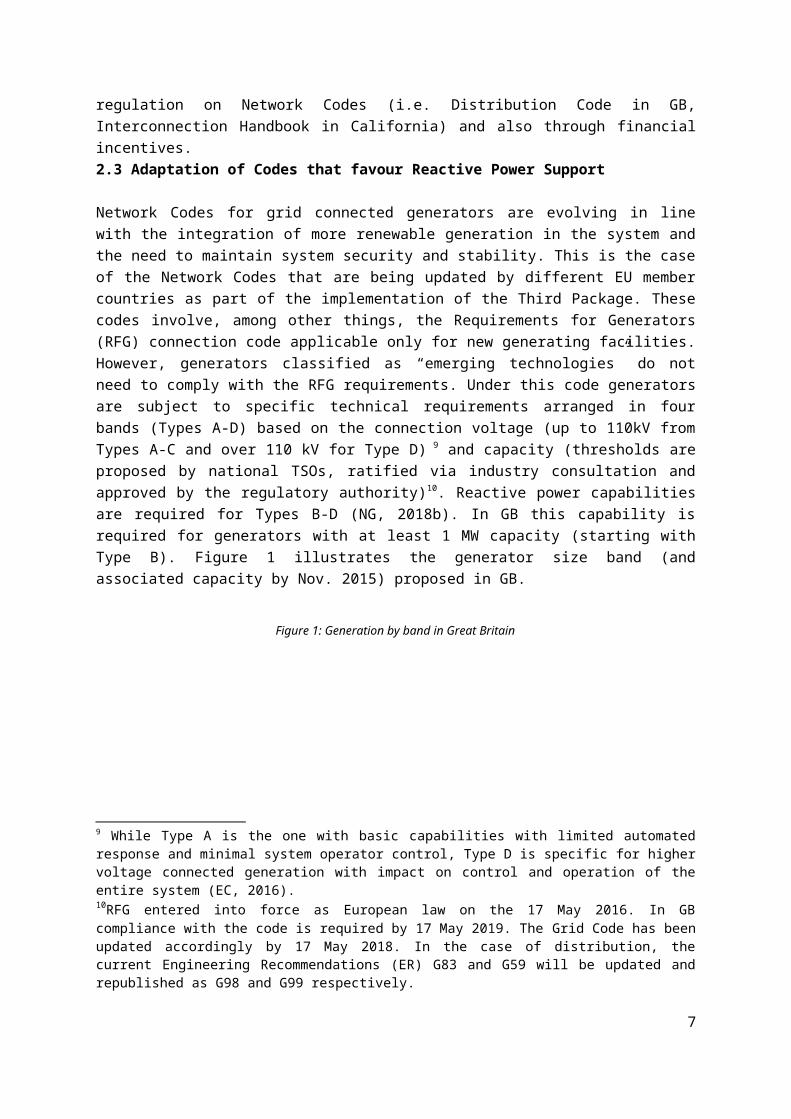
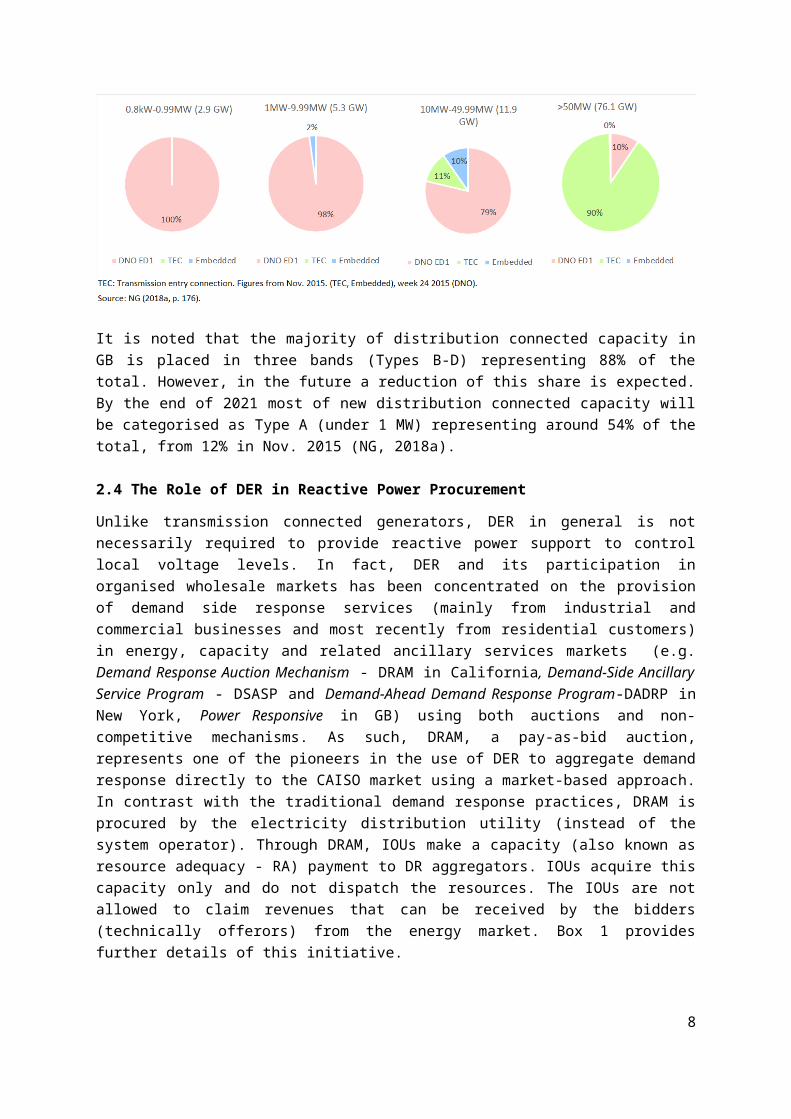
Network Codes for grid connected generators are evolving in line with the integration of more renewable generation in the system and the need to maintain system security and stability. This is the case of the Network Codes that are being updated by different EU member countries as part of the implementation of the Third Package. These codes involve, among other things, the Requirements for Generators (RFG) connection code applicable only for new generating facilities. However, generators classified as “emerging technologies” do not need to comply with the RFG requirements. Under this code generators are subject to specific technical requirements arranged in four bands (Types A-D) based on the connection voltage (up to 110kV from Types A-C and over 110 kV for Type D) 9 and capacity (thresholds are proposed by national TSOs, ratified via industry consultation and approved by the regulatory authority)10. Reactive power capabilities are required for Types B-D (NG, 2018b). In GB this capability is required for generators with at least 1 MW capacity (starting with Type B). Figure 1 illustrates the generator size band (and associated capacity by Nov. 2015) proposed in GB.
Figure 1: Generation by band in Great Britain
It is noted that the majority of distribution connected capacity in GB is placed in three bands (Types B-D) representing 88% of the total. However, in the future a reduction of this share is expected. By the end of 2021 most of new distribution connected capacity will be categorised as Type A (under 1 MW) representing around 54% of the total, from 12% in Nov. 2015 (NG, 2018a).
2.4 The Role of DER in Reactive Power Procurement
9 While Type A is the one with basic capabilities with limited automated response and minimal system operator control, Type D is specific for higher voltage connected generation with impact on control and operation of the entire system (EC, 2016). 10RFG entered into force as European law on the 17 May 2016. In GB compliance with the code is required by 17 May 2019. The Grid Code has been updated accordingly by 17 May 2018. In the case of distribution, the current Engineering Recommendations (ER) G83 and G59 will be updated and republished as G98 and G99 respectively.
5

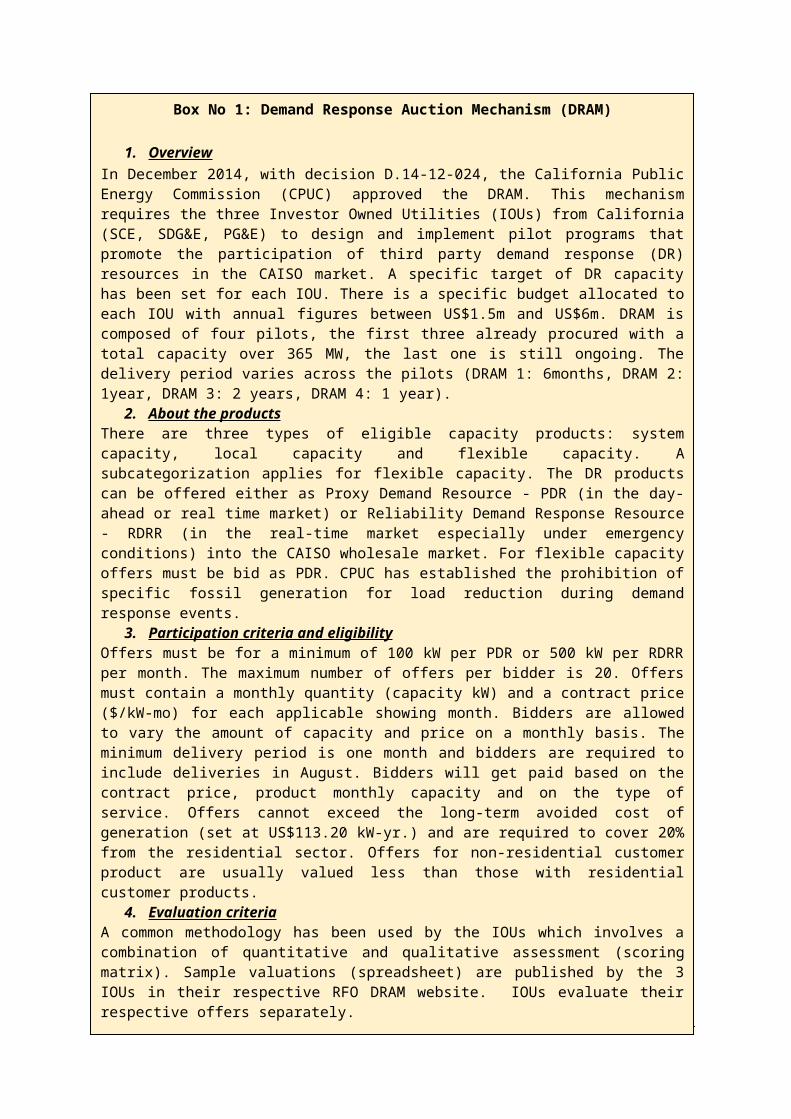
Unlike transmission connected generators, DER in general is not necessarily required to provide reactive power support to control local voltage levels. In fact, DER and its participation in organised wholesale markets has been concentrated on the provision of demand side response services (mainly from industrial and commercial businesses and most recently from residential customers) in energy, capacity and related ancillary services markets (e.g. Demand Response Auction Mechanism - DRAM in California, Demand-Side Ancillary Service Program - DSASP and Demand-Ahead Demand Response Program-DADRP in New York, Power Responsive in GB) using both auctions and non-competitive mechanisms. As such, DRAM, a pay-as-bid auction, represents one of the pioneers in the use of DER to aggregate demand response directly to the CAISO market using a market-based approach. In contrast with the traditional demand response practices, DRAM is procured by the electricity distribution utility (instead of the system operator). Through DRAM, IOUs make a capacity (also known as resource adequacy - RA) payment to DR aggregators. IOUs acquire this capacity only and do not dispatch the resources. The IOUs are not allowed to claim revenues that can be received by the bidders (technically offerors) from the energy market. Box 1 provides further details of this initiative.
Reactive power support from DER is expected to take a more active role in this in the future. This is reflected by the introduction of new requirements such as those specified in Network Codes, the use of advanced technologies such as smart-inverters in DER and the upward trend in DER capacity. The increase of DER capacity and the decline of centralised generation imply that the use of DER capabilities will be important to support both transmission and distribution system reliability (NERC, 2017). Increasing levels of DER participation in the wholesale market, also imply the need for greater DER visibility by system operators (at the transmission level) and additional coordination between transmission system operators and electricity distribution firms (More than Smart, 2017). In addition, in regions with a high level of DER penetration, electricity distribution firms can become a source rather than sink of reactive power (AEMO, 2017b). Because DER can also introduce additional system complexity. This implies that “trials” are required to measure and evaluate the effectiveness of DER in providing reactive power and voltage support (Exelon Companies, 2016).
3. Reactive Power: The International ExperienceThis section evaluates the international experience in reactive power procurement by selected system operators: Australian Energy Market Operator (AEMO), National Grid from GB and four ISOs from the USA (CAISO, PJM, NYISO, ISO-NE).
3.1 Australia
AEMO identifies three major categories of ancillary services: Frequency Control Ancillary Services (FCAS) Markets, Network Support and Control Ancillary Services (NSCAS) and System Restart Ancillary Services (SRAS). Voltage Control Ancillary Services (VCAS) is a sub category of the NSCAS that relates to reactive power services. NSCAS is classified as a “non-market service”, which means that these are not acquired by AEMO as part of the spot market (AEMC, 2018), in contrast with other ancillary services such as FCAS. Based on the Rule 2011 No.2 (AEMC, 2011), Transmission Network Service Providers (TNSP) have the primary responsibility for meeting the NSCAS needs in the NEM starting on April 2012. If this gap11 remains unmet by the TNSP, AEMO will seek tenders for NSCAS providers under ancillary services agreements. AEMO acts as NSCAS procurer of Last-Resort and will
11 The gap is identified by AEMO in its National Transmission Network Development Plan (NTNDP) and is represented by the difference between the NSCAS needs of the NEM power system (arising within a 5-year horizon) and the NSCAS that the TNSPs predict to be procured.
6
acquire NSCAS only to ensure power system security and reliability of supply on the transmission networks. TNSP may acquire NSCAS under connection agreements or network support agreements (AEMC, 2018), however they aim first to make maximum use of the existing reactive resources.
7
8
Box No 1: Demand Response Auction Mechanism (DRAM)
1. Overview In December 2014, with decision D.14-12-024, the California Public Energy Commission (CPUC) approved the DRAM. This mechanism requires the three Investor Owned Utilities (IOUs) from California (SCE, SDG&E, PG&E) to design and implement pilot programs that promote the participation of third party demand response (DR) resources in the CAISO market. A specific target of DR capacity has been set for each IOU. There is a specific budget allocated to each IOU with annual figures between US$1.5m and US$6m. DRAM is composed of four pilots, the first three already procured with a total capacity over 365 MW, the last one is still ongoing. The delivery period varies across the pilots (DRAM 1: 6months, DRAM 2: 1year, DRAM 3: 2 years, DRAM 4: 1 year).
2. About the products There are three types of eligible capacity products: system capacity, local capacity and flexible capacity. A subcategorization applies for flexible capacity. The DR products can be offered either as Proxy Demand Resource - PDR (in the day-ahead or real time market) or Reliability Demand Response Resource - RDRR (in the real-time market especially under emergency conditions) into the CAISO wholesale market. For flexible capacity offers must be bid as PDR. CPUC has established the prohibition of specific fossil generation for load reduction during demand response events.
3. Participation criteria and eligibility Offers must be for a minimum of 100 kW per PDR or 500 kW per RDRR per month. The maximum number of offers per bidder is 20. Offers must contain a monthly quantity (capacity kW) and a contract price ($/kW-mo) for each applicable showing month. Bidders are allowed to vary the amount of capacity and price on a monthly basis. The minimum delivery period is one month and bidders are required to include deliveries in August. Bidders will get paid based on the contract price, product monthly capacity and on the type of service. Offers cannot exceed the long-term avoided cost of generation (set at US$113.20 kW-yr.) and are required to cover 20% from the residential sector. Offers for non-residential customer product are usually valued less than those with residential customer products.
4. Evaluation criteria A common methodology has been used by the IOUs which involves a combination of quantitative and qualitative assessment (scoring matrix). Sample valuations (spreadsheet) are published by the 3 IOUs in their respective RFO DRAM website. IOUs evaluate their respective offers separately.
Quantitative: a. Offers are ranked based on each offer’s net market value (NMV). All cost and benefit figures
are adjusted using the utility’s average cost of capital and discounted back to the date of evaluation results.
NMV=Benefits−Costsb. Benefits are calculated for each offer using its forecast capacity market and the market value
of each type of product (Product Value). Benefits are multiplied by 1.15 which reflects the Planning Reserve Margin credit given to demand response resources in the RA compliance process. Offered Volume (kW) and Product Value ($/kW) refer to monthly figures.
Benefits=∑i=1
p
OfferedVolume i∗ProductValue i, where i=each product
c. Costs are computed for each offer by the product of Offered Volume and Offered Pricing per product and per month. All costs are then added.
Costs=∑i=1
p
Offered Volume i∗Offered Pricingi, where i=each product
Qualitative: d. Qualitative factors affect only the Costs. The IOUs may weigh the standard criteria differently.
Procurement of NSCAS under network support agreements is an option for reactive support beyond the performance standards (Transgrid, 2017).
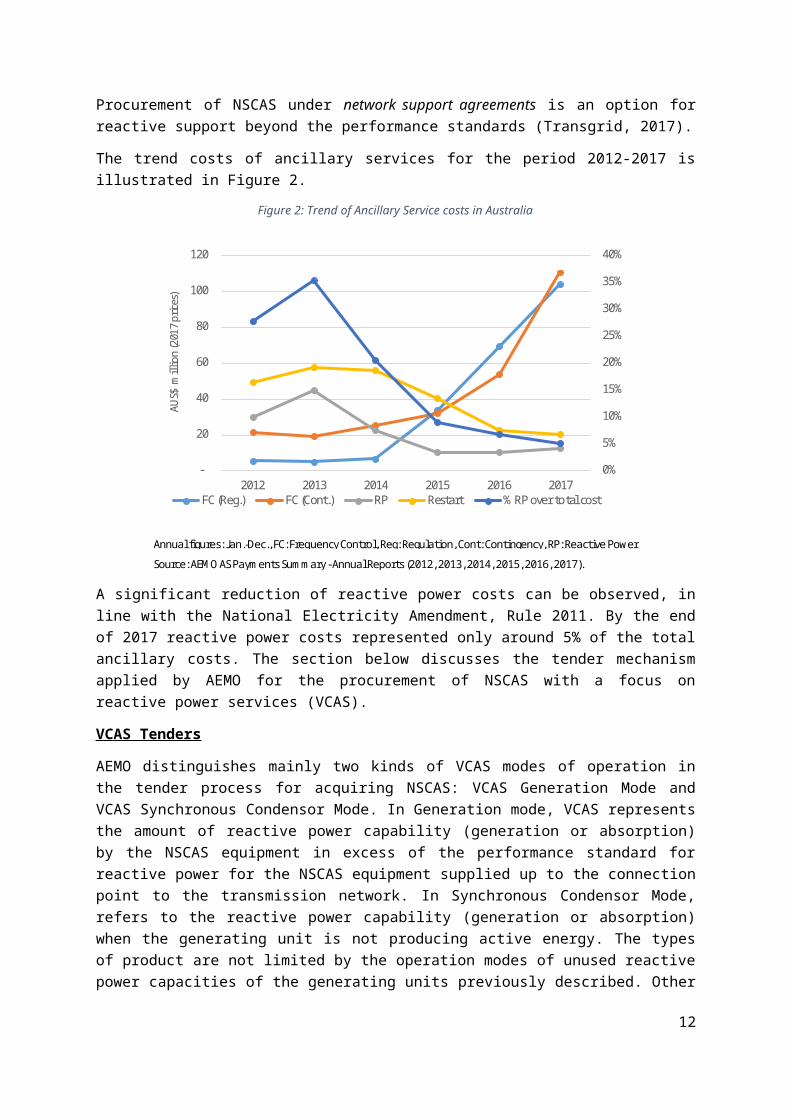
The trend costs of ancillary services for the period 2012-2017 is illustrated in Figure 2.
Figure 2: Trend of Ancillary Service costs in Australia
Annual figures: Jan.-Dec., FC: Frequency Control, Reg: Regulation, Cont: Contingency, RP: Reactive Power.
Source: AEMO AS Payments Summary - Annual Reports (2012, 2013, 2014, 2015, 2016, 2017).
0%
5%
10%
15%
20%
25%
30%
35%
40%
-
20
40
60
80
100
120
2012 2013 2014 2015 2016 2017
AUS$
mill
ion
(201
7 pr
ices)
FC (Reg.) FC (Cont.) RP Restart % RP over total cost
A significant reduction of reactive power costs can be observed, in line with the National Electricity Amendment, Rule 2011. By the end of 2017 reactive power costs represented only around 5% of the total ancillary costs. The section below discusses the tender mechanism applied by AEMO for the procurement of NSCAS with a focus on reactive power services (VCAS).
VCAS Tenders
AEMO distinguishes mainly two kinds of VCAS modes of operation in the tender process for acquiring NSCAS: VCAS Generation Mode and VCAS Synchronous Condensor Mode. In Generation mode, VCAS represents the amount of reactive power capability (generation or absorption) by the NSCAS equipment in excess of the performance standard for reactive power for the NSCAS equipment supplied up to the connection point to the transmission network. In Synchronous Condensor Mode, refers to the reactive power capability (generation or absorption) when the generating unit is not producing active energy. The types of product are not limited by the operation modes of unused reactive power capacities of the generating units previously described. Other types of reactive plants can also compete such as capacitors and reactors12, SVC, STATCOMs, HVDC/HVAC transmission lines, etc. (AEMO, 2012). Participants are free to offer their best solution. However, some of the tender requirements may be more specific than others.
The request for reactive power service may be for different term lengths (AEMO, 2012):
12 If a TNSP’s offer is selected to provide the required reactive power service using reactive equipment (i.e. reactors), after the contracting period this equipment may be included in the TNSP’s regulatory asset base (RAB) with a zero capital value in the RAB. This was the case of Transgrid (that provided the lowest cost service) in the provision of NSCAS for voltage control in southern New South Wales (AEMO, 2018).
9
a. short term: up to 12 months with the option to extend the service for 12 additional months, usually for existing facilities;
b. long term: for a period of 5 year or longer, installations of new or utilisation of existing reactive plants;
c. a combination of both, short term with existing installations until the construction of long term reactive power equipment.
Depending on the mode, participants (with winning selected offers) are subject to specific payments, see Table 2. There are two different payment structures based on the type of the generating unit operation mode. A compensation payment applies only when the generating unit is constrained off to generate or absorb reactive power during a trading interval. A Testing charge refers to the cost of specific tests that will be paid by AEMO. For additional details about the type of payments and their calculation see AEMO (2017a).
Table 2: Payment Structure
Mode Generation Mode Synchronous Condensor ModePrice and paymentsAvailability charge - RP generation Availability charge - RP absorption Enabling charge Compensation payment Testing charge Source: AEMO (2017a) - NSCAS Agreement Generic Proforma.
In the evaluation of the tenders, AEMO assess the optimal combination of reactive power services taking into consideration the locational effectiveness of each VCAS equipment (depicted in a map provided by AEMO) at the least cost possible. AEMO does not provide details of the evaluation criteria (quantitative or qualitative) but only a general list of the criteria to be taken into account.
3.2 Great Britain
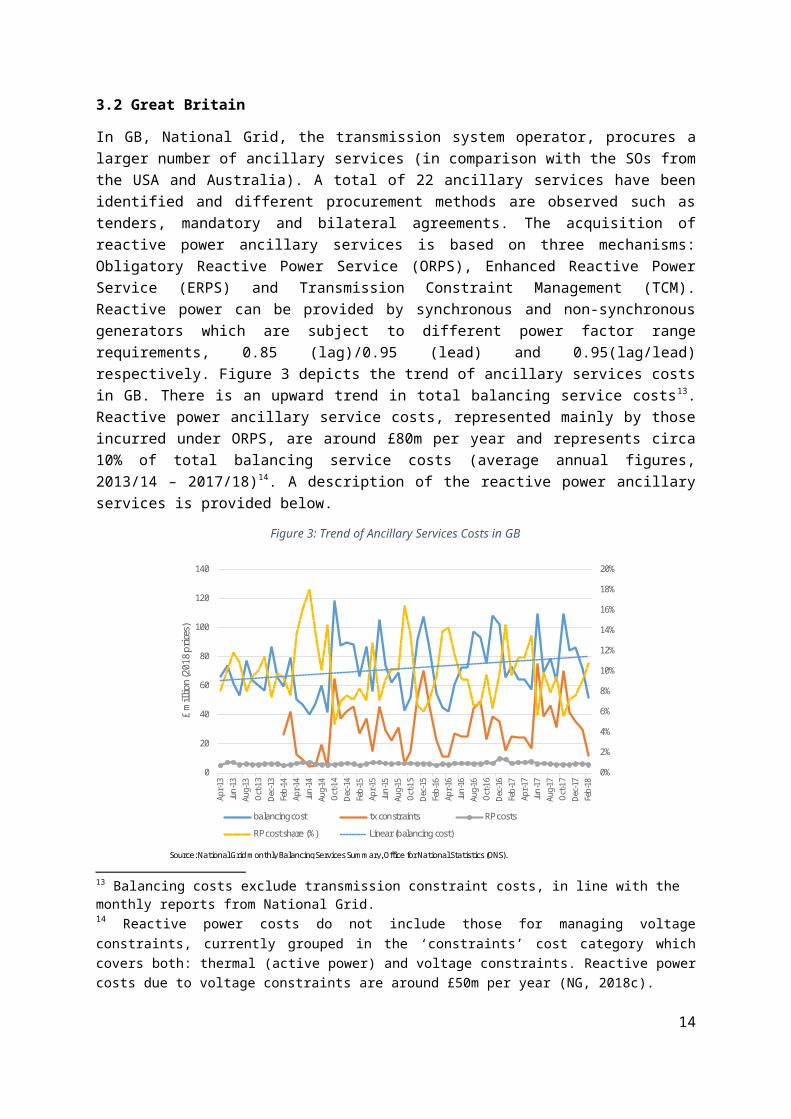
In GB, National Grid, the transmission system operator, procures a larger number of ancillary services (in comparison with the SOs from the USA and Australia). A total of 22 ancillary services have been identified and different procurement methods are observed such as tenders, mandatory and bilateral agreements. The acquisition of reactive power ancillary services is based on three mechanisms: Obligatory Reactive Power Service (ORPS), Enhanced Reactive Power Service (ERPS) and Transmission Constraint Management (TCM). Reactive power can be provided by synchronous and non-synchronous generators which are subject to different power factor range requirements, 0.85 (lag)/0.95 (lead) and 0.95(lag/lead) respectively. Figure 3 depicts the trend of ancillary services costs in GB. There is an upward trend in total balancing service costs 13. Reactive power ancillary service costs, represented mainly by those incurred under ORPS, are around £80m per year and represents circa 10% of total balancing service costs (average annual figures, 2013/14 – 2017/18)14. A description of the reactive power ancillary services is provided below.
Figure 3: Trend of Ancillary Services Costs in GB
13 Balancing costs exclude transmission constraint costs, in line with the monthly reports from National Grid. 14 Reactive power costs do not include those for managing voltage constraints, currently grouped in the ‘constraints’ cost category which covers both: thermal (active power) and voltage constraints. Reactive power costs due to voltage constraints are around £50m per year (NG, 2018c).
10
Balancing costs total
Source: National Grid monthly Balancing Services Summary, Office for National Statistics (ONS).
0%
2%
4%
6%
8%
10%
12%
14%
16%
18%
20%
0
20
40
60
80
100
120
140
Apr-1
3Ju
n-13
Aug-
13Oc
t-13
Dec-
13Fe
b-14
Apr-1
4Ju
n-14
Aug-
14Oc
t-14
Dec-
14Fe
b-15
Apr-1
5Ju
n-15
Aug-
15Oc
t-15
Dec-
15Fe
b-16
Apr-1
6Ju
n-16
Aug-
16Oc
t-16
Dec-
16Fe
b-17
Apr-1
7Ju
n-17
Aug-
17Oc
t-17
Dec-
17Fe
b-18
£ m
illio
n (2
018
pric
es)
balancing cost tx constraints RP costs
RP cost share (%) Linear (balancing cost)
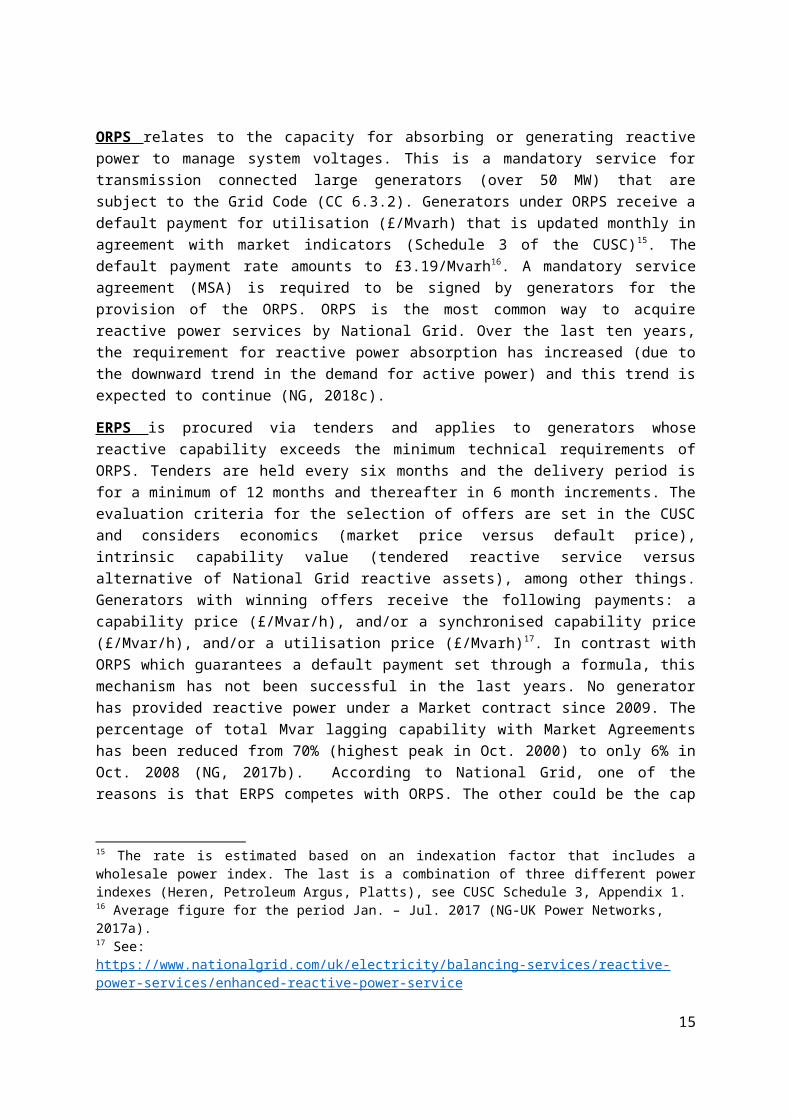
ORPS relates to the capacity for absorbing or generating reactive power to manage system voltages. This is a mandatory service for transmission connected large generators (over 50 MW) that are subject to the Grid Code (CC 6.3.2). Generators under ORPS receive a default payment for utilisation (£/Mvarh) that is updated monthly in agreement with market indicators (Schedule 3 of the CUSC) 15. The default payment rate amounts to £3.19/Mvarh16. A mandatory service agreement (MSA) is required to be signed by generators for the provision of the ORPS. ORPS is the most common way to acquire reactive power services by National Grid. Over the last ten years, the requirement for reactive power absorption has increased (due to the downward trend in the demand for active power) and this trend is expected to continue (NG, 2018c).
ERPS is procured via tenders and applies to generators whose reactive capability exceeds the minimum technical requirements of ORPS. Tenders are held every six months and the delivery period is for a minimum of 12 months and thereafter in 6 month increments. The evaluation criteria for the selection of offers are set in the CUSC and considers economics (market price versus default price), intrinsic capability value (tendered reactive service versus alternative of National Grid reactive assets), among other things. Generators with winning offers receive the following payments: a capability price (£/Mvar/h), and/or a synchronised capability price (£/Mvar/h), and/or a utilisation price (£/Mvarh)17. In contrast with ORPS which guarantees a default payment set through a formula, this mechanism has not been successful in the last years. No generator has provided reactive power under a Market contract since 2009. The percentage of total Mvar lagging capability with Market Agreements has been reduced from 70% (highest peak in Oct. 2000) to only 6% in Oct. 2008 (NG, 2017b). According to National Grid, one of the reasons is that ERPS competes with ORPS.
15 The rate is estimated based on an indexation factor that includes a wholesale power index. The last is a combination of three different power indexes (Heren, Petroleum Argus, Platts), see CUSC Schedule 3, Appendix 1.16 Average figure for the period Jan. – Jul. 2017 (NG-UK Power Networks, 2017a). 17 See: https://www.nationalgrid.com/uk/electricity/balancing-services/reactive-power-services/enhanced-reactive-power-service
11
The other could be the cap applied to the total funding for reactive power provision (Energy UK, 2017).
National Grid has released the Reactive Power Roadmap (NG, 2018c), and proposes the rationalisation (Stage 1) and simplification (Stage 2) of the current services for procuring reactive power. Based on this, National Grid is planning to submit a proposal (to CUSC) to remove ERPS.
TCM provides an ad-hoc solution. A transmission constraint can arise for different reasons (related to voltage or thermal constraints). A bilateral agreement is usually applied for contracting voltage support from generators using TCM, however constraint management tenders are also a way to procure it if there is sufficient competition18.
18 See: https://www.nationalgrid.com/uk/electricity/balancing-services/system-security-services/transmission-constraint-management
12

3.3 United States
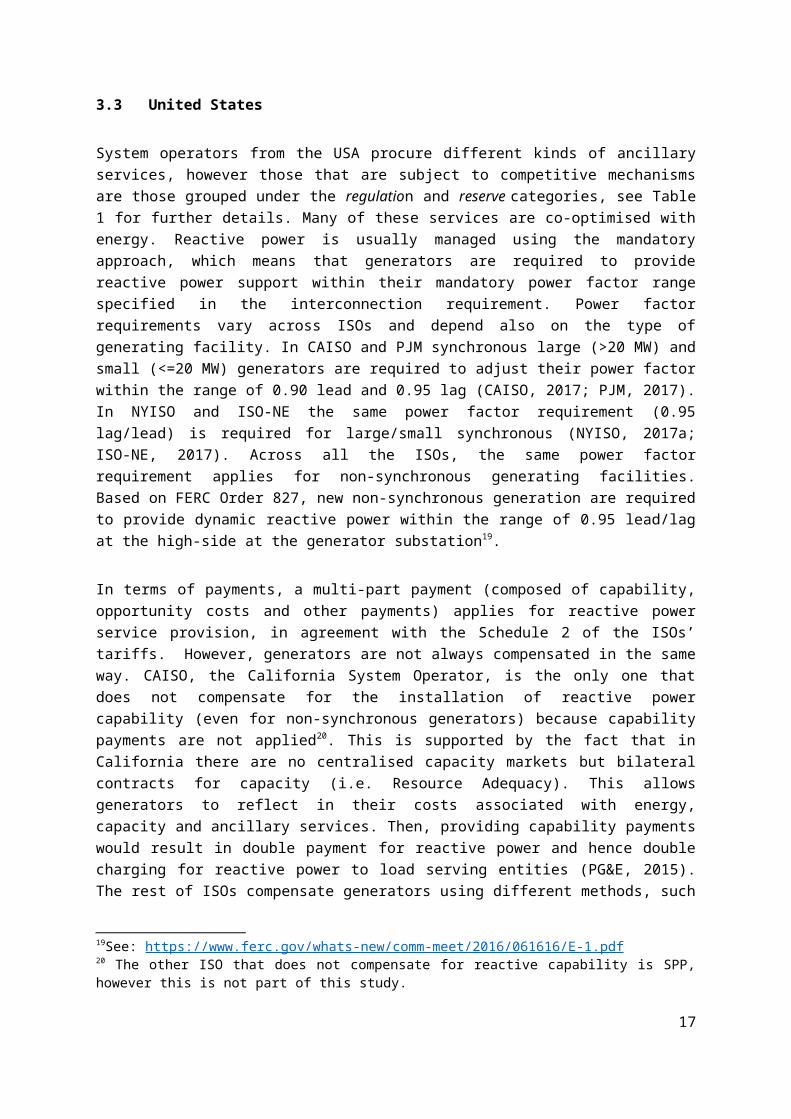
System operators from the USA procure different kinds of ancillary services, however those that are subject to competitive mechanisms are those grouped under the regulation and reserve categories, see Table 1 for further details. Many of these services are co-optimised with energy. Reactive power is usually managed using the mandatory approach, which means that generators are required to provide reactive power support within their mandatory power factor range specified in the interconnection requirement. Power factor requirements vary across ISOs and depend also on the type of generating facility. In CAISO and PJM synchronous large (>20 MW) and small (<=20 MW) generators are required to adjust their power factor within the range of 0.90 lead and 0.95 lag (CAISO, 2017; PJM, 2017). In NYISO and ISO-NE the same power factor requirement (0.95 lag/lead) is required for large/small synchronous (NYISO, 2017a; ISO-NE, 2017). Across all the ISOs, the same power factor requirement applies for non-synchronous generating facilities. Based on FERC Order 827, new non-synchronous generation are required to provide dynamic reactive power within the range of 0.95 lead/lag at the high-side at the generator substation19.
In terms of payments, a multi-part payment (composed of capability, opportunity costs and other payments) applies for reactive power service provision, in agreement with the Schedule 2 of the ISOs’ tariffs. However, generators are not always compensated in the same way. CAISO, the California System Operator, is the only one that does not compensate for the installation of reactive power capability (even for non-synchronous generators) because capability payments are not applied20. This is supported by the fact that in California there are no centralised capacity markets but bilateral contracts for capacity (i.e. Resource Adequacy). This allows generators to reflect in their costs associated with energy, capacity and ancillary services. Then, providing capability payments would result in double payment for reactive power and hence double charging for reactive power to load serving entities (PG&E, 2015). The rest of ISOs compensate generators using different methods, such as a fixed rate (NYISO, ISO-NE) and the American Electric Power - AEP methodology21 (supported by FERC) used by PJM.
AEP is a fixed-cost recovery approach and generators are required to submit the appropriate fillings to FERC for the evaluation of the cost-based revenue requirement for supplying reactive power. Based on this, NYISO and ISO-NE have set the compensation payments at US$ 2,747.61/Mvar year 22 and US$ 1,188.33/Mvar year23 respectively for 2018.
Opportunity cost is the other type of payment which is only applicable when generating resources operate outside their mandatory range. The four ISOs make this kind of compensation. NYISO
19See: https://www.ferc.gov/whats-new/comm-meet/2016/061616/E-1.pdf20 The other ISO that does not compensate for reactive capability is SPP, however this is not part of this study. 21 The AEP methodology has three main components associated with the production of reactive power: (1) the generator and its exciter, (2) accessory electric equipment that supports the operation of the generator-exciter and (3) the remaining total production investment required to provide real power and operate the exciter. The methodology also applies an allocation factor (Mvar2/MVA2) to sort annual revenues requirements of these components between real and reactive power (FERC, 2005, p. 8). 22 See 2018 NYISO Voltage Support Service Rates at http://www.nyiso.com/public/webdocs/markets_operations/market_data/pricing_data/rate_schedule_2/2018/2018_OATT__MST_Schedule%202_%20VSS_Rates_ESTIMATE-POSTING.pdf. 23 See 2018 ISO-NE rates at https://www.iso-ne.com/markets-operations/settlements/tariff-rates
13
defines this type of costs as: “The Lost Opportunity Cost payment shall be calculated as the maximum of zero or the difference between: (i) the product of: (a) the appropriate MW of output reduction and (b) the Real-Time LBMP at the Generator bus; and (ii) the Generator’s Energy Bid for the reduced output of the Generator multiplied by the time duration of reduction in hours or fractions thereof” 24. The two other payments are related to the cost of energy consumed or produced by generating units and non-generator reactive resources for the purpose of providing reactive power services.
Table 3 shows the different procurement methods and type of remuneration that reactive power providers can get for offering their services in selected system operators’ jurisdictions.
Table 3: Reactive Power Procuring and Payment Methods: A Comparison
4. The Power Potential Initiative: A New Market for Reactive Power The Power Potential project is a customer funded initiative that proposes the creation of a Reactive Power market using DER and additional capacity in the South East Region of the UK25. The transmission network has reached its capacity in this area (limited by dynamic voltage stability and thermal capacity). The Power Potential project will alleviate the problem by procuring resources reactive power and active power services from different kinds of distributed energy, using a market-based mechanism. Savings to energy customers has been estimated over £412m by 2050 (based on its potential implementation at 59 sites across GB) and up to 3.7 GW of additional connected capacity in this region. The project runs from January 2017 to December 2019 and the auction trial period is due to start no later than March 2019. Further details are provided in the following sections.
4.1 What is auctioned?
The Power Potential project is soliciting offers from DER to provide reactive power services (dynamic voltage support) and active power support (for constraint management and system balancing) in the South-East of England. DER are expected to be connected ideally at 33 KV or above for most
24 See https://www.nyiso.com/public/webdocs/markets_operations/committees/mc/meeting_materials/2014-11-20/Agedna%2005%20-%20Voltage%20Support%20Service%20MST%20RS2%20Revisions.pdf25 The total costs of the project amounts to £10.1m, Networks (NG-UK Power Networks, 2017b).
14
Country SO PeriodicityCompulsory/Mandatory Tenders Capability Availability Enabling Utilisation
Opportunity costs Others
USA CAISO variable NYISO variable PJM variable ISONE variable
Australia AEMO (GM) variable AEMO (SCM) variable
GB NG (ORP) variable
NG(ERP)
every six months, with term contract minimun 1 year and then in six-month increments
GM: generation mode, SCM: synchronous condensor mode. Others include: testing charges, cost of energy used to energise equipment that provides voltage support.
Source: AEMO (2017a), ISO Tariffs, NG Reactive Power Service Guides
Procurement method Type of payment
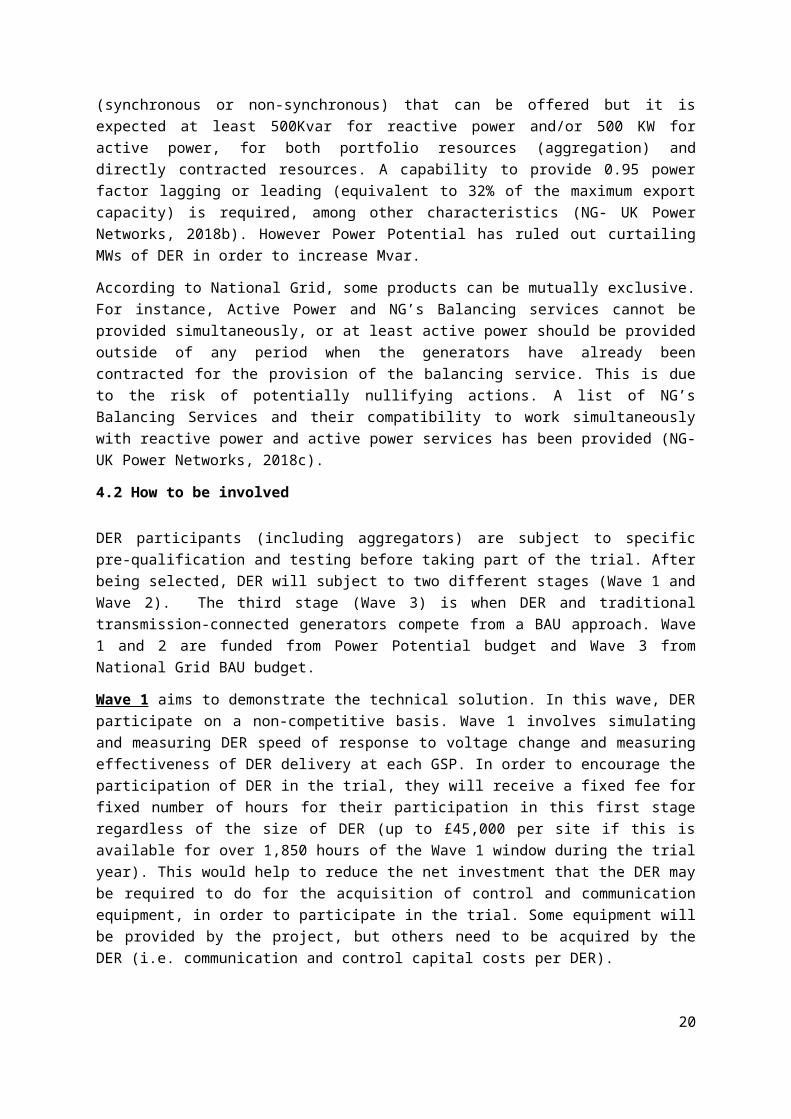
effectiveness (NG-UK Power Networks, 2018a). National Grid has identified four GSPs and their respective served areas where both reactive power and active power services are required. There is no limitation in the size of the resource (synchronous or non-synchronous) that can be offered but it is expected at least 500Kvar for reactive power and/or 500 KW for active power, for both portfolio resources (aggregation) and directly contracted resources. A capability to provide 0.95 power factor lagging or leading (equivalent to 32% of the maximum export capacity) is required, among other characteristics (NG- UK Power Networks, 2018b). However Power Potential has ruled out curtailing MWs of DER in order to increase Mvar.
According to National Grid, some products can be mutually exclusive. For instance, Active Power and NG’s Balancing services cannot be provided simultaneously, or at least active power should be provided outside of any period when the generators have already been contracted for the provision of the balancing service. This is due to the risk of potentially nullifying actions. A list of NG’s Balancing Services and their compatibility to work simultaneously with reactive power and active power services has been provided (NG-UK Power Networks, 2018c).
4.2 How to be involved
DER participants (including aggregators) are subject to specific pre-qualification and testing before taking part of the trial. After being selected, DER will subject to two different stages (Wave 1 and Wave 2). The third stage (Wave 3) is when DER and traditional transmission-connected generators compete from a BAU approach. Wave 1 and 2 are funded from Power Potential budget and Wave 3 from National Grid BAU budget.
Wave 1 aims to demonstrate the technical solution. In this wave, DER participate on a non-competitive basis. Wave 1 involves simulating and measuring DER speed of response to voltage change and measuring effectiveness of DER delivery at each GSP. In order to encourage the participation of DER in the trial, they will receive a fixed fee for fixed number of hours for their participation in this first stage regardless of the size of DER (up to £45,000 per site if this is available for over 1,850 hours of the Wave 1 window during the trial year). This would help to reduce the net investment that the DER may be required to do for the acquisition of control and communication equipment, in order to participate in the trial. Some equipment will be provided by the project, but others need to be acquired by the DER (i.e. communication and control capital costs per DER).
Wave 2 aims to evaluate the financial viability of Power Potential. In this wave DER compete with each other and the market is run for at least 1,800 hours during the trial period which will be achieved by running auctions across a period made up of 17 weeks (auctions may not be daily and will consider weekends). DER (with winning offers) will receive two kinds of payments as a result of winning in the procurement auction: a secured availability payment (£/Mvar/h) and a potential utilisation payment (£/Mvarh). There is no cap set for either payments, however bids will be assessed against the alternative cost of reinforcing the network (i.e. the counterfactual being explored in wave 2 is whether DER can provide reactive support more efficiently than the installation of reactive equipment on the transmission network). It has been decided that DER will compete in day-ahead auctions, though they can choose not to alter their offers daily.
Offers from DER can be received from different types of resources that are able to provide reactive and active power services in the area covered by at least one of the GSP specified by National Grid 26. 26 As of April 2018, National Grid and UK Power Networks have already received 13 submissions to provide reactive power services in 18 sites, with reactive power volumes up to 79.3 Mvar (lead) and 69.3 Mvar (lag).
15

Heatmaps are available to inform participants of the location of the GSP that would be more suitable for them. Offers can be made only for one GSP at the same time. Simultaneous offers to different GSPs are not allowed. The submission of offers, will be via a UK Power Networks platform (web portal). The size of reactive and active power services to be procured has been estimated between 10-50Mvar across all of the GSPs. The delivery period will not exceed 24 hours. Bids are expected to be submitted for four-hourly periods, which means a total of 6 period per day (NG-UK Power Networks, 2018d).
4.3 About the evaluation criteria and eligibility
Reactive and active power services will be procured through a market mechanism in day-ahead auctions27 using the pay-as-bid methodology. The idea is to select the offers based on a combination of both lowest costs and highest effectiveness but limited to the current budget (around £0.6m for both Wave 1 and Wave 2). NG will forecast the reactive and active power services to be procured for each GSP and will instruct the Distributed Energy Resource Management System (DERMS) 28 about this. The DERMS will evaluate the resources available (free capacity) at the lowest cost based as NG’s instructions. DER will then be instructed by the DERMS about the services to be provided at set points29. Non-cost variables have not been taken into account in the evaluation criteria.
5. Discussion and Lessons Learned5.1 Procurement of reactive power and the need for market-based mechanisms
The use of market-based mechanisms in the procurement of reactive power is practically non-existent globally. This is in contrast with other ancillary services such as frequency regulation and capacity reserves that are usually co-optimised with energy in day-ahead and/or real time market. Provision of reactive power by third parties (mainly generators) is generally managed under a mandatory approach (within a specific range of power factors that can vary depending on the type of generator). Generators are usually compensated using a fixed methodology (e.g. a flat compensation rate or a cost-based methodology) without any market determined prices. Other compensation schemes such the payment for opportunity cost, which include local marginal prices, happen under “very infrequent circumstances” (EPSA, 2016, p.5). This means that in CAISO (where capability payments do not exist when generators operate within the power factor range), generators are basically not compensated at all. This is an extreme case. There is also a risk of over-compensation or under-compensation when a fixed methodology is applied. For instance, even though a competitive market exists in GB, transmission-connected generators prefer to get the default payment under OPRS (£4.34/Mvarh, average price for period Jan-Jul. 2017) rather than participate in the ERPS market. In other markets where a flat rate applies (NYSISO and ISO-NE) and all generators receive the same compensation rate regardless of the technology and associated
The majority of DER are from PV solar, followed by battery storage (NG-UK Power Networks, 2018c). National Grid is expecting around 15 DER for the trial. 27 Each day ahead auction is looking to procure services for the following 24 hour period. Specific windows will be set within this period. 28 The DERMS run by UK Power Networks, is the Power Potential platform that facilitates the communication between National Grid and DER connected to UK Power Networks. It was developed by ZIV Automation. 29 For instance, for reactive power National Grid may set different periods (from 2 hour to 7 hour windows) over the day. See: https://www.nationalgrid.com/sites/default/files/documents/Power%20Potential%20webinar%20summary_September%202017.pdf.
16
costs, there are also concerns that those markets undercompensate certain generators for the provision of reactive power (EPSA, 2016, p.5), especially in comparison with the AEP methodology30.
The AEP methodology (a FERC approved cost-based revenue methodology) based their estimations on the generators’ investments for reactive capability and the nameplate capacity is used for measuring this. A key observation on this methodology is the potential degradation of the nameplate output overtime, which translates to lower output in reactive power support. According to EPSA (2016), as the cost of equipment (which sets the cost-based rates) does not vary regardless of the reduction of the nameplate output due to degradation, then it is not appropriate to use the degradation in production to vary the reactive compensation received by suppliers. A different point is made by FERC by suggesting asking for testing in order to verify any potential degradation in the reactive power output of the generators. FERC has found that this happens in fact (FERC, 2018b, p.4). The other observation is that AEP was initially developed for synchronous generators however its application has been expanded for all type of generators, including non-synchronous (i.e. wind turbines). Investment for reactive power for wind generators can be higher in non-synchronous generators than in synchronous generators with the same nameplate capacity, especially in terms of more turbines and generator/exciters (FERC, 2018c). However, the installation of this additional equipment brings a higher level of reliability to provide reactive supply (EDF Renewable, 2016). This suggests that the AEP methodology should be able to allow the recovery of all the costs related to the provision of reactive power regardless of the type of resource.
The risk of over-compensation or under-compensation for reactive power capability using a fixed methodology can be mitigated by introducing more market-based solutions. The proliferation of more DER can help to deal with the poor locational effectiveness that is observed when the resource is placed far from the point where reactive power services are required (Vars do not travel well). DER reactive power capabilities will also improve, in line with the upgrade of Network Codes. Then, DER may constitute an important source of reactive power support for the system grid. Procuring reactive power from DER will also require greater interaction between the DER, electricity distribution utilities and TSOs.
The use of a market-based approach using DER for reactive power services represents one more channel to procure this type of ancillary service. The use of fixed methodologies for compensating reactive power capability will continue in organised wholesale markets. However, it is expected that an enhanced methodology reflects the costs of providing reactive power services taking into consideration the nature of generators.
5.2 A Market-Based Approach for Reactive Power: The Conceptual Auction Design
The centrality in auction design of encouraging new entry and more participants in the auction . According to Klemperer (2002) a good auction should aim to attract entry, prevent collusion and predatory behaviour. Nobel initiatives in auction design for reactive power procurement encourage new entrants (i.e. DER) and more market participants in the supply of reactive power services (DER plus transmission connected resources). However, in the future the participation of new entrants 30 As an example of the inequality of these two methodologies: A wind generator that provides 200Mvar (lagging and leading) of reactive power capability from a 200 MW plant (with 0.9 PF) would be compensated for this capability differently. It would receive per year US$0 (CAISO), US$225k (ISO-NE), US$525k (NYISO), and US$ 1.9m (PJM). In the first one reactive capability is not compensated at all (EDF Renewable, 2016).
17

should depend on whether it can compete (in terms of prices) with the traditional transmission-connected resources or other future options. It is also important for repeated procurement auctions to be designed in a way that incumbent suppliers do not start by offering predatory (below cost) prices in the early auctions in order to deter entrants and / or then begin coordinating their offers with each other in order to raise outturn prices in the longer run
The importance of enhancing competition between the reactive power suppliers (i.e. DERs) across the different supply sites (i.e. GSPs) via a package auction design. Ausubel and Cramton (2011) suggest that auctions should aim to enhance substitution if multiple objects are for sale, encourage price discovery and induce truthful bidding. A joint auction allows a higher combination of products enhancing competition via substitution between reactive power suppliers. This would be a more complex auction design than for example the Power Potential initiative, however total procurement cost could be lower by selecting the combinations that maximise social welfare (similar to the use of co-optimisation in the US).
Consideration of pay-as-clear price determination format and the incorporation of a quality dimension. In general, auction theory suggests that second price auctions are better than pay-as-bid as a way of determining prices (Krishna, 2009). Pay-as-bid is an approach that is well-known by system operators (National Grid, CAISO) and market participants. While pay-as-bid can promote generally lower prices in the short run (Holt, 1980), its lack of transparency on true costs may reduce dynamic efficiency relative to pay-as-clear. It can also bias the equilibrium price and risk inefficiency. In economic theory, a second-price auction would work better for true price discovery with higher dynamic efficiency in comparison with pay-as-bid. In addition, the objective of a procurement auction is not only to minimise the price paid but to maximise economic welfare. The consideration of quality dimensions in the procurement process (represented by the locational effectiveness of reactive power) should be a part of good auction design.
Consideration should be given to the penalty scheme and the pricing format for reactive power supply (availability + utilisation). It could be the case that non delivery penalty affects the availability payment only. However due to the new requirements for DER (Grid Code GC0100), reactive capability is going to be compulsory. This implies only a utilisation payment is necessary. This is something that would need to be taken into account when contemplating the large-scale of market-based trials such as the one discussed in this study. On the other hand, penalties could be mitigated by reducing the risks of having DER with poor delivery. The use of non-cost variables in the evaluation of DER can help with this. The scoring matrix from DRAM sets a good reference for the identification of these variables.
The frequency and periodicity of the auction and the cost benefit of nearer to real time procurement and co-optimisation. More frequent auctions allow both parties (suppliers and the system operator) to adjust the reactive power offers and demand in nearly real time. Shorter trading periods can help to reduce AS costs by allowing similar trading periods for each AS (reactive power in this case) and the energy market. This is the case of other AS such as frequency regulation and reserves which are procured with energy (day ahead and real time) in specific jurisdictions. This practice is referred to as co-optimisation and may result in important system costing savings.
The careful specification of the counterfactual against which the auction results are to be evaluated. Reactive power can be acquired through auctions but also via transmission or distribution reactive
18

equipment or through other future options (identifying and despatching of a specific DER using a similar approach to the current mandatory mechanism, offering a fixed price to the DER for reactive power). Running a reactive power auction mechanism for a small number of supply sites (i.e. GSPs) could be costly.
The design of the contract between the DSO and TSO to incentivise optimal risk sharing . With the implementation of market-based initiatives for reactive power procurement using DER, the DSO assumes a new role that may expose it to a significant energy price risk (unlike now). Proper contractual agreements are required in order to incentivise DSOs to optimise their provision of reactive power (and other ancillary services).
5.3 About Power Potential Initiative
Power Potential is an opportunity to trial the technical solution (DERMS implementation, DER local effectiveness, DER response time to voltage change), the commercial solution (represented by the avoided cost of transmission reinforcement for reactive power compensation), new roles (DNO as a facilitator for the procurement of reactive power and its transition to a DSO, the TSO as a contractor of reactive power services from distribution companies) and new interactions (between DNOs and the TSO and the need to coordinate in order to capture whole system benefits). Power Potential could also help to identify any regulatory barrier that may limit the value of the competitively procured reactive power from DER and its large-scale implementation.
A centralised market for reactive power is not currently an option due to the poor capability of reactive power to travel long distances. A regional or more decentralised market, rather than the centralised one, would be much more viable especially due to the upward trend of DER. Under the context of Power Potential these regional markets can be represented by a group of supply points (in this case 4 GSPs).
6. Conclusions Globally, there is a lack of competitive mechanisms in the procurement of reactive power at both the transmission and the distribution level, in comparison with the procurement of other ancillary services. Instead, reactive power tends to be compensated by administratively determined pricing methodologies (involving fixed rates or cost-recovery) for procuring reactive power. This means that reactive power suppliers are likely to be over or under compensated. The introduction of more market oriented mechanisms and resources (such as DER) for acquiring reactive and active power services by the system operator opens new opportunities and new ways to deal with voltage stability issues. This also imposes new challenges such as the implementation of new types of agreements (apart from the traditional ones) between DER/system operator/electricity distribution firm and the use of new platforms to manage reactive power.
Power Potential is a first of its kind in seeking to competitively procure reactive power from DER. It offers the opportunity to trial not only the DER performance in the provision of reactive and active power but also an innovative procurement mechanism design. This paper provides key recommendations for such a design drawing on general lessons from auction theory and practice.
19
Our discussion of the principles of mechanism design would suggest that attention is given to the following: the frequency of the auction and its price determination mechanism offers significant scope for learning what sort of price resolution might be necessary/desirable or possible; consideration of the use of pay-as-clear (rather than pay-as-bid) to reveal information about underlying costs and to experiment with a different (and arguably superior) payment rule; and more consideration of how to enhance substitutability of products within the trail area, particularly by integrating the procurement across the 4 GSPs.
References
AEMC (2018), National Electricity Rules. Version 106. Australian Energy Market Commission.
AEMC (2011), Rule Determination. National Electricity Amendment (Network Support and Control Ancillary Services) Rule 2011. Australian Energy Market Commission, Apr. 2011.
AEMO (2012), Request for Expression of Interest Network Support and Control Ancillary Services. Australian Energy Market Operator, July 2012.
AEMO (2017a), Network Support and Control Ancillary Services Agreement. Generic Proforma. Australian Energy Market Operator, Dec. 2017.
AEMO (2017b), Visibility of Distributed Energy Resources. Future Power System Security Program. Australian Energy Market Operator, Jan. 2017.
AEMO (2018), TransGrid Transmission Determination 2018-23 Network Support and Control Ancillary Services. Australian Energy Market Operator, Jan. 2018.
Anaya, K., Pollitt, M. (2017), Regulating the Electricity System Operator: Lessons for Great Britain from around the world. EPRG Working Paper 1718 Cambridge Working Paper in Economics 1755, Dec. 2017.
Ausubel, L. and Cramton, P. (2011). Auction design for wind rights. Report to Bureau of Ocean Energy Management, Regulation and Enforcement.
CAISO (2017), Fifth Replacement FERC Electric Tariff, California Independent System Operator Corporation, May 2017.
Chapman, Stephen, J. (2005), Electric Machinery Fundamentals. Fourth edition, McGraw-Hill, New York.
CPUC (2017a), Decision adopting steps for implementing the competitive neutrality cost causation principle, requiring an auction in 2018 for the demand response auction mechanism, and establishing a working group for the creation of new models of demand response. Decision 17-10-017. California Public Utilities Commission, October 26, 2017.
CPUC (2017b), Research Plan for the Demand Response Auction Mechanism (DRAM) I, II, & III Pilots, 2015-2017. California Public Utilities Commission, Apr. 2017.
CPUC (2017c), Actions to Limit Utility Costs and Rates. Public Utilities Code Section 913.1 Annual Report to the Governor and Legislature. California Public Utilities Commission, May. 2017.
20

Dierkes, S., Bennewitz, F., Maercks, M, Verheggen, L., Moser, A. (2014), Impact of distributed reactive power control of renewable energy sources in smart grids on voltage stability of the power system. 2014 Electric Power Quality and Supply Reliability Conference (PQ), IEEE, pp. 119–126.
EA (2016), Ancillary Services Procurement Plan. New Zealand Electricity Authority, Dec. 2016.
EC (2016), Commission Regulation (EU) 2016/631 of 14 April 2016 establishing a network code on requirements for grid connection of generators. European Commission, Apr. 2017.
EC (2017), Commission Regulation (EU) 2017/2195 of 23 November 2017 establishing a guideline on electricity balancing. European Commission, Nov. 2017.
EDF Renewables (2016), Introductory Remarks, Panel 3 addressing “Cost Incurred by Non-Synchronous Generators for Reactive Supply”. Reactive Supply Compensation in Markets Operated by Regional Transmission Organizations and Independent System Operators. Docket No. AD16-17-000, Jun. 2016.
Energy UK (2017), Ancillary services report 2017. Energy UK, Apr. 2017.
EPRI (2016), Wholesale Electricity Market Design Initiatives in the United States: Survey and Research Needs. 2016 Technical Update. Electric Power Research Institute, Nov. 2016.
EPSA (2016), Comments of the Electric Power Supply Association. Reactive Supply Compensation in Markets Operated by Regional Transmission Organizations and Independent System Operators. Docket No. AD16-17-000, Jun. 2016.
Exelon Companies (2016), Comment and Policy Statement of the Exelon Companies. In the matter of the Value of Distributed Energy Resources. Case No. 15-E-0751. Exelon Companies, Apr. 2016.
FERC (2005), Principles for Efficient and Reliable Power Supply and Consumption. Commission Staff Report Docket No. AD05-1-000. Federal Energy Regulatory Commission, Feb. 2005.
FERC (2014), Payment for Reactive Power. Commission Staff Report AD14-7. Federal Energy Regulatory Commission, Apr. 2014.
FERC (2018a), Distributed Energy Resources. Technical Considerations for the Bulk Power System. Staff Report, Docket No. AD18-10-000. Federal Energy Regulatory Commission, Feb. 2018.
FERC (2018b), Order accepting proposed rate schedule and establishing hearing and settlement judge procedures. Docket No. NJ18-9-000. Federal Energy Regulatory Commission, Feb. 2018.
FERC (2018c), Order accepting and suspending proposed rate schedule and establishing hearing and settlement judge procedures. Docket No. ER18-642-000. Federal Energy Regulatory Commission, Mar. 2018.
Holt, C.A. (1980), ‘Competitive Bidding for Contracts under Alternative Auction Procedures’, Journal of Political Economy, 88 (3): 433-445.
IES (2017), A Package of Improvements for the NEM Auction. A Report prepared by Intelligent Energy Systems for CS Energy. IES Intelligent Energy Systems, Apr. 2017.
ISO-NE (2017), Schedule 22 Large Generator Interconnection Procedures. Independ System Operator New England, May 2017.
21

ISO-NE (2018), Reserve Products & Market Overview. Introduction to Wholesale Electricity Markets (WEM 101), March 2018.
Klemperer, Paul. (2002). ‘What Really Matters in Auction Design’, Journal of Economic Perspectives 16(1): 169-189.
Krishna, V. (2009). Auction Theory, San Diego: Academic Press.
More than Smart (2017), Coordination of Transmission and Distribution Operations in a High Distributed Energy Resource Electric Grid. Prepared by staff from CAISO, PG&E, SCE, SDG&E with support from More Than Smart, Jun. 2017.
NG (2017a), System Needs and Product Strategy, Warwick: National Grid, Jun. 2017.
NG (2017b), Reactive Market Report. Thirty Eight Tender Round for Obligatory and Enhanced Reactive Power Services. National Grid, July 2017.
NG (2017c), Product Roadmap for Frequency Response and Reserve. National Grid, Dec. 2017.
NG (2018a), GC0100 EU Connection Codes GB Implementation – Mod 1. Stage 06: Final Code Modification Report. Grid Code. National Grid, Feb. 2018.
NG (2018b), GC0101 EU Connection Codes GB Implementation – Mod 2. Stage 06: Final Code Modification Report. Grid Code. National Grid, Feb. 2018.
NG (2018c), Product Roadmap for Reactive Power. National Grid, May 2018.
NG-UK Power Networks (2017a), Power Potential Webinar. Webinar with Power Potential interested parties, Sep. 2017.
NG-UK Power Networks (2017b), Power Potential: A New Market for Reactive Power. Presented at LCNI, Low Carbon and Innovation Conference, 6-7 December 2017, Telford.
NG – UK Power Networks (2018a), The Power Potential Project. Head of Terms – Subject to contract. National Grid and UK Power Networks, Jan. 2018.
NG – UK Power Networks (2018b), Technical Characteristics Submission Spreadsheet. National Grid and UK Power Networks.
NG – UK Power Networks (2018c), Power Potential Webinar. National Grid and UK Power Networks, Mar. 2018.
NG – UK Power Networks (2018d), Transmission & Distribution Interface 2.0. SDRC 9.3 – Commercial tendering process report and finalised trial approach. National Grid and UK Power Networks.
NERC (2009), Reactive Support and Control Whitepaper. TIS-Reactive Support and Control Subteam. North American Electric Reliability Corporation, NERC, May, 2009.
NERC (2017), Distribution Energy Resources. Connection Modelling and Reliability Considerations. North American Electric Reliability Corporation, NERC, Feb. 2017.
NYISO (2017a), NYISO Tariffs. New York Independent System Operator, Oct. 2017.
NYISO (2017b), Distributed Energy Resources Market Design Concept Proposal. A Report by the New York Independent System Operator, Dec. 2017.
22

OFGEM (2017), Requirement for generators – ‘emerging technology’ decision document. Final decision. Office of Gas and Electricity Markets, May 2017.
PG&E (2015), Stakeholder Comments. Reactive Power and Financial Compensation. Pacific Gas & Electric, Jun. 2015.
PG&E (2017), Pacific Gas and Electric Company Advice Letter 5109-E. Advice Letter presented to the California Public Utilities Commission regarding 2018-2019 DRAM, Jun., 2017.
PJM (2017), Open Access Transmission Tariff. PJM, Dec. 2017.
PJM (2018), PJM Open Access Transmission Tariff, PJM. Effective date 23/04/2018-Docket#ER18-893-000.
Potomac Economics (2017), 2016 State of the Market Report for the ERCOT Electricity Markets. Independent Market Monitor for ERCOT, May 2017.
Read, E. Grant (2010), Co-Optimization of Energy and Ancillary Service Markets. In: Pardalos P., Rebennack, S., Pereira M., Iliadis N. (eds) Handbook of Power Systems I, Energy Systems. Springer, Berlin, Heidelberg.
Sauer, Peter W. (2005), Reactive Power and Voltage Control Issues in Electric Power Systems. In: Chow J.H., Wu F.F., Momoh J. (eds) Applied Mathematics for Restructured Electric Power Systems. Power Electronics and Power Systems. Springer, Boston, MA.
SCE (2015), Southern California Edison Company AL 3208-E, Pacific Gas and Electric Company AL 4618-E, San Diego & Electric Company AL 2729-E. Advice Letter presented to the California Public Utilities Commission, Apr. 2015.
SCE (2017), Southern California Edison Company Advice Letter 3629-E. Advice Letter presented to the California Public Utilities Commission regarding 2018-2019 DRAM, Jul., 2017.
SCE (2018), 2019 DRAM RFO Pro Forma. Demand Response Auction Mechanism Resource Purchase Agreement. Southern California Edison Company.
SDG&E (2017), San Diego Gas and Electric Company Advice Letter 3095-E. Advice Letter presented to the California Public Utilities Commission regarding 2018-2019 DRAM, Jun., 2017.
SDG&E-PG&E-SCE (2018a), 2019 Demand Response Auction Mechanism (DRAM 4). Pre-Bid (bidders) Web Conference, Feb. 2018.
SDG&E-PG&E-SCE (2018b), 2019 DRAM RFO (DRAM 4) Pre-Bid Conference and Other Questions & Answers, Feb. 2018.
Transgrid (2017), Transmission Annual Planning Report 2017. TransGrid, Jun. 2017.
23