Embed Size (px)
Citation preview

DOSSIERSupplemental Material – Intern Team Alpha
6 August 2014

2
Table of Contents
Presentation..............................................................................................1Financial Tables......................................................................................21
P&L...................................................................................................................... 21Assumptions: 2014.............................................................................................22Assumptions: 2015.............................................................................................23Assumptions: 2016.............................................................................................24Assumptions: 2017.............................................................................................25
Middle East Internet Penetration...........................................................26

Presentation
1
2

PRESO PAGES
3
4
5
6
7
8
9

10
11
12
13
14
15
16

17
18
19

20
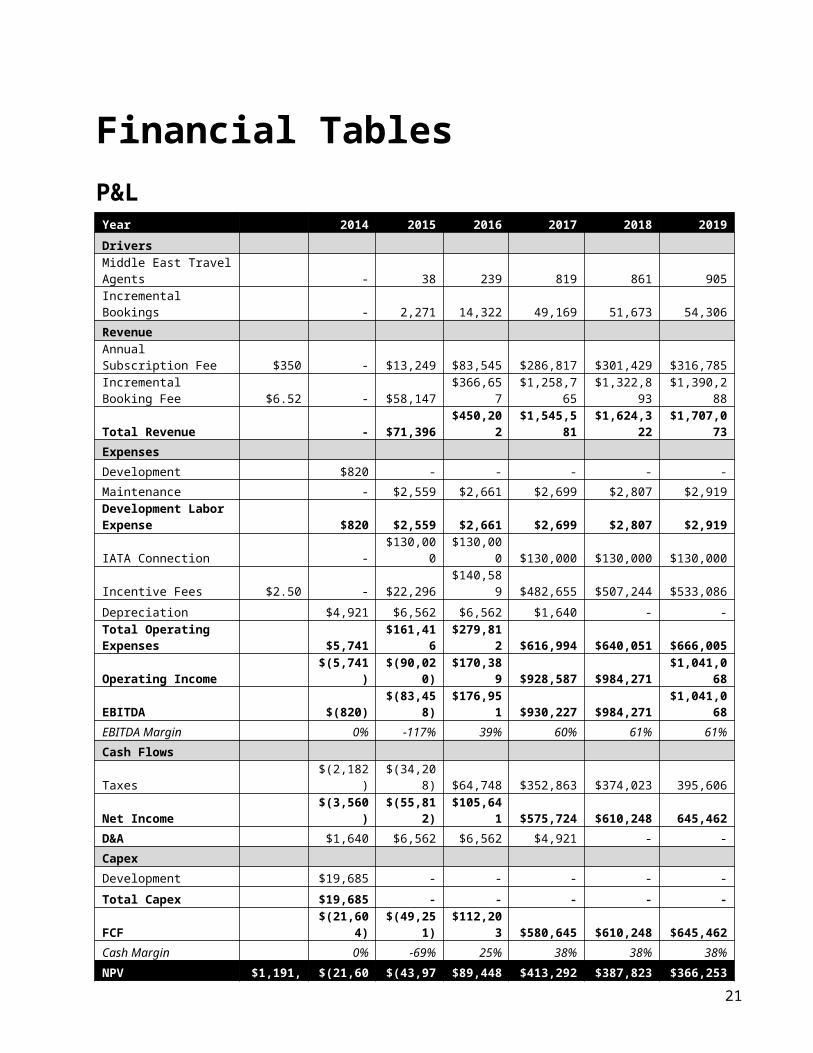
Financial TablesP&L
Year 2014 2015 2016 2017 2018 2019
Drivers
Middle East Travel Agents - 38 239 819 861 905
Incremental Bookings - 2,271 14,322 49,169 51,673 54,306
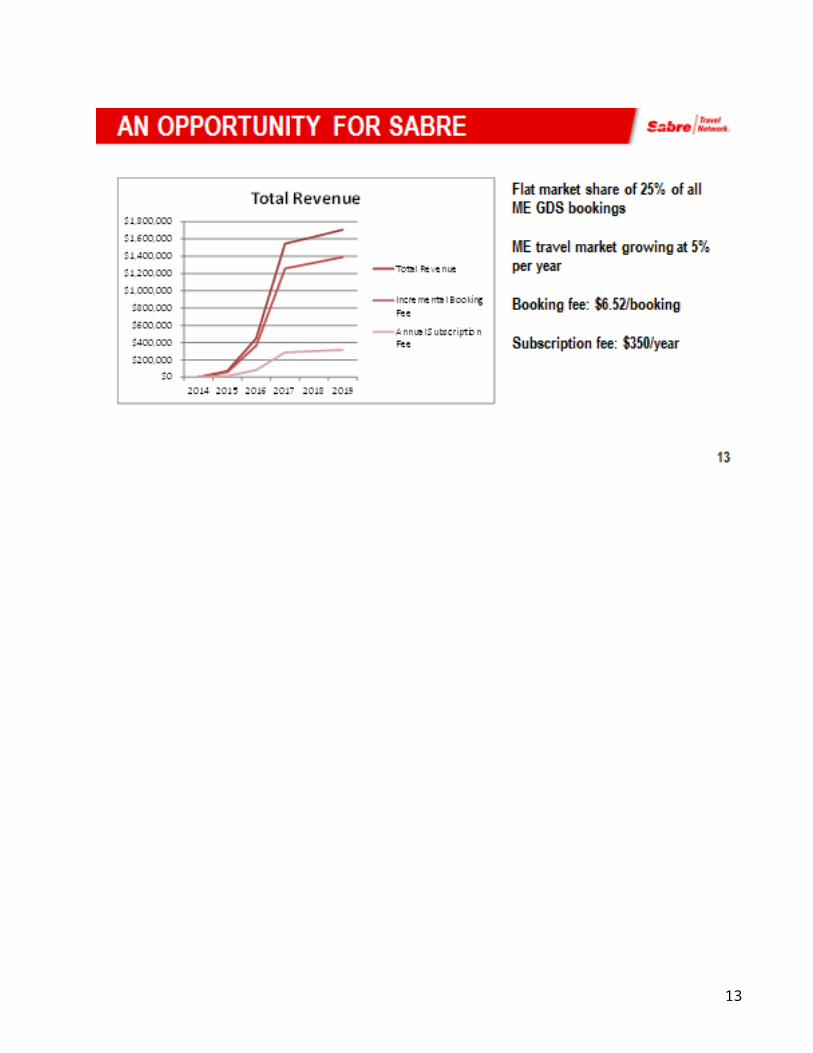
Revenue
Annual Subscription Fee $350 - $13,249 $83,545 $286,817 $301,429 $316,785
Incremental Booking Fee $6.52 - $58,147 $366,657 $1,258,765 $1,322,893 $1,390,288
Total Revenue - $71,396 $450,202 $1,545,581 $1,624,322 $1,707,073
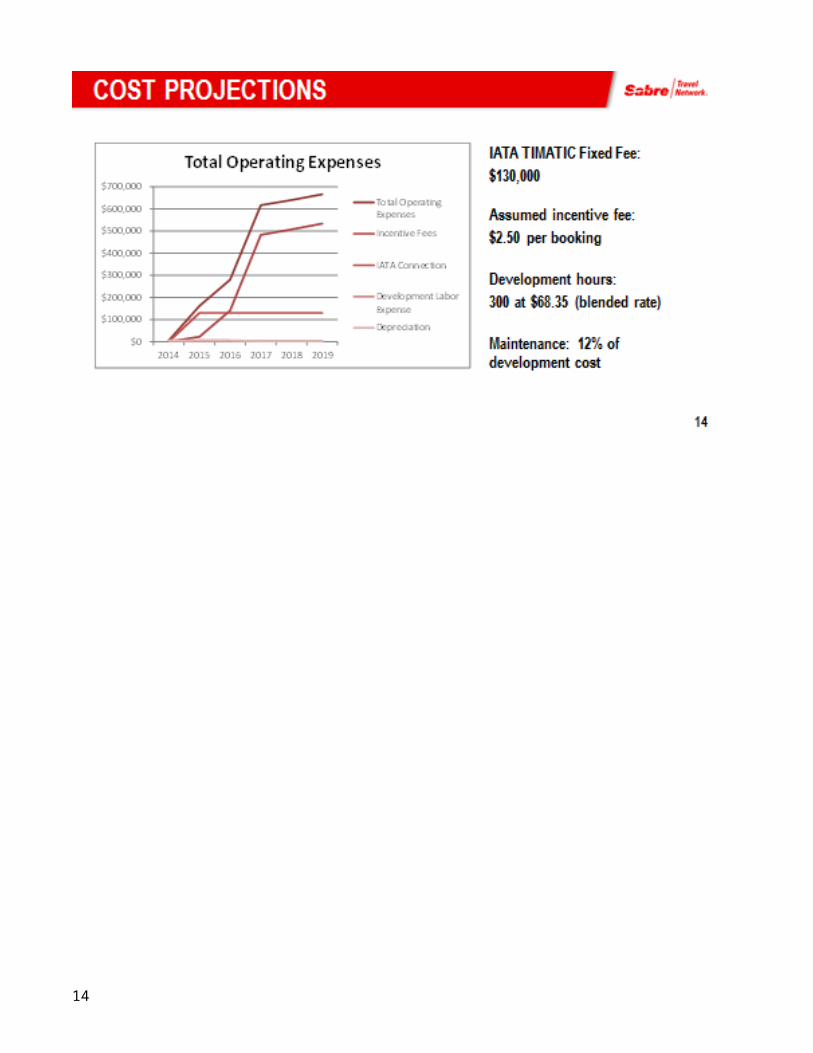
Expenses
Development $820 - - - - -
Maintenance - $2,559 $2,661 $2,699 $2,807 $2,919Development Labor Expense $820 $2,559 $2,661 $2,699 $2,807 $2,919
IATA Connection - $130,000 $130,000 $130,000 $130,000 $130,000
Incentive Fees $2.50 - $22,296 $140,589 $482,655 $507,244 $533,086
Depreciation $4,921 $6,562 $6,562 $1,640 - -
Total Operating Expenses $5,741 $161,416 $279,812 $616,994 $640,051 $666,005
Operating Income $(5,741) $(90,020) $170,389 $928,587 $984,271 $1,041,068
EBITDA $(820) $(83,458) $176,951 $930,227 $984,271 $1,041,068
EBITDA Margin 0% -117% 39% 60% 61% 61%
Cash Flows
Taxes $(2,182) $(34,208) $64,748 $352,863 $374,023 395,606
Net Income $(3,560) $(55,812) $105,641 $575,724 $610,248 645,462
D&A $1,640 $6,562 $6,562 $4,921 - -
Capex
Development $19,685 - - - - -
Total Capex $19,685 - - - - -
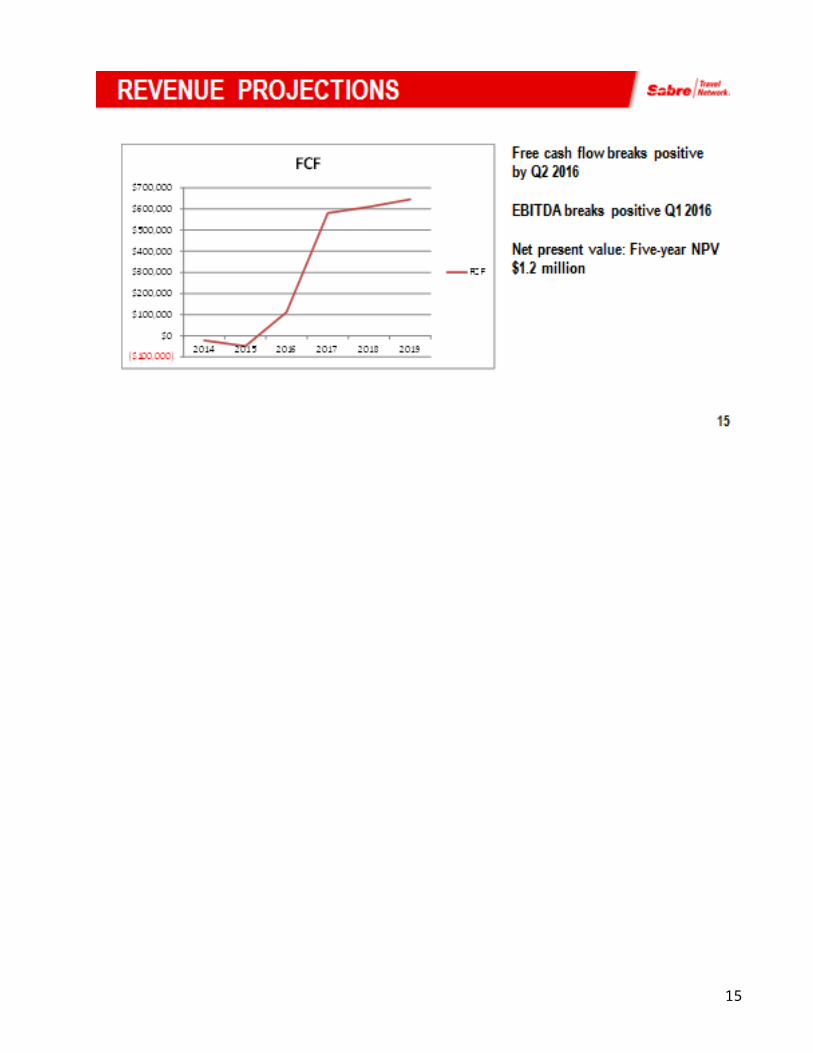
FCF $(21,604) $(49,251) $112,203 $580,645 $610,248 $645,462
Cash Margin 0% -69% 25% 38% 38% 38%
NPV $1,191,237 $(21,604) $(43,974) $89,448 $413,292 $387,823 $366,253
21

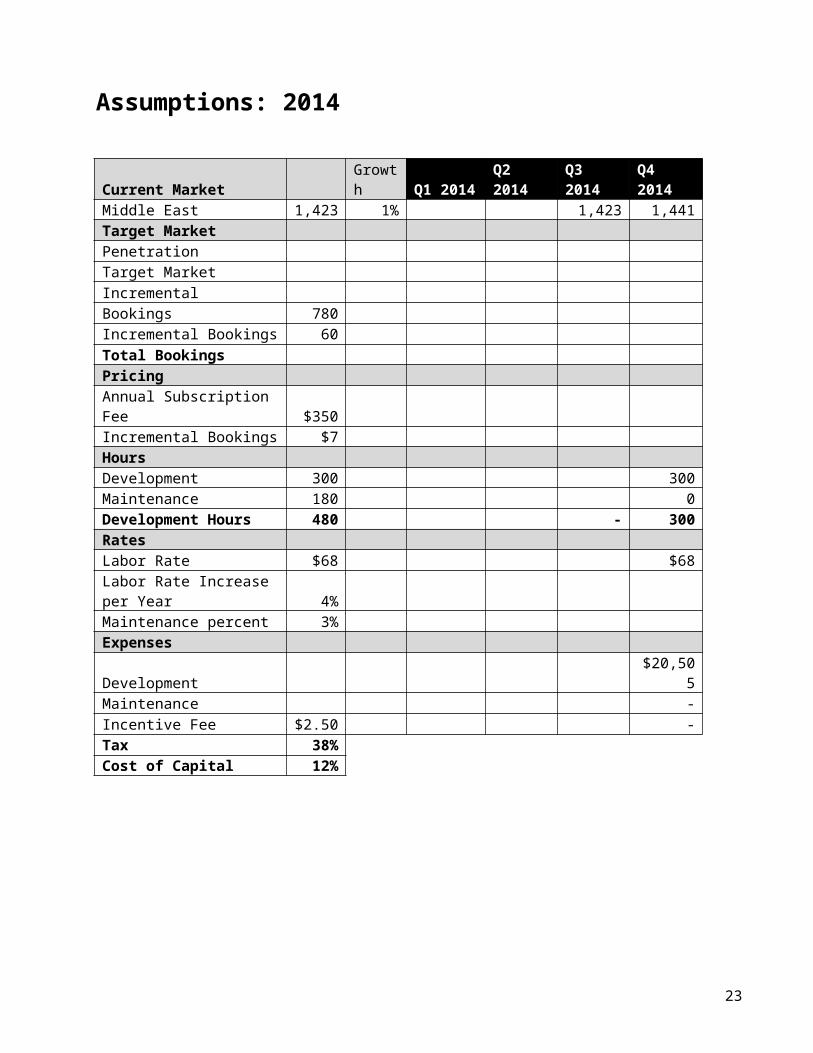
Assumptions: 2014
Current MarketGrowth Q1 2014 Q2 2014 Q3 2014 Q4 2014
Middle East 1,423 1% 1,423 1,441Target MarketPenetrationTarget MarketIncrementalBookings 780Incremental Bookings 60Total BookingsPricingAnnual Subscription Fee $350Incremental Bookings $7HoursDevelopment 300 300Maintenance 180 0Development Hours 480 - 300RatesLabor Rate $68 $68Labor Rate Increase per Year 4%Maintenance percent 3%ExpensesDevelopment $20,505Maintenance -Incentive Fee $2.50 -Tax 38%Cost of Capital 12%
22
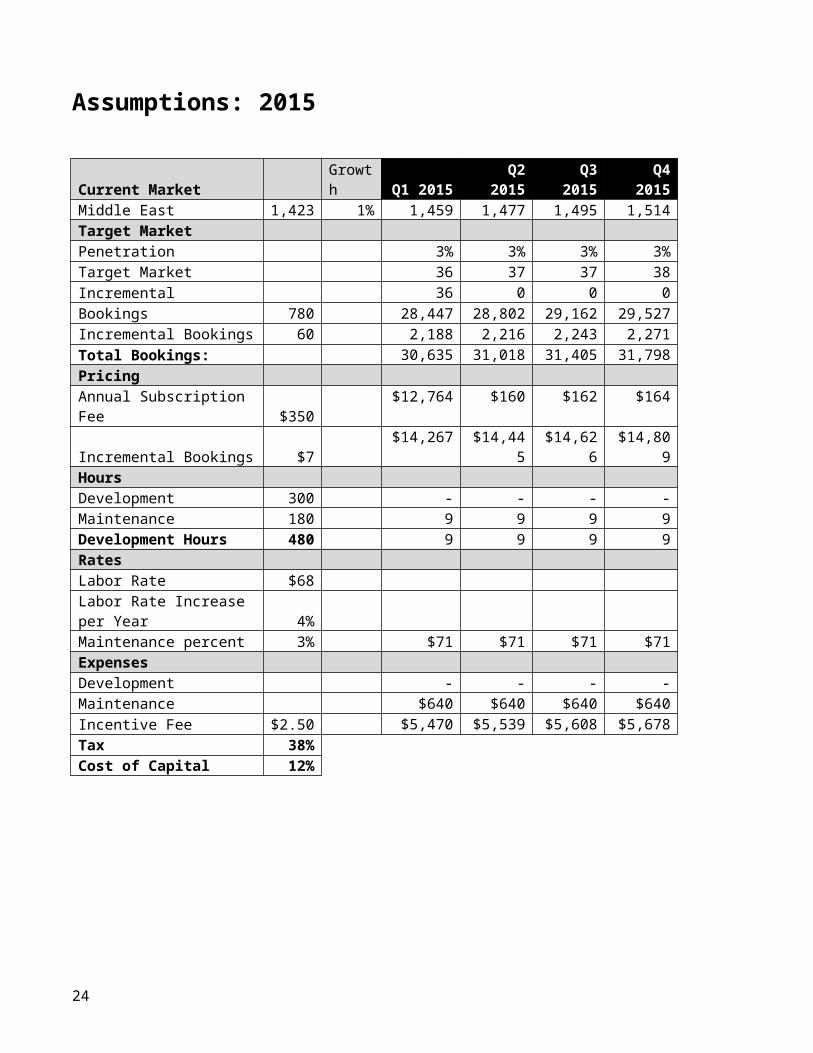
Assumptions: 2015
Current Market Growth Q1 2015 Q2 2015 Q3 2015 Q4 2015Middle East 1,423 1% 1,459 1,477 1,495 1,514Target MarketPenetration 3% 3% 3% 3%Target Market 36 37 37 38Incremental 36 0 0 0Bookings 780 28,447 28,802 29,162 29,527Incremental Bookings 60 2,188 2,216 2,243 2,271Total Bookings: 30,635 31,018 31,405 31,798PricingAnnual Subscription Fee $350 $12,764 $160 $162 $164Incremental Bookings $7 $14,267 $14,445 $14,626 $14,809HoursDevelopment 300 - - - -Maintenance 180 9 9 9 9Development Hours 480 9 9 9 9RatesLabor Rate $68Labor Rate Increase per Year 4%Maintenance percent 3% $71 $71 $71 $71ExpensesDevelopment - - - -Maintenance $640 $640 $640 $640Incentive Fee $2.50 $5,470 $5,539 $5,608 $5,678Tax 38%Cost of Capital 12%
23
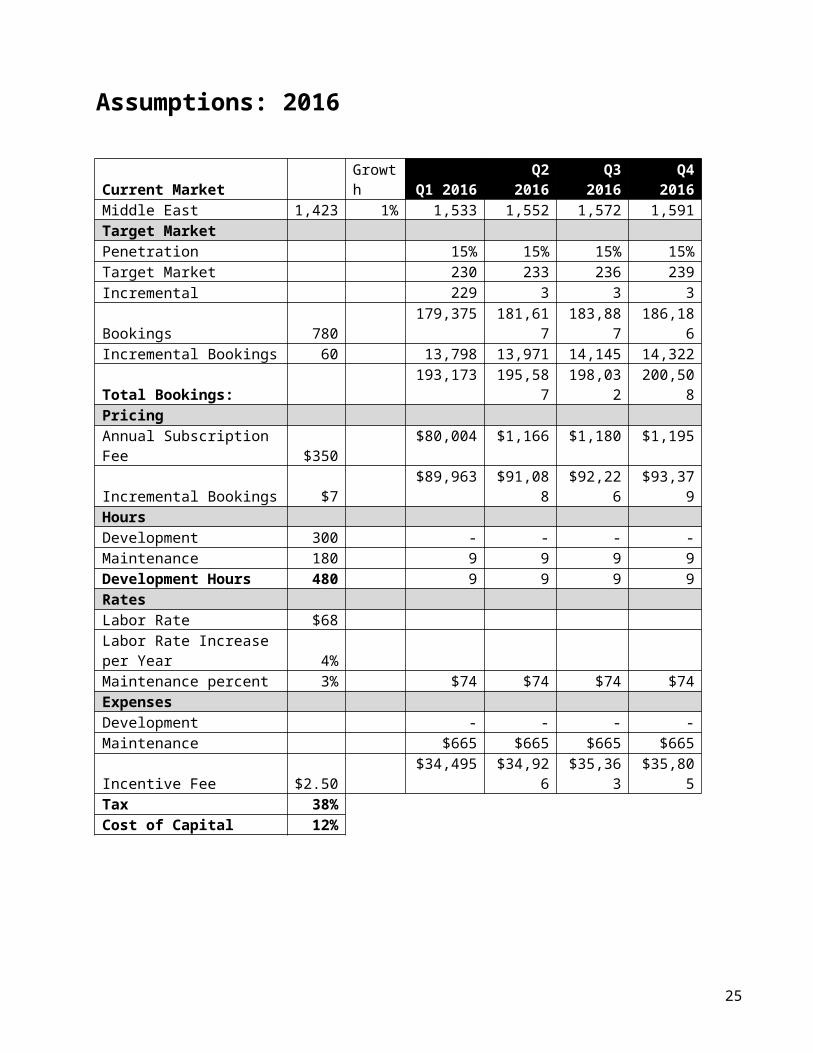
Assumptions: 2016
Current Market Growth Q1 2016 Q2 2016 Q3 2016 Q4 2016Middle East 1,423 1% 1,533 1,552 1,572 1,591Target MarketPenetration 15% 15% 15% 15%Target Market 230 233 236 239Incremental 229 3 3 3Bookings 780 179,375 181,617 183,887 186,186Incremental Bookings 60 13,798 13,971 14,145 14,322Total Bookings: 193,173 195,587 198,032 200,508PricingAnnual Subscription Fee $350 $80,004 $1,166 $1,180 $1,195Incremental Bookings $7 $89,963 $91,088 $92,226 $93,379HoursDevelopment 300 - - - -Maintenance 180 9 9 9 9Development Hours 480 9 9 9 9RatesLabor Rate $68Labor Rate Increase per Year 4%Maintenance percent 3% $74 $74 $74 $74ExpensesDevelopment - - - -Maintenance $665 $665 $665 $665Incentive Fee $2.50 $34,495 $34,926 $35,363 $35,805Tax 38%Cost of Capital 12%
24
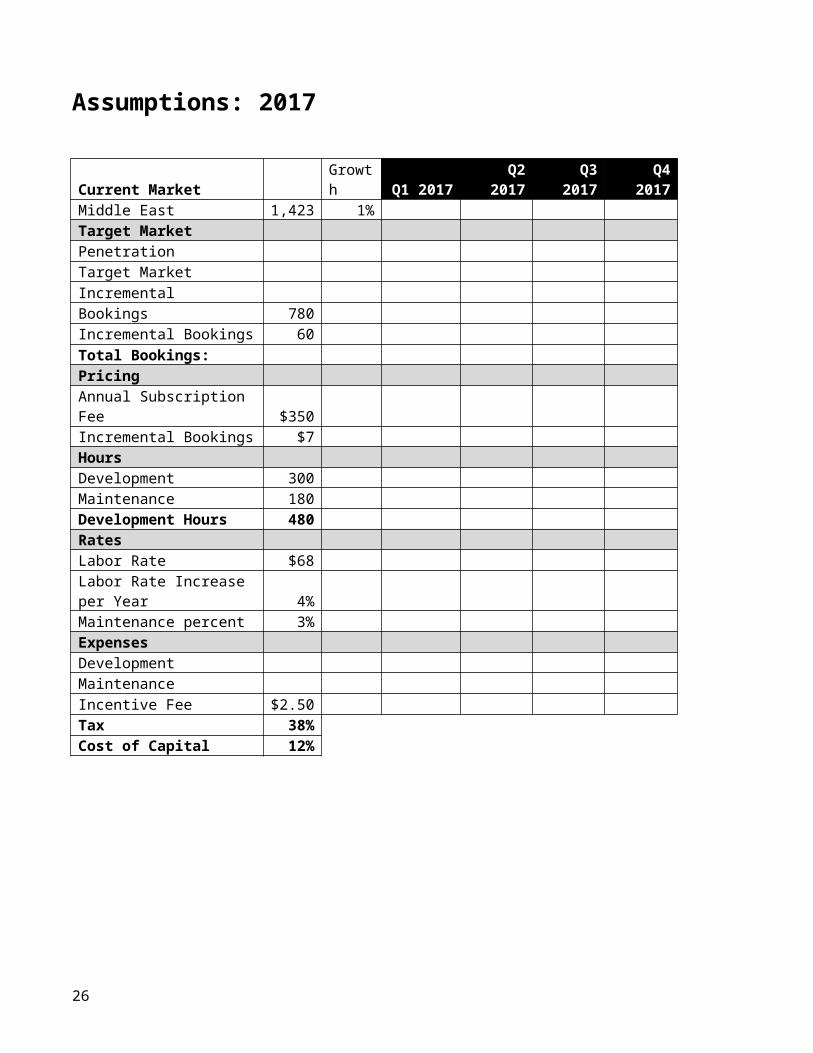
Assumptions: 2017
Current Market Growth Q1 2017 Q2 2017 Q3 2017 Q4 2017Middle East 1,423 1%Target MarketPenetrationTarget MarketIncrementalBookings 780Incremental Bookings 60Total Bookings:PricingAnnual Subscription Fee $350Incremental Bookings $7HoursDevelopment 300Maintenance 180Development Hours 480RatesLabor Rate $68Labor Rate Increase per Year 4%Maintenance percent 3%ExpensesDevelopmentMaintenanceIncentive Fee $2.50Tax 38%Cost of Capital 12%
25
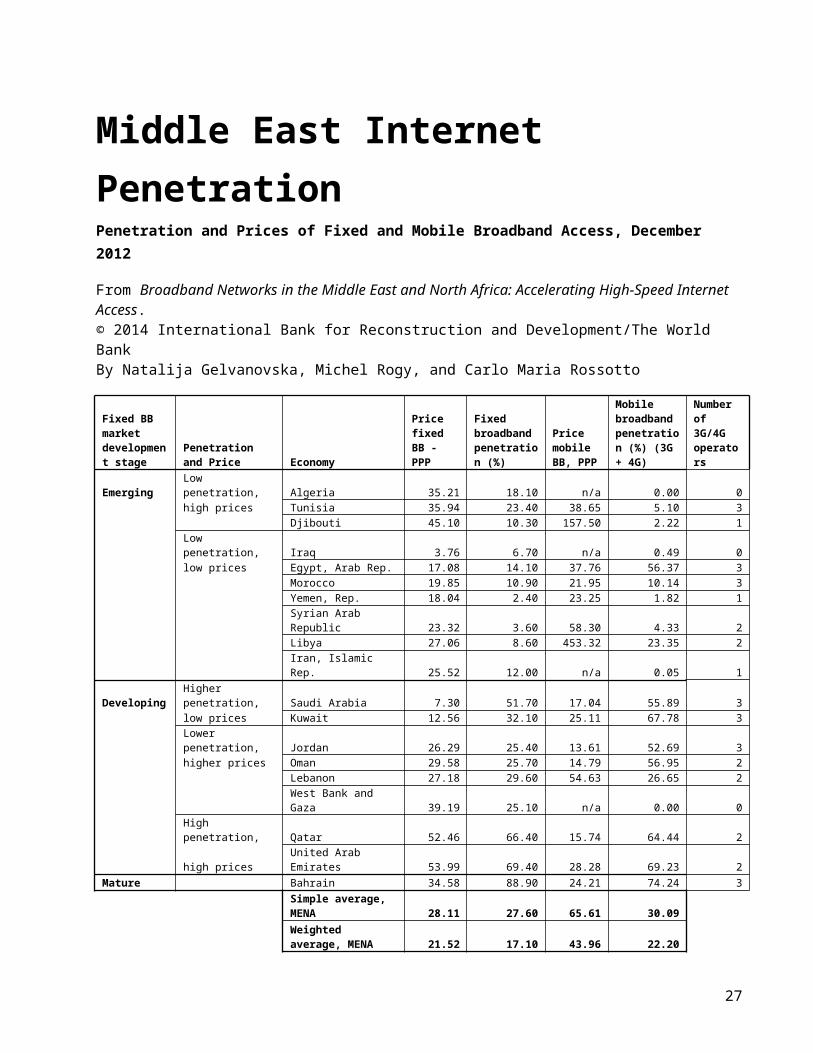
Middle East Internet PenetrationPenetration and Prices of Fixed and Mobile Broadband Access, December 2012
From Broadband Networks in the Middle East and North Africa: Accelerating High-Speed Internet Access. © 2014 International Bank for Reconstruction and Development/The World BankBy Natalija Gelvanovska, Michel Rogy, and Carlo Maria Rossotto
Fixed BB market development stage
Penetration and Price Economy
Price fixed BB - PPP
Fixed broadband penetration (%)
Price mobile BB, PPP
Mobile broadband penetration (%) (3G + 4G)
Number of 3G/4G operators
Emerging Low penetration, Algeria 35.21 18.10 n/a 0.00 0
high prices Tunisia 35.94 23.40 38.65 5.10 3
Djibouti 45.10 10.30 157.50 2.22 1
Low penetration, Iraq 3.76 6.70 n/a 0.49 0
low prices Egypt, Arab Rep. 17.08 14.10 37.76 56.37 3
Morocco 19.85 10.90 21.95 10.14 3
Yemen, Rep. 18.04 2.40 23.25 1.82 1
Syrian Arab Republic 23.32 3.60 58.30 4.33 2
Libya 27.06 8.60 453.32 23.35 2
Iran, Islamic Rep. 25.52 12.00 n/a 0.05 1Developing Higher penetration, Saudi Arabia 7.30 51.70 17.04 55.89 3
low prices Kuwait 12.56 32.10 25.11 67.78 3
Lower penetration, Jordan 26.29 25.40 13.61 52.69 3
higher prices Oman 29.58 25.70 14.79 56.95 2
Lebanon 27.18 29.60 54.63 26.65 2
West Bank and Gaza 39.19 25.10 n/a 0.00 0
High penetration, Qatar 52.46 66.40 15.74 64.44 2
high prices United Arab Emirates 53.99 69.40 28.28 69.23 2
Mature Bahrain 34.58 88.90 24.21 74.24 3
Simple average, MENA 28.11 27.60 65.61 30.09
Weighted average, MENA 21.52 17.10 43.96 22.20
Sources: Fixed broadband household penetration, mobile broadband subscriber penetration, number of 3G/4G operators—TeleGeography’s GlobalComms Database (http://www.telegeography.com, retrieved August 2013). For the Syrian Arab Republic, the source for fixed broadband price—TeleGeography’s GlobalComms Database (http://www.telegeography.com, retrieved November 2012); in all other cases, prices of fixed and mobile broadband monthly subscriptions—World Bank analysis based on operators’ data, January 2013.
Note: 3G = third generation of mobile telecommunications technology; 4G = fourth generation of mobile telecommunications technology; BB = broadband; MENA = Middle East and North Africa; PPP = purchasing power parity.
26
1,533 1,552 1,572 1,591
15% 15% 15% 15%230 233 236 239229 3 3 3179,375 181,617 183,887 186,18613,798 13,971 14,145 14,322193,173 195,587 198,032 200,508
$80,004 $1,166 $1,180 $1,195$89,963 $91,088 $92,226 $93,379
- - - -9 9 9 99 9 9 9
$74 $74 $74 $74
- - - -$665 $665 $665 $665$34,495 $34,926 $35,363 $35,805
27